 Annual General Meeting June 28, 2012 Exhibit 99.1 |
 Forward Looking Statements Outlooks, projections, estimates, targets, and business plans in this presentation or any related subsequent discussions are forward-looking statements. Actual future results, including TransAtlantic Petroleum Ltd.’s own production growth and mix; financial results; the amount and mix of capital expenditures; resource additions and recoveries; finding and development costs; project and drilling plans, timing, costs, and capacitie s; revenue enhancements and cost efficiencies; industry margins; margin enhancements and integration benefits; and the impact of technology could differ materially due to a number of factors. These include changes in long-term oil or gas prices or other market conditions affecting the oil, gas, and petrochemical industries; reservoir performance; timely completion of development projects; war and other political or security disturbances; changes in law or government regulation; the outcome of commercial negotiations; the actions of competitors; unexpected technological developments; the occurrence and duration of economic recessions; unforeseen technical difficulties; and other factors discussed here and under the heading “Risk Factors" in our Annual Report on Form 10-K for the year ended December 31, 2011 and our Quarterly Report on Form 10-Q for the quarter ended March 31, 2012 available at our website at www.transatlanticpetroleum.com and www.sec.gov. See also TransAtlantic’s 2011 audited financial statements and the accompanying management discussion and analysis. Forward-looking statements are based on management’s knowledge and reasonable expectations on the date hereof, and we assume no duty to update these statements as of any future date. The information set forth in this presentation does not constitute an offer, solicitation or recommendation to sell or an offer to buy any securities of the Company. The information published herein is provided for informational purposes only. The Company makes no representation that the information and opinions expressed herein are accurate, complete or current. The information contained herein is current as of the date hereof, but may become outdated or subsequently may change. Nothing contained herein constitutes financial, legal, tax, or other advice. The SEC has generally permitted oil and gas companies, in their filings with the SEC, to disclose only proved reserves that a company has demonstrated by actual production or conclusive formation tests to be economically and legally producible under existing economic and operating conditions. We may use the terms “estimated ultimate recovery,” “EUR,” “probable,” “possible,” and “non-proven” reserves, “prospective resources” or “upside” or other descriptions of volumes of resources or reserves potentially recoverable through additional drilling or recovery techniques that the SEC’s guidelines may prohibit us from including in filings with the SEC. These estimates are by their nature more speculative than estimates of proved reserves and accordingly are subject to substantially greater risk of being actually realized by the Company. There is no certainty that any portion of estimated prospective resources will be discovered. If discovered, there is no certainty that it will be commercially viable to produce any portion of the estimated prospective resources. BOE is derived by converting natural gas to oil in the ratio of six thousand cubic feet (Mcf) of natural gas to one barrel (bbl) of oil. Boe may be misleading, particularly if used in isolation. A BOE conversion ratio of 6 Mcf: 1 bbl is based on an energy equivalency conversion method primarily applicable at the burner tip and does not represent a value equivalency at the wellhead. 2 |
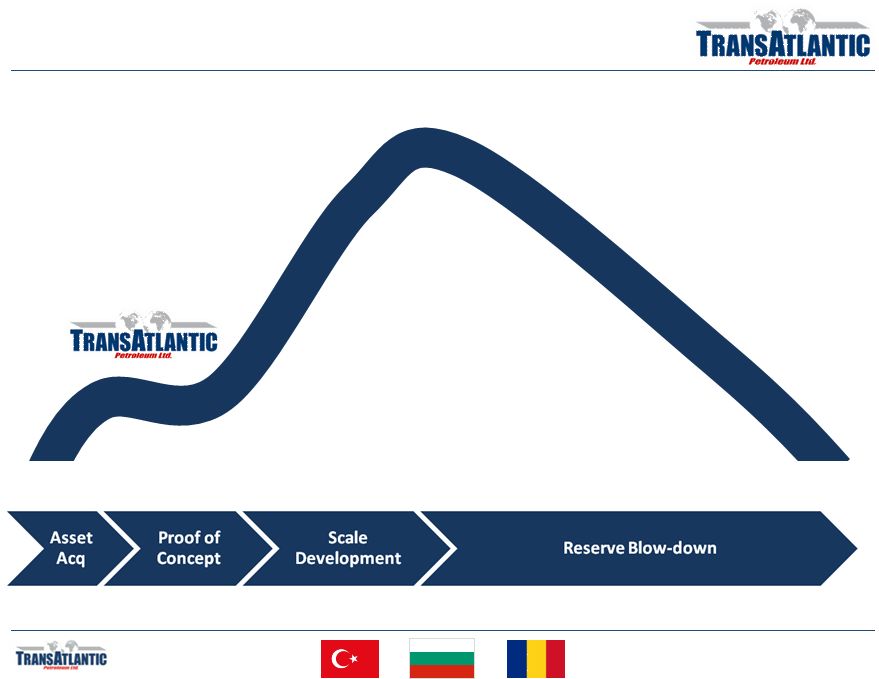 Oil and Gas Life Cycle: Still Early Innings 3 |
 Road Has Been Bumpy, But Still Holding Above Peers 4 Peer group inclusion factors: Publicly-traded company on 1/1/2008, meaningful onshore presence in Eastern Europe, Middle East, and/or North Africa |
 5 Portfolio Overview |
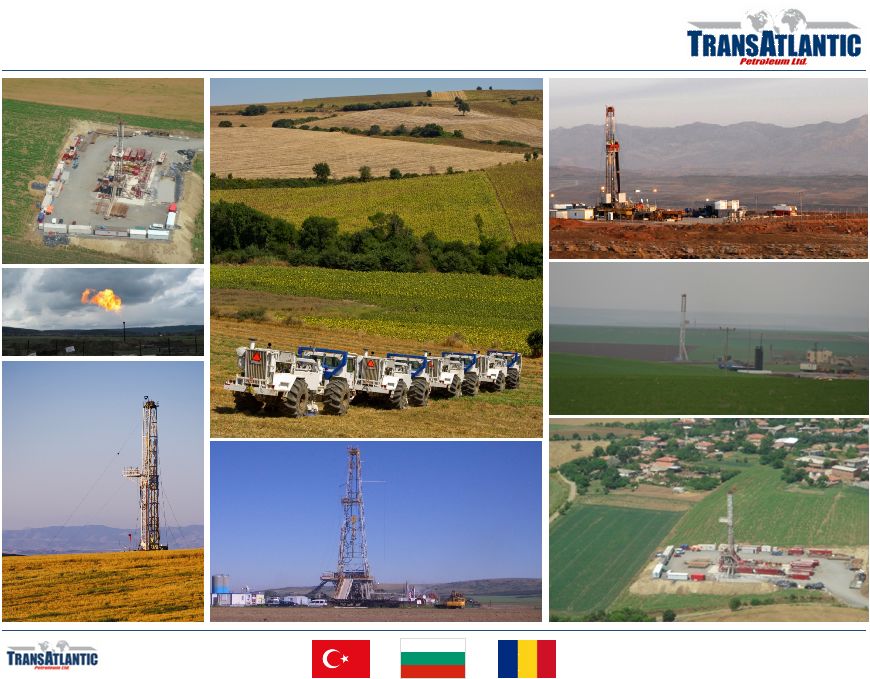 Portfolio Overview 6 |
 Portfolio Overview 7 Thrace Basin Development Taking Shape • Proved the rock is conducive to frac. • Deep program has identified an additional ~1,000 meters of gas saturated sands. • Gearing up for continuous drill-and-frac program beginning during 2H12. New Resource Play Concepts in the Southeast • Goksu discovery showing similar properties to Mississippian Lime play in the U.S. • Dadas shale evaluation process ongoing and picking up pace. Offset activity could help accelerate the learning curve process. • Horizontal concept on Gaziantap license. Near-Term High Impact Exploration • Idil block holds several structures, confirmed with recent seismic. Only area of Turkey with same drilling targets as prolific fields in Iraq and Syria. • Large structure identified on Gurun license. Longer-term Optionality • Bulgarian and Romanian shales. • Turkish exploration acreage (Sivas, Adana, other). |
 8 Thrace Basin |
 Thrace Basin Frac Program: Play Concept & Strategy 9 Play Concept • Thick, stacked, blanket sands with significant gas in place. • Extensive well control from shallow production • Thermally mature, but largely untested, source rocks provide substantial unconventional potential with the application of modern drilling and completion methods. Assessment Strategy 1. Prove rock is conducive to frac using low cost re-entries of existing shallow wellbores. a. Identify and test various zones (approximately 2,500-6,500 feet or 750-2,000 meters). b. Determine appropriate mix of fluid and horsepower. c. Test multiple zone completions. 2. Test deeper potential and additional structures with new wellbores a. Identify and test deeper zones (approximately 5,000-13,000 feet or 1,500-4,000 meters). b. Test additional structures (Pancarkoy-1, Suleymaniye-2). c. Define opportunity set (number of productive zones, commingling potential, etc.). 3. Test multi-stage vertical fracs 4. Evaluate individual zone productivity for horizontal potential and test if/where applicable. 5. Evaluate off-structure (stratigraphic) potential of blanket sands. In Process In Process In Process In Process Commencing TBD TBD |
 Thrace Basin Frac Program: Play Concept & Strategy 10 Overview • Unconventional targets from approximately 1,000 meters (~3,300 feet) to 4,000 meters (~13,100 feet). • Early activity provided support that conventional sands to 1,500 meters (~5,000 feet) were viable targets with economic recoveries. • Deep activity to-date has expanded the opportunity set with an additional 1,000 meters (~3,300 feet) of gas saturated sands shown to be productive. • Testing indicating that targets below approximately 2,500 meters (~8,200 feet) are tight and water prone. • Finishing fourth deep well with results expected to provide enough detail to begin transition to development program in the Tekirdag Field Area. |
 Thrace Basin Frac Program: Mezardere Members 11 |
 Thrace Basin Frac Program: Type Curve Scenarios 12 • 3 cases/scenarios forecasted using 60 day average, normalized rate from 7 single stage fracs • Average IP for the 7 fracs is 1,800 Mcf/d • Base Case is 330 MMcf, Average recovery of the 3 cases is ~370 MMcf • Production data thus far indicates steep initial decline with an average hyperbolic exponent of 1.3 Decline Curve Parameters and Scenarios Case EUR (MMcf) b Di Qi Low 250 1.1 91% 1,800 Base 330 1.3 89% 1,800 High 520 1.6 86% 1,800 Average 367 1.3 89% 1,800 Internal prospective resource estimates prepared 2/28/12 and evaluated by a registered professional engineer in accordance with NI 51-101 guidelines and the COGE Handbook |
 Thrace Basin Frac Program: Type Curve Economics 13 Cost Assumptions: • Well preparation, pre-frac diagnostics, one stage frac, and testing: $330k gross • Additional $400k gross investment to drill and case a 1,000m well. Each additional stage expected to cost $90k per stage. • Gas price = $7.42/mcf • Base case recovery and decline parameters were used for each stage in New Drill cases Remarks: • All re-entry cases payout in 1.5 months, recovering approximately 65 MMcf gross in the first 2 months • Approximately 20 re-entry candidates have been identified • The Low Case for a new drill with single stage still nets $280k NPV10 with a 0.9 ROI Single Stage Re-Entry Economics Case NPV10 ($M)* ROI Payout (Mos) Low $450 3.3 1.5 Base 600 4.4 1.5 High 890 6.5 1.5 Average $650 4.8 1.5 New Drill Economics – Base Case Forecast Case NPV10 ($M)* ROI Payout (Mos) 1 Stage $435 1.4 5.8 2 Stage 1,220 3.6 4.2 3 Stage 1,940 5.1 3.7 Average $1,200 3.4 4.6 Internal prospective resource estimates prepared 2/28/12 and evaluated by a registered professional engineer in accordance with NI 51-101 guidelines and the COGE Handbook * Net to TransAtlantic’s 41.5% working interest * Net to TransAtlantic’s 41.5% working interest |
 Thrace Basin Frac Program: Assessment Timeline 14 |
 Thrace Basin Frac Program: Assessment Limitations 15 Stimulation Equipment • Currently only a single frac spread in-country. If utilized to test deep Thrace targets or to stimulate zones in southeast Turkey then the equipment is not available for repeat development program completions in the Tekirdag area. • Viking’s second frac crew expected to be available during the first quarter of 2013. Additional equipment possible with further success. Winter Weather Can Slow You Down • Winter conditions (wet) can inhibit activity, most notably pad construction and equipment moves. • During assessment periods with activity contingent upon recent wells, can add meaningful time between wells. • Development program allows advanced preparation of wellpads and logistics planning for drilling and completion materials. |
 16 Southeast Turkey |
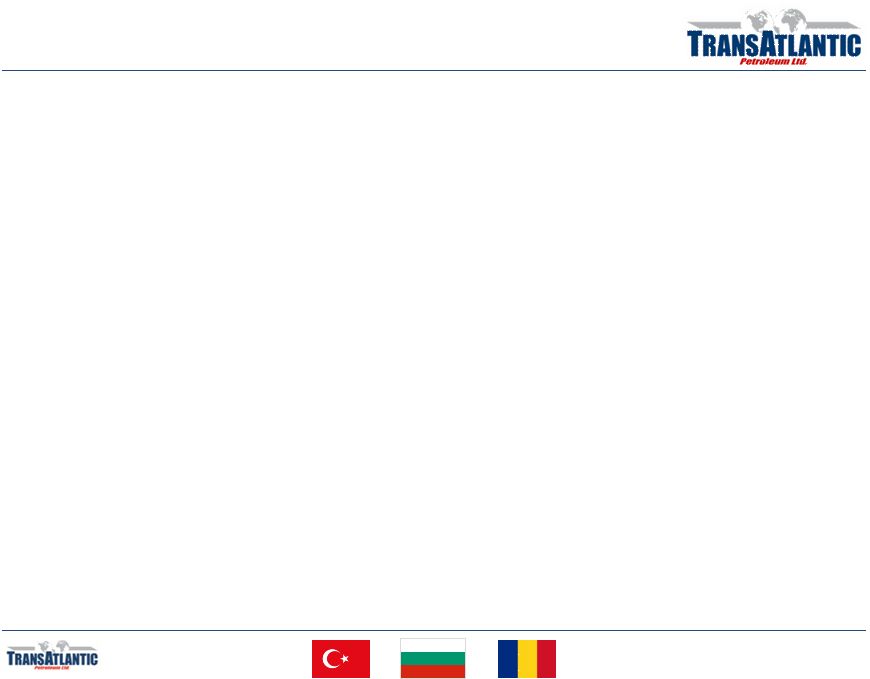
 17 Overview • Extension of prolific Iraqi and Syrian oil trends. Houses Turkey’s most productive fields including TransAtlantic’s Selmo field. • Conventional oil production provides low decline base. • Conventional and unconventional upside opportunities including large shale play potential. Numerous large anticlines identified. • Bedinan, Dadas, Hazro, and Mardin targets. • Existing production reasonably well removed from border. • Recent seismic shoot at Idil block along Syrian border. Drilling expected later in 2012. Dadas Shale • Upper Silurian (Woodford equivalent) • Roughly equal in size to the Barnett. • Source rock for conventional fields. • Limited test work to-date. Early work indicates oil, liquids and gas windows. Turkey: Southeast |
 Southeast – Dadas Shale Overview 18 Dadas Shale Characteristics • Devonian-Silurian age . • Areal extent similar to the core area of the Barnett shale. • Basal member (Dadas 1) is the primary oil source rock for regional hydrocarbon production. • Indications of oil window (south) transitioning to gas window (north). • TransAtlantic’s acreage primarily in expected oil and liquids windows. Goksu-1R Core Analysis • Approximately 30 feet of core taken (2010). • Vertical depth: 8,350 feet (2,500 meters) • Total Organic Content: 7-9% • Porosity: 0.5-6.0% • T max : 435° C • R 0 : 0.7-0.8% Shale Comparison Attribute Dadas Woodford Eagle Ford Bakken Age Silurian Silurian Cretaceous Mississippian Depth (ft) 7,000-10,000 6,000-14,500 4,000-14,000 8,000-11,000 Gross Thickness 300-800 300-400 100-350 150 TOC (%) 3.0-12.0 6.0-6.5 4.0-5.5 6.0-8.0 T max (° C) 350-460 300-400 425-455 420-430 R 0 (%) 0.5-1.0% 1.1-3.0% 0.5-2.6% 0.4-1.7% Porosity (%) 0.5-10% 3-12% 4-15% 8-12% Permeability 0.3-1.0 md 0.2 md <0.13 md 0.005-0.2 md Oil Gravity (API) 40-60 30-65 40-60 40-45 EUR (Mboe) TBD 150-2,000 300-1,500 500-1,500 |
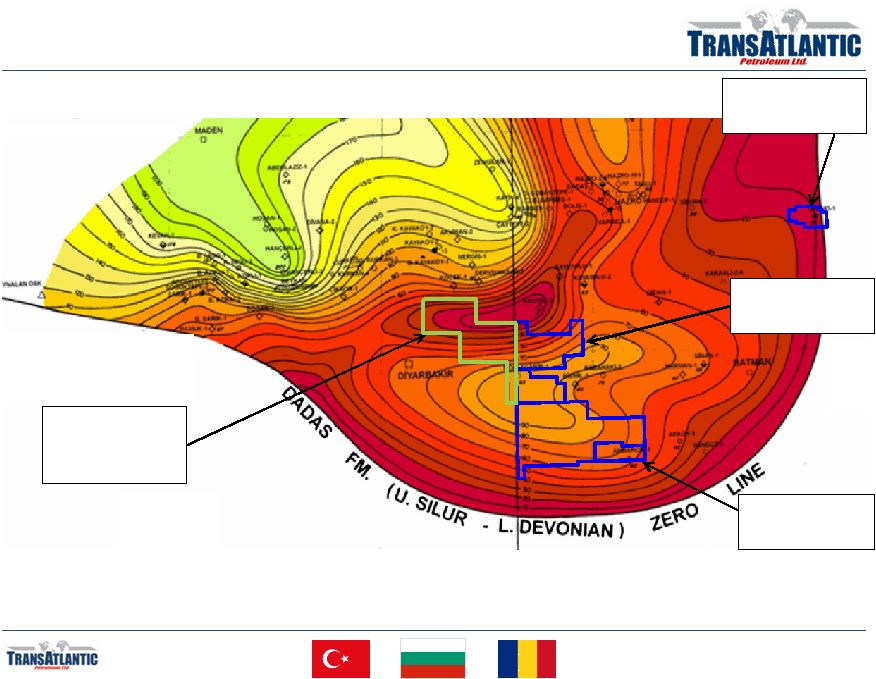 Southeast – Dadas Shale Isopach 19 TransAtlantic’s Molla Field TransAtlantic’s Arpatepe Field TransAtlantic’s Selmo Field TransAtlantic Recent License Award |
 Southeast – Dadas Shale Industry Interest 20 Shell/TPAO Dadas Joint Venture TransAtlantic’s Molla Field TransAtlantic’s Arpatepe Field TransAtlantic’s Selmo Field TransAtlantic New Exploration License Anatolia Energy Dadas Core TPAO Dadas Test Well TransAtlantic’s Bahar-1 TransAtlantic’s Goksu 1 & 2 |
 Southeast – Molla/Goksu 21 Concept Overview • Previously by-passed pay zone. • Parallel, vertically oriented natural fracture system. • Vertical well results highly dependent upon intersecting a fracture and the ultimate volume capacity of the fracture itself. • Horizontal concept to connect vertical fracture system in similar fashion to the horizontal Mississippian Lime play in Oklahoma and Kansas. |
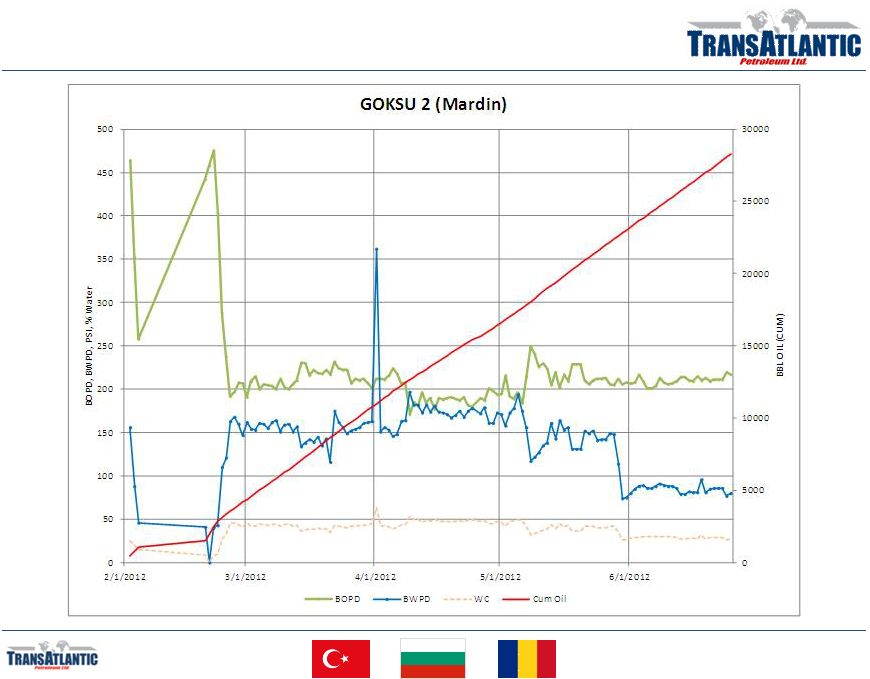 Southeast – Molla/Goksu – Goksu 2 Production 22 |
 23 Near-Term High-Impact Exploration |
 Exploration: Idil License - Southeast Turkey 24 Overview • Extension of prolific Iraqi and Syrian oil trends. One of only a handful of Turkish licenses with similar targets as those seen in Syria and Northern Iraq. • High risk, high potential reward targets identified with application of improved seismic technology. • Unrisked potential greater than 100 MMbbls (1) . • Smaller target to spud during 4Q12. • Larger target to spud in 2013 after winter conditions ebb. (1) Internal estimate - represents potentially recoverable hydrocarbons from undiscovered accumulation(s) which are subject to both risk of discovery and development. |
 Exploration: Idil License – 2D Seismic Lines 25 |
 Exploration: Idil License – Seismic Quality Improvement 26 2008 Single Receiver Line Conventional Acquisition (Post-stack Migration) 2012 Dual Receiver Line Combined Sweep Acquisition (Pre-stack Migration) |
 Exploration: Idil License – Ebyat Anticline (Ukok-1) 27 |
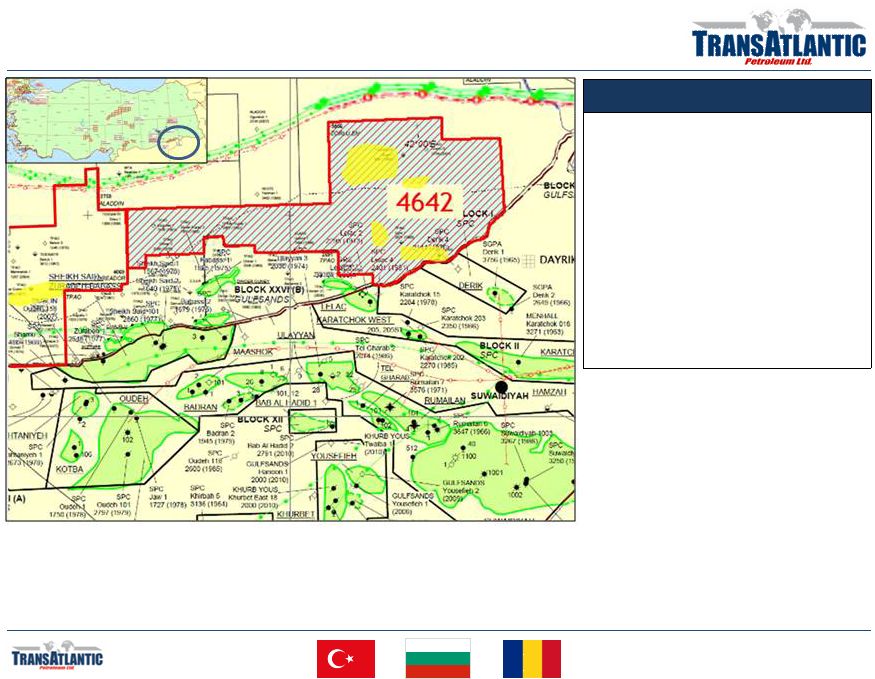
 Exploration: Idil License – South Area (Durukoy-1) 28 Cudi Closure: 400 acres Mardin Closure: 250 acres |
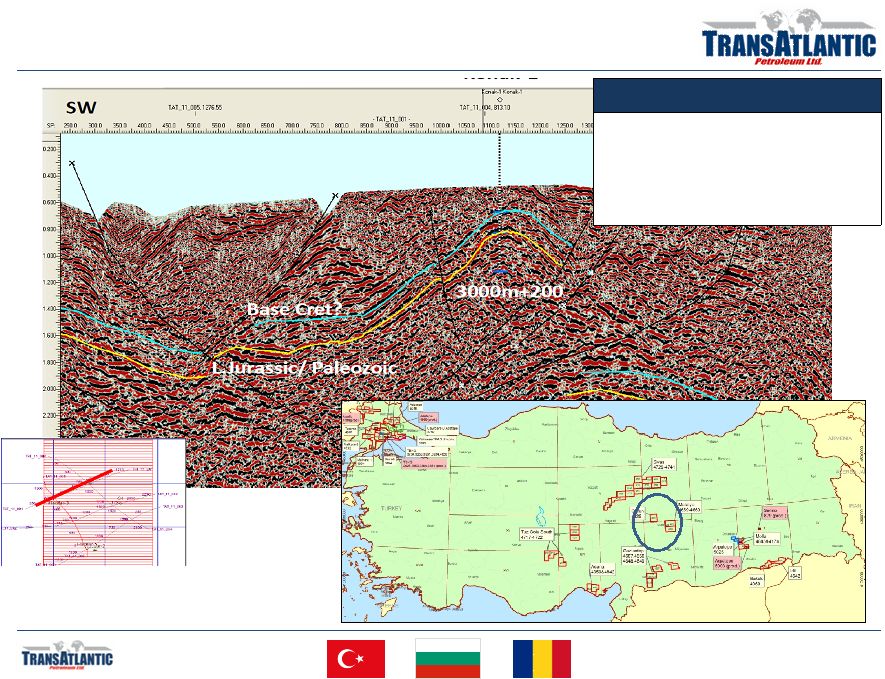 Exploration: Gurun License - Central Turkey (Konak-1) 29 Overview • Large structure identified. • High-risk, high potential reward. Single well should assess structure’s viability as a target. • Activity expected during 3Q12. |
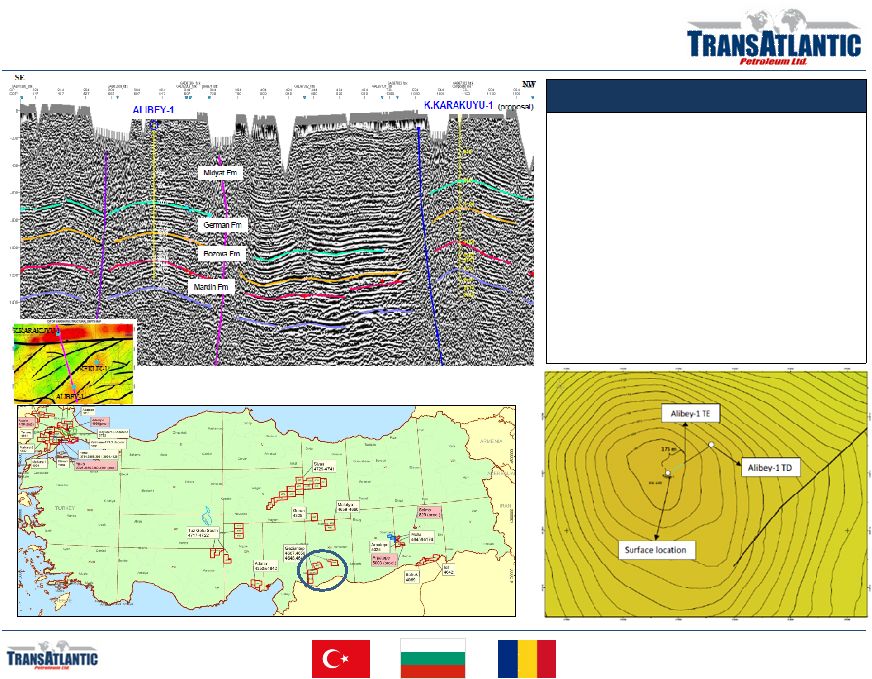 Exploration: Gaziantap License – S. Central (Alibey-1H) 30 Overview (Alibey-1H) • Re-entry of vertical oil show well. • Mardin target with similar geologic characteristics as those seen at Molla/Goksu and the horizontal Mississippian Lime play in Oklahoma and Kansas. • Spud expected during 3Q12. |
 31 Longer-Term Optionality |
 Bulgaria 32 Overview • The A-Lovech exploration license covers approximately 565,000 acres (2,288 square kilometers) in NW Bulgaria. • All acreage is prospective for the Etropole shale formation. • Proximal to existing natural gas infrastructure. • Attractive terms: 2.5%-30% royalty and 10% corporate tax. Koynare (Deventci) • 160,000 acres (648 square kilometers) • Conventional gas discovery in the Jurassic-aged Orzirovo. • Deventci R-1, is currently producing ~250 Mcf/d on a limited test basis. Waiting on award of production license. Surface casing set on Deventci-R2. • Seeking a development partner. Bulgaria’s Energy Profile 2010 Population: 7,561,910 2010 GDP: $47.7 billion 2010 Oil Consumption: 91.0 Mbbls/d 2010 Oil Production: 2.9 Mbbls/d 2010 Nat Gas Consumption: 211 MMcf/d 2010 Nat Gas Production: 0 MMcf/d Source: The World Bank, CIA World Factbook & Energy Information Administration Peshtene R-11 • November 2011 drilled a ~10,500 foot (3,200 meter) exploration well to core and test the Etropole formation. • Core currently being evaluated. • Rock properties similar to prolific US shale plays, with more favorable terms (royalty and taxes) and commodity pricing. • Etropole position is estimated to hold gross unrisked best estimate prospective resources of 11 Tcfe (1) . • Awaiting revision(s) to recent Parliamentary legislation. (1) Internal estimate prepared as of November 2010 - represents potentially recoverable hydrocarbons from undiscovered accumulation(s) which are subject to both risk of discovery and development. |
 Romania 33 Overview • 50% interest in 1,000,000 acres (400,000 with unconventional potential) • Sterling Resources-operated joint venture. Seeking additional joint venture partner(s). • Prospective for Silurian shale (natural gas). Also holds Jurassic oil potential. • Awarded license for Phase 2 Exploration Period. • Remaining commitment of 200 km 2D seismic to be shot during 2012. • Chevron has acquired exploration licenses straddling the eastern Bulgarian/Romanian border. Romania’s Energy Profile 2010 Population: 21,449,980 2010 GDP: $161.6 billion 2010 Oil Consumption: 196.0 Mbbls/d 2010 Oil Production: 107.1 Mbbls/d 2010 Nat Gas Consumption: 1,247 MMcf/d 2010 Nat Gas Production: 1,025 MMcf/d Source: The World Bank, CIA World Factbook & Energy Information Administration (EIA) |
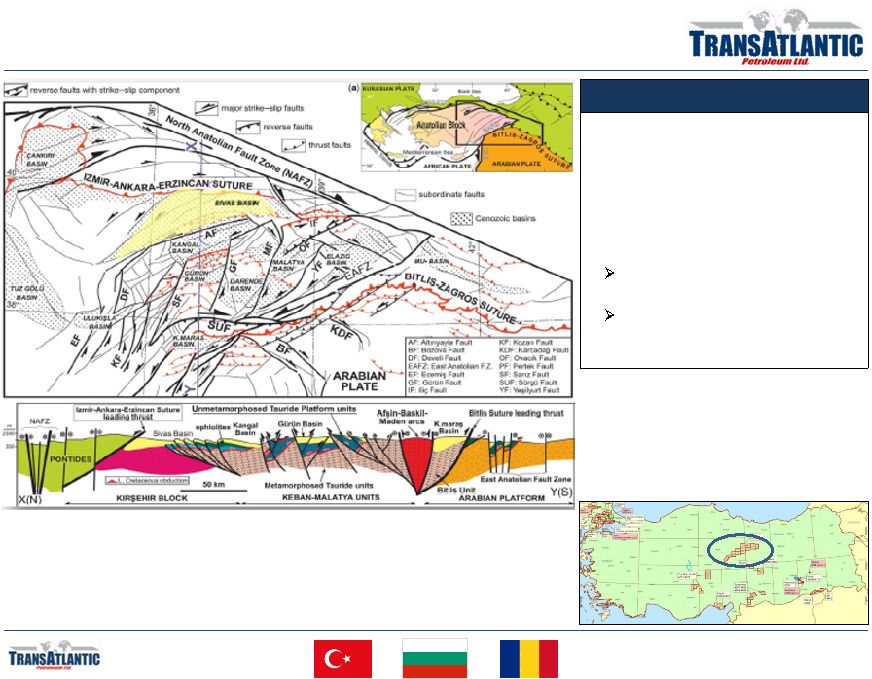 Sivas Basin – Central Turkey 34 Overview • Large, unexplored basin. Only one well ever drilled. • Basin-edge analysis shows source rock, reservoir rock and seal rock potential. • Exploration Agreement with Shell covering TransAtlantic’s 1.6 million acres. 2012 work program: Seismic and aeromagnetic studies. 2013 work program: Up to two wells, contingent upon seismic and aeromag. |
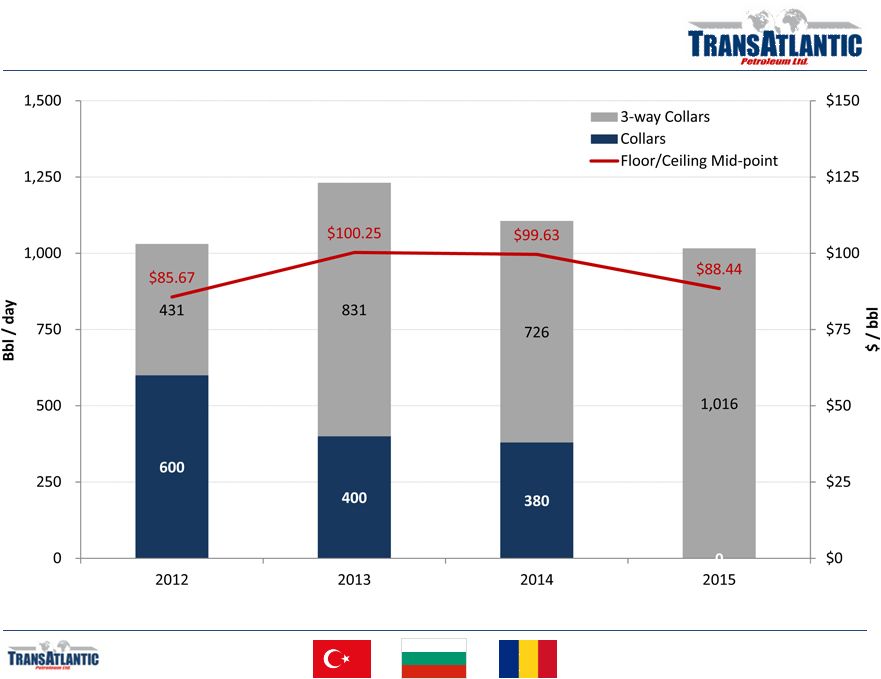 Hedge Profile 35 As of 3/31/2012 |
 PV10 Reconciliation 36 The PV-10 value of the estimated future net revenue are not intended to represent the current market value of the estimated oil and natural gas reserves we own. Management believes that the presentation of PV-10, while not a financial measure in accordance with U.S. GAAP, provides useful information to investors because it is widely used by professional analysts and sophisticated investors in evaluating oil and natural gas companies. Because many factors that are unique to each individual company impact the amount of future income taxes estimated to be paid, the use of a pre-tax measure is valuable when comparing companies based on reserves. PV-10 is not a measure of financial or operating performance under U.S. GAAP. PV-10 should not be considered as an alternative to the standardized measure as defined under U.S. GAAP. The following table provides a reconciliation of our PV10 to our standardized measure: US $ thousands Total PV 10: $645,837 Future income taxes: (171,592) Discount of future income taxes at 10% per annum: 57,522 Standardized measure: $531,797 |