 SunTrust Robinson Humphrey “Play-by-Play” Oil & Gas Conference May 30, 2013 Exhibit 99.1 |
 FORWARD LOOKING STATEMENTS 2 Outlooks, projections, estimates, targets and business plans in this presentation or any related subsequent discussions are forward-looking statements. Actual future results, including TransAtlantic Petroleum Ltd.’s own production growth and mix; financial results; the amount and mix of capital expenditures; resource additions and recoveries; finding and development costs; project and drilling plans, timing, costs, and capacities; revenue enhancements and cost efficiencies; industry margins; margin enhancements and integration benefits; and the impact of technology could differ materially due to a number of factors. These include market prices for natural gas, natural gas liquids and oil products; estimates of reserves and economic assumptions; the ability to produce and transport natural gas, natural gas liquids and oil; the results of exploration and development drilling and related activities; economic conditions in the countries and provinces in which we carry on business, especially economic slowdowns; actions by governmental authorities, receipt of required approvals, increases in taxes, legislative and regulatory initiatives relating to fracture stimulation activities, changes in environmental and other regulations, and renegotiations of contracts; political uncertainty, including actions by insurgent groups or other conflict; the negotiation and closing of material contracts; shortages of drilling rigs, equipment or oilfield services; and other factors discussed here and under the heading “Risk Factors" in our Annual Report on Form 10-K for the year ended December 31, 2012 and our Quarterly Report on Form 10-Q for the three months ended March 31, 2013, which are available on our website at www.transatlanticpetroleum.com and www.sec.gov. See also TransAtlantic’s audited financial statements and the accompanying management discussion and analysis. Forward-looking statements are based on management’s knowledge and reasonable expectations on the date hereof, and we assume no duty to update these statements as of any future date. The information set forth in this presentation does not constitute an offer, solicitation or recommendation to sell or an offer to buy any securities of the Company. The information published herein is provided for informational purposes only. The Company makes no representation that the information and opinions expressed herein are accurate, complete or current. The information contained herein is current as of the date hereof, but may become outdated or subsequently may change. Nothing contained herein constitutes financial, legal, tax, or other advice. The SEC has generally permitted oil and gas companies, in their filings with the SEC, to disclose only proved reserves that a company has demonstrated by actual production or conclusive formation tests to be economically and legally producible under existing economic and operating conditions. We may use the terms “estimated ultimate recovery,” “EUR,” “probable,” “possible,” and “non-proven” reserves, “prospective resources” or “upside” or other descriptions of volumes of resources or reserves potentially recoverable through additional drilling or recovery techniques that the SEC’s guidelines may prohibit us from including in filings with the SEC. These estimates are by their nature more speculative than estimates of proved reserves and accordingly are subject to substantially greater risk of actually being realized by the Company. There is no certainty that any portion of estimated prospective resources will be discovered. If discovered, there is no certainty that it will be commercially viable to produce any portion of the estimated prospective resources. Boe (barrel of oil equivalent) is derived by converting natural gas to oil in the ratio of six thousand cubic feet (Mcf) of natural gas to one barrel (bbl) of oil. Boe may be misleading, particularly if used in isolation. A BOE conversion ratio of 6 Mcf:1 bbl is based on an energy equivalency conversion method primarily applicable at the burner tip and does not represent a value equivalency at the wellhead. |
 COMPANY OVERVIEW TransAtlantic Petroleum Ltd. is an international energy company engaged in the acquisition, development, exploration and production of crude oil and natural gas in Turkey and Bulgaria. 3 NYSE-MKT: Toronto: TAT TNP Share Price (1) : $0.84 Market Cap (1) : $310 million Enterprise Value (1) : $330 million Proved Reserves (2) : 11.6 MMboe SEC PV-10 (3) : $511.0 million (1) Market data as of 5/24/2013. (2) DeGoyler and MacNaughton reserves as of 12/31/2012 based on $108.30/barrel and $8.94/Mcf. (3) Please see reconciliation of PV-10 to standardized measure at end of presentation. Executive Management Chairman & CEO: N. Malone Mitchell, 3rd President: Ian J. Delahunty VP, CFO: Wil F. Saqueton VP, Legal: Jeffrey S. Mecom |
 COMPANY OBJECTIVES Work in countries with favorable fiscal terms where we earn world market prices • Türkiye (Turkey) • Bulgaria 4 Acquire assets with known production or verifiable “show” wells • Utilize technology to enhance or commercialize • Earn early cash flow from sales • Evaluate, plan & monitor from Dallas, Texas headquarters – Seismic, horizontal, and stimulation – 12.5% Royalty, no production tax – Oil: Brent less $7-10, Natural gas: +/- $10/mcf – Currently imports nearly all oil and natural gas – 2.5% Royalty (until 1.5x payout), no production tax – Natural gas: +/- $9/mcf – Currently imports nearly all oil and natural gas |
 2013 PLAN OF ACTION 5 Financial Overview • $130 million capital budget • Operate within cash flow, cash on hand and credit availability • Accelerate with consummation of a joint venture Southeastern Türkiye • Drill horizontal wells to increase productivity • 3D seismic of Molla blocks • Expand 2012 discoveries (Goksu, Bahar, and Alibey) • Resume development at Selmo with horizontal wells • Arar acquisition of more than 150,000 acres in Molla area, 100% working interest and operatorship Northwestern Türkiye • Tekirdag development project: low risk gas production growth, 2 well horizontal trial • Hayrabolu: exploration and delineation wells, overpressure below 1,500 meters • Final exploitation of Edirne blocks (NW Thrace) • Limited development within TPAO (Turkish Petroleum) joint blocks • 3D on Osmanli structure near Thrace area “kitchen” Bulgaria • Expect to resume activity 3Q 2013 • Reviewing other prospects outside Türkiye |
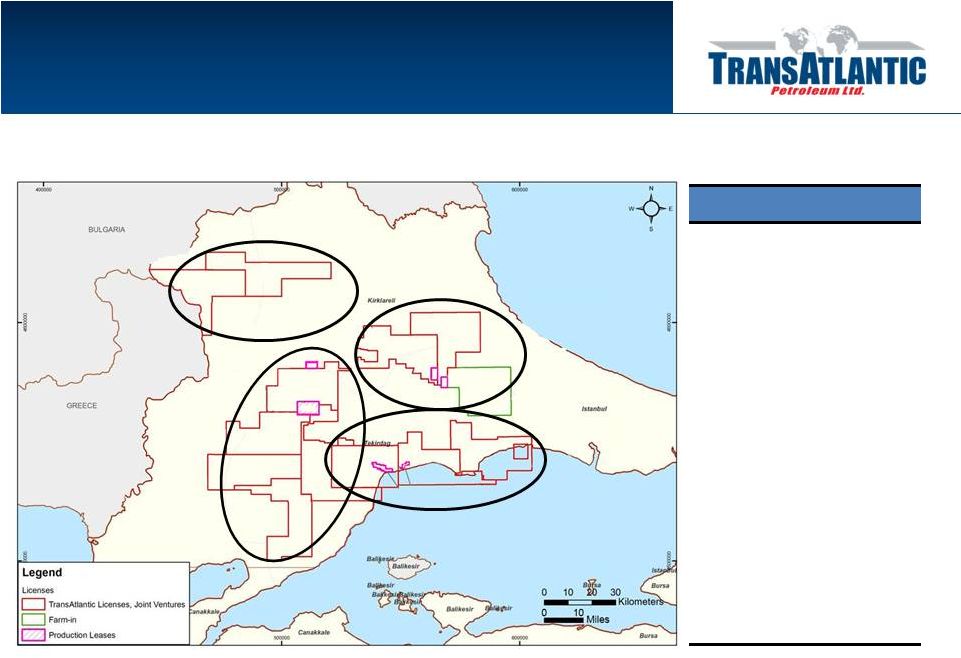
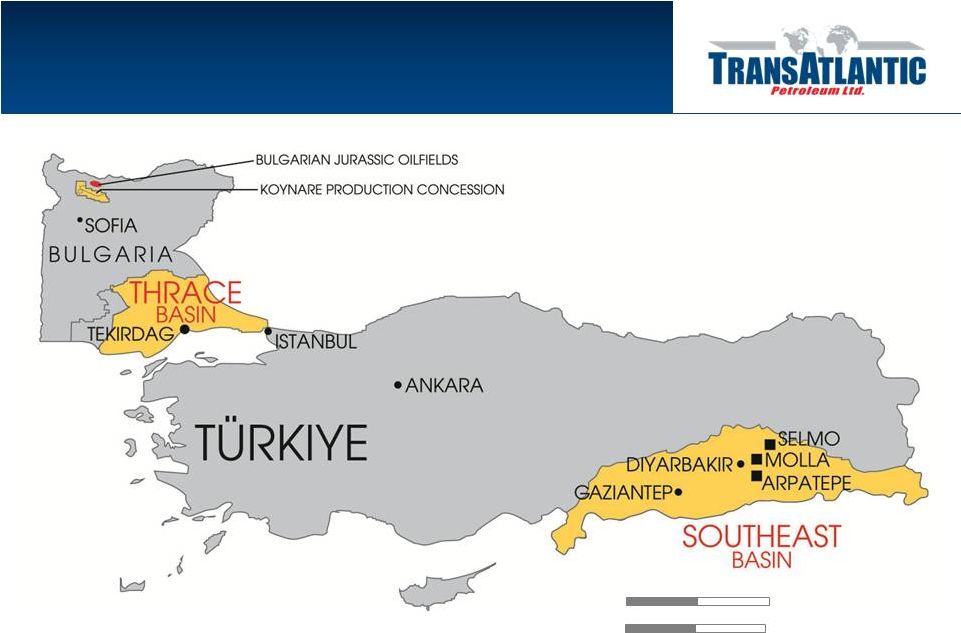 CURRENT OPERATIONS 6 125 miles 200 kilometers |
 1Q 2013 RESULTS 7 Net sales (Boed) 4,144 Realized oil price (per bbl) $103.00 Realized natural gas price (per mcf) $10.12 Net income ($MM) $3.0 Adjusted EBITDAX ($MM) $19.5 Cash and cash equivalents ($MM) $19.4 Debt ($MM) $39.8 Note: Results are for the three months ending March 31, 2013. Realized prices are unhedged. Net income and Adjusted EBITDAX are from continuing operations. Please see reconciliation of Adjusted EBITDAX to net income at end of presentation. |
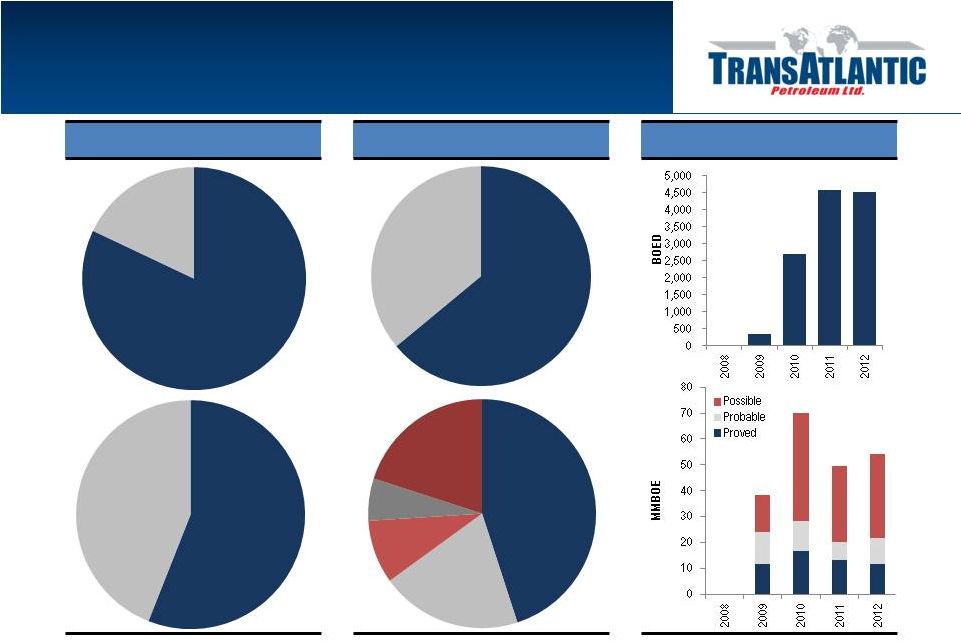 ASSET CHARACTERISTICS 8 Natural Gas 18% Oil 82% Undeveloped 44% Developed 56% Oil 64% Natural Gas 36% Selmo 45% Thrace 20% Other 20% (1) DeGolyer and MacNaughton reserves as of 12/31/2012, based on $108.30/barrel and $8.94/Mcf. Goksu 9% Molla 6% Growth Profile (1) 1Q13 Production Profile Reserve Profile (1) |
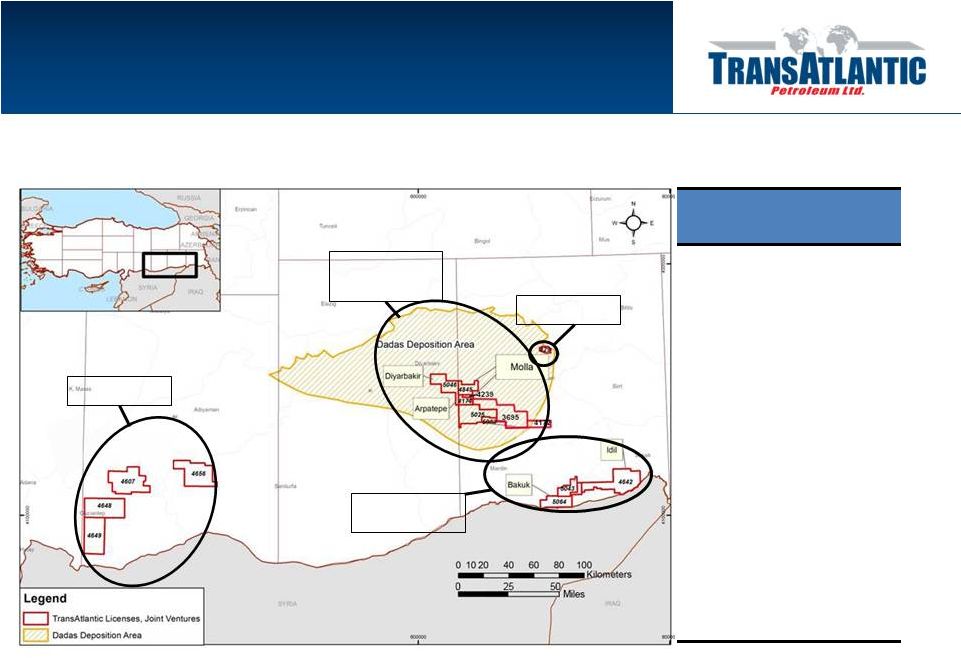 TÜRKIYE: SOUTHEAST 9 Action Plan • Drill horizontal wells to increase productivity • 3D seismic of Molla blocks • Expand 2012 discoveries (Goksu, Bahar and Alibey) • Resume development at Selmo with horizontal wells • Prepare to drill on licenses acquired in May 2013 TransAtlantic’s properties in southeastern Türkiye have common geology with Syria and Iraq. GAZIANTEP MOLLA – ARPATEPE SELMO BAKUK - IDIL |
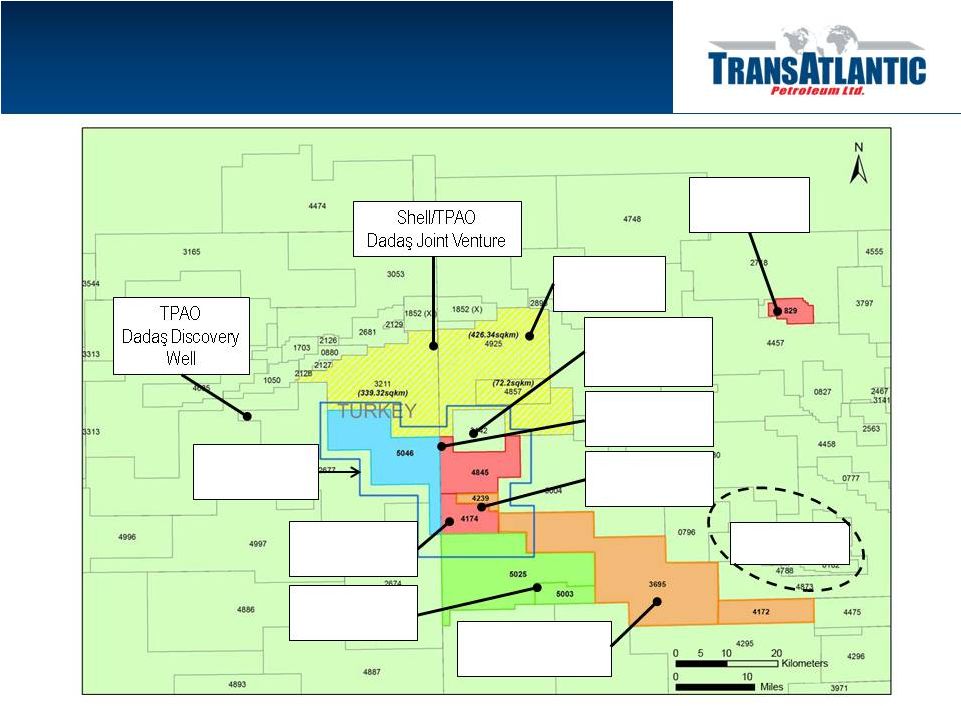 MOLLA – ARPATEPE AREA 10 TransAtlantic’s Arpatepe Field TransAtlantic’s Selmo Field TransAtlantic’s Bahar Field TransAtlantic’s Goksu Field Shell/TPAO Saribugday-1 Perenco’s Kestal Field (EUR 15 MMbo) TransAtlantic’s May 2013 Acquisition TransAtlantic’s Molla Field TransAtlantic 3D Seismic Area Bati Raman Field Largest oil field in Türkiye |
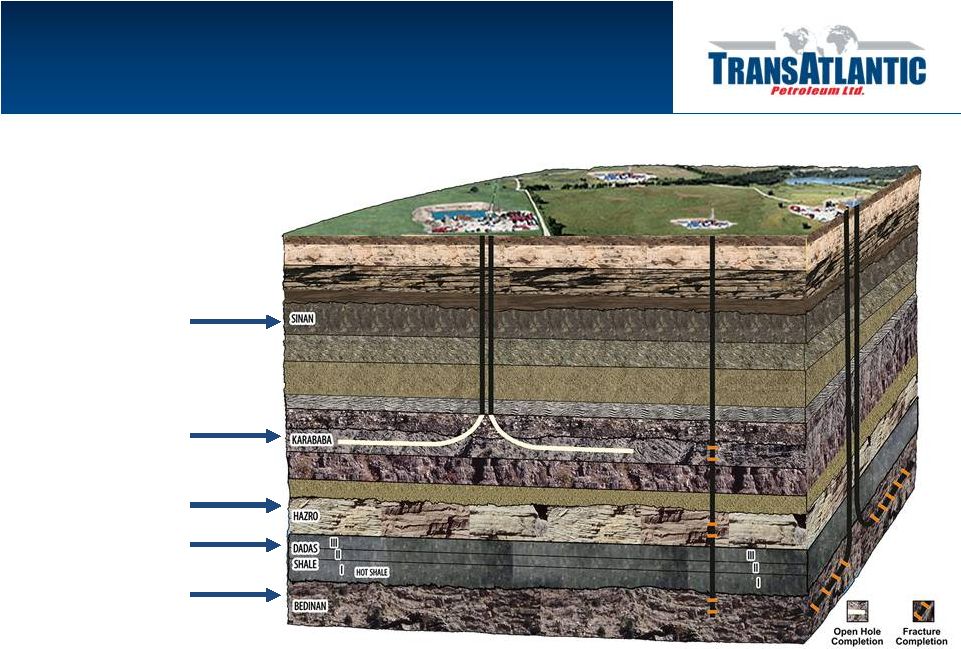 MOLLA – ARPATEPE STACKED PAY POTENTIAL 11 Demonstrated horizontal success with Goksu 3H over 250 BOPD after ~5 months of production Vertical discovery (Bahar-1) IP after frac at ~600 BOPD; Horizontal currently drilling Tested 150 BOPD (Bahar-1) Potential resource play Oil shows – untested Selmo producing zone |
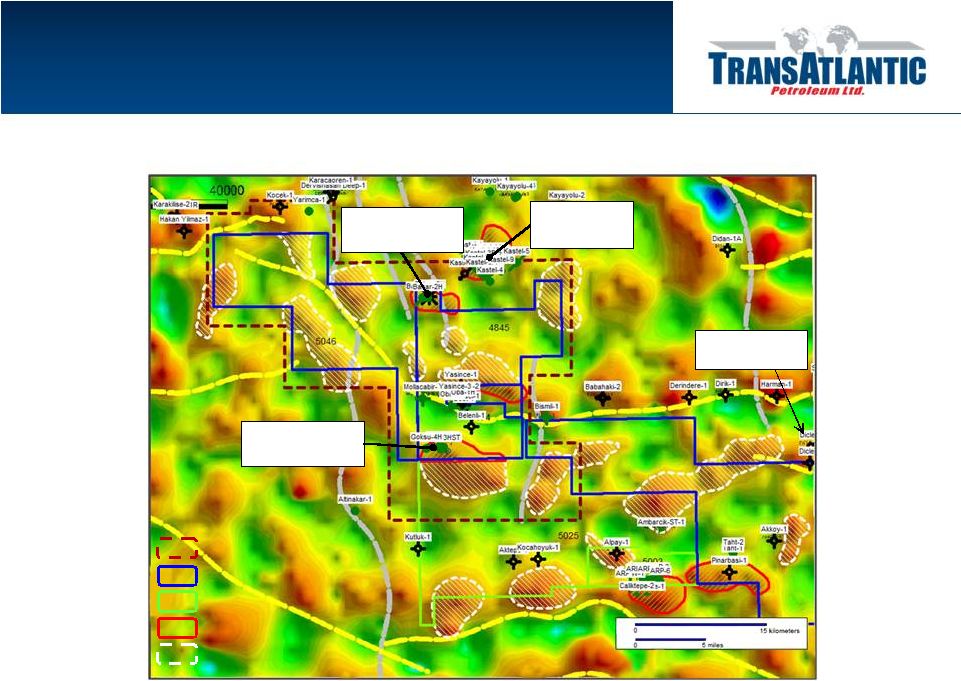 MOLLA – ARPATEPE AREA GRAVITY MAP 12 Field discoveries align well with gravity data; meaningful structural and stratigraphic running room Kastel Field (EUR 15 MMbo) Bahar Field (2P Reserves: 2.5 MMbo) Goksu Field (2P Reserves: 2.9 MMbo) (1) DeGolyer and MacNaughton reserves as of 12/31/2012, based on $108.30/barrel and $8.94/Mcf. Arpatepe JV (TAT 50%) Proved Structures Gravity-Indicated Structures TAT 100% Molla 3D Bati Raman Field Largest oil field in Türkiye |
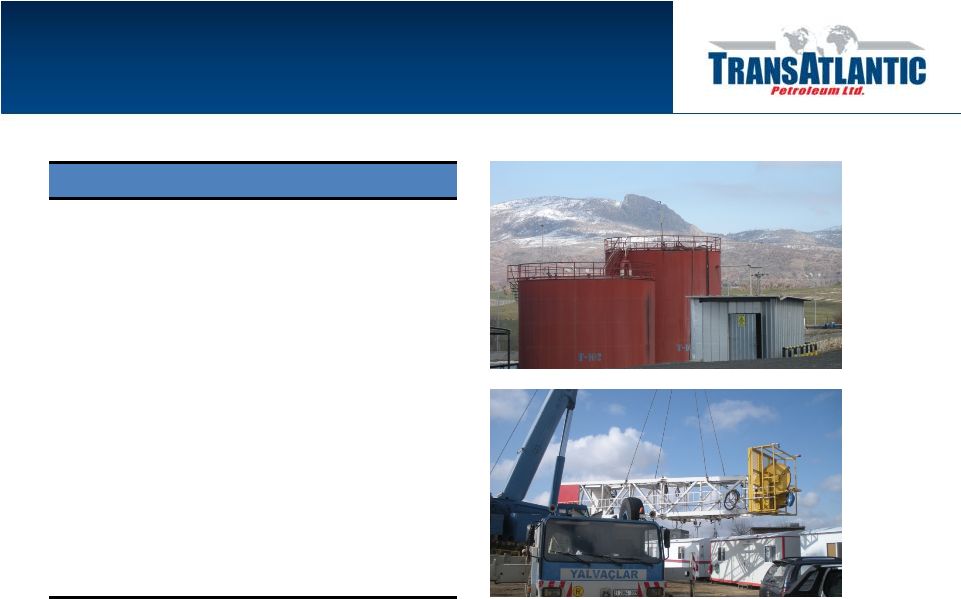 SELMO REMAPPING 13 Selmo Overview • Extensive work has been done to remap and model Selmo to identify bypassed oil due to the extremely fractured nature of the field • New dynamic model incorporates updated substructure mapping with production and pressure histories to determine the areas of the field that will most benefit from a horizontal drilling campaign • We believe horizontal wellbores will allow pressure drawdown that is more uniform across the length of the wellbore and prevent water coning or premature breakthrough of water • 2013 budget provides for four horizontal wells in the Middle Sinan Dolomite (MSD) and one horizontal well in the Lower Sinan Dolomite (LSD) |
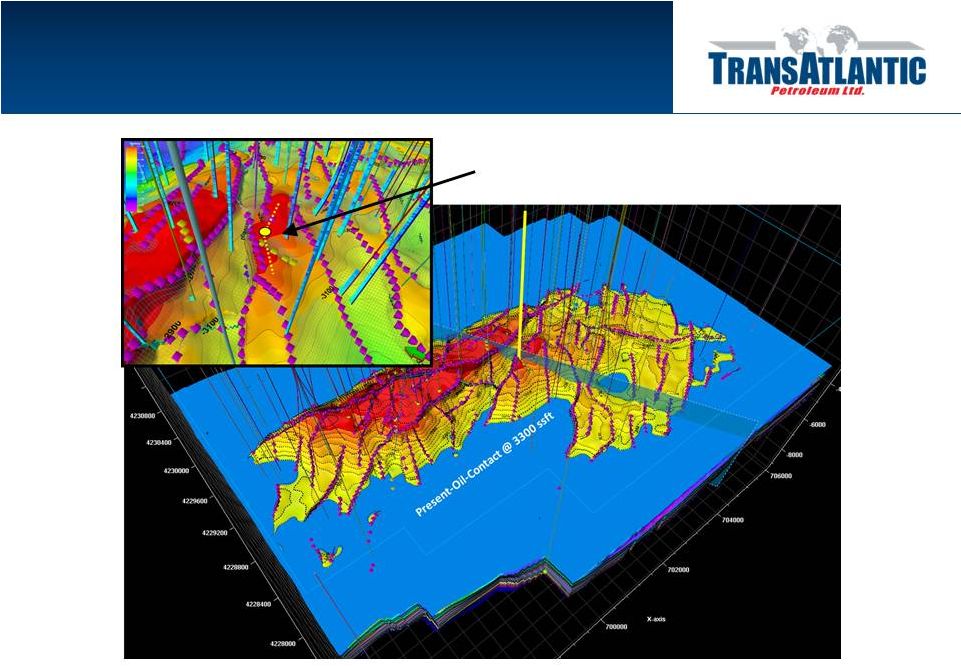 SELMO REMAPPING, CONTINUED 14 Selmo Horizontal Well Example Middle Sinan Dolomite Structure |
 TÜRKIYE: NORTHWEST 15 Thrace Basin Natural Gas Türkiye Corporation (41.5% owned) West Northwest Joint Area with TPAO (50%/50% ) Action Plan • Tekirdag development project: low risk gas production growth, 2 well horizontal trial • Hayrabolu: evaluate exploration and delineation wells, overpressure below 1,500 meters • Final exploitation of Edirne blocks (NW Thrace) • Limited development within TPAO (Turkish Petroleum) joint blocks • 3D on Osmanli structure near Thrace area “kitchen” |
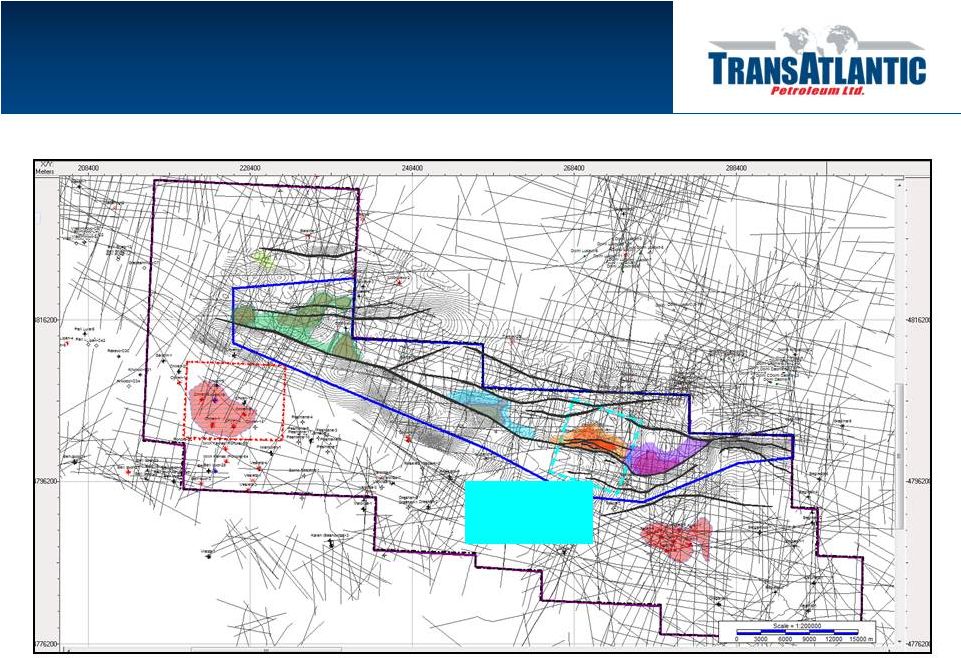
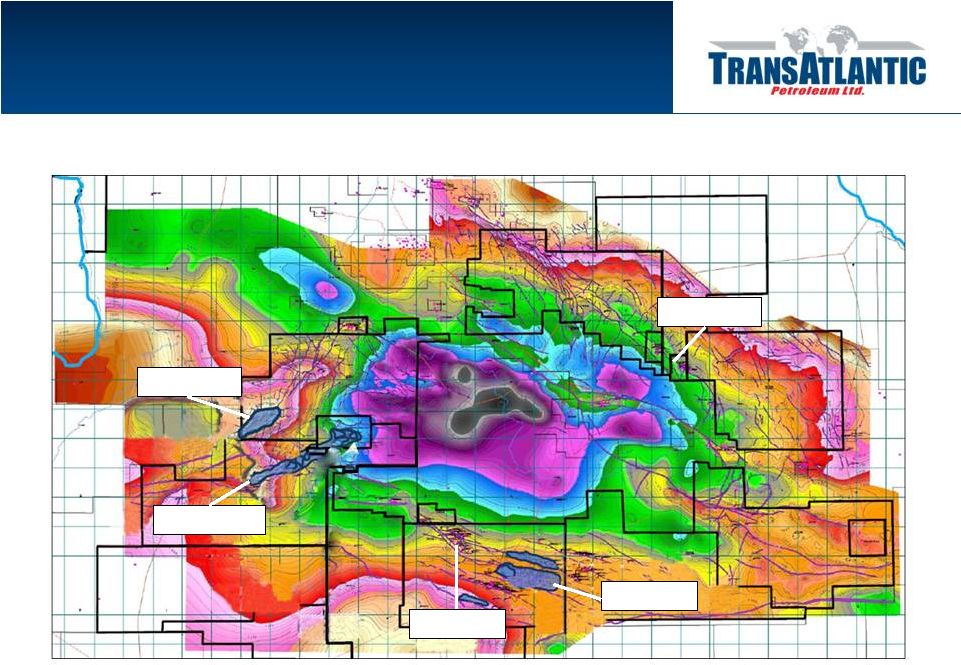 THRACE BASIN: MEZARDERE FORMATION 16 Basin map illustrates source, kitchen, trap and pressure dynamics TEKIRDAG HAYRABOLU YILDIRIM GO – TEPE OSMONLI |
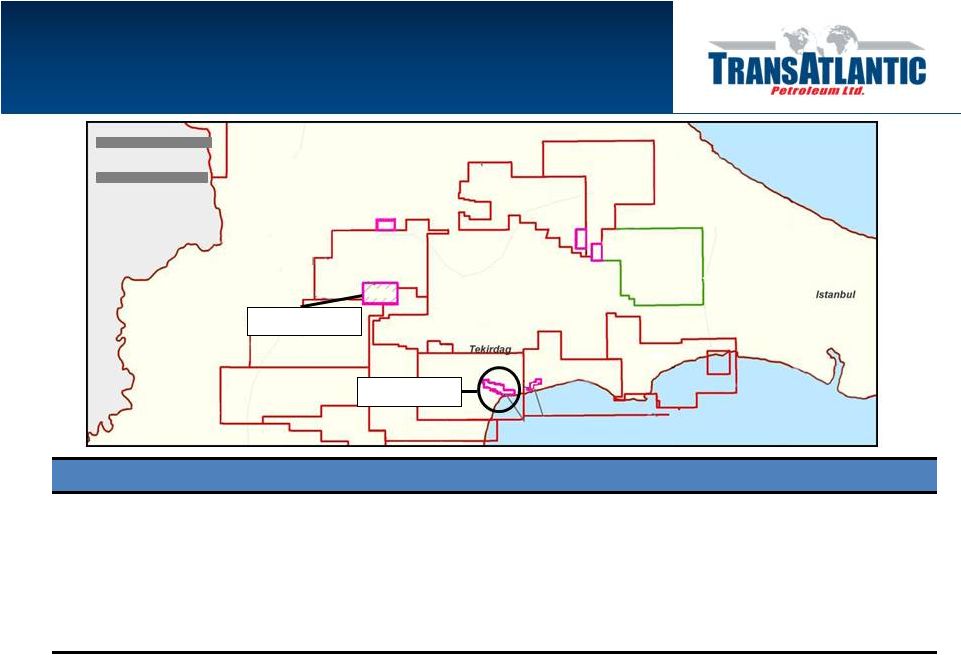 THRACE BASIN: TEKIRDAG DEVELOPMENT 17 Development Program Characteristics: • Initial 88-well vertical development program covering approximately 5,000 acres of the Tekirdag Field Area • Plan 17 wells in Tekirdag area and 8 wells in Hayrabolu during 2013 (will likely adjust downward to shift capital to recently acquired licenses in the southeast) • Two well horizontal test could reduce well count by 75% • Gross well costs expected to range between $2.0 million and $3.0 million, depending upon depth and completion design • Gross expected ultimate recovery expected to exceed 70 Bcf (1) (1) Internal estimate prepared 10/1/12 HAYRABOLU TEKIRDAG 15 miles 25 kilometers |
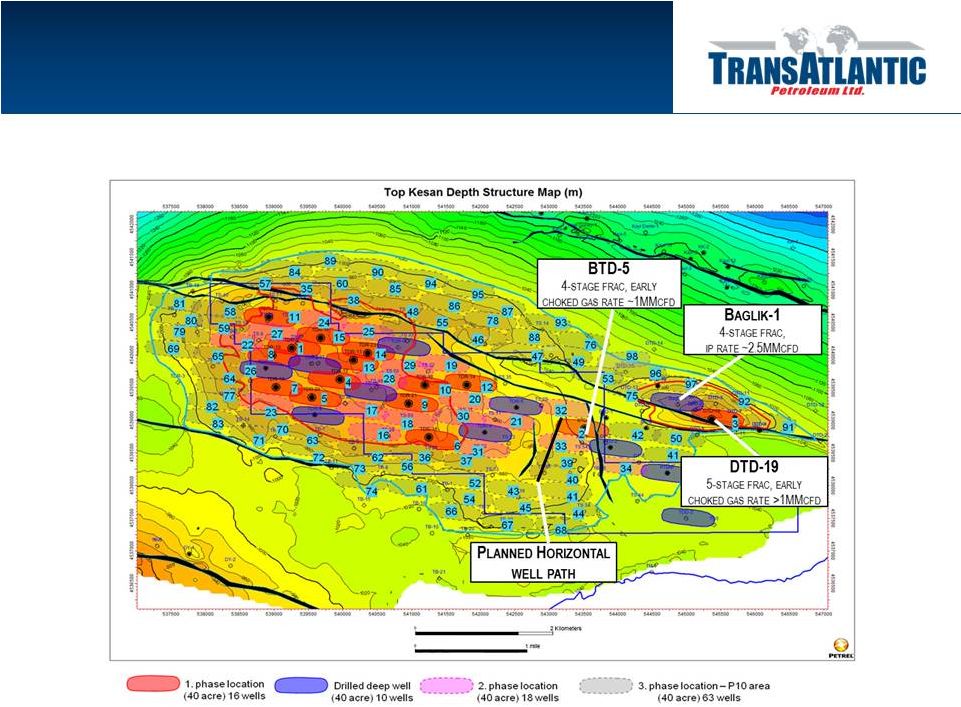 THRACE BASIN: TEKIRDAG DEVELOPMENT 18 Each horizontal well could replace 4-5 vertical wells, significantly improving the economics of the field |
 BULGARIA 19 Action Plan Koynare (Deventci) • Currently finalizing 50% JV • Expect to drill Deventci-R2 in 2013 • Conventional gas discovery in Jurassic-aged Orzirovo • If successful, plan to build pipeline to connect to central grid at +/-$9/Mcf, shoot additional 3D seismic of the multiple structures along Koynare fault trend Stefanetz • November 2011 drilled a ~10,500 foot (3,200 meter) Peshtene-R11 exploration well to core and test Etropole formation • Awaiting revision to parliamentary legislation regarding hydraulic fracture stimulation Near the best oil and natural gas fields in the country and existing natural gas infrastructure ETROPOLE SHALE KOYNARE CONCESSION 160,000 ACRES DEVENRCI-R1 PESHTENE-R11 STEFENETZ CONCESSION (APPLICATION) 395,000 ACRES |
 INVESTMENT CONSIDERATIONS Constructive Outlook • Horizontal and multi-stage completions have potential to significantly increase production and improve economics from known oil and natural gas deposits • More fields are present than originally believed (Goksu, Bahar and Yildirim) • Expect improvements in drilling efficiency to improve well economics and increase well count • JV would accelerate development • Incremental production will largely fall to bottom line without significant increase in G&A or LOE 20 Strong Fundamentals • Very good pricing and netbacks • Terms remain favorable in Turkey and Bulgaria • Ramping up drilling activity to increase production • Newly acquired properties offer additional prospects |
 INVESTOR CONTACT INFORMATION Taylor B. Miele Director of Investor Relations (214) 265-4746 taylor.miele@tapcor.com Wil F. Saqueton VP - Chief Financial Officer (214) 265-4743 wil.saqueton@tapcor.com Ian J. Delahunty President (214) 265-4780 ian.delahunty@tapcor.com 21 |
 Crude Oil Supply/Demand WHY TURKEY? 22 Opportunity Set Undersupplied: • Produces ~8% of crude oil consumed • Produces ~2% of natural gas consumed Underexplored: • Known petroleum systems and attractive geology • Opportunity for modern technology to make a difference Pro-Business: • Relatively laissez faire • 12.5% royalty, 20% corporate tax Source: US Energy Information Administration (EIA) Source: US Energy Information Administration (EIA). Most recent data available is 2011. Source: World Bank. Most recent data available is 2011. Natural Gas Supply/Demand Gross Domestic Product |
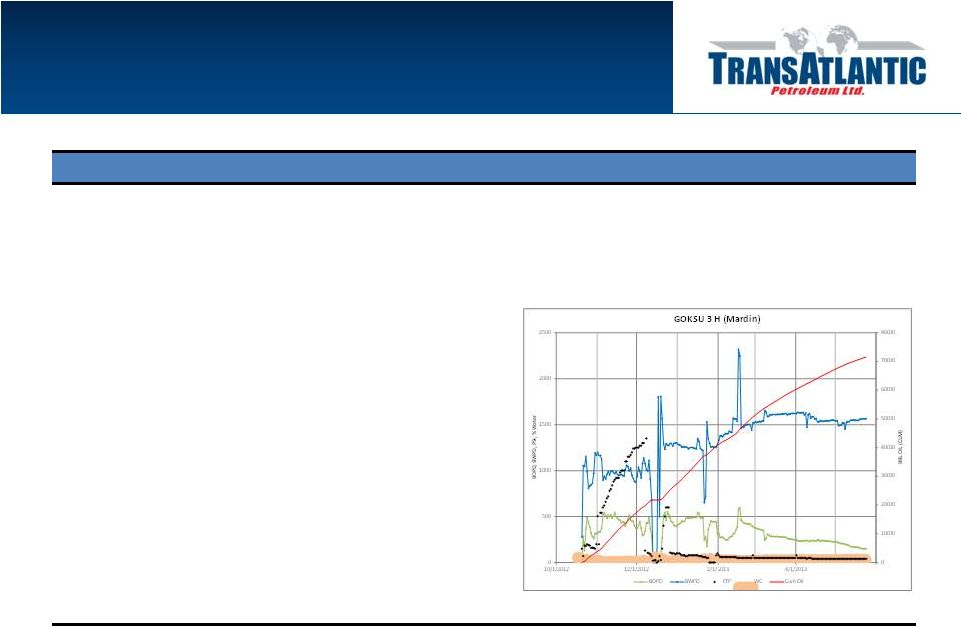 MOLLA: MARDIN POTENTIAL; GOKSU DISCOVERY 23 Molla: Mardin Formation Overview • Fractured Cretaceous carbonate present across the region • Initial vertical discoveries bolstered by recent application of horizontal drilling processes • Total 1P reserves of 0.6 MMbbls (1) ; Total 2P reserves of 2.9 MMbbls (1) • Cumulative production over 60,000 bbls • Initial flow rates were 400-500 BOPD in February 2012 • Flowing ~250 BOPD after 5 months of production • Cumulative production over 70,000 bbls • TransAtlantic’s first horizontal completion, 1,600 foot lateral • Drilled and completed for approximately $3.5 million • Initial production 250 BOPD • Drilled and completed for approximately $2.5 million • Westerly field extension (1) DeGolyer and MacNaughton reserves as of 12/31/2012, based on $108.30/barrel and $8.94/Mcf. Goksu-2 Goksu-3H Goksu-4H |
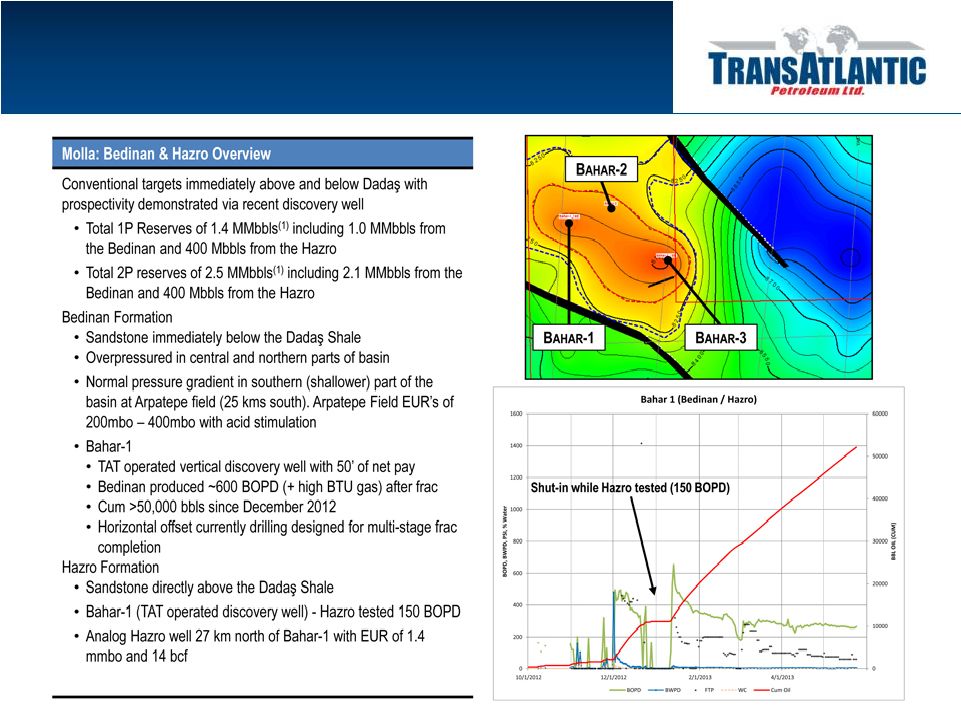 MOLLA: BEDINAN AND HAZRO DISCOVERY (1) DeGolyer and MacNaughton reserves as of 12/31/2012, based on $108.30/barrel and $8.94/Mcf. 24 |
 MOLLA: BAHAR-1 MARDIN TARGETS 25 |
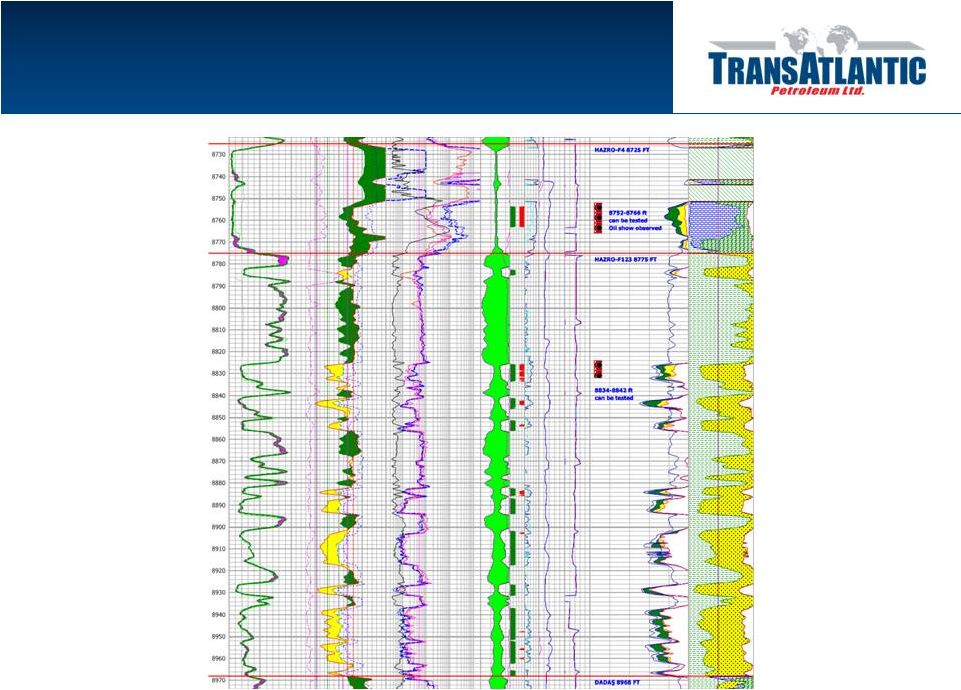 MOLLA: BAHAR-1 HAZRO TARGETS 26 |
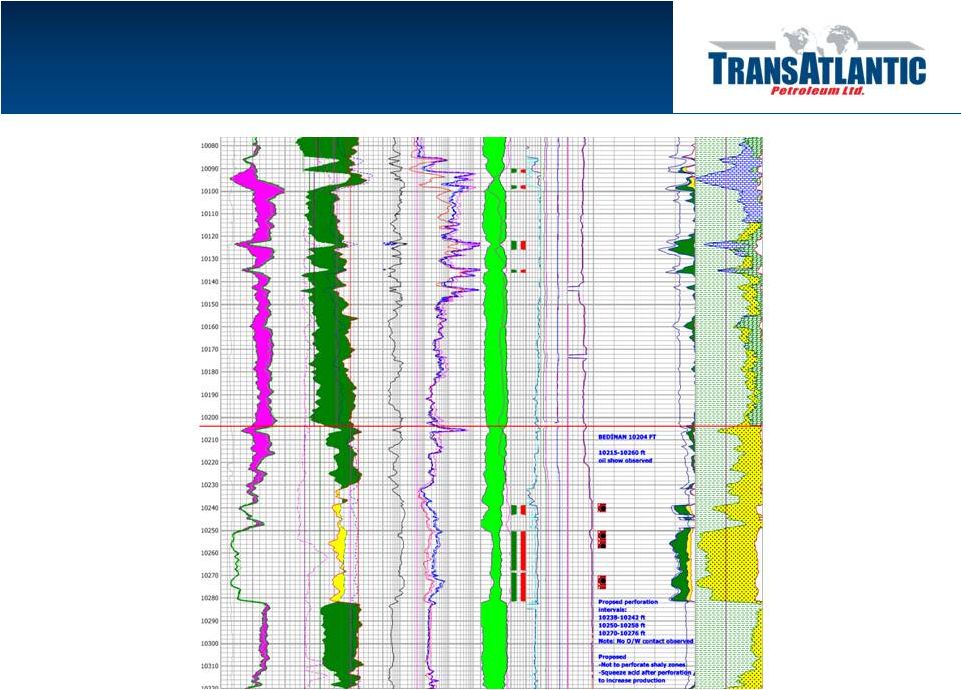 MOLLA: BAHAR-1 BEDINAN TARGET 27 |
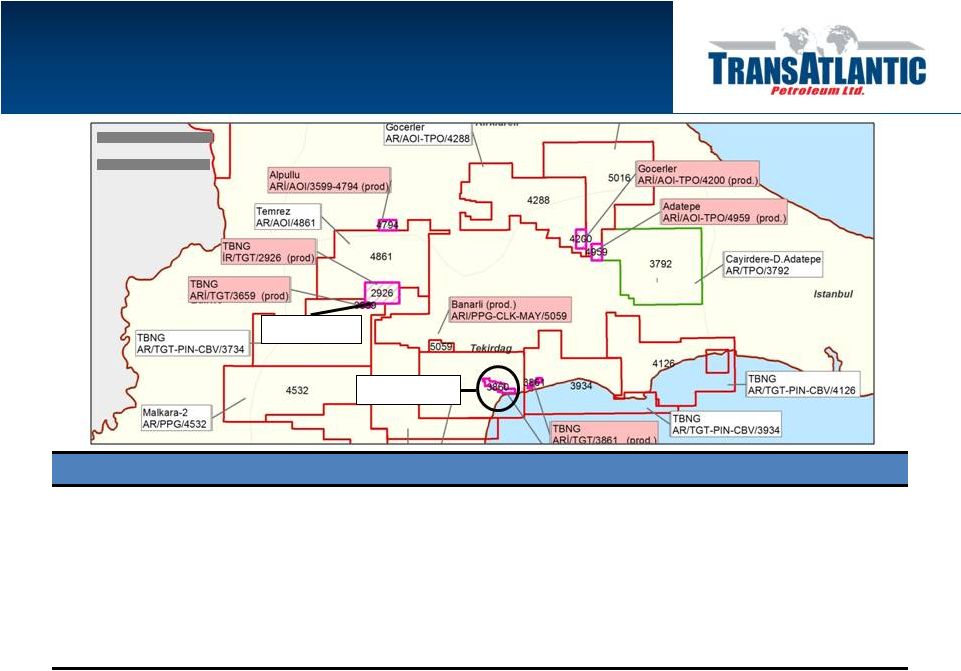 THRACE BASIN: TEKIRDAG DEVELOPMENT 28 Development Program Characteristics: • Initial 88-well vertical development program covering approximately 5,000 acres of the Tekirdag Field Area • Plan 17 wells in Tekirdag area and 8 wells in Hayrabolu during 2013 (will likely adjust downward to shift capital to recently acquired licenses in the southeast) • Two well horizontal test could reduce well count by 75% • Gross well costs expected to range between $2.0 million and $3.0 million, depending upon total depth and completion design • Gross expected ultimate recovery expected to exceed 70 Bcf (1) (1) Internal estimate prepared 10/1/12. HAYRABOLU TEKIRDAG 15 miles 25 kilometers |
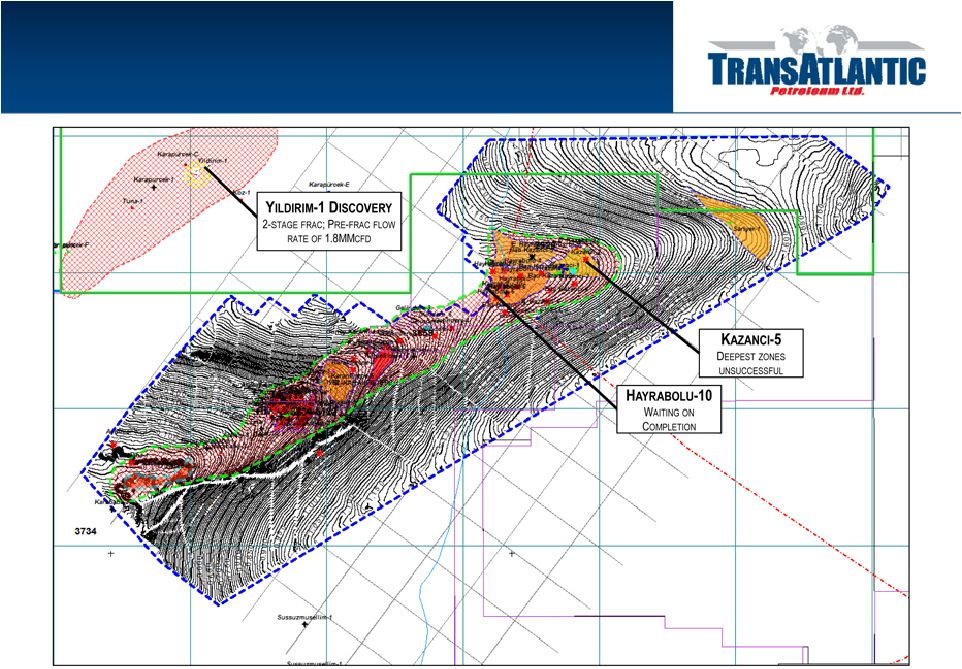 THRACE BASIN: HAYRABOLU TREND 29 11,000 prospective acres |
 BULGARIA SEISMIC AND WELL DATABASE 30 Deventci 3D Seismic Survey 75 km^2 |
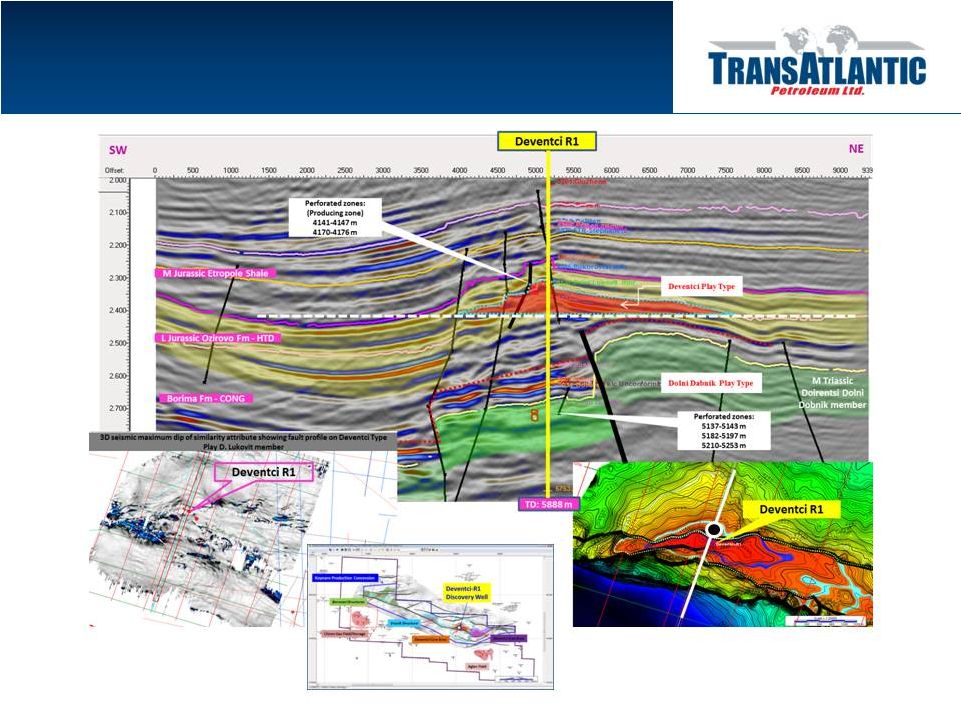 BULGARIA: DEVENTCI-R1 DISCOVERY WELL 31 |
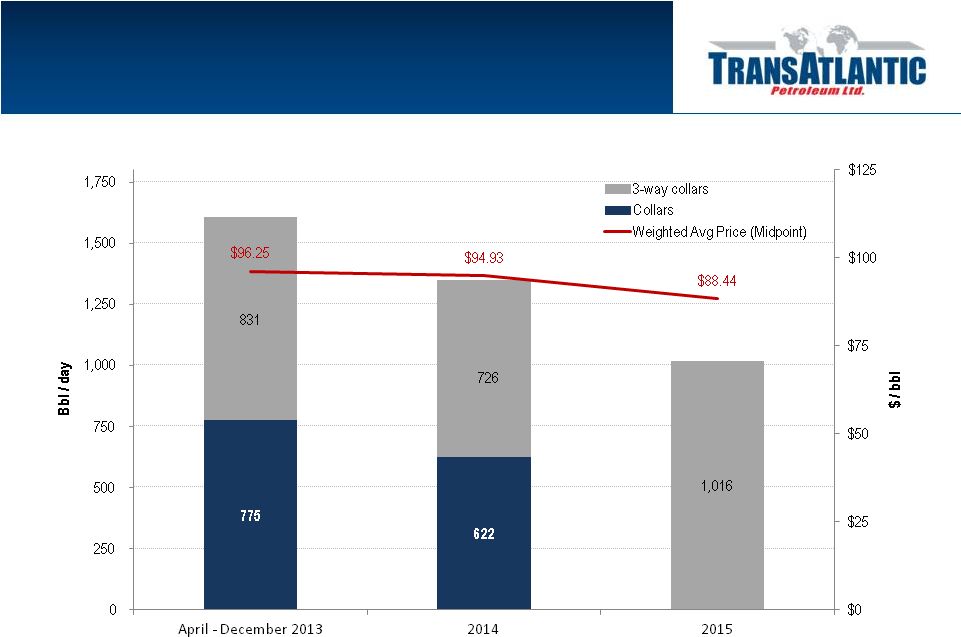 HEDGE PROFILE 32 Data as of 3/31/2013. |
 EBITDAX RECONCILIATION 33 For the three months ended $US millions March 31, 2013 Net income from continuing operations $3.0 Less: Interest and other, net 0.5 Income tax expense 2.3 Exploration, abandonment, and impairment 3.9 Seismic 0.1 Foreign exchange loss 0.5 Share-based compensation 0.4 Unrealized derivative gain (0.5) Accretion of asset retirement obligation 0.1 Depreciation, depletion and amortization 9.0 Net other items 0.2 Adjusted EBITDAX from continuing operations $19.5 This presentation references estimated EBITDAX, which is a non-GAAP financial measure that represents earnings from continuing operations before income taxes, interest, depreciation, depletion, amortization, impairment, abandonment and exploration expense. The Company believes EBITDAX assists management and investors in comparing the Company’s performance and ability to fund capital expenditures and working capital requirements on a consistent basis without regard to depreciation, depletion and amortization, impairment of natural gas and oil properties and exploration expenses, which can vary significantly from period to period. In addition, management uses EBITDAX as a financial measure to evaluate the Company’s operating performance. EBITDAX is also widely used by investors and rating agencies. EBITDAX is not a measure of financial performance under GAAP. Accordingly, it should not be considered as a substitute for net income, income from operations, or cash flow provided by operating activities prepared in accordance with GAAP. Net income, income from operations, or cash flow provided by operating activities may vary materially from EBITDAX. Investors should carefully consider the specific items included in the computation of EBITDAX. The Company has disclosed EBITDAX to permit a comparative analysis of its operating performance and debt servicing ability relative to other companies. |
 PV-10 RECONCILIATION 34 $US thousands Total PV-10: $511,075 Future income taxes: (106,411) Discount of future income taxes at 10% per annum: 31,213 Standardized measure: $435,880 The PV-10 value of the estimated future net revenue are not intended to represent the current market value of the estimated oil and natural gas reserves we own. Management believes that the presentation of PV-10, while not a financial measure in accordance with U.S. GAAP, provides useful information to investors because it is widely used by professional analysts and sophisticated investors in evaluating oil and natural gas companies. Because many factors that are unique to each individual company impact the amount of future income taxes estimated to be paid, the use of a pre-tax measure is valuable when comparing companies based on reserves. PV-10 is not a measure of financial or operating performance under U.S. GAAP. PV-10 should not be considered as an alternative to the standardized measure as defined under U.S. GAAP. The following table provides a reconciliation of our PV-10 to our standardized measure: |