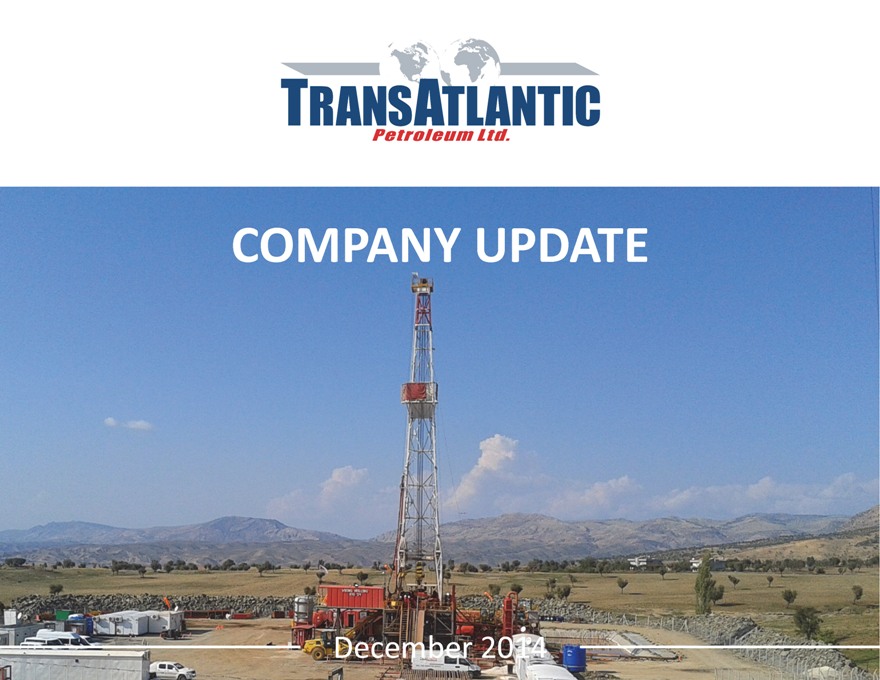
Exhibit 99.1
COMPANY UPDATE
December 2014
FORWARD LOOKING STATEMENTS
Outlooks,projections,estimates,targets andbusiness plans in this presentation or any related subsequent discussions are forward looking statements. Actual future results, including TransAtlantic Petroleum Ltd.’s own production growth and mix; financial results; the amount and mix of capital expenditures; resource additions and recoveries; finding and development costs; project and drilling plans, timing, costs, and capacities; revenue enhancements and cost efficiencies; industry margins; margin enhancements and integration benefits; and the impact of technology could differ materially due to a number of factors. These include market prices for natural gas, natural gas liquids and oil products; estimates of reserves and economic assumptions; the ability to produce and transport natural gas, natural gas liquids and oil; the results of exploration and development drilling and related activities; economic conditions in the countries and provinces in which we carry on business, especially economic slowdowns; actions by governmental authorities, receipt of required approvals, increases in taxes, legislative and regulatory initiatives relating to fracture stimulation activities, changes in environmental and other regulations, and renegotiations of contracts; political uncertainty, including actions by insurgent groups or other conflict; the negotiation and closing of material contracts; shortages of drilling rigs, equipment or oilfield services; and other factors discussed here and under the heading “Risk Factors” in our Annual Report on Form 10 K for the year ended December 31, 2013, which is available on our website at www.transatlanticpetroleum.com and on www.sec.gov. See also TransAtlantic’s audited financial statements and the accompanying management discussion and analysis. Forward looking statements are based on management’s knowledge and reasonable expectations on the date hereof, and we assume no duty to update these statements as of any future date.
The information set forth in this presentation does not constitute an offer, solicitation or recommendation to sell or an offer to buy any securities of the Company. The information published herein is provided for informational purposes only. The Company makes no representation that the information and opinions expressed herein are accurate, complete or current. The information contained herein is current as of the date hereof, but may become outdated or subsequently may change. Nothing contained herein constitutes financial, legal, tax, or other advice.
The SEC has generally permitted oil and gas companies, in their filings with the SEC, to disclose only proved reserves that a company has demonstrated byactual production or conclusive formation tests to beeconomicallyand legallyproducibleunder existing economicand operating conditions. We may use the terms “estimated ultimate recovery,” “EUR,” “probable,” “possible,” and “nonproven” reserves, “prospective resources” or “upside” or other descriptions of volumes of resources or reserves potentially recoverable through additional drilling or recovery techniques that the SEC’s guidelines may prohibit us from including in filings with the SEC. These estimates are by their nature more speculative than estimates of proved reserves and accordingly are subject to substantially greater risk of actually being realized by the Company. There is no certainty that any portion of estimated prospective resources will be discovered. If discovered, there is no certainty that it will be commercially viable to produce any portion of the estimated prospective resources.
Note on Possible Reserves: possible reserves are those additional reserves that are less certain to be recovered than probable reserves. There is a 10% probability that the quantities actually recovered will equal or exceed the sum of proved plus probable plus possible reserves.
Note on BOE: BOE (barrel of oil equivalent) is derived by converting natural gas to oil in the ratio of six thousand cubic feet (MCF) of natural gas to one barrel (bbl) of oil. BOE may be misleading, particularly if used in isolation. A BOE conversion ratio of 6 Mcf:1 bbl is based on an energy equivalency conversion method primarily applicable at the burner tip and does not represent a value equivalency at the wellhead.
Cover Photo: Şelmo field in southeastern Turkey.
2
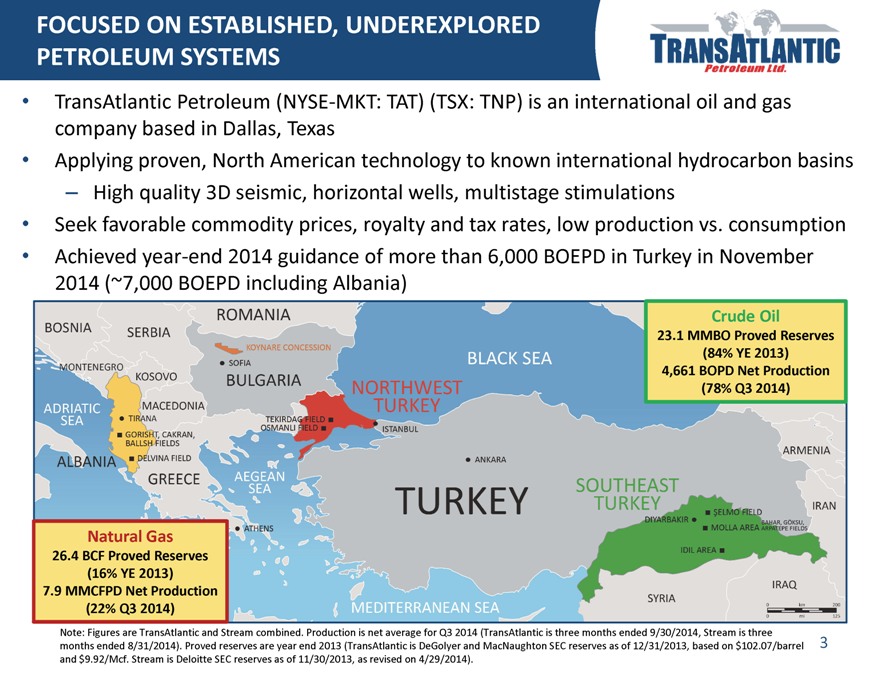
FOCUSED ON ESTABLISHED, UNDEREXPLORED PETROLEUM SYSTEMS
TransAtlantic Petroleum (NYSE MKT: TAT) (TSX: TNP) is an international oil and gas company based in Dallas, Texas
Applying proven, North American technology to known international hydrocarbon basins
– High quality 3D seismic, horizontal wells, multistage stimulations
Seek favorable commodity prices, royalty and tax rates, low production vs. consumption
Achieved year end 2014 guidance of more than 6,000 BOEPD in Turkey in November
2014 (~7,000 BOEPD including Albania)
Crude Oil
23.1 MMBO Proved Reserves (84% YE 2013) 4,661 BOPD Net Production (78% Q3 2014)
Natural Gas
26.4 BCF Proved Reserves (16% YE 2013) 7.9 MMCFPD Net Production (22% Q3 2014)
Note: Figures are TransAtlantic and Stream combined. Production is net average for Q3 2014 (TransAtlantic is three months ended 9/30/2014, Stream is three months ended 8/31/2014). Proved reserves are year end 2013 (TransAtlantic is DeGolyer and MacNaughton SEC reserves as of 12/31/2013, based on $102.07/barrel and $9.92/Mcf. Stream is Deloitte SEC reserves as of 11/30/2013, as revised on 4/29/2014).
3
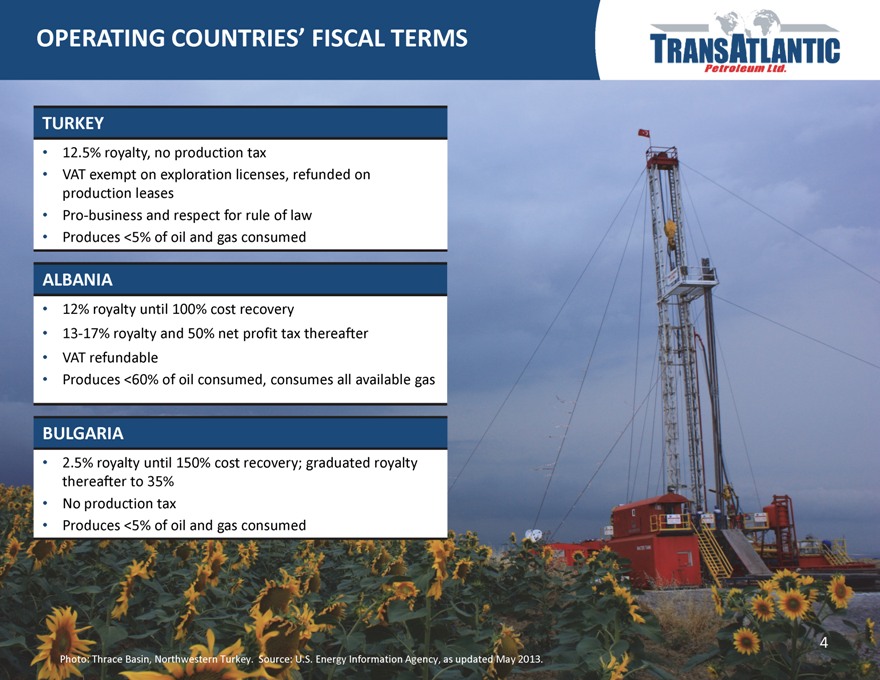
OPERATING COUNTRIES’ FISCAL TERMS
TURKEY
12.5% royalty, no production tax
VAT exempt on exploration licenses, refunded on production leases
Pro?business and respect for rule of law
Produces <5% of oil and gas consumed
ALBANIA
12% royalty until 100% cost recovery
13?17% royalty and 50% net profit tax thereafter
VAT refundable
Produces <60% of oil consumed, consumes all available gas
BULGARIA
2.5% royalty until 150% cost recovery; graduated royalty thereafter to 35%
No production tax
Produces <5% of oil and gas consumed
Photo: Thrace Basin, Northwestern Turkey. Source: U.S. Energy Information Agency, as updated May 2013.
4
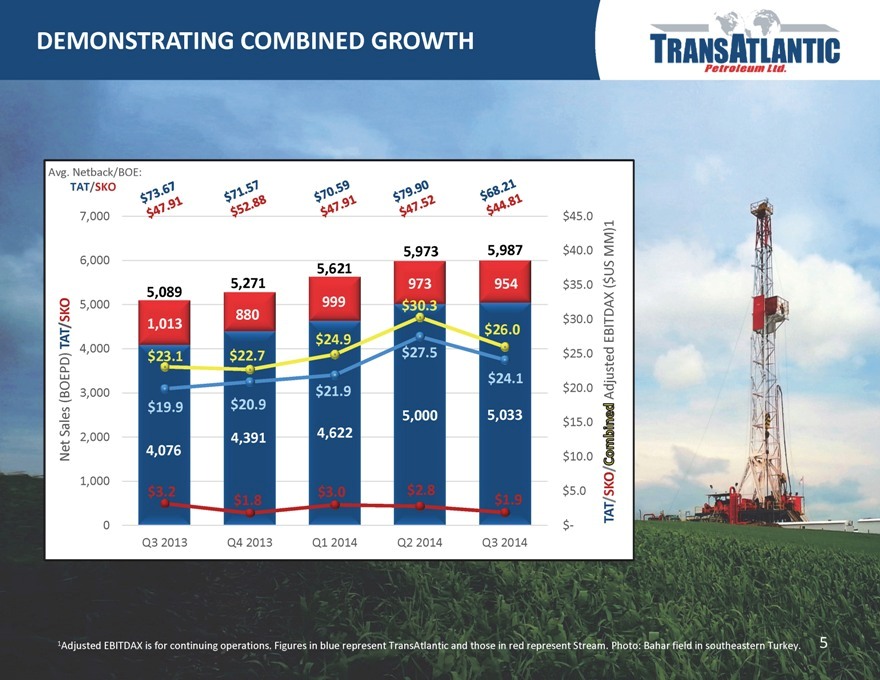
DEMONSTRATING COMBINED GROWTH
Avg. Netback/BOE:
TAT/SKO $73.67 $71.57 $
7,000 $ 45.0
5,973 5,987 $ 40.0 MM)1
6,000
5,621 US
5,271 973 954 $ 35.0 ( $
5,089
5,000 999 $30.3
SKO 880
/ 1,013 $ 30.0
AT $24.9 $26.0 EBITDAX
T
4,000 $23.1 $22.7 $27.5 $ 25.0
$24.1
(BOEPD) 3,000 $21.9 $ 20.0 Adjusted
$19.9 $20.9
les 5,000 5,033 $ 15.0
Sa 4,622
2,000 4,391
Net 4,076 $ 10.0
/
1,000 SKO
$3.2 $3.0 $2.8 $ 5.0
$1.8 $1.9 /
T
0 $ ? TA
Q3 2013 Q4 2013 Q1 2014 Q2 2014 Q3 2014
T
1Adjusted EBITDAX is for continuing operations. Figures in blue represent TransAtlantic and those in red represent Stream. Photo: Bahar field in southeastern Turkey.
5
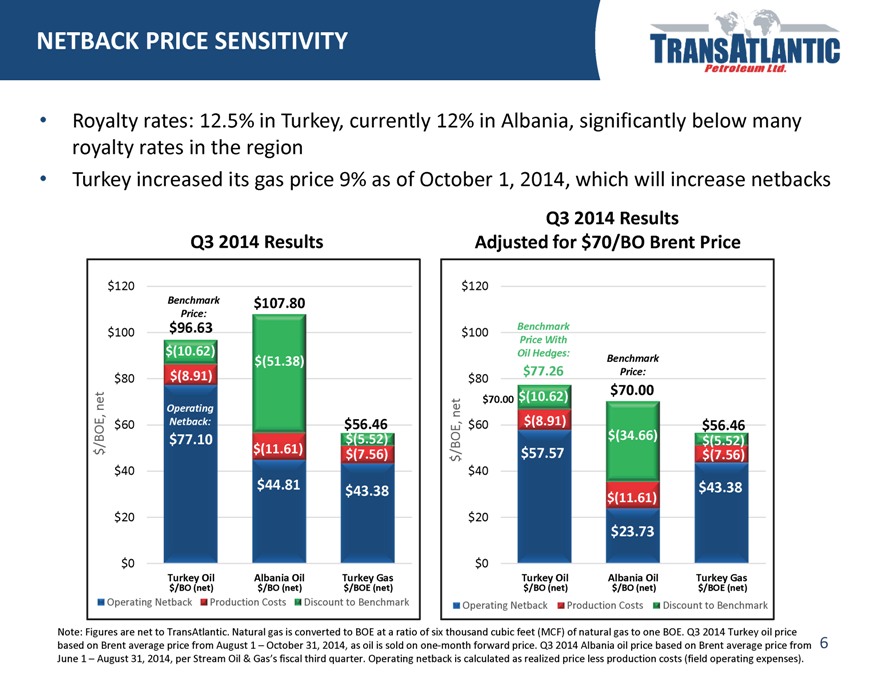
NETBACK PRICE SENSITIVITY
Royalty rates: 12.5% in Turkey, currently 12% in Albania, significantly below many royalty rates in the region Turkey increased its gas price 9% as of October 1, 2014, which will increase netbacks
Q3 2014 Results
$120
Benchmark $107.80
Price:
$100 $96.63
$(10.62)
$(51.38)
$80 $(8.91)
net Operating
E,
$60 Netback: $56.46
$77.10 $(5.52)
$(11.61) $(7.56)
$40
$44.81 $43.38
$20
$0
Turkey Oil Albania Oil Turkey Gas
$/BO (net) $/BO (net) $/BOE (net)
Operating Netback Production Costs Discount to Benchmark
Q3 2014 Results Adjusted for $70/BO Brent Price
$120
$100 Benchmark
Price With
Oil Hedges: Benchmark
$80 $77.26 Price:
$70.00
$70.00 $(10.62)
net, $60 $(8.91) $56.46
$(34.66) $(5.52)
$57.57 $(7.56)
$40
$43.38
$(11.61)
$20
$23.73
$0
Turkey Oil Albania Oil Turkey Gas
$/BO (net) $/BO (net) $/BOE (net)
Operating Netback Production Costs Discount to Benchmark
Note: Figures are net to TransAtlantic. Natural gas is converted to BOE at a ratio of six thousand cubic feet (MCF) of natural gas to one BOE. Q3 2014 Turkey oil price based on Brent average price from August 1 – October 31, 2014, as oil is sold on onemonth forward price. Q3 2014 Albania oil price based on Brent average price from June 1 – August 31, 2014, per Stream Oil & Gas’s fiscal third quarter. Operating netback is calculated as realized price less production costs (field operating expenses).
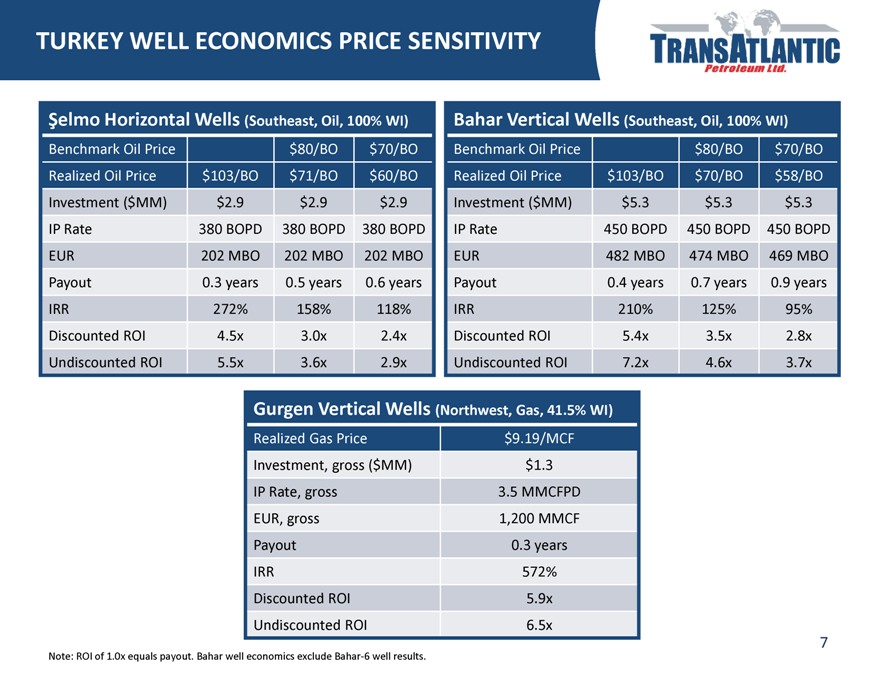
TURKEY WELL ECONOMICS PRICE SENSITIVITY
Şelmo Horizontal Wells (Southeast, Oil, 100% WI) Bahar Vertical Wells (Southeast, Oil, 100% WI)
Benchmark Oil Price $80/BO $70/BO Benchmark Oil Price $80/BO $70/BO
Realized Oil Price $103/BO $71/BO $60/BO Realized Oil Price $103/BO $70/BO $58/BO
Investment ($MM) $2.9 $2.9 $2.9 Investment ($MM) $5.3 $5.3 $5.3
IP Rate 380 BOPD 380 BOPD 380 BOPD IP Rate 450 BOPD 450 BOPD 450 BOPD
EUR 202 MBO 202 MBO 202 MBO EUR 482 MBO 474 MBO 469 MBO
Payout 0.3 years 0.5 years 0.6 years Payout 0.4 years 0.7 years 0.9 years
IRR 272% 158% 118% IRR 210% 125% 95%
Discounted ROI 4.5x 3.0x 2.4x Discounted ROI 5.4x 3.5x 2.8x
Gurgen Vertical Wells (Northwest, Gas, 41.5% WI)
Realized Gas Price $9.19/MCF
Investment, gross ($MM) $1.3
IP Rate, gross 3.5 MMCFPD
EUR, gross 1,200 MMCF
Payout 0.3 years
IRR 572%
Discounted ROI 5.9x
Undiscounted ROI 6.5x
Undiscounted ROI 5.5x 3.6x 2.9x Undiscounted ROI 7.2x 4.6x 3.7x
Note: ROI of 1.0x equals payout. Bahar well economics exclude Bahar 6 well results.
7
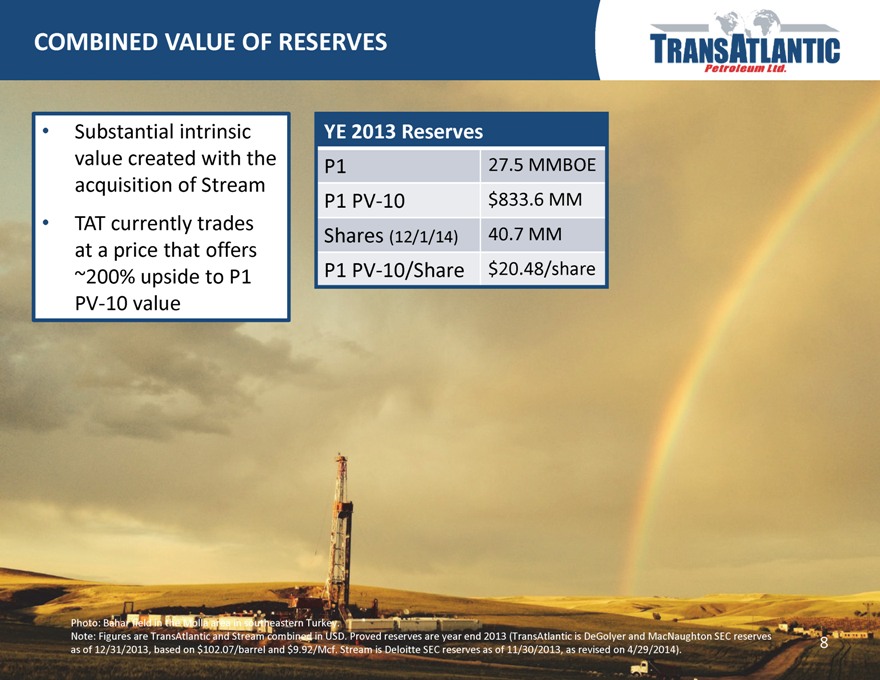
COMBINED VALUE OF RESERVES
Substantial intrinsic YE 2013 Reserves
value created with the P1 27.5 MMBOE
acquisition of Stream
P1 PV 10 $833.6 MM
TAT currently trades Shares (12/1/14) 40.7 MM
at a price that offers
~200% upside to P1 P1 PV 10/Share $20.48/share
PV 10 value
Photo: Bahar field in the Molla area in southeastern Turkey.
Note: Figures are TransAtlantic and Stream combined in USD. Proved reserves are year end 2013 (TransAtlantic is DeGolyer and MacNaughton SEC reserves as of 12/31/2013, based on $102.07/barrel and $9.92/Mcf. Stream is Deloitte SEC reserves as of 11/30/2013, as revised��on 4/29/2014).
8
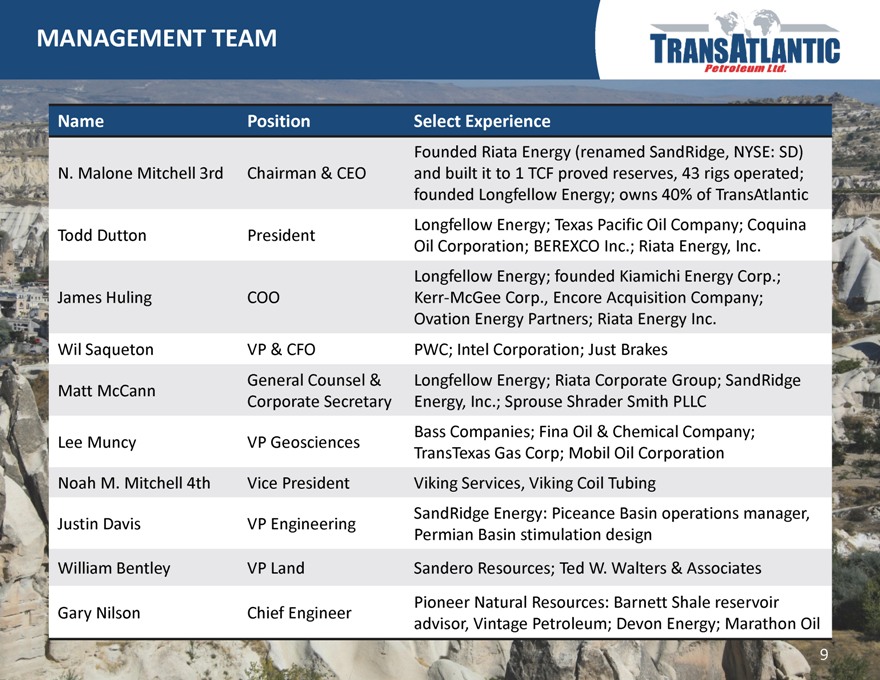
MANAGEMENT TEAM
Name Position Select Experience
Founded Riata Energy (renamed SandRidge, NYSE: SD)
N. Malone Mitchell 3rd Chairman & CEO and built it to 1 TCF proved reserves, 43 rigs operated;
founded Longfellow Energy; owns 40% of TransAtlantic
Longfellow Energy; Texas Pacific Oil Company; Coquina
Todd Dutton President
Oil Corporation; BEREXCO Inc.; Riata Energy, Inc.
Longfellow Energy; founded Kiamichi Energy Corp.;
James Huling COO Kerr McGee Corp., Encore Acquisition Company;
Ovation Energy Partners; Riata Energy Inc.
Wil Saqueton VP & CFO PWC; Intel Corporation; Just Brakes
General Counsel & Longfellow Energy; Riata Corporate Group; SandRidge
Matt McCann
Corporate Secretary Energy, Inc.; Sprouse Shrader Smith PLLC
Bass Companies; Fina Oil & Chemical Company;
Lee Muncy VP Geosciences
TransTexas Gas Corp; Mobil Oil Corporation
Noah M. Mitchell 4th Vice President Viking Services, Viking Coil Tubing
SandRidge Energy: Piceance Basin operations manager,
Justin Davis VP Engineering
Permian Basin stimulation design
William Bentley VP Land Sandero Resources; Ted W. Walters & Associates
Pioneer Natural Resources: Barnett Shale reservoir
Gary Nilson Chief Engineer
advisor, Vintage Petroleum; Devon Energy; Marathon Oil
9
ALBANIA ACQUISITION
Stream Oil & Gas
10
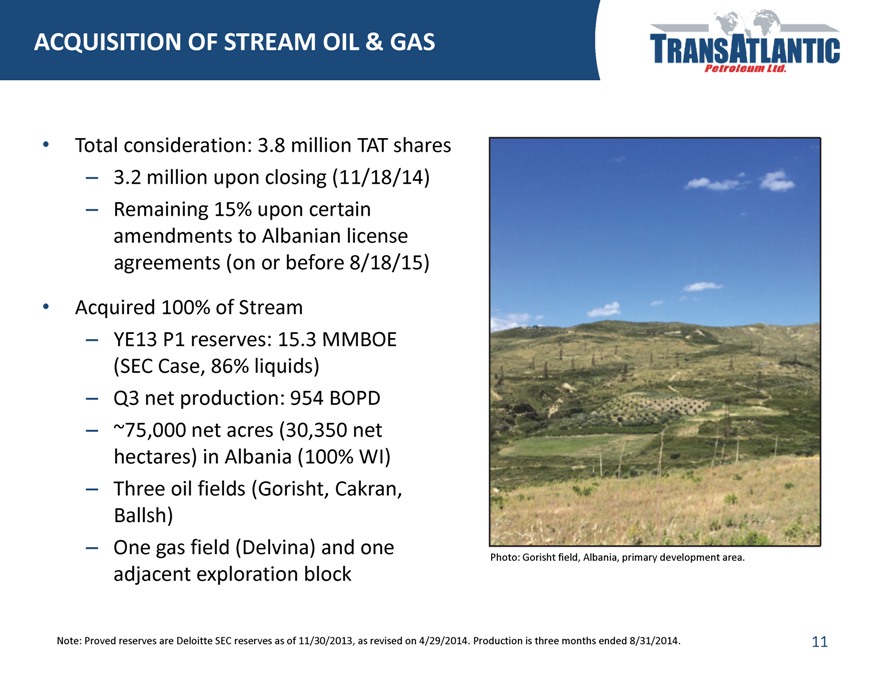
ACQUISITION OF STREAM OIL & GAS
Total consideration: 3.8 million TAT shares
– 3.2 million upon closing (11/18/14)
– Remaining 15% upon certain amendments to Albanian license agreements (on or before 8/18/15)
Acquired 100% of Stream
– YE13 P1 reserves: 15.3 MMBOE (SEC Case, 86% liquids)
– Q3 net production: 954 BOPD
– ~75,000 net acres (30,350 net hectares) in Albania (100% WI)
– Three oil fields (Gorisht, Cakran, Ballsh)
– One gas field (Delvina) and one adjacent exploration block
Photo: Gorisht field, Albania, primary development area.
Note: Proved reserves are Deloitte SEC reserves as of 11/30/2013, as revised on 4/29/2014. Production is three months ended 8/31/2014.
11
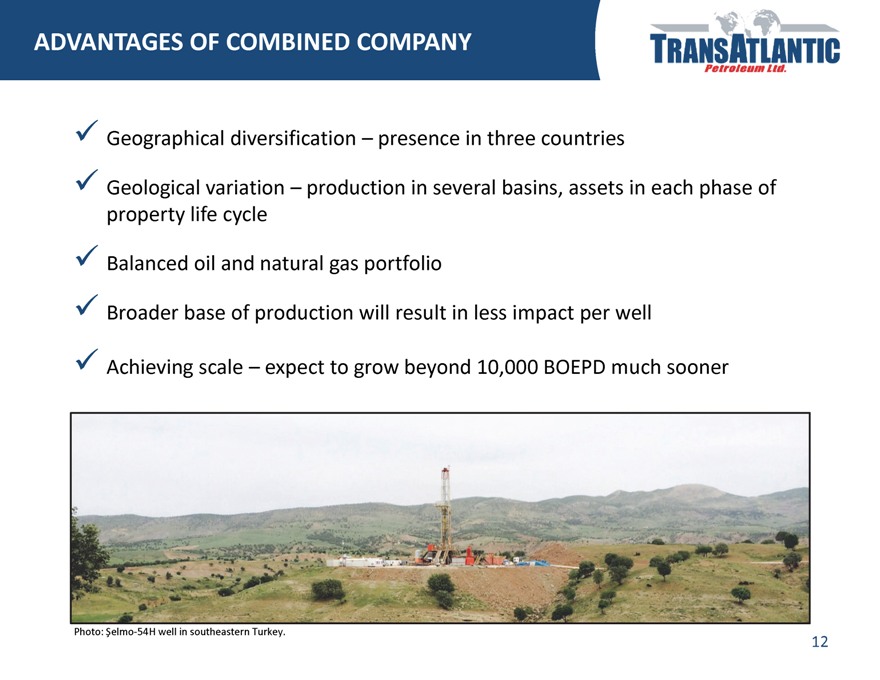
ADVANTAGES OF COMBINED COMPANY
?Geographical diversification – presence in three countries
?Geological variation – production in several basins, assets in each phase of property life cycle?Balanced oil and natural gas portfolio?Broader base of production will result in less impact per well?Achieving scale – expect to grow beyond 10,000 BOEPD much sooner
Photo: Şelmo?54H well in southeastern Turkey.
12
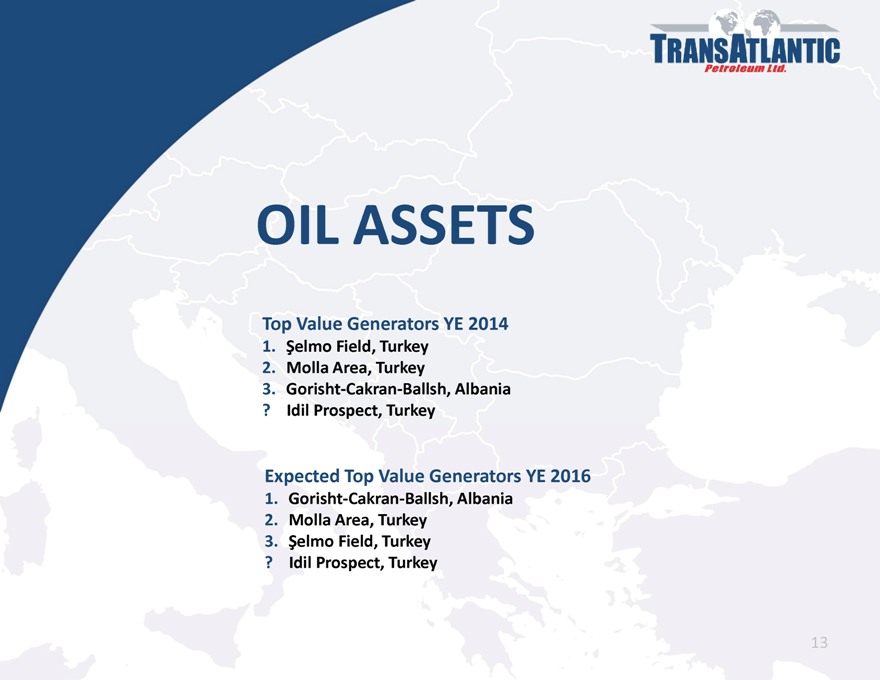
OIL ASSETS
Top Value Generators YE 2014
1. Şelmo Field, Turkey
2. Molla Area, Turkey
3. Gorisht-Cakran-Ballsh, Albania
? Idil Prospect, Turkey
Expected Top Value Generators YE 2016
1. Gorisht-Cakran-Ballsh, Albania
2. Molla Area, Turkey
3. Şelmo Field, Turkey
? Idil Prospect, Turkey
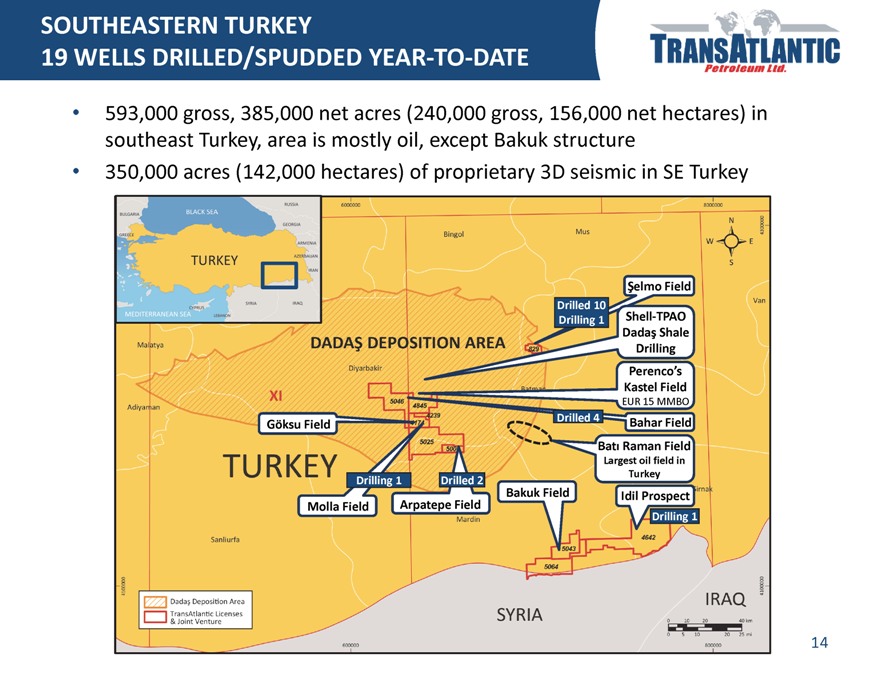
SOUTHEASTERN TURKEY
19 WELLS DRILLED/SPUDDED YEAR-TO-DATE
593,000 gross, 385,000 net acres (240,000 gross, 156,000 net hectares) in southeast Turkey, area is mostly oil, except Bakuk structure
350,000 acres (142,000 hectares) of proprietary 3D seismic in SE Turkey
Şelmo Field
Drilled 10
Drilling 1 Shell-TPAO
Dadaş Shale
Drilling
Perenco’s
Kastel Field
EUR 15 MMBO
Göksu Field Drilled 4 Bahar Field
Bat- Raman Field
Largest oil field in
Drilling 1 Drilled 2 Turkey
Bakuk Field Idil Prospect
Molla Field Arpatepe Field
Drilling 1
14
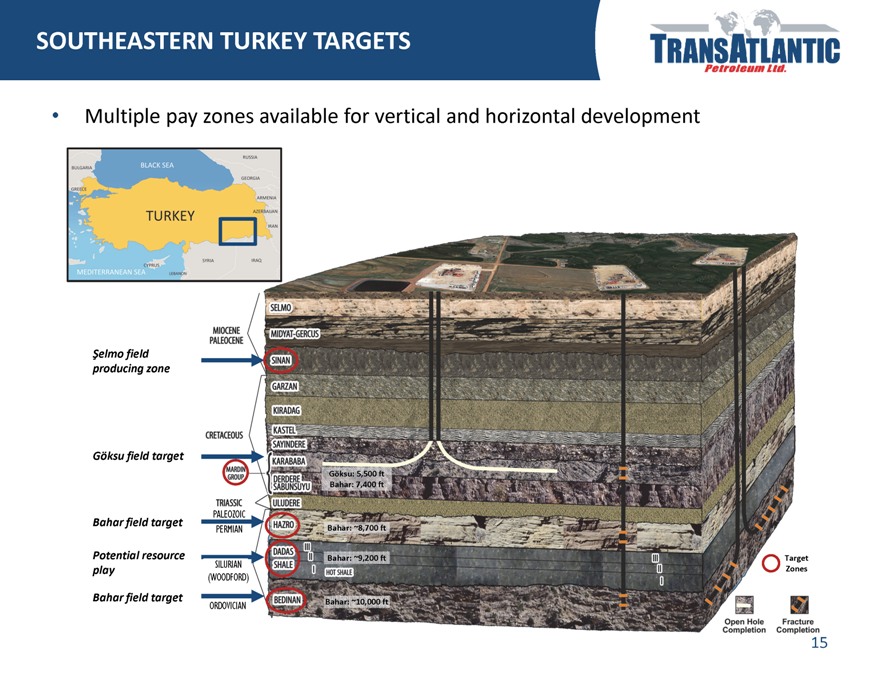
SOUTHEASTERN TURKEY TARGETS
Multiple pay zones available for vertical and horizontal development
Şelmo field
producing zone
Göksu field target
Göksu: 5,500 ft
Bahar: 7,400 ft
PALEOZOIC
Bahar field target PERMIAN Bahar: ~8,700 ft
Potential resource Bahar: ~9,200 ft Target
SILURIAN
play Zones
(WOODFORD)
Bahar field target
ORDOVICIAN Bahar: ~10,000 ft
15
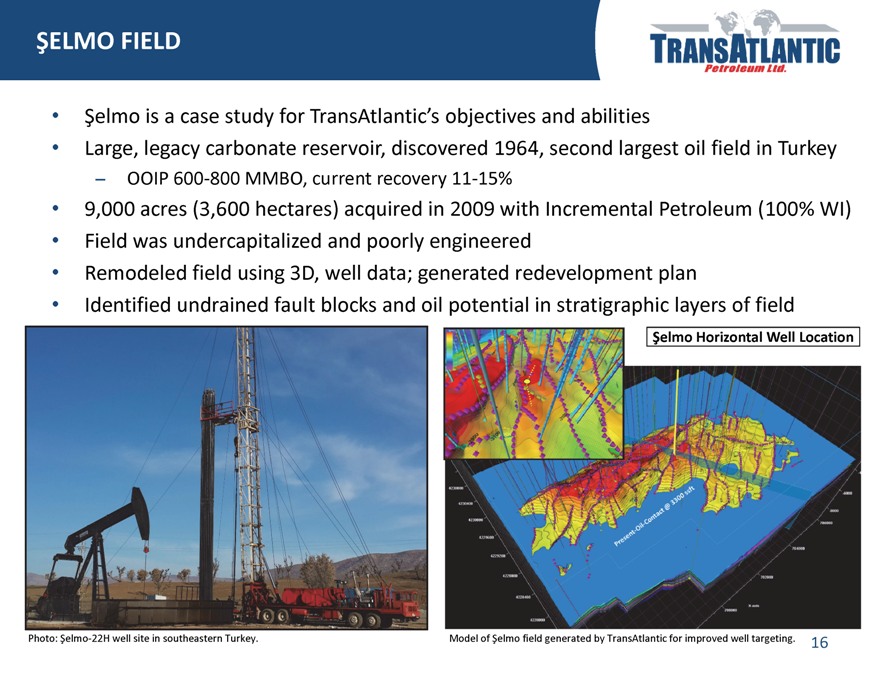
ŞELMO FIELD
Şelmo is a case study for TransAtlantic’s objectives and abilities
Large, legacy carbonate reservoir, discovered 1964, second largest oil field in Turkey
– OOIP 600-800 MMBO, current recovery 11-15%
9,000 acres (3,600 hectares) acquired in 2009 with Incremental Petroleum (100% WI)
Field was undercapitalized and poorly engineered
Remodeled field using 3D, well data; generated redevelopment plan
Identified undrained fault blocks and oil potential in stratigraphic layers of field
Şelmo Horizontal Well Location
Photo: Şelmo -22H well site in southeastern Turkey. Model of Şelmo field generated by TransAtlantic for improved well targeting.
16
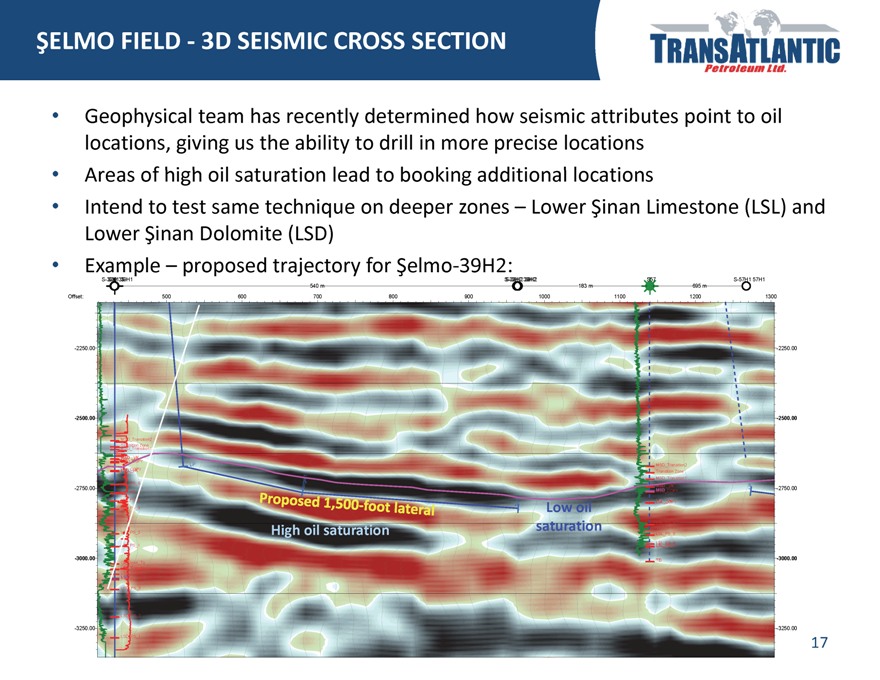
ŞELMO FIELD -3D
Geophysical team has recently determined how seismic attributes point to oil locations, giving us the ability to drill in more precise locations Areas of high oil saturation lead to booking additional locations Intend to test same technique on deeper zones – Lower Şinan Limestone (LSL) and Lower Şinan Dolomite (LSD) Example – proposed trajectory for Şelmo-39H2:
S- S39 H1 39 39H1 S S—39H H2 2 39H 39H2 S57 S-57H1 57H1
S- S39H13939H1 S-S-39H2H2 39H39H2 S57 S-57H1 57H1
540 m 183 m 695 m
Offset: 500 600 700 800 900 1000 1100 1200 1300
-2250.00 -2250.00
-2500.00 -2500.00
MSD_Transition2
Transition Zone
MSD_Transition1
MSD
MSD_COPY
LP MSD_Transition2
LSL LSL_COPY Transition Zone
1
t MSD_Transition1
e
LSL_PS_6 g
r P
-2750.00 a L -2750.00
LSL_PS_5 T MSD S _COPY
LSL_PS_4 O E LSL_COPYLSL
LSL_PS_3 T Low oil
saturation LSL_PS_6
LSL_PS_2 High oil saturation LSL_PS_5
LSL_PS_4
LSL_PS_1 LSL_PS_2 3
-3000.00 -3000.00
OWCil_Down_To
LSLSD_TransitionTr siti Zone
LSD_COPY
Garzan LSD
LSD_PS_3
LSD_PS_2
-3250.00 -3250.00
LSD_PS_1
17
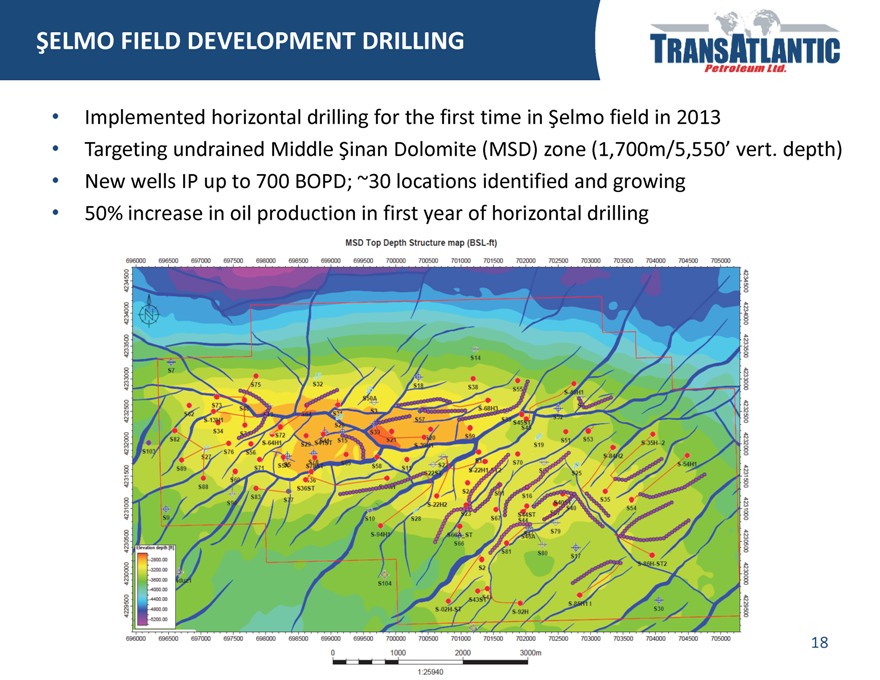
ŞELMO FIELD DEVELOPMENT DRILLING
Implemented horizontal drilling for the first time in Şelmo field in 2013
Targeting undrained Middle Şinan Dolomite (MSD) zone (1,700m/5,550’ vert. depth) New wells IP up to 700 BOPD; ~30 locations identified and growing 50% increase in oil production in first year of horizontal drilling
18
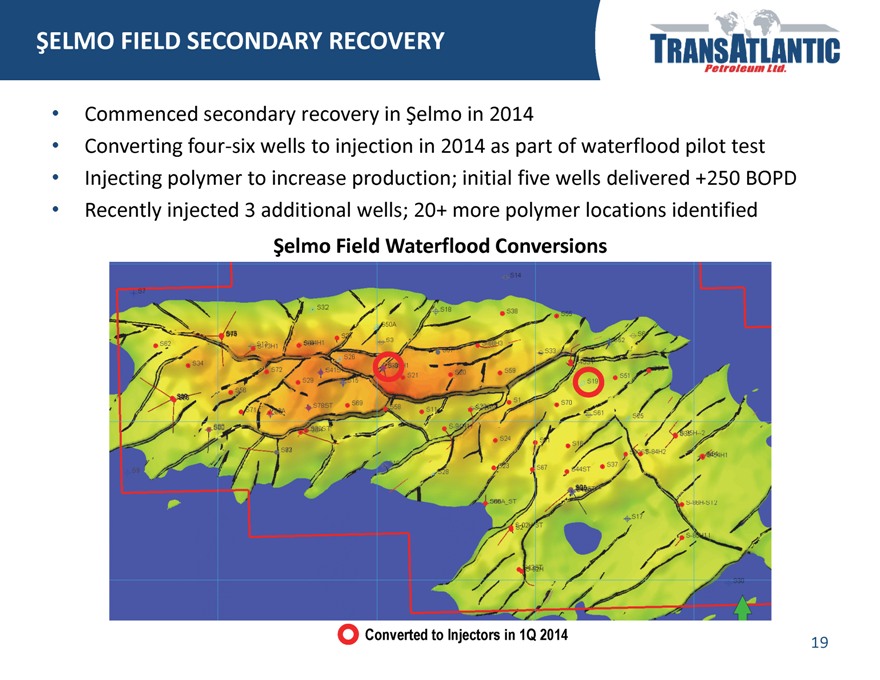
ŞELMO FIELD SECONDARY RECOVERY
Commenced secondary recovery in Şelmo in 2014
Converting four-six wells to injection in 2014 as part of waterflood pilot test Injecting polymer to increase production; initial five wells delivered +250 BOPD Recently injected 3 additional wells; 20+ more polymer locations identified
Şelmo Field Waterflood Conversions
Converted to Injectors in 1Q 2014
19
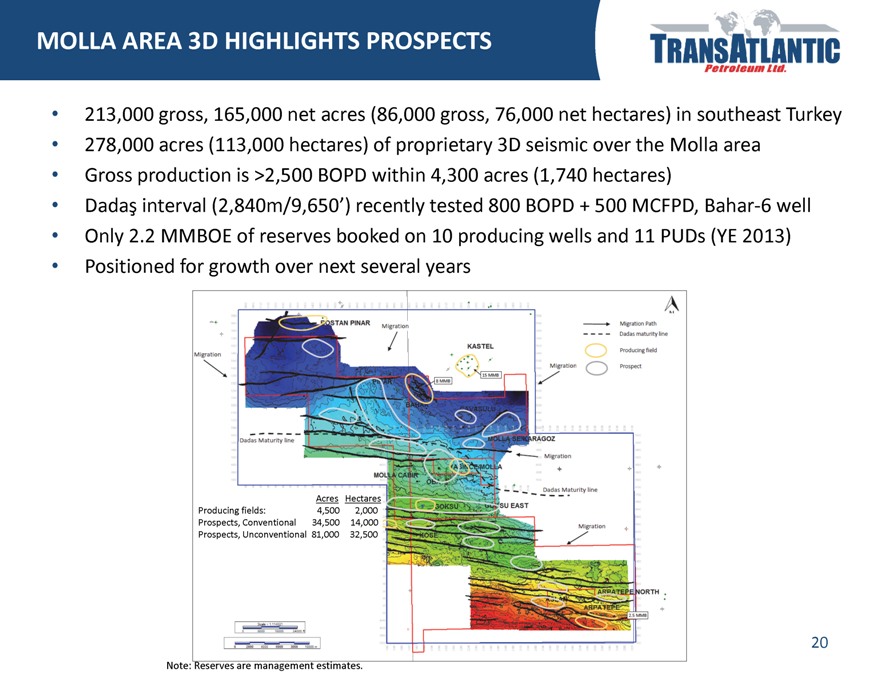
MOLLA AREA 3D HIGHLIGHTS PROSPECTS
213,000 gross, 165,000 net acres (86,000 gross, 76,000 net hectares) in southeast Turkey 278,000 acres (113,000 hectares) of proprietary 3D seismic over the Molla area Gross production is >2,500 BOPD within 4,300 acres (1,740 hectares) Dadaş interval (2,840m/9,650’) recently tested 800 BOPD + 500 MCFPD, Bahar-6 well Only 2.2 MMBOE of reserves booked on 10 producing wells and 11 PUDs (YE 2013) Positioned for growth over next several years
Acres Hectares
Producing fields: 4,500 2,000
Prospects, Conventional 34,500 14,000
Prospects, Unconventional 81,000 32,500
Note: Reserves are management estimates.
20
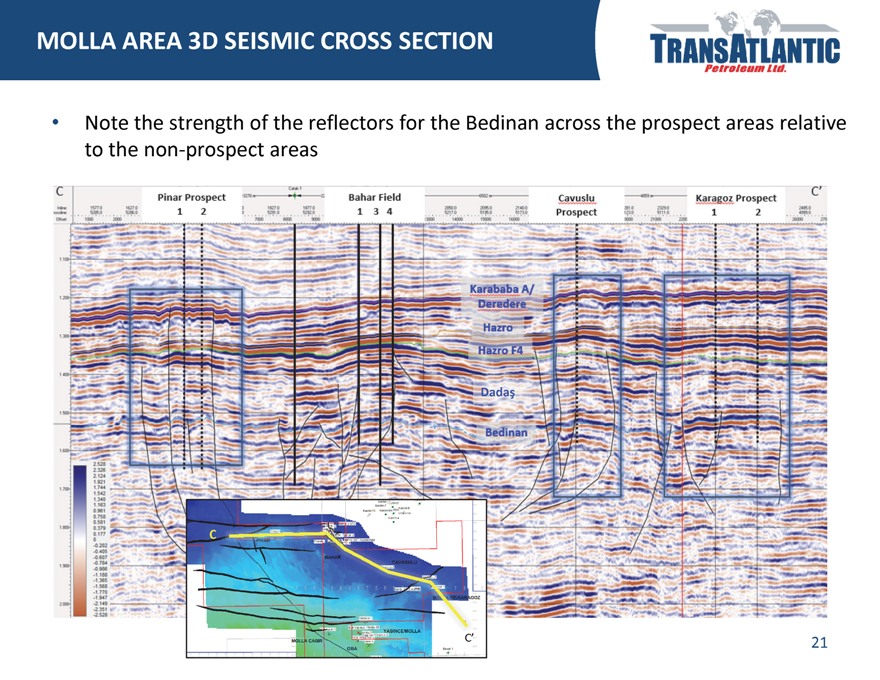
MOLLA AREA 3D SEISMIC CROSS SECTION
Note the strength of the reflectors for the Bedinan across the prospect areas relative to the non-prospect areas
Dadaş
C
C’ 21
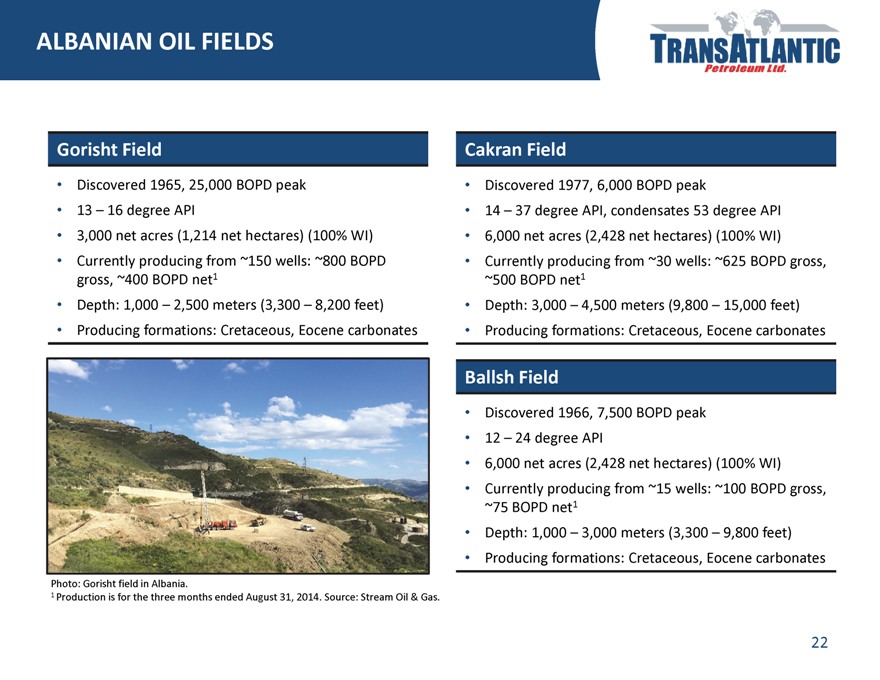
ALBANIAN OIL FIELDS
Gorisht Field Cakran Field
Discovered 1965, 25,000 BOPD peak Discovered 1977, 6,000 BOPD peak
13 – 16 degree API 14 – 37 degree API, condensates 53 degree API
3,000 net acres (1,214 net hectares) (100% WI) 6,000 net acres (2,428 net hectares) (100% WI)
Currently producing from ~150 wells: ~800 BOPD Currently producing from ~30 wells: ~625 BOPD gross,
gross, ~400 BOPD net1 ~500 BOPD net1
Depth: 1,000 – 2,500 meters (3,300 – 8,200 feet) Depth: 3,000 – 4,500 meters (9,800 – 15,000 feet)
Producing formations: Cretaceous, Eocene carbonates Producing formations: Cretaceous, Eocene carbonates
Ballsh Field
Discovered 1966, 7,500 BOPD peak
12 – 24 degree API
6,000 net acres (2,428 net hectares) (100% WI)
Currently producing from ~15 wells: ~100 BOPD gross,
~75 BOPD net1
Depth: 1,000 – 3,000 meters (3,300 – 9,800 feet)
Producing formations: Cretaceous, Eocene carbonates
Photo: Gorisht field in Albania.
1 Production is for the three months ended August 31, 2014. Source: Stream Oil & Gas.
22
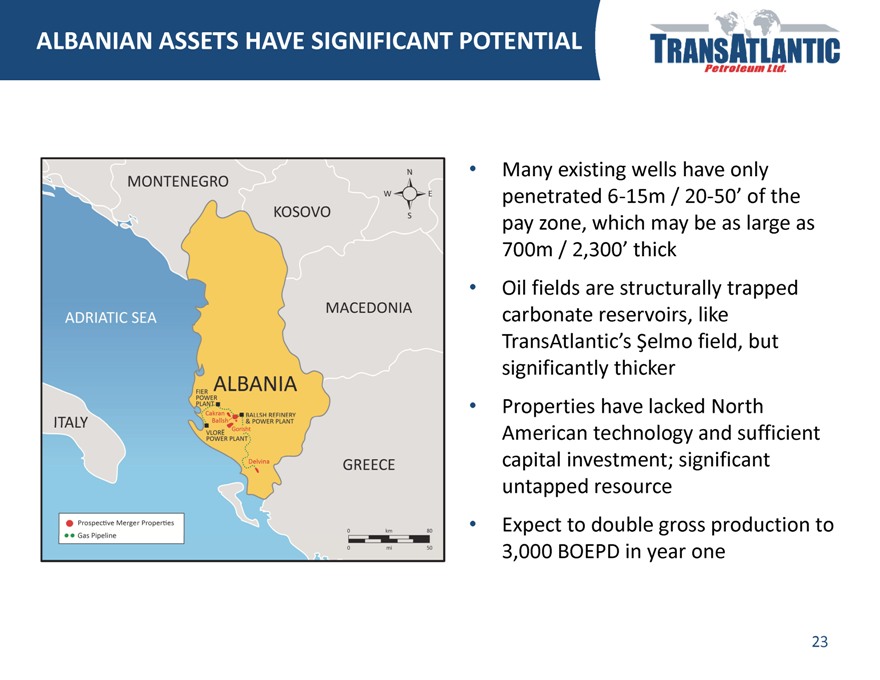
ALBANIAN ASSETS HAVE SIGNIFICANT POTENTIAL
Many existing wells have only
penetrated 6 15m / 20 50’ of the
pay zone, which may be as large as
700m / 2,300’ thick
Oil fields are structurally trapped
carbonate reservoirs, like
TransAtlantic’s Şelmo field, but
significantly thicker
Properties have lacked North
American technology and sufficient
capital investment; significant
untapped resource
Expect to double gross production to
3,000 BOEPD in year one
23
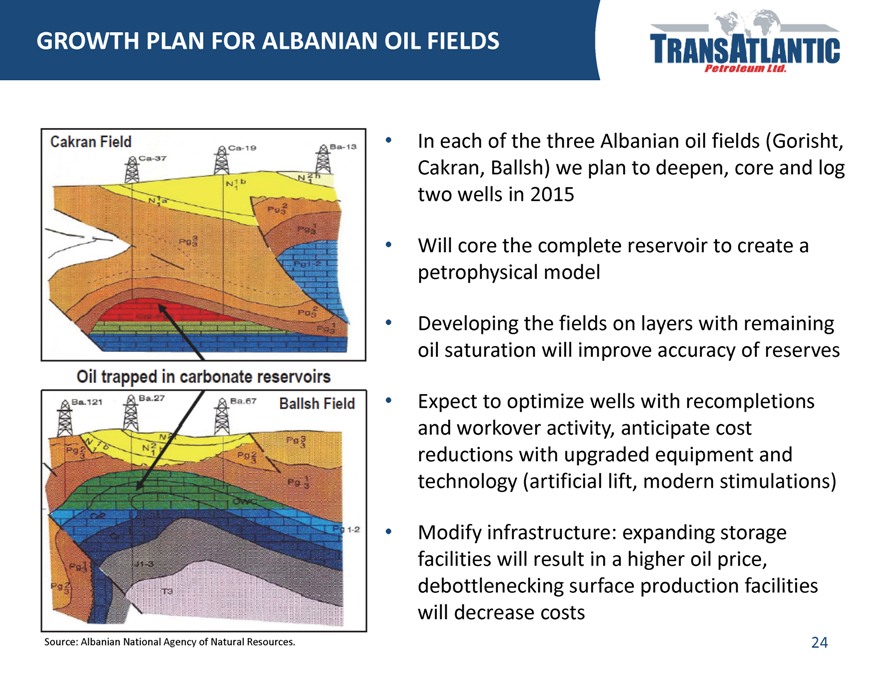
GROWTH PLAN FOR ALBANIAN OIL FIELDS
• In each of the three Albanian oil fields (Gorisht,
Cakran, Ballsh) we plan to deepen, core and log
two wells in 2015
• Will core the complete reservoir to create a
petrophysical model
• Developing the fields on layers with remaining
oil saturation will improve accuracy of reserves
• Expect to optimize wells with recompletions
and workover activity, anticipate cost
reductions with upgraded equipment and
technology (artificial lift, modern stimulations)
• Modify infrastructure: expanding storage
facilities will result in a higher oil price,
debottlenecking surface production facilities
will decrease costs
Source: Albanian National Agency of Natural Resources.
24
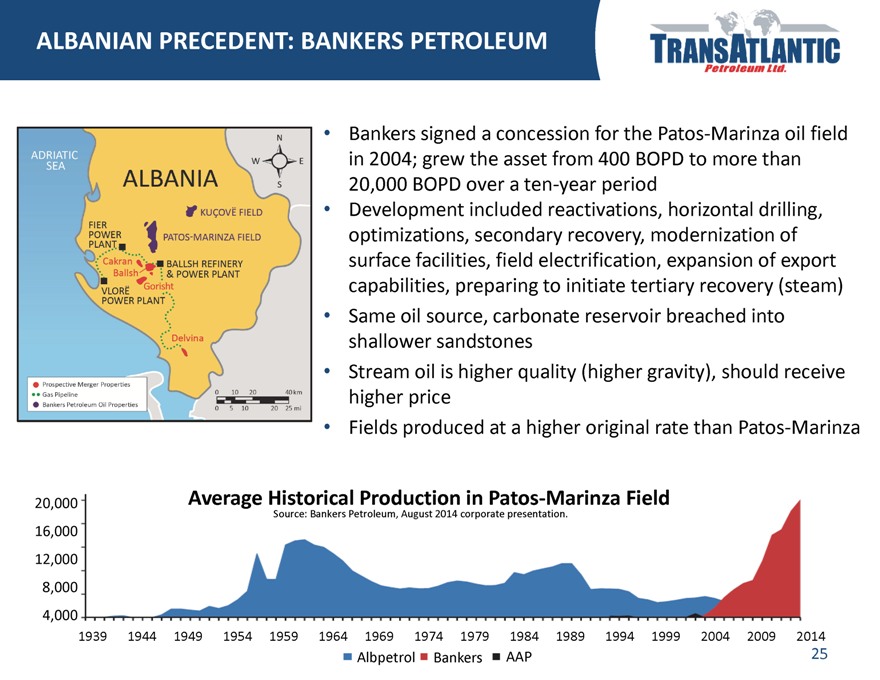
ALBANIAN PRECEDENT: BANKERS PETROLEUM
Bankers signed a concession for the Patos Marinza oil field
in 2004; grew the asset from 400 BOPD to more than
20,000 BOPD over a ten year period
Development included reactivations, horizontal drilling,
optimizations, secondary recovery, modernization of
surface facilities, field electrification, expansion of export
capabilities, preparing to initiate tertiary recovery (steam)
Same oil source, carbonate reservoir breached into
shallower sandstones
Stream oil is higher quality (higher gravity), should receive
higher price
Fields produced at a higher original rate than Patos Marinza
20,000 Average Historical Production in Patos Marinza Field
Source: Bankers Petroleum, August 2014 corporate presentation.
16,000
12,000
8,000
4,000
1939 1944 1949 1954 1959 1964 1969 1974 1979 1984 1989 1994 1999 2004 2009 2014
Albpetrol Bankers AAP
25
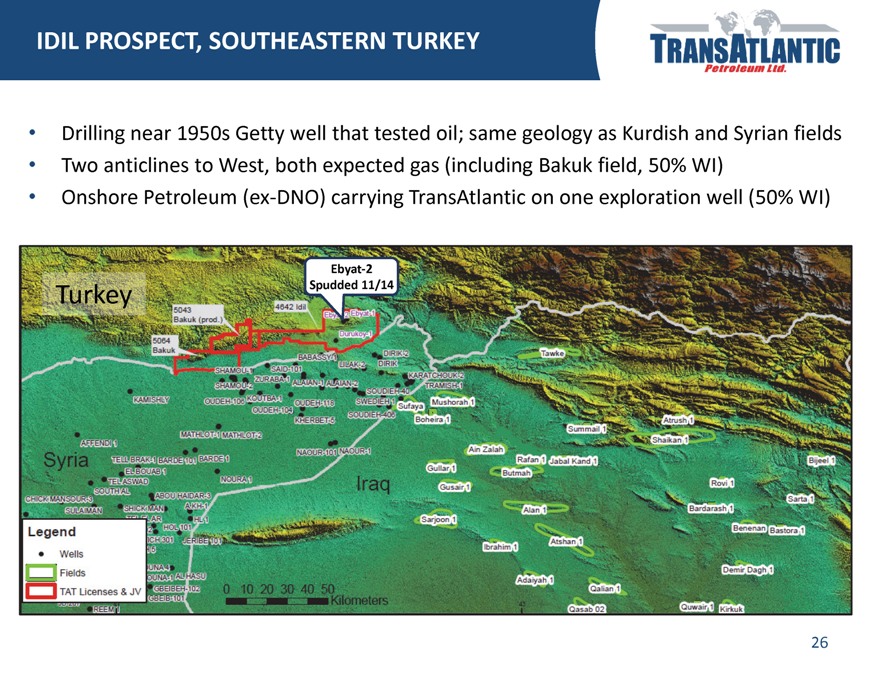
IDIL PROSPECT, SOUTHEASTERN TURKEY
Drilling near 1950s Getty well that tested oil; same geology as Kurdish and Syrian fields Two anticlines to West, both expected gas (including Bakuk field, 50% WI) Onshore Petroleum (ex DNO) carrying TransAtlantic on one exploration well (50% WI)
Ebyat 2
Turkey Spudded 11/14
26
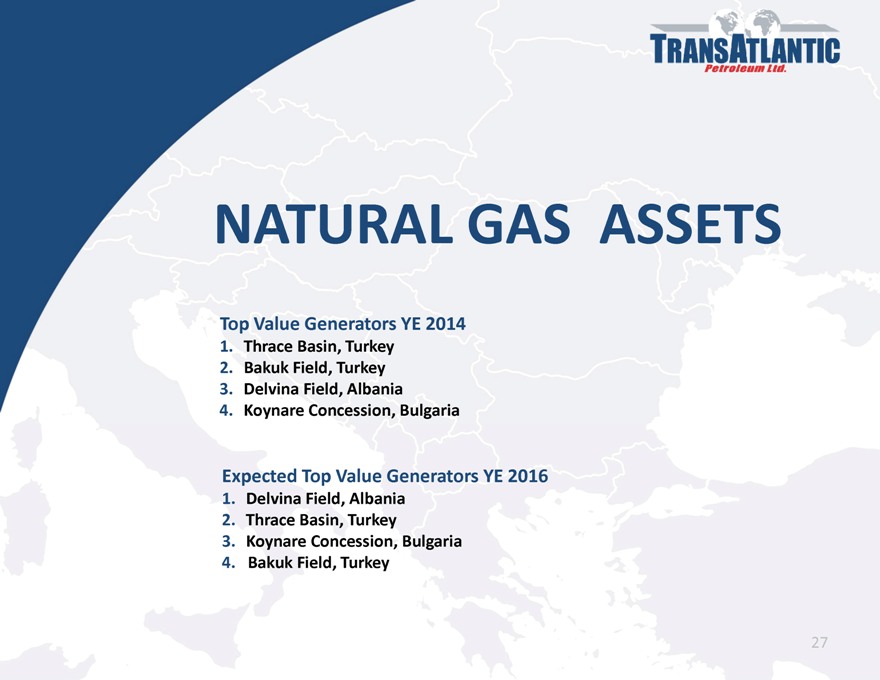
NATURAL GAS ASSETS
Top Value Generators YE 2014
1. Thrace Basin, Turkey
2. Bakuk Field, Turkey
3. Delvina Field, Albania
4. Koynare Concession, Bulgaria
Expected Top Value Generators YE 2016
1. Delvina Field, Albania
2. Thrace Basin, Turkey
3. Koynare Concession, Bulgaria
4. Bakuk Field, Turkey
27
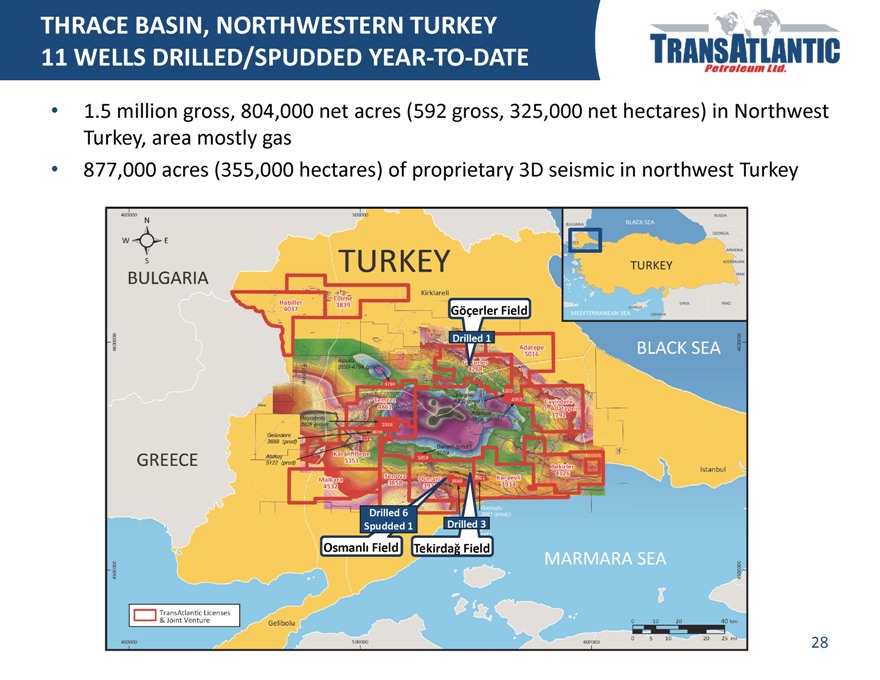
THRACE BASIN, NORTHWESTERN TURKEY
11 WELLS DRILLED/SPUDDED YEAR TO DATE
1.5 million gross, 804,000 net acres (592 gross, 325,000 net hectares) in Northwest Turkey, area mostly gas
877,000 acres (355,000 hectares) of proprietary 3D seismic in northwest Turkey
Göçerler Field
Drilled 1
Drilled 6
Spudded 1 Drilled 3
Osmanl Field Tekirdağ Field
28
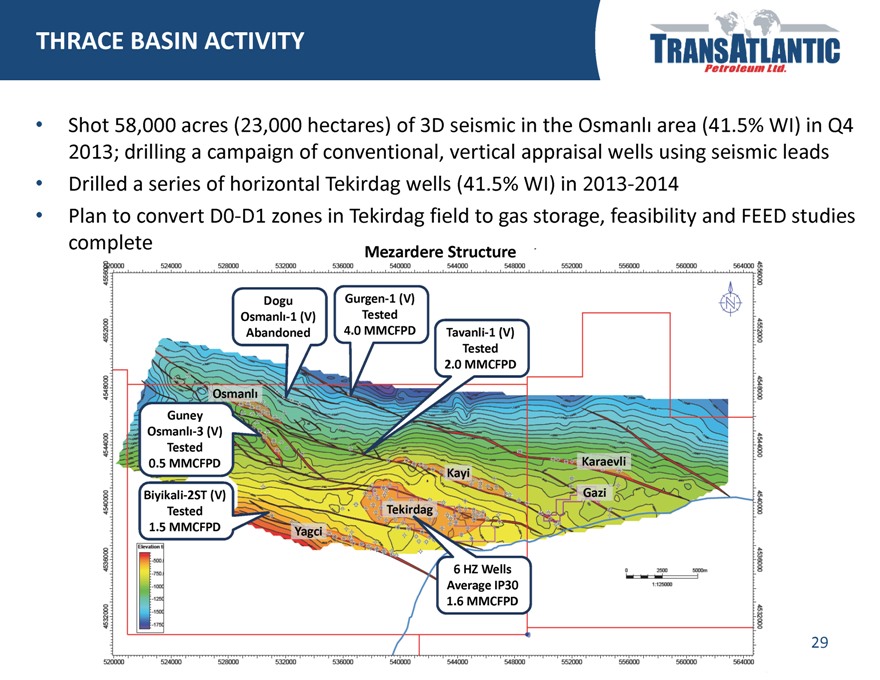
THRACE BASIN ACTIVITY
Shot 58,000 acres (23,000 hectares) of 3D seismic in the Osmanl area (41.5% WI) in Q4 2013; drilling a campaign of conventional, vertical appraisal wells using seismic leads
Drilled a series of horizontal Tekirdag wells (41.5% WI) in 2013 2014
Plan to convert D0 D1 zones in Tekirdag field to gas storage, feasibility and FEED studies complete
complete Mezardere Structure
Dogu Gurgen 1 (V)
Osmanl 1 (V) Tested
Abandoned 4.0 MMCFPD Tavanli 1 (V)
Tested
2.0 MMCFPD
Osmanl
Guney
Osmanl 3 (V)
Tested
0.5 MMCFPD Karaevli
Kayi
Biyikali 2ST (V) Gazi
Tested Tekirdag
1.5 MMCFPD Yagci
6 HZ Wells
Average IP30
1.6 MMCFPD
29
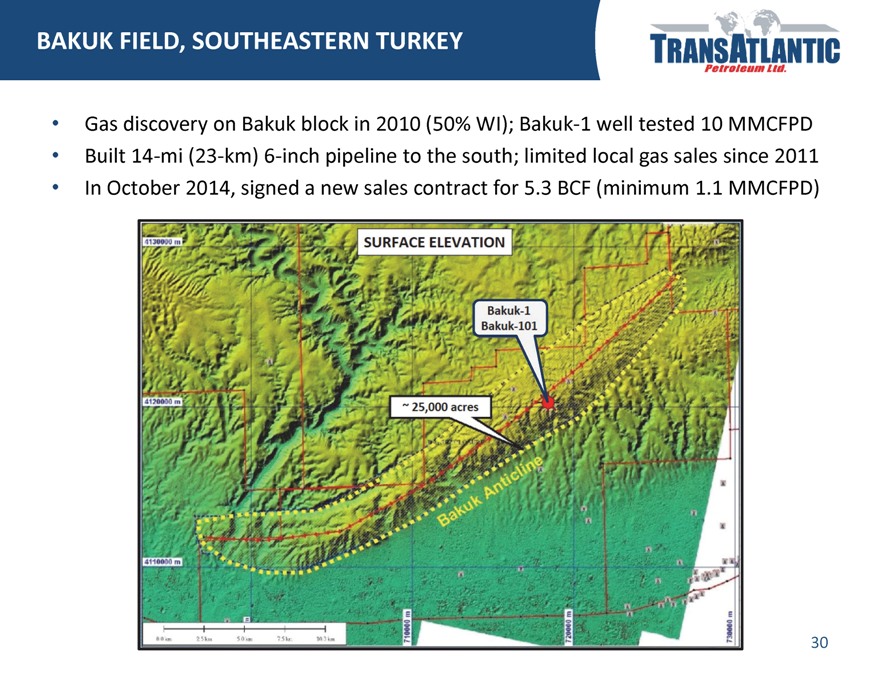
BAKUK FIELD, SOUTHEASTERN TURKEY
Gas discovery on Bakuk block in 2010 (50% WI); Bakuk 1 well tested 10 MMCFPD
Built 14 mi (23 km) 6 inch pipeline to the south; limited local gas sales since 2011
In October 2014, signed a new sales contract for 5.3 BCF (minimum 1.1 MMCFPD)
30
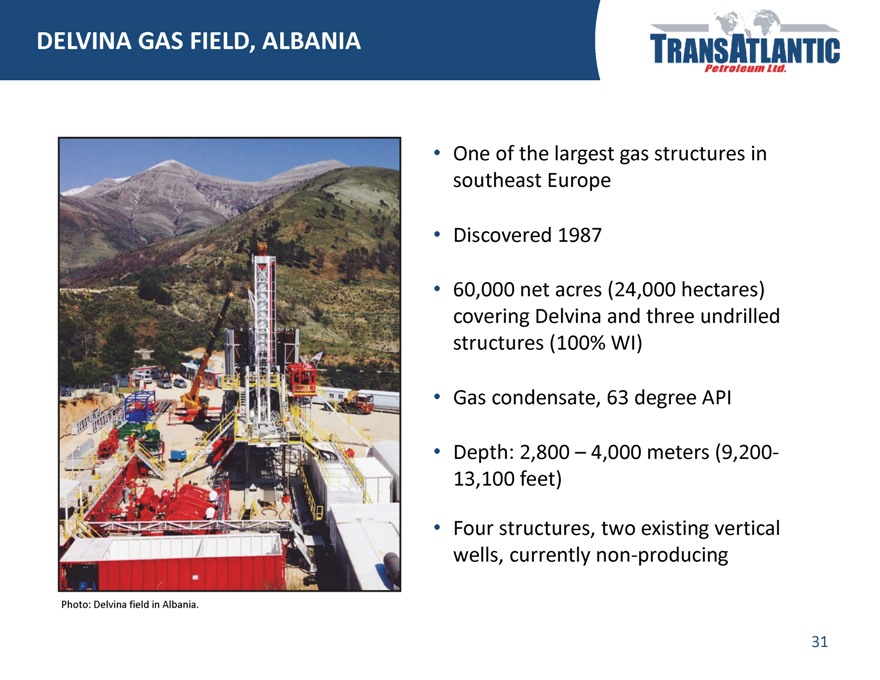
DELVINA GAS FIELD, ALBANIA
One of the largest gas structures in southeast Europe
Discovered 1987
60,000 net acres (24,000 hectares) covering Delvina and three undrilled structures (100% WI)
Gas condensate, 63 degree API
Depth: 2,800 – 4,000 meters (9,200 13,100 feet)
Four structures, two existing vertical wells, currently non producing
31
DELVINA FIELD GROWTH PLAN
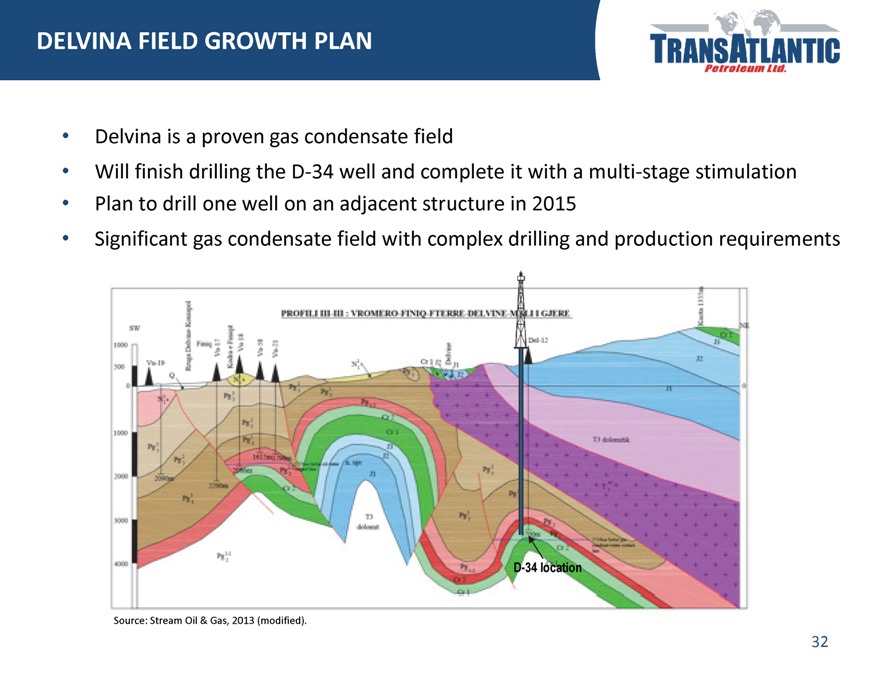
Delvina is a proven gas condensate field
Will finish drilling the D?34 well and complete it with a multi?stage stimulation
Plan to drill one well on an adjacent structure in 2015
Significant gas condensate field with complex drilling and production requirements
D-34 location
Source: Stream Oil & Gas, 2013 (modified).
32
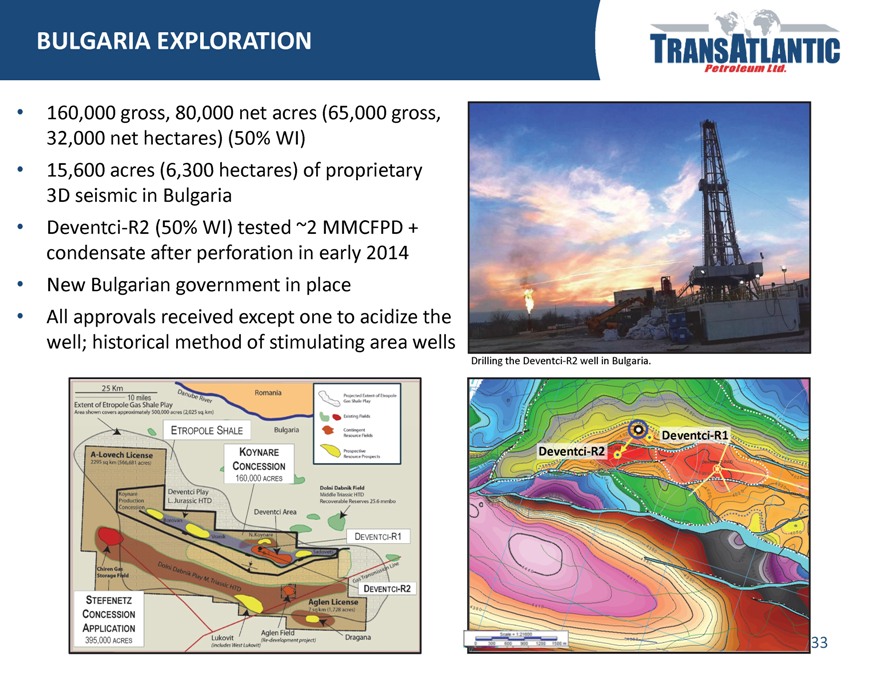
BULGARIA EXPLORATION
160,000 gross, 80,000 net acres (65,000 gross,
32,000 net hectares) (50% WI)
15,600 acres (6,300 hectares) of proprietary
3D seismic in Bulgaria
Deventci R2 (50% WI) tested ~2 MMCFPD +
condensate after perforation in early 2014
New Bulgarian government in place
All approvals received except one to acidize the
well; historical method of stimulating area wells
Drilling the Deventci R2 well in Bulgaria.
Deventci R1
Deventci R2
33
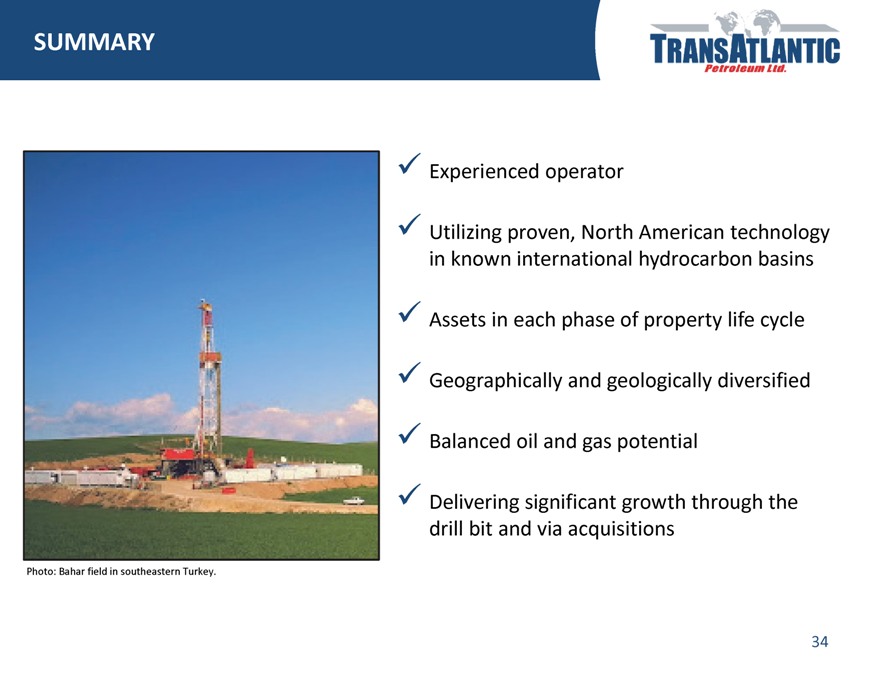
SUMMARY
Experienced operator
Utilizing proven, North American technology in known international hydrocarbon basins
Assets in each phase of property life cycle Geographically and geologically diversified Balanced oil and gas potential Delivering significant growth through the drill bit and via acquisitions
Photo: Bahar field in southeastern Turkey.
34
CONTACT
Taylor Beach
Director of Investor Relations (214) 265 4746 Taylor.Beach@tapcor.com
www.TransAtlanticPetroleum.com
35
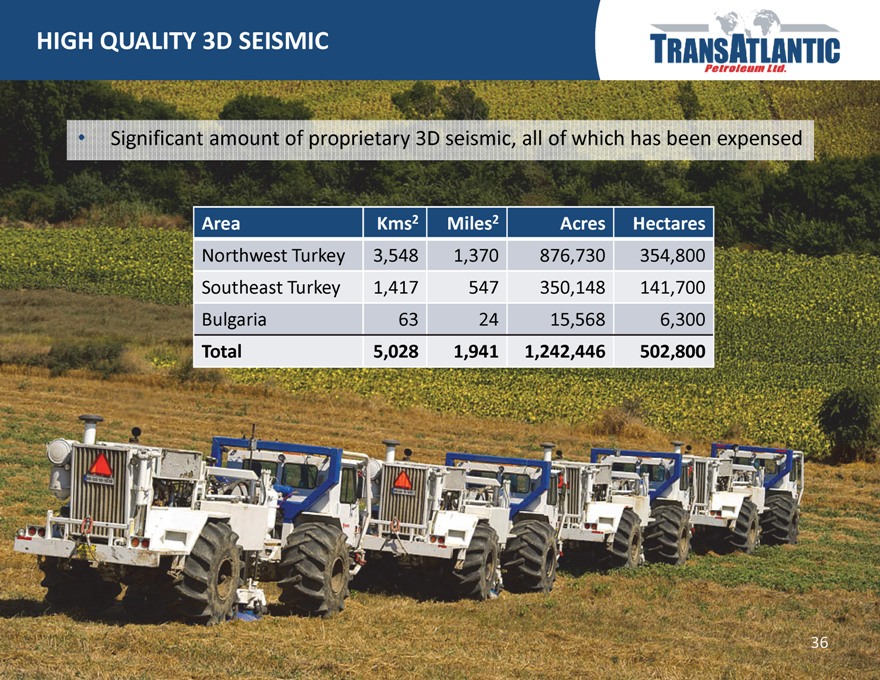
HIGH QUALITY 3D SEISMIC
Significant amount of proprietary 3D seismic, all of which has been expensed
Area Kms2 Miles2 Acres Hectares
Northwest Turkey 3,548 1,370 876,730 354,800
Southeast Turkey 1,417 547 350,148 141,700
Bulgaria 63 24 15,568 6,300
Total 5,028 1,941 1,242,446 502,800
36
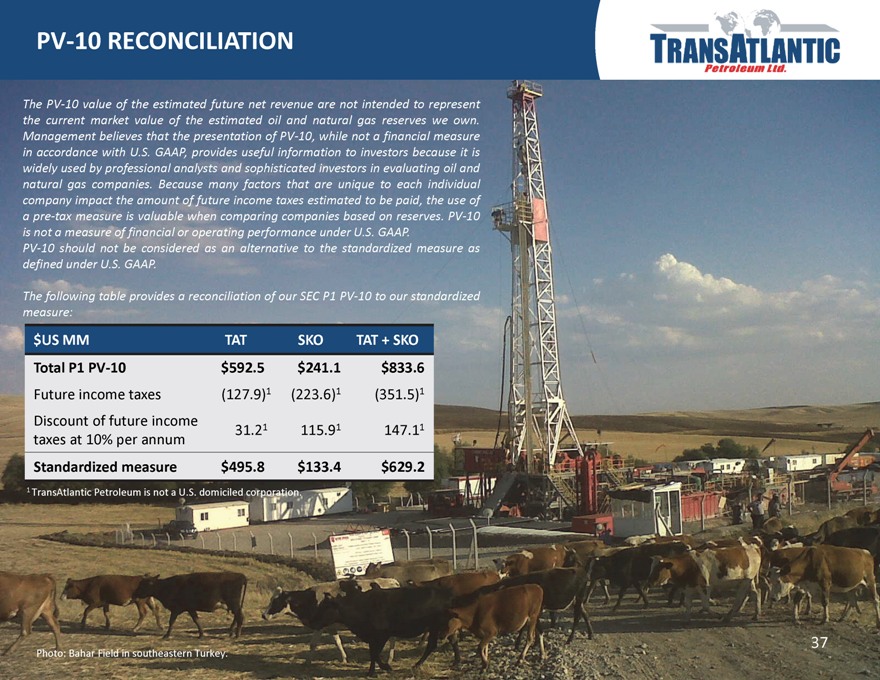
PV 10 RECONCILIATION
The PV 10 value of the estimated future net revenue are not intended to represent the current market value of the estimated oil and natural gas reserves we own. Management believes that the presentation of PV 10, while not a financial measure in accordance with U.S. GAAP, provides useful information to investors because it is widely used by professional analysts and sophisticated investors in evaluating oil and natural gas companies. Because many factors that are unique to each individual company impact the amount of future income taxes estimated to be paid, the use of apre tax measure is valuable when comparing companies based on reserves. PV 10 is not a measure of financial or operating performance under U.S. GAAP.
PV 10 should not be considered as an alternative to the standardized measure as defined under U.S. GAAP.
The following table provides a reconciliation of our SEC P1 PV 10 to our standardized measure:
$US MM TAT SKO TAT + SKO
Total P1 PV 10 $592.5 $241.1 $833.6
Future income taxes (127.9)1 (223.6)1 (351.5)1
Discount of future income 31.21 115.91 147.11
taxes at 10% per annum
Standardized measure $495.8 $133.4 $629.2
1 TransAtlantic Petroleum is not a U.S. domiciled corporation.
Photo: Bahar Field in southeastern Turkey.
37