Exhibit 99.2
|
YEAR-END 2014 RESERVES
February 2015
|
FORWARD LOOKING STATEMENTS
Outlooks, projections, estimates, targets and business plans in this presentation or any related subsequent discussions are forward-looking statements. Actual future results, including TransAtlantic Petroleum Ltd.’s own production growth and mix; financial results; the amount and mix of capital expenditures; resource additions and recoveries; finding and development costs; project and drilling plans, timing, costs, and capacities; revenue enhancements and cost efficiencies; industry margins; margin enhancements and integration benefits; and the impact of technology could differ materially due to a number of factors. These includemarket prices for natural gas, natural gas liquidsand oil products; estimates of reserves and economic assumptions; the ability to produce and transport natural gas, natural gas liquids and oil; the results of exploration and development drilling and related activities; economic conditions in the countries and provinces in which we carry on business, especially economic slowdowns; actions by governmental authorities, receipt of required approvals, increases in taxes, legislative and regulatory initiatives relating to fracture stimulation activities, changes in environmental and other regulations, and renegotiations of contracts; political uncertainty, including actions by insurgent groups or other conflict; the negotiation and closing of material contracts; shortages of drilling rigs, equipment or oilfield services; and other factors discussed here and under the heading “Risk Factors” in our Annual Report on Form 10-K for the year ended December 31, 2013, which is available on our website at www.transatlanticpetroleum.com and on www.sec.gov. See also TransAtlantic’s audited financial statements and the accompanying management discussion and analysis. Forward-looking statements are based on management’s knowledge and reasonable expectations on the date hereof, and we assume no duty to update these statements as of any future date.
The information set forth in this presentation does not constitute an offer, solicitation or recommendation to sell or an offer to buy any securities of the Company. The information published herein is provided for informational purposes only. The Company makes no representation that the information and opinions expressed herein are accurate, complete or current. The information contained herein is current as of the date hereof, but may become outdated or subsequently may change. Nothing contained herein constitutes financial, legal, tax, or other advice.
The SEC has generally permitted oil and gas companies, in their filings with the SEC, to disclose only proved reserves that a company has demonstrated by actual production or conclusive formation tests to be economically and legally producible under existing economic and operating conditions. We may use the terms “estimated ultimate recovery,” “EUR,” “probable,” “possible,” and “non-proven” reserves, “prospective resources” or “upside” or other descriptions of volumes of resources or reserves potentially recoverable through additional drilling or recovery techniques that the SEC’s guidelines may prohibit us from including in filings with the SEC. These estimates are by their nature more speculative than estimates of proved reserves and accordingly are subject to substantially greater risk of actually being realized by the Company. There is no certainty that any portion of estimated prospective resources will be discovered. If discovered, there is no certainty that it will be commercially viable to produce any portion ofthe estimated prospective resources.
Note on Possible Reserves: possible reserves are those additional reserves that are less certain to be recovered than probably reserves. There is a 10% probability that the quantities actually recovered will equal or exceed the sum of proved plus probable plus possible reserves.
Note on BOE: BOE (barrel of oil equivalent) is derived by converting natural gas to oil in the ratio of six thousand cubic feet (MCF) of natural gas to one barrel (bbl) of oil. BOE may be misleading, particularly if used in isolation. A BOE conversion ratio of 6 Mcf:1 bbl is based on an energy equivalency conversion method primarily applicable at the burner tip and does not represent a value equivalency at the wellhead.
Cover Photo: Ebyat-2 well on the Idil license in southeastern Turkey.
2 |
|
|
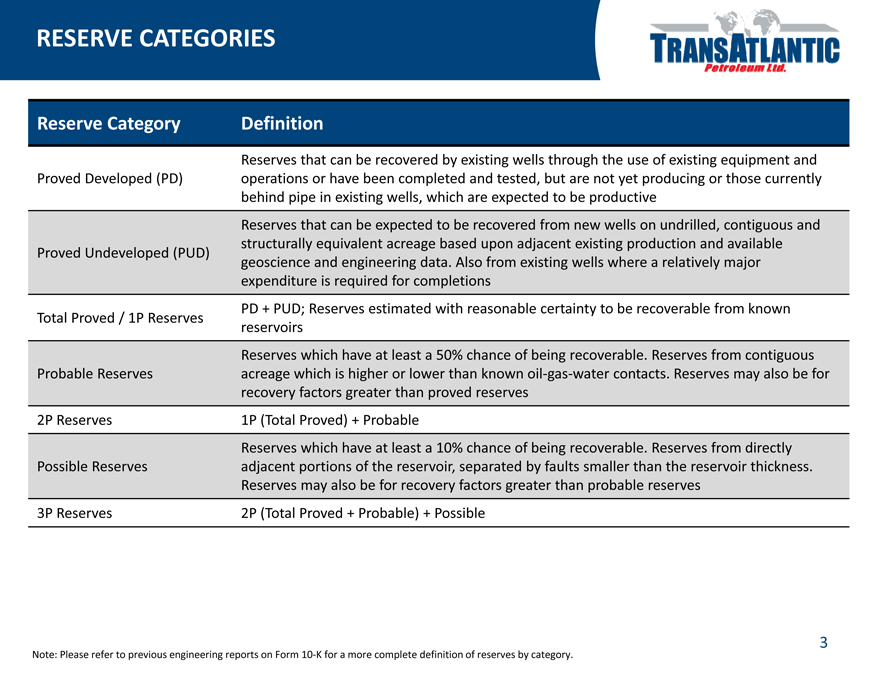
RESERVE CATEGORIES
Reserve Category Definition
Reserves that can be recovered by existing wells through the use of existing equipment and
Proved Developed (PD) operations or have been completed and tested, but are not yet producing or those currently
behind pipe in existing wells, which are expected to be productive
Reserves that can be expected to be recovered from new wells on undrilled, contiguous and
structurally equivalent acreage based upon adjacent existing production and available
Proved Undeveloped (PUD)
geoscience and engineering data. Also from existing wells where a relatively major
expenditure is required for completions
PD + PUD; Reserves estimated with reasonable certainty to be recoverable from known
Total Proved / 1P Reserves
reservoirs
Reserves which have at least a 50% chance of being recoverable. Reserves from contiguous
Probable Reserves acreage which is higher or lower than known oil-gas-water contacts. Reserves may also be for
recovery factors greater than proved reserves
2P Reserves 1P (Total Proved) + Probable
Reserves which have at least a 10% chance of being recoverable. Reserves from directly
Possible Reserves adjacent portions of the reservoir, separated by faults smaller than the reservoir thickness.
Reserves may also be for recovery factors greater than probable reserves
3P Reserves 2P (Total Proved + Probable) + Possible
Note: Please refer to previous engineering reports on Form 10-K for a more complete definition of reserves by category.
3 |
|
|
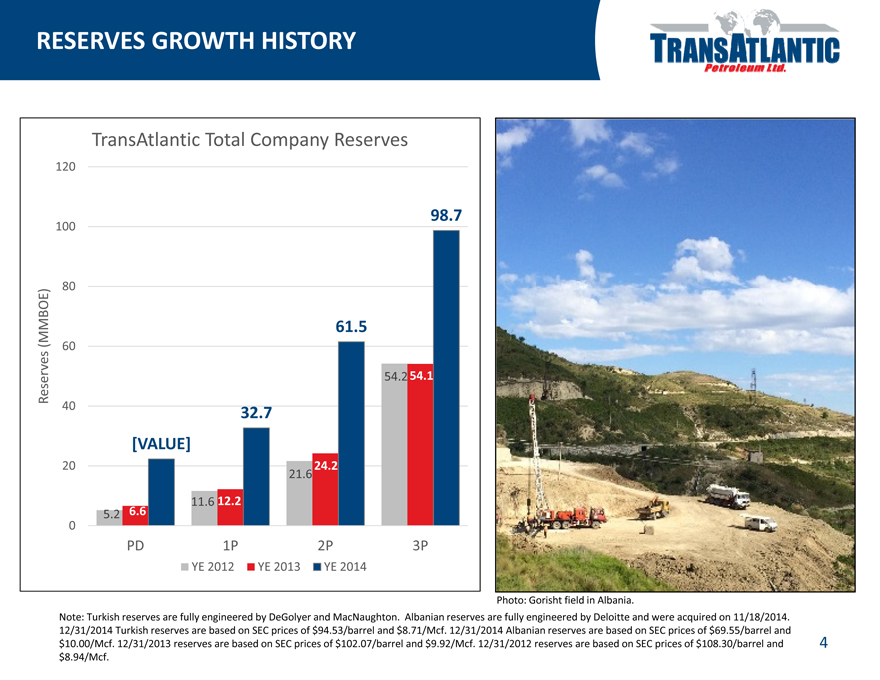
RESERVES GROWTH HISTORY
TransAtlantic Total Company Reserves
120
100 98.7
80
MMBOE) 61.5
( 60
Reserves 54.2 54.1
40 32.7 [VALUE]
20 24.2
21.6
6.6 11.6 12.2
5.2 0
PD 1P 2P 3P
YE 2012 YE 2013 YE 2014
Photo: Gorisht field in Albania.
Note: Turkish reserves are fully engineered by DeGolyer and MacNaughton. Albanian reserves are fully engineered by Deloitte and were acquired on 11/18/2014. 12/31/2014 Turkish reserves are based on SEC prices of $94.53/barrel and $8.71/Mcf. 12/31/2014 Albanian reserves are based on SEC prices of $69.55/barrel and
$10.00/Mcf. 12/31/2013 reserves are based on SEC prices of $102.07/barrel and $9.92/Mcf. 12/31/2012 reserves are based on SEC prices of $108.30/barrel and $8.94/Mcf.
4 |
|
|
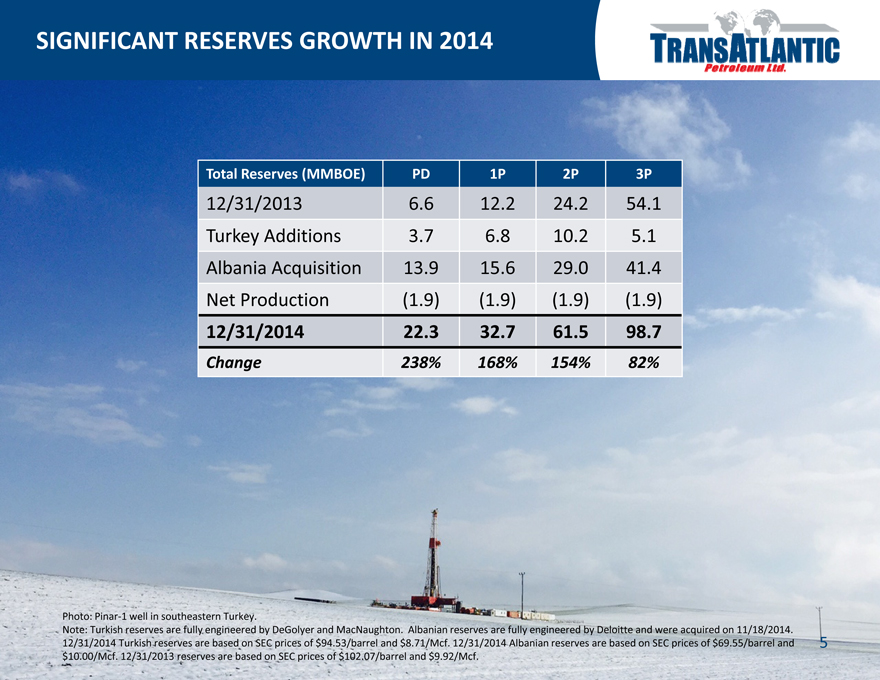
SIGNIFICANT RESERVES GROWTH IN 2014
Total Reserves (MMBOE) PD 1P 2P 3P
12/31/2013 6.6 12.2 24.2 54.1
Turkey Additions 3.7 6.8 10.2 5.1
Albania Acquisition 13.9 15.6 29.0 41.4
Net Production (1.9) (1.9) (1.9) (1.9)
12/31/2014 22.3 32.7 61.5 98.7
Change 238% 168% 154% 82%
Photo: Pinar-1 well in southeastern Turkey.
Note: Turkish reserves are fully engineered by DeGolyer and MacNaughton. Albanian reserves are fully engineered by Deloitte and were acquired on 11/18/2014. 12/31/2014 Turkish reserves are based on SEC prices of $94.53/barrel and $8.71/Mcf. 12/31/2014 Albanian reserves are based on SEC prices of $69.55/barrel and $10.00/Mcf. 12/31/2013 reserves are based on SEC prices of $102.07/barrel and $9.92/Mcf.
5 |
|
|
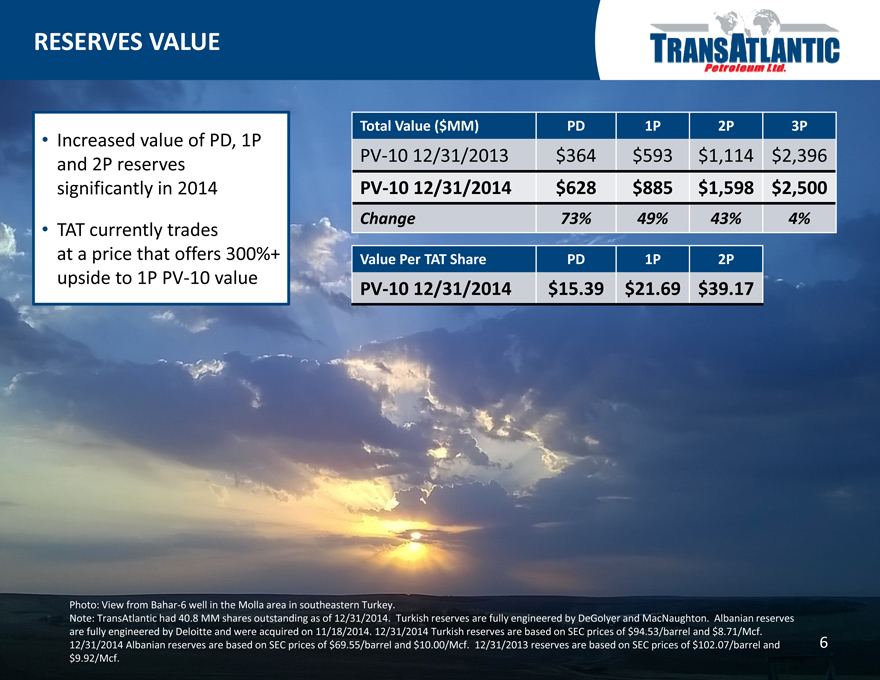
RESERVES VALUE
Total Value ($MM) PD 1P 2P 3P
• |
| Increased value of PD, 1P |
and 2P reserves PV-10 12/31/2013 $364 $593 $1,114 $ 2,396
significantly in 2014 PV-10 12/31/2014 $628 $885 $ 1,598 $ 2,500
• |
| TAT currently trades Change 73% 49% 43% 4% |
at a price that offers 300%+ Value Per TAT Share PD 1P 2P
upside to 1P PV-10 value PV-10 12/31/2014 $15.39 $21.69 $ 39.17
Photo: View from Bahar-6 well in the Molla area in southeastern Turkey.
Note: TransAtlantic had 40.8 MM shares outstanding as of 12/31/2014. Turkish reserves are fully engineered by DeGolyer and MacNaughton. Albanian reserves are fully engineered by Deloitte and were acquired on 11/18/2014. 12/31/2014 Turkish reserves are based on SEC prices of $94.53/barrel and $8.71/Mcf. 12/31/2014 Albanian reserves are based on SEC prices of $69.55/barrel and $10.00/Mcf. 12/31/2013 reserves are based on SEC prices of $102.07/barrel and $9.92/Mcf.
6 |
|
|
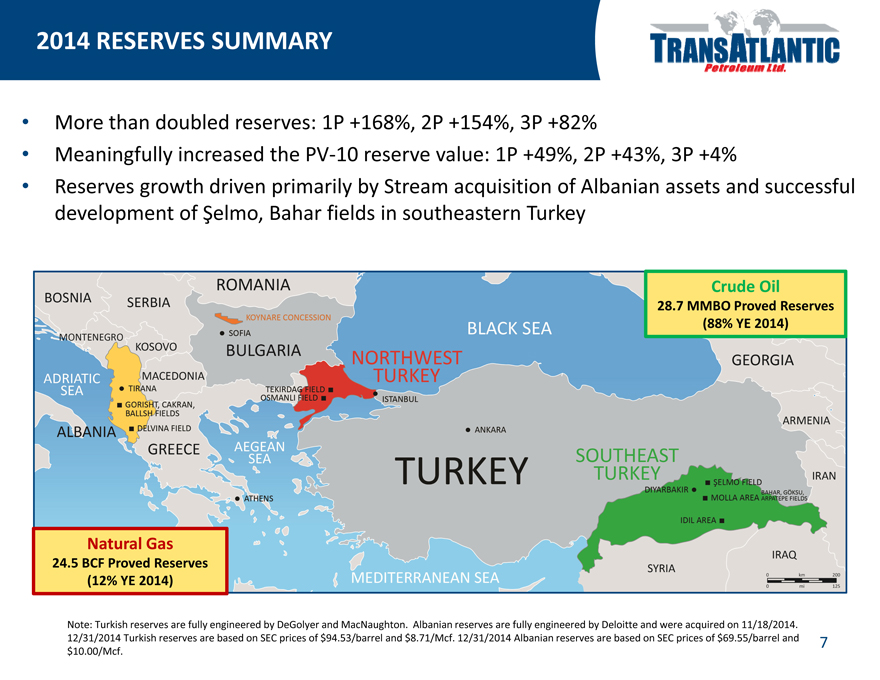
2014 RESERVES SUMMARY
• |
| More than doubled reserves: 1P +168%, 2P +154%, 3P +82% |
• |
| Meaningfully increased the PV-10 reserve value: 1P +49%, 2P +43%, 3P +4% |
• |
| Reserves growth driven primarily by Stream acquisition of Albanian assets and successful development of Şelmo, Bahar fields in southeastern Turkey |
Crude Oil
28.7 MMBO Proved Reserves (88% YE 2014)
Natural Gas
24.5 BCF Proved Reserves (12% YE 2014)
Note: Turkish reserves are fully engineered by DeGolyer and MacNaughton. Albanian reserves are fully engineered by Deloitte and were acquired on 11/18/2014. 12/31/2014 Turkish reserves are based on SEC prices of $94.53/barrel and $8.71/Mcf. 12/31/2014 Albanian reserves are based on SEC prices of $69.55/barrel and $10.00/Mcf.
7 |
|
|
TURKISH RESERVES
8 |
|
|
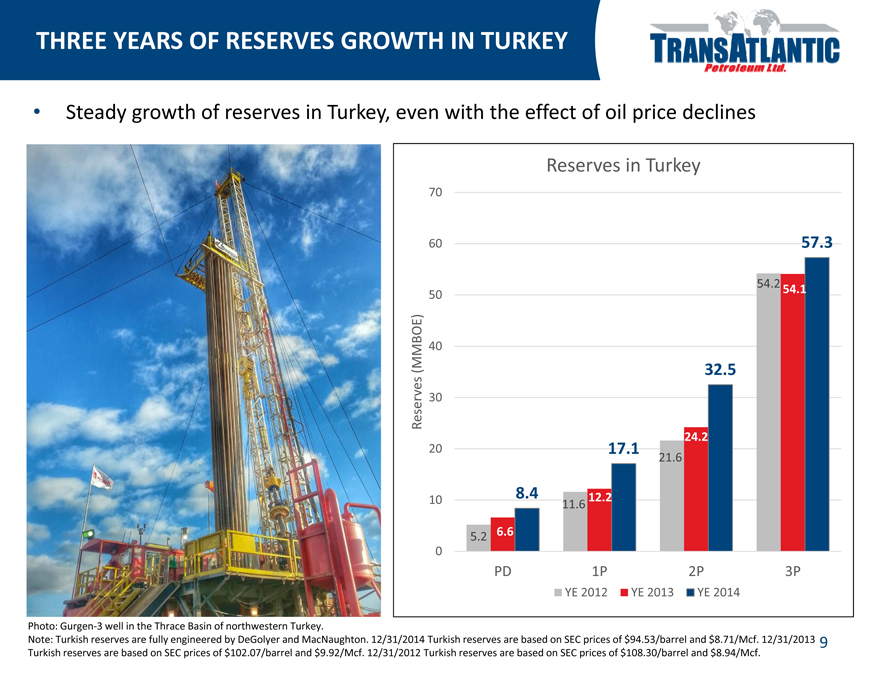
THREE YEARS OF RESERVES GROWTH IN TURKEY
• |
| Steady growth of reserves in Turkey, even with the effect of oil price declines |
Reserves in Turkey
70
60 57.3
54.2
54.1
50
BOE) (MM 40
32.5
eserves 30 R
24.2
20 17.1
21.6
8.4 12.2
10 11.6
5.2 6.6 0
PD 1P 2P 3P
YE 2012 YE 2013 YE 2014
Photo: Gurgen-3 well in the Thrace Basin of northwestern Turkey.
Note: Turkish reserves are fully engineered by DeGolyer and MacNaughton. 12/31/2014 Turkish reserves are based on SEC prices of $94.53/barrel and $8.71/Mcf. 12/31/2013 Turkish reserves are based on SEC prices of $102.07/barrel and $9.92/Mcf. 12/31/2012 Turkish reserves are based on SEC prices of $108.30/barrel and $8.94/Mcf.
9
|
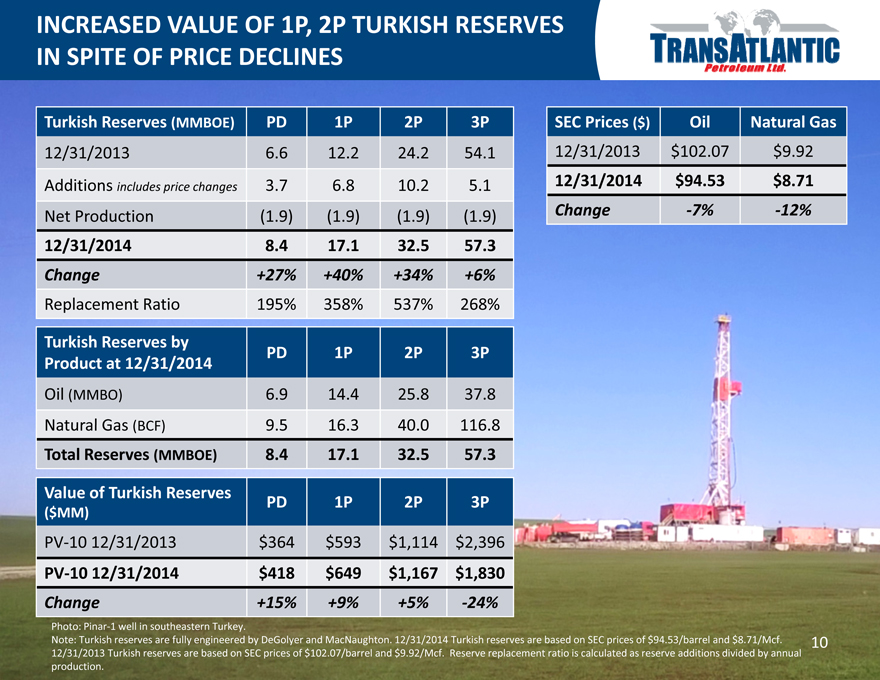
INCREASED VALUE OF 1P, 2P TURKISH RESERVES IN SPITE OF PRICE DECLINES
Turkish Reserves (MMBOE) PD 1P 2P 3P SEC Prices ($) Oil Natural Gas
12/31/2013 6.6 12.2 24.2 54.1 12/31/2013 $102.07 $9.92
Additions includes price changes 3.7 6.8 10.2 5.1 12/31/2014 $94.53 $ 8.71
Net Production (1.9) (1.9) (1.9) (1.9) Change -7% -12%
12/31/2014 8.4 17.1 32.5 57.3
Change +27% +40% +34% +6%
Replacement Ratio 195% 358% 537% 268%
Turkish Reserves by
PD 1P 2P 3P
Product at 12/31/2014
Oil (MMBO) 6.9 14.4 25.8 37.8
Natural Gas (BCF) 9.5 16.3 40.0 116.8
Total Reserves (MMBOE) 8.4 17.1 32.5 57.3
Value of Turkish Reserves PD 1P 2P 3P
($ MM)
PV-10 12/31/2013 $ 364 $ 593 $1,114 $2,396
PV-10 12/31/2014 $ 418 $ 649 $ 1,167 $ 1,830
Change +15% +9% +5% -24%
Photo: Pinar-1 well in southeastern Turkey.
Note: Turkish reserves are fully engineered by DeGolyer and MacNaughton. 12/31/2014 Turkish reserves are based on SEC prices of $94.53/barrel and $8.71/Mcf. 12/31/2013 Turkish reserves are based on SEC prices of $102.07/barrel and $9.92/Mcf. Reserve replacement ratio is calculated as reserve additions divided by annual production.
10
|
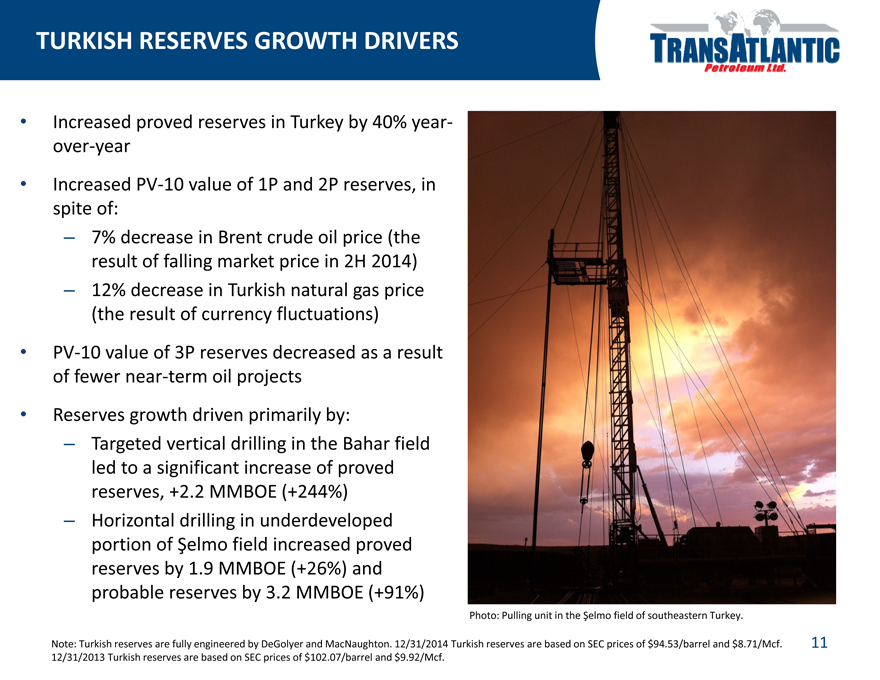
TURKISH RESERVES GROWTH DRIVERS
• |
| Increased proved reserves in Turkey by 40% year-over-year |
• |
| Increased PV-10 value of 1P and 2P reserves, in spite of: |
– 7% decrease in Brent crude oil price (the result of falling market price in 2H 2014)
– 12% decrease in Turkish natural gas price (the result of currency fluctuations)
• |
| PV-10 value of 3P reserves decreased as a result of fewer near-term oil projects |
• |
| Reserves growth driven primarily by: |
– Targeted vertical drilling in the Bahar field led to a significant increase of proved reserves, +2.2 MMBOE (+244%)
– Horizontal drilling in underdeveloped portion of Şelmo field increased proved reserves by 1.9 MMBOE (+26%) and probable reserves by 3.2 MMBOE (+91%)
Photo: Pulling unit in the Şelmo field of southeastern Turkey.
Note: Turkish reserves are fully engineered by DeGolyer and MacNaughton. 12/31/2014 Turkish reserves are based on SEC prices of $94.53/barrel and $8.71/Mcf. 12/31/2013 Turkish reserves are based on SEC prices of $102.07/barrel and $9.92/Mcf.
11
|
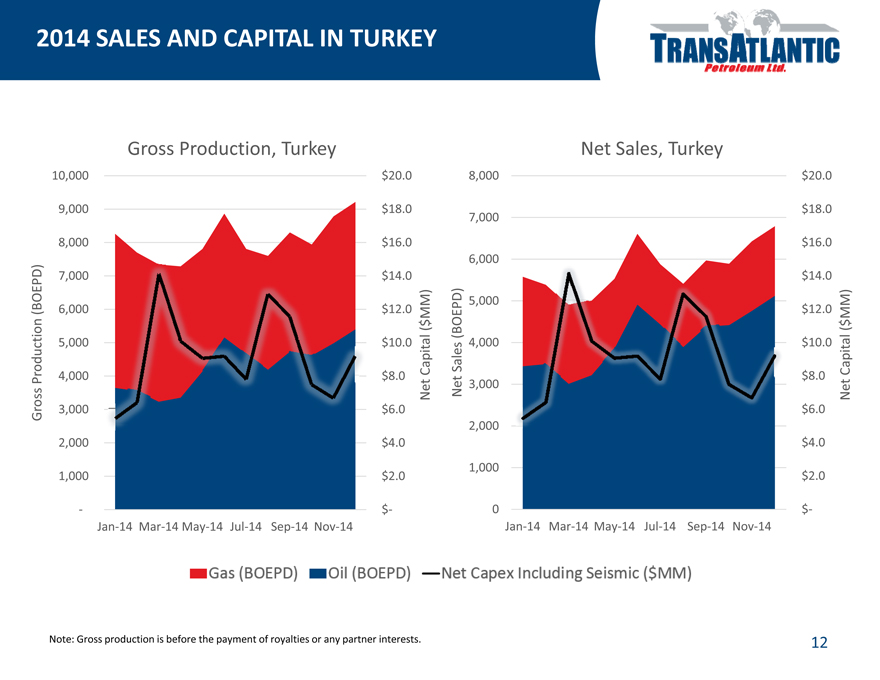
2014 SALES AND CAPITAL IN TURKEY
Gross Production, Turkey Net Sales, Turkey
10,000 $20.0 8,000 $20.0
9,000 $18.0 $18.0 7,000
8,000 $16.0 $16.0 6,000 7,000 $14.0 $14.0
5,000
(BOEPD) 6,000 $12.0 $12.0
MM) MM)
$ ( ( $ l (BOEPD) l tion 5,000 $10.0 Sales 4,000 $10.0 Capita Produc 4,000 $8.0 Capita $8.0 Net Net 3,000 Net Gross 3,000 $6.0 $6.0
2,000
2,000 $4.0 $4.0
1,000
1,000 $2.0 $2.0
- $- 0 $-Jan-14 Mar-14 May-14 Jul-14 Sep-14 Nov-14 Jan-14 Mar-14 May-14 Jul-14 Sep-14 Nov-14
Note: Gross production is before the payment of royalties or any partner interests.
12
|
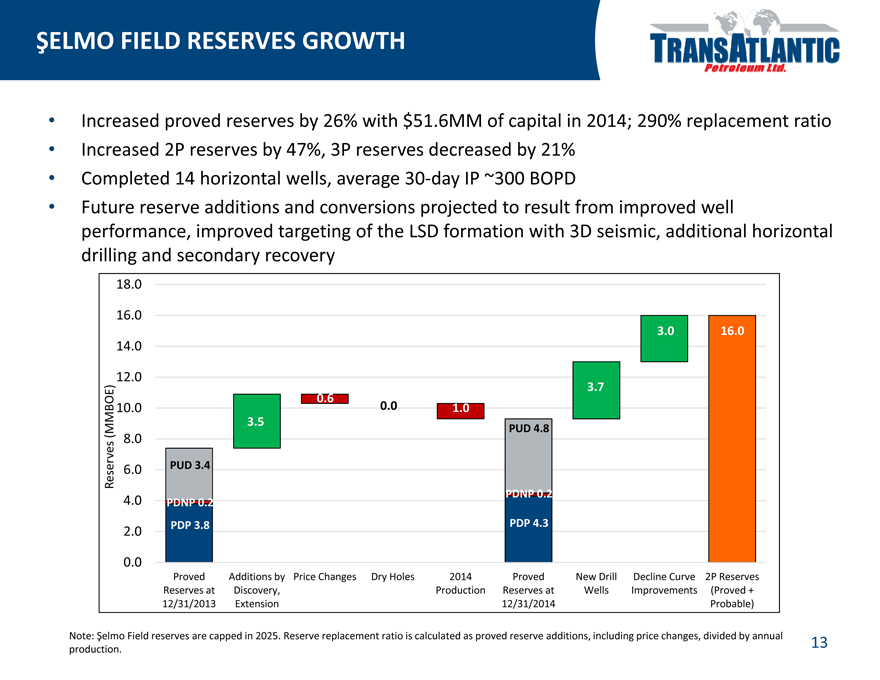
ŞELMO FIELD RESERVES GROWTH
• |
| Increased proved reserves by 26% with $51.6MM of capital in 2014; 290% replacement ratio |
• |
| Increased 2P reserves by 47%, 3P reserves decreased by 21% |
• |
| Completed 14 horizontal wells, average 30-day IP ~300 BOPD |
• |
| Future reserve additions and conversions projected to result from improved well performance, improved targeting of the LSD formation with 3D seismic, additional horizontal drilling and secondary recovery |
18.0
16.0
3.0 16.0
14.0
12.0 3.7
0.6
MBOE) 10.0 0.0 1.0
3.5
(M PUD 4.8
8.0
Reserves 6.0 PUD 3.4
PDNP 0.2
4.0 PDNP 0.2
PDP 3.8 PDP 4.3
2.0
0.0
Proved Additions by Price Changes Dry Holes 2014 Proved New Drill Decline Curve 2P Reserves Reserves at Discovery, Production Reserves at Wells Improvements (Proved + 12/31/2013 Extension 12/31/2014 Probable)
Note: Şelmo Field reserves are capped in 2025. Reserve replacement ratio is calculated as proved reserve additions, including price changes, divided by annual production.
13
|
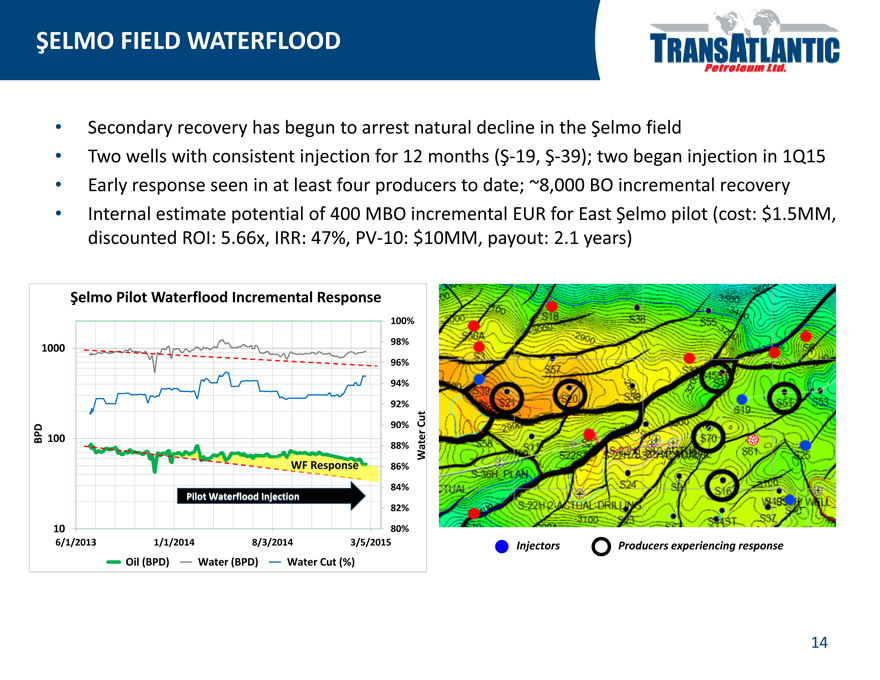
ŞELMO FIELD WATERFLOOD
• |
| Secondary recovery has begun to arrest natural decline in the Şelmo field |
• |
| Two wells with consistent injection for 12 months (Ş-19, Ş-39); two began injection in 1Q15 |
• |
| Early response seen in at least four producers to date; ~8,000 BO incremental recovery |
• |
| Internal estimate potential of 400 MBO incremental EUR for East Şelmo pilot (cost: $1.5MM, discounted ROI: 5.66x, IRR: 47%, PV-10: $10MM, payout: 2.1 years) |
Şelmo Pilot Waterflood Incremental Response
100%
98%
1000
96%
94%
92%
Cut
90%
BPD 100
88% Water
WF Response 86%
84% Pilot Waterflood Injection 82%
10 80%
6/1/2013 1/1/2014 8/3/2014 3/5/2015 Injectors Producers experiencing response
Oil (BPD) Water (BPD) Water Cut (%)
14
|
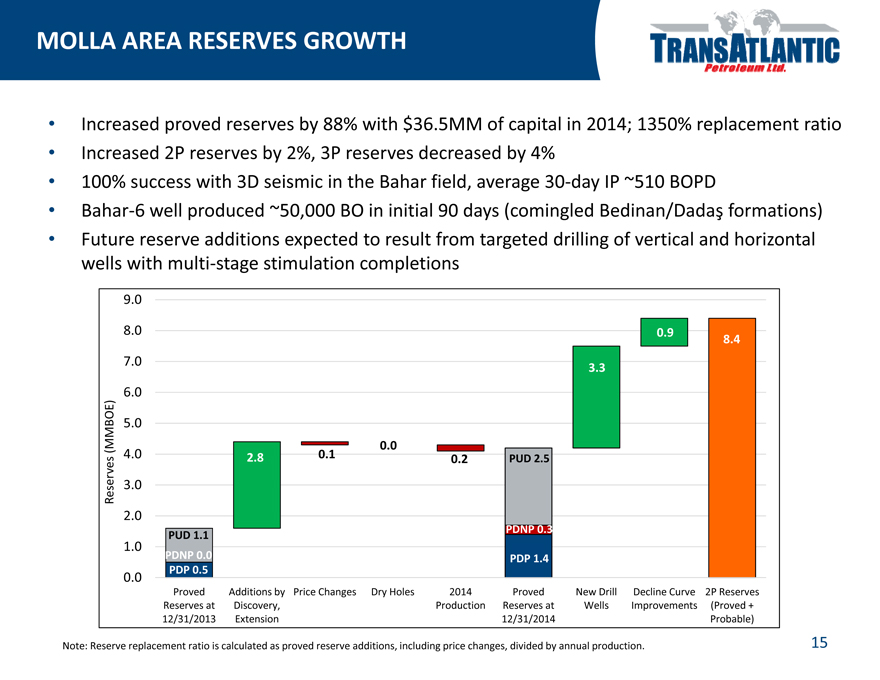
MOLLA AREA RESERVES GROWTH
• |
| Increased proved reserves by 88% with $36.5MM of capital in 2014; 1350% replacement ratio |
• |
| Increased 2P reserves by 2%, 3P reserves decreased by 4% |
• |
| 100% success with 3D seismic in the Bahar field, average 30-day IP ~510 BOPD |
• |
| Bahar-6 well produced ~50,000 BO in initial 90 days (comingled Bedinan/Dadaºformations) |
• |
| Future reserve additions expected to result from targeted drilling of vertical and horizontal wells with multi-stage stimulation completions |
9.0
8.0 0.9
84 .
7.0
3.3
6.0
BOE) 50 .
(MM 0.0
4.0 2.8 0.1 0.2 PUD 2.5
Reserves 3.0
2.0
PDNP 0.3 PUD 1.1
1.0
PDNP 0.0 PDP 1.4 PDP 0.5
0.0
Proved Additions by Price Changes Dry Holes 2014 Proved New Drill Decline Curve 2P Reserves Reserves at Discovery, Production Reserves at Wells Improvements (Proved + 12/31/2013 Extension 12/31/2014 Probable)
Note: Reserve replacement ratio is calculated as proved reserve additions, including price changes, divided by annual production. 15
|
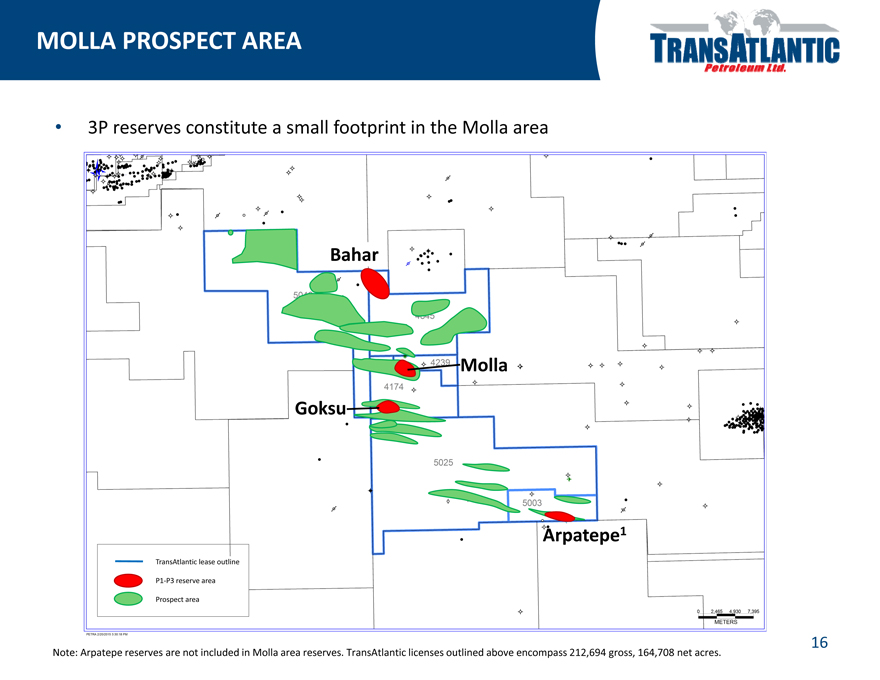
MOLLA PROSPECT AREA
• |
| 3P reserves constitute a small footprint in the Molla area |
Bahar
Molla
Goksu
Arpatepe1
TransAtlantic lease outline P1-P3 reserve area Prospect area
Note: Arpatepe reserves are not included in Molla area reserves. TransAtlantic licenses outlined above encompass 212,694 gross, 164,708 net acres. 16
|
THRACE BASIN RESERVES GROWTH
• |
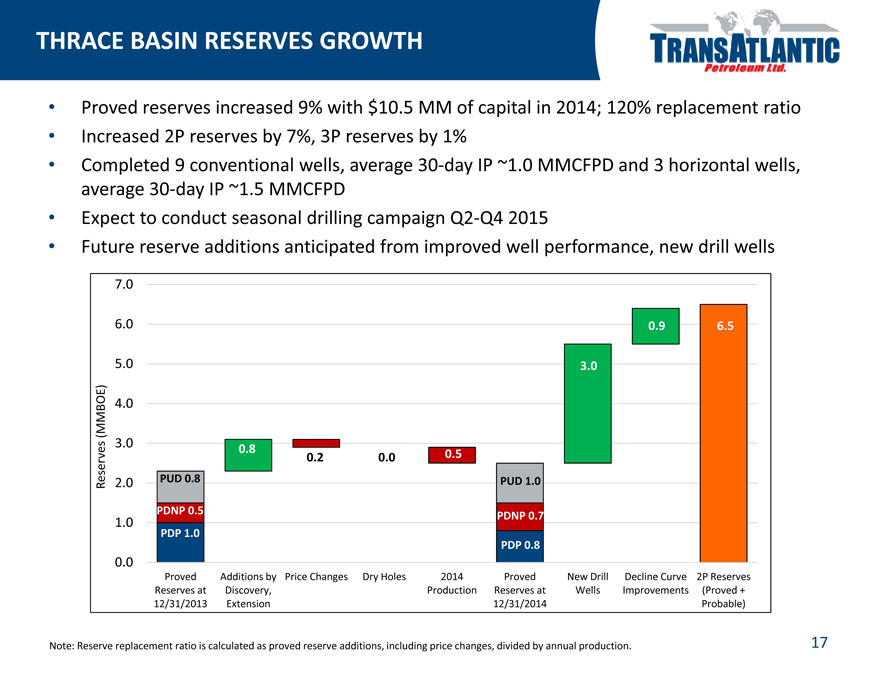
| Proved reserves increased 9% with $10.5 MM of capital in 2014; 120% replacement ratio |
• |
| Increased 2P reserves by 7%, 3P reserves by 1% |
• |
| Completed 9 conventional wells, average 30-day IP ~1.0 MMCFPD and 3 horizontal wells, average 30-day IP ~1.5 MMCFPD |
• |
| Expect to conduct seasonal drilling campaign Q2-Q4 2015 |
• |
| Future reserve additions anticipated from improved well performance, new drill wells |
7.0
6.0 0.9 6.5
5.0 3.0
MBOE) 4.0 (M
3.0
0.8
0.2 0.0 0.5
Reserves 2.0 PUD 0.8 PUD 1.0 PDNP 0.5 PDNP 0.7
1.0
PDP 1.0
PDP 0.8
0.0
Proved Additions by Price Changes Dry Holes 2014 Proved New Drill Decline Curve 2P Reserves Reserves at Discovery, Production Reserves at Wells Improvements (Proved + 12/31/2013 Extension 12/31/2014 Probable)
Note: Reserve replacement ratio is calculated as proved reserve additions, including price changes, divided by annual production. 17
|
THRACE BASIN FOCUS IN 2015
• |
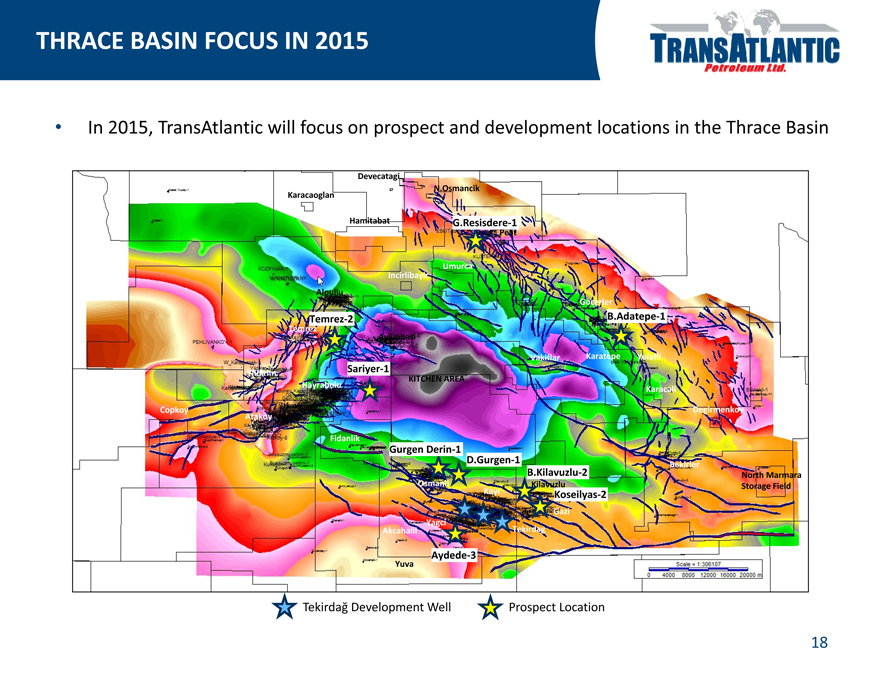
| In 2015, TransAtlantic will focus on prospect and development locations in the Thrace Basin |
Devecatagi
Karacaoglan N.Osmancik
Hamitabat G.Resisdere-1
Pelit
Umurca Incirlibayir
Alpullu
Gocerler
Temrez-2 B.Adatepe-1
Temrez
Avluobasi
Vakiflar Karatepe Yulafli
Sariyer-1
Yildirim
KITCHEN AREA Hayrabolu
Karacali
Copkoy Atakoy Degirmenkoy Fidanlik
Gurgen Derin-1
D.Gurgen-1
B.Kilavuzlu-2 Bekirler
North Marmara Osmanli Kilavuzlu Storage Field Kayi Koseilyas-2
Gazi Yagci Tekirdag Akcahalil
Aydede-3
Yuva
TekirdağDevelopment Well Prospect Location
18
|
YE 2014 TURKISH RESERVES’ ESTIMATED SENSITIVITY TO OIL PRICE FLUCTUATIONS
Turkey Reserves at 12/31/2014
100%
90%
80%
70%
% of SEC Reserves
0% 10% 20% 30% 40% 50% 60%
$80/BO $70/BO $60/BO $50/BO $40/BO
PV-10 of Turkey Reserves at 12/31/2014
100% 90% 80%
70%
Value 60%—10 PV 50%
SEC of 40% %
30% 20% 10% 0%
$80/BO $70/BO $60/BO $50/BO $40/BO
Brent Crude Oil Price Brent Crude Oil Price
1P Reserves 2P Reserves 3P Reserves
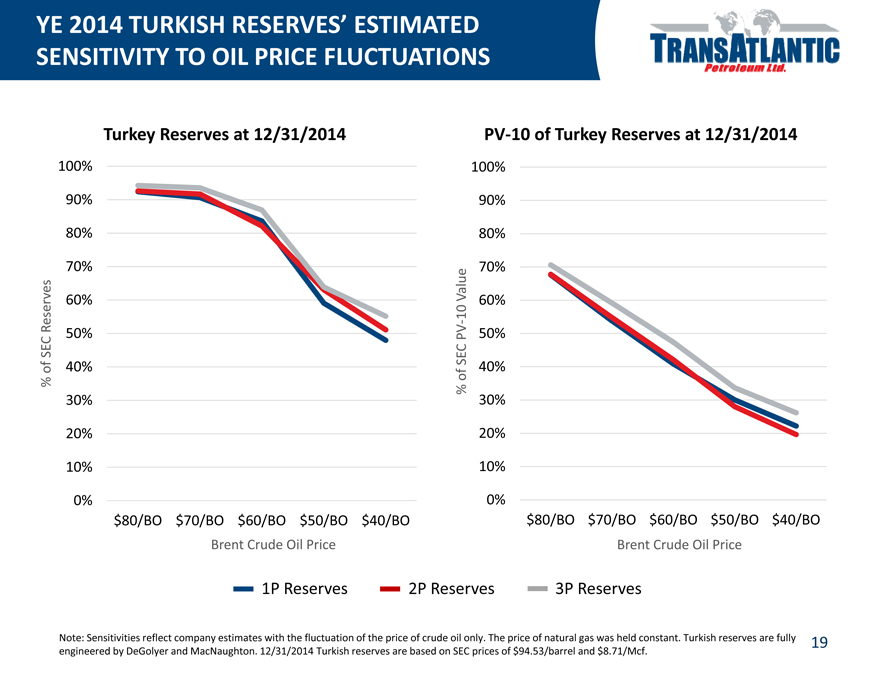
Note: Sensitivities reflect company estimates with the fluctuation of the price of crude oil only. The price of natural gas was held constant. Turkish reserves are fully engineered by DeGolyer and MacNaughton. 12/31/2014 Turkish reserves are based on SEC prices of $94.53/barrel and $8.71/Mcf.
19
|

ALBANIAN RESERVES
20
|
ALBANIAN RESERVES
Albanian Reserves
PD 1P 2P 3P
at 12/31/2014
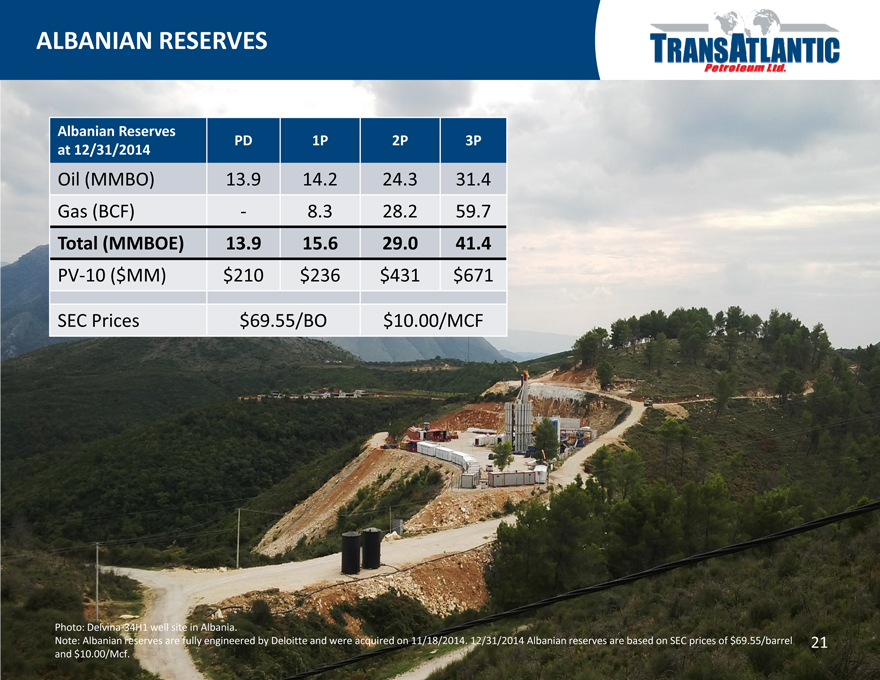
Oil (MMBO) 13.9 14.2 24.3 31.4
Gas (BCF)—8.3 28.2 59.7
Total (MMBOE) 13.9 15.6 29.0 41.4
PV-10 ($MM) $210 $236 $431 $671
SEC Prices $69.55/BO $10.00/MCF
Photo: Delvina-34H1 well site in Albania.
Note: Albanian reserves are fully engineered by Deloitte and were acquired on 11/18/2014. 12/31/2014 Albanian reserves are based on SEC prices of $69.55/barrel and $10.00/Mcf.
21
|
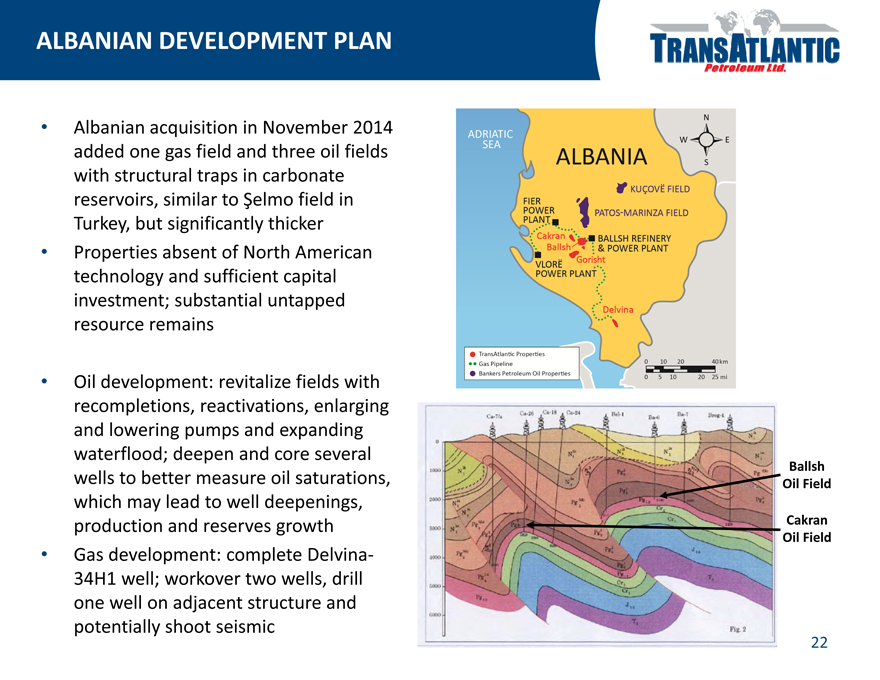
ALBANIAN DEVELOPMENT PLAN
• |
| Albanian acquisition in November 2014 added one gas field and three oil fields with structural traps in carbonate reservoirs, similar to Şelmo field in Turkey, but significantly thicker |
• |
| Properties absent of North American technology and sufficient capital investment; substantial untapped resource remains |
• |
| Oil development: revitalize fields with recompletions, reactivations, enlarging and lowering pumps and expanding waterflood; deepen and core several Ballsh wells to better measure oil saturations, Oil Field which may lead to well deepenings, production and reserves growth Cakran |
Oil Field
• |
| Gas development: complete Delvina-34H1 well; workover two wells, drill one well on adjacent structure and potentially shoot seismic |
22
|
BULGARIAN RESERVES
23
|
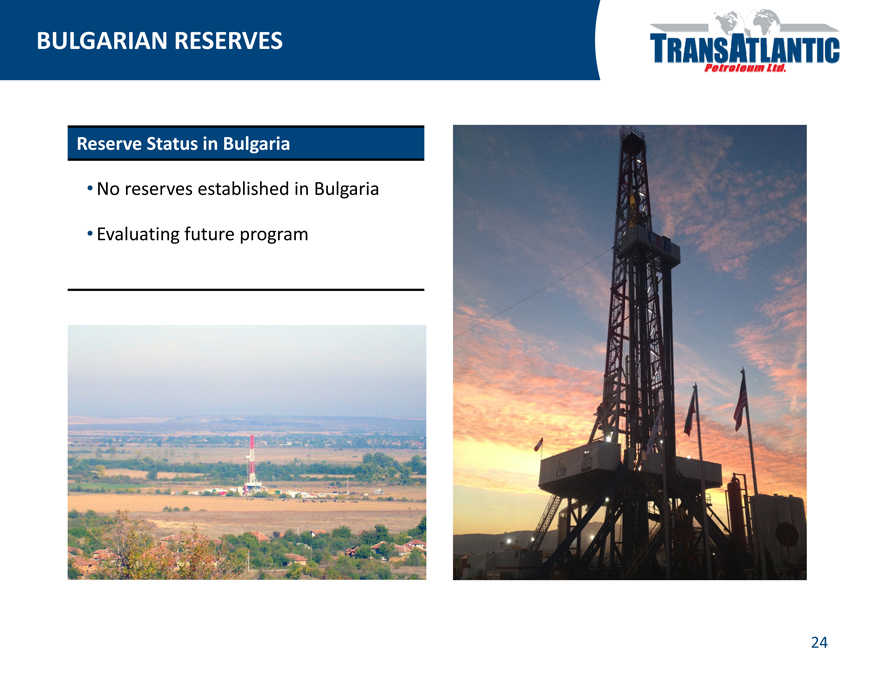
BULGARIAN RESERVES
Reserve Status in Bulgaria
• |
| No reserves established in Bulgaria |
• |
| Evaluating future program |
24
|
OUTSTANDING GROWTH IN 2014
• |
| More than doubled 1P and 2P reserves: 1P +168%, 2P +154% |
• |
| Meaningfully increased PV-10 reserve value: 1P +49%, 2P +43% |
• |
| Increased proved reserves in Turkey by 40% |
• |
| Boosted total net production by 40%; grew net production in Turkey by 20% |
• |
| Expanded knowledge of oil fields in southeast Turkey – 100% well success with 3D seismic; Identified prospects in the Molla area with larger reserve potential than Bahar field |
• |
| Albanian oil fields with 2,000-foot column potentially containing multiple pay zones and projected recoveries of approximately 10% of original oil in place are expected to increase with production and facility improvements |
• |
| ~$35MM of cash on hand and a portfolio of commodity derivative contracts with present value of ~$26MM (at $60/BO); expect to utilize cash flow for capital expenditures, debt repayment and/or stock repurchases |
• |
| Ability to be a nimble operator with superior access to oilfield services |
25
|
CONTACT
Taylor Beach
Director of Investor Relations
(214) 265-4746
Taylor.Beach@tapcor.com
www.TransAtlanticPetroleum.com
26
|
APPENDIX
27
|
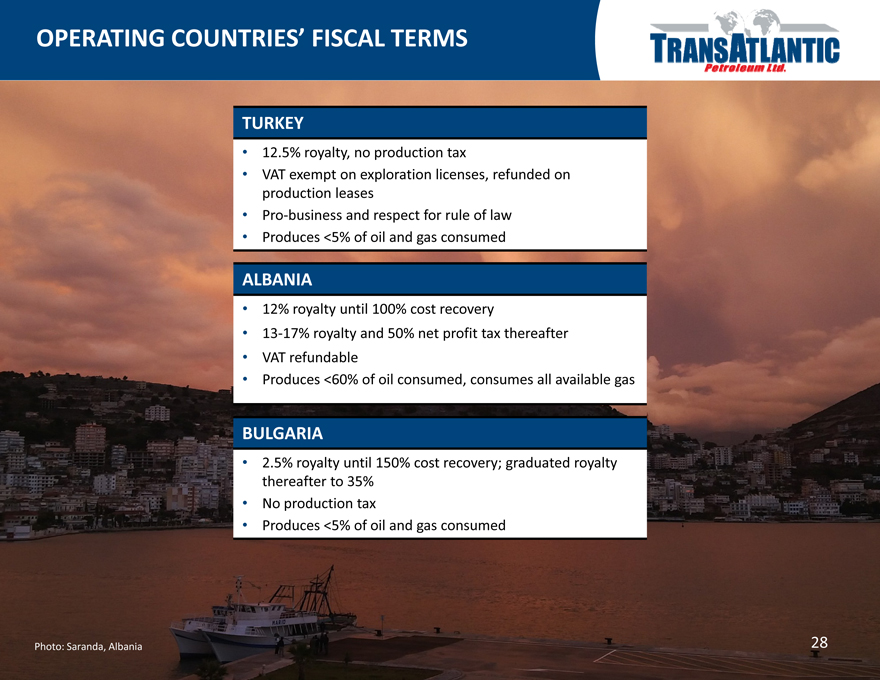
OPERATING COUNTRIES’ FISCAL TERMS
TURKEY
• |
| 12.5% royalty, no production tax |
• |
| VAT exempt on exploration licenses, refunded on production leases |
• |
| Pro-business and respect for rule of law |
• |
| Produces <5% of oil and gas consumed |
ALBANIA
• |
| 12% royalty until 100% cost recovery |
• |
| 13-17% royalty and 50% net profit tax thereafter |
• |
| VAT refundable |
• |
| Produces <60% of oil consumed, consumes all available gas |
BULGARIA
• |
| 2.5% royalty until 150% cost recovery; graduated royalty thereafter to 35% |
• |
| No production tax |
• |
| Produces <5% of oil and gas consumed |
Photo: Saranda, Albania
28
|
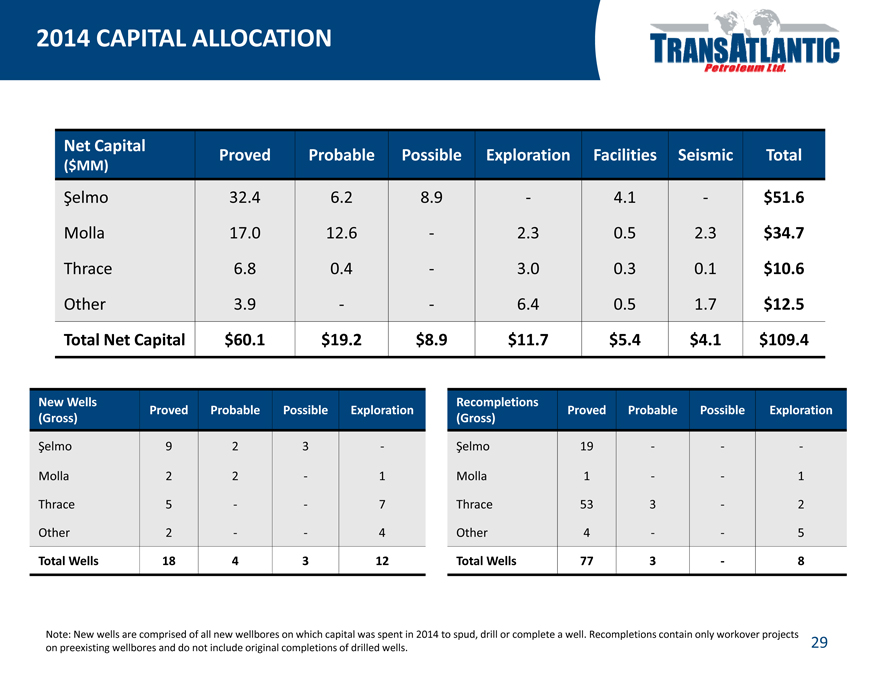
2014 CAPITAL ALLOCATION
Net Capital Proved Probable Possible Exploration Facilities Seismic Total
($MM)
Şelmo 32.4 6.2 8.9—4.1—$51.6
Molla 17.0 12.6—2.3 0.5 2.3 $34.7
Thrace 6.8 0.4—3.0 0.3 0.1 $10.6
Other 3.9 — 6.4 0.5 1.7 $12.5
Total Net Capital $60.1 $19.2 $8.9 $11.7 $5.4 $4.1 $109.4
New Wells Recompletions
Proved Probable Possible Exploration Proved Probable Possible Exploration
(Gross) (Gross)
Şelmo 9 2 3—Şelmo 19 — -
Molla 2 2—1 Molla 1 — 1
Thrace 5 — 7 Thrace 53 3—2
Other 2 — 4 Other 4 — 5
Total Wells 18 4 3 12 Total Wells 77 3—8
Note: New wells are comprised of all new wellbores on which capital was spent in 2014 to spud, drill or complete a well. Recompletions contain only workover projects on preexisting wellbores and do not include original completions of drilled wells.
29
|
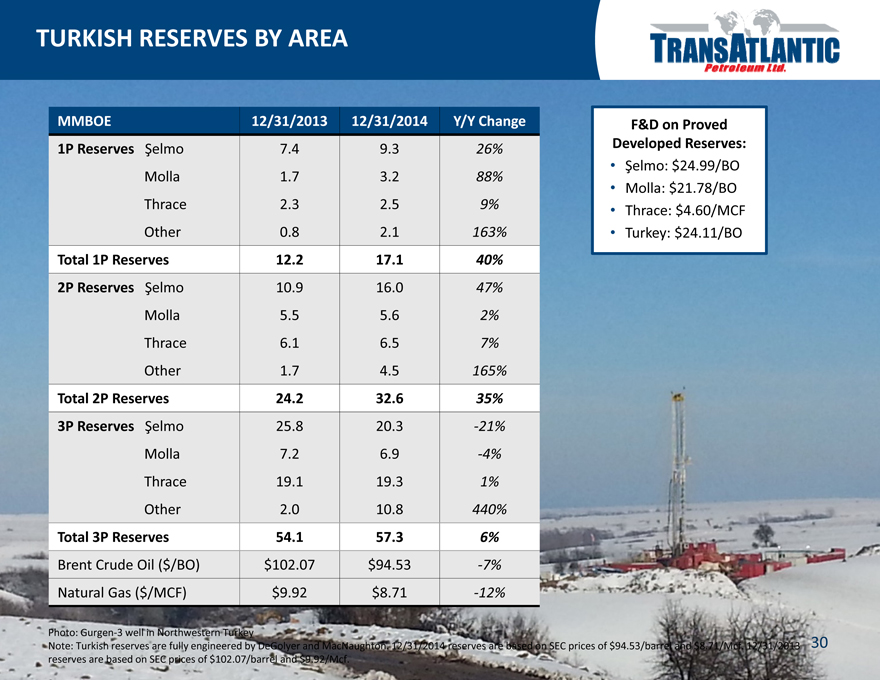
TURKISH RESERVES BY AREA
MMBOE 12/31/2013 12/31/2014 Y/Y Change F&D on Proved
1P Reserves Şelmo 7.4 9.3 26% Developed Reserves:
• Şelmo: $24.99/BO
Molla 1.7 3.2 88%
• Molla: $21.78/BO
Thrace 2.3 2.5 9% • Thrace: $4.60/MCF
Other 0.8 2.1 163% • Turkey: $24.11/BO
Total 1P Reserves 12.2 17.1 40%
2P Reserves Şelmo 10.9 16.0 47%
Molla 5.5 5.6 2%
Thrace 6.1 6.5 7%
Other 1.7 4.5 165%
Total 2P Reserves 24.2 32.6 35%
3P Reserves Şelmo 25.8 20.3 -21%
Molla 7.2 6.9 -4%
Thrace 19.1 19.3 1%
Other 20. 10.8 440%
Total 3P Reserves 54.1 57.3 6%
Brent Crude Oil ($/BO) $102.07 $94.53 -7%
Natural Gas ($/MCF) $9.92 $8.71 -12%
Photo: Gurgen-3 well in Northwestern Turkey
Note: Turkish reserves are fully engineered by DeGolyer and MacNaughton. 12/31/2014 reserves are based on SEC prices of $94.53/barrel and $8.71/Mcf. 12/31/2013 reserves are based on SEC prices of $102.07/barrel and $9.92/Mcf.
30
|
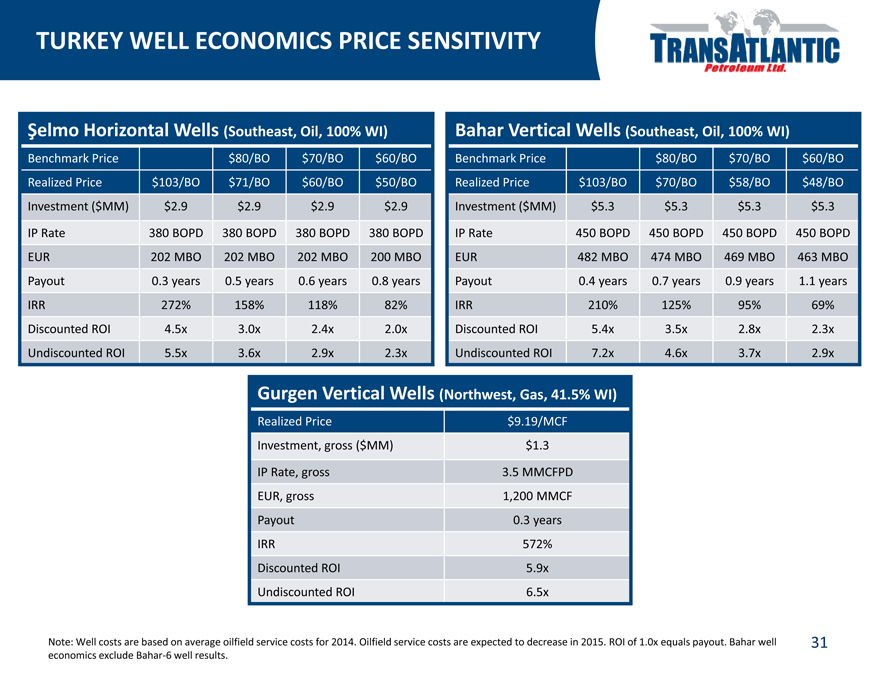
TURKEY WELL ECONOMICS PRICE SENSITIVITY
Şelmo Horizontal Wells (Southeast, Oil, 100% WI) Bahar Vertical Wells (Southeast, Oil, 100% WI)
Benchmark Price $80/BO $70/BO $60/BO Benchmark Price $80/BO $70/BO $60/BO
Realized Price $103/BO $71/BO $60/BO $50/BO Realized Price $103/BO $70/BO $58/BO $48/BO
Investment ($MM) $2.9 $2.9 $2.9 $2.9 Investment ($MM) $5.3 $5.3 $5.3 $5.3
IP Rate 380 BOPD 380 BOPD 380 BOPD 380 BOPD IP Rate 450 BOPD 450 BOPD 450 BOPD 450 BOPD
EUR 202 MBO 202 MBO 202 MBO 200 MBO EUR 482 MBO 474 MBO 469 MBO 463 MBO
Payout 0.3 years 0.5 years 0.6 years 0.8 years Payout 0.4 years 0.7 years 0.9 years 1.1 years
IRR 272% 158% 118% 82% IRR 210% 125% 95% 69%
Discounted ROI 4.5x 3.0x 2.4x 2.0x Discounted ROI 5.4x 3.5x 2.8x 2.3x
Undiscounted ROI 5.5x 3.6x 2.9x 2.3x Undiscounted ROI 7.2x 4.6x 3.7x 2.9x
Gurgen Vertical Wells (Northwest, Gas, 41.5% WI)
Realized Price $9.19/MCF
Investment, gross ($MM) $1.3
IP Rate, gross 3.5 MMCFPD
EUR, gross 1,200 MMCF
Payout 0.3 years
IRR 572%
Discounted ROI 5.9x
Undiscounted ROI 6.5x
Note: Well costs are based on average oilfield service costs for 2014. Oilfield service costs are expected to decrease in 2015. ROI of 1.0x equals payout. Bahar well economics exclude Bahar-6 well results.
31
|
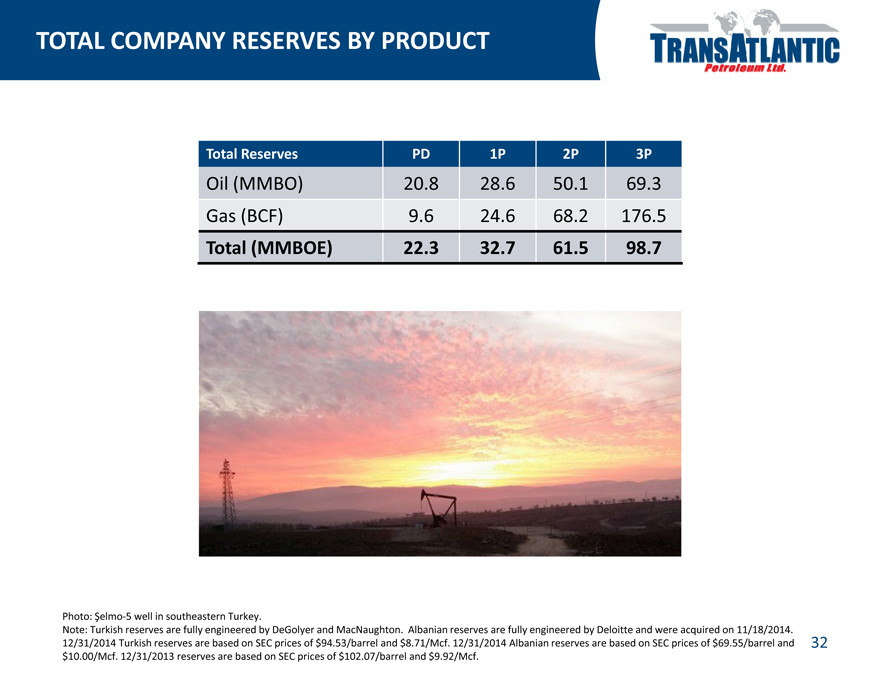
TOTAL COMPANY RESERVES BY PRODUCT
Total Reserves PD 1P 2P 3P
Oil (MMBO) 20.8 28.6 50.1 69.3
Gas (BCF) 9.6 24.6 68.2 176.5
Total (MMBOE) 22.3 32.7 61.5 98.7
Photo: Şelmo-5 well in southeastern Turkey.
Note: Turkish reserves are fully engineered by DeGolyer and MacNaughton. Albanian reserves are fully engineered by Deloitte and were acquired on 11/18/2014. 12/31/2014 Turkish reserves are based on SEC prices of $94.53/barrel and $8.71/Mcf. 12/31/2014 Albanian reserves are based on SEC prices of $69.55/barrel and $10.00/Mcf. 12/31/2013 reserves are based on SEC prices of $102.07/barrel and $9.92/Mcf.
32
|
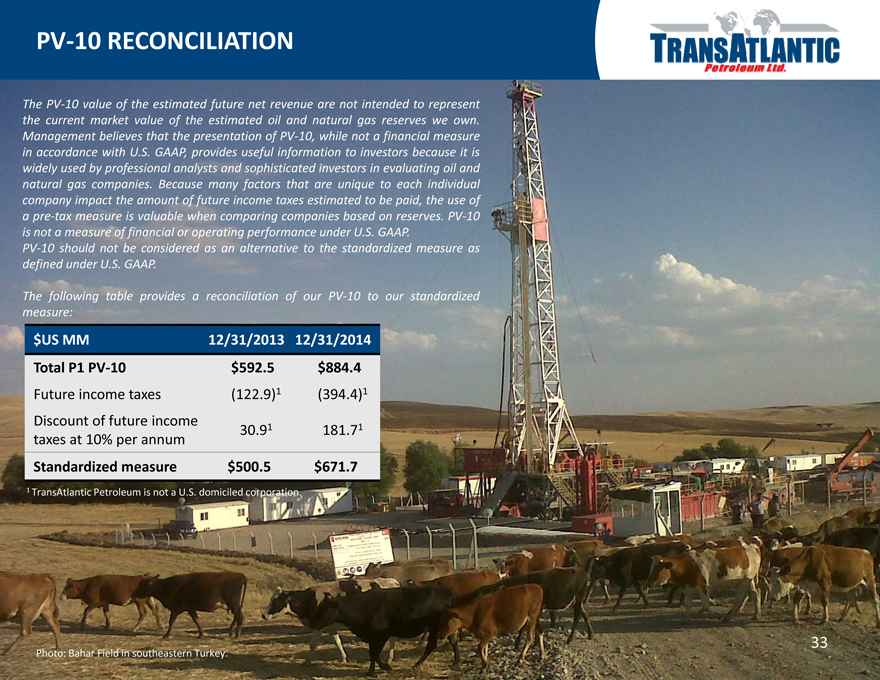
PV-10 RECONCILIATION
The PV-10 value of the estimated future net revenue are not intended to represent the current market value of the estimated oil and natural gas reserves we own. Management believes that the presentation of PV-10, while not a financial measure in accordance with U.S. GAAP, provides useful information to investors because it is widely used by professional analysts and sophisticated investors in evaluating oil and natural gas companies. Because many factors that are unique to each individual company impact the amount of future income taxes estimated to be paid, the use of a pre-tax measure is valuable when comparing companies based on reserves. PV-10 is not a measure of financial or operating performance under U.S. GAAP.
PV-10 should not be considered as an alternative to the standardized measure as defined under U.S. GAAP.
The following table provides a reconciliation of our PV-10 to our standardized measure:
$US MM 12/31/2013 12/31/2014
Total P1 PV-10 $592.5 $884.4
Future income taxes (122.9)1 (394.4)1 Discount of future income
30.91 181.71 taxes at 10% per annum
Standardized measure $500.5 $671.7
1 |
| TransAtlantic Petroleum is not a U.S. domiciled corporation. |
Photo: Bahar Field in southeastern Turkey.
33