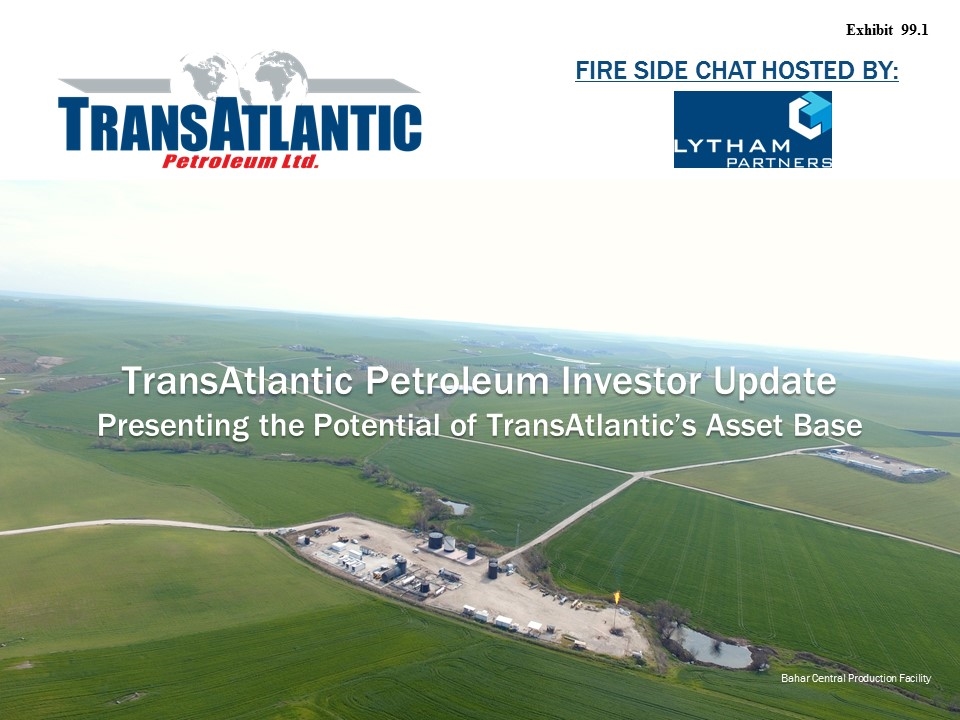
Bahar Production Facility FIRE SIDE CHAT Hosted By: Bahar Central Production Facility TransAtlantic Petroleum Investor Update Presenting the Potential of TransAtlantic’s Asset Base Exhibit 99.1
Disclaimer (1/2) Outlooks, projections, estimates, targets and business plans in this presentation or any related subsequent discussions are forward-looking statements. Actual future results, including TransAtlantic Petroleum Ltd.’s own production growth and mix; financial results; the amount and mix of capital expenditures; resource additions and recoveries; finding and development costs; project and drilling plans, timing, costs, and capacities; marketing process; access to capital; revenue enhancements and cost efficiencies; industry margins; margin enhancements and integration benefits; and the impact of technology could differ materially due to a number of factors. These include market prices for natural gas, natural gas liquids and oil products; estimates of reserves and economic assumptions; the ability to produce and transport natural gas, natural gas liquids and oil; the results of exploration and development drilling and related activities; economic conditions in the countries and provinces in which we carry on business, especially economic slowdowns; actions by governmental authorities, receipt of required approvals, increases in taxes, legislative and regulatory initiatives relating to fracture stimulation activities, changes in environmental and other regulations, and renegotiations of contracts; political uncertainty, including actions by insurgent groups or other conflict; the negotiation and closing of material contracts; shortages of drilling rigs, equipment or oilfield services; and other factors discussed here and under the heading “Risk Factors" in our Annual Report on Form 10-K for the year ended December 31, 2017, which is available on our website at www.transatlanticpetroleum.com and at www.sec.gov. See also TransAtlantic’s audited financial statements and the accompanying management discussion and analysis. Forward-looking statements are based on management’s knowledge and reasonable expectations on the date hereof, and we assume no duty to update these statements contained in our Form 10-K as of any future date, except as required by law. The information set forth in this presentation does not constitute an offer, solicitation or recommendation to sell or an offer to buy any securities of TransAtlantic. The information published herein is provided for informational purposes only. TransAtlantic makes no representation that the information and opinions expressed herein are accurate, complete or current. The information contained herein is current as of the date hereof, but may become outdated or subsequently may change. Nothing contained herein constitutes financial, legal, tax, or other advice. The SEC requires oil and gas companies, in their filings with the SEC, to disclose proved reserves that a company has demonstrated by actual production or conclusive formation tests to be economically and legally producible under existing economic and operating conditions. We may use the terms “estimated ultimate recovery,” “EUR,” “probable,” “possible,” and “non-proven” reserves, “prospective resources” or “upside” or other descriptions of volumes of resources or reserves potentially recoverable through additional drilling or recovery techniques. These estimates are by their nature more speculative than estimates of proved reserves and accordingly are subject to substantially greater risk of actually being realized by TransAtlantic. There is no certainty that any portion of estimated prospective resources will be discovered. If discovered, there is no certainty that it will be commercially viable to produce any portion of the estimated prospective resources. This presentation includes 1P, 2P, and 3P reserves based on a reserve report prepared by Degolyer & MacNaughton as of December 31, 2017 using forward strip pricing (“YE2017 D&M Strip-Pricing Reserve Report”) and a reserve report prepared by Degolyer & MacNaughton as of December 31, 2017 using SEC pricing (“YE2017 D&M SEC Reserve Report”). 1P reserves refer to proved reserves. 2P reserves refer to proved reserves plus probable reserves. 3P reserves refer to proved reserves plus probable reserves plus possible reserves. Proved reserves are those quantities of oil and natural gas, which, by analysis of geoscience and engineering data, can be estimated with reasonable certainty to be economically producible, from a given date forward, from known reservoirs, and under existing economic conditions, operating methods, and government regulations, prior to the time at which contracts providing the right to operate expire, unless evidence indicates that renewal is reasonably certain, regardless of whether deterministic or probabilistic methods are used for the estimation. The project to extract the hydrocarbons must have commenced or the operator must be reasonably certain that it will commence the project within a reasonable time. Probable reserves are inherently imprecise. When producing an estimate of the amount of oil and natural gas that is recoverable from a particular reservoir, an estimated quantity of probable reserves is an estimate of those additional reserves that are less certain to be recovered than proved reserves but which, together with proved reserves, are as likely as not to be recovered. When deterministic methods are used, it is as likely as not that actual remaining quantities recovered will exceed the sum of estimated proved plus probable reserves. When probabilistic methods are used, there should be at least a 50% probability that the actual quantities recovered will equal or exceed the proved plus probable reserves estimates. Possible reserves are also inherently imprecise. When producing an estimate of the amount of oil and natural gas that is recoverable from a particular reservoir, an estimated quantity of possible reserves is an estimate that might be achieved, but only under more favorable circumstances than are likely. When deterministic methods are used, the total quantities ultimately recovered from a project have a low probability of exceeding proved plus probable plus possible reserves. When probabilistic methods are used, there should be at least a 10% probability that the total quantities ultimately recovered will equal or exceed the proved plus probable plus possible reserves estimates.
Disclaimer (2/2) This presentation also includes prospective resource estimates from the Netherland, Sewell & Associates, Inc. Prospective Resource Report dated as of May 31, 2017 (“May 2017 NSAI Prospective Resource Report”) and the DeGloyer and MacNaughton Prospective Resource Report dated as of December 31, 2017 (“December 2017 D&M Prospective Resource Report”). Prospective resources are not the same as reserves or contingent resources. Prospective resources are those quantities of oil and gas estimated, as of a given date, to be potentially recoverable from undiscovered accumulations by application of future development projects. Prospective resources have both an associated chance of discovery and a chance of development. There is no certainty that any portion of the resources will be discovered. If discovered, there is no certainty that it will be commercially viable to produce any portion of the resources. Risks associated with the estimate of prospective resources contained in this presentation include, but are not limited to: The Thrace Basin Centered Gas Accumulation (“Thrace BCGA”) play is in the early exploration and delineation cycle with limited well control and limited fracture stimulation and testing data. Prospects evaluated in the May 2017 NSAI Prospective Resource Report are developed largely using seismic interpretation. Limited well control data is available to support the prospects. The volumes associated with the May 2017 NSAI Prospective Resource Report are all the unrisked high estimate, meaning there is no more than a 10% probability that the volumes discovered will exceed the estimate. There is no long-term well production performance from the Thrace BCGA or the May 2017 NSAI Prospective Resource Report prospects to establish a production type curve specific to the prospect, thereby requiring use of analogue information to establish development plans and to confirm the chance of commerciality. Recovery efficiencies are uncertain given the absence of site specific long-term well production performance data. The limited deep drilling carried out in the Thrace Basin and Bulgaria provides limited visibility on future costs to drill, frac and complete deep development wells to exploit prospects in those regions and the associated impact on the chance of commerciality. Although oil and gas activity has been underway for many decades in Turkey, as activity levels increase, timelines may increase to achieve government and local landowner approvals. Note on PV10 and PV20: The present value of estimated future net revenues is an estimate of future net revenues from a property at the date indicated, without giving effect to derivative financial instrument activities, after deducting production and ad valorem taxes, future capital costs, abandonment costs and operating expenses, but before deducting future federal income taxes. The PV10 future net revenues have been discounted at an annual rate of 10% and the PV20 future net revenues have been discounted at an annual rate of 20% to determine their “present value.” The present value is shown to indicate the effect of time on the value of the net revenue stream and should not be construed as being the fair market value of the properties or the oil and natural gas reserves TransAtlantic owns. Estimates have been made using constant oil and natural gas prices and operating and capital costs at the date indicated, at its acquisition date, or as otherwise indicated. We believe that the present value of estimated future net revenues before income taxes, while not a financial measure in accordance with GAAP, is an important financial measure used by investors and independent oil and natural gas producers for evaluating the relative significance of oil and natural gas properties and acquisitions because the tax characteristics of comparable companies can differ materially. PV10 and PV20 are not measures of financial or operating performance under GAAP. Neither PV10 nor PV20 should be considered as an alternative to the Standardized Measure as defined under GAAP. The Standardized Measure represents the PV10 after giving effect to income taxes. Note on BOE: BOE (barrel of oil equivalent) is derived by converting natural gas to oil in the ratio of six thousand cubic feet (MCF) of natural gas to one barrel (bbl) of oil. BOE may be misleading, particularly if used in isolation. A BOE conversion ratio of 6 Mcf:1 bbl is based on an energy equivalency conversion method primarily applicable at the burner tip and does not represent a value equivalency at the wellhead.
This presentation reflects TransAtlantic’s management’s opinions of a logical and appropriate production, development, and exploration program, which balances the following objectives: Increasing production income by drilling proved undeveloped locations Advancing testing of high-value resource and prospective prospects to a state where continuous development could be commenced in mid-2019 following reservoir testing of wells drilled in 2018 and early 2019 Constructing the necessary and justified production facilities to support the continuous development described in 2) above All activities in 1) and 2) located and timed to conserve and expand TransAtlantic’s production licenses in the greatest realistic manner Making fair estimates of costs and production results based upon prior history and expected practices The drilling and exploration activities discussed in this presentation seek to provide investors with information to better understand the value potential of TransAtlantic’s current properties and opportunities. This presentation depicts an accelerated work-plan that exceeds TransAtlantic’s current cash flow and credit facilities and therefore this presentation should be read as a description of the “potential” of TransAtlantic’s assets rather than as a description of actual intended operations. Important Notice
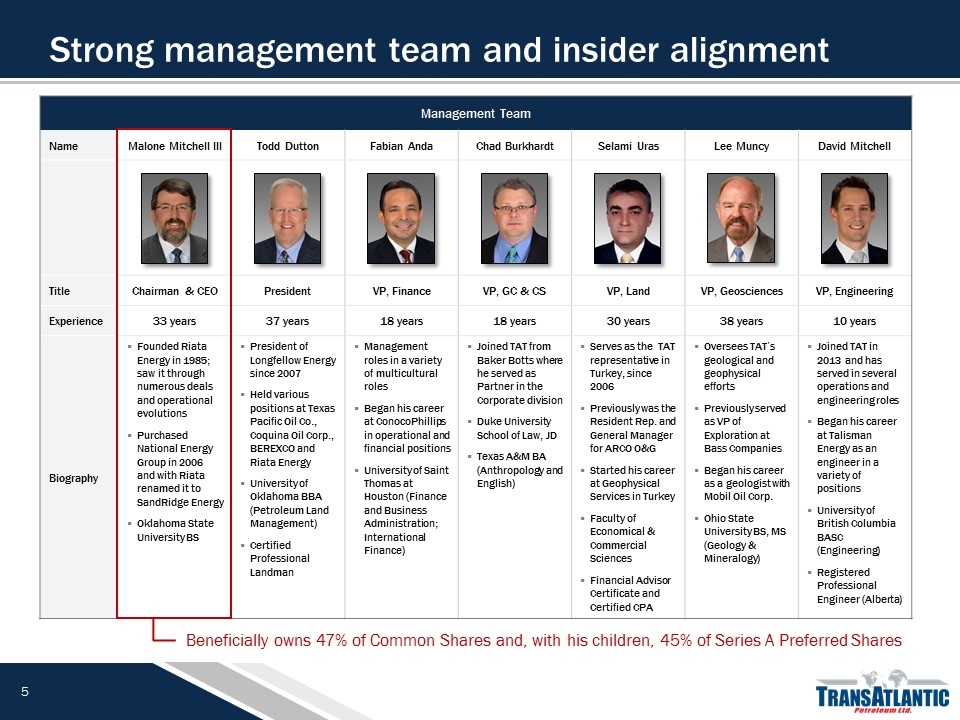
Management Team Name Malone Mitchell III Todd Dutton Fabian Anda Chad Burkhardt Selami Uras Lee Muncy David Mitchell Title Chairman & CEO President VP, Finance VP, GC & CS VP, Land VP, Geosciences VP, Engineering Experience 33 years 37 years 18 years 18 years 30 years 38 years 10 years Biography Founded Riata Energy in 1985; saw it through numerous deals and operational evolutions Purchased National Energy Group in 2006 and with Riata renamed it to SandRidge Energy Oklahoma State University BS President of Longfellow Energy since 2007 Held various positions at Texas Pacific Oil Co., Coquina Oil Corp., BEREXCO and Riata Energy University of Oklahoma BBA (Petroleum Land Management) Certified Professional Landman Management roles in a variety of multicultural roles Began his career at ConocoPhillips in operational and financial positions University of Saint Thomas at Houston (Finance and Business Administration; International Finance) Joined TAT from Baker Botts where he served as Partner in the Corporate division Duke University School of Law, JD Texas A&M BA (Anthropology and English) Serves as the TAT representative in Turkey, since 2006 Previously was the Resident Rep. and General Manager for ARCO O&G Started his career at Geophysical Services in Turkey Faculty of Economical & Commercial Sciences Financial Advisor Certificate and Certified CPA Oversees TAT’s geological and geophysical efforts Previously served as VP of Exploration at Bass Companies Began his career as a geologist with Mobil Oil Corp. Ohio State University BS, MS (Geology & Mineralogy) Joined TAT in 2013 and has served in several operations and engineering roles Began his career at Talisman Energy as an engineer in a variety of positions University of British Columbia BASC (Engineering) Registered Professional Engineer (Alberta) Strong management team and insider alignment Beneficially owns 47% of Common Shares and, with his children, 45% of Series A Preferred Shares
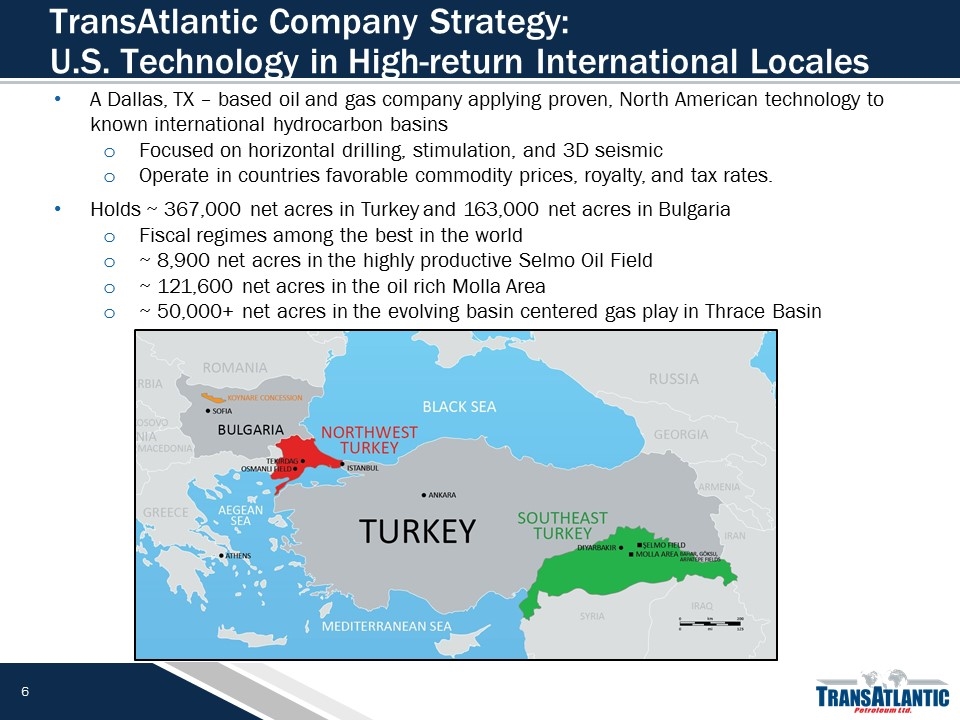
TransAtlantic Company Strategy: U.S. Technology in High-return International Locales . A Dallas, TX – based oil and gas company applying proven, North American technology to known international hydrocarbon basins Focused on horizontal drilling, stimulation, and 3D seismic Operate in countries favorable commodity prices, royalty, and tax rates. Holds ~ 367,000 net acres in Turkey and 163,000 net acres in Bulgaria Fiscal regimes among the best in the world ~ 8,900 net acres in the highly productive Selmo Oil Field ~ 121,600 net acres in the oil rich Molla Area ~ 50,000+ net acres in the evolving basin centered gas play in Thrace Basin
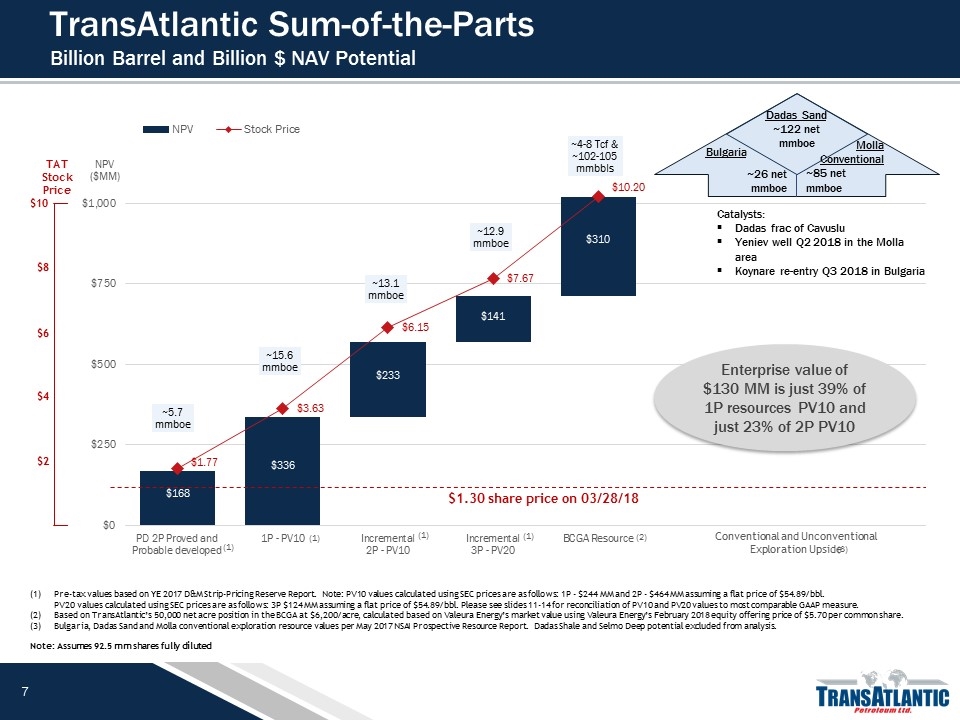
TransAtlantic Sum-of-the-Parts Billion Barrel and Billion $ NAV Potential Pre-tax values based on YE 2017 D&M Strip-Pricing Reserve Report. Note: PV10 values calculated using SEC prices are as follows: 1P - $244 MM and 2P - $464 MM assuming a flat price of $54.89/bbl. PV20 values calculated using SEC prices are as follows: 3P $124 MM assuming a flat price of $54.89/bbl. Please see slides 11-14 for reconciliation of PV10 and PV20 values to most comparable GAAP measure. Based on TransAtlantic’s 50,000 net acre position in the BCGA at $6,200/acre, calculated based on Valeura Energy’s market value using Valeura Energy’s February 2018 equity offering price of $5.70 per common share. Bulgaria, Dadas Sand and Molla conventional exploration resource values per May 2017 NSAI Prospective Resource Report. Dadas Shale and Selmo Deep potential excluded from analysis. Note: Assumes 92.5 mm shares fully diluted Enterprise value of $130 MM is just 39% of 1P resources PV10 and just 23% of 2P PV10 $1.30 share price on 03/28/18 TAT Stock Price $10 $8 $6 $4 $2 Catalysts: Dadas frac of Cavuslu Yeniev well Q2 2018 in the Molla area Koynare re-entry Q3 2018 in Bulgaria Bulgaria ~26 net mmboe Molla Conventional ~85 net mmboe Dadas Sand ~122 net mmboe Conventional and Unconventional Exploration Upside
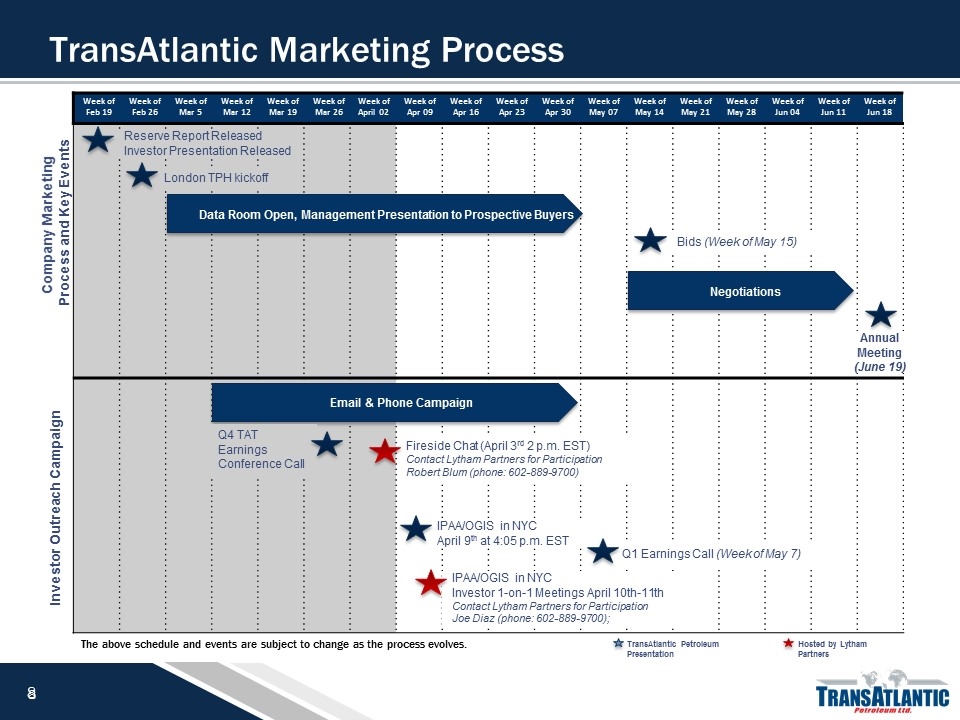
Week of Mar 5 Week of Mar 19 Week of Mar 12 Week of Mar 26 Week of April 02 Week of Apr 09 Week of Apr 16 Week of Apr 23 Week of Apr 30 Week of May 07 Week of May 14 Week of May 21 Week of May 28 Week of Jun 04 Week of Jun 11 Week of Jun 18 Company Marketing Process and Key Events Investor Outreach Campaign Week of Feb 19 Week of Feb 26 Reserve Report Released Investor Presentation Released London TPH kickoff Data Room Open, Management Presentation to Prospective Buyers Negotiations Bids (Week of May 15) Annual Meeting (June 19) IPAA/OGIS in NYC April 9th at 4:05 p.m. EST Email & Phone Campaign Q4 TAT Earnings Conference Call Fireside Chat (April 3rd 2 p.m. EST) Contact Lytham Partners for Participation Robert Blum (phone: 602-889-9700) Q1 Earnings Call (Week of May 7) The above schedule and events are subject to change as the process evolves. Hosted by Lytham Partners TransAtlantic Petroleum Presentation IPAA/OGIS in NYC Investor 1-on-1 Meetings April 10th-11th Contact Lytham Partners for Participation Joe Diaz (phone: 602-889-9700); TransAtlantic Marketing Process

Thank you For process inquiries, please contact: Tudor Pickering Holt & Co. TransAtlantic@tphco.com London: +44 20 7268 2857 TransAtlantic, Malone Mitchell III Chairman & CEO Dallas: +1 972 590 9913 TransAtlantic, Chad Burkhardt VP, General Counsel & Secretary Dallas: +1 214 265 4705
appendix
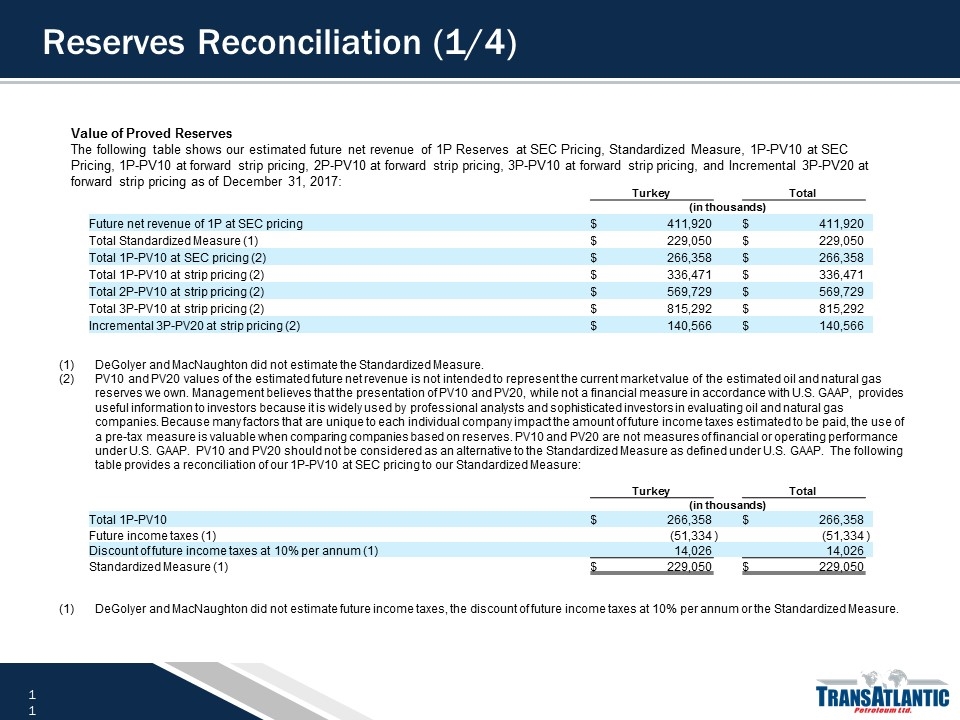
Reserves Reconciliation (1/4) DeGolyer and MacNaughton did not estimate the Standardized Measure. PV10 and PV20 values of the estimated future net revenue is not intended to represent the current market value of the estimated oil and natural gas reserves we own. Management believes that the presentation of PV10 and PV20, while not a financial measure in accordance with U.S. GAAP, provides useful information to investors because it is widely used by professional analysts and sophisticated investors in evaluating oil and natural gas companies. Because many factors that are unique to each individual company impact the amount of future income taxes estimated to be paid, the use of a pre-tax measure is valuable when comparing companies based on reserves. PV10 and PV20 are not measures of financial or operating performance under U.S. GAAP. PV10 and PV20 should not be considered as an alternative to the Standardized Measure as defined under U.S. GAAP. The following table provides a reconciliation of our 1P-PV10 at SEC pricing to our Standardized Measure: Value of Proved Reserves The following table shows our estimated future net revenue of 1P Reserves at SEC Pricing, Standardized Measure, 1P-PV10 at SEC Pricing, 1P-PV10 at forward strip pricing, 2P-PV10 at forward strip pricing, 3P-PV10 at forward strip pricing, and Incremental 3P-PV20 at forward strip pricing as of December 31, 2017: Turkey Total (in thousands) Future net revenue of 1P at SEC pricing $ 411,920 $ 411,920 Total Standardized Measure (1) $ 229,050 $ 229,050 Total 1P-PV10 at SEC pricing (2) $ 266,358 $ 266,358 Total 1P-PV10 at strip pricing (2) $ 336,471 $ 336,471 Total 2P-PV10 at strip pricing (2) $ 569,729 $ 569,729 Total 3P-PV10 at strip pricing (2) $ 815,292 $ 815,292 Incremental 3P-PV20 at strip pricing (2) $ 140,566 $ 140,566 DeGolyer and MacNaughton did not estimate future income taxes, the discount of future income taxes at 10% per annum or the Standardized Measure. Turkey Total (in thousands) Total 1P-PV10 $ 266,358 $ 266,358 Future income taxes (1) (51,334 ) (51,334 ) Discount of future income taxes at 10% per annum (1) 14,026 14,026 Standardized Measure (1) $ 229,050 $ 229,050
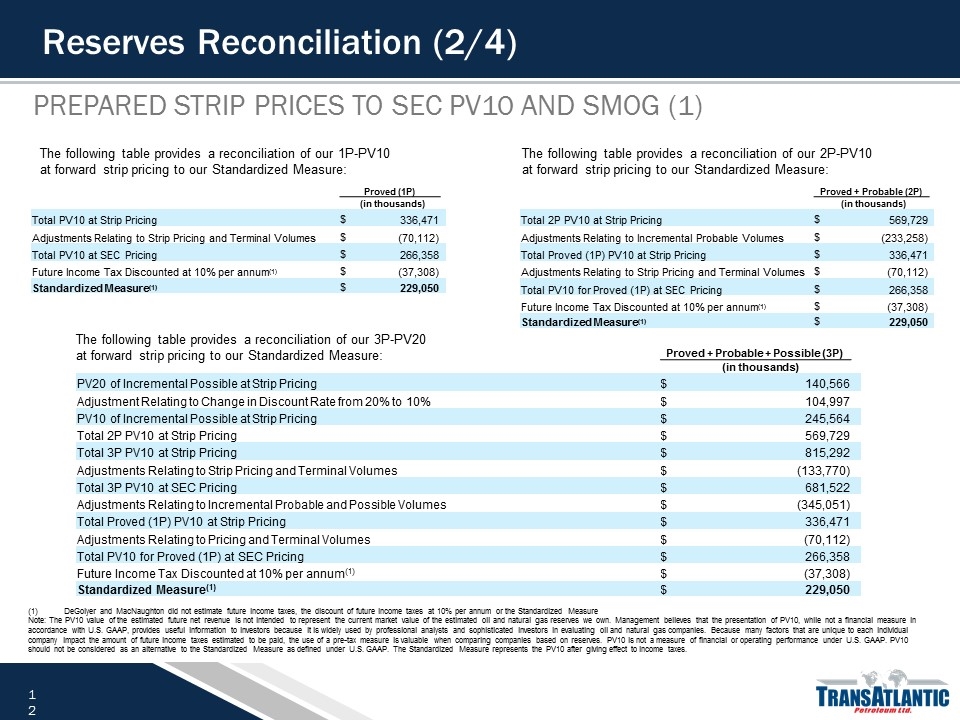
Reserves Reconciliation (2/4) Prepared Strip Prices to SEC PV10 and SMOG (1) DeGolyer and MacNaughton did not estimate future income taxes, the discount of future income taxes at 10% per annum or the Standardized Measure Note: The PV10 value of the estimated future net revenue is not intended to represent the current market value of the estimated oil and natural gas reserves we own. Management believes that the presentation of PV10, while not a financial measure in accordance with U.S. GAAP, provides useful information to investors because it is widely used by professional analysts and sophisticated investors in evaluating oil and natural gas companies. Because many factors that are unique to each individual company impact the amount of future income taxes estimated to be paid, the use of a pre-tax measure is valuable when comparing companies based on reserves. PV10 is not a measure of financial or operating performance under U.S. GAAP. PV10 should not be considered as an alternative to the Standardized Measure as defined under U.S. GAAP. The Standardized Measure represents the PV10 after giving effect to income taxes. Proved (1P) (in thousands) Total PV10 at Strip Pricing $ 336,471 Adjustments Relating to Strip Pricing and Terminal Volumes $ (70,112) Total PV10 at SEC Pricing $ 266,358 Future Income Tax Discounted at 10% per annum(1) $ (37,308) Standardized Measure(1) $ 229,050 Proved + Probable (2P) (in thousands) Total 2P PV10 at Strip Pricing $ 569,729 Adjustments Relating to Incremental Probable Volumes $ (233,258) Total Proved (1P) PV10 at Strip Pricing $ 336,471 Adjustments Relating to Strip Pricing and Terminal Volumes $ (70,112) Total PV10 for Proved (1P) at SEC Pricing $ 266,358 Future Income Tax Discounted at 10% per annum(1) $ (37,308) Standardized Measure(1) $ 229,050 Proved + Probable + Possible (3P) (in thousands) PV20 of Incremental Possible at Strip Pricing $ 140,566 Adjustment Relating to Change in Discount Rate from 20% to 10% $ 104,997 PV10 of Incremental Possible at Strip Pricing $ 245,564 Total 2P PV10 at Strip Pricing $ 569,729 Total 3P PV10 at Strip Pricing $ 815,292 Adjustments Relating to Strip Pricing and Terminal Volumes $ (133,770) Total 3P PV10 at SEC Pricing $ 681,522 Adjustments Relating to Incremental Probable and Possible Volumes $ (345,051) Total Proved (1P) PV10 at Strip Pricing $ 336,471 Adjustments Relating to Pricing and Terminal Volumes $ (70,112) Total PV10 for Proved (1P) at SEC Pricing $ 266,358 Future Income Tax Discounted at 10% per annum(1) $ (37,308) Standardized Measure(1) $ 229,050 The following table provides a reconciliation of our 1P-PV10 at forward strip pricing to our Standardized Measure: The following table provides a reconciliation of our 2P-PV10 at forward strip pricing to our Standardized Measure: The following table provides a reconciliation of our 3P-PV20 at forward strip pricing to our Standardized Measure:
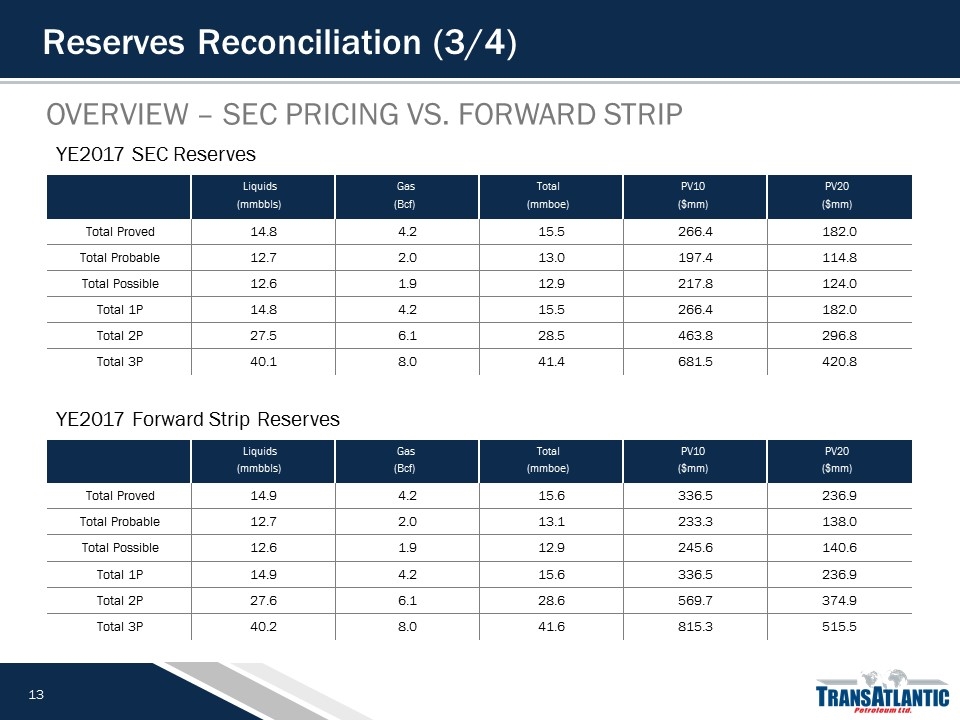
Reserves Reconciliation (3/4) Overview – SEC Pricing vs. Forward Strip YE2017 SEC Reserves YE2017 Forward Strip Reserves Liquids Gas Total PV10 PV20 (mmbbls) (Bcf) (mmboe) ($mm) ($mm) Total Proved 14.8 4.2 15.5 266.4 182.0 Total Probable 12.7 2.0 13.0 197.4 114.8 Total Possible 12.6 1.9 12.9 217.8 124.0 Total 1P 14.8 4.2 15.5 266.4 182.0 Total 2P 27.5 6.1 28.5 463.8 296.8 Total 3P 40.1 8.0 41.4 681.5 420.8 Liquids Gas Total PV10 PV20 (mmbbls) (Bcf) (mmboe) ($mm) ($mm) Total Proved 14.9 4.2 15.6 336.5 236.9 Total Probable 12.7 2.0 13.1 233.3 138.0 Total Possible 12.6 1.9 12.9 245.6 140.6 Total 1P 14.9 4.2 15.6 336.5 236.9 Total 2P 27.6 6.1 28.6 569.7 374.9 Total 3P 40.2 8.0 41.6 815.3 515.5
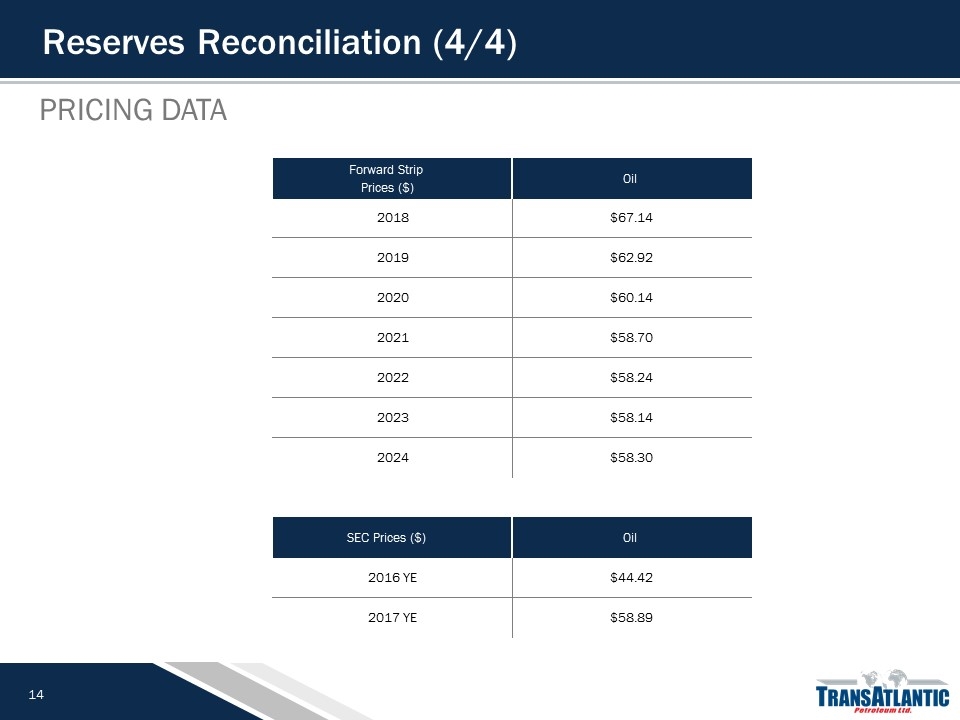
Reserves Reconciliation (4/4) Pricing Data Forward Strip Prices ($) Oil 2018 $67.14 2019 $62.92 2020 $60.14 2021 $58.70 2022 $58.24 2023 $58.14 2024 $58.30 SEC Prices ($) Oil 2016 YE $44.42 2017 YE $58.89


