2019 year end Corporate reserves update March 2020 Exhibit 99.2
DISCLAIMER Outlooks, projections, estimates, targets, and business plans in this presentation or any related subsequent discussions are forward-looking statements. Actual future results, including TransAtlantic Petroleum Ltd.’s own production growth and mix; financial results; the amount and mix of capital expenditures; resource additions and recoveries; finding and development costs; project and drilling plans, timing, costs, and capacities; revenue enhancements and cost efficiencies; industry margins; margin enhancements and integration benefits; and the impact of technology could differ materially due to a number of factors. These include market prices for natural gas, natural gas liquids, and oil products; estimates of reserves and economic assumptions; the ability to produce and transport natural gas, natural gas liquids, and oil; the results of exploration and development drilling and related activities; economic conditions in the countries and provinces in which TransAtlantic carries on business, especially economic slowdowns; actions by governmental authorities, receipt of required approvals, increases in taxes, legislative, and regulatory initiatives relating to fracture stimulation activities, changes in environmental and other regulations, and renegotiations of contracts; political uncertainty, including actions by insurgent groups or other conflict; the negotiation and closing of material contracts; shortages of drilling rigs, equipment, or oilfield services; and other factors discussed here and under the heading “Risk Factors" in TransAtlantic’s Annual Report on Form 10-K for the year ended December 31, 2018, and Quarterly Report on Form 10-Q for the quarterly period ended September 30, 2019, each of which is available on TransAtlantic’s website at www.transatlanticpetroleum.com and at www.sec.gov. See also TransAtlantic’s audited financial statements and the accompanying management discussion and analysis. Forward-looking statements are based on management’s knowledge and reasonable expectations on the date hereof, and TransAtlantic assumes no duty to update these statements contained in TransAtlantic’s Form 10-K as of any future date, except as required by law. The information set forth in this presentation does not constitute an offer, solicitation, or recommendation to sell or an offer to buy any securities of TransAtlantic. The information published herein is provided for informational purposes only. TransAtlantic makes no representation that the information and opinions expressed herein are accurate, complete, or current. The information contained herein is current as of the date hereof but may become outdated or subsequently may change. Nothing contained herein constitutes financial, legal, tax, or other advice. The SEC requires oil and gas companies, in their filings with the SEC, to disclose proved reserves that a company has demonstrated by actual production or conclusive formation tests to be economically and legally producible under existing economic and operating conditions. This presentation may use the terms “estimated ultimate recovery,” “EUR,” “probable,” “possible,” and “non-proven” reserves, “prospective resources” or “upside,” or other descriptions of volumes of resources or reserves potentially recoverable through additional drilling or recovery techniques. These estimates are by their nature more speculative than estimates of proved reserves and accordingly are subject to substantially greater risk of actually being realized by TransAtlantic. There is no certainty that any portion of estimated prospective resources will be discovered. If discovered, there is no certainty that it will be commercially viable to produce any portion of the estimated prospective resources. This presentation includes 1P, 2P, and 3P reserves based on a reserve report prepared by Degolyer & MacNaughton as of December 31, 2019 using forward strip pricing (“YE2019 D&M Strip-Pricing Reserve Report”) and a reserve report prepared by Degolyer & MacNaughton as of December 31, 2019 using SEC pricing (“YE2019 D&M SEC Reserve Report”). 1P reserves refer to proved reserves. 2P reserves refer to proved reserves plus probable reserves. 3P reserves refer to proved reserves plus probable reserves plus possible reserves. Proved reserves are those quantities of oil and natural gas, which, by analysis of geoscience and engineering data, can be estimated with reasonable certainty to be economically producible, from a given date forward, from known reservoirs, and under existing economic conditions, operating methods, and government regulations, prior to the time at which contracts providing the right to operate expire, unless evidence indicates that renewal is reasonably certain, regardless of whether deterministic or probabilistic methods are used for the estimation. The project to extract the hydrocarbons must have commenced or the operator must be reasonably certain that it will commence the project within a reasonable time. Probable reserves are inherently imprecise. When producing an estimate of the amount of oil and natural gas that is recoverable from a particular reservoir, an estimated quantity of probable reserves is an estimate of those additional reserves that are less certain to be recovered than proved reserves but which, together with proved reserves, are as likely as not to be recovered. When deterministic methods are used, it is as likely as not that actual remaining quantities recovered will exceed the sum of estimated proved plus probable reserves. When probabilistic methods are used, there should be at least a 50% probability that the actual quantities recovered will equal or exceed the proved plus probable reserves estimates. Possible reserves are also inherently imprecise. When producing an estimate of the amount of oil and natural gas that is recoverable from a particular reservoir, an estimated quantity of possible reserves is an estimate that might be achieved, but only under more favorable circumstances than are likely. When deterministic methods are used, the total quantities ultimately recovered from a project have a low probability of exceeding proved plus probable plus possible reserves. When probabilistic methods are used, there should be at least a 10% probability that the total quantities ultimately recovered will equal or exceed the proved plus probable plus possible reserves estimates. Note on PV10 and PV20: The present value of estimated future net revenues is an estimate of future net revenues from a property at the date indicated, without giving effect to derivative financial instrument activities, after deducting production and ad valorem taxes, future capital costs, abandonment costs, and operating expenses, but before deducting future federal income taxes. The PV10 future net revenues have been discounted at an annual rate of 10% and the PV20 future net revenues have been discounted at an annual rate of 20% to determine their “present value.” The present value is shown to indicate the effect of time on the value of the net revenue stream and should not be construed as being the fair market value of the properties or the oil and natural gas reserves TransAtlantic owns. Estimates have been made using constant oil and natural gas prices and operating and capital costs at the date indicated, at its acquisition date, or as otherwise indicated. TransAtlantic believes that the present value of estimated future net revenues before income taxes, while not a financial measure in accordance with GAAP, is an important financial measure used by investors and independent oil and natural gas producers for evaluating the relative significance of oil and natural gas properties and acquisitions because the tax characteristics of comparable companies can differ materially. PV10 and PV20 are not measures of financial or operating performance under GAAP. Neither PV10 nor PV20 should be considered as an alternative to the Standardized Measure as defined under GAAP. The Standardized Measure represents the PV10 after giving effect to income taxes. Note on BOE: BOE (barrel of oil equivalent) is derived by converting natural gas to oil in the ratio of six thousand cubic feet (MCF) of natural gas to one barrel (bbl) of oil. BOE may be misleading, particularly if used in isolation. A BOE conversion ratio of 6 Mcf:1 bbl is based on an energy equivalency conversion method primarily applicable at the burner tip and does not represent a value equivalency at the wellhead.
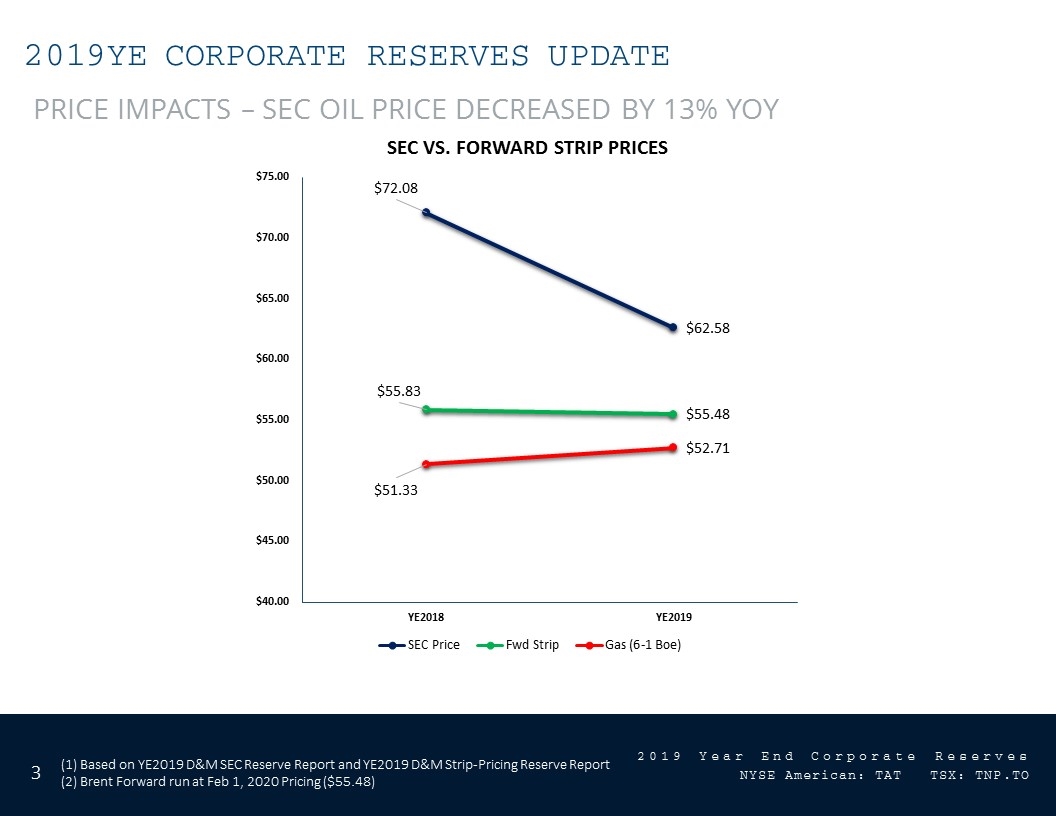
2019YE Corporate reserves update Price impacts – sec oil price decreased by 13% yoy (1) Based on YE2019 D&M SEC Reserve Report and YE2019 D&M Strip-Pricing Reserve Report (2) Brent Forward run at Feb 1, 2020 Pricing ($55.48)
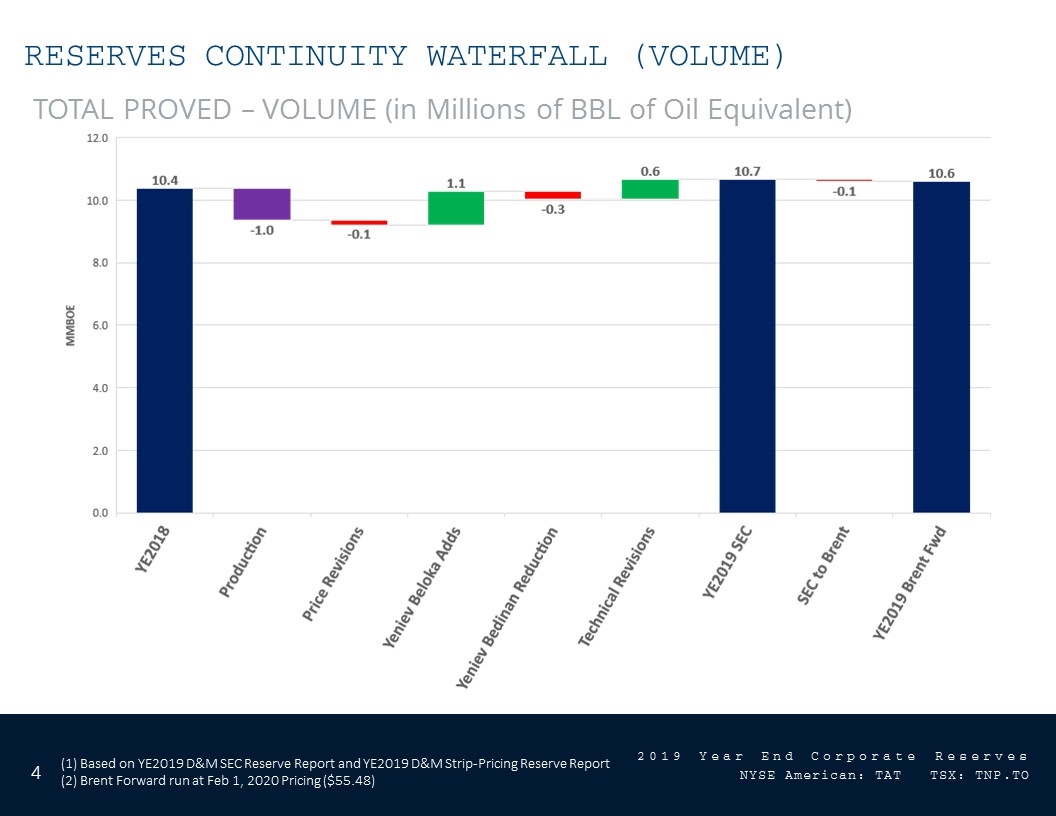
reserves continuity waterfall (volume) Total proved – volume (in Millions of BBL of Oil Equivalent) (1) Based on YE2019 D&M SEC Reserve Report and YE2019 D&M Strip-Pricing Reserve Report (2) Brent Forward run at Feb 1, 2020 Pricing ($55.48)
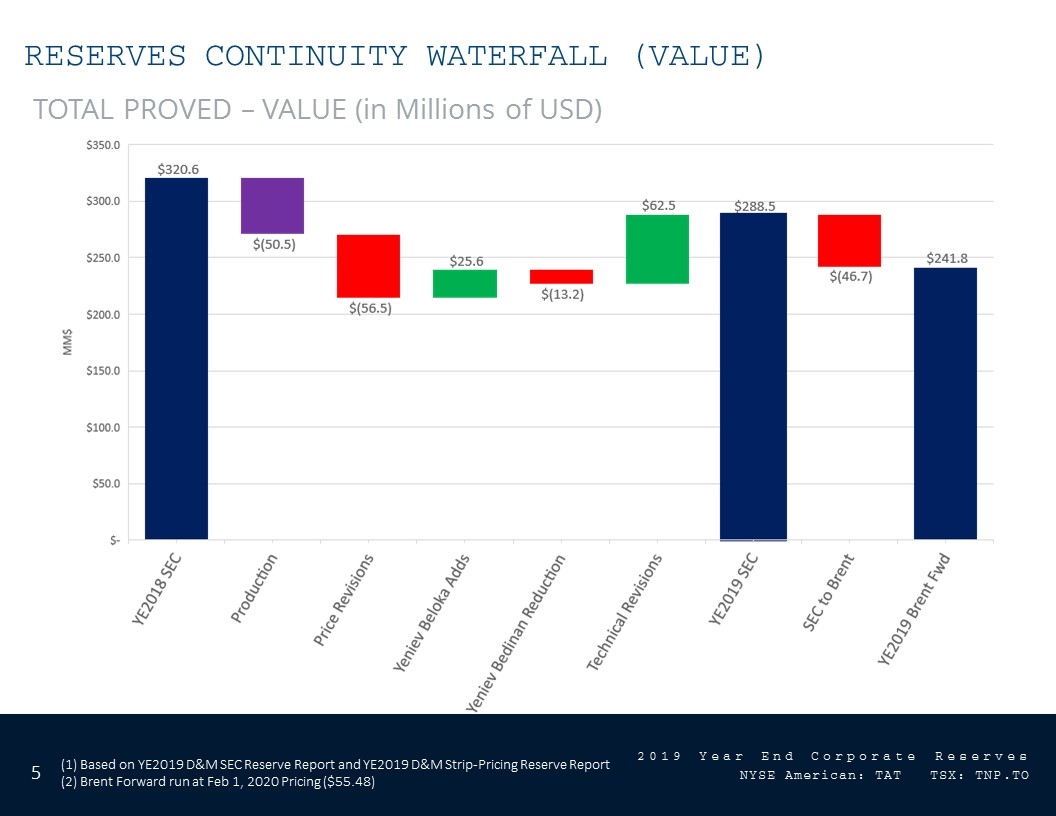
reserves continuity waterfall (vALUE) Total proved – Value (in Millions of USD) (1) Based on YE2019 D&M SEC Reserve Report and YE2019 D&M Strip-Pricing Reserve Report (2) Brent Forward run at Feb 1, 2020 Pricing ($55.48)
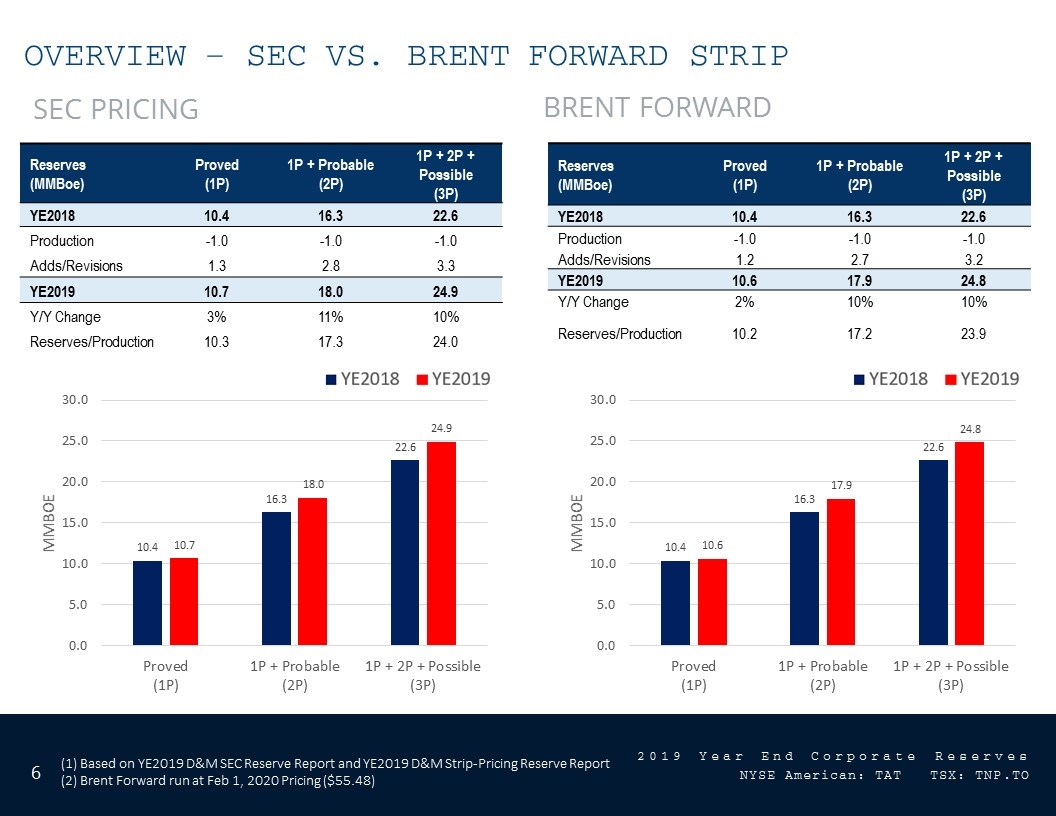
OVERVIEW – SEC VS. BRENT FORWARD STRIP Sec pricing Brent forward Reserves (MMBoe) Proved (1P) 1P + Probable (2P) 1P + 2P + Possible (3P) YE2018 10.4 16.3 22.6 Production -1.0 -1.0 -1.0 Adds/Revisions 1.3 2.8 3.3 YE2019 10.7 18.0 24.9 Y/Y Change 3% 11% 10% Reserves/Production 10.3 17.3 24.0 Reserves (MMBoe) Proved (1P) 1P + Probable (2P) 1P + 2P + Possible (3P) YE2018 10.4 16.3 22.6 Production -1.0 -1.0 -1.0 Adds/Revisions 1.2 2.7 3.2 YE2019 10.6 17.9 24.8 Y/Y Change 2% 10% 10% Reserves/Production 10.2 17.2 23.9 (1) Based on YE2019 D&M SEC Reserve Report and YE2019 D&M Strip-Pricing Reserve Report (2) Brent Forward run at Feb 1, 2020 Pricing ($55.48)
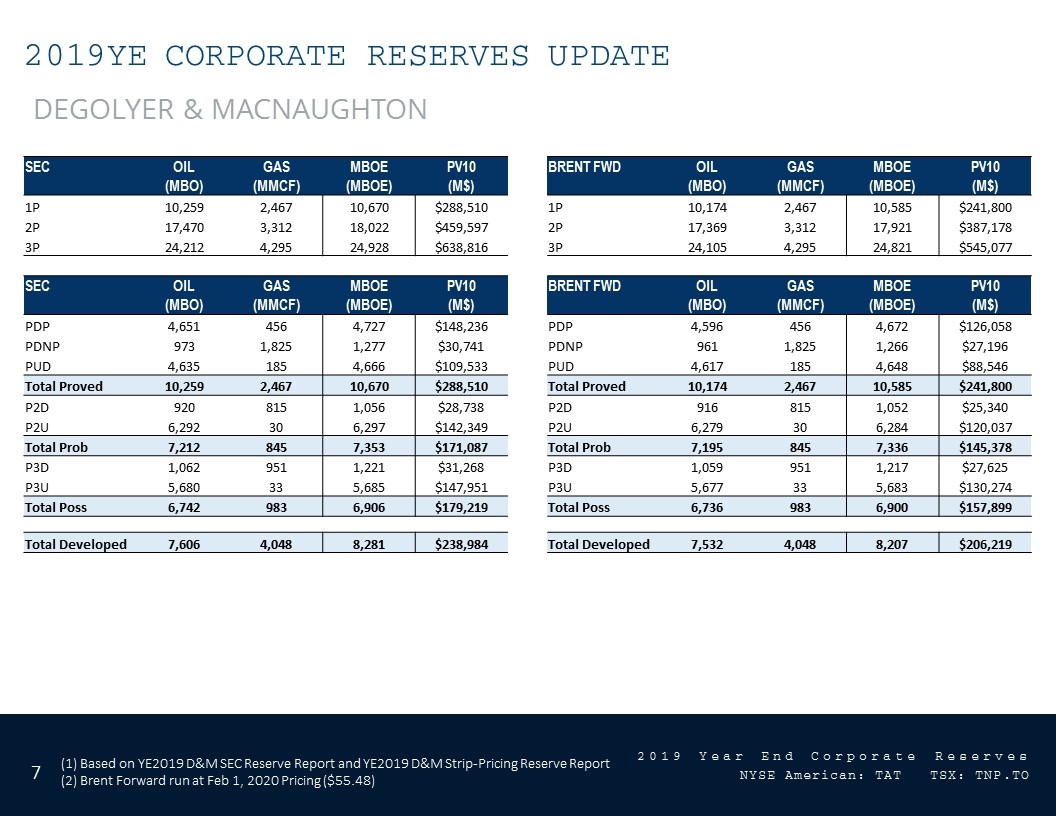
2019YE Corporate reserves update Degolyer & macnaughton SEC OIL GAS MBOE PV10 BRENT FWD OIL GAS MBOE PV10 (MBO) (MMCF) (MBOE) (M$) (MBO) (MMCF) (MBOE) (M$) 1P 10,259 2,467 10,670 $288,510 1P 10,174 2,467 10,585 $241,800 2P 17,470 3,312 18,022 $459,597 2P 17,369 3,312 17,921 $387,178 3P 24,212 4,295 24,928 $638,816 3P 24,105 4,295 24,821 $545,077 SEC OIL GAS MBOE PV10 BRENT FWD OIL GAS MBOE PV10 (MBO) (MMCF) (MBOE) (M$) (MBO) (MMCF) (MBOE) (M$) PDP 4,651 456 4,727 $148,236 PDP 4,596 456 4,672 $126,058 PDNP 973 1,825 1,277 $30,741 PDNP 961 1,825 1,266 $27,196 PUD 4,635 185 4,666 $109,533 PUD 4,617 185 4,648 $88,546 Total Proved 10,259 2,467 10,670 $288,510 Total Proved 10,174 2,467 10,585 $241,800 P2D 920 815 1,056 $28,738 P2D 916 815 1,052 $25,340 P2U 6,292 30 6,297 $142,349 P2U 6,279 30 6,284 $120,037 Total Prob 7,212 845 7,353 $171,087 Total Prob 7,195 845 7,336 $145,378 P3D 1,062 951 1,221 $31,268 P3D 1,059 951 1,217 $27,625 P3U 5,680 33 5,685 $147,951 P3U 5,677 33 5,683 $130,274 Total Poss 6,742 983 6,906 $179,219 Total Poss 6,736 983 6,900 $157,899 Total Developed 7,606 4,048 8,281 $238,984 Total Developed 7,532 4,048 8,207 $206,219 (1) Based on YE2019 D&M SEC Reserve Report and YE2019 D&M Strip-Pricing Reserve Report (2) Brent Forward run at Feb 1, 2020 Pricing ($55.48)
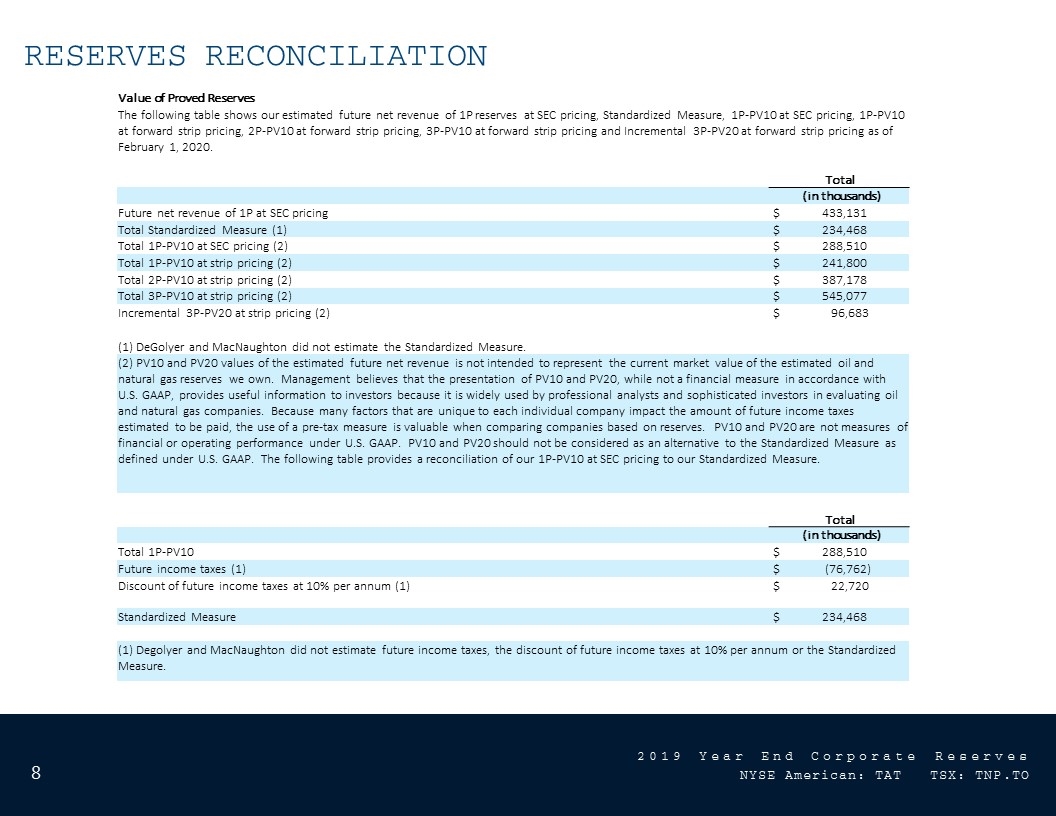
Reserves reconciliation Value of Proved Reserves The following table shows our estimated future net revenue of 1P reserves at SEC pricing, Standardized Measure, 1P-PV10 at SEC pricing, 1P-PV10 at forward strip pricing, 2P-PV10 at forward strip pricing, 3P-PV10 at forward strip pricing and Incremental 3P-PV20 at forward strip pricing as of February 1, 2020. Total (in thousands) Future net revenue of 1P at SEC pricing $ 433,131 Total Standardized Measure (1) $ 234,468 Total 1P-PV10 at SEC pricing (2) $ 288,510 Total 1P-PV10 at strip pricing (2) $ 241,800 Total 2P-PV10 at strip pricing (2) $ 387,178 Total 3P-PV10 at strip pricing (2) $ 545,077 Incremental 3P-PV20 at strip pricing (2) $ 96,683 (1) DeGolyer and MacNaughton did not estimate the Standardized Measure. (2) PV10 and PV20 values of the estimated future net revenue is not intended to represent the current market value of the estimated oil and natural gas reserves we own. Management believes that the presentation of PV10 and PV20, while not a financial measure in accordance with U.S. GAAP, provides useful information to investors because it is widely used by professional analysts and sophisticated investors in evaluating oil and natural gas companies. Because many factors that are unique to each individual company impact the amount of future income taxes estimated to be paid, the use of a pre-tax measure is valuable when comparing companies based on reserves. PV10 and PV20 are not measures of financial or operating performance under U.S. GAAP. PV10 and PV20 should not be considered as an alternative to the Standardized Measure as defined under U.S. GAAP. The following table provides a reconciliation of our 1P-PV10 at SEC pricing to our Standardized Measure. Total (in thousands) Total 1P-PV10 $ 288,510 Future income taxes (1) $ (76,762) Discount of future income taxes at 10% per annum (1) $ 22,720 Standardized Measure $ 234,468 (1) Degolyer and MacNaughton did not estimate future income taxes, the discount of future income taxes at 10% per annum or the Standardized Measure.
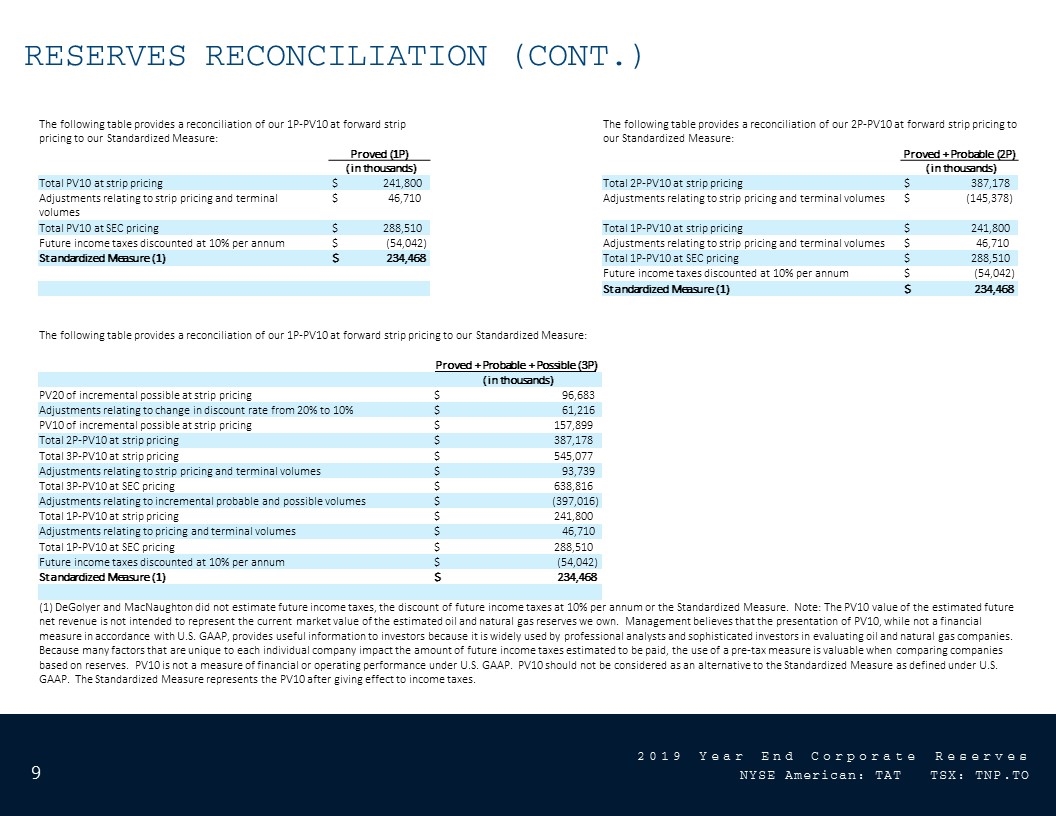
Reserves reconciliation (Cont.) The following table provides a reconciliation of our 1P-PV10 at forward strip pricing to our Standardized Measure: The following table provides a reconciliation of our 2P-PV10 at forward strip pricing to our Standardized Measure: Proved (1P) Proved + Probable (2P) (in thousands) (in thousands) Total PV10 at strip pricing $ 241,800 Total 2P-PV10 at strip pricing $ 387,178 Adjustments relating to strip pricing and terminal volumes $ 46,710 Adjustments relating to strip pricing and terminal volumes $ (145,378) Total PV10 at SEC pricing $ 288,510 Total 1P-PV10 at strip pricing $ 241,800 Future income taxes discounted at 10% per annum $ (54,042) Adjustments relating to strip pricing and terminal volumes $ 46,710 Standardized Measure (1) $ 234,468 Total 1P-PV10 at SEC pricing $ 288,510 Future income taxes discounted at 10% per annum $ (54,042) Standardized Measure (1) $ 234,468 The following table provides a reconciliation of our 1P-PV10 at forward strip pricing to our Standardized Measure: Proved + Probable + Possible (3P) (in thousands) PV20 of incremental possible at strip pricing $ 96,683 Adjustments relating to change in discount rate from 20% to 10% $ 61,216 PV10 of incremental possible at strip pricing $ 157,899 Total 2P-PV10 at strip pricing $ 387,178 Total 3P-PV10 at strip pricing $ 545,077 Adjustments relating to strip pricing and terminal volumes $ 93,739 Total 3P-PV10 at SEC pricing $ 638,816 Adjustments relating to incremental probable and possible volumes $ (397,016) Total 1P-PV10 at strip pricing $ 241,800 Adjustments relating to pricing and terminal volumes $ 46,710 Total 1P-PV10 at SEC pricing $ 288,510 Future income taxes discounted at 10% per annum $ (54,042) Standardized Measure (1) $ 234,468 (1) DeGolyer and MacNaughton did not estimate future income taxes, the discount of future income taxes at 10% per annum or the Standardized Measure. Note: The PV10 value of the estimated future net revenue is not intended to represent the current market value of the estimated oil and natural gas reserves we own. Management believes that the presentation of PV10, while not a financial measure in accordance with U.S. GAAP, provides useful information to investors because it is widely used by professional analysts and sophisticated investors in evaluating oil and natural gas companies. Because many factors that are unique to each individual company impact the amount of future income taxes estimated to be paid, the use of a pre-tax measure is valuable when comparing companies based on reserves. PV10 is not a measure of financial or operating performance under U.S. GAAP. PV10 should not be considered as an alternative to the Standardized Measure as defined under U.S. GAAP. The Standardized Measure represents the PV10 after giving effect to income taxes.


