UNITED STATES
SECURITIES AND EXCHANGE COMMISSION
Washington, D.C. 20549
FORM 10-K
FOR ANNUAL AND TRANSITION REPORTS
PURSUANT TO SECTIONS 13 OR 15(d) OF THE
SECURITIES EXCHANGE ACT OF 1934
| x | ANNUAL REPORT PURSUANT TO SECTION 13 OR 15(d) OF THE SECURITIES EXCHANGE ACT OF 1934 |
For the fiscal year ended December 31, 2006
OR
| ¨ | TRANSITION REPORT PURSUANT TO SECTION 13 OR 15(d) OF THE SECURITIES EXCHANGE ACT OF 1934 |
For the transition period from to
Commission file number 000-27501
The TriZetto Group, Inc.
(Exact Name of Registrant as Specified in Its Charter)
| | |
| Delaware | | 33-0761159 |
(State or Other Jurisdiction of Incorporation or Organization) | | (I.R.S. Employer Identification Number) |
| | |
567 San Nicolas Drive, Suite 360 Newport Beach, California | | 92660 |
| (Address of Principal Executive Offices) | | (Zip Code) |
Registrant’s telephone number, including area code: (949) 719-2200
Securities registered pursuant to Section 12(b) of the Act:
| | |
Title of Each Class | | Name of Each Exchange on Which Registered |
Common Stock, $0.001 par value Series A Junior Participating Stock, $0.001 par value | | The Nasdaq Global Select Market |
Securities registered pursuant to Section 12(g) of the Act:
None.
Indicate by check mark if the registrant is a well-known seasoned issuer as defined in Rule 405 of the Securities Act. Yes x No ¨
Indicate by check mark if the registrant is not required to file reports pursuant to Section 13 of 15(d) of the Act. Yes ¨ No x
Indicate by check mark whether the registrant: (1) has filed all reports required to be filed by Section 13 or 15(d) of the Securities Exchange Act of 1934 during the preceding 12 months (or for such shorter period that the registrant was required to file such reports), and (2) has been subject to such filing requirements for the past 90 days. Yes x No ¨
Indicate by check mark if disclosure of delinquent filers pursuant to Item 405 of Regulation S-K is not contained herein, and will not be contained, to the best of registrant’s knowledge, in definitive proxy or information statements incorporated by reference in Part III of this Form 10-K or any amendment to this Form 10-K. x
Indicate by check mark whether the registrant is a large accelerated filer, an accelerated filer or a non-accelerated filer (as defined in Exchange Act Rule 12b-2).
Large accelerated filer ¨ Accelerated filer x Non-accelerated filer ¨
Indicated by check mark whether the registrant is a shell company. Yes ¨ No x
As of June 30, 2006, the aggregate market value of voting stock held by non-affiliates of the registrant, based upon the closing sales price for the registrant’s Common Stock, as reported on the NASDAQ Stock Market, was $599.9 million. Shares of Common Stock held by each officer and director and by each person who owns 10% or more of the outstanding Common Stock have been excluded in that such persons may be deemed to be affiliates. This determination of affiliate status is not necessarily a conclusive determination for any other purpose.
The number of shares of the registrant’s Common Stock outstanding as of March 13, 2007 was45,205,070.
Documents Incorporated by Reference
Part III of this Report incorporates by reference information from the definitive Proxy Statement for the registrant’s 2007 Annual Meeting of Stockholders.
THE TRIZETTO GROUP, INC.
ANNUAL REPORT ON FORM 10-K
For the Fiscal Year Ended December 31, 2006
TABLE OF CONTENTS
CAUTIONARY STATEMENT
This report contains forward-looking statements that have been made pursuant to the provisions of the Private Securities Litigation Reform Act of 1995. These statements relate to future events or our future financial performance. In some cases, you can identify forward-looking statements by terminology such as “may,” “will,” “should,” “forecasts,” “expects,” “plans,” “anticipates,” “believes,” “estimates,” “predicts,” “potential,” or “continue” or the negative of such terms and other comparable terminology. These statements are only predictions. Actual events or results may differ materially. In evaluating these statements, you should specifically consider various factors, including the risks outlined in Item 1A under the caption “Risk Factors.” These factors may cause our actual events to differ materially from any forward-looking statement. We do not undertake to update any forward-looking statement.
PART I
OVERVIEW
TriZetto is distinctly focused on accelerating healthcare payers’ ability to lead the industry’s transformation by providing information technology solutions that enhance revenue growth, drive administrative efficiency and improve the cost and quality of care for their members. We offer a broad portfolio of proprietary information technology products and services targeted to the payer industry, which is comprised of health insurance plans and third party benefits administrators. These include:
| | • | | Enterprise core administration software, including Facets®, Facts™, QicLink™and QNXT, including add-on modules such as Workflow, HealthWeb®, HIPAA Privacy, CDH Account Management and FXI to provide enhanced functionality for advanced automation, web-based e-business, HIPAA regulations, consumer functionality and inoperability, respectively; |
| | • | | Cost and quality of care solutions, including our NetworX™ suite of products for provider network management and CareAdvance™ suite of care management solutions for both traditional and advanced care management; |
| | • | | Revenue enhancement software and administrative efficiency solutions for payers that service members in Medicare Advantage, Medicare Part D and Medicaid plans; |
| | • | | Software hosting services and select business process outsourcing services; and |
| | • | | Strategic, installation, and optimization consulting services. |
In the U.S. healthcare system, payers effectively balance the demands of all the different constituents in the healthcare system including employers, providers, consumers and brokers. As a result, payers are the central aggregation point for data from across the systems and payers are information-intensive businesses. New government regulations, shifting market trends and competition constantly pressure these payers to change their product offerings, business policies and processes. To enable these changes, payers must continually upgrade their information technology systems. Many payers, especially the largest, have traditionally developed their own information systems in-house. But, increasingly in recent years, payers have utilized commercial systems to reduce information technology and business costs, and accelerate their time-to-market for new products and enhanced efficiency.
TriZetto’s large footprint of payers and their members provides unique opportunities to develop and accelerate the adoption of new information technology solutions that will help payers respond and to capitalize on market changes. Including the company’s recent acquisitions, TriZetto technology touches approximately 120 million lives, or nearly half the insured population of the U.S.
We provide products and services to 362 unique customers, including our recent acquisitions, in the health plan and benefits administrator markets. In 2006, these markets represented 90% and 10% of our total revenue, respectively.
The TriZetto Group, Inc. was incorporated in Delaware in May 1997 with the merger of two organizations: System One, a provider of online electronic-funds transfer technology, and Margolis Health Enterprises, a provider of technology consulting to healthcare organizations. The combination created a company dedicated to healthcare information technology products and services. Initially, we focused upon providing hosted software services addressed primarily to the provider market. From 1998 to 2003, we increased our focus on the payer industry. In 2003, we initiated a strategic plan to concentrate exclusively on the payer market and to wind-down our provider business. We completed this plan in 2005 and no longer provide services to the provider market.
We completed our initial public offering in October 1999 and, since that time, have acquired 10 companies: Novalis Corporation, Finserv Health Care Systems, Inc., Healthcare Media Enterprises, Inc., Erisco Managed Care Technologies, Inc. (“Erisco”), Resource Information Management Systems, Inc. (“RIMS”), Infotrust Company, Diogenes, Inc., CareKey, Inc. (“CareKey”), Plan Data Management, Inc. (“PDM”), and Quality Care Solutions, Inc. (“QCSI”).
3
Of the 10 acquisitions, the Erisco and RIMS acquisitions completed in the fourth quarter of 2000, the CareKey acquisition completed in the fourth quarter of 2005, and the QCSI acquisition completed in the first quarter of 2007 were our most significant. Erisco’s main product, Facets® and QCSI’s main product, QNXT, are the leading administrative systems for managed health plans in the country. QicLink™, developed by RIMS, is the leading automated claims-processing system for benefits administrators. With these acquisitions, TriZetto obtained a customer base with more than 120 million enrollees (48% of the U.S. insured population) and attained a leadership position in two market segments of the payer industry, health plans and benefits administrators. The products developed by CareKey are proven applications and solutions for the rapidly growing consumer-directed healthcare segment.
FINANCIAL INFORMATION
Please refer to Item 6, “Selected Financial Data,” and Item 7, “Management’s Discussion and Analysis of Financial Condition and Results of Operations,” for a review of revenue, net income, and total assets for the last three years.
OUR STRATEGY
Rising healthcare costs and health insurance premiums are causing employers, as well as federal and state government programs, to shift more of the cost of healthcare benefits to consumers in the form of higher premium contributions, deductibles, co-insurance and co-payments. Since 2000, average premiums for family coverage in the United States increased 59%, while wages grew only 12%. Typical family out-of-pocket healthcare costs now exceed 10% of the average annual wage. As a result of increased personal spending on healthcare, healthcare consumers (i.e., employees and their family members, individuals, and retirees) are demanding better service, efficiency, and value from their health plan. This includes improved information regarding health care benefit and insurance coverage options, better information to determine the most efficient methods to fund out-of-pocket costs, real-time information regarding benefits eligibility and accessibility, accurate information at the point-of-service regarding out-of-pocket costs (i.e., patient or consumer financial responsibility), real-time information regarding healthcare fund balances and claims payment status, and increased comparative data and intelligence regarding healthcare provider cost (i.e., pricing) and quality.
We believe that payers will play a central and leading role in the evolution of the U.S. healthcare industry. We also believe that most health plans and benefits administrators must evolve and improve their technology infrastructures, software applications, and business processes to compete in this changing healthcare marketplace. We recognize that the evolution of the healthcare industry to a more retail-like environment may be gradual or in steps. Our strategy, therefore, is to protect our existing customers’ investment in our products and services through ongoing research and development that allows for systematic upgrades of existing capabilities, while providing both existing and new payer customers with innovative information technology products and services that help them strengthen their IT capabilities, and transform their businesses to prosper in this more consumer-centric environment. Key elements of our strategy include:
| | • | | Help customers anticipate change and migrate toward a successful future. In 2006, we continued to articulate our vision of the future for health plans and benefits administrators. In 2003, we launched and named these “futures” concepts Health Plan 5.0 and Benefits Administrator 5.0. “5.0” continues to be the centerpiece of our sales strategy, supported by TriZetto’s extensive portfolio of solutions and a clear migration path for customers. Over the course of 2006, we introduced additional products and services that provide our customers with the solution components to achieve level or version “5.0.” |
| | • | | Offer a compelling value proposition. We are focused on offering a quantified, compelling value proposition that includes such advantages as enhancing payers’ revenue growth, driving their administrative efficiency and improving the cost and quality of care for their members. Other benefits include reduced and more predictable information technology costs, more cost effective business processes, lower administrative costs, lower medical costs, less risk and more rapid return on investment, and faster business transformation. Our internal estimates, based on industry benchmarks and customer data, show that return on investment increases with the use of our proprietary software in combination with one or more of our outsourced services. |
| | • | | Offer market-leading enterprise administration software for health plans and benefits administrators. As some of the most information-intensive businesses in the U.S., payers spend about 11% of the premiums they collect on administration activities. Efficient and accurate enterprise administration systems are critical to success. In 2003, we introduced new versions of both Facets Extended Enterprise™ (or Facets e2™) and QicLink Extended Enterprise (QicLink e2™) to the marketplace. Facets e2™ represented a major expansion of our flagship Facets® enterprise administration software for health plans. Facets e2™ provides significant new business and technology enhancements aimed at helping health plans meet emerging market demands, including customer-driven market requirements, integrated e-business functionality, regulatory compliance, and advanced open architecture and web services technologies. QicLink e2™ represented a new generation of our leading QicLink™ administration software for third-party benefits administrators, with similar consumer-centric enhancements, as well as an enhanced user interface. In 2006, new releases of these systems included new features, functionality and benefits for payers. These products continue to be our flagship core |
4
| | enterprise solutions. The acquisition of QCSI’s QNXT in January 2007 further expands TriZetto’s enterprise administration solutions. |
| | • | | Offer innovative enterprise cost and quality of care application.Payers spend an average of 86% of premiums collected on the cost of care for members. As the economics of running a plan started to shift in 2005 and 2006, payers began looking to new ways to cut waste and improve care.In early 2004, TriZetto partnered with CareKey, Inc. to offer new cost and quality of care solutions to its payer customers. In December 2005, TriZetto acquired CareKey. Today, the company is unique in offering integrated solutions that address both the unit cost of care as well as the volume usage. TriZetto’s suite of cost and quality of care solutions are complementary to our enterprise software solutions and allow us to help payers address the vast majority of healthcare medical costs not focused solely on health plan administration activities. TriZetto’s NetworX Pricer™ and NetworX Modeler™ applications allow health plans to improve the provider contracting process, as well as to automate the administration of these provider contracts to reduce the aggregate unit cost of care. Our CareAdvance Enterprise™ suite of advanced care management solutions addresses traditional utilization, case and disease management, as well as provides secure, portable and personalized health records to facilitate proactive population management. By improving patient wellness, these solutions better control the total usage of healthcare resources and reduce payers’ aggregate usage-driven costs of care for members. While these applications are architecturally engineered to most easily integrate with other TriZetto products such as Facets®, they are also of high value to customers who run enterprise administration systems not developed by TriZetto. |
| | • | | Enhance the value of our core enterprise technology with a variety of add-on software solutions and a continuum of services. In addition to offering leading enterprise administration and care solutions, TriZetto has created a number of high-value add-on systems that increase the performance of TriZetto systems and extend the value and return on investment for customers. TriZetto’s enterprise systems are very large applications that require significant work to install and optimize. Like many other enterprise software companies, TriZetto offers complementary services that assist customers in achieving business success, including: professional services, or consulting, for installation and optimization of the company’s software. For customers who desire to reduce their data center or overall processing costs, TriZetto also offers software hosting services and business process outsourcing services. These typically are sold as add-ons following the sale of TriZetto software. |
| | • | | Organize products and services around the customer’s main business cycles. Our solutions are aligned with the way our customers operate internally. Our individual products and services, and complete solutions address the main business cycles of a health plan, which are: product development, revenue management, reimbursement management, customer service, network management, care management, risk management, and general finance and administration. Benefits administrators have largely similar business cycles. |
| | • | | Leverage our strategic relationships. We leverage our current strategic relationships and enter into new relationships to expand our customer base and service offerings. We have established co-marketing and sales arrangements with third-party systems integrators and software vendors. As our customer base grows, we intend to expand and strengthen these relationships. |
| | • | | Selectively pursue acquisitions. We continually evaluate acquisitions of companies that could expand our market share, product offerings or our technical capabilities. Since our initial public offering in 1999, we have made 10 acquisitions. We may pursue additional acquisitions that we believe create shareholder value. |
OUR PRODUCTS AND SERVICES
TriZetto’s mission is to be the premier technology provider focused on healthcare payers. We have historically been a leading core administration company, and through acquisitions have expanded our capabilities. We have targeted five strategic areas that will drive healthcare changes including enterprise core administration, care management, network management, consumer retail healthcare and government programs.
In 2006, we derived approximately 47% of our total revenue from license and maintenance fees for our proprietary enterprise core administration software. Our Facets®, Facts™ and QicLink™ applications are recognized in their respective markets for providing advanced solutions that enhance revenue growth, drive administrative efficiencies and improve the cost and quality of care.
Out of our total revenue in 2006, 2005, and 2004, we spent 15%, 14%, and 14% respectively, on software development (expensed and capitalized), primarily for our proprietary software products.
Enterprise Core Administration Software
Facets®. Facets® is a comprehensive, flexible, scalable, production-proven, enterprise-wide core administration solution for healthcare payers. Facets® provides a functionally rich set of modules that allow health care payers to meet their comprehensive business requirements—across claims processing, claims re-pricing, capitation/risk fund accounting, premium billing, provider
5
network management, group/membership administration, referral management, hospital and medical pre-authorization, case management, customer service, and electronic data interchange.
Facets® can also be combined with complementary software to address the enterprise-wide needs of a managed care organization. Facets® has been expanded through alliances with complementary solutions for physician credentialing, document imaging, workflow management, data warehousing, and decision support.
Facets® is available to customers on a hosted or non-hosted basis; it includes core functionality and add on modules that provide the following features and benefits for health plans:
| | • | | Flexible, integrated technology to support multiple lines of business and in-depth functionality which provide for the essentials of health plan administration; |
| | • | | Simplified entry of benefit plan information; |
| | • | | Enhanced views of customer service data; |
| | • | | Integrated HIPAA functionality to satisfy standard electronic transactions and privacy regulations; |
| | • | | Consumer directed healthcare, Medicare and Managed Medicaid solutions; |
| | • | | Functions to support complex provider contracts and automated pricing of claims; |
| | • | | Integrated Workflow for claims, customer service and group administration |
| | • | | Extended integration tools to enable customers to access key business logic |
| | • | | Extensive use of Service-Oriented Architecture (SOA) that emphasizes Web-enabled interoperability to simplify integration of third-party applications; and |
| | • | | Choice of leading databases — Oracle, Microsoft SQL and Sybase. |
At December 31, 2006, we had 74 implementations of Facets® at customers comprising approximately 80 million member lives under contract. Many customers have purchased or are updating to Facets®4.3 and 4.4 to support consumer directed health plans, changes in NPI and workflow improvements. These upgrades are included in customers’ annual release fees. In addition, unspecified upgrades generate opportunities to sell consulting and other services to assist with the upgrades, as well as add-on modules that work exclusively with this new version of Facets®. In 2006, TriZetto Professional Services created a new Upgrade Service exclusively focused on helping health plans upgrade Facets® to a newer version to take advantage of the new capabilities.
Facts™. Introduced in 1980, Facts™ is designed for the indemnity insurance market, specifically managed indemnity, and group insurance. Facts™ software, which we acquired in our acquisition of Erisco, is a legacy software application which is used for the essential administrative transactions of an indemnity plan, including enrollment, rating and premium calculation, billing, and claims processing. At December 31, 2006, we had 33 Facts™ customers totaling more than 48.5 million lives.
QicLink™. We believe that QicLink™ is the nation’s most widely-used automated claims administration technology for benefits administrators. Its flexible design is well suited for third party administrators, as well as organizations that self-fund or self-administer their health benefits. QicLink™ is a full-functioned enterprise system that handles enrollment, customer service, claims adjudication, billing and accounts receivable, re-pricing, and payment process, and is available to customers on a licensed or hosted basis. Recent product releases include functionality improvements designed for the consumer-directed market, debit card processing expanded auto adjudication and web customer service, and technology improvements such as the introduction of the Microsoft.NET framework. At December 31, 2006, we had 135 QicLink™ customers, totaling more than 7.6 million lives.
Workflow. The add-on Workflow application for Facets e2™ automates manual processes and streamlines workflows, helping health plans to reduce claims turnaround times, improve customer response and facilitate the creation of employer groups. With Facets e2™ Workflow, claims are prioritized and routed automatically according to rules established by the plan’s business staff. Faster claims turnaround times allow health plans to realize lower overall operating costs, as well as nearly immediate return on investment through prompt-pay discounts. Facets e2™ Workflow functionality for Customer Service focuses on the management of work items that are not resolved upon initial contact with customer service representative. Facets e2™ Workflow functionality for Group Administration allows customers to administer the creation of new groups and facilitates the group renewal process. The application gives health plans a competitive advantage: faster, more accurate claims adjudication and reduced customer response time, which translates directly into improved service for plan members and providers.
6
DirectLink™.DirectLink™ was added to TriZetto’s component offerings in November 2004, built around technology from the acquisition of Diogenes, Inc. DirectLink™ helps payers reduce their dependence on clearinghouses and exchange transactions with providers, employers, and other constituents directly over the Internet – at a fraction of the cost of clearinghouse fees. The technology provides point-to-point connectivity and cutting-edge security features, including encryption, authentication, and tamper protection, which exceed the government’s HIPAA security guidelines. DirectLink™ is designed to be easy to use and can be remotely deployed and installed via the Internet, right to the desktop.
Cost and Quality of Care.As cost and quality of care issues move to center stage, for health plans, the ability to automate care and provider management becomes key to improving care outcomes and decrease costs. TriZetto offers solutions for both care management and network management.
Care management
Health plans are recognizing that care management will quickly become a required competency for connecting to members in an increasingly consumer-retail world of healthcare. The ability to keep the well from getting sick, to keep the sick out of the hospital and to help the hospitalized recover quickly will reduce overall medical costs. TriZetto offers CareAdvance Enterprise™ to address both personal health records for the consumers and health management for the health plans.
CareAdvance Enterprise™. Until 2004, the majority of TriZetto’s solutions focused on payers’ administrative costs. In 2004, TriZetto partnered with CareKey to offer the CareAdvance™ suite of care management solutions. TriZetto completed its acquisition of CareKey in December 2005 and began marketing the CareAdvance suite as TriZetto CareAdvance Enterprise™. TriZetto CareAdvance Enterprise™ automates all aspects of care management, including: member identification and assessment; guideline-based care planning; member and provider communications; task and team management; ongoing member monitoring, education and care coaching; and multi-stakeholder granular reporting for a variety of constituents. The system integrates with TriZetto’s Facets® administrative system as well as other core administration systems to provide real-time access to member administrative data including claims, eligibility, benefits and authorizations. CareAdvance Enterprise™ extends effective care to more members and allows a health plan to serve all its members’ medical management needs on one platform, including catastrophic care coordination, chronic disease management, wellness, and family care.
Health plans can license and host the care management enterprise software themselves or have it hosted through TriZetto’s Hosting Services. Health plans can also use TriZetto Professional Services to implement and optimize their care management operations. Specific services include: implementation, business process engineering, health program development and launch, and technology and application optimization.
Network management
As cost and quality issues move to center stage for health plans, the ability to automate provider networks, including the contracting and payment cycle becomes key to reducing care costs. Changes to a provider contract by 1% can result in net increases or decreases of millions to a health plan’s bottom line. Increasingly complex contracts and intense financial pressures have made network management critical to a health plan’s success.
NetworX™. NetworX™ was the first enterprise-wide management system and claims re-pricing solution for preferred provider organizations. The NetworX™ product line has been expanded to include a suite of products that addresses the pricing needs of not only PPOs, but also the requirements of health plans for automated pricing of complex facility claims and modeling of contracts. NetworX Pricer™ is a specialized component application, which automates the claims pricing process for health plans. This product is sold as a separate application that can be interfaced to legacy administration systems, as well as to Facets e2™. The NetworX Modeler™ product is a standalone application to support the automated modeling and analysis of contracts to help health plans negotiate with providers in their network. NetworX Pricer™ and NetworX Modeler™ have an innovative interface, which allows users to share contract data between the two systems. NetworX™ complements ClaimsExchange™, a hosted application service, which provides Internet connections that allow preferred provider organizations and healthcare claims payers to exchange claim information online.
Health plans can license the network management software or host it through TriZetto’s Hosting Services. Health plans can also use TriZetto Professional Services to implement their network management operations. Specific services include implementation, contract loading third-party interface development, and optimization.
7
Market Solutions
Two pervasive market drivers are driving dramatic changes in healthcare today:
| | • | | A surge in government healthcare programs as baby boomers drop out of private plans and into Medicare programs while the Medicaid-eligible population grows |
| | • | | Continued pressure on the consumer to pay more of individual healthcare costs to offset the rapidly increasing costs |
TriZetto has formed two market solutions groups to help drive the technological transformation needed to support government and consumer programs.
Retail Healthcare Solutions
A change that started with high deductible health plans, the retail healthcare movement is rapidly changing how payers interact with their consumer, provider, broker and employer constituents. TriZetto’s Consumer Retail Healthcare Solutions combine our traditional technology solutions with services and third-party applications. Specific retail healthcare solutions include:
Fund Management.Combining Facets® CDH Account Management Module, Metavante’s Benefits Card Platform and financial services, TriZetto’s Fund Management solution enables Facets® users to administer FSA, HRA and HSA plans on the Facets® platform. Our pre-integrated solutions enables debit card access for FSA, HRA and HSA accounts via a single card. Through Metavante, the fund management solution provides integration with ACS/Mellon, HAS Bank, and other preferred financial institutions, for “one-step” HAS account management. Members can track HSA account spending and manage fund investments while benefiting from the health plan’s education, online services and enrollment capabilities.
HealthWeb®. HealthWeb® allows health plans to exchange information and conduct business with physician groups, members, employers, and brokers on a secure basis over the Internet. HealthWeb® is installed on the health plan’s web servers or offered on a hosted basis and then configured according to customer preferences. The HealthWeb® applications are easy to use and personalized for each customer, providing access to the business applications and content needed to perform typical healthcare tasks. HealthWeb® modules are designed to manage online eligibility, authorizations, referrals, benefit verification, claims status, claims adjudication, and many other transactions benefiting physician offices. The modules also support enrollment, billing, benefit cost modeling, demographic changes, primary care physician selection, identification card requests, and other transactions for employers, brokers, and health plan members.
Provider POS Direct. Health plans can use this integrated software solution to enable providers to calculate real-time patient liability or fully adjudicate a claim in real-time before the patient leaves the provider’s office. Provider POS Direct helps providers reduce costs associated with growing accounts receivable and collections by allowing the provider to collect true payment at the time of service.
Professional Services.TriZetto offers a suite of services specifically for Retail Healthcare including Retail Readiness, Implementation and Optimization. Retail Readiness Services combine strategic planning, business process engineering and implementation services to help a health plan ready its operations to support retail solutions, expanding beyond pure technology implementation.
Government Programs
TriZetto offers solutions that assist payers as they compete in the rapidly growing Government programs marketplace. With the influx of new members through the aging of the baby-boomers and the passage of the Medicare Modernization Act providing prescription drug coverage for seniors, plans have entered this marketplace in large numbers. TriZetto government solutions, which are built on our core products, allow our customers to expand their offerings to include Medicare Part D, Medicare Advantage and Managed Medicaid.
Medicare and Medicare Part D.Building on its Facets® Core Administration platform, TriZetto offers targeted solutions for Managed Medicare and Medicare Part D. TriZetto provides core administration software along with Care Management and Network management tools to assist a plan’s efforts to control their administrative costs while providing high quality and cost effective care for their seniors. Our FastTrak solution integrates Facets®, Hosting Services and BPO to implement a Medicare or Medicare Part D solution in six months. In addition to implementing and optimizing Facets® for the Medicare and Medicare Part D business lines, TriZetto also offers a CMS Monitoring Service in which Medicare-knowledgeable TriZetto professionals monitor daily changes in CMS requirements and identify the ramifications of those changes on the health plan’s operations.
Medicaid.TriZetto’s Medicaid solutions can efficiently handle claims processing as well as enrollment, medical-management and workflow processes for Medicaid membership. We continue to enhance our solution to accommodate the evolving Medicaid
8
reporting requirements and other administrative demands. Health plans can purchase these solutions in a license, hosted or BPO option, including an integrated solution—FastTrak—that implements in six months.
PDM.In 2006, TriZetto acquired Plan Data Management, the leading business solutions company to the Medicare Advantage industry. PDM provides four key Medicare Advantage solutions including enrollment, data validation and submission, reconciliation, and revenue optimization. Solutions include:
E*ENRL. Includes the steps required to enroll and disenroll members including interfacing to the CMS system for Medicare Advantage and Part D business lines.
E*DATA Module 1. Part of the Data Validation and Submission suite, E*DATA Module 1 submits, tracks and provides the tools to correct and resubmit medical data and encounter data.
E*DATA Module 2. Identifies, from claims data, diagnoses that may indicate the presence of other conditions that may ultimately affect CMS payment and supplies the necessary reporting to allow a payer to submit additional confirmed diagnoses to CMS.
E*RxEVENT. Part of the Data Validation and Submission suite, E*RxEVENT submits, tracks and provides the tools to correct and resubmit pharmacy event data to CMS.
Outsourced Business Services
In 2006, we derived approximately 25% of our total revenue from outsourced business services. Our outsourced business services fall into two categories, software hosting and application management and business process outsourcing, both of which are described in more detail below.
Software Hosting and Application Management. TriZetto Hosting Services include integrating, hosting, monitoring, and managing our proprietary software applications alongside other software applications from third party vendors. We deliver software on a cost-predictable subscription basis, through multi-year contracts that include service levels.
TriZetto Hosting Services include implementing, hosting and supporting Facets®, CareAdvance Enterprise™, HealthWeb®, NetworX™, QicLink™ and the third-party applications with which these systems interface. Dedicated teams provide deep knowledge in technical architecture, application support, performance and tuning, operations and release management. The data center operates 24x7x365 and offers a Class 5 (highest level) data center that includes disaster recovery capabilities that support HIPAA and internal control requirements.
Whether adding new members, or adding care and network management capability, TriZetto’s hosting customers turn to us to help them align their strategic and business initiatives. Using TriZetto’s Hosting Services, health plans can deliver new products to market faster and better manage capacity fluctuations, provide higher service levels and focus IT resources on strategic initiatives rather than day-to-day operations.
TriZetto’s hosted solutions provide complete, professionally managed application management and customization that includes desktop and network connections, software applications, specialized third-party software, information management access and sophisticated reporting capabilities to aid in data analysis and decision making. Customers can choose the combination of our products and services to best meet their business requirements including:
Hosting.A comprehensive solution that works for health plans of all sizes. TriZetto Hosting Services include best-practice implementation, and management and support of TriZetto’s products. Standard packages include monitoring and reporting of customers’ equipment, telecommunications, network services and disaster recovery. Also included is the management of daily batch scheduling, reporting, and interfaces to business-critical third-party applications.
On Demand Environments.These services provide pre-configured environments run by experienced Facets® professionals—to help customers jumpstart their product configuration, testing and training activities, and deliver more features to the market this year than current resources allow.
Disaster Recovery.Because compliance is key to any health plan’s operations, TriZetto also offers multiple disaster recovery options including a Class 5 (highest level) data center. This facility incorporates advanced technology to ensure the maximum possible disaster preparedness. It includes features such as redundant connectivity, cooling, power sources, generator and fuel systems. TriZetto data centers are staffed 24x7x365 by Facets® experts who know how to recover Facets® more quickly and efficiently than companies that provide only equipment and floor space.
9
InfoTrust®.The TriZetto Cyber Site also incorporates its powerful InfoTrust® methodology to allow health plans to use recovery equipment as a pre-production model environment for application testing. With InfoTrust®, TriZetto provides servers and applications as a non-production environment. If a disaster occurs, TriZetto fails over to these environments to recover customers’ applications in committed recovery times. This “double use” methodology provides a more cost effective solution for health plans because it minimizes equipment needs.
Vendor Partner Relationships. In order to provide our customers with accessibility to other specialty software applications that run integrated and alongside TriZetto solutions, we have acquired rights to license and/or deploy numerous commercially available software applications from a variety of healthcare and other software vendors. These relationships range from perpetual, reusable software licenses and contracts to preferred installer agreements to informal co-marketing arrangements. We enter into relationships with software vendors in order to offer our customers a variety of solutions tailored to their unique information technology needs. Our relationships with our vendor partners are designed to provide both parties with numerous mutual benefits.
Business Process Outsourcing (BPO). To complement our software hosting services, we also provide health plans and benefits administrators with transaction processing services for typical back office functions, including claims, billing, and enrollment. Customers typically outsource to us for the following reasons: to improve or maintain service, for more predictable costs, to take advantage of our larger scale, to reduce risk through our performance guarantees, to gain access to our technical and healthcare business expertise, to increase speed-to-market, to ensure business continuity, and to become HIPAA compliant.
Our business process outsourcing services include:
| | • | | Benefit and Provider Configuration Rule Set-Up. We configure, and can maintain, the customer’s software according to the customer’s specific benefit plans and provider payment arrangements. |
| | • | | Document Imaging/Electronic Data Interchange (EDI) Processing. We accept and process claim forms, enrollment documents and other documents submitted via paper or EDI, and scan all images for electronic retrieval. |
| | • | | Medical, Dental, and Specialty Claims Processing. We process claims submitted for services under a variety of products and lines of business, adjust payments, and coordinate benefits. We also generate, print, and distribute claims payment checks and remittance notices to appropriate claimants and to health plan members. |
| | • | | Membership and Enrollment Processing. We set up employer group and individual membership information and process transactions regarding benefit plan selection, assignment of primary care physicians, and membership changes. We also issue member identification cards and perform other related administrative tasks. |
| | • | | Premium Billing. We generate, print, and mail invoices, post payments received on behalf of the health plan, and reconcile employer group and individual member accounts against billed amounts. |
| | • | | Print and Mailing Services. We print and mail functional area output documents such as enrollment cards, claims payment checks, remittance notices, premium invoices, broker commission checks, and capitation payments along with supporting documentation. |
| | • | | Business Continuity Services. We have facilities and personnel available to assist customers using our proprietary products to meet business processing requirements in the event of a loss of a customer site. |
Health plans can purchase these services on a retainer or project basis. These business process outsourcing services are generally provided in our centralized processing locations. Approximately 200 employees are located at our various processing sites, providing services for customers using our Facets®, QicLink™, and other proprietary and third-party software systems.
Professional Services
We derived approximately 28% of our revenue from professional services in 2006, mainly from consulting and implementations associated with our proprietary software, software hosting, and other outsourcing contracts. As of December 31, 2006, we employed approximately 250 professional services personnel. Our professional services team helps our customers enhance revenue growth, drive administrative efficiencies and improve the cost and quality of care by implementing and optimizing TriZetto solutions. Our team provides expertise in all aspects of TriZetto’s proprietary software products, especially Facets®, CareAdvance™, QicLink™, HealthWeb®, HIPAA Gateway, and NetworX™, through onsite services, remote support, and customer training in four key areas:
Product Installation.Product Installation includes a set of pre-bundled services to help a health plan install a TriZetto application. Services include: product training, environment setup, product installation, and project planning and configuration design. Often this phase includes assessments for third-party interface development, business process engineering and data conversion. The by-
10
product of this phase is a correctly installed product, and a realistic implementation plan that identifies all of the critical success factors and resource constraints to take a technology from installation through operational use.
Customization.To take full advantage of TriZetto applications, health plans typically customize them to meet their unique operational needs. Customization services include software development (design, coding and testing) of interfaces and extensions to third-party applications; Facets® configuration; application and technology architecture integration planning; test planning, report development and additional product training. TriZetto professional services team members are experienced in both our applications and healthcare operations. This experience drives faster and more accurate customizations, saves time and money, and reduces the risk of a complex system implementation.
Deployment.In the Deployment phase, health plans move our applications into operations. This typically requires converting legacy data to our new applications, testing the application, training the trainer, training end users and managing the operational turnover. To assist with these tasks, our Professional Services organization has developed a library of toolkits and shortcuts to make operational transition smooth and to increase internal user adoption rates.
Optimization.Once operational, our customers use our Optimization services to increase the effectiveness and efficiencies of our applications. Services include: Business Process Engineering to help our customers engineer their existing operations to achieve higher business performance; data management and warehousing strategies and implementation to help our customers improve information access and build business reports that drive intelligent business decisions; optimization of hardware, software and data exchange capabilities to leverage technology and network investments and maximize data center operations; product optimization, and user effectiveness training. These services optimize existing applications, enable the health plan to scale operations quickly and efficiently and add new lines of business.
SALES AND MARKETING
Our primary sales and marketing approach is to utilize our direct sales force to promote TriZetto as the single source for comprehensive healthcare information technology products and services to payers. As of December 31, 2006, we had approximately 70 sales, sales support, account management and marketing employees throughout the United States. Our professional sales force sells our entire range of offerings to current and prospective customers, including enterprise core administration software, network management and care management, outsourced hosting and business services, and consulting services. We also have specialized sales personnel who focus exclusively on our care management applications. Separate sales teams have been established for the health plan and benefits administration markets. Our solutions architecture team supports application and service sales while our sales support team provides in-depth technical information, provides product demonstrations and negotiates contracts with our customers and prospects. To support the overall sales process, multi-disciplinary pursuit teams are established for each major prospect, spearheaded by a member of executive management.
Our marketing team includes five key areas: Integrated Marketing, Marketing Communications and Events, Sales Channel Programs, Solutions Marketing and Product Marketing. Key functions of Integrated Marketing include branding and naming, integrated marketing planning, market intelligence, relationship marketing, analyst relations, employee communications and the Intranet and Internet. Marketing Communications and Events produces our advertising, collateral and lead generation material, as well as plans and executes TriZetto conferences and trade shows. Sales Channel Programs include customer analytics, loyalty programs, customer satisfaction and customer councils. The Solutions Marketing and Product Marketing teams are responsible for driving a presence in new markets including developing value propositions, sales tools, application beta management, product roadmaps and segmentation planning.
CUSTOMER SERVICE
We believe that personalized support is necessary to maintain long-term relationships with our customers. Because we support multiple applications and technology solutions, our functional and technical support staff are grouped and trained by specific application and by application type. These focused staff groups have concentrated expertise that we can deploy as needed to address customer needs. We cross-train employees to support multiple applications and technology solutions and create economies-of-scale in our support staff.
We further leverage the capabilities of our support staff through the use of sophisticated software that tracks solutions to common computer and software-related problems. This allows our support staff to learn from the experience of other people within the organization and reduces the time it takes to solve problems. In addition, we provide customer support for our business process outsourcing services.
Hosted clients interact most directly with TriZetto’s customer delivery management (CDM) business unit. The CDM provides ongoing customer support and “customer-facing” functions for TriZetto’s hosted customers and reports directly to the senior vice president of Enterprise Infrastructure (i.e., hosting operations). In addition to providing the customer support services identified above, the CDM is primarily responsible for managing service level commitments and supervising the delivery of
11
customer’s specific production processing services (e.g., batch processing, online availability, file transfers, connectivity, issue resolution) for hosted customers. This service-oriented business unit is composed of TriZetto’s Customer Support Help Desk and a dedicated customer delivery team composed of customer leads and a customer delivery executive (CDE).
COMPETITION
The market for healthcare information technology services is intensely competitive, rapidly evolving, highly fragmented and subject to rapid technological change. By using proprietary technologies and methods, we develop, integrate and deliver packaged enterprise and component software applications, connectivity solutions for both Internet and direct communication, application hosting, infrastructure outsourced business services and IT consulting services. Our competitors provide some or all of the services that we provide. Our competitors can be categorized as follows:
| | • | | information technology and outsourcing companies, such as Perot Systems Corporation, IBM, Affiliated Computer Services, DST (who acquired the healthcare division of Computer Sciences Corporation), Electronic Data Systems Corporation and Infocrossing; |
| | • | | healthcare information software vendors, including the newly combined DST/Amisys Synertech Inc., Perot Systems Corporation, Electronic Data Systems Corporation, and Plexis in the health plan market, as well as Eldorado and SBPA in the benefits administration market, and MMC 2020, Gorman and Dynamics in the Medicare Advantage market; |
| | • | | healthcare information technology consulting firms, such as First Consulting Group, Inc., Proxicom (ACS) and the consulting divisions or former affiliates of the major accounting firms, such as Deloitte Consulting and Accenture; |
| | • | | healthcaree-commerce and portal companies, such as Emdeon Corporation (formerly WebMD Corporation), Healthnation, HealthTrio, Avolent, edocs and BenefitFocus; |
| | • | | enterprise application integration vendors such as Vitria, SeeBeyond, TIBCO, Fuego and M2; |
| | • | | care management software and service companies such as HealthTrio, MEDecision, McKesson, Emdeon, HealthAtoZ and Click4Care; |
| | • | | consumer retail software and services companies such as CareGain and FiServ; and |
| | • | | health plans, themselves, some of whom are providing hosting and BPO services to the marketplace and leveraging capabilities across the aggregated membership of multiple organizations. |
Each of these types of companies can be expected to compete with us within various segments of the healthcare information technology market. Furthermore, major software information systems companies and other entities, including those specializing in the healthcare industry that are not presently offering applications that compete with our products and services, may enter our markets. In addition, some of our third-party software vendors compete with us from time to time by offering their software on a licensed or hosted basis.
We believe companies in our industry primarily compete based on performance, price, software functionality, ease of implementation, level of service, and track record of successful customer installations. Although our competitive position is difficult to characterize due principally to the variety of current and potential competitors and the evolving nature of our market, we believe that we presently compete favorably with respect to all of these factors. While our competition comes from many industry segments, we believe no other single company offers the integrated, single-source solution that we provide to our customers.
To be competitive, we must continue to enhance our products and services, as well as our sales, marketing, and distribution channels to respond promptly and effectively to:
| | • | | changes in the healthcare industry, including consolidation; |
| | • | | constantly evolving standards and government regulation affecting healthcare transactions; |
| | • | | the challenges of technological innovation and adoption; |
| | • | | evolving business practices of our customers; |
| | • | | our competitors’ new products and services; |
| | • | | new products and services developed by our vendor partners and suppliers; and |
12
| | • | | challenges in hiring and retaining information technology professionals. |
BACKLOG
Our total backlog is defined as the revenue we expect to generate in future periods from existing customer contracts. Our 12-month backlog is defined as the revenue we expect to generate from existing customer contracts over the next 12 months. Most of the revenue in our backlog is derived from multi-year service revenue contracts (including software hosting, business process outsourcing, IT outsourcing, and software maintenance with periods up to seven years) and consulting contracts. Consulting revenue is included in the backlog when the revenue from such a consulting contract is expected to be recognized over a period exceeding 12 months.
Backlog can change due to a number of factors, including unforeseen changes in implementation schedules, contract cancellations (subject to penalties paid by the customer), or customer financial difficulties. In such event, unless we enter into new customer agreements that generate enough revenue to replace or exceed the revenue that is recognized in any given quarter, our backlog will decline. Our backlog at any date may not indicate demand for our products and services and may not reflect actual revenue for any period in the future.
Our total backlog at December 31, 2006 was approximately $858.2 million compared to $703.4 million at December 31, 2005. The 12-month backlog at December 31, 2006 was approximately $213.3 million compared to $185.1 million at December 31, 2005.
INTELLECTUAL PROPERTY
Our intellectual property is important to our business. We rely on certain developed software assets and internal methodologies for performing customer services. Our consulting services group develops and utilizes information technology life-cycle methodology and related paper-based and software-based toolsets to perform customer assessments, planning, design, development, implementation, and support services. We rely primarily on a combination of patent, copyright, trademark and trade secret laws, confidentiality procedures, and contractual provisions to protect our intellectual property.
Our efforts to protect our intellectual property may not be adequate. Our competitors may independently develop similar technology or duplicate our products or services. Unauthorized parties may infringe upon or misappropriate our products, services or proprietary information. In addition, the laws of some foreign countries do not protect proprietary rights as well as the laws of the United States. In the future, litigation may be necessary to enforce our intellectual property rights or to determine the validity and scope of the proprietary rights of others. Any such litigation could be time consuming and costly.
We could be subject to intellectual property infringement claims as we expand our product and service offerings and the number of competitors increases. Defending against these claims, even if not meritorious, could be expensive and divert our attention from operating our company. If we become liable to third parties for infringing upon their intellectual property rights, we could be required to pay a substantial damage award and be forced to develop non-infringing technology, obtain a license or cease using the applications that contain the infringing technology or content. We may be unable to develop non-infringing technology or content or obtain a license on commercially reasonable terms, or at all.
We also rely on a variety of technologies that are licensed from third parties to perform key functions. These third-party licenses are an essential element of our hosted solutions business. These third-party licenses may not be available to us on commercially reasonable terms in the future. The loss of or inability to maintain any of these licenses could delay the introduction of software enhancements and other features until equivalent technology can be licensed or developed. Any such delay could materially adversely affect our ability to attract and retain customers.
SIGNIFICANT CUSTOMERS
As of December 31, 2006 we were providing services to 320 unique customers. One of our customers, The Regence Group, accounted for more than 10% of our consolidated revenue in 2006. No single customer accounted for more than 10% of our accounts receivable in 2006. In 2005, one of our customers, The Regence Group, accounted for more than 10% of our accounts receivable and two of our customers, The Regence Group and United Healthcare Services, Inc., each accounted for more than 10% of our consolidated revenue. No single customer accounted for more than 10% of our accounts receivable and consolidated revenues in 2004.
EMPLOYEES
As of December 31, 2006, we had approximately 1,600 employees. Our employees are not subject to any collective bargaining agreements, and we generally have good relations with our employees.
13
AVAILABLE INFORMATION
Our website is located atwww.trizetto.com. We make available free of charge through this website all of our SEC filings including our annual report on Form 10-K, quarterly reports on Form 10-Q, current reports on Form 8-K, and all amendments to those reports, as soon as reasonably practicable after those reports are electronically filed with the SEC.
Item 1A—RISK FACTORS
We cannot predict if we will be able to sustain our positive net income.
We may not be able to sustain our current level of revenue or increase our revenue in the future. We currently derive our revenue primarily from providing hosted solutions, software licensing and maintenance, and other services such as consulting. We depend on the continued demand for healthcare information technology and related services. We plan to continue investing in administrative infrastructure, research and development, sales and marketing, and acquisitions. If we are not able to sustain our current levels of revenue or maintain our profitability, our operations may be adversely affected.
Revenue from a limited number of customers comprises a significant portion of our total revenue, and if these customers terminate or modify existing contracts or experience business difficulties, it could adversely affect our earnings.
As of December 31, 2006, we were providing services to 320 unique customers. One of our customers, The Regence Group, represented approximately 12% of our consolidated revenue for the year ended December 31, 2006.
Although we typically enter into multi-year customer agreements, a majority of our customers are able to reduce or cancel their use of our services before the end of the contract term, subject to monetary penalties which are not significant. We also provide services to some hosted customers without long-term contracts. In addition, many of our contracts are structured so that we generate revenue based on units of volume, which include the number of members, number of workstations or number of users. If our customers experience business difficulties and the units of volume decline or if a customer ceases operations for any reason, we will generate less revenue under these contracts and our operating results may be materially and adversely impacted.
Our operating expenses are relatively fixed and cannot be reduced on short notice to compensate for unanticipated contract cancellations or reductions. As a result, any termination, significant reduction or modification of our business relationships with any of our significant customers could have a material adverse effect on our business, financial condition, operating results and cash flows.
Our business is changing rapidly, which could cause our quarterly operating results to vary and our stock price to fluctuate.
Our quarterly operating results have varied in the past, and we expect that they will continue to vary in future periods. Our quarterly operating results can vary significantly based on a number of factors, such as:
| | • | | our mix of products and services revenue; |
| | • | | our ability to add new customers and renew existing accounts; |
| | • | | selling additional products and services to existing customers; |
| | • | | long and unpredictable sales cycles; |
| | • | | meeting project milestones and customer expectations; |
| | • | | seasonality in information technology purchases; |
| | • | | the timing of new customer sales; and |
| | • | | general economic conditions. |
Variations in our quarterly operating results could cause us to not meet the earnings estimates of securities analysts or the expectations of our investors, which could affect the market price of our common stock in a manner that may be unrelated to our long-term operating performance.
We base our expense levels in part upon our expectations concerning future revenue, and these expense levels are relatively fixed in the short-term. If we do not achieve our expected revenue targets, we may not be able to reduce our short-term spending in response. Any shortfall in revenue would have a direct impact on our results of operations.
The intensifying competition we face from both established entities and new entries in the market may adversely affect our revenue and profitability.
The market for our technology and services is highly competitive and rapidly changing and requires potentially expensive technological advances. Many of our competitors and potential competitors have significantly greater financial, technical, product development, marketing and other resources, and greater market recognition than we have. Many of our competitors also have, or
14
may develop or acquire, substantial installed customer bases in the healthcare industry. As a result, our competitors may be able to respond more quickly to new or emerging technologies and changes in customer requirements or to devote greater resources to the development, promotion, and sale of their applications or services than we can devote.
Our competitors can be categorized as follows:
| | • | | information technology and outsourcing companies, such as Perot Systems Corporation, IBM, Affiliated Computer Services, DST (who acquired the healthcare division of Computer Sciences Corporation), Electronic Data Systems Corporation and Infocrossing; |
| | • | | healthcare information software vendors, including the newly combined DST/Amisys Synertech Inc., Perot Systems Corporation and Electronic Data Systems Corporation and Plexis in the health plan market, as well as Eldorado and SBPA in the benefits administration market and MMC 2020, Gorman and Dynamics in the Medicare Advantage market; |
| | • | | healthcare information technology consulting firms, such as First Consulting Group, Inc., Proxicom (ACS) and the consulting divisions or former affiliates of the major accounting firms, such as Deloitte Consulting and Accenture; |
| | • | | healthcaree-commerce and portal companies, such as Emdeon Corporation (formerly WebMD Corporation), HealthTrio, Avolent, edocs and BenefitFocus; |
| | • | | enterprise application integration vendors such as Vitria, SeeBeyond, TIBCO, Fuego and M2; |
| | • | | care management software and service companies such as HealthTrio, MEDecision, McKesson, Emdeon, HealthAtoZ and Click4Care; |
| | • | | consumer retail software and services companies such as, CareGain and FiServ; and |
| | • | | health plans, themselves, some of whom are providing hosting and BPO services to the marketplace and leveraging capabilities across the aggregated membership of multiple organizations. |
Further, other entities that do not presently compete with us may do so in the future, including major software information systems companies and financial services entities.
We believe our ability to compete will depend in part upon our ability to:
| | • | | enhance our current technology and services; |
| | • | | respond effectively to technological changes; |
| | • | | introduce new capabilities for current and new market segments; and |
| | • | | meet the increasingly sophisticated needs of our customers. |
| | • | | maintain and continue to develop partnerships with vendors; |
Increased competition may result in price reductions, reduced margins, and loss of market share, any of which could have a material adverse effect on our results of operations. In addition, pricing, margins, and market share could be negatively impacted further as a greater number of available products in the marketplace increases the likelihood that product and service offerings in our markets become more fungible and price sensitive.
Our sales and implementation cycles are long and unpredictable.
We have experienced and continue to experience long and unpredictable sales cycles, particularly for contracts with large customers, or customers purchasing multiple products and services. Enterprise software typically requires significant capital expenditures by customers, and the decision to outsource IT-related services is complicated and time-consuming. Major purchases by large payer organizations typically range from nine to 12 months or more from initial contact to contract execution. The prospects currently in our pipeline may not sign contracts within a reasonable period of time or at all.
In addition, our implementation cycle has ranged from 12 to 24 months or longer from contract execution to completion of implementation. During the sales cycle and the implementation cycle, we will expend substantial time, effort, and financial resources preparing contract proposals, negotiating the contract, and implementing the solution. We may not realize any revenue to offset these expenditures, and, if we do, accounting principles may not allow us to recognize the revenue during corresponding periods, which could harm our future operating results. Additionally, any decision by our customers to delay implementation may adversely affect our revenues.
Consolidation of healthcare payer organizations and benefits administrators could decrease the number of our existing and potential customers.
There has been and continues to be acquisition and consolidation activity among healthcare payers and benefits administrators. Mergers or consolidations of payer organizations in the future could decrease the number of our existing and potential customers. The acquisition of a customer could reduce our revenue and have a negative impact on our results of operations
15
and financial condition. A smaller overall market for our products and services could also result in lower revenue and margins. In addition, healthcare payer organizations are increasing their focus on consumer directed healthcare, in which consumers interact directly with health plans through administrative services provided by health plans to employer groups. These services compete with the services provided by benefits administrators and could result in additional consolidation in the benefits administration market.
Some of our significant customers may develop their own software solutions, which could decrease the demand for our products.
Some of our customers in the healthcare payer industry have, or may seek to acquire, the financial and technological resources necessary to develop software solutions to perform the functions currently serviced by our products and services. Additionally, consolidation in the healthcare payer industry could result in additional organizations having the resources necessary to develop similar software solutions. If these organizations successfully develop and utilize their own software solutions, they may discontinue their use of our products or services, which could materially and adversely affect our results of operations.
We depend on our software application vendor relationships, and if our software application vendors terminate or modify existing contracts or experience business difficulties, or if we are unable to establish new relationships with additional software application vendors, it could harm our business.
We depend, and will continue to depend, on our licensing and business relationships with third-party software application vendors. Our success depends significantly on our ability to maintain our existing relationships with our vendors and to build new relationships with other vendors in order to enhance our services and application offerings and remain competitive. Although most of our licensing agreements are perpetual or automatically renewable, they are subject to termination in the event that we materially breach such agreements. We may not be able to maintain relationships with our vendors or establish relationships with new vendors. The software, products or services of our third-party vendors may not achieve or maintain market acceptance or commercial success. Accordingly, our existing relationships may not result in sustained business partnerships, successful product or service offerings or the generation of significant revenue for us.
Our arrangements with third-party software application vendors are not exclusive. These third-party vendors may not regard our relationships with them as important to their own respective businesses and operations. They may reassess their commitment to us at any time and may choose to develop or enhance their own competing distribution channels and product support services. If we do not maintain our existing relationships or if the economic terms of our business relationships change, we may not be able to license and offer these services and products on commercially reasonable terms or at all. Our inability to obtain any of these licenses could delay service development or timely introduction of new services and divert our resources. Any such delays could materially adversely affect our business, financial condition, operating results and cash flows.
Our licenses for the use of third-party software applications are essential to the technology solutions we provide for our customers. Loss of any one of our major vendor agreements may have a material adverse effect on our business, financial condition, operating results and cash flows.
We rely on third-party software vendors for components of our software products.
Our software products contain components developed and maintained by third-party software vendors, and we expect that we may have to incorporate software from third-party vendors in our future products. We may not be able to replace the functions provided by the third-party software currently offered with our products if that software becomes obsolete, defective, or incompatible with future versions of our products or is not adequately maintained or updated. Any significant interruption in the availability of these third-party software products or defects in these products could harm the sale of our products unless and until we can secure or develop an alternative source. Although we believe there are adequate alternate sources for the technology currently licensed to us, such alternate sources may not be available to us in a timely manner, may not provide us with the same functions as currently provided to us or may be more expensive than products we currently use.
We have sustained rapid growth, and our inability to manage this growth could harm our business.
We have rapidly and significantly expanded our operations since inception and may continue to do so in the future. This growth has placed, and may continue to place, a significant strain on our managerial, operational, and financial resources, and information systems. If we are unable to manage our growth effectively, it could have a material adverse effect on our business, financial condition, operating results, and cash flows.
Our acquisition strategy may disrupt our business and require additional financing.
Since our initial public offering in October 1999, we have made ten acquisitions. A significant portion of our historical growth has occurred through acquisitions and we may continue to seek strategic acquisitions as part of our growth strategy. We compete with other companies to acquire businesses, making it difficult to acquire suitable companies on favorable terms or at all.
16
Acquisitions may require significant capital, typically entail many risks, and can result in difficulties integrating operations, personnel, technologies, products and information systems of acquired businesses.
We may be unable to successfully integrate companies that we have acquired or may acquire in the future in a timely manner. If we are unable to successfully integrate acquired businesses, we may incur substantial costs and delays or other operational, technical or financial problems. In addition, the integration of our acquisitions may divert our management’s attention from our existing business, which could damage our relationships with our key customers and employees.
To finance future acquisitions, we may issue equity securities that could be dilutive to our stockholders. We may also incur debt and additional amortization expenses related to goodwill and other intangible assets as a result of acquisitions. The interest expense related to this debt and additional amortization expense may significantly reduce our profitability and have a material adverse effect on our business, financial condition, operating results and cash flows. Acquisitions may also result in large one-time charges as well as goodwill and intangible assets and impairment charges in the future that could negatively impact our operating results.
Our need for additional financing is uncertain as is our ability to raise capital if required.
If we are not able to sustain our positive net income, we may need additional financing to fund operations or growth. We may not be able to raise additional funds through public or private financings at any particular point in the future or on favorable terms. Future financings could adversely affect our common stock and debt securities.
Our business will suffer if our software products contain errors.
The proprietary and third party software products we offer are inherently complex. Despite our testing and quality control procedures, errors may be found in current versions, new versions or enhancements of our products. Significant technical challenges may also arise with our products because our customers purchase and deploy those products across a variety of computer platforms and integrate them with a number of third-party software applications and databases. If new or existing customers have difficulty deploying our products or require significant amounts of customer support, our costs would increase. Moreover, we could face possible claims and higher development costs if our software contains undetected errors or if we fail to meet our customers’ expectations. As a result of the foregoing, we could experience:
| | • | | loss of or delay in revenue and loss of market share; |
| | • | | damage to our reputation; |
| | • | | failure to achieve market acceptance; |
| | • | | diversion of development resources; |
| | • | | increased service and warranty costs; |
| | • | | legal actions by customers against us which could, whether or not successful, increase costs and distract our management; and |
| | • | | increased insurance costs. |
We could lose customers and revenue if we fail to meet contractual obligations including performance standards and other material obligations.
Many of our service agreements contain performance standards and other post contract obligations. Our failure to meet these standards or breach other material obligations under our agreements could trigger remedies for our customers including termination, financial penalties and refunds that could have a material adverse effect on our business, financial condition, operating results and cash flows.
If our ability to expand our network and computing infrastructure is constrained in any way, we could lose customers and damage our operating results.
We must continue to expand and adapt our network and technology infrastructure to accommodate additional users, increased transaction volumes, changing customer requirements and technological obsolescence. We may not be able to accurately project the rate or timing of increases, if any, in the use of our hosted solutions or be able to expand and upgrade our systems and infrastructure to accommodate such increases. We may be unable to expand or adapt our network infrastructure to meet additional demand or our customers’ changing needs on a timely basis, at a commercially reasonable cost or at all. Our current information systems, procedures and controls may not continue to support our operations while maintaining acceptable overall performance and may hinder our ability to exploit the market for healthcare applications and services. Service lapses could cause our users to switch to the services of our competitors, which could have a material adverse effect on our business, financial condition, operating results and cash flows.
17
Performance or security problems with our systems could damage our business.
Our customers’ satisfaction and our business could be harmed if we, or our customers, experience any system delays, failures, or loss of data.
Although we devote substantial resources to avoid performance problems, errors may occur. Errors in the processing of customer data may result in loss of data, inaccurate information, and delays. Such errors could cause us to lose customers and be liable for damages. We currently process a substantial number of our customers’ transactions and data at our data centers in Colorado. Although we have safeguards for emergencies and we have contracted backup processing for our customers’ critical functions, the occurrence of a major catastrophic event or other system failure at any of our facilities could interrupt data processing or result in the loss of stored data. In addition, we depend on the efficient operation of telecommunication providers that have had periodic operational problems or experienced outages.
A material security breach could damage our reputation or result in liability to us. We retain confidential customer and federally protected patient information in our data centers. Therefore, it is critical that our facilities and infrastructure remain secure and that our facilities and infrastructure are perceived by the marketplace to be secure. Despite the implementation of security measures, our infrastructure may be vulnerable to physical break-ins, computer viruses, programming errors, attacks by third parties, or similar disruptive problems.
Our services agreements generally contain limitations on liability, and we maintain insurance with adequate coverage limits for general liability and professional liability to protect against claims associated with the use of our products and services. However, the contractual provisions and insurance coverage may not provide adequate coverage against all possible claims that may be asserted. In addition, appropriate insurance may be unavailable in the future at commercially reasonable rates. A successful claim in excess of our insurance coverage could have a material adverse effect on our business, financial condition, operating results, and cash flows. Even unsuccessful claims could result in litigation or arbitration costs and may divert management’s attention from our existing business.
Our success depends on our ability to attract, retain and motivate management and other key personnel.
Our success will depend in large part on the continued services of management and key personnel. Competition for personnel in the healthcare information technology market is intense, and there are a limited number of persons with knowledge of, and experience in, this industry. We do not have employment agreements with most of our executive officers, so any of these individuals may terminate his or her employment with us at any time. The loss of services from one or more of our management or key personnel, or the inability to hire additional management or key personnel as needed, could have a material adverse effect on our business, financial condition, operating results, and cash flows. Although we currently experience relatively low rates of turnover for our management and key personnel, the rate of turnover may increase in the future. In addition, we expect to further grow our operations and our needs for additional management and key personnel will increase. Our continued ability to compete effectively in our business depends on our ability to attract, retain, and motivate these individuals.
We rely on an adequate supply and performance of computer hardware and related equipment from third parties to provide services to larger customers and any significant interruption in the availability or performance of third-party hardware and related equipment could adversely affect our ability to deliver our products to certain customers on a timely basis.
As we offer our hosted solution services and software to a greater number of customers and particularly to larger customers, we may be required to obtain specialized computer equipment from third parties that can be difficult to obtain on short notice. Any delay in obtaining such equipment may prevent us from delivering large systems to our customers on a timely basis. We also may rely on such equipment to meet required performance standards. We may have no control over the resources that third parties may devote to service our customers or satisfy performance standards. If such performance standards are not met, we may be adversely impacted under our service agreements with our customers.
Any failure or inability to protect our technology and confidential information could adversely affect our business.
Our success depends in part upon proprietary software and other confidential information. The software and information technology industries have experienced widespread unauthorized reproduction of software products and other proprietary technology. We rely on a combination of copyright, patent, trademark and trade secret laws, confidentiality procedures, and contractual provisions to protect our intellectual property. However, these protections may not be sufficient, and they do not prevent independent third-party development of competitive products or services.
We execute confidentiality and non-disclosure agreements with certain employees and our suppliers, as well as limit access to and distribution of our proprietary information. The departure of any of our management and technical personnel, the breach of their confidentiality and non-disclosure obligations to us, or the failure to achieve our intellectual property objectives could have a material adverse effect on our business, results of operations and financial condition. We have had, and may continue to have, employees leave us and go to work for competitors. If we are not successful in prohibiting the unauthorized use of our proprietary
18
technology or the use of our processes by a competitor, our competitive advantage may be significantly reduced which would result in reduced revenues.
Our products may infringe the intellectual property rights of others, which may cause us to incur unexpected costs or prevent us from selling our products.
We cannot be certain that our products do not infringe issued patents or other intellectual property rights of others. In addition, because patent applications in the United States and many other countries are not publicly disclosed until a patent is issued, applications covering technology used in our software products may have been filed without our knowledge. We may be subject to legal proceedings and claims from time to time, including claims of alleged infringement of the patents, trademarks and other intellectual property rights of third parties by us or our licensees in connection with their use of our products. Intellectual property litigation is expensive and time-consuming and could divert our management’s attention away from running our business and seriously harm our business. If we were to discover that our products violated the intellectual property rights of others, we would have to obtain licenses from these parties in order to continue marketing our products without substantial reengineering. We might not be able to obtain the necessary licenses on acceptable terms or at all, and if we could not obtain such licenses, we might not be able to reengineer our products successfully or in a timely fashion. If we fail to address any infringement issues successfully, we would be forced to incur significant costs, including damages and potentially satisfying indemnification obligations that we have with our customers, and we could be prevented from selling certain of our products.
If our consulting services revenue does not grow substantially, our revenue growth could be adversely impacted.
Our consulting services revenue represents a significant component of our total revenue and we anticipate that it will continue to represent a significant percentage of total revenue in the future. The level of consulting services revenue depends upon the healthcare industry’s demand for outsourced information technology services and our ability to deliver products that generate implementation and follow-on consulting services revenue. Our ability to increase services revenue will depend in part on our ability to increase the capacity of our consulting group, including our ability to recruit, train and retain a sufficient number of qualified personnel.
The insolvency of our customers or the inability of our customers to pay for our services could negatively affect our financial condition.
Healthcare payers are often required to maintain restricted cash reserves and satisfy strict balance sheet ratios promulgated by state regulatory agencies. In addition, healthcare payers are subject to risks that physician groups or associations within their organizations become subject to costly litigation or become insolvent, which may adversely affect the financial stability of the payer. If healthcare payers are unable to pay for our services because of their need to maintain cash reserves or failure to maintain balance sheet ratios or solvency, our ability to collect fees for services rendered would be impaired and our financial condition could be adversely affected.
Changes in government regulation of the healthcare industry could adversely affect our business.
During the past several years, the healthcare industry has been subject to increasing levels of government regulation of, among other things, reimbursement rates and certain capital expenditures. In addition, proposals to substantially reform Medicare, Medicaid, and the healthcare system in general have been or are being considered by Congress. These proposals, if enacted, may further increase government involvement in healthcare, lower reimbursement rates, and otherwise adversely affect the healthcare industry which could adversely impact our business. The impact of regulatory developments in the healthcare industry is complex and difficult to predict, and our business could be adversely affected by existing or new healthcare regulatory requirements or interpretations.
Participants in the healthcare industry, such as our payer customers, are subject to extensive and frequently changing laws and regulations, including laws and regulations relating to the confidential treatment and secure transmission of patient medical records, and other healthcare information. Legislators at both the state and federal levels have proposed and enacted additional legislation relating to the use and disclosure of medical information, and the federal government is likely to enact new federal laws or regulations in the near future. Pursuant to the Health Insurance Portability and Accountability Act of 1996 (“HIPAA”), the Department of Health and Human Services (“DHHS”) has issued a series of regulations setting forth security, privacy and transactions standards for all health plans, clearinghouses, and healthcare providers to follow with respect to individually identifiable health information. DHHS has issued final regulations mandating the use of standard transactions and code sets, which became effective October 16, 2003. DHHS has also issued final HIPAA privacy regulations, which required Covered Entities to be in compliance by April 14, 2003, and final HIPAA security regulations, which required Covered Entities to be in compliance by April 20, 2005. Many of our customers will also be subject to state laws implementing the federal Gramm-Leach-Bliley Act, relating to certain disclosures of nonpublic personal health information and nonpublic personal financial information by insurers and health plans.
Our payer customers must comply with HIPAA, its regulations, and other applicable healthcare laws and regulations. In addition, we may be deemed to be a covered entity subject to HIPAA because we offer our customers products that convert data to a
19
HIPAA compliant format. Accordingly, we must comply with certain provisions of HIPAA and in order for our products and services to be marketable, they must contain features and functions that allow our customers to comply with HIPAA and other healthcare laws and regulations. We believe our products currently allow our customers to comply with existing laws and regulations. However, because HIPAA and its regulations have yet to be fully interpreted, our products may require modification in the future. If we fail to offer solutions that permit our customers to comply with applicable laws and regulations, our business will suffer.
We perform billing and claims services that are governed by numerous federal and state civil and criminal laws. The federal government in recent years has imposed heightened scrutiny on billing and collection practices of healthcare providers and related entities, particularly with respect to potentially fraudulent billing practices, such as submissions of inflated claims for payment and upcoding. Violations of the laws regarding billing and coding may lead to civil monetary penalties, criminal fines, imprisonment, or exclusion from participation in Medicare, Medicaid and other federally funded healthcare programs for our customers and for us. Any of these results could have a material adverse effect on our business, financial condition, operating results, and cash flows.
In addition, laws governing healthcare payers are often not uniform among states. This could require us to undertake the expense and difficulty of tailoring our products in order for our customers to be in compliance with applicable state and local laws and regulations.
Part of our business is subject to government regulation relating to the Internet that could impair our operations.
The Internet and its associated technologies are subject to increasing government regulation. A number of legislative and regulatory proposals are under consideration by federal, state, local, and foreign governments, and agencies. Laws or regulations may be adopted with respect to the Internet relating to liability for information retrieved from or transmitted over the Internet, on-line content regulation, user privacy, taxation and quality of products and services. Many existing laws and regulations, when enacted, did not anticipate the methods of the Internet-based hosted, software and information technology solutions we offer. We believe, however, that these laws may be applied to us. We expect our products and services to be in substantial compliance with all material federal, state and local laws and regulations governing our operations. However, new legal requirements or interpretations applicable to the Internet could decrease the growth in the use of the Internet, limit the use of the Internet for our products and services or prohibit the sale of a particular product or service, increase our cost of doing business, or otherwise have a material adverse effect on our business, results of operations and financial conditions. To the extent that we market our products and services outside the United States, the international regulatory environment relating to the Internet and healthcare services could also have an adverse effect on our business.
Increased leverage as a result of our convertible note offering may harm our financial condition and results of operations.
On October 5, 2005, we completed a private placement of $100.0 million aggregate principal amount of our 2.75% Convertible Senior Notes due 2025 (“Notes”). The indebtedness under the Notes constitutes senior unsecured obligations and will rank equally with all of our existing and future unsecured indebtedness. The Notes were issued pursuant to an Indenture dated October 5, 2005 (the “Indenture”) with Wells Fargo Bank, National Association, as trustee.
As of December 31, 2006, our total consolidated long-term debt was $114.0 million. In addition, the Indenture does not restrict our ability to incur additional indebtedness, and we may choose to incur additional debt in the future. Our level of indebtedness could have important consequences to you, because:
| | • | | it could affect our ability to satisfy our debt obligations under the Notes or our credit facility; |
| | • | | a substantial portion of our cash flows from operations will have to be dedicated to interest and principal payments of our debt obligations and may not be available for operations, expansion, acquisitions or other purposes; |
| | • | | it may impair our ability to obtain additional financing in the future; |
| | • | | it may limit our flexibility in planning for, or reacting to, changes in our business and industry; and |
| | • | | it may make us more vulnerable to downturns in our business, our industry or the economy in general. |
Our ability to make payments of principal and interest on our indebtedness depends upon our future performance, which will be subject to our success in marketing our products and services, general economic conditions and financial, business and other factors affecting our operations, many of which are beyond our control. If we are not able to generate sufficient cash flow from operations in the future to service our indebtedness, we may be required, among other things:
| | • | | to seek additional financing in the debt or equity markets; |
| | • | | to refinance or restructure all or a portion of our indebtedness; |
| | • | | to reduce or delay planned expenditures on research and development and/or commercialization activities. |
20
Such measures might not be sufficient to enable us to service our debt. In addition, any such financing, refinancing or sale of assets might not be available on economically favorable terms or at all.
We have certain repurchase and payment obligations under the Notes and we may not be able to repurchase such Notes or pay the amounts due upon conversion of the Notes when necessary.
On each of October 1, 2010, 2015 and 2020, holders of certain of the Notes may require us to purchase, for cash, all or a portion of their Notes at 100% of their principal amount, plus any accrued and unpaid interest. If a fundamental change occurs, as defined in the Indenture, including a change in control transaction, holders of such Notes may also require us to repurchase, for cash, all or a portion of their Notes. In addition, upon conversion of such Notes if we have made an irrevocable election to settle conversion in cash, we would be required to satisfy our conversion obligation up to the principal amount of the Notes in cash. Our ability to repurchase the Notes and settle the conversion of the Notes in cash is effectively subordinated to our senior credit facility and may be limited by law, by the Indenture, by the terms of other agreements relating to our senior debt and by indebtedness and agreements that we may enter into in the future which may replace, supplement or amend our existing or future debt. Our failure to repurchase the Notes or make the required payments upon conversion would constitute an event of default under the Indenture, which would in turn constitute a default under the terms of our senior credit facility and other indebtedness at that time.
Our common stock price has been, and may continue to be, volatile and our shareholders may not be able to resell shares of our stock at or above the price paid for such shares.
The price for shares of our common stock has exhibited high levels of volatility with significant volume and price fluctuations, which makes our common stock unsuitable for many investors. For example, for the year ended December 31, 2006, the closing price of our common stock ranged from a high of $19.15 to a low of $11.96. The fluctuations in price of our common stock have occasionally been related to our operating performance. These broad fluctuations may negatively impact the market price of shares of our common stock. The price of our common stock has also been influenced by:
| | • | | fluctuations in our results of operations or the operations of our competitors or customers; |
| | • | | failure of our results of operations to meet the expectations of stock market analysts and investors; |
| | • | | changes in stock market analyst recommendations regarding us, our competitors or our customers; and |
| | • | | the timing and announcements of new products or financial results by us or our competitors. |
Future issuances of common stock may depress the trading price of our common stock.
Any future issuance of equity securities, including the issuance of shares upon conversion of the Notes, could dilute the interests of our existing stockholders and could substantially decrease the trading price of our common stock. We may issue equity securities in the future for a number of reasons, including to finance our operations and business strategy, to adjust our ratio of debt to equity, to satisfy our obligations upon the exercise of outstanding warrants or options or for other reasons.
Our stockholder rights plan and charter documents could make it more difficult for a third party to acquire us, even if doing so would be beneficial to our shareholders.
Our stockholder rights plan and certain provisions of our certificate of incorporation and Delaware law are intended to encourage potential acquirers to negotiate with us and allow our Board of Directors the opportunity to consider alternative proposals in the interest of maximizing shareholder value. However, such provisions may also discourage acquisition proposals or delay or prevent a change in control, which in turn, could harm our stock price.
Item 1B—Unresolved Staff Comments
Not applicable.
Item 2—Properties
Facilities
As of December 31, 2006, we were leasing a total of 14 facilities located in the United States. Our principal executive and corporate office is located in Newport Beach, California. Our data center that we use to serve customers is located in Greenwood Village, Colorado. Our leases have expiration dates ranging from 2007 to 2016. We believe that our facilities are adequate for our current operations and that additional leased space can be obtained, if needed.
Item 3—Legal Proceedings
In September 2004, McKesson Information Solutions LLC (“McKesson”) filed a lawsuit against us in the United States District Court for the District of Delaware. In its complaint, McKesson alleged that we made, used, offered for sale, and/or sold a clinical editing software system that infringed McKesson’s United States Patent No. 5,253,164, entitled “System And Method For
21
Detecting Fraudulent Medical Claims Via Examination Of Services Codes.” McKesson sought injunctive relief and substantial monetary damages, including treble damages for willful infringement. On April 4, 2006, in response to our motion for summary judgment, the court ruled, as a matter of law, that our software products did not infringe 12 of the 15 claims of McKesson’s patent that were involved in this dispute, leaving claims 1, 2 and 16. On April 17, 2006, a jury trial commenced on the first phase of this case to determine the issue of infringement of the remaining three claims. On April 26, 2006, the jury found that our Facets®, QicLink™ and ClaimFacts® software products infringed claims 1 and 2, but not claim 16 of the patent. On May 4, 2006, the court scheduled the second phase of the trial to commence on October 3, 2006 on the issues of our validity, estoppel and laches defenses and on the issue of McKesson’s damages, if any.
On September 7, 2006, we entered into a Settlement Agreement with McKesson to settle the lawsuit. As part of the Settlement Agreement, we agreed to pay McKesson a one-time royalty fee of $15.0 million for a license in the patent that covers past and future use of our products and services by all existing customers. The $15.0 million, payable in two equal installments on September 30, 2006 and September 30, 2007, was expensed in the third quarter of 2006. Our customers with maintenance agreements also will continue to receive software version upgrades that include clinical editing capabilities. Going forward, we may continue to include our clinical editing functionality in versions of Facets® sold to new health plan customers with 100,000 or fewer members and in versions of QicLink™ sold to any new customers. We have agreed to pay McKesson a royalty fee of 5% of the net licensing revenue received from new sales of Facets® and QicLink™ containing our clinical editing functionality. However, pursuant to the terms of the Settlement Agreement, we will no longer include clinical editing functionality in versions of Facets® sold to new customers with more than 100,000 members, beginning November 1, 2006. In these cases, new customers may choose their clinical editing solution from available third-party providers.
In addition to the matters described above, we are involved in litigation from time to time relating to claims arising out of our operations in the normal course of business. Except as discussed above, as of the filing date of this annual report on Form 10-K, we were not a party to any other legal proceedings, the adverse outcome of which, in management’s opinion, individually or in the aggregate, would have a material adverse effect on our results of operations, financial position and/or cash flows.
Item 4—Submission of Matters to a Vote of Security Holders
No matters were submitted to a vote of our stockholders during the quarter ended December 31, 2006.
22
PART II
Item 5—Market for Registrant’s Common Equity, Related Stockholder Matters and Issuer Purchases of Equity Securities
Our common stock has been traded on the NASDAQ Stock Market under the symbol “TZIX” since October 8, 1999.
The following table shows the high and low sales prices of our common stock as reported on the NASDAQ Stock Market for the periods indicated:
| | | | | | |
Quarters Ended | | High | | Low |
December 31, 2006 | | $ | 18.95 | | $ | 14.25 |
September 30, 2006 | | $ | 15.53 | | $ | 11.89 |
June 30, 2006 | | $ | 17.68 | | $ | 12.69 |
March 31, 2006 | | $ | 19.74 | | $ | 16.11 |
December 31, 2005 | | $ | 17.49 | | $ | 12.77 |
September 30, 2005 | | $ | 17.34 | | $ | 13.61 |
June 30, 2005 | | $ | 14.40 | | $ | 8.60 |
March 31, 2005 | | $ | 9.94 | | $ | 8.00 |
As of March 13, 2007, there were214 holders of record based on the records of our transfer agent.
We have never paid cash dividends on our common stock. We currently anticipate that we will retain earnings, if any, to support operations and to finance the growth and development of our business and do not anticipate paying cash dividends in the foreseeable future. The payment of cash dividends by us is restricted by our current bank credit facility, which contains a restriction prohibiting us from paying any cash dividends without the bank’s prior approval.
The following table sets forth all purchases made by us of our common stock during each month within the fourth quarter of 2006. No purchases were made pursuant to a publicly announced repurchase plan or program.
| | | | | | | | | |
Month | | Total Number of Shares (or Units) Purchased(1) | | Average Price Paid per Share (or Unit) | | Total Number of Shares (or Units) Purchased as Part of Publicly Announced Plans or Programs | | Maximum Number (or Approximate Dollar Value) of Shares (or Units) that May Yet Be Purchased Under the Plans or Programs |
October 1, 2006 – October 31, 2006 | | — | | $ | — | | — | | — |
November 1, 2006 – November 30, 2006 | | 9,712 | | | 16.89 | | — | | — |
December 1, 2006 – December 31, 2006 | | 2,472 | | | 18.49 | | — | | — |
| | | | | | | | | |
Total | | 12,184 | | | 17.21 | | — | | — |
| | | | | | | | | |
| (1) | All share acquisitions set forth in this table were made in connection with the satisfaction of employee tax obligations upon the vesting of restricted stock awards. |
Recent Sales of Unregistered Securities
In connection with our recent acquisition of Plan Data Management, Inc. (“PDM”), we entered into a Merger Agreement, dated October 26, 2006, with PDM (the “Merger Agreement”). Pursuant to the Merger Agreement, we issued 491,488 shares of TriZetto common stock as part of the closing payment based upon a per share value of $16.28, which represents the average closing price of TriZetto’s common stock for the 20 trading days ending October 27, 2006. Assuming the same per share value and prior to any adjustments that may be required under the Merger Agreement, we may issue up to approximately 798,525 additional shares of common stock in connection with subsequent payments that may become due under the Merger Agreement.
In connection with the issuance of shares to PDM securityholders, we relied upon the exemption from registration provided by Section 4(2) of the Securities Act of 1933, and Regulation D promulgated thereunder. Each PDM securityholder has represented to us that such securityholder is an “accredited investor,” as such term is defined in Regulation D, or has the requisite knowledge and experience in financial and business matters. In addition, each PDM securityholder has had access to information concerning TriZetto and is acquiring the securities for such securityholder’s own account and not with a view to the distribution thereof.
23
Stock Performance Graph
The graph below compares the five-year cumulative total stockholder return on our common stock for the five-year period ended December 31, 2006, with the cumulative total return of (a) the Nasdaq Market Index and (b) Hemscott Industry Group Index 825—Healthcare Information Services over the same period. The graph assumes $100.00 invested at the beginning of the period in our common stock and the stocks represented by the above named indices and the reinvestment of all dividends; we have paid no dividends on our common stock. The performance graph is not necessarily an indicator of future performance. This information has been provided by Hemscott, Inc.
Comparison of Five-Year Cumulative Total Returns to Stockholders
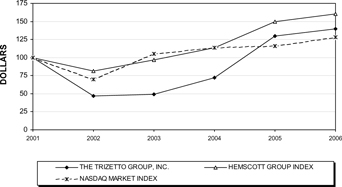
| | | | | | | | | | | | | | | | | | |
| | | Year Ended December 31, |
Company/Index/Market | | 2001 | | 2002 | | 2003 | | 2004 | | 2005 | | 2006 |
The TriZetto Group, Inc. | | $ | 100.00 | | $ | 46.80 | | $ | 49.16 | | $ | 72.41 | | $ | 129.50 | | $ | 140.02 |
Hemscott Healthcare Information Services Index | | | 100.00 | | | 81.29 | | | 96.61 | | | 113.36 | | | 149.70 | | | 160.74 |
Nasdaq Market Index | | | 100.00 | | | 69.75 | | | 104.88 | | | 113.70 | | | 116.19 | | | 128.12 |
24
Item 6—Selected Financial Data
The following selected consolidated financial data, except as noted herein, has been taken or derived from our audited consolidated financial statements and should be read in conjunction with the full consolidated financial statements included herein.
| | | | | | | | | | | | | | | | | | | | |
| | | Years Ended December 31, | |
| | | 2006 | | | 2005 | | | 2004 | | | 2003 | | | 2002 | |
| | | (in thousands, except per share amounts) | |
Consolidated statement of operations data: | | | | | | | | | | | | | | | | | | | | |
Revenue: | | | | | | | | | | | | | | | | | | | | |
Services and other | | $ | 272,943 | | | $ | 243,483 | | | $ | 223,257 | | | $ | 244,641 | | | $ | 233,019 | |
Products | | | 74,994 | | | | 48,736 | | | | 51,308 | | | | 45,688 | | | | 32,131 | |
| | | | | | | | | | | | | | | | | | | | |
Total revenue | | | 347,937 | | | | 292,219 | | | | 274,565 | | | | 290,329 | | | | 265,150 | |
| | | | | | | | | | | | | | | | | | | | |
Operating costs and expenses: | | | | | | | | | | | | | | | | | | | | |
Cost of revenue – services and other (1) | | | 165,229 | | | | 144,318 | | | | 157,573 | | | | 217,552 | | | | 174,073 | |
Cost of revenue – products (excludes amortization of acquired technology) | | | 14,175 | | | | 14,210 | | | | 12,025 | | | | 6,455 | | | | 3,747 | |
Research and development | | | 42,789 | | | | 31,655 | | | | 30,398 | | | | 24,823 | | | | 21,911 | |
Selling, general and administrative | | | 103,809 | | | | 76,758 | | | | 59,980 | | | | 52,138 | | | | 53,966 | |
Restructuring and impairment charges (2) | | | — | | | | — | | | | — | | | | 3,769 | | | | 651 | |
Impairment of goodwill (3) | | | — | | | | — | | | | — | | | | — | | | | 97,479 | |
Impairment of acquired intangible assets (3) | | | — | | | | — | | | | — | | | | — | | | | 33,540 | |
Amortization of acquired technology | | | 4,120 | | | | 660 | | | | 440 | | | | 7,120 | | | | 18,335 | |
Amortization of acquired other intangible assets | | | 867 | | | | 2,225 | | | | 3,804 | | | | 3,788 | | | | 9,692 | |
| | | | | | | | | | | | | | | | | | | | |
Total operating costs and expenses | | | 330,989 | | | | 269,826 | | | | 264,220 | | | | 315,645 | | | | 413,394 | |
| | | | | | | | | | | | | | | | | | | | |
Income (loss) from operations | | | 16,948 | | | | 22,393 | | | | 10,345 | | | | (25,316 | ) | | | (148,244 | ) |
Interest income | | | 3,823 | | | | 1,619 | | | | 583 | | | | 970 | | | | 1,609 | |
Interest expense | | | (3,342 | ) | | | (1,579 | ) | | | (1,369 | ) | | | (2,005 | ) | | | (1,479 | ) |
Other income | | | 180 | | | | — | | | | — | | | | — | | | | — | |
| | | | | | | | | | | | | | | | | | | | |
Income (loss) before provision for income taxes | | | 17,609 | | | | 22,433 | | | | 9,559 | | | | (26,351 | ) | | | (148,114 | ) |
Provision for income taxes | | | (2,494 | ) | | | (412 | ) | | | (1,101 | ) | | | (1,124 | ) | | | (250 | ) |
| | | | | | | | | | | | | | | | | | | | |
Net income (loss) | | $ | 15,115 | | | $ | 22,021 | | | $ | 8,458 | | | $ | (27,475 | ) | | $ | (148,364 | ) |
| | | | | | | | | | | | | | | | | | | | |
Net income (loss) per share: | | | | | | | | | | | | | | | | | | | | |
Basic | | $ | 0.36 | | | $ | 0.52 | | | $ | 0.18 | | | $ | (0.60 | ) | | $ | (3.28 | ) |
| | | | | | | | | | | | | | | | | | | | |
Diluted | | $ | 0.33 | | | $ | 0.48 | | | $ | 0.18 | | | $ | (0.60 | ) | | $ | (3.28 | ) |
| | | | | | | | | | | | | | | | | | | | |
Shares used in computing net income (loss) per share: | | | | | | | | | | | | | | | | | | | | |
Basic | | | 42,389 | | | | 41,948 | | | | 46,794 | | | | 46,170 | | | | 45,256 | |
| | | | | | | | | | | | | | | | | | | | |
Diluted | | | 45,691 | | | | 45,503 | | | | 48,157 | | | | 46,170 | | | | 45,256 | |
| | | | | | | | | | | | | | | | | | | | |
25
| | | | | | | | | | | | | | | |
| | | December 31, |
| | | 2006 | | 2005 | | 2004 | | 2003 | | 2002 |
| | | (in thousands) |
Consolidated balance sheet data: | | | | | | | | | | | | | | | |
Cash, cash equivalents, restricted cash, and short-term investments | | $ | 107,978 | | $ | 108,483 | | $ | 73,147 | | $ | 76,347 | | $ | 81,117 |
Total assets | | | 382,600 | | | 317,739 | | | 239,884 | | | 233,308 | | | 237,996 |
Total short-term debt and capital lease obligations | | | 1,576 | | | 2,099 | | | 43,786 | | | 34,920 | | | 17,921 |
Total long-term debt and capital lease obligations | | | 114,030 | | | 101,065 | | | 13,838 | | | 7,155 | | | 15,116 |
Total stockholders’ equity | | | 133,907 | | | 101,358 | | | 86,933 | | | 113,523 | | | 137,414 |
| (1) | Included in cost of revenue are charges associated with loss on contracts. During the fourth quarter of 2003, we decided to wind-down our outsourcing services to physician group customers. As a result of this decision, we estimated that the existing customer agreements would generate a total loss of $11.3 million until the terms of these agreements expired in 2008. We recorded a loss accrual in the fourth quarter of 2003. Through discussions and negotiations, we were able to accelerate the termination of our services agreements with certain physician group customers and implemented cost cutting measures that reduced the expected future costs to support our remaining customers. As a result of these actions, we were able to reverse approximately $5.9 million of previously accrued loss on contracts charges in 2004. Early in the second quarter of 2005, we executed termination agreements with our two remaining physician group customers. We continued to provide outsourced business services through May 2005, when the transition services were completed. The completion of these services to the remaining customers allowed us to reverse the remaining balance in the loss on contracts accrual of $2.9 million in the second quarter of 2005. The total amount of loss actually incurred related to the outsourcing services to physician group customers was $2.1 million in 2004 and $403,000 in the first six months of 2005. |
In December 2003, we negotiated a settlement regarding out-of-scope work related to one of our large fixed fee implementation projects. As a result of this settlement, we estimated that this project would generate a total loss of $3.7 million until its completion, which was expected to occur in mid-2004. We recorded a loss accrual in the fourth quarter of 2003. In 2004, we determined that the large fixed fee implementation project would require a greater effort to complete than previously estimated. As a result, we accrued an additional $5.0 million of loss on contracts charges in the first six months of 2004. In the fourth quarter of 2004, we negotiated a settlement of additional out-of-scope work, which decreased the total loss on the project and resulted in the reversal of approximately $455,000 of previously accrued loss on contracts charges. This fixed fee implementation was completed by the end of the first quarter of 2005. The total amount of loss actually incurred on this project was $7.7 million in 2004 and $484,000 in the first quarter of 2005.
(2) | In the fourth quarter of 2003, we made a decision to wind-down our outsourcing services to physician groups and to discontinue our outsourcing services to certain non-Facets® payer customers. We estimated that our future net cash flows from the assets used in these businesses would not recover their net book value. Accordingly, a total charge of $4.0 million was taken as a restructuring and impairment charge in the fourth quarter of 2003, which represented the net book value of these assets. The assets were written off in the first quarter of 2004. |
| (3) | After the end of the fourth quarter of 2002, our market capitalization decreased to a level that required us to perform additional analyses under FASB Statement No. 142 to quantify the amount of impairment to goodwill. This analysis resulted in an impairment charge to goodwill of $97.5 million as of December 31, 2002. The decrease in market capitalization was also an indicator that our other intangible assets might also be impaired as of December 31, 2002, and they were also tested for impairment in accordance with FASB Statement No. 144, “Accounting for the Impairment or Disposal of Long-Lived Assets.” The analysis resulted in an additional impairment charge of $33.5 million. |
26
Item 7—Management’s Discussion and Analysis of Financial Condition and Results of Operations
Overview
We offer a broad portfolio of proprietary information technology products and services targeted to the payer industry, which is comprised of health insurance plans and third party benefits administrators. We offer enterprise claims administration software, including Facets Extended Enterprise™ and QicLink Extended Enterprise™, and enterprise cost and quality of care software, including Clinical CareAdvance™, Personal CareAdvance™ and our NetworX™ suite for provider network management. We also provide a number of component software solutions and add-ons to the enterprise software solutions, including CDH Account Management, Workflow, HealthWeb® and Benefit Cost Modeler. To support these software products, we provide software hosting services and business process outsourcing services, giving customers variable cost alternatives to licensing software, as well as strategic, implementation and optimization consulting services. As of December 2006, we served 320 unique customers in the health plan and benefits administrator markets, which we refer to as payers. In 2006, these markets represented approximately 90% and 10% of our total revenue, respectively.
We measure financial performance by monitoring revenue, bookings and backlog, and net income. Total revenue for 2006 was $347.9 million compared to $292.2 million for 2005. Services and other revenue for 2006 was $272.9 million compared to $243.5 million for 2005. Products revenue for 2006 was $75.0 million compared to $48.7 million for 2005. Operating costs and expenses for 2006 were $331.0 million compared to $269.8 million for 2005. Bookings for 2006 were $381.6 million compared to $296.6 million for 2005. Backlog at December 31, 2006 was $858.2 million compared to $703.4 million at December 31, 2005. Net income in 2006 was $15.1 million compared to $22.0 million in 2005. These financial comparisons are further explained in the section below, “Results of Operations.”
We generate services revenue from several sources, including the provision of outsourcing services, such as software hosting and business process outsourcing services, the sale of maintenance and support for our proprietary and certain of our non-proprietary software products, and from consulting fees for implementation, installation, configuration, business process engineering, data conversion, testing and training related to the use of our proprietary, and third-party licensed products. We generate products revenue from the licensing of our software. Cost of revenue includes costs related to the products and services we provide to our customers and costs associated with the operation and maintenance of our customer connectivity centers. These costs include salaries and related expenses for consulting personnel, customer connectivity centers’ personnel, customer support personnel, application software license fees, amortization of capitalized software development costs, telecommunications costs, facility costs, and maintenance costs. Research and development (“R&D”) expenses are salaries and related expenses associated with the development of software applications prior to establishing technological feasibility. Such expenses include compensation paid to software engineering personnel and other administrative, infrastructure and facility expenses and fees to outside contractors and consultants. Selling, general and administrative expenses consist primarily of salaries and related expenses for sales, sales commissions, account management, marketing, administrative, finance, legal, human resources and executive personnel, and fees for certain professional services.
As part of our growth strategy, we intend to increase revenue per customer by continuing to introduce new complementary products and services, including new cost and quality of care products and services, to our established enterprise software and hosting and business process outsourcing services. Some of these service offerings, including hosting, business process outsourcing, and consulting have a higher cost of revenue, resulting in lower gross profit margins. Therefore, to the extent that our revenue increases through the sale of these lower margin product and service offerings, our total gross profit margin may decrease.
We are continuing to target larger health plan customers. This has given us the opportunity to sell additional services such as software hosting, business intelligence, and business process outsourcing services. As the technology requirements of our customers become more sophisticated, our service offerings have become more complex. This has lengthened our sales cycles and made it more difficult for us to predict the timing of our software and services sales.
In late 2003, a management decision was made to exit certain non-strategic and less profitable product offerings and business lines. This decision included winding down services related to our physician group customers, as well as the planned elimination of our hosting and business process outsourcing services for two competing third-party software platforms. Early in the second quarter of 2005, we executed termination agreements with the last two of our remaining physician group customers. We continued to provide outsourced business services through May 2005 when the transition services were completed.
On December 22, 2006, we acquired all of the issued and outstanding shares of Plan Data Management, Inc. The estimated purchase price as of December 31, 2006 was approximately $19.6 million, which consisted of 491,488 shares of our common stock with a value of $16.28 per share (which represents the average closing price of TriZetto’s common stock for the 20 trading days ending October 27, 2006), cash payments of $8.0 million, assumed liabilities of $3.1 million and estimated acquisition-related costs of $500,000. Due to the close of the acquisition late in the year, the issuance of the 491,488 shares of common stock and the cash payment of $8.0 million to PDM stockholders and option holders were not completed prior to December 31, 2006. However, these amounts were accrued as of December 31, 2006.
27
The computation of earnings per share for the year ended December 31, 2006 did not include the issuance of the 491,488 shares of common stock or the financial operating results of PDM since the impact of these amounts was not material.
Critical Accounting Policies and Estimates
The discussion and analysis of our financial condition and results of operations are based upon our consolidated financial statements, which have been prepared in accordance with accounting principles generally accepted in the United States. The preparation of these financial statements requires us to make estimates and judgments that affect the reported amount of assets and liabilities, revenues and expenses, and related disclosures of contingent assets and liabilities at the date of our financial statements. Those estimates are based on our experience, terms of existing contracts, observance of trends in the industry, information provided by our customers and information available from other outside sources, which are believed to be reasonable under the circumstances. Actual results may differ from these estimates under different assumptions or conditions.
The following critical accounting policies affect the more significant judgments and estimates used in the preparation of our consolidated financial statements, and may potentially result in materially different results under different assumptions and conditions. We have identified the following as critical accounting policies to our company:
| | • | | Up-front payments to customers; |
| | • | | Sales returns and allowance for doubtful accounts; |
| | • | | Capitalization of software development costs; |
| | • | | Goodwill and other intangible assets; |
| | • | | Stock-based compensation. |
This listing is not a comprehensive list of all of our accounting policies. For a detailed discussion on the application of these and other accounting policies, see Note 2 of Notes to Consolidated Financial Statements.
Revenue Recognition.We recognize revenue when persuasive evidence of an arrangement exists, the product or service has been delivered, fees are fixed or determinable, collection is reasonably assured and all other significant obligations have been fulfilled. Our revenue is classified into two categories: services and other, and products. For the year ended December 31, 2006, approximately 78% of our total revenue was generated from services and other revenue and 22% was from products revenue.
We follow the provisions of the Securities and Exchange Commission Staff Accounting Bulletin No. 104, “Revenue Recognition,” AICPA Statement of Position (“SOP”) 97-2, “Software Revenue Recognition,” as amended, EITF Issue 00-3, “Application of AICPA Statement of Position 97-2 to Arrangements That Include the Right to Use Software Stored on Another Entity’s Hardware,” and EITF Issue 00-21, “Revenue Arrangements with Multiple Deliverables.”
We generate services revenue from several sources, including the provision of outsourcing services, such as software hosting and other business services, and the sale of maintenance and support for our proprietary software products. We apply EITF 00-3 to hosting arrangements that include the licensing of software. A software element covered by SOP 97-2 is present in a hosting arrangement if the customer has the contractual right to take possession of the software at any time during the hosting period without significant penalty and it is feasible for the customer to either run the software on its own hardware or contract with another party unrelated to the vendor to host the software. Outsourcing services revenue is typically billed and recognized monthly over the contract term, generally three to seven years. Many of our outsourcing agreements require us to maintain a certain level of operating performance. We record revenue net of estimated penalties resulting from any failure to maintain the level of operating performance. These penalties have not been significant in the past. Software maintenance and support revenues are typically based on one-year renewable contracts and are recognized ratably over the contract period. Payment for software maintenance received in advance is recorded on the balance sheet as deferred revenue. Certain royalty costs paid to third-party software vendors associated with software maintenance are amortized over the software maintenance period.
We also generate services revenue from consulting fees for implementation, installation, configuration, business process engineering, data conversion, testing and training related to the use of our proprietary and third party licensed products. In certain instances, we also generate services revenue from customization services of our proprietary licensed products. We recognize revenue for these services as they are performed. When we cannot reasonably
28
estimate the cost to complete, we recognize revenue using the completed contract method, upon completion of all contractual obligations. We also generate services revenue from set-up fees, which are services, hardware, and software associated with preparing our customer connectivity center or a customer’s data center in order to ready a specific customer for software hosting services. The set-up fees are usually separate and distinct from the hosting fees, and performance of the set-up services represents the culmination of the earnings process. We recognize revenue for these services as they are performed. We generate other revenue from certain one-time charges, including certain contractual fees such as termination fees and change of control fees, and we recognize the revenue for these fees once the termination or change of control is guaranteed, there are no remaining substantive performance obligations and collection is reasonably assured. Other revenue is also generated from fees related to our product related conference.
For multiple element arrangements, such as software license, consulting services, outsourcing services and maintenance, and where vendor-specific objective evidence (“VSOE”) of fair value exists for all undelivered elements, we account for the delivered elements in accordance with the “residual method.” VSOE of fair value is determined for each undelivered element based on how it is sold separately, or in the case of maintenance, the renewal rate. For arrangements in which VSOE does not exist for each undelivered element, including specified product and upgrade rights, revenue for the delivered element is deferred and not recognized until VSOE is available for the undelivered element or delivery of each element has occurred. In determining VSOE for the undelivered elements, no portion of the discount is allocated to specified or unspecified product or upgrade rights.
Under the residual method, the arrangement fee is recognized as follows: (1) the total fair value of the undelivered elements, as indicated by VSOE, is deferred and subsequently recognized in accordance with the relevant sections of SOP 97-2 and (2) the difference between the total arrangement fee and the amount deferred for the undelivered elements is recognized as revenue related to the delivered elements.
We generate products revenue from the licensing of our software. Under SOP 97-2, software license revenue is recognized upon the execution of a license agreement, upon delivery of the software, when fees are fixed or determinable, when collectibility is probable and when all other significant obligations have been fulfilled. For software license agreements in which customer acceptance is a significant condition of earning the license fees, revenue is not recognized until acceptance occurs. For software license agreements that require significant customization or modification of the software, revenue is recognized as the customization services are performed.
Up-front Payments to Customers.We may pay certain up-front amounts to our customers in connection with the establishment of our hosting and outsourcing services contracts. Under EITF 01-9, “Accounting for Consideration Given by a Vendor to a Customer (Including a Reseller of the Vendor’s Products),” these payments are capitalized and amortized over the life of the contract as a reduction to revenue, provided that such amounts are recoverable from future revenue under the contract. If an up-front payment is not recoverable from future revenue, or it cannot be offset by contract cancellation penalties paid by the customer, the amount will be expensed in the period it is deemed unrecoverable. Unamortized up-front fees were $6.2 million and $7.7 million as of December 31, 2006 and 2005, respectively.
Sales Returns and Allowance for Doubtful Accounts.We maintain an allowance for sales returns and doubtful accounts to reserve for estimated discounts, pricing adjustments, and other sales allowances. The reserve is charged to revenue in amounts sufficient to maintain the allowance at a level we believe is adequate based on historical experience and current trends. We also maintain an allowance for doubtful accounts to reflect estimated losses resulting from the inability of customers to make required payments. We base this allowance on estimates after consideration of factors such as the composition of the accounts receivable aging and bad debt history and our evaluation of the financial condition of the customers. If the financial condition of customers were to deteriorate, resulting in an impairment of their ability to make payments, additional sales allowances and bad debt expense may be required. We typically do not require collateral. Historically, our estimates for sales returns and doubtful account reserves have been adequate to cover accounts receivable exposures. We continually monitor these reserves and make adjustments to these provisions when we believe actual credits or other allowances may differ from established reserves.
For the twelve month period ended December 31, 2006, our allowance for sales returns and doubtful accounts increased by $2.9 million. In December 2006, we entered into a settlement with one of our larger customers that had disputed payments due from a software implementation project. The amounts represented revenue recorded in the first two quarters of 2006 and were included in the allowance for sales returns and a reduction to revenue in the quarter ended September 30, 2006. The settlement fully resolved the issues and resulted in a payment that was less than the amount previously disputed. We do not believe the increase in the allowance for sales returns is a trend or representative of more significant issues in our business.
Capitalization of Software Development Costs.The capitalization of software costs includes developed technology acquired in acquisitions and costs incurred by us in developing our products that qualify for capitalization. We account for our software development costs, other than costs for internal-use software, in accordance with FASB Statement No. 86, “Accounting for Costs of Computer Software to be Sold, Leased or Otherwise Marketed.” We capitalize costs associated with product development, coding and testing subsequent to establishing technological feasibility of the product. Technological feasibility is established after completion of a detailed program design or working model. Capitalization of computer software costs ceases upon a product’s
29
general availability release. Capitalized software development costs are amortized over the estimated useful life of the software product starting from the date of general availability.
On a quarterly basis, we monitor the expected net realizable value of the capitalized software for factors that would indicate impairment, such as a decline in the demand, the introduction of new technology, or the loss of a significant customer. As of December 31, 2006, our evaluation determined that the carrying amount of these assets was not impaired.
Goodwill and Other Intangible Assets. Acquisitions are accounted for using the purchase method of accounting. The purchase price is allocated to the tangible and intangible assets acquired and the liabilities assumed on the basis of their estimated fair market values on the acquisition date. The excess of the purchase price over the estimated fair market value of the assets purchased and liabilities assumed is allocated to goodwill and other intangible assets.
Under FASB Statement No. 142, “Goodwill and Other Intangible Assets,” goodwill and intangible assets deemed to have indefinite lives are subject to annual (or more often if indicators of impairment exist) impairment tests using a two-step process. The first step looks for indicators of impairment. If indicators of impairment are revealed in the first step, then the second step is conducted to measure the amount of the impairment, if any. We performed our annual impairment test on March 31, 2006, and this test did not reveal indications of impairment.
Litigation Accruals. Pending unsettled lawsuits involve complex questions of fact and law and may require expenditure of significant funds. From time to time, we may enter into confidential discussions regarding the potential settlement of such lawsuits; however, there can be no assurance that any such discussions will occur or will result in a settlement. Moreover, the settlement of any pending litigation could require us to incur settlement payments and costs. In the period in which a new legal case arises, an expense will be accrued if our liability to the other party is probable and can be reasonably estimated. On a quarterly basis, we review and analyze the adequacy of our accruals for each individual case for all pending litigations. Adjustments are recorded as needed to ensure appropriate levels of reserve. Our attorney fees and other defense costs related to litigation are expensed as incurred.
Self-Insurance.Effective January 1, 2006, we became self-insured for certain losses related to employee health and dental benefits. We record a liability based on an estimate of claims incurred but not recorded determined based on actuarial analysis of historical claims experience and historical industry data. We maintain individual and aggregate stop-loss coverages with a third party insurer to limit our total exposure for these programs. Our self-insurance liability contains uncertainties because the calculation requires management to make assumptions and apply judgment to estimate the ultimate cost to settle reported claims and claims incurred but not reported as of the balance sheet date. We do not believe that there is a reasonable likelihood that there will be a material change in the future assumptions or estimates we use to calculate our self-insurance liability. However, if actual results are not consistent with our assumptions and estimates, we may be exposed to losses or gains that could be material.
Bonus Accrual.Our bonus model is designed to project the level of funding required under the bonus program as approved by the Compensation Committee of the Board of Directors. A significant portion of the bonus program is based on the Company meeting certain financial objectives, such as revenue, earnings per share, and the level of capital spending. The expense related to the bonus program is accrued in the year of performance and paid in the first quarter following the fiscal year end. The bonus model is analyzed and adjusted on a quarterly basis as necessary based on achievement of targets.
Income Taxes.We account for income taxes under FASB Statement No. 109, “Accounting for Income Taxes.” This statement requires the recognition of deferred tax assets and liabilities for the future consequences of events that have been recognized in our financial statements or tax returns. The measurement of the deferred items is based on enacted tax laws. In the event the future consequences of differences between financial reporting bases and the tax bases of our assets and liabilities result in a deferred tax asset, FASB Statement No. 109 requires an evaluation of the probability of being able to realize the future benefits indicated by such an asset. A valuation allowance related to a deferred tax asset is recorded when it is more likely than not that some portion or the entire deferred tax asset will not be realized. During 2006, our valuation allowance decreased by $20.1 million, $15.4 million as a result of purchase accounting and related deferred tax accounting adjustments associated with the acquisition of CareKey, Inc. (“CareKey”) and $4.7 million as a result of the utilization of net operating loss carryovers and true-ups. Of the remaining valuation allowance of $2.1 million, approximately $1.5 million will reverse through the income statement and approximately $600,000 will reverse to goodwill.
30
Stock-Based Compensation. Effective January 1, 2006, we adopted the fair value recognition provisions of FASB Statement No. 123R, “Share-Based Payment,” using the modified prospective transition method, and therefore have not restated prior periods’ results. Under this method, we recognize compensation expense for all share-based payments granted after January 1, 2006 and for all share-based payments granted prior to, but not yet vested as of, January 1, 2006. Under the fair value recognition provisions of FASB Statement No. 123R, stock-based compensation cost is estimated at the grant date based on the award’s fair-value and is recognized as expense ratably over the requisite service period. We use the Black-Scholes option-pricing model to calculate fair value which requires the input of highly subjective assumptions. These assumptions include estimating the length of time employees will retain their vested stock options before exercising them (“expected term”), the estimated volatility of our common stock price over the expected term and the number of options that will ultimately not complete their vesting requirements (“forfeitures”). The assumptions used in calculating the fair value of share-based payment awards represent management’s best estimates, but these estimates involve inherent uncertainties and the application of management judgment. As a result, if factors change and we use different assumptions, our stock-based compensation could be materially different in the future. In addition, if our actual forfeiture rate is materially different from our estimate, stock-based compensation expense could be significantly different from what we have recorded in the current period.
31
Recent Accounting Pronouncements
In July 2006, the FASB issued FASB Interpretation No. 48, “Accounting for Uncertainty in Income Taxes” (“FIN 48”). FIN 48 applies to all tax positions accounted for under SFAS No. 109, “Accounting for Income Taxes,” and defines the confidence level that a tax position must meet in order to be recognized in the financial statements. The interpretation requires that the tax effects of a position be recognized only if it is “more-likely-than-not” to be sustained by the taxing authority as of the reporting date. If a tax position is not considered “more-likely-than-not” to be sustained then no benefits of the position are to be recognized. FIN 48 requires additional disclosures and is effective as of the beginning of the first fiscal year beginning after December 15, 2006. We do not expect the adoption of FIN 48 to have a material impact on our consolidated results of operations and financial condition.
Revenue Information
Revenue by customer type and revenue mix for the years ended December 31, 2006, 2005, and 2004, is as follows (amounts in thousands):
| | | | | | | | | | | | | | | | | | |
| | | Years Ended December 31, | |
| | | 2006 | | | 2005 | | | 2004 | |
Revenue by customer type: | | | | | | | | | | | | | | | | | | |
Health plans | | $ | 312,567 | | 90 | % | | $ | 256,162 | | 88 | % | | $ | 224,806 | | 82 | % |
Benefits administration | | | 35,370 | | 10 | % | | | 35,915 | | 12 | % | | | 45,080 | | 16 | % |
Provider | | | — | | 0 | % | | | 142 | | 0 | % | | | 4,679 | | 2 | % |
| | | | | | | | | | | | | | | | | | |
Total revenue | | $ | 347,937 | | 100 | % | | $ | 292,219 | | 100 | % | | $ | 274,565 | | 100 | % |
| | | | | | | | | | | | | | | | | | |
Revenue mix: | | | | | | | | | | | | | | | | | | |
Services and other revenue | | | | | | | | | | | | | | | | | | |
Outsourced business services | | $ | 86,877 | | 25 | % | | $ | 79,418 | | 27 | % | | $ | 89,916 | | 33 | % |
Software maintenance | | | 88,628 | | 25 | % | | | 80,719 | | 28 | % | | | 69,065 | | 25 | % |
Consulting services and other | | | 97,438 | | 28 | % | | | 83,346 | | 28 | % | | | 64,276 | | 23 | % |
| | | | | | | | | | | | | | | | | | |
Services and other revenue total | | | 272,943 | | | | | | 243,483 | | | | | | 223,257 | | | |
| | | | | | | | | | | | | | | | | | |
Products revenue | | | | | | | | | | | | | | | | | | |
Software license fees | | | 74,994 | | 22 | % | | | 48,736 | | 17 | % | | | 51,308 | | 19 | % |
| | | | | | | | | | | | | | | | | | |
Total revenue | | $ | 347,937 | | 100 | % | | $ | 292,219 | | 100 | % | | $ | 274,565 | | 100 | % |
| | | | | | | | | | | | | | | | | | |
Our total backlog is defined as the revenue we expect to generate in future periods from existing customer contracts. Our 12-month backlog is defined as the revenue we expect to generate from existing customer contracts over the next 12 months. Most of the revenue in our backlog is derived from multi-year service revenue contracts (including software hosting, business process outsourcing, IT outsourcing, and software maintenance with periods up to seven years) and consulting contracts. Consulting revenue is included in the backlog when the revenue from such consulting contract is expected to be recognized over a period exceeding 12 months.
Backlog can change due to a number of factors, including unforeseen changes in implementation schedules, contract cancellations (subject to penalties paid by the customer), or customer financial difficulties. In such event, unless we enter into new customer agreements that generate enough revenue to replace or exceed the revenue we expect to generate from our backlog in any given quarter, our backlog will decline. Our backlog at any date may not indicate demand for our products and services and may not reflect actual revenue for any period in the future. Our 12-month and total backlog data are as follows (in thousands):
| | | | | | | | | | | | | | | | | | | | | | | | | | | |
| | | 12/31/06 | | 9/30/06 | | 6/30/06 | | 3/31/06 | | 12/31/05 | | 9/30/05 | | 6/30/05 | | 3/31/05 | | 12/31/04 |
12-month backlog | | $ | 213,300 | | $ | 191,600 | | $ | 186,100 | | $ | 187,300 | | $ | 185,100 | | $ | 194,500 | | $ | 174,800 | | $ | 172,000 | | $ | 173,100 |
| | | | | | | | | | | | | | | | | | | | | | | | | | | |
Total backlog | | $ | 858,200 | | $ | 747,800 | | $ | 717,500 | | $ | 704,700 | | $ | 703,400 | | $ | 663,100 | | $ | 638,900 | | $ | 604,800 | | $ | 585,000 |
| | | | | | | | | | | | | | | | | | | | | | | | | | | |
Total quarterly bookings equal the estimated total dollar value of the contracts signed in the quarter. Bookings can vary substantially from quarter to quarter, based on a number of factors, including the number and type of prospects in our pipeline, the length of time it takes a prospect to reach a decision and sign the contract, and the effectiveness of our sales force. Included in quarterly bookings are up to seven years of maintenance revenue and hosting and other services revenue. Bookings for each of the quarters are as follows (in thousands):
32
| | | | | | | | | | | | | | | | | | | | | | | | | | | |
| | | 12/31/06 | | 9/30/06 | | 6/30/06 | | 3/31/06 | | 12/31/05 | | 9/30/05 | | 6/30/05 | | 3/31/05 | | 12/31/04 |
Quarterly bookings | | $ | 139,700 | | $ | 75,900 | | $ | 78,600 | | $ | 87,400 | | $ | 83,100 | | $ | 75,100 | | $ | 85,300 | | $ | 53,100 | | $ | 58,800 |
| | | | | | | | | | | | | | | | | | | | | | | | | | | |
Results of Operations
Year Ended December 31, 2006 Compared to the Year Ended December 31, 2005.
Revenue. Total revenue increased $55.7 million, or 19%, to $347.9 million in 2006 from $292.2 million for 2005. Of this increase, $29.4 million related to services and other revenue and $26.3 million related to products revenue.
Services and Other Revenue. Services and other revenue includes outsourced business services (primarily software hosting and business process outsourcing), maintenance fees related to our software license contracts, consulting services and other revenue. Services and other revenue increased $29.4 million, or 12%, to $272.9 million in 2006 from $243.5 million in 2005. This increase was the result of a $14.0 million increase in consulting services and other revenue, a $7.9 million increase in software maintenance revenue, and an increase of $7.5 million in outsourced business services. The increase in consulting services and other revenue was due primarily to new Facets®, QicLink™, NetworX™ and CareAdvance™ implementations. The increase in software maintenance revenue was attributable primarily to new agreements for certain Facets®, NetworX™, HealthWeb® and CareAdvance™ customers and annual rate increases from existing customers. The overall increase in outsourced business services revenue was primarily due to new Facets® and CareAdvance™ hosted customers and increased membership from existing Facets® hosted customers.
Products Revenue.Products revenue, which includes software license sales, increased $26.3 million, or 54%, to $75.0 million in 2006 from $48.7 million in 2005 resulting from increased sales for new Facets®, NetworX™, HealthWeb® and CareAdvance™ license sales to our health plan customers.
Cost of Revenue – Services and Other. Cost of revenue for services and other increased $20.9 million, or 15%, to $165.2 million in 2006 from $144.3 million in 2005 to support the increase in our outsourced business services, software maintenance, and consulting services and other revenue.
Cost of revenue for our outsourced business services and software maintenance revenue increased $6.1 million, primarily attributable to higher compensation costs of $3.0 million, increased investment in infrastructure and technology of $3.0 million, a $2.9 million reversal of a loss on contracts accrual and a $1.7 million increase in other costs, partially offset by a $2.5 million decrease in depreciation expense and lower costs for outside consultants of $1.8 million. Higher compensation costs were impacted by the annual merit increases in early 2006, the adoption of SFAS 123R and a reassignment of product and development leaders and other executives to more appropriately align their responsibilities with our market facing strategy. Higher infrastructure and technology costs were driven by customer and internal upgrades, new operating lease agreements for data center equipment and related maintenance. In 2005, we executed termination agreements with our two remaining physician group customers, allowing us to reverse the remaining balance in our loss on contracts accrual. The overall increase in other costs was primarily related to bad debt expense, postage and freight, telecommunications, and travel. The reduction in depreciation expense related primarily to fully depreciated assets and a lower mix of equipment with longer estimated useful lives, offset in part by depreciation related to new additions in 2006. Reduced fees from our outside consultants were attributable to a higher utilization of internal resources for product support services.
Cost of revenue for our consulting services and other revenue increased $14.8 million, primarily attributable to higher compensation costs of $12.8 million, increased investment in infrastructure and technology of $2.1 million, increased travel costs of $1.1 million and a $1.1 million increase in other costs, partly offset by a $2.6 million reduction in utilization of outside consultants. Compensation costs were impacted by an increase in headcount, the adoption of SFAS 123R and a reassignment of product and development leaders and other executives to more appropriately align their responsibilities with our market facing strategy. Higher infrastructure and technology costs and travel costs were also impacted by increased headcount and the increased level of implementation projects. The overall increase in other costs was primarily related to facilities expense associated with a new facility acquired in the December 2005 acquisition of CareKey and expansion projects for certain of our existing facilities, as well as an increase in telecom usage. Reduced fees from outside consultants were attributable to a higher utilization of internal resources on implementation projects.
As a percentage of total revenue, cost of revenue for services and other approximated 48% in 2006 compared with 49% in 2005.
Cost of Revenue - Products. Cost of revenue for products, which excludes the amortization of acquired technology, remained flat year over year. Amortization of capitalized software development costs increased $1.6 million, partly offset by a decrease in software customer pass-through costs of $1.0 million and a $700,000 decrease in royalty expense. The increase in amortization of capitalized software development costs resulted from new versions of certain of our proprietary software products which were released for sale in mid to late 2005 and in 2006. Software customer pass-through costs decreased due primarily to a decreased volume of customer pass-through agreements. The decrease in royalty expense was due primarily to the elimination of a pre-
33
acquisition royalty relationship with CareKey in 2005. As a percentage of total revenue, cost of revenue for products approximated 4% in 2006 compared with 5% in 2005.
Research and Development (R&D) Expenses. R&D expenses increased $11.1 million, or 35%, to $42.8 million in 2006 from $31.7 million in 2005. The overall increase in R&D expenses was due primarily to higher compensation costs which were impacted by our annual merit increases in early 2006, increased headcount related to the development of cost and quality of care solutions following the December 2005 acquisition of CareKey and the adoption of SFAS 123R. As a percentage of total revenue, R&D expenses approximated 12% in 2006 compared with 11% in 2005. R&D expenses, as a percentage of total R&D expenditures (which includes capitalized R&D expenses of $8.6 million in 2006 and 2005), was 83% in 2006 compared with 79% in 2005.
Selling, General and Administrative (SG&A) Expenses. SG&A expenses increased $27.0 million, or 35%, to $103.8 million in 2006 from $76.8 million in 2005. The overall increase resulted primarily from a $15.0 million legal settlement that occurred in the third quarter of 2006, $10.7 million in higher compensation and related costs, increased investment in infrastructure and technology of $1.5 million, and an increase of approximately $700,000 in legal costs. These increases were offset in part by a $1.0 million reduction in utilization of outside consultants and a net decrease of $400,000 related to facilities expense. In the third quarter of 2006, we entered into a settlement agreement with McKesson Information Solutions LLC (“McKesson”) by which we agreed to pay McKesson a one-time royalty fee of $15.0 million. Higher compensation and related costs were impacted by our annual merit increases in early 2006, increased headcount and recruiting fees related to new hires, and our adoption of SFAS 123R, offset in part by a reassignment of product and development leaders and other executives to more appropriately align their responsibilities with our market facing strategy. Investment in infrastructure and technology costs was driven primarily by support for internal growth and upgrades. The $700,000 increase in legal fees was attributable to a $1.1 million insurance reimbursement related to a legal settlement that occurred in 2005, partially offset by a $400,000 decrease in litigation defense costs in 2006. The lower utilization of outside consultants related to strategic planning and process improvement projects in 2005. The net decrease in facilities expense is due to facility closures related to lease termination costs in 2005 of $900,000, offset by a $500,000 increase related primarily to incremental costs associated with the acquisition of CareKey in December 2005 and expansion projects for certain of our existing facilities. As a percentage of total revenue, selling, general and administrative expenses approximated 30% in 2006 compared with 26% in 2005.
Amortization of Intangible Assets. Amortization of intangible assets is comprised of acquired technology and acquired other intangible assets. In total, amortization of intangible assets increased $2.1 million, or 73%, to $5.0 million in 2006 from $2.9 million in 2005.
Amortization of Acquired Technology. The amortization of acquired technology is excluded from cost of revenue – products and consists primarily of amounts amortized with respect to core or completed technology and existing software. Amortization of acquired technology increased $3.4 million, or 524%, to $4.1 million in 2006 from $660,000 in 2005. The increase was due to the amortization of core technology and existing software acquired through the CareKey acquisition.
Amortization of Acquired Other Intangible Assets. Amortization of acquired other intangible assets decreased $1.3 million, or 61%, from $2.2 million in 2005 to $870,000 in 2006. The decrease was due primarily to certain intangible assets acquired in previous years, which were fully amortized in late 2005 and early 2006.
Future amortization expense related to existing intangible assets is estimated to be as follows (in thousands):
| | | | | | | | | |
| For the years ending December 31, | | Acquired Technology | | Acquired Other Intangible Assets | | Total |
2007 | | $ | 4,120 | | $ | 852 | | $ | 4,972 |
2008 | | | 4,120 | | | 852 | | | 4,972 |
2009 | | | 3,680 | | | 852 | | | 4,532 |
2010 | | | 3,460 | | | 852 | | | 4,312 |
2011 and thereafter | | | 4,300 | | | 4,259 | | | 8,559 |
| | | | | | | | | |
Total | | $ | 19,680 | | $ | 7,667 | | $ | 27,347 |
| | | | | | | | | |
Amortization expense related to existing intangible assets will vary from amounts identified above in the event we recognize impairment charges prior to the amortized useful life of any intangible assets. Additionally, amortization expense will vary from amounts identified above when the final accounting for the PDM and QCSI acquisitions are completed, and the allocation between goodwill and identifiable intangible assets is recorded.
Interest Income. Interest income increased $2.2 million, or 136%, to $3.8 million in 2006 from $1.6 million in 2005. The increase is due primarily to higher cash balances in our operating and investment accounts, resulting primarily from the $100.0 million convertible debt issued in 2005.
Interest Expense. Interest expense increased $1.7 million, or 112%, to $3.3 million in 2006 from $1.6 million in 2005. The increase relates primarily to a $2.1 million increase in interest charges incurred on the $100.0 million convertible debt issued in October 2005 and an increase of $100,000 related to our line of credit borrowings. These increases were offset in part by a decrease of $500,000 related primarily to certain capital leases ending in late 2005 and early 2006 and the IMS Health note payable, which was fully repaid in January 2005.
34
Provision for Income Taxes. Provision for income taxes was $2.5 million in 2006 compared to $412,000 in 2005. The provision increase is due mostly to an increase in state income taxes as a result of having previously utilized many of our state net operating loss carryovers, net of a release of a portion of our tax contingency reserve and state tax refunds received related to prior years for which income tax benefit was not previously recorded. The effective tax rate was 14.2% for 2006, which was lower than the Federal statutory rate primarily due to the decrease in (release of) valuation allowance, which occurred as a result of utilization of net operating loss carryovers, and the increase in state income taxes. The effective tax rate was 1.8% for 2005.
Year Ended December 31, 2005 Compared to the Year Ended December 31, 2004.
Revenue. Total revenue increased $17.6 million, or 6%, to $292.2 million in 2005 from $274.6 million in 2004. Services and other revenue increased $20.2 million and products revenue decreased $2.6 million.
Services and Other Revenue. Services and other revenue includes outsourced business services (primarily software hosting and business process outsourcing), maintenance fees related to our software license contracts, consulting services and other revenue. Services and other revenue increased $20.2 million, or 9%, to $243.5 million in 2005 from $223.3 million in 2004. This increase was the result of $19.1 million in consulting services and other revenue, $11.6 million in software maintenance, and $12.0 million in software hosting offsetting the loss of $22.5 million of outsourced business services revenue from exited businesses and contracts. The $19.1 million increase in consulting services and other revenue was due primarily to the higher utilization of consulting resources on more profitable implementation projects. The overall increase of $11.6 million in software maintenance revenue primarily resulted from sales of our enterprise and component software in 2005, including Facets Extended Enterprise™, QicLink Extended Enterprise™, NetworX™, CareAdvance™ and HealthWeb®, Workflow and HIPAA Gateway™. The overall decrease of $10.5 million in outsourced business services revenue resulted primarily from (i) a $9.3 million decline caused by the scheduled termination of our services for Altius, (ii) a $5.8 million decline resulting from the wind-down of our services for PHN, (iii) a $4.1 million reduction resulting from the planned wind-down of our services to physician group customers, and (iv) a $3.3 million decrease from the planned elimination of our hosting and business process outsourcing services on certain competitive software platforms. The effect of this $22.5 million decline in outsourced business services revenue was offset in part by a net increase of $12.0 million of additional revenue primarily from new Facets® hosted customers and increased membership from existing Facets® hosted and benefits administrator customers.
Products Revenue. Products revenue, which includes software license sales, decreased $2.6 million, or 5%, from $51.3 million in 2004 to $48.7 million in 2005 due to the timing of sales compared to 2004.
Cost of Revenue – Services and Other. Cost of revenue for services and other decreased $13.3 million, or 8%, from $157.6 million in 2004 to $144.3 million in 2005.
Cost of revenue for our outsourced business services and software maintenance revenue decreased $9.1 million, primarily attributable to (i) reduced costs of $7.2 million associated with the scheduled termination of our services for Altius, (ii) a $4.6 million reduction resulting from the planned wind-down of our services to physician group customers, (iii) a decline of $3.5 million related to the wind-down of our services for PHN, (iv) a $3.0 million increase related to the loss on contracts from physician group customers, and (v) a $3.2 million net increase in costs to support the additional outsourced business services revenue from new Facets® hosted customers and existing benefits administrator customers. We executed termination agreements with our two remaining physician group customers in the second quarter of 2005, allowing us to reverse the remaining balance in our loss on contracts accrual of $2.9 million, which reduced our total cost of revenue by an equal amount. In 2004, we reversed $5.9 million of previously accrued loss on contracts charges due to the accelerated termination of certain physician group contracts and the reduction of costs to support these remaining contracts. The net increase of $3.2 million represented higher incentive and compensation costs, increased royalty expense related to license deals, new software and equipment maintenance agreements, and new operating leases, which were offset in part by reduced outsourced contractor expenses from the completion of certain internal and customer related data center projects and reduced costs related to cost containment efforts.
Cost of revenue for our consulting services and other revenue decreased $4.2 million, primarily attributable to a $4.5 million decrease related to the loss on contracts for a certain fixed fee implementation, partly offset by a $400,000 increase in other costs. In 2004, we recorded a net $4.5 million of loss on contracts charges, which primarily represented incremental hours required to complete a certain fixed fee implementation. This fixed fee implementation project was completed by the end of the first quarter of 2005. The overall increase in other costs was due primarily to higher incentive and compensation costs, partially offset by lower outsourced consulting costs related to the completion of a large fixed fee implementation project, lower facilities expense related to an office closure, and a decrease in overall travel expense.
As a percentage of total revenue, cost of revenue for services and other approximated 49% in 2005 compared with 57% in 2004.
Cost of Revenue – Products.Cost of revenue for products, which excludes the amortization of acquired technology, increased $2.2 million, or 18%, to $14.2 million in 2005 from $12.0 million in 2004. This increase resulted primarily from an increase of $4.3 million in the amortization of capitalized software development products related to the general release of additional products, partly
35
offset by reduced royalty expense of $1.0 million and a decrease of $1.1 million in customer software pass-through costs. As a percentage of total revenue, cost of revenue for products approximated 5% in 2005 compared with 4% in 2004.
Research and Development (R&D) Expenses. R&D expenses increased $1.3 million, or 4%, to $31.7 million in 2005 from $30.4 million in 2004. This net increase was due primarily to increased spending related to the development of our proprietary software for the health plan and benefits administrator markets. Most of our R&D expense was used to continue our development of Facets Extended Enterprise™, which is a substantial upgrade of our flagship software for health plans, and for the development of certain new component software. Several enhancements were also made to QicLink™, a proprietary software product for benefits administrators and HealthWeb®, our web-enable platform, which allows health plans to exchange information on a secure basis over the Internet. As a percentage of total revenue, R&D expenses approximated 11% in 2005 and 2004. R&D expenses, as a percentage of total R&D expenditures (which includes capitalized R&D expenses of $8.6 million in 2005 and 2004), was 79% in 2005 and 78% in 2004.
Selling, General and Administrative (SG&A) Expenses. SG&A expenses increased $16.8 million, or 28%, to $76.8 million in 2005 from $60.0 million in 2004. The overall increase resulted primarily from (i) $8.8 million in higher personnel costs, including higher incentive and compensation costs associated with certain senior staff additions in late 2004 and higher commission expenses incurred related to the timing of new contracts signed, (ii) a $3.0 million increase in outsourced services primarily for strategic planning and process improvements, in addition to support and enhancements related to our enterprise reporting system, (iii) a $3.1 million increase related primarily to defense costs for McKesson in 2005 compared to lower costs in 2004, partially offset by a $1.1 million insurance reimbursement received in 2005 related to the ATPA litigation settlement, and (iv) approximately $1.9 million in other expenses such as audit and compliance, executive travel, sales and marketing, and other corporate support costs. SG&A expenses also increased $1.1 million due to the collection of a fully reserved note receivable in the second quarter of 2004, which negatively affected the period comparison. As a percentage of total revenue, selling, general and administrative expenses approximated 26% in 2005 compared with 22% in 2004.
Amortization of Intangible Assets. Amortization of intangible assets is comprised of acquired technology and acquired other intangible assets. Amortization of intangible assets decreased $1.3 million, or 32%, from $4.2 million in 2004 to $2.9 million in 2005.
Amortization of Acquired Technology.The amortization of acquired technology is excluded from cost of revenue - products and consists primarily of amounts amortized with respect to core or completed technology and existing software. Amortization of acquired technology increased $220,000, or 50%, to $660,000 in 2005 from $440,000 in 2004. The increase was related to the Diogenes acquisition in early 2004.
Amortization of Acquired Other Intangible Assets. Amortization of acquired other intangible assets decreased $1.6 million, or 41%, from $3.8 million in 2004 to $2.2 million in 2005. The decrease was due primarily to certain intangible assets acquired in previous years, which were fully amortized in early 2005.
Interest Income. Interest income increased $1.0 million, or 178%, to $1.6 million in 2005 from $583,000 in 2004. The increase is due primarily to higher cash balances attributed to the proceeds from the convertible debt deal, as well as higher interest earned in our investment accounts.
Interest Expense. Interest expense increased $210,000 or 15%, to $1.6 million in 2005 from $1.4 million in 2004. The increase relates primarily to interest incurred on the $100.0 million convertible debt and borrowings on our revolving line of credit facility. The effect of this increase was offset in part by lower balances on our capital leases and notes payable.
Provision for Income Taxes. Provision for income taxes was $412,000 in 2005 compared with $1.1 million in 2004. The provision decrease is due to a decrease in state income taxes from benefits recorded for return to provision adjustments related to 2004 state taxes and refunds received related to prior years for which income tax benefit was not previously recorded, offset partially by an increase in Federal income taxes for alternative minimum tax. The effective tax rate was 1.8% for 2005, which was lower than the Federal statutory rate primarily due to the decrease in (release of) valuation allowance, which occurred as a result of utilization of net operating loss carryovers. The effective tax rate was 11.5% for 2004.
36
Selected Quarterly Results of Operations
This data has been derived from unaudited consolidated financial statements that, in the opinion of our management, include all adjustments consisting only of normal recurring adjustments that we consider necessary for a fair presentation of the information when read in conjunction with our audited consolidated financial statements and the attached notes included herein. The operating results for any quarter are not necessarily indicative of the results for any future period. The following table sets forth certain unaudited consolidated statement of operations data for the eight quarters ended December 31, 2006 (in thousands, except per share data):
| | | | | | | | | | | | | | | | | | | | | | | | | | | | | | | | |
| | | Quarters Ended | |
| | | December 31, 2006 | | | September 30, 2006 | | | June 30, 2006 | | | March 31, 2006 | | | December 31, 2005 | | | September 30, 2005 | | | June 30, 2005 | | | March 31, 2005 | |
Revenue: (1) | | | | | | | | | | | | | | | | | | | | | | | | | | | | | | | | |
Services and other | | $ | 69,957 | | | $ | 67,421 | | | $ | 69,793 | | | $ | 65,772 | | | $ | 63,486 | | | $ | 62,921 | | | $ | 61,482 | | | $ | 55,594 | |
Products | | | 18,515 | | | | 19,016 | | | | 17,917 | | | | 19,546 | | | | 11,354 | | | | 10,132 | | | | 11,026 | | | | 16,224 | |
| | | | | | | | | | | | | | | | | | | | | | | | | | | | | | | | |
Total revenue | | | 88,472 | | | | 86,437 | | | | 87,710 | | | | 85,318 | | | | 74,840 | | | | 73,053 | | | | 72,508 | | | | 71,818 | |
| | | | | | | | | | | | | | | | | | | | | | | | | | | | | | | | |
Operating costs and expenses: | | | | | | | | | | | | | | | | | | | | | | | | | | | | | | | | |
Cost of revenue – services and other (2) | | | 41,064 | | | | 41,838 | | | | 41,980 | | | | 40,347 | | | | 37,011 | | | | 36,546 | | | | 34,901 | | | | 35,860 | |
Cost of revenue – products (excludes amortization of acquired technology) | | | 3,231 | | | | 3,238 | | | | 3,232 | | | | 4,474 | | | | 3,068 | | | | 3,188 | | | | 4,205 | | | | 3,749 | |
Research and development | | | 10,982 | | | | 10,586 | | | | 10,743 | | | | 10,478 | | | | 6,992 | | | | 7,748 | | | | 8,434 | | | | 8,481 | |
Selling, general and administrative | | | 22,961 | | | | 35,505 | | | | 24,027 | | | | 21,316 | | | | 21,296 | | | | 18,585 | | | | 18,775 | | | | 18,102 | |
Amortization of acquired technology | | | 1,030 | | | | 935 | | | | 940 | | | | 1,215 | | | | 165 | | | | 165 | | | | 165 | | | | 165 | |
Amortization of acquired other intangible assets | | | 213 | | | | 233 | | | | 128 | | | | 293 | | | | 124 | | | | 691 | | | | 692 | | | | 718 | |
| | | | | | | | | | | | | | | | | | | | | | | | | | | | | | | | |
Total operating costs and expenses | | | 79,481 | | | | 92,335 | | | | 81,050 | | | | 78,123 | | | | 68,656 | | | | 66,923 | | | | 67,172 | | | | 67,075 | |
Income (loss) from operations | | | 8,991 | | | | (5,898 | ) | | | 6,660 | | | | 7,195 | | | | 6,184 | | | | 6,130 | | | | 5,336 | | | | 4,743 | |
Interest income | | | 1,051 | | | | 937 | | | | 945 | | | | 890 | | | | 987 | | | | 261 | | | | 182 | | | | 189 | |
Interest expense | | | (850 | ) | | | (825 | ) | | | (835 | ) | | | (832 | ) | | | (836 | ) | | | (206 | ) | | | (178 | ) | | | (359 | ) |
Other income | | | — | | | | — | | | | — | | | | 180 | | | | — | | | | — | | | | — | | | | — | |
| | | | | | | | | | | | | | | | | | | | | | | | | | | | | | | | |
Income (loss) before (provision for) benefit from income taxes | | | 9,192 | | | | (5,786 | ) | | | 6,770 | | | | 7,433 | | | | 6,335 | | | | 6,185 | | | | 5,340 | | | | 4,573 | |
(Provision for) benefit from income taxes | | | (1,646 | ) | | | 103 | | | | (356 | ) | | | (595 | ) | | | (71 | ) | | | 295 | | | | (361 | ) | | | (275 | ) |
| | | | | | | | | | | | | | | | | | | | | | | | | | | | | | | | |
Net income (loss) | | $ | 7,546 | | | $ | (5,683 | ) | | $ | 6,414 | | | $ | 6,838 | | | $ | 6,264 | | | $ | 6,480 | | | $ | 4,979 | | | $ | 4,298 | |
| | | | | | | | | | | | | | | | | | | | | | | | | | | | | | | | |
Net income (loss) per share: | | | | | | | | | | | | | | | | | | | | | | | | | | | | | | | | |
Basic | | $ | 0.18 | | | $ | (0.13 | ) | | $ | 0.15 | | | $ | 0.16 | | | $ | 0.15 | | | $ | 0.15 | | | $ | 0.12 | | | $ | 0.10 | |
| | | | | | | | | | | | | | | | | | | | | | | | | | | | | | | | |
Diluted | | $ | 0.16 | | | $ | (0.13 | ) | | $ | 0.14 | | | $ | 0.15 | | | $ | 0.14 | | | $ | 0.14 | | | $ | 0.11 | | | $ | 0.10 | |
| | | | | | | | | | | | | | | | | | | | | | | | | | | | | | | | |
Shares used in computing net income (loss) per share: | | | | | | | | | | | | | | | | | | | | | | | | | | | | | | | | |
Basic | | | 42,744 | | | | 42,526 | | | | 42,370 | | | | 41,899 | | | | 41,519 | | | | 42,567 | | | | 41,988 | | | | 41,714 | |
| | | | | | | | | | | | | | | | | | | | | | | | | | | | | | | | |
Diluted | | | 46,273 | | | | 42,526 | | | | 45,394 | | | | 45,666 | | | | 45,518 | | | | 46,921 | | | | 44,816 | | | | 43,934 | |
| | | | | | | | | | | | | | | | | | | | | | | | | | | | | | | | |
| (1) | In December 2006, the Company entered into a settlement with one of its larger customers that had disputed payments due from a software implementation project. The amounts represented revenue recorded in the first two quarters of 2006 and were included in the allowance for sales returns and a reduction to revenue in the quarter ended September 30, 2006. The settlement fully resolved the issues and resulted in a payment that was less than the amount previously disputed. |
| (2) | Included in cost of revenue are charges associated with loss on contracts. During the fourth quarter of 2003, we decided to wind-down our outsourcing services to physician group customers. As a result of this decision, we estimated that the existing customer agreements would generate a total loss of $11.3 million until the terms of these agreements expired in 2008. We recorded a loss accrual in the fourth quarter of 2003. Through discussions and negotiations, we were able to accelerate the termination of our services agreements with certain physician group customers and implemented cost cutting measures that reduced the expected future costs to support our remaining customers. As a result of these actions, we were able to reverse approximately $5.9 million of previously accrued loss on contracts charges in 2004. Early in the second quarter of 2005, we executed termination agreements with our two remaining physician group customers. We continued to provide outsourced business services through May 2005, when the transition services were completed. The completion of these services to the remaining customers allowed us to reverse the remaining balance in the loss on contracts accrual of $2.9 million in the second quarter of 2005. The total amount of loss actually incurred related to the outsourcing services to physician group customers was $2.1 million in 2004 and $403,000 in the first six months of 2005. |
37
Liquidity and Capital Resources
Capital Resources
Our principal sources of liquidity include cash from operations, borrowings under our debt facility, proceeds from the issuance of convertible debt, cash obtained from our acquisitions, employee exercises of stock options and private financings. As of December 31, 2006, we have the following sources of cash available to fund our ongoing operations:
| | • | | Cash and cash equivalents totaling $108.0 million, including $921,000 of restricted cash. |
| | • | | In January 2007, we entered into an amendment to our Credit Agreement established December 21, 2004 to add a term loan of up to $150.0 million and to extend the expiration date of the Credit Agreement, including our $100.0 million revolving credit facility, to January 5, 2011. As of December 31, 2006, we had outstanding borrowings on the revolving line of credit of $12.0 million and were in compliance with all applicable covenants and other restrictions under the Credit Agreement. In January 2007, we borrowed $75.0 million under the term loan to help fund our acquisition of Quality Care Solutions, Inc. (“QCSI”). We can borrow up to an additional $75.0 million under the term loan through June 30, 2007, at which time no additional funds can be borrowed under the term loan. All borrowings under our Credit Agreement bear interest at a per annum rate equal to either (i) the LIBOR rate plus an adjustable applicable margin of between 1.75% and 3.50% or (ii) Wells Fargo’s prime rate plus an adjustable applicable margin of between 0.0% and 2.0%, at our election, subject to specified restrictions. The maximum amount that we may borrow under our revolving credit facility may be limited based upon multiples of EBITDA, as specified in the Credit Agreement. The Credit Agreement is also subject to other customary financial and negative covenants. |
| | • | | In October 2005, we issued $100.0 million aggregate principal amount of 2.75% Convertible Senior Notes due 2025 (the “Notes”). The Notes bear interest at a rate of 2.75%, which is payable in cash semi-annually. On or after October 5, 2010, we may from time to time at our option redeem the Notes, in whole or in part, for cash, at the applicable redemption date. Additionally, holders of the Notes may require us to purchase all or a portion of their Notes in cash on each October 1, 2010, October 1, 2015 and October 1, 2020. |
The Notes are convertible into shares of our common stock at an initial conversion price of $18.85 per share, or 53.0504 shares for each $1,000 principal amount of Notes, subject to certain adjustments set forth in the Indenture. Upon conversion of the Notes, we will have the right to deliver shares of our common stock, cash or a combination of cash and shares of our common stock. The Notes are convertible (i) prior to October 1, 2020, during any fiscal quarter after the fiscal quarter ending December 31, 2005, if the closing sale price of our common stock for 20 or more trading days in a period of 30 consecutive trading days ending on the last trading day of the immediately preceding fiscal quarter exceeds 120% of the conversion price in effect on the last trading day of the immediately preceding fiscal quarter, (ii) prior to October 1, 2020, during the five business day period after any five consecutive trading day period (the “Note Measurement Period”) in which the average trading price per $1,000 principal amount of Notes was equal to or less than 97% of the average conversion value of the Notes during the Note Measurement Period, (iii) upon the occurrence of specified corporate transactions, as described in the Indenture, (iv) if we call the Notes for redemption, or (v) any time on or after October 1, 2020.
Based on our current operating plan, we believe that existing cash and cash equivalents balances, cash forecasted by management to be generated by operations and borrowings from existing credit facilities will be sufficient to meet our working capital and capital requirements for at least the next 12 months. However, if events or circumstances occur such that we do not meet our operating plan as expected, we may be required to seek additional capital and/or reduce certain discretionary spending, which could have a material adverse effect on our ability to achieve our business objectives. We may seek additional financing, which may include debt and/or equity financing or funding through third party agreements. There can be no assurance that any additional financing will be available on acceptable terms, if at all. Any equity financing may result in dilution to existing stockholders and any debt financing may include restrictive covenants.
38
Summary of Cash Activities
As of December 31, 2006, we had cash and cash equivalents totaling $107.1 million and $921,000 in restricted cash. Significant cash flow activities for the years ended December 31, 2006 and 2005 are as follows (in thousands):
| | | | | | | | |
| | | Year Ended
December 31, | |
| | | 2006 | | | 2005 | |
Cash provided by operating activities | | $ | 40,154 | | | $ | 43,825 | |
Purchase of property and equipment and software licenses | | | (10,575 | ) | | | (7,171 | ) |
Capitalization of software development costs | | | (8,568 | ) | | | (8,608 | ) |
Acquisitions, net of cash acquired | | | (40,581 | ) | | | (26,799 | ) |
Proceeds from notes payable | | | — | | | | 100,000 | |
Proceeds from revolving line of credit, debt financings and capital leases | | | 37,992 | | | | 79,650 | |
Payments on notes payable | | | (997 | ) | | | (40,991 | ) |
Payments on revolving line of credit and capital leases | | | (27,316 | ) | | | (94,542 | ) |
Payments for repurchase of common stock | | | — | | | | (19,798 | ) |
Employee exercise of common stock options and purchase of common stock | | | 10,008 | | | | 10,254 | |
Cash and cash equivalents increased $117,000 in 2006 from $106.9 million at December 31, 2005 to $107.1 million at December 31, 2006. The main contributors of this increase were $40.2 million in cash provided by operating activities, $38.0 million in proceeds from our revolving line of credit and other financing debt, and $10.0 million in proceeds from employee option exercises and stock purchases. These cash inflows were partially offset by net cash payments of $40.6 million which included $42.4 million of payments related to the acquisition of CareKey and $1.8 million of cash acquired from PDM, payments on our debt (including revolving line of credit) of $28.3 million and $19.1 million for capital spending.
Although our acquisition of PDM was consummated on December 22, 2006, the initial closing consideration of $8.0 million and 491,488 shares of common stock was paid and issued, respectively, in January 2007. In January 2007, we also consummated our acquisition of QCSI, pursuant to which we made an aggregate cash payment of $130.0 million, net of cash received in the acquisition.
Commitments and Contingencies
The following tables summarize our estimated contractual obligations and other commercial commitments (in thousands):
| | | | | | | | | | | | | | | |
| | | Payments (including interest) Due by Period |
Contractual obligations | | Total | | Less than
1 Year | | 1-3
Years | | 3-5
Years | | More than 5
Years |
Short-term debt | | $ | 115 | | $ | 115 | | $ | — | | $ | — | | $ | — |
Capital lease obligations | | | 3,806 | | | 1,618 | | | 1,625 | | | 563 | | | — |
Operating leases | | | 63,363 | | | 13,603 | | | 19,944 | | | 12,703 | | | 17,113 |
Convertible debt | | | 152,281 | | | 2,750 | | | 5,500 | | | 5,500 | | | 138,531 |
| | | | | | | | | | | | | | | |
Total contractual obligations | | $ | 219,565 | | $ | 18,086 | | $ | 27,069 | | $ | 18,766 | | $ | 155,644 |
| | | | | | | | | | | | | | | |
Other commercial commitments | | Total
Amounts
Committed | | Less
Than
1 Year | | 1-3
Years | | 3-5
Years | | More than 5
Years |
Line of credit | | $ | 12,000 | | $ | — | | $ | — | | $ | 12,000 | | $ | — |
Standby letters of credit | | | 921 | | | — | | | 500 | | | 308 | | | 113 |
| | | | | | | | | | | | | | | |
Total other commercial commitments | | $ | 12,921 | | $ | — | | $ | 500 | | $ | 12,308 | | $ | 113 |
| | | | | | | | | | | | | | | |
In the second quarter of 2006, we extended the term of our lease on our Colorado facility for a period of seven years from July 31, 2009 through July 31, 2016. At the same time, we leased an additional 50,862 square feet within this facility.
Convertible debt represents scheduled principal and interest payments for our October 2005 convertible debt offering, which includes $100.0 million aggregate principal amount of our Convertible Senior Notes. The Notes bear interest at a rate of 2.75%, which is payable in cash semi-annually in arrears on April 1 and October 1 of each year, commencing on April 1, 2006, to the holders of record on the preceding March 15 and September 15, respectively. The Notes mature on October 1, 2025. However, on or after October 5, 2010, we may from time to time at our option redeem the Notes, in whole or in part, for cash, at the applicable redemption date. Additionally, holders of the Notes may require us to purchase all or a portion of their Notes in cash on each of October 1, 2010, October 1, 2015 and October 1, 2020.
39
As of December 31, 2006, we had outstanding four unused standby letters of credit in the aggregate amount of $921,000 which serve as security deposits for certain operating leases. We are required to maintain a cash balance equal to the outstanding letters of credit, which is classified as restricted cash on our balance sheet.
Excluded from the tables above are certain potential payments to former CareKey stockholders and option holders as these payments are contingent upon the achievement of financial milestones. These amounts are payable in either cash or stock at our election. Former CareKey stockholders and option holders are entitled to receive three contingent consideration payments of $8.3 million each (up to $25.0 million), upon the achievement of certain revenue milestones during the period beginning upon acquisition and ending December 31, 2008. In addition, further consideration payable in cash or stock at our election, may be paid to former CareKey stockholders and option holders if, prior to December 31, 2008, the acquired CareKey products generate revenues in excess of certain revenue milestones and/or if a negotiated multiple of software maintenance revenues of acquired CareKey products during the fiscal year ended December 31, 2009 exceed total purchase consideration made to those former CareKey stockholders and option holders. Also excluded from the tables above are certain potential payments to former PDM and QCSI stockholders and option and warrant holders. In addition to the $8.0 million and 491,488 shares of common stock paid and issued in January 2007, former PDM security holders may be entitled to receive contingent consideration as follows: aggregate payments of up to $5.0 million on or before June 30, 2007, $5.0 million on or before December 31, 2008, and $8.0 million on or before December 31, 2009, each subject to reduction if certain revenue thresholds are not satisfied during the applicable measurement period. Additional contingent consideration may be paid on June 30, 2009 if certain revenue thresholds are satisfied, provided that in no event will the aggregate consideration of all payments exceed $42.0 million. It is expected that 50% of each payment will be made in cash and 50% will be paid in shares of TriZetto’s common stock.
In addition to the net cash payment of $130.0 million paid in January 2007, former QCSI security holders are entitled to an aggregate cash payment of $5.0 million on January 31, 2008, subject to reduction if the parties determine that QCSI had negative working capital under the acquisition agreement as of the date of closing or to the extent that we are entitled to claims for indemnification under the acquisition agreement. In addition, former QCSI security holders will be entitled to receive an aggregate cash payment of $7.0 million on January 31, 2008 if license and software revenues arising from the sale of QCSI products reach specified thresholds during the fiscal year ending on December 31, 2007.
The tables further exclude the long-term debt obligations under our term loan used to help fund the purchase of QCSI in January 2007. As of January 31, 2007, there was $75.0 million outstanding under our term loan. All borrowings under our term loan must be repaid in quarterly installments commencing on July 1, 2007 through January 5, 2010 in amounts equal to the amount outstanding under the term loan on June 30, 2007, divided by 28.
OFF-BALANCE SHEET ARRANGEMENTS
We do not currently have any relationships with unconsolidated entities or financial partnerships, such as entities referred to as structured finance or special purpose entities, which would have been established for the purpose of facilitating off-balance sheet or other contractually narrow or limited purposes.
Item 7A—Quantitative and Qualitative Disclosures About Market Risk
Market risk associated with adverse changes in financial and commodity market prices and rates could impact our financial position, operating results or cash flows. We are exposed to market risk due to changes in interest rates such as the prime rate and LIBOR. This exposure is directly related to our normal operating and funding activities. Historically, and as of December 31, 2006, we have not used derivative instruments or engaged in hedging activities.
The interest rate on our $100.0 million revolving credit facility is a per annum rate equal to (i) the LIBOR rate plus an applicable margin of between 1.75% and 2.25% or (ii) the lending institution’s prime rate plus an adjustable applicable margin of between 0.0% and 0.5%, at our election, subject to specified restrictions, and is payable monthly in arrears. The revolving credit facility expires in January 2010. As of December 31, 2006, we had outstanding borrowings on the revolving line of credit of $12.0 million.
On September 30, 2005, we entered into a Purchase Agreement with UBS Securities, LLC, Banc of America Securities, LLC and William Blair & Company LLC (the “Initial Purchasers”), to sell $100.0 million aggregate principal amount of our 2.75% Convertible Senior Notes due 2025 (the “Notes”) in a private placement in reliance on Section 4(2) of the Securities Act of 1933, as amended (the “Securities Act”). The Notes have been resold by the Initial Purchasers to qualified institutional buyers pursuant to Rule 144A under the Securities Act. The sale of the Notes to the Initial Purchasers was consummated on October 5, 2005. The Notes were issued pursuant to an Indenture, dated October 5, 2005, by and between us and Wells Fargo Bank, National Association, as trustee. The Notes bear interest at a rate of 2.75%, which is payable in cash semi-annually in arrears on April 1 and October 1 of each year, commencing on April 1, 2006, to the holders of record on the preceding March 15 and September 15, respectively.
40
We manage interest rate risk by investing excess funds in cash equivalents and short-term investments bearing variable interest rates, which are tied to various market indices. We also manage interest rate risk by closely managing our borrowings on our credit facility based on our operating needs in order to minimize the interest expense incurred. As a result, we do not believe that near-term changes in interest rates will result in a material effect on our future earnings, fair values or cash flows.
Item 8—Financial Statements and Supplementary Data
The financial statements and supplementary data required by this Item 8 are set forth at the pages indicated at Item 15(a)(1).
Item 9—Changes in and Disagreements With Accountants on Accounting and Financial Disclosure
None.
Item 9A—Controls and Procedures
Evaluation of Disclosure Controls and Procedures
Our management, with the participation of our Chief Executive Officer and Chief Financial Officer, has evaluated the effectiveness of our disclosure controls and procedures (as defined in Rule 13a-15(e) under the Securities Exchange Act of 1934 (the “Exchange Act”)), as of the end of the period covered by this annual report on Form 10-K. Based on this evaluation, our Chief Executive Officer and Chief Financial Officer have concluded that, as of such date, our disclosure controls and procedures were effective.
In addition, no change in our internal control over financial reporting (as defined in Rule 13a-15(f) under the Exchange Act) occurred during the fourth quarter of our fiscal year ended December 31, 2006 that has materially affected, or is reasonable likely to materially affect, our internal control over financial reporting.
Management’s Report on Internal Control Over Financial Reporting
The management of The TriZetto Group, Inc. (the “Company”) is responsible for establishing and maintaining adequate internal control over financial reporting, as defined in Rule 13a–15(f) under the Securities Exchange Act of 1934. The Company’s internal control over financial reporting is a process designed under the supervision of the Company’s principal executive and principal financial officers to provide reasonable assurance regarding the reliability of financial reporting and the preparation of the Company’s financial statements for external reporting purposes in accordance with U.S. generally accepted accounting principles.
As of December 31, 2006, management assessed the effectiveness of the Company’s internal control over financial reporting based on the framework established in “Internal Control—Integrated Framework” issued by the Committee of Sponsoring Organizations of the Treadway Commission (COSO). Based on this evaluation, management has determined that the Company’s internal control over financial reporting was effective as of December 31, 2006.
Because of its inherent limitations, internal control over financial reporting may not prevent or detect misstatements. Also, projections of any evaluation of effectiveness to future periods are subject to the risk that controls may become inadequate because of changes in conditions, or that the degree of compliance with the policies or procedures may deteriorate.
The scope of management’s assessment of the effectiveness of our internal control over financial reporting as of December 31, 2006 includes all of our businesses except for Plan Data Management, Inc. (“PDM”), which was acquired on December 22, 2006. The acquired PDM business constituted approximately $19.6 million of total assets as of December 31, 2006. In accordance with guidance issued by the Securities and Exchange Commission, our management is permitted to exclude PDM from its assessment as of December 31, 2006.
Ernst & Young LLP, the independent registered public accounting firm that audited the consolidated financial statements of the Company included in this Annual Report on Form 10-K, has issued an attestation report on management’s assessment of the effectiveness of the Company’s internal control over financial reporting as of December 31, 2006. The report, which expresses unqualified opinions on management’s assessment and on the effectiveness of the Company’s internal control over financial reporting as of December 31, 2006, is included in this Item under the heading “Attestation Report of Independent Registered Public Accounting Firm.”
41
Attestation Report of Independent Registered Public Accounting Firm
REPORT OF INDEPENDENT REGISTERED PUBLIC ACCOUNTING FIRM
To the Board of Directors and Stockholders of The TriZetto Group, Inc.
We have audited management’s assessment, included in the accompanying Management’s Report on Internal Control Over Financial Reporting, that The TriZetto Group, Inc. maintained effective internal control over financial reporting as of December 31, 2006, based on criteria established in Internal Control—Integrated Framework issued by the Committee of Sponsoring Organizations of the Treadway Commission (the COSO criteria). The TriZetto Group, Inc.’s management is responsible for maintaining effective internal control over financial reporting and for its assessment of the effectiveness of internal control over financial reporting. Our responsibility is to express an opinion on management’s assessment and an opinion on the effectiveness of the company’s internal control over financial reporting based on our audit.
We conducted our audit in accordance with the standards of the Public Company Accounting Oversight Board (United States). Those standards require that we plan and perform the audit to obtain reasonable assurance about whether effective internal control over financial reporting was maintained in all material respects. Our audit included obtaining an understanding of internal control over financial reporting, evaluating management’s assessment, testing and evaluating the design and operating effectiveness of internal control, and performing such other procedures as we considered necessary in the circumstances. We believe that our audit provides a reasonable basis for our opinion.
A company’s internal control over financial reporting is a process designed to provide reasonable assurance regarding the reliability of financial reporting and the preparation of financial statements for external purposes in accordance with generally accepted accounting principles. A company’s internal control over financial reporting includes those policies and procedures that (1) pertain to the maintenance of records that, in reasonable detail, accurately and fairly reflect the transactions and dispositions of the assets of the company; (2) provide reasonable assurance that transactions are recorded as necessary to permit preparation of financial statements in accordance with generally accepted accounting principles, and that receipts and expenditures of the company are being made only in accordance with authorizations of management and directors of the company; and (3) provide reasonable assurance regarding prevention or timely detection of unauthorized acquisition, use, or disposition of the company’s assets that could have a material effect on the financial statements.
As indicated in the accompanying Management’s Report on Internal Control Over Financial Reporting, management’s assessments of and conclusion on the effectiveness of internal control over financial reporting did not include the internal controls of Plan Data Management, Inc., acquired in 2006, which is included in the 2006 consolidated financial statements of The TriZetto Group, Inc. and represented approximately $19.6 million of total assets as of December 31, 2006. Our audit of internal control over financial reporting of The TriZetto Group, Inc. also did not include an evaluation of the internal control over financial reporting of Plan Data Management, Inc.
Because of its inherent limitations, internal control over financial reporting may not prevent or detect misstatements. Also, projections of any evaluation of effectiveness to future periods are subject to the risk that controls may become inadequate because of changes in conditions, or that the degree of compliance with the policies or procedures may deteriorate.
In our opinion, management’s assessment that The TriZetto Group, Inc. maintained effective internal control over financial reporting as of December 31, 2006, is fairly stated, in all material respects, based on the COSO criteria. Also, in our opinion, The TriZetto Group, Inc. maintained, in all material respects, effective internal control over financial reporting as of December 31, 2006, based on the COSO criteria.
We also have audited, in accordance with the standards of the Public Company Accounting Oversight Board (United States), the consolidated balance sheets of The TriZetto Group, Inc. as of December 31, 2006 and 2005, and the related consolidated statements of operations, stockholders’ equity, and cash flows for each of the three years in the period ended December 31, 2006 of The TriZetto Group, Inc. and our report dated February 16, 2007 expressed an unqualified opinion thereon.
| | |
| | | /s/ ERNST & YOUNG LLP |
| |
| Orange County, California | | |
| February 16, 2007 | | |
Item 9B—Other Information
None.
42
PART III
Item 10—Directors, Executive Officers and Corporate Governance
The information required by this Item is set forth under the captions “Election of Directors,” “Compensation of Executive Officers” and “Corporate Governance” in our definitive Proxy Statement, which will be filed with the Securities and Exchange Commission pursuant to Regulation 14A under the Securities and Exchange Act of 1934 and is incorporated herein by reference.
The Company maintains a Code of Ethics, which is applicable to all directors, officers and employees, including the Company’s Principal Executive Officer, Principal Financial Officer and Principal Accounting Officer and persons performing similar functions on the Company’s website at www.trizetto.com. Any amendment or waiver to the Code of Ethics that applies to our directors or executive officers will be posted on our website or in a report filed with the SEC on Form 8-K. A copy of the Code of Ethics is available upon written request to: Investor Relations, The TriZetto Group, 567 San Nicolas Drive, Suite 360, Newport Beach, California 92660.
Item 11—Executive Compensation
The information required by this Item is set forth under the captions “Compensation of Executive Officers” and “Election of Directions” in our definitive Proxy Statement, which will be filed with the Securities and Exchange Commission pursuant to Regulation 14A under the Securities and Exchange Act of 1934 and is incorporated herein by reference.
Item 12—Security Ownership of Certain Beneficial Owners and Management and Related Stockholder Matters
The information required by this Item is set forth under the captions “Security Ownership of Management and Certain Beneficial Owners” and “Equity Compensation Plan Information” in our definitive Proxy Statement, which will be filed with the Securities and Exchange Commission pursuant to Regulation 14A under the Securities and Exchange Act of 1934 and is incorporated herein by reference.
Item 13—Certain Relationships and Related Transactions, and Director Independence
The information required by this Item is set forth under the captions “Certain Transactions” and “Director Independence” in our definitive Proxy Statement, which will be filed with the Securities and Exchange Commission pursuant to Regulation 14A under the Securities and Exchange Act of 1934 and is incorporated herein by reference.
Item 14—Principal Accounting Fees and Services
The information required by this Item is set forth under the caption “Independent Registered Public Accountant” in our definitive Proxy Statement, which will be filed with the Securities and Exchange Commission pursuant to Regulation 14A under the Securities and Exchange Act of 1934 and is incorporated herein by reference.
43
PART IV
Item 15—Exhibits and Financial Statement Schedules
| | (a) | List of documents filed as part of this Form 10-K: |
See Index to Financial Statements and Schedule on page F-1.
| | (2) | Financial Statement Schedules. |
See Index to Financial Statements and Schedule on page F-1.
The following exhibits are filed (or incorporated by reference herein) as part of this Form 10-K:
| | |
Exhibit
Number | | Description of Exhibit |
| 2.1* | | Agreement and Plan of Reorganization, dated as of May 16, 2000, by and among TriZetto, Elbejay Acquisition Corp., IMS Health Incorporated and Erisco Managed Care Technologies, Inc. (Incorporated by reference to Exhibit 2.1 of TriZetto’s Form 8-K as filed with the SEC on May 19, 2000, File No. 000-27501) |
| |
| 2.2* | | Agreement and Plan of Merger, dated as of November 2, 2000, by and among TriZetto, Cidadaw Acquisition Corp., Resource Information Management Systems, Inc. (“RIMS”), the shareholders of RIMS, Terry L. Kirch and Thomas H. Heimsoth (Incorporated by reference to Exhibit 2.1 of TriZetto’s Form 8-K as filed with the SEC on December 18, 2000, File No. 000-27501) |
| |
| 2.3* | | First Amendment to Agreement and Plan of Merger, dated as of December 1, 2000, by and among TriZetto, Cidadaw Acquisition Corp., RIMS, the shareholders of RIMS, Terry L. Kirch and Thomas H. Heimsoth (Incorporated by reference to Exhibit 2.2 of TriZetto’s Form 8-K as filed with the SEC on December 18, 2000, File No. 000-27501) |
| |
| 2.4* | | Agreement and Plan of Merger, dated as of December 22, 2005, by and among TriZetto, CK Acquisition Corp., CareKey, Inc. (CareKey”), the shareholders of CareKey, and Ido Schoenberg (Incorporated by reference to Exhibit 2.1 of TriZetto’s Form 8-K as filed with the SEC on December 29, 2005, File No. 000-27501) |
| |
| 2.5* | | Agreement and Plan of Merger, dated as of September 12, 2006, by and among TriZetto, Quartz Acquisition Corp., Quality Care Solutions, Inc., and Michael Lee (Incorporated by reference to Exhibit 2.1 of TriZetto’s Form 10-Q as filed with the SEC on November 6, 2006, File No. 000-27501). |
| |
| 2.6* | | Agreement and Plan of Merger, dated as of October 26, 2006, by and among TriZetto, PDM Acquisition Corp., Plan Data Management, Inc., and Stephen B.C. Jackson (Incorporated by reference to Exhibit 2.1 of TriZetto’s Form 8-K as filed with the SEC on December 29, 2006). |
| |
| 3.1* | | Form of Amended and Restated Certificate of Incorporation of TriZetto, as filed with the Delaware Secretary of State effective as of October 14, 1999 (Incorporated by reference to Exhibit 3.2 of TriZetto’s Registration Statement on Form S-1/A, as filed with the SEC on September 14, 1999, File No. 333-84533) |
| |
| 3.2* | | Certificate of Amendment of Amended and Restated Certificate of Incorporation of TriZetto, dated October 3, 2000 (Incorporated by reference to Exhibit 3.1 of TriZetto’s Form 10-Q as filed with the SEC on November 14, 2000, File No. 000-27501) |
| |
| 3.3* | | Certificate of Designation of Rights, Preferences and Privileges of Series A Junior Participating Preferred Stock of TriZetto, dated October 17, 2000 (Incorporated by reference to Exhibit 3.2 of TriZetto’s Form 10-Q as filed with the SEC on November 14, 2000, File No. 000-27501) |
| |
| 3.4* | | Amended and Restated Bylaws of TriZetto effective as of October 7, 1999 (Incorporated by reference to Exhibit 3.4 of TriZetto’s Registration Statement on Form S-1/A, as filed with the SEC on August 18, 1999, File No. 333-84533) |
| |
| 4.1* | | Specimen common stock certificate (Incorporated by reference to Exhibit 4.1 of TriZetto’s Registration Statement on Form S-1/A as filed with the SEC on September 14, 1999, File No. 333-84533) |
| |
| 4.2* | | Rights Agreement, dated October 2, 2000, by and between TriZetto and U.S. Stock Transfer Corporation (Incorporated by reference to Exhibit 2.1 of TriZetto’s Form 8-A12G as filed with the SEC on October 19, 2000, File No. 000-27501) |
| |
| 4.3* | | First Amendment to Rights Agreement, dated December 21, 2004, between the Company and U.S. Stock Transfer Corporation, as Rights Agent (Incorporated by reference to Exhibit 2 of TriZetto’s Form 8A12G/A as filed with the SEC on December 21, 2004, File No. 000-27501) |
45
| | |
Exhibit
Number | | Description of Exhibit |
| 4.4* | | Purchase Agreement, dated as of September 30, 2005, by and between the TriZetto Group, Inc. and UBS Securities, LLC, Banc of America Securities, LLC and William Blair & Company LLC, as the Initial Purchasers (Incorporated by reference to Exhibit 4.1 of TriZetto’s Form 10-Q as filed with the SEC on November 7, 2005, File No. 000-27501) |
| |
| 4.5* | | Registration Rights Agreement, dated as of October 5, 2005, by and between The TriZetto Group, Inc. and UBS Securities, LLC, Banc of America Securities, LLC and William Blair & Company, LLC, as the Initial Purchasers (Incorporated by reference to Exhibit 4.2 of TriZetto’s Form 10-Q as filed with the SEC on November 7, 2005, File No. 000-27501) |
| |
| 4.6* | | Indenture, dated as of October 5, 2005, by and between The TriZetto Group, Inc. and Wells Fargo Bank, National Association, as trustee (Incorporated by reference to Exhibit 4.3 of TriZetto’s Form 10-Q as filed with the SEC on November 7, 2005, File No. 000-27501) |
| |
| 4.7* | | Form of Global 2.75% Convertible Senior Note due 2025 (Included in Exhibit 4.3 Incorporated by reference to Exhibit 4.4 of TriZetto’s Form 10-Q as filed with the SEC on November 7, 2005, File No. 000-27501) |
| |
| 10.1* | | First Amended and Restated 1998 Stock Option Plan (Incorporated by reference to Exhibit 4.1 of TriZetto’s Form S-8 as filed with the SEC on August 7, 2000, File No. 333-43220) |
| |
| 10.2* | | Form of 1998 Incentive Stock Option Agreement (Incorporated by reference to Exhibit 10.2 of TriZetto’s Registration Statement on Form S-1 as filed with the SEC on August 5, 1999, File No. 333-84533) |
| |
| 10.3* | | Form of 1998 Non-Qualified Stock Option Agreement (Incorporated by reference to Exhibit 10.3 of TriZetto’s Registration Statement on Form S-1 as filed with the SEC on August 5, 1999, File No. 333-84533) |
| |
| 10.4* | | 1999 Employee Stock Purchase Plan (Incorporated by reference to Exhibit 10.4 of TriZetto’s Registration Statement on Form S-1/A as filed with the SEC on August 18, 1999, File No. 333-84533) |
| |
| 10.5* | | RIMS Stock Option Plan (Incorporated by reference to Exhibit 4.1 of TriZetto’s Form S-8 as filed with the SEC on December 21, 2000, File No. 000-27501) |
| |
| 10.6* | | Form of Indemnification Agreement (Incorporated by reference to Exhibit 10.7 of TriZetto’s Registration Statement on Form S-1 as filed with the SEC on August 5, 1999, File No. 333-84533) |
| |
| 10.7* | | Form of Restricted Stock Agreement between TriZetto and certain consultants and employees (Incorporated by reference to Exhibit 10.3 of TriZetto’s Form 10-Q as filed with the SEC on August 14, 2000, File No. 000-27501) |
| |
| 10.8* | | Form of Change of Control Agreement entered into by and between TriZetto and certain executive officers of TriZetto effective as of August 24, 2006 (Incorporated by reference to Exhibit 10.1 of TriZetto’s Form 8-K as filed with the SEC on August 29, 2006, File No. 000-27501) |
| |
| 10.9* | | First Amended and Restated Investor Rights Agreement, dated April 9, 1999 by and among Raymond Croghan, Jeffrey Margolis, TriZetto, and Series A and Series B Preferred Stockholders (Incorporated by reference to Exhibit 10.8 of TriZetto’s Registration Statement on Form S-1/A, as filed with the SEC on August 18, 1999, File No. 333-84533) |
| |
| 10.10* | | Office Lease Agreement, dated April 26, 1999, between St. Paul Properties, Inc. and TriZetto (including addendum) (Incorporated by reference to Exhibit 10.10 of TriZetto’s Registration Statement on Form S-1 as filed with the SEC on August 5, 1999, File No. 333-84533) |
| |
| 10.11* | | Sublease Agreement, dated December 18, 1998, between TPI Petroleum, Inc. and TriZetto (including underlying Office Lease Agreement by and between St. Paul Properties, Inc. and Total, Inc.) (Incorporated by reference to Exhibit 10.11 of TriZetto’s Registration Statement on Form S-1 as filed with the SEC on August 5, 1999, File No. 333-84533) |
| |
| 10.12* | | First Modification and Ratification of Lease, dated November 1, 1999, by and between TriZetto and St. Paul Properties, Inc. (Incorporated by reference to Exhibit 10.22 of TriZetto’s Form 10-K as filed with the SEC on March 30, 2000, File No. 000-27501) |
| |
| 10.13* | | Second Modification and Ratification of Lease, dated December 1999, by and between TriZetto and St. Paul Properties, Inc. (Incorporated by reference to Exhibit 10.23 of TriZetto’s Form 10-K as filed with the SEC on March 30, 2000, File No. 000-27501) |
| |
| 10.14* | | Third Modification and Ratification of Lease, dated January 15, 2000, by and between TriZetto and St. Paul Properties, Inc. (Incorporated by reference to Exhibit 10.16 of TriZetto’s Form 10-K as filed with the SEC on April 2, 2001, File No. 000-27501) |
| |
| 10.15* | | Fourth Modification and Ratification of Lease, dated October 15, 2000, by and between TriZetto and St. Paul Properties, Inc. (Incorporated by reference to Exhibit 10.17 TriZetto’s Form 10-K as filed with the SEC on April 2, 2001, File No. 000-27501) |
| |
| 10.16 | | Fifth Modification and Ratification of Lease, dated October 31, 2002, by and between TriZetto and St. Paul Properties, Inc. |
45
| | |
Exhibit
Number | | Description of Exhibit |
| 10.17 | | Sixth Modification and Ratification of Lease, dated May 19, 2003, by and between TriZetto and St. Paul Properties, Inc. |
| |
| 10.18 | | Seventh Modification and Ratification of Lease, dated April 12, 2004, by and between TriZetto and St. Paul Properties, Inc. |
| |
| 10.19 | | Eighth Modification and Ratification of Lease, dated April 7, 2006, by and between TriZetto and St. Paul Properties, Inc. |
| |
| 10.20* | | Form of Voting Agreement (Incorporated by reference to Exhibit 2.1 of TriZetto’s Form 8-K as filed with the SEC on May 19, 2000, File No. 000-27501) |
| |
| 10.21* | | Stockholder Agreement, dated as of October 2, 2000, by and between TriZetto and IMS Health Incorporated (Incorporated by reference to Exhibit 10.29 of TriZetto’s Form 10-K as filed with the SEC on April 2, 2001, File No. 000-27501) |
| |
| 10.22* | | Registration Rights Agreement, dated as of October 2, 2000, by and between TriZetto and IMS Health Incorporated (Incorporated by reference to Exhibit 10.30 of TriZetto’s Form 10-K as filed with the SEC on April 2, 2001, File No. 000-27501) |
| |
| 10.23* | | Form of Restricted Stock Agreement Between TriZetto and Certain Employees (Incorporated by reference to Exhibit 10.39 of TriZetto’s Form 10-K as filed with the SEC on March 31, 2003, File No. 000-27501) |
| |
| 10.24* | | Form of Indemnification Agreement (Incorporated by reference to Exhibit 10.40 of TriZetto’s Form 10-Q as filed with the SEC on May 15, 2003, File No. 000-27501) |
| |
| 10.25* | | Form of Restricted Stock Agreement between TriZetto and Certain Employees (Incorporated by reference to Exhibit 10.2 of Trizetto’s Form 10-Q as filed with the SEC on May 10, 2004, File No. 000-27501) |
| |
| 10.26* | | Form of Restricted Stock Agreement between TriZetto and Certain Employees (Incorporated by reference to Exhibit 10.1 of Trizetto’s Form 10-Q as filed with the SEC on August 6, 2004, File No. 000-27501) |
| |
| 10.27* | | Form of 1998 Long-term Incentive Plan Stock Option Award Agreement (Incorporated by reference to Exhibit 10.1 of Trizetto’s Form 10-Q as filed with the SEC on November 9, 2004, File No. 000-27501) |
| |
| 10.28* | | Credit Agreement, dated December 21, 2004, by and among TriZetto, each of TriZetto’s subsidiaries, and Wells Fargo Foothill, Inc. (Incorporated by reference to Exhibit 10.48 of TriZetto’s Form 10-K as filed with the SC on February 14, 2005, File No. 0-27501) |
| |
| 10.29* | | Share Purchase Agreement, dated December 21, 2004, by and between TriZetto and IMS Health, Inc. (Incorporated by reference to Exhibit 10.49 of TriZetto’s Form 10-K as filed with the SC on February 14, 2005, File No. 0-27501) |
| |
| 10.30* | | Subordinated Promissory Note, dated December 21, 2004, payable by TriZetto to IMS Health, Inc. (Incorporated by reference to Exhibit 10.50 of TriZetto’s Form 10-K as filed with the SC on February 14, 2005, File No. 0-27501) |
| |
| 10.31* | | Letter Agreement between TriZetto and VA Partners, LLC dated December 5, 2004 (Incorporated by reference to Exhibit 10.51 of TriZetto’s Form 10-K as filed with the SC on February 14, 2005, File No. 0-27501) |
| |
| 10.32* | | Amended and Restated Executive Employment Agreement, dated January 1, 2006, by and between the Company and Jeffrey H. Margolis (Incorporated by reference to Exhibit 10.1 of TriZetto’s Form 10-Q as filed with the SEC on November 6, 2006, File No. 000-27501) |
| |
| 10.33* | | Cash Bonus Plan (Incorporated by reference to Exhibit 10.1 of TriZetto’s Form 8-K as filed with the SEC on May 15, 2006, File No. 000-27501) |
| |
| 10.34* | | 1998 Long-Term Incentive Plan, dated April 7, 2005 (Incorporated by reference to Appendix B of TriZetto’s proxy statement on Schedule 14A as filed with the SEC on April 15, 2004) |
| |
| 10.35* | | 2005 Amendment to 1998 Long-Term Incentive Plan, dated April 7, 2005 (Incorporated by reference to Appendix B of TriZetto’s proxy statement on Schedule 14A as filed with the SEC on April 18, 2005) |
| |
| 10.36* | | 2006 Amendment to 1998 Long-Term Incentive Plan, dated April 7, 2005 (Incorporated by reference to Appendix A of TriZetto’s proxy statement on Schedule 14A as filed with the SEC on April 25, 2006) |
| |
| 10.37* | | Amended and Restated Employee Stock Purchase Plan, effective April 7, 2005 (Incorporated by reference to Appendix C of TriZetto’s proxy statement on Schedule 14A as filed with the SEC on April 18, 2005) |
| |
| 10.38* | | Executive Deferred Compensation Plan, dated as of June 30, 2005, between TriZetto and Certain Key Employees (Incorporated by reference to Exhibit 10.1 of TriZetto’s Form 8-K as filed with the SEC on December 27, 2005, File No. 000-27501) |
46
| | |
Exhibit
Number | | Description of Exhibit |
| 10.39 | | Amended and Restated Credit Agreement, dated January 10, 2007, by and among TriZetto, each of TriZetto’s subsidiaries, and Wells Fargo Foothill, Inc. |
| |
| 10.40* | | Settlement and License Agreement, dated September 7, 2006, by and between TriZetto and McKesson Information Solutions LLC (Incorporated by reference to Exhibit 10.3 of TriZetto’s Form 10-Q as filed with the SEC on November 6, 2006, File No. 000-27501). |
| |
| 10.41 | | Form of Restricted Stock Award Agreement (Performance Compensation Award) between TriZetto and certain employees. |
| |
| 14.1* | | Code of Ethics (Incorporated by reference to Exhibit 14.1 of TriZetto’s Form 10-Q as filed with the SEC on August 14, 2003, File No. 000-27501) |
| |
| 21.1 | | Current Subsidiaries of TriZetto |
| |
| 23.1 | | Consent of Ernst & Young LLP, Independent Registered Public Accounting Firm |
| |
| 31.1 | | Certification of CEO Pursuant to Securities Exchange Act Rules 13a-14 and 15d-14 as Adopted Pursuant to Section 302 of the Sarbanes-Oxley Act of 2002 |
| |
| 31.2 | | Certification of CFO Pursuant to Securities Exchange Act Rules 13a-14 and 15d-14 as Adopted Pursuant to Section 302 of the Sarbanes-Oxley Act of 2002 |
| |
| 32.1 | | Certification of CEO and CFO Pursuant to 18 U.S.C. Section 1350 as Adopted Pursuant to Section 906 of the Sarbanes-Oxley Act of 2002 |
47
SIGNATURES
Pursuant to the requirements of Section 13 or 15(d) of the Securities Exchange Act of 1934, the registrant has duly caused this report to be signed on its behalf by the undersigned, thereunto duly authorized on March 16, 2007.
| | |
| THE TRIZETTO GROUP, INC. |
| |
| By: | | /s/ Jeffrey H. Margolis |
| | Jeffrey H. Margolis, Chief Executive Officer and Chairman of the Board |
POWER OF ATTORNEY
Each of the undersigned hereby constitutes and appoints Jeffrey H. Margolis and James C. Malone, or either of them, his/her true and lawful attorney-in-fact and agent, with full power of substitution and re-substitution, to sign any or all amendments to the Form 10-K of The TriZetto Group, Inc. for the year ended December 31, 2006 and to file the same, with all exhibits thereto, and other documents in connection therewith, with the Securities and Exchange Commission, hereby ratifying and confirming all that said attorney-in-fact, or his/her substitute or substitutes, may do or cause to be done by virtue hereof in any and all capacities.
Pursuant to the requirements of the Securities Exchange Act of 1934, this report has been signed below by the following persons on behalf of the registrant and in the capacities and on the date indicated.
| | | | |
Signature | | Title | | Date |
| | |
/s/ Jeffrey H. Margolis | | | | |
| Jeffrey H. Margolis | | Chief Executive Officer and Chairman of the Board (principal executive officer) | | March 16, 2007 |
| | |
/s/ James C. Malone | | | | |
| James C. Malone | | Executive Vice President of Finance and Chief Financial Officer (principal financial and accounting officer) | | March 16, 2007 |
| | |
/s/ Lois A. Evans | | | | March 16, 2007 |
| Lois A. Evans | | Director | | |
| | |
/s/ Thomas B. Johnson | | | | March 16, 2007 |
| Thomas B. Johnson | | Director | | |
| | |
/s/ L. William Krause | | | | March 16, 2007 |
| L. William Krause | | Director | | |
| | |
/s/ Paul F. LeFort | | | | March 16, 2007 |
| Paul F. LeFort | | Director | | |
| | |
/s/ Donald J. Lothrop | | | | March 16, 2007 |
| Donald J. Lothrop | | Director | | |
| | |
/s/ Jerry P. Widman | | | | March 16, 2007 |
| Jerry P. Widman | | Director | | |
48
THE TRIZETTO GROUP, INC.
INDEX TO CONSOLIDATED FINANCIAL INFORMATION
F-1
REPORT OF INDEPENDENT REGISTERED PUBLIC ACCOUNTING FIRM
To the Board of Directors and Stockholders of The TriZetto Group, Inc.
We have audited the accompanying consolidated balance sheets of The TriZetto Group, Inc. as of December 31, 2006 and 2005, and the related consolidated statements of operations, stockholders’ equity, and cash flows for each of the three years in the period ended December 31, 2006. Our audits also included the financial statement schedule listed in the Index at Item 15. These financial statements and schedule are the responsibility of the Company’s management. Our responsibility is to express an opinion on these financial statements and schedule based on our audits.
We conducted our audits in accordance with the standards of the Public Company Accounting Oversight Board (United States). Those standards require that we plan and perform the audit to obtain reasonable assurance about whether the financial statements are free of material misstatement. An audit includes examining, on a test basis, evidence supporting the amounts and disclosures in the financial statements. An audit also includes assessing the accounting principles used and significant estimates made by management, as well as evaluating the overall financial statement presentation. We believe that our audits provide a reasonable basis for our opinion.
In our opinion, the financial statements referred to above present fairly, in all material respects, the consolidated financial position of The TriZetto Group, Inc. at December 31, 2006 and 2005, and the consolidated results of its operations and its cash flows for each of the three years in the period ended December 31, 2006, in conformity with U.S. generally accepted accounting principles. Also, in our opinion, the related financial statement schedule, when considered in relation to the basic financial statements taken as a whole, presents fairly in all material respects the information set forth therein.
As discussed in Note 1 to the consolidated financial statements, effective January 1, 2006, the Company adopted Statement of Financial Accounting Standards No. 123 (revised 2004), “Share-Based Payment.”
We also have audited, in accordance with the standards of the Public Company Accounting Oversight Board (United States), the effectiveness of The TriZetto Group, Inc.’s internal control over financial reporting as of December 31, 2006, based on criteria established in Internal Control-Integrated Framework issued by the Committee of Sponsoring Organizations of the Treadway Commission and our report dated February 16, 2007 expressed an unqualified opinion thereon.
| | |
| | /s/ ERNST & YOUNG LLP |
| |
| Orange County, California | | |
| February 16, 2007 | | |
F-2
THE TRIZETTO GROUP, INC.
CONSOLIDATED BALANCE SHEETS
(in thousands, except per share data)
| | | | | | | | |
| | | December 31, | |
| | | 2006 | | | 2005 | |
Assets | | | | | | | | |
Current assets: | | | | | | | | |
Cash and cash equivalents | | $ | 107,057 | | | $ | 106,940 | |
Restricted cash | | | 921 | | | | 1,543 | |
Accounts receivable, less allowances of $3,770 and $855 at December 31, 2006 and 2005, respectively | | | 64,386 | | | | 41,745 | |
Deferred tax assets | | | 14,100 | | | | — | |
Prepaid expenses and other current assets | | | 11,415 | | | | 11,375 | |
| | | | | | | | |
Total current assets | | | 197,879 | | | | 161,603 | |
Property and equipment, net | | | 26,777 | | | | 25,730 | |
Capitalized software development costs, net | | | 27,913 | | | | 28,724 | |
Goodwill | | | 90,337 | | | | 87,170 | |
Other intangible assets, net | | | 27,347 | | | | 3,335 | |
Other assets | | | 12,347 | | | | 11,177 | |
| | | | | | | | |
Total assets | | $ | 382,600 | | | $ | 317,739 | |
| | | | | | | | |
Liabilities and Stockholders’ Equity | | | | | | | | |
Current liabilities: | | | | | | | | |
Notes payable | | $ | 115 | | | $ | 120 | |
Current portion of capital lease obligations | | | 1,461 | | | | 1,979 | |
Accounts payable | | | 18,091 | | | | 14,959 | |
Accrued liabilities | | | 61,595 | | | | 56,957 | |
Deferred revenue | | | 30,508 | | | | 35,625 | |
| | | | | | | | |
Total current liabilities | | | 111,770 | | | | 109,640 | |
Long-term convertible debt | | | 100,000 | | | | 100,000 | |
Long-term revolving line of credit | | | 12,000 | | | | — | |
Other long-term liabilities | | | 2,340 | | | | 1,752 | |
Capital lease obligations | | | 2,030 | | | | 1,065 | |
Deferred tax liabilities | | | 14,100 | | | | — | |
Deferred revenue | | | 6,453 | | | | 3,924 | |
| | | | | | | | |
Total liabilities | | | 248,693 | | | | 216,381 | |
| | | | | | | | |
Commitments and contingencies (Note 9) | | | | | | | | |
| | |
Stockholders’ equity: | | | | | | | | |
Preferred stock: $0.001 par value; shares authorized: 4,000 (5,000 authorized net of 1,000 designated as Series A Junior Participating Preferred); shares issued and outstanding: zero in 2006 and 2005 | | | — | | | | — | |
Series A Junior Participating Preferred Stock: $0.001 par value; shares authorized: 1,000; shares issued and outstanding: zero in 2006 and 2005 | | | — | | | | — | |
Common stock: $0.001 par value; shares authorized: 95,000; shares issued and outstanding: 43,497 in 2006 and 42,104 in 2005 | | | 43 | | | | 42 | |
Additional paid-in capital | | | 376,633 | | | | 362,186 | |
Deferred stock compensation | | | — | | | | (2,986 | ) |
Accumulated deficit | | | (242,769 | ) | | | (257,884 | ) |
| | | | | | | | |
Total stockholders’ equity | | | 133,907 | | | | 101,358 | |
| | | | | | | | |
Total liabilities and stockholders’ equity | | $ | 382,600 | | | $ | 317,739 | |
| | | | | | | | |
See accompanying notes.
F-3
THE TRIZETTO GROUP, INC.
CONSOLIDATED STATEMENTS OF OPERATIONS
(in thousands, except per share data)
| | | | | | | | | | | | |
| | | Years Ended December 31, | |
| | | 2006 | | | 2005 | | | 2004 | |
Revenue: | | | | | | | | | | | | |
Services and other | | $ | 272,943 | | | $ | 243,483 | | | $ | 223,257 | |
Products | | | 74,994 | | | | 48,736 | | | | 51,308 | |
| | | | | | | | | | | | |
Total revenue | | | 347,937 | | | | 292,219 | | | | 274,565 | |
| | | | | | | | | | | | |
Operating costs and expenses: | | | | | | | | | | | | |
Cost of revenue - services and other | | | 165,229 | | | | 144,318 | | | | 157,573 | |
Cost of revenue - products (excludes amortization of acquired technology) | | | 14,175 | | | | 14,210 | | | | 12,025 | |
Research and development | | | 42,789 | | | | 31,655 | | | | 30,398 | |
Selling, general and administrative | | | 103,809 | | | | 76,758 | | | | 59,980 | |
Amortization of acquired technology | | | 4,120 | | | | 660 | | | | 440 | |
Amortization of acquired other intangible assets | | | 867 | | | | 2,225 | | | | 3,804 | |
| | | | | | | | | | | | |
Total operating expenses | | | 330,989 | | | | 269,826 | | | | 264,220 | |
| | | | | | | | | | | | |
Income from operations | | | 16,948 | | | | 22,393 | | | | 10,345 | |
Interest income | | | 3,823 | | | | 1,619 | | | | 583 | |
Interest expense | | | (3,342 | ) | | | (1,579 | ) | | | (1,369 | ) |
Other income | | | 180 | | | | — | | | | — | |
| | | | | | | | | | | | |
Income before provision for income taxes | | | 17,609 | | | | 22,433 | | | | 9,559 | |
Provision for income taxes | | | (2,494 | ) | | | (412 | ) | | | (1,101 | ) |
| | | | | | | | | | | | |
Net income | | $ | 15,115 | | | $ | 22,021 | | | $ | 8,458 | |
| | | | | | | | | | | | |
Net income per share: | | | | | | | | | | | | |
Basic | | $ | 0.36 | | | $ | 0.52 | | | $ | 0.18 | |
| | | | | | | | | | | | |
Diluted | | $ | 0.33 | | | $ | 0.48 | | | $ | 0.18 | |
| | | | | | | | | | | | |
Shares used in computing net income per share: | | | | | | | | | | | | |
Basic | | | 42,389 | | | | 41,948 | | | | 46,794 | |
| | | | | | | | | | | | |
Diluted | | | 45,691 | | | | 45,503 | | | | 48,157 | |
| | | | | | | | | | | | |
Certain reclassifications have been made to prior year amounts to conform to current year presentation
with respect to services and products revenue and cost of revenue, with no effect on net income.
See accompanying notes.
F-4
THE TRIZETTO GROUP, INC.
CONSOLIDATED STATEMENTS OF STOCKHOLDERS’ EQUITY
Years Ended December 31, 2006, 2005 and 2004
(in thousands)
| | | | | | | | | | | | | | | | | | | | | | | |
| | | Common Stock | | | Additional
Paid-in
Capital | | | Deferred
Stock
Compensation | | | Accumulated Deficit | | | Total Stockholders’
Equity | |
| | | Shares | | | Amount | | | | | |
Balance, December 31, 2003 | | 46,870 | | | $ | 47 | | | $ | 402,702 | | | $ | (863 | ) | | $ | (288,363 | ) | | $ | 113,523 | |
Issuance of common stock to ValueAct Capital | | 6,600 | | | | 7 | | | | 44,543 | | | | — | | | | — | | | | 44,550 | |
Issuance of restricted stock grants | | 422 | | | | — | | | | 2,604 | | | | (2,604 | ) | | | — | | | | — | |
Stock-based compensation | | — | | | | — | | | | — | | | | 594 | | | | | | | | 594 | |
Employee exercise of common stock options and purchase of common stock | | 452 | | | | — | | | | 1,772 | | | | — | | | | — | | | | 1,772 | |
Repurchase of common stock from IMS | | (12,143 | ) | | | (12 | ) | | | (81,952 | ) | | | — | | | | — | | | | (81,964 | ) |
Net income | | — | | | | — | | | | — | | | | — | | | | 8,458 | | | | 8,458 | |
| | | | | | | | | | | | | | | | | | | | | | | |
Balance, December 31, 2004 | | 42,201 | | | | 42 | | | | 369,669 | | | | (2,873 | ) | | | (279,905 | ) | | | 86,933 | |
Employee exercise of common stock options and purchase of common stock | | 1,370 | | | | 2 | | | | 10,252 | | | | — | | | | — | | | | 10,254 | |
Stock-based compensation | | — | | | | — | | | | 191 | | | | 1,206 | | | | — | | | | 1,397 | |
Issuance of restricted stock grants | | 100 | | | | — | | | | 1,319 | | | | (1,319 | ) | | | — | | | | — | |
Repurchase of common stock from ValueAct Capital | | (600 | ) | | | (1 | ) | | | (5,297 | ) | | | — | | | | — | | | | (5,298 | ) |
Repurchase of common stock related to convertible debt | | (1,000 | ) | | | (1 | ) | | | (14,499 | ) | | | — | | | | — | | | | (14,500 | ) |
Issuance of common stock for purchase of software patent | | 33 | | | | — | | | | 551 | | | | — | | | | — | | | | 551 | |
Net income | | — | | | | — | | | | — | | | | — | | | | 22,021 | | | | 22,021 | |
| | | | | | | | | | | | | | | | | | | | | | | |
Balance, December 31, 2005 | | 42,104 | | | | 42 | | | | 362,186 | | | | (2,986 | ) | | | (257,884 | ) | | | 101,358 | |
Employee exercise of common stock options and purchase of common stock | | 1,131 | | | | 1 | | | | 10,007 | | | | — | | | | — | | | | 10,008 | |
Elimination of deferred stock compensation in accordance with SFAS No. 123R | | — | | | | — | | | | (2,986 | ) | | | 2,986 | | | | — | | | | — | |
Stock-based compensation | | — | | | | — | | | | 7,426 | | | | — | | | | — | | | | 7,426 | |
Issuance of restricted stock grants | | 262 | | | | — | | | | — | | | | — | | | | — | | | | — | |
Net income | | — | | | | — | | | | — | | | | — | | | | 15,115 | | | | 15,115 | |
| | | | | | | | | | | | | | | | | | | | | | | |
Balance, December 31, 2006 | | 43,497 | | | $ | 43 | | | $ | 376,633 | | | $ | — | | | $ | (242,769 | ) | | $ | 133,907 | |
| | | | | | | | | | | | | | | | | | | | | | | |
See accompanying notes.
F-5
THE TRIZETTO GROUP, INC.
CONSOLIDATED STATEMENTS OF CASH FLOWS
(in thousands)
| | | | | | | | | | | | |
| | | Years Ended December 31, | |
| | | 2006 | | | 2005 | | | 2004 | |
Cash flows from operating activities: | | | | | | | | | | | | |
Net income | | $ | 15,115 | | | $ | 22,021 | | | $ | 8,458 | |
Adjustments to reconcile net income to net cash provided by operating activities: | | | | | | | | | | | | |
Provision for (benefit from) doubtful accounts and sales allowance | | | 3,214 | | | | (597 | ) | | | (2,299 | ) |
Stock-based compensation | | | 7,426 | | | | 1,397 | | | | 594 | |
(Gain) loss on disposal of property and equipment | | | (158 | ) | | | 70 | | | | — | |
Depreciation and amortization | | | 22,237 | | | | 23,282 | | | | 21,106 | |
Amortization of other intangible assets | | | 4,987 | | | | 2,885 | | | | 4,244 | |
Recovery from contracts | | | — | | | | (2,877 | ) | | | (1,353 | ) |
Increase in cash surrender value of life insurance policies | | | (683 | ) | | | (151 | ) | | | — | |
Changes in assets and liabilities (net of acquisition): | | | | | | | | | | | | |
Restricted cash | | | 622 | | | | (88 | ) | | | 23 | |
Accounts receivable | | | (23,794 | ) | | | 12,825 | | | | (12,940 | ) |
Prepaid expenses and other current assets | | | (1,092 | ) | | | (3,386 | ) | | | (496 | ) |
Other assets | | | (486 | ) | | | (8,384 | ) | | | (914 | ) |
Accounts payable | | | 4,911 | | | | 2,417 | | | | 1,488 | |
Accrued liabilities | | | 11,746 | | | | (2,620 | ) | | | 939 | |
Deferred revenue | | | (3,891 | ) | | | (2,969 | ) | | | 17,034 | |
| | | | | | | | | | | | |
Net cash provided by operating activities | | | 40,154 | | | | 43,825 | | | | 35,884 | |
| | | | | | | | | | | | |
Cash flows from investing activities: | | | | | | | | | | | | |
Sale of short-term investments, net | | | — | | | | 1,203 | | | | 17,640 | |
Purchase of property and equipment and software licenses | | | (10,575 | ) | | | (7,171 | ) | | | (8,131 | ) |
Capitalization of software development costs | | | (8,568 | ) | | | (8,608 | ) | | | (8,610 | ) |
Purchase of intangible assets | | | — | | | | (572 | ) | | | (2,138 | ) |
Acquisitions, net of cash acquired | | | (40,581 | ) | | | (26,799 | ) | | | (89 | ) |
| | | | | | | | | | | | |
Net cash used in investing activities | | | (59,724 | ) | | | (41,947 | ) | | | (1,328 | ) |
| | | | | | | | | | | | |
Cash flows from financing activities: | | | | | | | | | | | | |
Proceeds from revolving line of credit | | | 37,000 | | | | 78,000 | | | | 72,000 | |
Proceeds from convertible note | | | — | | | | 100,000 | | | | — | |
Proceeds from debt financing | | | 992 | | | | 1,511 | | | | 1,110 | |
Proceeds from capital leases | | | — | | | | 139 | | | | 1,150 | |
Payments on revolving line of credit | | | (25,000 | ) | | | (90,000 | ) | | | (80,000 | ) |
Payments on notes payable | | | (997 | ) | | | (40,991 | ) | | | (1,429 | ) |
Payments on term note | | | — | | | | — | | | | (9,375 | ) |
Payments on capital leases | | | (2,316 | ) | | | (4,542 | ) | | | (5,321 | ) |
Proceeds from sale of common stock | | | — | | | | — | | | | 44,550 | |
Payment for repurchase of common stock | | | — | | | | (19,798 | ) | | | (44,550 | ) |
Employee exercises of stock options and purchase of common stock | | | 10,008 | | | | 10,254 | | | | 1,772 | |
| | | | | | | | | | | | |
Net cash provided by (used in) financing activities | | | 19,687 | | | | 34,573 | | | | (20,093 | ) |
| | | | | | | | | | | | |
Net increase in cash and cash equivalents | | | 117 | | | | 36,451 | | | | 14,463 | |
Cash and cash equivalents at beginning of year | | | 106,940 | | | | 70,489 | | | | 56,026 | |
| | | | | | | | | | | | |
Cash and cash equivalents at end of year | | $ | 107,057 | | | $ | 106,940 | | | $ | 70,489 | |
| | | | | | | | | | | | |
See Note 15 for supplemental disclosure of additional cash flow information,
including certain non-cash investing and financing activities.
See accompanying notes.
F-6
THE TRIZETTO GROUP, INC.
NOTES TO CONSOLIDATED FINANCIAL STATEMENTS
1. Formation and Business of the Company
The TriZetto Group, Inc. (the “Company”) was incorporated in the state of Delaware on May 27, 1997. The Company develops, licenses and supports proprietary and third-party software products for the healthcare industry. The Company also provides hosting, applications management, business process management, consulting and other services primarily to the healthcare industry. The Company provides access to its hosted solutions either through the Internet or through traditional networks and sells its software and services to customers primarily in the United States.
2. Summary of Significant Accounting Policies
Basis of consolidation
The consolidated financial statements include the accounts of the Company and its wholly-owned subsidiaries. All intercompany transactions have been eliminated in consolidation.
Liquidity and capital resources
The Company has generated net income of $15.1 million, $22.0 million and $8.5 million for the years ended December 31, 2006, 2005 and 2004, respectively, and has an accumulated deficit of $242.8 million at December 31, 2006. The Company has generated cash from operating activities of $40.2 million, $43.8 million and $35.9 million for the years ended December 31, 2006, 2005, and 2004, respectively. The Company has total cash, cash equivalents and restricted cash of $108.0 million and net working capital of $86.1 million at December 31, 2006. Based on the Company’s current operating plan, management believes existing cash, cash equivalents and short-term investment balances, cash forecasted by management to be generated by operations and borrowings from existing credit facilities will be sufficient to meet the Company’s working capital and capital requirements through at least December 31, 2007. However, if events or circumstances occur such that the Company does not meet its operating plan as expected, the Company may be required to seek additional capital and/or to reduce certain discretionary spending, which could have a material adverse effect on the Company’s ability to achieve its intended business objectives. The Company may seek additional financing, which may include debt and/or equity financing or funding through third party agreements. There can be no assurance that any additional financing will be available on acceptable terms, or available at all. Any equity financing may result in dilution to existing stockholders and any debt financing may include restrictive covenants.
Company owned life insurance
The Company has purchased life insurance policies to fund its obligations under certain deferred compensation plans for officers, key employees and directors. Cash surrender values of these policies are adjusted for fluctuations in the market value of underlying investments. The cash surrender value is adjusted each reporting period and any gain or loss is included with other income and expense in the Company’s consolidated statements of operations.
Use of estimates
The preparation of consolidated financial statements in conformity with U.S. generally accepted accounting principles requires management to make estimates and assumptions that affect the reported amounts of assets and liabilities and disclosure of contingent assets and liabilities at the date of the financial statements and reported amounts of revenues and expenses during the reporting period. Actual results could differ from those estimates.
Concentration of credit risk
Financial instruments that potentially subject the Company to a concentration of credit risk consist of cash and cash equivalents, short-term investments and accounts receivable. Cash and cash equivalents are deposited in demand and money market accounts in three financial institutions. Deposits held with banks may exceed the amount of insurance provided on such deposits. The Company has not experienced any losses on its deposits of cash and cash equivalents. The Company’s accounts receivable are derived from revenue earned from customers primarily located in the United States. The Company generally requires no collateral from its customers. The Company maintains an allowance for doubtful accounts receivable based upon the expected collectibility of individual accounts.
One customer, The Regence Group, accounted for more than 10% of the Company’s consolidated revenue in 2006. No single customer accounted for more than 10% of the Company’s accounts receivable in 2006. In 2005, one customer, The Regence Group, accounted for more than 10% of the Company’s accounts receivable and two customers, The Regence Group and United Healthcare Services, Inc., each accounted for more than 10% of its consolidated revenue. No single customer accounted for more than 10% of the Company’s accounts receivable and consolidated revenues in 2004.
F-7
THE TRIZETTO GROUP, INC.
NOTES TO CONSOLIDATED FINANCIAL STATEMENTS—(Continued)
Fair value of financial instruments
Carrying amounts of certain of the Company’s financial instruments including cash and cash equivalents, short-term investments, accounts receivable and accounts payable approximate fair value due to their short maturities. Based on borrowing rates currently available to the Company for loans with similar terms, the carrying value of its debt obligations approximates fair value.
Cash and cash equivalents
The Company considers all highly liquid investments purchased with an original maturity of three months or less to be cash equivalents. Cash and cash equivalents include money market funds, commercial paper and various deposit accounts.
Short-term investments
Short-term investments include money market funds, commercial paper, and various deposit accounts.
Restricted cash
Restricted cash consists of $921,000 in letters of credit issued for certain operating leases.
Property and equipment
Property and equipment are stated at cost and are depreciated on a straight-line basis over their estimated useful lives: computer equipment, other equipment and software are depreciated over three to twenty years, and furniture and fixtures are depreciated over seven years. Leasehold improvements are amortized over their estimated useful lives or the lease term, if shorter. Upon retirement or sale, the cost and related accumulated depreciation are removed from the balance sheet and the resulting gain or loss is reflected in operations. Maintenance and repairs are charged to operations as incurred.
Goodwill
Under Financial Accounting Standards Board (“FASB”) Statement Nos. 141 and 142, “Business Combinations” and “Goodwill and Other Intangible Assets,” respectively, goodwill and intangible assets deemed to have indefinite lives are not amortized but, instead, are tested annually or on an interim basis if events or circumstances indicate that the fair value of the asset has decreased below its carrying value.
Long-lived assets, including other intangible assets
Other intangible assets arising from the Company’s acquisitions consist of customer lists, core technology, consulting contracts, tradenames and intellectual property, which are being amortized on a straight-line basis over their estimated useful lives of five to ten years. Software technology rights are being amortized on a straight-line basis over the lesser of the contract term or five years. Long-lived assets and other intangible assets are reviewed for impairment when events or changes in circumstances indicate the carrying amount of an asset may not be recoverable in accordance with FASB Statement No. 144, “Accounting for the Impairment or Disposal of Long–Lived Assets.” Recoverability is measured by comparison of the asset’s carrying amount to future net undiscounted cash flows the assets are expected to generate. If such assets are considered to be impaired, the impairment to be recognized is measured by the amount by which the carrying amount of the assets exceeds the projected discounted future net cash flows arising from the assets. The discount rate applied to these cash flows is based on a discount rate commensurate with the risks involved.
Revenue recognition
The Company recognizes revenue when persuasive evidence of an arrangement exists, the product or service has been delivered, fees are fixed or determinable, collection is reasonably assured and all other significant obligations have been fulfilled. The Company’s revenue is classified into two categories: services and other, and products. For the year ended December 31, 2006, approximately 78% of the Company’s total revenue was generated from services and other revenue and 22% was from products revenue.
The Company follows the provisions of the Securities and Exchange Commission Staff Accounting Bulletin No. 104, “Revenue Recognition,” AICPA Statement of Position (“SOP”) 97-2, “Software Revenue Recognition,” as amended, EITF Issue 00-3, “Application of AICPA Statement of Position 97-2 to Arrangements That Include the Right to Use Software Stored on Another Entity’s Hardware,” and EITF Issue 00-21, “Revenue Arrangements with Multiple Deliverables.”
F-8
THE TRIZETTO GROUP, INC.
NOTES TO CONSOLIDATED FINANCIAL STATEMENTS—(Continued)
The Company generates services revenue from several sources, including the provision of outsourcing services, such as software hosting and other business services, and the sale of maintenance and support for its proprietary software products. The Company applies EITF 00-3 to hosting arrangements that include the licensing of software. A software element covered by SOP 97-2 is present in a hosting arrangement if the customer has the contractual right to take possession of the software at any time during the hosting period without significant penalty and it is feasible for the customer to either run the software on its own hardware or contract with another party unrelated to the vendor to host the software. Software hosting and other business services revenue is typically billed and recognized monthly over the contract term, generally three to seven years. Many of the Company’s outsourcing agreements require it to maintain a certain level of operating performance. The Company records revenue net of estimated penalties resulting from any failure to maintain the level of operating performance. These penalties have not been significant in the past. Software maintenance and support revenues are typically based on one-year renewable contracts and are recognized ratably over the contract period. Payment for software maintenance received in advance is recorded on the balance sheet as deferred revenue. Certain royalty costs paid to third-party software vendors associated with software maintenance are amortized over the software maintenance period.
The Company also generates services revenue from consulting fees for implementation, installation, configuration, business process engineering, data conversion, testing and training related to the use of its proprietary and third party licensed products. In certain instances, the Company also generates services revenue from customization services of its proprietary licensed products. The Company recognizes revenue for these services as they are performed. When the Company cannot reasonably estimate the cost to complete, it recognizes revenue using the completed contract method, upon completion of all contractual obligations. The Company also generates services revenue from set-up fees, which are services, hardware, and software associated with preparing its customer connectivity center or a customer’s data center in order to ready a specific customer for software hosting services. The set-up fees are usually separate and distinct from the hosting fees, and performance of the set-up services represents the culmination of the earnings process. The Company recognizes revenue for these services as they are performed. The Company generates other revenue from certain one-time charges, including certain contractual fees such as termination fees and change of control fees, and it recognizes the revenue for these fees once the termination or change of control is guaranteed, there are no remaining substantive performance obligations and collection is reasonably assured. Other revenue is also generated from fees related to the Company’s product related conference.
For multiple element arrangements, such as software license, consulting services, outsourcing services and maintenance, and where vendor-specific objective evidence (“VSOE”) of fair value exists for all undelivered elements, the Company accounts for the delivered elements in accordance with the “residual method.” VSOE of fair value is determined for each undelivered element based on how it is sold separately, or in the case of maintenance, the renewal rate. For arrangements in which VSOE does not exist for each undelivered element, including specified product and upgrade rights, revenue for the delivered element is deferred and not recognized until VSOE is available for the undelivered element or delivery of each element has occurred. In determining VSOE for the undelivered elements, no portion of the discount is allocated to specified or unspecified product or upgrade rights.
Under the residual method, the arrangement fee is recognized as follows: (1) the total fair value of the undelivered elements, as indicated by VSOE, is deferred and subsequently recognized in accordance with the relevant sections of SOP 97-2 and (2) the difference between the total arrangement fee and the amount deferred for the undelivered elements is recognized as revenue related to the delivered elements.
The Company generates products revenue from the licensing of its software. Under SOP 97-2, software license revenue is recognized upon the execution of a license agreement, upon delivery of the software, when fees are fixed or determinable, when collectibility is probable and when all other significant obligations have been fulfilled. For software license agreements in which customer acceptance is a significant condition of earning the license fees, revenue is not recognized until acceptance occurs. For software license agreements that require significant customizations or modifications of the software, revenue is recognized as the customization services are performed.
Research and development expense and capitalized software development costs
Research and development (“R&D”) expenses are salaries and related expenses associated with the development of software applications prior to establishing technological feasibility. Such expenses include compensation paid to engineering personnel and fees to outside contractors and consultants. Costs incurred internally in the development of our software products are expensed as incurred as R&D expenses until technological feasibility has been established, after which production costs are capitalized as software development costs in accordance with FASB Statement No. 86, “Accounting for the Costs of Computer Software to be
F-9
THE TRIZETTO GROUP, INC.
NOTES TO CONSOLIDATED FINANCIAL STATEMENTS—(Continued)
Sold, Leased, or Otherwise Marketed.” Capitalization ceases and amortization of capitalized software development costs begins when the software product is available for general release to customers.
On a quarterly basis, the Company monitors the expected net realizable value of the capitalized software for factors that would indicate impairment, such as a decline in the demand, the introduction of new technology, or the loss of a significant customer. As of December 31, 2006, the Company’s evaluation determined that the carrying amount of these assets was not impaired.
Capitalized software development costs are amortized to cost of revenue on a straight-line basis over the estimated useful life of the related products, which is generally deemed to be five years. Software development costs of $8.6 million have been capitalized for each of the years ended December 31, 2006, 2005 and 2004. Amortization expense for the years ended December 31, 2006, 2005, and 2004 was $9.4 million, $7.8 million, and $6.2 million, respectively, and is included in cost of revenue—products.
Capitalized software development costs, net consist of the following (in thousands):
| | | | | | | | |
| | | Years Ended December 31, | |
| | | 2006 | | | 2005 | |
Capitalized software development costs | | $ | 55,838 | | | $ | 47,270 | |
Less: accumulated amortization | | | (27,925 | ) | | | (18,546 | ) |
| | | | | | | | |
| | $ | 27,913 | | | $ | 28,724 | |
| | | | | | | | |
Internal-use software
The Company capitalizes direct costs of materials and services used in the development of internal-use software in accordance with Statement of Position (“SOP”) 98-1, “Accounting for the Costs of Computer Software Developed or Obtained for Internal Use.” Amounts capitalized are amortized on a straight-line basis over a period of three to five years and are included in software within property, plant and equipment.
Stock-based compensation
In December 2004, the FASB issued SFAS No. 123R, “Share-Based Payment.” This statement requires that the cost resulting from all share-based payment transactions be recognized in the financial statements. This statement establishes fair value as the measurement objective in accounting for share-based payment arrangements and requires all entities to apply a fair-value based measurement method in accounting for share-based payment transactions with employees except for equity instruments held by employee share ownership plans.
Prior to the January 1, 2006 adoption of SFAS No. 123R, the Company accounted for stock-based compensation using the intrinsic value method prescribed in Accounting Principles Board Opinion No. 25 (“APB 25”), “Accounting for Stock Issued to Employees,” and related interpretations. The Company recognized compensation expense for stock options granted to employees, where the exercise price was lower than the fair market value of the Company’s common stock on the date of grant, and recorded compensation expense accordingly. For stock options granted with an exercise price equal to the fair market value of the Company’s common stock on the date of grant, no compensation expense had been recognized but was included as a pro forma disclosure in the notes to the consolidated financial statements as permitted by SFAS No 123, “Accounting for Stock-Based Compensation.”
Effective January 1, 2006, the Company adopted the fair value recognition provisions of SFAS No. 123R, using the modified prospective method. Under this method, the provisions of SFAS No. 123R apply to all awards granted or modified after the date of adoption and all previously granted awards not yet vested as of the date of adoption. Prior periods have not been restated.
F-10
THE TRIZETTO GROUP, INC.
NOTES TO CONSOLIDATED FINANCIAL STATEMENTS—(Continued)
The following table is a summary of the amount of stock-based compensation expense recognized in the consolidated statements of operations (in thousands):
| | | | | | | | | |
| | | Years Ended December 31, |
| | | 2006 | | 2005 | | 2004 |
Cost of revenue – services and other | | $ | 1,675 | | $ | 36 | | $ | 4 |
Research and development | | | 893 | | | 34 | | | 24 |
Selling, general and administrative | | | 4,858 | | | 1,327 | | | 566 |
| | | | | | | | | |
Total | | $ | 7,426 | | $ | 1,397 | | $ | 594 |
| | | | | | | | | |
The Company has the following stock-based compensation plans: (i) the 1998 Long-Term Incentive Plan, which is an amendment and restatement of the 1998 Stock Option Plan, permits the Company to grant other types of awards in addition to stock options, (ii) the RIMS Stock Option Plan, a plan the Company assumed through the acquisition of Resource Information Management Systems, Inc. in late 2000, and (iii) the Employee Stock Purchase Plan, which allows full-time employees to purchase shares of the Company’s common stock at a discount to fair market value.
SFAS No. 123R requires disclosure of pro forma information for periods prior to the adoption. The following table illustrates the effect on net income and net income per share if the Company had applied the fair value recognition provisions of SFAS No. 123R to stock-based employee compensation (in thousands, except per share data):
| | | | | | | | |
| | | Year Ended December 31, | |
| | | 2005 | | | 2004 | |
Net income as reported | | $ | 22,021 | | | $ | 8,458 | |
Add: stock-based employee compensation expense included in reported net income, net of related tax effects | | | — | | | | — | |
Deduct: stock-based employee compensation expense determined under fair value based method for all awards, net of related tax effects | | | (5,782 | ) | | | (4,889 | ) |
| | | | | | | | |
Pro forma net income | | $ | 16,239 | | | $ | 3,569 | |
| | | | | | | | |
Net income per share | | | | | | | | |
Basic, as reported | | $ | 0.52 | | | $ | 0.18 | |
| | | | | | | | |
Diluted, as reported | | $ | 0.48 | | | $ | 0.18 | |
| | | | | | | | |
Basic, pro forma | | $ | 0.39 | | | $ | 0.08 | |
| | | | | | | | |
Diluted, pro forma | | $ | 0.36 | | | $ | 0.07 | |
| | | | | | | | |
The fair value of option grants was estimated using the Black-Scholes pricing model. The Company evaluates the assumptions used to value stock awards on a quarterly basis. The following weighted average assumptions were used for the periods presented:
| | | | | | | | | | | | |
| | | Years Ended December 31, | |
| | | 2006 | | | 2005 | | | 2004 | |
Expected volatility | | | 45 | % | | | 55 | % | | | 50 | % |
Risk-free interest rate | | | 4.75 | % | | | 3.70 | % | | | 3.00 | % |
Expected life | | | 6.25 years | | | | 4 years | | | | 4 years | |
Forfeiture rate | | | 6.0 | % | | | — | | | | — | |
Expected dividends | | | — | | | | — | | | | — | |
Weighted average fair value | | $ | 8.49 | | | $ | 3.99 | | | $ | 2.81 | |
Expected volatility is based on implied volatility from traded options on the Company’s stock and historical volatility of the Company’s stock. The risk-free interest rate is the U.S. Treasury rate for the week of the grant having a term equal to the expected life of the option. The expected life of options granted represents the period of time that options granted are expected to be outstanding. The Company has determined that historical experience is not a good predictor of future exercise patterns and thus has applied the “simplified” method outlined in Staff Accounting Bulletin No. 107, “Share-Based Payment,” to calculate expected life. The forfeiture rate is the estimated percentage of options granted that are expected to be forfeited or cancelled before becoming
F-11
THE TRIZETTO GROUP, INC.
NOTES TO CONSOLIDATED FINANCIAL STATEMENTS—(Continued)
fully vested and is based on historical experience. The Company has not made any dividend payments nor does it have plans to pay dividends in the foreseeable future.
Advertising costs
Advertising costs are expensed as incurred. Advertising expense for the years ended December 31, 2006, 2005, and 2004 was $644,000, $1.2 million, and $937,000, respectively.
Common stock repurchase program
On January 26, 2006, the Board of Directors approved a repurchase program which allows for the repurchase of up to 1,000,000 shares of the Company’s common stock at a price and time to be determined by the Company’s Chief Executive Office or Chief Financial Officer. As of December 31, 2006, no shares had been repurchased under the plan. Unless extended by the Board of Directors, the current repurchase plan will expire on December 31, 2007. The Company had prior repurchase programs in place in 2004 and 2005, which have since expired, but no shares were repurchased under such plans.
Income taxes
The Company accounts for income taxes under FASB Statement No. 109, “Accounting for Income Taxes.” This statement requires the recognition of deferred tax assets and liabilities for the future consequences of events that have been recognized in the Company’s financial statements or tax returns. The measurement of the deferred items is based on enacted tax laws. In the event the future consequences of differences between financial reporting bases and the tax bases of the Company’s assets and liabilities result in a deferred tax asset, FASB Statement No. 109 requires an evaluation of the probability of being able to realize the future benefits indicated by such asset. A valuation allowance related to a deferred tax asset is recorded when it is more likely than not that some portion of the deferred tax asset will not be realized. The Company reviews the need for a valuation allowance on a quarterly basis and believes sufficient uncertainty exists regarding the realizability of the deferred tax assets such that a valuation allowance has been recorded on net deferred tax assets.
Computation of earnings per share
The computation of basic earnings per share (“EPS”) is based on the weighted average number of common shares outstanding during each period. The computation of diluted earnings per share is based on the weighted average number of common shares outstanding during the period plus, when their effect is dilutive, incremental shares consisting of shares subject to stock options, unvested restricted stock, and shares issued upon conversion of convertible debt.
Emerging Issues Task Force Issue No. 04-08, “The Effect of Contingently Convertible Instruments on Diluted Earnings per Share” (“EITF No. 04-08”) requires companies to account for contingently convertible debt using the “if converted” method set forth in SFAS No. 128 “Earnings Per Share” for calculating diluted EPS. Under the “if converted” method, the after-tax effect of interest expense related to the convertible securities is added back to net income, and convertible debt is assumed to have been converted to equity at the beginning of the period and is added to outstanding common shares, unless the inclusion of such shares is anti-dilutive. For the years ended December 31, 2006 and 2005, the 5,305,040 shares from the assumed conversion of convertible debt are antidilutive.
The following is a reconciliation of the computations of basic and diluted EPS information for each of the three years ended December 31, 2006, 2005 and 2004 (in thousands, except per share data):
| | | | | | | | | |
| | | Years Ended December 31, |
| | | 2006 | | 2005 | | 2004 |
Basic and diluted: | | | | | | | | | |
Net income | | $ | 15,115 | | $ | 22,021 | | $ | 8,458 |
| | | | | | | | | |
Weighted average shares outstanding (basic) | | | 42,389 | | | 41,948 | | | 46,794 |
Effect of dilutive securities: | | | | | | | | | |
Unvested common shares outstanding | | | 552 | | | 523 | | | 295 |
Unexercised stock options | | | 2,750 | | | 3,032 | | | 1,068 |
| | | | | | | | | |
Adjusted weighted average shares for diluted EPS | | | 45,691 | | | 45,503 | | | 48,157 |
| | | | | | | | | |
Basic earnings per share | | $ | 0.36 | | $ | 0.52 | | $ | 0.18 |
| | | | | | | | | |
Diluted earnings per share | | $ | 0.33 | | $ | 0.48 | | $ | 0.18 |
| | | | | | | | | |
On December 22, 2006, the Company acquired all of the issued and outstanding shares of Plan Data Management, Inc. The estimated purchase price as of December 31, 2006 was approximately $19.6 million, which consisted of 491,488 shares of the Company’s common stock with a value of $16.28 per share (which represents the average closing price of TriZetto’s common stock
F-12
THE TRIZETTO GROUP, INC.
NOTES TO CONSOLIDATED FINANCIAL STATEMENTS—(Continued)
for the 20 trading days ending October 27, 2006), cash payments of $8.0 million, assumed liabilities of $3.1 million and estimated acquisition-related costs of $500,000. Due to the close of the acquisition late in the year, the issuance of the 491,488 shares of common stock and the cash payment of $8.0 million to PDM stockholders and option holders were not completed prior to December 31, 2006. However, these amounts were accrued as of December 31, 2006. The computation of earnings per share for the year ended December 31, 2006 did not include the issuance of the 491,488 shares of common stock or the financial operating results of PDM since the impact of these amounts was not material.
Comprehensive income
The Company has adopted the provisions of FASB Statement No. 130, “Comprehensive Income” (“Statement 130”). Statement 130 establishes standards for reporting and display of comprehensive income and its components for general-purpose financial statements. Comprehensive income is defined as net income plus all revenues, expenses, gains and losses from non-owner sources that are excluded from net income in accordance with U.S. generally accepted accounting principles. Comprehensive income was equal to net income for 2006, 2005 and 2004.
Reclassifications
Certain reclassifications, none of which affected net income, have been made to prior year amounts to conform to current year presentation.
Recent accounting pronouncements
In July 2006, the FASB issued FASB Interpretation No. 48, “Accounting for Uncertainty in Income Taxes” (“FIN 48”). FIN 48 applies to all tax positions accounted for under SFAS No. 109, “Accounting for Income Taxes” and defines the confidence level that a tax position must meet in order to be recognized in the financial statements. The interpretation requires that the tax effects of a position be recognized only if it is “more-likely-than-not” to be sustained by the taxing authority as of the reporting date. If a tax position is not considered “more-likely-than-not” to be sustained then no benefits of the position are to be recognized. FIN 48 requires additional disclosures and is effective as of the beginning of the first fiscal year beginning after December 15, 2006. The Company does not expect the adoption of FIN 48 to have a material impact on its consolidated results of operations and financial condition.
3. Prepaid Expenses and Other Assets
Prepaid expenses and other assets consist of the following (in thousands):
| | | | | | | | |
| | | December 31, | |
| | | 2006 | | | 2005 | |
Prepaid expenses—other | | $ | 1,450 | | | $ | 1,369 | |
Prepaid hardware & software license maintenance | | | 5,484 | | | | 3,473 | |
Prepaid commission & royalty | | | 145 | | | | 1,919 | |
Up-front fees | | | 6,198 | | | | 7,664 | |
Accounts receivable—other | | | 735 | | | | 1,087 | |
Prepaid insurance | | | 576 | | | | 551 | |
Prepaid rent & operating leases | | | 830 | | | | 1,268 | |
Prepaid deposits | | | 5,045 | | | | 4,293 | |
Cash value of life insurance policies | | | 572 | | | | 151 | |
Acquisition costs | | | 1,471 | | | | — | |
Other | | | 1,256 | | | | 777 | |
| | | | | | | | |
| | | 23,762 | | | | 22,552 | |
Less: Current portion | | | (11,415 | ) | | | (11,375 | ) |
| | | | | | | | |
| | $ | 12,347 | | | $ | 11,177 | |
| | | | | | | | |
F-13
THE TRIZETTO GROUP, INC.
NOTES TO CONSOLIDATED FINANCIAL STATEMENTS—(Continued)
4. Property and Equipment
Property and equipment, net, consist of the following (in thousands):
| | | | | | | | |
| | | December 31, | |
| | | 2006 | | | 2005 | |
Computer equipment | | $ | 37,104 | | | $ | 32,831 | |
Furniture and fixtures | | | 6,647 | | | | 5,292 | |
Other equipment | | | 4,878 | | | | 4,261 | |
Software | | | 36,354 | | | | 31,518 | |
Leasehold improvements | | | 6,702 | | | | 3,974 | |
| | | | | | | | |
| | | 91,685 | | | | 77,876 | |
Less: Accumulated depreciation | | | (64,908 | ) | | | (52,146 | ) |
| | | | | | | | |
| | $ | 26,777 | | | $ | 25,730 | |
| | | | | | | | |
Depreciation expense for the years ended December 31, 2006, 2005 and 2004 was $12.9 million, $15.5 million and $14.9 million, respectively. Included in property and equipment at December 31, 2006 and 2005 is equipment acquired under capital leases totaling approximately $24.3 million and $22.1 million, and related accumulated depreciation of $20.9 million and $18.7 million, respectively.
Under FASB Statement No. 144, the Company is required to perform an evaluation of its long-lived assets for recoverability whenever events or changes in circumstances indicate that their carrying amount may not be recoverable. The Company did not perform any evaluation in 2006 or 2005, as management did not believe that any such indicators existed.
5. Goodwill and Other Intangible Assets
Goodwill and other intangible assets, net, consist of the following (in thousands):
| | | | | | | | |
| | | December 31, | |
| | | 2006 | | | 2005 | |
Non-amortizable intangible assets | | | | | | | | |
Goodwill | | $ | 90,337 | | | $ | 87,170 | |
Amortizable intangible assets | | | | | | | | |
Customer lists | | $ | 9,700 | | | $ | 2,300 | |
Core technology and intellectual property | | | 28,674 | | | | 7,074 | |
Tradenames | | | 4,879 | | | | 4,879 | |
| | | | | | | | |
| | | 43,253 | | | | 14,253 | |
Less: Accumulated amortization | | | (15,906 | ) | | | (10,918 | ) |
| | | | | | | | |
| | $ | 27,347 | | | $ | 3,335 | |
| | | | | | | | |
In December 2005, the Company recorded $47.7 million in goodwill in connection with its acquisition of CareKey, Inc., which represented the excess of the purchase price over the estimated fair market value of the assets purchased and liabilities assumed. In the third quarter of 2006, the Company received the final valuation of assets and liabilities assumed. The final valuation of identifiable intangible assets was determined to be $29.0 million. The $29.0 million allocated to identifiable intangible assets includes customer relationships and maintenance agreements of $7.4 million to be amortized over a ten-year life, existing software of $13.0 million to be amortized over a five-year life, and core technology of $8.6 million to be amortized over a ten-year life.
In December 2006, the Company recorded $15.0 million in goodwill in connection with its acquisition of Plan Data Management, Inc. (“PDM”) (Note 14), which represents the excess of the purchase price over the estimated fair market value of the assets purchased and liabilities assumed. Because the acquisition was completed on December 22, 2006, there was not sufficient time to finalize the fair market valuation of assets and liabilities acquired as of December 31, 2006. Goodwill also decreased by $526,000 in December 2006 as a result of the initial recognition of tax benefits obtained in the Diogenes acquisition (Note 14).
The Company tested goodwill using the two-step process prescribed in FASB Statement No. 142. The first required step is a screen for potential impairment, while the second step measures the amount of the impairment, if any. The Company performed its annual impairment test on March 31, 2006, and this test did not reveal any indications of impairment.
F-14
THE TRIZETTO GROUP, INC.
NOTES TO CONSOLIDATED FINANCIAL STATEMENTS—(Continued)
The amount of amortization expense excluded from cost of revenue – products consists primarily of amounts amortized with respect to acquired technology, which includes core or completed technology and existing software. Amortization expense recorded for the years ended December 31, 2006, 2005, and 2004 related to acquired technology was $4.1 million, $660,000 and $440,000, respectively. Amortization expense recorded for the years ended December 31, 2006, 2005, and 2004 related to acquired other intangible assets was $867,000, $2.2 million and $3.8 million, respectively. The estimated aggregate amortization expense related to these intangible assets for the next five fiscal years and thereafter is as follows (in thousands):
| | | | | | | | | |
| For the Years Ending December 31, | | Acquired
Technology | | Acquired Other
Intangible
Assets | | Total |
2007 | | $ | 4,120 | | $ | 852 | | $ | 4,972 |
2008 | | | 4,120 | | | 852 | | | 4,972 |
2009 | | | 3,680 | | | 852 | | | 4,532 |
2010 | | | 3,460 | | | 852 | | | 4,312 |
2011 and thereafter | | | 4,300 | | | 4,259 | | | 8,559 |
| | | | | | | | | |
Total | | $ | 19,680 | | $ | 7,667 | | $ | 27,347 |
| | | | | | | | | |
Amortization expense related to existing intangible assets will vary from amounts identified above in the event the Company recognizes impairment charges prior to the amortized useful life of any intangible assets. Additionally, amortization expense will vary from amounts identified above when the final accounting for the PDM and QCSI acquisitions are completed, and the allocation between goodwill and identifiable intangible assets is recorded.
6. Accrued Liabilities
Accrued liabilities consist of the following (in thousands):
| | | | | | |
| | | December 31, |
| | | 2006 | | 2005 |
Accrued payroll and benefits | | $ | 29,475 | | $ | 20,767 |
Accrued professional and litigation fees and settlements | | | 8,609 | | | 1,590 |
Accrued acquisition costs | | | 16,500 | | | 25,611 |
Accrued outside services | | | 370 | | | 959 |
Accrued employee relations | | | 602 | | | 775 |
Accrued income and other taxes | | | 2,125 | | | 1,253 |
Other | | | 3,914 | | | 6,002 |
| | | | | | |
| | $ | 61,595 | | $ | 56,957 |
| | | | | | |
Effective January 1, 2006, the Company became self-insured for certain losses related to employee health and dental benefits. The Company records a liability based on an estimate of claims incurred but not recorded determined by actuarial analysis of historical claims experience and historical industry data. The Company maintains individual and aggregate stop-loss coverages with a third party insurer to limit its total exposure for these programs.
7. Debt
In December 2004, the Company and IMS Health Incorporated (“IMS Health”) entered into a Share Purchase Agreement pursuant to which the Company purchased all of the 12,142,857 shares of the Company’s common stock owned by IMS Health for an aggregate purchase price of $82.0 million, or $6.75 per share. The purchase price for the repurchase of shares was paid by delivery of $44.6 million in cash and a Subordinated Promissory Note in the principal amount of $37.4 million. The Subordinated Promissory Note bore interest at the rate of 5.75% and was due and paid in full on January 21, 2005 from the Company’s cash accounts. The cash portion of the purchase price was financed with the proceeds of the Company’s sale of 6,600,000 shares of its common stock to ValueAct Capital for $6.75 per share totaling $44.6 million in proceeds.
In January 2006, the Company entered into an amendment to its Credit Agreement established December 21, 2004. The amendment increased the amount of the revolving credit facility from $50.0 million to $100.0 million, subject to certain fixed percentages of its recurring revenues (which includes outsourced business services and software maintenance revenue – see Note 16), and extended the expiration date of the Credit Agreement to January 5, 2010. Principal outstanding under the facility bears interest at a per annum rate equal to either (i) the LIBOR rate plus an adjustable applicable margin of between 1.75% and 2.25% or (ii) the lending institution’s prime rate plus an adjustable applicable margin of between 0.0% and 0.5%, at the Company’s election, subject to specified restrictions. The unused portions of the facility are subject to unused facility fees. In the event the Company terminates the Credit Agreement prior to its expiration, the Company will be required to pay the lending institution a termination fee equal to 2% of the maximum credit amount if the termination is prior to the second anniversary of the Credit Agreement or 1% of the maximum credit amount if the Credit Agreement is terminated thereafter, up to 90 days prior to the expiration of the Credit
F-15
THE TRIZETTO GROUP, INC.
NOTES TO CONSOLIDATED FINANCIAL STATEMENTS—(Continued)
Agreement, subject to specified exceptions. Management expects to use the proceeds for general working capital purposes and has granted the lending institution a security interest in all of the Company’s assets. The Credit Agreement contains customary affirmative and negative covenants for credit facilities of this type, including limitations with respect to indebtedness, liens, investments, distributions, mergers and acquisitions, dispositions of assets and transactions with the Company’s affiliates. The Credit Agreement also includes financial covenants including minimum EBITDA, determined on a quarterly basis ranging from $33.4 million at March 31, 2006 and increasing over time to $46.9 million at December 31, 2006. The Company also becomes subject to further restrictions, including minimum liquidity, minimum recurring revenue (which includes outsourced business services and software maintenance revenue – see Note 16) and maximum capital expenditures. As of December 31, 2006, the Company was in compliance with all applicable covenants and other restrictions under the Credit Agreement. As of December 31, 2006, the Company had outstanding borrowings on the revolving line of credit of $12.0 million.
On September 30, 2005, the Company entered into a Purchase Agreement with UBS Securities, LLC, Banc of America Securities, LLC and William Blair & Company LLC (the “Initial Purchasers”), to sell $100 million aggregate principal amount of its 2.75% Convertible Senior Notes due 2025 (the “Notes”) in a private placement in reliance on Section 4(2) of the Securities Act of 1933, as amended (the “Securities Act”). The Notes have been resold by the Initial Purchasers to qualified institutional buyers pursuant to Rule 144A under the Securities Act. The sale of the Notes to the Initial Purchasers was consummated on October 5, 2005.
The aggregate net proceeds received by the Company from the sale of the Notes were approximately $82.0 million, after deducting the amount used to repurchase one million shares of its common stock at $14.50 per share in connection with the private placement, the Initial Purchasers’ discount and estimated offering expenses. The indebtedness under the Notes constitutes the Company’s senior unsecured obligations and will rank equally with all of its existing and future unsecured indebtedness.
The Notes were issued pursuant to an Indenture, dated October 5, 2005, by and between the Company and Wells Fargo Bank, National Association, as trustee. The Notes bear interest at a rate of 2.75%, which is payable in cash semi-annually in arrears on April 1 and October 1 of each year, commencing on April 1, 2006, to the holders of record on the preceding March 15 and September 15, respectively.
The Notes are convertible into shares of the Company’s common stock at an initial conversion price of $18.85 per share, or 53.0504 shares for each $1,000 principal amount of Notes, subject to certain adjustments set forth in the Indenture. Upon conversion of the Notes, the Company will have the right to deliver shares of its common stock, cash or a combination of cash and shares of its common stock. The Notes are convertible (i) prior to October 1, 2020, during any fiscal quarter after the fiscal quarter ending December 31, 2005, if the closing sale price of the Company’s common stock for 20 or more trading days in a period of 30 consecutive trading days ending on the last trading day of the immediately preceding fiscal quarter exceeds 120% of the conversion price in effect on the last trading day of the immediately preceding fiscal quarter, (ii) prior to October 1, 2020, during the five business day period after any five consecutive trading day period (the “Note Measurement Period”) in which the average trading price per $1,000 principal amount of Notes was equal to or less than 97% of the average conversion value of the Notes during the Note Measurement Period, (iii) upon the occurrence of specified corporate transactions, as described in the Indenture, (iv) if the Company calls the Notes for redemption, or (v) any time on or after October 1, 2020.
The Notes mature on October 1, 2025. However, on or after October 5, 2010, the Company may from time to time at its option redeem the Notes, in whole or in part, for cash, at a redemption price equal to 100% of the principal amount of the Notes the Company redeems, plus any accrued and unpaid interest to, but excluding, the redemption date. On each of October 1, 2010, October 1, 2015 and October 1, 2020, holders may require the Company to purchase all or a portion of their Notes at a purchase price in cash equal to 100% of the principal amount of the Notes to be purchased, plus any accrued and unpaid interest to, but excluding, the purchase date. In addition, holders may require the Company to repurchase all or a portion of their Notes upon a fundamental change, as described in the Indenture, at a repurchase price in cash equal to 100% of the principal amount of the Notes to be repurchased, plus any accrued and unpaid interest to, but excluding, the fundamental change repurchase date. Additionally, the Notes may become immediately due and payable upon an Event of Default, as defined in the Indenture. Pursuant to a Registration Rights Agreement dated October 5, 2005, the Company filed with the Securities and Exchange Commission, a registration statement under the Securities Act for the purpose of registering for resale, the Notes and all of the shares of its common stock issuable upon conversion of the Notes.
F-16
THE TRIZETTO GROUP, INC.
NOTES TO CONSOLIDATED FINANCIAL STATEMENTS—(Continued)
Notes payable and line of credit consist of the following at December 31 (in thousands):
| | | | | | | | | | | | | | |
| | | Notes Payable | | | Line of Credit |
| | | 2006 | | | 2005 | | | 2006 | | 2005 |
Long-term convertible debt, due 2025, interest at 2.75% fixed rate, payable semi-annually in arrears | | $ | 100,000 | | | $ | 100,000 | | | $ | — | | $ | — |
Revolving credit facility of $100.0 million, interest at the lending institution’s prime rate (8.25% at December 31, 2006), payable monthly in arrears | | | — | | | | — | | | | 12,000 | | | — |
Other | | | 115 | | | | 120 | | | | — | | | — |
| | | | | | | | | | | | | | |
Total debt | | $ | 100,115 | | | $ | 100,120 | | | $ | 12,000 | | | — |
Less: Current portion | | | (115 | ) | | | (120 | ) | | | — | | | — |
| | | | | | | | | | | | | | |
| | $ | 100,000 | | | $ | 100,000 | | | $ | 12,000 | | $ | — |
| | | | | | | | | | | | | | |
Future principal payments of notes payable and line of credit at December 31, 2006 are as follows (in thousands):
| | | | | | |
For the Periods Ending December 31, | | Notes Payable | | Line of Credit |
2007 | | $ | 115 | | $ | — |
2008 | | | — | | | — |
2009 | | | — | | | — |
2010 | | | — | | | 12,000 |
2011 | | | — | | | — |
Thereafter | | | 100,000 | | | — |
As of December 31, 2006, the Company had outstanding four unused standby letters of credit in the aggregate amount of $921,000 which serve as security deposits for certain operating leases. The Company is required to maintain a cash balance equal to the outstanding letters of credit, which is classified as restricted cash on the balance sheet.
8. Related Party Transactions
In December 2004, the Company entered into a Share Purchase Agreement with IMS Health (See Note 7).
9. Commitments and Contingencies
The Company leases office space and equipment under non-cancelable operating and capital leases, respectively, with various expiration dates through 2016. Capital lease obligations are collateralized by the equipment subject to the leases. The Company is responsible for maintenance costs and property taxes on certain of the operating leases. Rent expense for the years ended December 31, 2006, 2005 and 2004 was $7.8 million, $6.8 million and $7.5 million, respectively. These amounts are net of sublease income of $331,000, $668,000 and $522,000, respectively.
The aggregate future minimum rentals to be received under non-cancelable subleases as of December 31, 2006 is approximately $7,000. Future minimum lease payments under non-cancelable operating and capital leases at December 31, 2006 are as follows (in thousands):
| | | | | | | |
For the Years Ending December 31, | | Capital Leases | | | Operating Leases |
2007 | | $ | 1,618 | | | $ | 13,603 |
2008 | | | 1,119 | | | | 11,424 |
2009 | | | 506 | | | | 8,520 |
2010 | | | 404 | | | | 6,739 |
2011 | | | 159 | | | | 5,964 |
Thereafter | | | — | | | | 17,113 |
| | | | | | | |
Total minimum lease payments | | | 3,806 | | | $ | 63,363 |
| | | | | | | |
Less: interest | | | (315 | ) | | | |
Less: current portion | | | (1,461 | ) | | | |
| | | | | | | |
| | $ | 2,030 | | | | |
| | | | | | | |
As of December 31, 2006, the Company had three sale-leaseback transactions for certain computer hardware equipment. The leases, which are classified as operation, have lease terms of three years. The Company did not realize any gain or loss on the sale as the fair value approximated the carrying value of the equipment. The future lease payments under these sale-leaseback
F-17
THE TRIZETTO GROUP, INC.
NOTES TO CONSOLIDATED FINANCIAL STATEMENTS—(Continued)
transactions for the years ending December 31, 2007, 2008 and 2009, are included in the above table totaling $400,000, $400,000 and $140,000, respectively.
Pursuant to the terms of the Agreement and Plan of Merger in connection with the Company’s acquisition of CareKey, CareKey stockholders and option holders are entitled to receive three contingent consideration payments of $8.3 million each (up to $25.0 million), upon the achievement of certain revenue milestones during the period beginning upon acquisition and ending December 31, 2008. In addition, further consideration payable in cash or stock at our election, may be paid to former CareKey stockholders and option holders if, prior to December 31, 2008, the acquired CareKey products generate revenues in excess of certain revenue milestones and/or if a negotiated multiple of software maintenance revenues of acquired CareKey products during the fiscal year ended December 31, 2009 exceed total purchase consideration made to those former CareKey stockholders and option holders.
Under the Agreement and Plan of Merger with PDM (Note 14), PDM stockholders and option holders may also be entitled to receive contingent consideration as follows: aggregate payments of up to $5.0 million on or before June 30, 2007, $5.0 million on or before December 31, 2008, and $8.0 million on or before December 31, 2009, each subject to reduction if certain revenue thresholds are not satisfied during the applicable measurement period. Additional contingent consideration may be paid on June 30, 2009 if certain revenue thresholds are satisfied, provided that in no event will the aggregate consideration of all payments exceed $42.0 million. The merger consideration is also subject to adjustment based upon minimum cash and working capital balances. It is expected that 50% of any such payment will be made in cash and 50% will be paid in shares of the Company’s common stock.
10. Litigation
On October 26, 2004, a jury in California Superior Court, County of Alameda, delivered its verdict in the case of Associated Third Party Administrators v. The TriZetto Group, Inc., a dispute involving technology agreements between Associated Third Party Administrators (“ATPA”), a former QicLink™ customer, and the Company. In its verdict, the jury found that the Company made certain misrepresentations to ATPA in connection with the license of QicLink™ software in 2001 and awarded damages of approximately $1.85 million, representing primarily the amount of the license fee paid by ATPA. In the first quarter of 2005, a judgment was entered by the court, which included, in addition to damages of $1.85 million, approximately $500,000 in pre-judgment interest and recoverable costs. The Company recorded an accrual for the additional $500,000 of costs in the first quarter of 2005 increasing the total accrual for the dispute to $2.35 million. In June 2005, the Company entered into a settlement agreement with ATPA in which the Company agreed to pay ATPA $2.2 million to fully resolve the dispute. The Company paid this amount to ATPA in July 2005. In June 2005, the Company’s insurance carrier agreed to reimburse the Company a total of $1.1 million of the settlement. The reimbursement was received in July 2005 and was recorded as a reduction to expense.
In September 2004, McKesson Information Solutions LLC (“McKesson”) filed a lawsuit against the Company in the United States District Court for the District of Delaware. In its complaint, McKesson alleged that the Company made, used, offered for sale, and/or sold a clinical editing software system that infringed McKesson’s United States Patent No. 5,253,164, entitled “System And Method For Detecting Fraudulent Medical Claims Via Examination Of Services Codes.” McKesson sought injunctive relief and substantial monetary damages, including treble damages for willful infringement. On April 4, 2006, in response to the Company’s motion for summary judgment, the court ruled, as a matter of law, that the Company’s software products did not infringe 12 of the 15 claims of McKesson’s patent that were involved in this dispute, leaving claims 1, 2 and 16. On April 17, 2006, a jury trial commenced on the first phase of this case to determine the issue of infringement of the remaining three claims. On April 26, 2006, the jury found that the Company’s Facets®, QicLink™ and ClaimFacts® software products infringed claims 1 and 2, but not claim 16 of the patent. On May 4, 2006, the court scheduled the second phase of the trial to commence on October 3, 2006 on the issues of the Company’s validity, estoppel and laches defenses and on the issue of McKesson’s damages, if any.
On September 7, 2006, the Company entered into a Settlement Agreement with McKesson to settle the lawsuit. As part of the Settlement Agreement, the Company agreed to pay McKesson a one-time royalty fee of $15.0 million for a license in the patent that covers past and future use of the Company’s products and services by all existing customers. The $15.0 million, payable in two equal installments on September 30, 2006 and September 30, 2007, was expensed in the third quarter of 2006. The Company’s customers with maintenance agreements also will continue to receive software version upgrades that include clinical editing capabilities. Going forward, the Company may continue to include its clinical editing functionality in versions of Facets® sold to new health plan customers with 100,000 or fewer members and in versions of QicLink™ sold to any new customers. The Company has agreed to pay McKesson a royalty fee of 5% of the net licensing revenue received from new sales of Facets® and QicLink™ containing the Company’s clinical editing functionality. However, pursuant to the terms of the Settlement Agreement, the Company will no longer include its clinical editing functionality in versions of Facets® sold to new customers with more than 100,000 members, beginning November 1, 2006. In these cases, new customers may choose their clinical editing solution from available third-party providers.
In addition to the matter described above, the Company is involved in litigation from time to time relating to claims arising out of its operations in the normal course of business. Except as discussed above,
F-18
THE TRIZETTO GROUP, INC.
NOTES TO CONSOLIDATED FINANCIAL STATEMENTS—(Continued)
the Company was not a party to any other legal proceedings, the adverse outcome of which, in management’s opinion, individually or in the aggregate, would have a material adverse effect on its results of operations, financial position and/or cash flows.
11. Stockholders’ Equity
Common stock
In December 2004, the Company and IMS Health entered into a Share Purchase Agreement pursuant to which, on the same date, the Company purchased all of the 12,142,857 shares (“IMS Shares”) of the Company’s common stock, owned by IMS Health for an aggregate purchase price of $82.0 million, or $6.75 per share. The purchase price was paid by delivery of $44.6 million in cash and a Subordinated Promissory Note in the principal amount of $37.4 million. The Subordinated Promissory Note bore interest at the rate of 5.75% and was due and paid in full on January 21, 2005 from the Company’s cash accounts. Immediately following the purchase of the IMS Shares, the Company placed 6,600,000 of such shares with ValueAct Capital for an aggregate purchase price of $44.6 million, or $6.75 per share.
Pursuant to a letter dated December 5, 2004, the Company was given the right to repurchase up to 600,000 of the shares sold to ValueAct. On September 19, 2005, the Company exercised its repurchase right with respect to all 600,000 shares for an aggregate purchase price of $5.3 million, or $8.83 per share, that was paid for in cash.
On September 30, 2005, the Company entered into a Purchase Agreement with UBS Securities, LLC, Banc of America Securities, LLC and William Blair & Company LLC (the “Initial Purchasers”), to sell $100 million aggregate principal amount of its 2.75% Convertible Senior Notes due 2025 (the “Notes”) in a private placement in reliance on Section 4(2) of the Securities Act of 1933, as amended (the “Securities Act”). The Notes have been resold by the Initial Purchasers to qualified institutional buyers pursuant to Rule 144A under the Securities Act. The sale of the Notes to the Initial Purchasers was consummated on October 5, 2005.
The aggregate net proceeds received by the Company from the sale of the Notes were approximately $82.0 million, after deducting the amount used to repurchase 1,000,000 shares of its common stock at $14.50 per share in connection with the private placement, the Initial Purchasers’ discount and estimated offering expenses. The indebtedness under the Notes constitutes the Company’s senior unsecured obligations and will rank equally with all of its existing and future unsecured indebtedness.
Common stockholders are entitled to dividends as and when declared by the Board of Directors subject to the prior rights of preferred stockholders. The holders of each share of common stock are entitled to one vote.
Stock option plans
In May 1998, the Company adopted the 1998 Stock Option Plan (the “1998 Stock Option Plan”) under which the Board of Directors (the “Board”) or the Compensation Committee (the “Committee”) may issue incentive and non-qualified stock options to employees, directors and consultants. The Committee had the authority to determine to whom options will be granted, the number of shares and the term and exercise price. Options were to be granted at an exercise price not less than fair market value for incentive stock options or 85% of fair market value for non-qualified stock options. For individuals holding more than 10% of the voting rights of all classes of stock, the exercise price of incentive stock options will not be less than 110% of fair market value. The options generally vest and became exercisable annually at a rate of 25% of the option grant over a four-year period. The term of the options would be no longer than five years for incentive stock options for which the grantee owns greater than 10% of the voting power of all classes of stock and no longer than ten years for all other options.
On November 30, 2000, in connection with the Resource Information Management Systems, Inc. (“RIMS”) acquisition, the Company adopted the RIMS Stock Option Plan based primarily upon RIMS’ existing non-statutory stock option plan. Unless previously terminated by the stockholders, the Plan shall terminate at the close of business on January 1, 2009, and no options shall be granted under it thereafter. Such termination shall not affect any option previously granted. Upon a business combination by the Company with any corporation or other entity, the Company may provide written notice to optionees that options shall terminate on a date not less than 14 days after the date of such notice unless theretofore exercised. In connection with such notice, the Company may, in its discretion, accelerate or waive any deferred exercise period.
In March 2004, the Board of Directors of the Company amended and restated the 1998 Stock Option Plan, renaming it the 1998 Long-Term Incentive Plan (the “Plan”). As amended, the Plan permits the granting of the following types of awards: options, share appreciation rights, restricted and unrestricted share awards, deferred share units, and performance awards. The principal changes made to the 1998 Stock Option Plan pursuant to this amendment and restatement are as follows: (i) renaming it “The TriZetto Group, Inc. 1998 Long-term Incentive Plan,” (ii) increasing the numbers of shares available for issuance by 2,000,000 (from 11,000,000 to 13,000,000 shares), (iii) adding provisions that permit awards other than options, and (iv) modifying the
F-19
THE TRIZETTO GROUP, INC.
NOTES TO CONSOLIDATED FINANCIAL STATEMENTS—(Continued)
Committee’s discretion to administer the Plan and past or future awards. The terms and conditions of all options outstanding under the 1998 Stock Option Plan immediately before the effective date of this amendment and restatement shall continue to be governed by the terms and conditions of the 1998 Stock Option Plan (and the respective instruments evidencing each such option) as in effect on the date each such option was granted; provided, however, that any one or more provisions of the amended and restated Plan, may, in the Committee’s discretion, be extended to one or more of such options (subject to the participant’s written consent of any adverse changes).
In April 2006, the Board of Directors of the Company adopted, subject to stockholder approval, amendments to the Plan to (i) increase by 1,500,000 the total number of shares of the Company’s common stock available for issuance under the Plan from 13,000,000 to 14,500,000 and (ii) increase by 500,000 the share limitation on awards other than options and stock appreciation rights from 700,000 to 1,200,000.
Activity under the plans related only to stock options was as follows (in thousands, except per share data):
| | | | | | | | | | | | |
| | | Outstanding Options |
| | | Shares Available for Grant | | | Number of Shares | | | Exercise Price | | Weighted Average Exercise Price |
Balances, December 31, 2003 | | 2,761 | | | 6,815 | | | $ | 0.25 – $63.25 | | $ | 10.26 |
Additional options reserved | | 2,000 | | | — | | | | | | | |
Granted | | (2,442 | ) | | 2,442 | | | | 5.86 – 7.07 | | | 6.64 |
Exercised | | — | | | (255 | ) | | | 0.25 – 6.50 | | | 2.59 |
Cancelled | | 1,314 | | | (1,314 | ) | | | 1.00 – 63.25 | | | 10.41 |
| | | | | | | | | | | | |
Balances, December 31, 2004 | | 3,633 | | | 7,688 | | | | 0.25 – 63.25 | | | 9.33 |
Granted | | (2,214 | ) | | 2,214 | | | | 8.35 – 16.07 | | | 8.67 |
Exercised | | — | | | (1,290 | ) | | | 0.25 – 15.13 | | | 7.51 |
Cancelled | | 365 | | | (365 | ) | | | 3.34 – 15.25 | | | 8.71 |
| | | | | | | | | | | | |
Balances, December 31, 2005 | | 1,784 | | | 8,247 | | | | 0.25 – 63.25 | | | 9.44 |
Additional options reserved | | 1,500 | | | — | | | | | | | |
Granted | | (737 | ) | | 737 | | | | 12.75 – 18.36 | | | 16.68 |
Exercised | | — | | | (1,086 | ) | | | 0.25 – 15.13 | | | 8.54 |
Cancelled | | 178 | | | (178 | ) | | | 3.49 – 20.25 | | | 9.88 |
| | | | | | | | | | | | |
| | 2,725 | | | 7,720 | | | $ | 0.25 – $63.25 | | $ | 10.25 |
| | | | | | | | | | | | |
Less: Restricted stock awards granted | | (722 | ) | | | | | | | | | |
| | | | | | | | | | | | |
Balances, December 31, 2006 | | 2,003 | | | | | | | | | | |
| | | | | | | | | | | | |
At December 31, 2006, the Company had reserved approximately 9,722,983 shares of common stock for issuance upon exercise of stock options and shares issuable under its stock option plans.
F-20
THE TRIZETTO GROUP, INC.
NOTES TO CONSOLIDATED FINANCIAL STATEMENTS—(Continued)
The options outstanding and currently exercisable by exercise price at December 31, 2006 are as follows (in thousands, except per share data):
| | | | | | | | | | | | |
| | | Options Outstanding at December 31, 2006 | | Options Exercisable at December 31, 2006 |
| | | Weighted Average | |
Range of Exercise Price | | Number of Shares | | Remaining Contractual Life (Years) | | Weighted Average
Exercise Price | | Number of Shares | | Weighted Average
Exercise Price |
$0.25 - $3.49 | | 807 | | 4.79 | | $ | 2.60 | | 662 | | $ | 2.41 |
$4.11 - $6.53 | | 302 | | 5.98 | | | 5.78 | | 200 | | | 5.84 |
$6.66 - $6.66 | | 1,309 | | 7.13 | | | 6.66 | | 509 | | | 6.66 |
$7.00 - $7.77 | | 295 | | 6.81 | | | 7.11 | | 210 | | | 7.13 |
$8.35 - $8.35 | | 1,288 | | 8.12 | | | 8.35 | | 202 | | | 8.35 |
$8.48 - $9.25 | | 790 | | 6.56 | | | 8.85 | | 270 | | | 8.98 |
$11.14 - $12.50 | | 845 | | 4.83 | | | 12.29 | | 675 | | | 12.30 |
$12.69 - $14.50 | | 242 | | 6.34 | | | 13.52 | | 132 | | | 13.46 |
$15.13 - $15.13 | | 915 | | 3.75 | | | 15.13 | | 915 | | | 15.13 |
$15.25 - $57.50 | | 927 | | 7.50 | | | 20.73 | | 235 | | | 26.79 |
| | | | | | | | | | | | |
| | 7,720 | | 6.30 | | | 10.25 | | 4,010 | | | 10.47 |
| | | | | | | | | | | | |
At December 31, 2006, 2005, and 2004, options exercisable under the plans were 4,010,132, 3,765,394, and 3,825,989, respectively. The total intrinsic value of options outstanding and options exercisable at December 31, 2006 was $66.0 million and $33.9 million, respectively. The remaining contractual life of options exercisable at December 31, 2006 was 5.02 years.
The total intrinsic value of options exercised during the year ended December 31, 2006 was $9.3 million. As of December 31, 2006, $10.1 million of total unrecognized compensation cost related to stock options is expected to be recognized over a weighted average period of 1.92 years.
Employee Stock Purchase Plan
In August 1999, the Board of Directors of the Company adopted the Employee Stock Purchase Plan (the “Stock Purchase Plan”), which is intended to qualify under Section 423 of the Internal Revenue Code. A total of 600,000 shares of common stock were reserved for issuance under the original Stock Purchase Plan. The Stock Purchase Plan was amended and restated on May 14, 2003 and again on May 11, 2005, ultimately increasing the number of common stock reserved for issuance to 1,500,000 shares, of which 385,052 remain available for issuance at December 31, 2006. Each employee of the Company who customarily works more than 20 hours per week for more than five months per calendar year is eligible to participate in offerings under the Stock Purchase Plan if on the offering date, such employee has been employed by the Company for at least 90 days. Employees who own more than 5% of the Company’s outstanding stock may not participate. The Stock Purchase Plan permits eligible employees to purchase common stock through payroll deductions, which may not exceed the lesser of 15% of an employee’s compensation or $25,000.
The two semi-annual offerings under the Stock Purchase Plan begin on January 1 and July 1 and continue until the end of the six-month period ending on June 30 and December 31 (the “Offering Period”). The first Offering Period commenced on January 1, 2000. Effective July 1, 2005, the purchase price of the common stock under the Stock Purchase Plan will be equal to 95% of the fair market value per share of common stock on the last date of the offering period (or purchase date). The Stock Purchase Plan will terminate in 2009, unless terminated sooner by the Board of Directors. Shares issued under the Stock Purchase Plan in 2006, 2005, and 2004 were 70,866, 89,869, and 196,806, at a weighted average purchase price of $15.82, $8.02, and $5.65 per share, respectively. Shares issued in 2005 represent only one offering period since the purchase date of the second offering period took place in early January 2006.
Shareholder rights plan
In September 2000, the Board of Directors of the Company adopted a shareholder rights plan. The plan provides for a dividend distribution of one preferred stock purchase right (a “Right”) for each outstanding share of common stock, distributed to stockholders of record on or after October 19, 2000. The Rights will be exercisable only if a person or group acquires 15% or more of the Company’s common stock (an “Acquiring Person”) or announces a tender offer for 15% or more of the common stock. Each Right will entitle stockholders to buy one one-hundredth of a share of newly created Series A Junior Participating Preferred Stock, par value $0.001 per share, of the Company at an initial exercise price of $75 per Right, subject to adjustment from time to time. However, if any person becomes an Acquiring Person, each Right will then entitle its holder (other than the Acquiring Person) to purchase at the exercise price, common stock of the Company having a market value at that time of twice the Right’s exercise price.
F-21
THE TRIZETTO GROUP, INC.
NOTES TO CONSOLIDATED FINANCIAL STATEMENTS—(Continued)
If the Company is later acquired in a merger or similar transaction, all holders of Rights (other than the Acquiring Person) may, for $75.00, purchase shares of the acquiring corporation with a market value of $150.00. Rights held by the Acquiring Person will become void. The Rights Plan excludes from its operation ValueAct Capital with respect to the shares of the Company’s common stock acquired by it on December 21, 2004. As a result, their holdings will not cause the Rights to become exercisable or non-redeemable or trigger the other features of the Rights. The Rights will expire on October 2, 2010, unless earlier redeemed by the Board at $0.001 per Right.
The holders of Series A Junior Participating Preferred Stock in preference to the holders of common stock, shall be entitled to receive, when, as and if declared by the Board of Directors, quarterly dividends payable in cash in an amount per share equal to 100 times the aggregate per share amount of all cash dividends or non-cash dividends other than a dividend payable in share of common stock.
Each share of Series A Junior Participating Preferred Stock shall entitle its holder to 100 votes.
Deferred stock compensation and restricted stock
Prior to the January 1, 2006 adoption of SFAS No. 123R, the Company recorded deferred stock compensation related to stock options granted to employees, where the exercise price is lower than the fair market value of the Company’s common stock on the date of the grant. Additionally, the Company recorded deferred stock compensation for the issuance of restricted stock to certain employees related to acquisitions and to certain employees to encourage continued service with the Company.
The Company recorded a total of $1.4 million and $3.0 million of deferred stock compensation in 2005 and 2004, respectively, for the issuance of restricted stock. The deferred stock compensation charge was then amortized to compensation expense over the vesting period of the underlying stock option or restricted stock awarded. Amortization of deferred stock compensation expense was $1.4 million and $594,000 in 2005 and 2004, respectively. The valuation of restricted stock is calculated based on the fair market value on the date of grant. Pursuant to the restricted stock agreements, the Company shall cancel any unvested shares of common stock upon termination of services. There were approximately 1,086,000 shares of restricted stock outstanding at December 31, 2005, of which 479,400 shares were unvested.
With the adoption of SFAS No. 123R on January 1, 2006, the Company reclassified $3.0 million of unearned deferred stock compensation to additional paid-in capital. There were approximately 1,348,000 shares of restricted stock outstanding at December 31, 2006, of which 545,536 shares were unvested.
The following table summarizes nonvested restricted stock awards as of December 31, 2006 and changes during the year ended December 31, 2006 (in thousands, except per share data):
| | | | | | |
| | | Number of Shares | | | Weighted-
Average
Grant-Date Fair Value |
Nonvested at December 31, 2005 | | 479 | | | $ | 7.64 |
Granted | | 270 | | | | 16.56 |
Vested | | (195 | ) | | | 7.30 |
Forfeited | | (8 | ) | | | 16.81 |
| | | | | | |
Nonvested at December 31, 2006 | | 546 | | | | 12.04 |
| | | | | | |
As of December 31, 2006, there was $5.2 million of total unrecognized compensation cost related to nonvested restricted stock awards, which will be amortized over the weighted-average remaining service period of 2.18 years.
F-22
THE TRIZETTO GROUP, INC.
NOTES TO CONSOLIDATED FINANCIAL STATEMENTS—(Continued)
12. Income Taxes
The components of the provision for income taxes are as follows (in thousands):
| | | | | | | | | | |
| | | Years Ended December 31, |
| | | 2006 | | 2005 | | | 2004 |
Current: | | | | | | | | | | |
Federal | | $ | 1,272 | | $ | 429 | | | $ | — |
State | | | 1,222 | | | (17 | ) | | | 1,101 |
| | | | | | | | | | |
| | | 2,494 | | | 412 | | | | 1,101 |
| | | | | | | | | | |
Deferred: | | | | | | | | | | |
Federal | | | — | | | — | | | | — |
State | | | — | | | — | | | | — |
| | | | | | | | | | |
| | | — | | | — | | | | — |
| | | | | | | | | | |
Provision for income taxes | | $ | 2,494 | | $ | 412 | | | $ | 1,101 |
| | | | | | | | | | |
Deferred income taxes reflect the net tax effects of temporary differences between carrying amounts of assets and liabilities for financial reporting purposes and the amounts used for income tax purposes. Significant components of the Company’s deferred tax liabilities and assets as of December 31, 2006 and 2005, are as follows (in thousands):
| | | | | | | | | | | | | | | | |
| | | December 31, 2006 | | | December 31, 2005 | |
| | | Current | | | Long Term | | | Current | | | Long-Term | |
Deferred tax assets: | | | | | | | | | | | | | | | | |
Reserves and accruals | | $ | 8,143 | | | $ | — | | | $ | 2,349 | | | $ | — | |
Deferred compensation | | | — | | | | 2,886 | | | | — | | | | 130 | |
Other | | | — | | | | 376 | | | | 6 | | | | 34 | |
State taxes | | | 729 | | | | — | | | | 12 | | | | — | |
Deferred revenue | | | — | | | | — | | | | 533 | | | | — | |
Acquired intangible assets | | | — | | | | — | | | | — | | | | 1,137 | |
Depreciation | | | — | | | | 245 | | | | — | | | | — | |
Start-up costs | | | 554 | | | | 2,440 | | | | 813 | | | | 2,440 | |
Net operating losses and capital losses | | | 8,787 | | | | — | | | | 8,000 | | | | 19,233 | |
Tax credits | | | — | | | | 2,674 | | | | — | | | | 1,964 | |
| | | | | | | | | | | | | | | | |
Total deferred tax assets | | | 18,213 | | | | 8,621 | | | | 11,713 | | | | 24,938 | |
| | | | | | | | | | | | | | | | |
Deferred tax liabilities: | | | | | | | | | | | | | | | | |
Deferred revenue | | | (1,984 | ) | | | — | | | | — | | | | — | |
Depreciation | | | — | | | | — | | | | — | | | | (1,272 | ) |
State taxes | | | — | | | | (40 | ) | | | — | | | | (1,204 | ) |
Acquired intangible assets | | | — | | | | (13,234 | ) | | | — | | | | — | |
Capitalized software | | | — | | | | (9,447 | ) | | | — | | | | (11,949 | ) |
| | | | | | | | | | | | | | | | |
Total deferred tax liabilities | | | (1,984 | ) | | | (22,721 | ) | | | — | | | | (14,425 | ) |
| | | | | | | | | | | | | | | | |
Net deferred tax assets before valuation allowance | | | 16,229 | | | | (14,100 | ) | | | 11,713 | | | | 10,513 | |
Valuation allowance | | | (2,129 | ) | | | — | | | | (11,713 | ) | | | (10,513 | ) |
| | | | | | | | | | | | | | | | |
Net deferred taxes | | $ | 14,100 | | | $ | (14,100 | ) | | $ | — | | | $ | — | |
| | | | | | | | | | | | | | | | |
The valuation allowance on the deferred tax assets was $2.1 million and $22.2 million as of December 31, 2006 and 2005, respectively. The valuation allowance decreased by $20.1 million during 2006 as a result of current year operating profits which allowed for the utilization of net operating loss carryovers, and also as a result of $15.4 million of net deferred liabilities recorded in connection with the acquisition of CareKey.
At December 31, 2006 and 2005, deferred tax assets do not include $9.5 million and $5.8 million, respectively, of excess tax benefits from employee stock option exercises that are a component of the Company’s net operating loss carryovers. Deferred taxes and the valuation allowance as of December 31, 2005 have been restated in order to conform to the 2006 presentation. Equity will be increased by $9.5 million when such excess tax benefits are realized.
If and when the Company decreases the valuation allowance on its deferred tax asset, approximately $1.5 million will be allocated to income tax benefit and $600,000 will be recorded as an adjustment to goodwill. During 2006, goodwill decreased by $526,000 as a result of the initial recognition of tax benefits obtained in the Diogenes acquisition.
F-23
THE TRIZETTO GROUP, INC.
NOTES TO CONSOLIDATED FINANCIAL STATEMENTS—(Continued)
The Company’s effective tax rate differs from the statutory rate as shown in the following schedule (in thousands):
| | | | | | | | | | | | |
| | | Years Ended December 31, | |
| | | 2006 | | | 2005 | | | 2004 | |
Tax expense at federal statutory rate | | $ | 6,163 | | | $ | 7,851 | | | $ | 3,250 | |
State income taxes | | | 1,970 | | | | (17 | ) | | | 1,101 | |
Change in valuation allowance | | | (5,926 | ) | | | (7,658 | ) | | | (3,498 | ) |
Initial recognition of tax benefits allocated to goodwill | | | 526 | | | | — | | | | — | |
Refund of prior year state taxes | | | (354 | ) | | | — | | | | 65 | |
Reduction in reserve for uncertain tax positions | | | (350 | ) | | | — | | | | — | |
Nondeductible items | | | 465 | | | | 236 | | | | 183 | |
| | | | | | | | | | | | |
| | $ | 2,494 | | | $ | 412 | | | $ | 1,101 | |
| | | | | | | | | | | | |
Federal and state tax loss carryforwards at December 31, 2006 are $44.1 million and 42.0 million, respectively. The federal tax loss carryforwards will start to expire beginning in 2010. The state tax loss carryforwards will start to expire beginning in 2007. Approximately $12.0 million of the remaining federal and state tax loss carryforwards are related to net operating losses obtained in connection with the Diogenes and CareKey acquisitions. Such net operating losses are subject to limitations in accordance with IRC Section 382.
13. Employee Benefit Plans
In January 1998, the Company adopted a defined contribution plan (the “401(k) Plan”) which qualifies under Section 401(k) of the Internal Revenue Code of 1986. Employees are eligible to participate the first day of the month following 30 days of employment. Eligible employees may make voluntary contributions to the 401(k) Plan of up to 25% of their annual compensation, not to exceed the statutory limit.
Effective January 1, 2001, the Company provides a discretionary matching contribution to the 401(k) Plan in the amount of $0.50 for each $1.00 contributed to the Plan, up to 6% of pay. Employees must be employed on the last day of the Plan Year (December 31) to receive the match. The match has a three-year vesting period after which the employee will be 100% vested. The Company’s cash contributions to the 401(k) plan in 2006, 2005, and 2004 were approximately $2.3 million, $1.9 million, and $2.1 million, respectively.
On December 21, 2005, the Company’s Compensation Committee of the Board of Directors formally adopted the Executive Deferred Compensation Plan (the “Plan”). The Plan is an unfunded deferred compensation plan established and maintained for the purpose of providing key management employees with the opportunity to defer the receipt of compensation and to accumulate earnings on such deferrals on a tax-deferred basis. The Company’s Compensation Committee of the Board of Directors determines which key management employees will be eligible to participate in the Plan. Currently, all of the executive officers of the Company are eligible to participate. The Plan is administered by the Company and became effective as of June 30, 2005.
Under the Plan, each participant may elect to defer, for any calendar year, up to 75% of his or her base salary and/or 100% of any commissions and/or bonuses earned during such calendar year. Amounts deferred for each participant are recorded in a bookkeeping account for such participant. Each participant is allowed to make a hypothetical allocation of the amounts credited to his or her account among investment options/indices that the Company makes available from time to time. Each account is credited at least annually with notational earnings equal to the aggregate/weighted average return on the investment options/indices selected by the participant, less expenses. The Company also may credit each participant’s account with a discretionary company contribution. Company contributions vest after three years of service with the Company. The Company’s cash contribution to the Plan in 2006 was approximately $52,000.
Upon termination of employment, a participant is entitled to a benefit from the Company equal to the amount of vested contributions credited to his or her account, subject to certain restrictions. Alternatively, a participant may elect to have all or a portion the contributions in his or her account paid in one or more installments, subject to certain waiting period and other restrictions set forth in the Plan.
The Company has purchased life insurance policies with the funds in which the executive officers elected to defer in the Plan. The majority of the non-qualified retirement plan assets are held in a company-owned life insurance policy, whose investment assets are a separately-managed portfolio administered by an insurance company. The assets held under this insurance policy are recorded at estimated fair value with changes in estimated value recorded in net earnings. At the end of fiscal year 2006, the
F-24
THE TRIZETTO GROUP, INC.
NOTES TO CONSOLIDATED FINANCIAL STATEMENTS—(Continued)
Company was the beneficiary of various insurance contracts on some of the participants in the Plans. At December 31, 2006, these life insurance contracts had cash surrender values of approximately $600,000.
14. Acquisitions
Diogenes, Inc.
On April 26, 2004, the Company completed its acquisition of Diogenes, Inc. (“Diogenes”). Diogenes developed and marketed transaction-messaging software, which provides EDI-class transaction processing across the Internet. The Company determined that Diogenes’ software as adapted to handle healthcare claims and other business transactions would broaden and augment its current offerings and strengthen the infrastructure of its current offerings.
The final purchase price as of April 26, 2005 was approximately $5.2 million, which consisted of cash payments of $2.2 million, deferred payments of $2.5 million, and acquisition-related costs of $459,000. The former shareholders of Diogenes received a total payment of $2.5 million on April 26, 2005, which was paid in cash. The acquisition of Diogenes was not significant to the Company’s results of operations and therefore is not required to present pro forma information for the periods prior to acquisition.
The acquisition was accounted for using the purchase method of accounting and, accordingly, the purchase price was allocated to the tangible and intangible assets acquired and liabilities assumed on the basis of their estimated fair market values on the acquisition date. The excess of the purchase price over the estimated fair market value of the assets purchased and liabilities assumed was $5.2 million and was allocated to goodwill and other intangible assets. Goodwill, representing the excess of the purchase price over the fair value of tangible and identifiable intangible assets acquired in the acquisition, will not be amortized and is not deductible for tax purposes. In 2006, goodwill decreased by $526,000 as a result of the initial recognition of tax benefits obtained in the Diogenes acquisition. Other intangibles are being amortized over a period of 60 months from the date of acquisition.
CareKey, Inc.
On December 22, 2005, the Company acquired all of the issued and outstanding shares of CareKey, Inc. (“CareKey”) for cash. The acquisition was accounted for using the purchase method of accounting. As of December 31, 2005, the excess of the purchase price over the preliminary fair market value of the assets purchased and liabilities assumed was $47.7 million and was allocated to goodwill.
In August 2006, the Company received the final valuation of assets and liabilities assumed. The final valuation of identifiable intangible assets was determined to be $29.0 million. The $29.0 million allocated to identifiable intangible assets includes customer relationships and maintenance agreements of $7.4 million to be amortized over a ten-year life, existing software of $13.0 million to be amortized over a five-year life, and core technology of $8.6 million to be amortized over a ten-year life. CareKey stockholders and option holders are entitled to receive three contingent consideration payments of $8.3 million each (up to $25.0 million), upon the achievement of certain revenue milestones during the period beginning upon acquisition and ending December 31, 2008. In addition, further consideration payable in cash or stock at the Company’s election, may be paid to former CareKey stockholders and option holders if, prior to December 31, 2008, the acquired CareKey products generate revenues in excess of certain revenue milestones and/or if a negotiated multiple of software maintenance revenues of acquired CareKey products during the fiscal year ended December 31, 2009 exceeds total purchase consideration made to those former CareKey stockholders and option holders.
The following unaudited pro forma summary combines the consolidated results of operations of the Company and CareKey for the years ended December 31, 2005 and 2004 as if the acquisition had occurred at the beginning of 2004, after giving effect to certain pro forma adjustments. This pro forma financial information is provided for informational purposes only and may not be indicative of the results of operations as they would have been had the transaction been effected on the assumed date, nor is it indicative of the results of operations which may occur in the future (in thousands, except per share amounts).
| | | | | | |
| | | Years Ended December 31, (unaudited) |
| | | 2005 | | 2004 |
Total revenue | | $ | 298,462 | | $ | 274,636 |
Net income | | $ | 16,709 | | $ | 1,951 |
Net income per share (diluted) | | $ | 0.37 | | $ | 0.04 |
F-25
THE TRIZETTO GROUP, INC.
NOTES TO CONSOLIDATED FINANCIAL STATEMENTS—(Continued)
Plan Data Management, Inc.
On December 22, 2006, the Company acquired all of the issued and outstanding shares of Plan Data Management, Inc. (“PDM”). PDM is a business solutions company focused on providing software and services to the healthcare industry primarily for payers that service members in Medicare Advantage, Medicare Part D and Medicaid plans.
Because the acquisition was completed on December 22, 2006, there was not sufficient time to finalize the fair market valuation of assets and liabilities acquired as of December 31, 2006. Once the Company receives a final valuation, the estimated purchase price will be adjusted and the allocation between goodwill and identifiable intangible assets will be recorded. Portions related to goodwill, representing the excess of the purchase price over the fair value of tangible and identifiable intangible assets acquired in the acquisition will not be amortized and is not deductible for tax purposes. Any amounts attributable to identifiable intangible assets will be amortized over their useful life and deductible over varying tax periods. The estimated purchase price as of December 31, 2006 was approximately $19.6 million, which consisted of 491,488 shares of the Company’s common stock with a value of $16.28 per share (which represents the average closing price of TriZetto’s common stock for the 20 trading days ending October 27, 2006), cash payments of $8.0 million, assumed liabilities of $3.1 million and estimated acquisition-related costs of $500,000. Due to the close of the acquisition late in the year, the issuance of the 491,488 shares of common stock and the cash payment of $8.0 million to PDM stockholders and option holders were not completed prior to December 31, 2006. However, these amounts were accrued as of December 31, 2006. The computation of earnings per share for the year ended December 31, 2006 did not include the issuance of the 491,488 shares of common stock or the financial operating results of PDM since the impact of these amounts was not material.
PDM stockholders and option holders will also be entitled to receive contingent consideration under each of the following circumstances: aggregate payments of up to $5.0 million on or before June 30, 2007, $5.0 million on or before December 31, 2008, and $8.0 million on or before December 31, 2009, each subject to reduction if certain revenue thresholds are not satisfied during the applicable measurement period. Additional contingent consideration may be paid on June 30, 2009 if certain revenue thresholds are satisfied, provided that in no event will the aggregate consideration of all payments exceed $42.0 million. The merger consideration is also subject to adjustment based upon minimum cash and working capital balances. It is expected that 50% of each payment will be made in cash and 50% will be paid in shares of the Company’s common stock.
The acquisition was accounted for using the purchase method of accounting. The excess of the purchase price over the preliminary fair market value of the assets purchased and liabilities assumed was $15.0 million and was allocated to goodwill. Once the Company completes its final determination of the fair market value of the assets and liabilities assumed, the estimated purchase price will be adjusted and the allocation between goodwill and identifiable intangible assets will be recorded. The acquisition of PDM was not significant to the Company’s results of operations and therefore no pro forma information for the periods prior to acquisition have been presented.
The purchase price allocations for the acquisitions described above were based on the estimated fair value of the assets and liabilities, on the date of purchase as follows (in thousands):
| | | | | | | | | | | | |
| | | Diogenes | | | CareKey | | | PDM (1) | |
Total current assets | | $ | 155 | | | $ | 13,935 | | | $ | 3,758 | |
Property, plant, equipment and other non-current assets | | | 834 | | | | 1,562 | | | | 861 | |
Goodwill | | | 1,350 | | | | 36,390 | | | | 15,018 | |
Other intangible assets | | | 3,300 | | | | 29,000 | | | | — | |
| | | | | | | | | | | | |
Total assets acquired | | | 5,639 | | | | 80,887 | | | | 19,637 | |
less: liabilities assumed | | | (433 | ) | | | (3,537 | ) | | | (3,137 | ) |
| | | | | | | | | | | | |
Total purchase price of net assets acquired | | $ | 5,206 | | | $ | 77,350 | | | $ | 16,500 | |
| | | | | | | | | | | | |
| (1) | Allocation is preliminary pending final determination in 2007. |
15. Supplemental Cash Flow Disclosures (in thousands)
| | | | | | | | | |
| | | For the Years Ended December 31, |
| | | 2006 | | 2005 | | 2004 |
Supplemental disclosures for cash flow information | | | | | | | | | |
Cash paid for interest | | $ | 3,280 | | $ | 941 | | $ | 1,486 |
Cash paid for income taxes | | | 2,467 | | | 1,090 | | | 1,189 |
Non-cash investing and financing activities | | | | | | | | | |
Assets acquired through capital lease | | | 2,487 | | | 1,424 | | | 1,151 |
Deferred stock compensation (net of cancellations) | | | — | | | 1,319 | | | 2,604 |
Common stock issued for purchase of intangible assets | | | — | | | 551 | | | — |
Note payable in exchange for repurchase of shares | | | — | | | — | | | 37,414 |
F-26
THE TRIZETTO GROUP, INC.
NOTES TO CONSOLIDATED FINANCIAL STATEMENTS—(Continued)
16. Segment Information
The Company has adopted FASB Statement No. 131, “Disclosures about Segments of an Enterprise and Related Information” (“Statement 131”). Statement 131 requires enterprises to report information about operating segments in annual financial statements and selected information about reportable segments in interim financial reports issued to stockholders. It also establishes standards for related disclosures about products and services, geographic areas and major customers. The Company has only one reportable segment.
The Company classifies its revenue in the following categories: services and other, and products as follows (in thousands):
| | | | | | | | | |
| | | For the Years Ended December 31, |
| | | 2006 | | 2005 | | 2004 |
Outsourced business services | | $ | 86,877 | | $ | 79,418 | | $ | 89,916 |
Software maintenance | | | 88,628 | | | 80,719 | | | 69,065 |
Consulting services and other | | | 97,438 | | | 83,346 | | | 64,276 |
| | | | | | | | | |
Services and other revenue | | | 272,943 | | | 243,483 | | | 223,257 |
| | | | | | | | | |
Software license fees | | | 74,994 | | | 48,736 | | | 51,308 |
| | | | | | | | | |
Products revenue | | | 74,994 | | | 48,736 | | | 51,308 |
| | | | | | | | | |
Total revenue | | $ | 347,937 | | $ | 292,219 | | $ | 274,565 |
| | | | | | | | | |
The Company’s assets are all located in the United States and the Company’s sales were primarily to customers located in the United States.
| 17. | Quarterly Financial Data(unaudited and in thousands, except per share data) |
| | | | | | | | | | | | | | | | | | |
| | | Net Revenue | | Operating
Costs and
Expenses | | Net Income (loss) | | | Net Income (Loss) Per Share, Basic | | | Net Income (Loss) Per Share, Diluted | |
Fiscal year 2006(1) | | | | | | | | | | | | | | | | | | |
First quarter | | $ | 85,318 | | $ | 78,123 | | $ | 6,838 | | | $ | 0.16 | | | $ | 0.15 | |
Second quarter | | | 87,710 | | | 81,050 | | | 6,414 | | | | 0.15 | | | | 0.14 | |
Third quarter | | | 86,437 | | | 92,335 | | | (5,683 | ) | | | (0.13 | ) | | | (0.13 | ) |
Fourth quarter | | | 88,472 | | | 79,481 | | | 7,546 | | | | 0.18 | | | | 0.16 | |
Fiscal year 2005 | | | | | | | | | | | | | | | | | | |
First quarter | | | 71,818 | | | 67,075 | | | 4,298 | | | | 0.10 | | | | 0.10 | |
Second quarter (2) | | | 72,508 | | | 67,172 | | | 4,979 | | | | 0.12 | | | | 0.11 | |
Third quarter | | | 73,053 | | | 66,923 | | | 6,480 | | | | 0.15 | | | | 0.14 | |
Fourth quarter | | | 74,840 | | | 68,656 | | | 6,264 | | | | 0.15 | | | | 0.14 | |
| (1) | In December 2006, the Company entered into a settlement with one of its larger customers that had disputed payments due from a software implementation project. The amounts represented revenue recorded in the first two quarters of 2006 and were included in the allowance for sales returns and a reduction to revenue in the quarter ended September 30, 2006. |
| (2) | Included in cost of revenue are charges associated with loss on contracts. During the fourth quarter of 2003, the Company decided to wind-down its outsourcing services to physician group customers. As a result of this decision, the Company estimated that the existing customer agreements would generate a total loss of $11.3 million until the terms of these agreements expired in 2008. The Company recorded a loss accrual in the fourth quarter of 2003. Through discussions and negotiations, the Company was able to accelerate the termination of its services agreements with certain physician group customers and implemented cost cutting measures that reduced the expected future costs to support its remaining customers. As a result of these actions, the Company was able to reverse approximately $5.9 million of previously accrued loss on contracts charges in 2004. Early in the second quarter of 2005, the Company executed termination agreements with its two remaining physician group customers. The Company continued to provide outsourced business services through May 2005, when the transition services were completed. The completion of these services to the remaining customers allowed the Company to reverse the remaining balance in the loss on contracts accrual of $2.9 million in the second quarter of 2005. The total amount of loss actually incurred related to the outsourcing services to physician group customers was $2.1 million in 2004 and $403,000 in the first six months of 2005. |
F-27
THE TRIZETTO GROUP, INC.
NOTES TO CONSOLIDATED FINANCIAL STATEMENTS—(Continued)
18. Subsequent Events
Quality Care Solutions, Inc.
On January 10, 2007, the Company announced that it had completed the acquisition of privately held Quality Care Solutions, Inc. (“QCSI”). As previously announced, the definitive agreement for the acquisition was executed on September 13, 2006 and the Company received regulatory clearance for the transaction on December 29, 2006. QCSI is a provider of healthcare claims administration platforms and consumer-directed health solutions for payers. Enterprise applications include the QNXT product family, the QMACS product family and the web-based MyHealthBank suite of products.
Under the merger agreement, the Company paid to QCSI stockholders, warrantholders and option holders approximately $130.0 million, net of cash received in the merger. QCSI security holders are entitled to an aggregate cash payment of $5.0 million on January 31, 2008, subject to reduction if the parties determine that QCSI had negative working capital under the acquisition agreement as of the date of closing or to the extent that the Company is entitled to claims for indemnification under the acquisition agreement. In addition, former QCSI security holders will be entitled to receive an aggregate cash payment of $7.0 million on January 31, 2008 if license and software revenues arising from the sale of QCSI products reach specified thresholds during the fiscal year ending on December 31, 2007. The Company also assumed approximately $1.0 million of QCSI’s debt.
In connection with the QCSI acquisition, the Company adopted the Quality Care Solutions, Inc. Stock Option Plan based primarily upon QCSI’s existing stock option plan. Unless previously terminated by the stockholders, the Plan shall terminate at the close of business on December 31, 2007, and no options shall be granted under it thereafter.
Wells Fargo Line of Credit
On January 10, 2007, the Company and each of its subsidiaries (the “Borrowers”) entered into an Amended and Restated Credit Agreement (the “Credit Agreement”) with Wells Fargo Foothill, Inc., as the administrative agent and lender (the “Lender”).
The Credit Agreement amends and restates the Borrowers’ current $100.0 million credit facility with the Lender and provides that the Lender shall make available to the Borrowers up to $150.0 million of term debt (the “Term Loan”). The Credit Agreement will expire by its terms on January 5, 2011. All borrowings under the Credit Agreement will bear interest at a per annum rate equal to either (i) the LIBOR rate plus an adjustable applicable margin of between 1.75% and 3.50% or (ii) Wells Fargo’s prime rate plus an adjustable applicable margin of between 0.0% and 2.0%, at the election of the Borrowers, subject to specified restrictions. All borrowings under the Term Loan must be repaid in quarterly installments commencing on April 1, 2007. In the event Borrowers terminate the Credit Agreement prior to its expiration or make certain prepayments, the Borrowers will be required to pay the Lender a termination or prepayment fee equal to 1% of the maximum credit amount in the event of termination or 1% of the prepayment amount in the event of prepayments, subject to specified exceptions.
The Credit Agreement contains customary affirmative and negative covenants for credit facilities of this type, including limitations on the Borrowers with respect to indebtedness, liens, investments, distributions, mergers and acquisitions, dispositions of assets and transactions with affiliates of the Borrowers. The Credit Agreement also includes financial covenants including minimum EBITDA, minimum liquidity, minimum recurring revenue (which includes outsourced business services and software maintenance revenue – see Note 16) and maximum capital expenditures.
The Company has initially drawn down $75.0 million from the Term Loan to help fund its acquisition of QCSI. The Company expects to use the remaining available credit for general working capital purposes. All borrowings under the Term Loan must be repaid in quarterly installments commencing on July 1, 2007 through January 5, 2010 in amounts equal to the amount outstanding under the term loan on June 30, 2007, divided by 28. Under the Credit Agreement, the Borrowers have granted the Lender a security interest in all of the assets of the Borrowers.
F-28
VALUATION AND QUALIFYING ACCOUNTS
(in thousands)
| | | | | | | | | | | | | |
| | | Balance at Beginning of Period | | Additions Charged
to Costs
and
Expenses(1) | | | Deductions(2) | | Balance at End of Period |
Allowance for doubtful accounts | | | | | | | | | | | | | |
Year ended December 31, 2004 | | $ | 2,368 | | $ | (1,010 | ) | | $ | 639 | | $ | 719 |
Year ended December 31, 2005 | | $ | 719 | | $ | 38 | | | $ | 433 | | $ | 324 |
Year ended December 31, 2006 | | $ | 324 | | $ | (47 | ) | | $ | 277 | | $ | — |
Sales returns | | | | | | | | | | | | | |
Year ended December 31, 2004 | | $ | 2,564 | | $ | (1,289 | ) | | $ | 302 | | $ | 973 |
Year ended December 31, 2005 | | $ | 973 | | $ | (439 | ) | | $ | 3 | | $ | 531 |
Year ended December 31, 2006 | | $ | 531 | | $ | 3,261 | | | $ | 22 | | $ | 3,770 |
Deferred tax valuation allowance | | | | | | | | | | | | | |
Year ended December 31, 2004 | | $ | 26,537 | | $ | 1,176 | | | $ | — | | $ | 27,713 |
Year ended December 31, 2005 | | $ | 27,713 | | $ | (5,487 | ) | | $ | — | | $ | 22,226 |
Year ended December 31, 2006 | | $ | 22,226 | | $ | (20,097 | ) | | $ | — | | $ | 2,129 |
(1) | Adjustments to the allowance for doubtful accounts and sales returns were the result of the collections of aged receivables. In December 2006, the Company entered into a settlement with one of its larger customers that had disputed payments due from a software implementation project. The amounts represented revenue recorded in the first two quarters of 2006 and were included in the allowance for sales returns and a reduction to revenue in the quarter ended September 30, 2006. |
(2) | Deductions include the net effect of write-offs and recoveries of uncollectible amounts with respect to accounts receivable. |
S-1