ANNUAL REPORT
ZENITH NATIONAL INSURANCE CORP.
2001
FINANCIAL HIGHLIGHTS
Years ended December 31,
| | 2001
| | 2000
| | 1999
| |
|---|
Operating Results: |
|
|
(Dollars in thousands, except per share data) |
|
| |
Revenues(1) |
|
$ |
622,046 |
|
$ |
459,569 |
|
$ |
492,108 |
|
|
|
|
|
|
|
|
|
| | Operating loss after tax(2) | | | (29,760 | ) | | (37,739 | ) | | (55,228 | ) |
| |
Realized gains (losses) after tax: |
|
|
|
|
|
|
|
|
|
|
|
|
|
|
|
|
|
|
|
|
|
| | |
On investments |
|
|
5,960 |
|
|
(10,054 |
) |
|
4,993 |
|
|
|
|
|
|
|
|
|
|
|
|
| | |
On sale of CalFarm Insurance Company(1) |
|
|
|
|
|
|
|
|
104,335 |
|
|
|
|
|
|
|
|
|
| | (Loss) income before extraordinary item | | | (23,800 | ) | | (47,793 | ) | | 54,100 | |
| |
Extraordinary item — gain on extinguishment of debt after tax(3) |
|
|
|
|
|
993 |
|
|
|
|
|
|
|
|
|
|
|
|
| | Net (loss) income | | $ | (23,800 | ) | $ | (46,800 | ) | $ | 54,100 | |
|
|
|
|
|
|
|
|
| Per Share Data: | | | | | | | | | | |
| |
Operating loss after tax(2) |
|
$ |
(1.69 |
) |
$ |
(2.19 |
) |
$ |
(3.22 |
) |
| |
Realized gains (losses) after tax: |
|
|
|
|
|
|
|
|
|
|
|
|
|
|
|
|
|
|
|
|
|
| | |
On investments |
|
|
0.34 |
|
|
(0.59 |
) |
|
0.29 |
|
|
|
|
|
|
|
|
|
|
|
|
| | |
On sale of CalFarm Insurance Company(1) |
|
|
|
|
|
|
|
|
6.08 |
|
|
|
|
|
|
|
|
|
| | (Loss) income before extraordinary item | | | (1.35 | ) | | (2.78 | ) | | 3.15 | |
| |
Extraordinary item — gain on extinguishment of debt after tax(3) |
|
|
|
|
|
0.06 |
|
|
|
|
|
|
|
|
|
|
|
|
| | Net (loss) income | | $ | (1.35 | ) | $ | (2.72 | ) | $ | 3.15 | |
|
|
|
|
|
|
|
|
| | Stockholders' dividends | | $ | 1.00 | | $ | 1.00 | | $ | 1.00 | |
Key Statistics: |
|
|
|
|
|
|
|
|
|
|
| |
Combined ratio: |
|
|
|
|
|
|
|
|
|
|
|
|
|
|
|
|
|
|
|
|
|
| | |
Including catastrophes(2) |
|
|
118.9% |
|
|
130.2% |
|
|
135.2% |
|
|
|
|
|
|
|
|
|
|
|
|
| | |
Excluding catastrophes(2) |
|
|
110.2% |
|
|
123.6% |
|
|
130.0% |
|
| |
Stockholders' equity |
|
$ |
302,611 |
|
$ |
309,776 |
|
$ |
354,559 |
|
| |
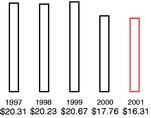
Stockholders' equity per share(4) |
|
|
16.31 |
|
|
17.76 |
|
|
20.67 |
|
| |
Closing common stock price |
|
|
27.94 |
|
|
29.38 |
|
|
20.63 |
|
(1) Zenith completed the sale of CalFarm Insurance Company effective March 31, 1999 for a gain of $104.3 million after tax, or $6.08 per share.
(2) The year ended December 31, 1999 includes $50.0 million before tax ($32.5 million after tax, or $1.89 per share) of net charges associated with an increase in the purchase price of RISCORP. Operating loss excludes realized gains (losses).
(3) In 2000, Zenith repurchased a total of $16.5 million aggregate principal amount of the outstanding 9% Senior Notes due 2002 and $8.0 million aggregate liquidation amount of the outstanding 8.55% Capital Securities.
(4) Excluding the effect of Statement of Financial Accounting Standards No. 115, stockholders' equity per share was $16.36, $18.31, and $21.80 at December 31, 2001, 2000 and 1999, respectively.
1
TABLE OF CONTENTS
| • | Financial Highlights | | 1 |
• |
Letter to Stockholders |
|
3 |
• |
Management's Discussion and Analysis of Consolidated
Financial Condition and Results of Operations |
|
22 |
• |
5-Year Summary of Selected Financial Information |
|
38 |
• |
Property-Casualty Loss Development |
|
40 |
• |
Consolidated Balance Sheet |
|
42 |
• |
Consolidated Statement of Operations |
|
44 |
• |
Consolidated Statement of Cash Flows |
|
45 |
• |
Consolidated Statement of Stockholders' Equity |
|
46 |
• |
Notes to Consolidated Financial Statements |
|
48 |
• |
Report of Independent Accountants |
|
68 |
• |
Corporate Directory |
|
|
|
Zenith National Insurance Corp. |
|
70 |
|
Zenith Insurance Company |
|
71 |
|
TheZenith Marketing, Underwriting and Claims Offices |
|
72 |
|
Perma-Bilt, a Nevada Corporation |
|
72 |
TheZenith and Zenith are registered U.S. trademarks.
2
TO OUR STOCKHOLDERS
Zenith did not return to profitability due to losses incurred in our Reinsurance operations related to the tragic events of September 11th, however 2001 net loss and operating loss improved significantly compared to 2000.
Let us take a moment to acknowledge that monetary and material losses pale in comparison to the human tragedy of the terrorist attack. On behalf of our management and staff, let me extend our heartfelt condolences to the families whose loved ones were lost or injured, some of whom were our colleagues in the financial markets. And let me express our admiration for the courageous actions of the emergency personnel. We pray and hope that this is a one-time occurrence.
Moving forward, there is positive news to report. Zenith's 2001 performance resulted in a 15 percentage point improvement of our combined ratio to 114% in our major business segment, Workers' Compensation. This in tandem with a 38% growth in premium revenues marks a major favorable trend reversal. Prices continue to increase in both our Workers' Compensation and Reinsurance markets. We begin 2002 in a strong financial position to support continuing growth and the restoration of profitability.
9/11 LEGACY FROM AN INSURANCE PERSPECTIVE
Significant underwriting and pricing changes are already underway; new lessons have been learned from the single most devastating property and Workers' Compensation loss in history:
- •
- Prices reinsurers charge have increased, and the terms of contracts offered have been modified.
- •
- Zenith will no longer provide coverage for terrorism in our Reinsurance policies.
- •
- To ensure we properly price our Workers' Compensation business, we will make a modest charge for terrorism exposure where allowed.
- •
- As a purchaser of Reinsurance within our Workers' Compensation business, we are unable to obtain significant terrorism coverage at prices that make economic sense at this time.
3
NEW UNDERWRITING AND PRICING LESSONS HAVE BEEN LEARNED FROM THE SINGLE MOST DEVASTATING PROPERTY AND WORKERS' COMPENSATION LOSS IN HISTORY.
- •
- Close monitoring of our Workers' Compensation segment is underway to make certain we do not write business that will clearly increase our risk and terrorism exposure.
- •
- Submissions have already been rejected where the employer is domiciled in a high-profile structure, and where, in our opinion, security arrangements are inadequate or nonexistent.
- •
- An analysis of our policyholders indicates we do not have large numbers of employers with major employee concentrations in single high profile locations or high-rise buildings.
- •
- Additional capital recently invested in the reinsurance industry will likely dampen the amount and duration of future rate increases in some cases, even though demand for reinsurance coverage is expected to continue.
In summary, the world appears far riskier today than it did prior to September 11th. From our perspective, we believe our rate increases will exceed loss-cost trends, and result in the ongoing improvement of our combined ratios and profitability.
PERFORMANCE SUMMARY
- 1.
- Workers' Compensation:
- •
- Premiums inforce increased 36%.
- •
- Policies inforce increased by 3,000 to 35,500.
- •
- Price increases are continuing.
- •
- Underwriting losses reduced by $29.5 million.
- •
- Combined ratio improved to 114% from 129% in 2000.
- 2.
- Additional financial stability:
- •
- Capital increased by $25 million.
- •
- One million shares sold at 150% of book value.
- •
- Cash flow from operations was $84.6 million in 2001.
4
- 3.
- Net loss and operating loss:
- •
- Net loss was $23.8 million, compared to $46.8 million in 2000.
- •
- Operating loss was $29.8 million, compared to $37.7 million in 2000.
- •
- WTC net loss was $24.4 million after tax, or $1.39 per share.
- 4.
- Investment Income pre-tax:
- •
- Comparable in 2001 and 2000 at about $52 million.
- •
- A favorable result in view of declining interest rates.
- •
- Investment portfolio increased from $852.7 million to $944.7 million.
ANALYSIS
Net loss was $23.8 million, or $1.35 per share in 2001, compared to net loss of $46.8 million, or $2.72 per share the prior year.
The following table summarizes pre-tax underwriting performance during the past three years.
| |
|---|
Underwriting Results
| | 2001
| | 2000
| | 1999
| |
|---|
| |
|---|
| | | | (Dollars in thousands) | |
| Workers' Compensation | | $ | (58,329 | ) | $ | (87,854 | ) | $ | (122,543 | ) |
| Other Property-Casualty | | | | | | | | | (22 | ) |
| Reinsurance | | | (31,918 | ) | | (14,536 | ) | | (7,324 | ) |
| |
| Underwriting loss | | $ | (90,247 | ) | $ | (102,390 | ) | $ | (129,889 | ) |
| |
| Catastrophes | | | (41,700 | ) | | (22,600 | ) | | (18,900 | ) |
| |
2001 results improved significantly, but were adversely affected by the WTC events of September 11, 2001.
- •
- Combined ratio for the Workers' Compensation operations was 114%, comprised of a 65% accident year loss ratio (compared to 68% for the current estimate of last year), a 49% loss adjustment and underwriting expense ratio, and a zero impact from prior years' reserve strengthening. Since the
5
PRICE INCREASES IN BOTH OUR WORKERS' COMPENSATION AND REINSURANCE OPERATIONS POSITION US FAVORABLY FOR THE FUTURE.
beginning of California's open-rating in 1995, our California loss ratio has averaged 69%, compared to 108% for the California industry. Our 39-point advantage is better than TheZenith's comparative results prior to open rating, and demonstrates the discipline of our pricing, underwriting and service strategies during a period of significant market turmoil. Growth in earned premiums of 38% this past year is a result of our underwriting patience.
- •
- 2001 accident year Reinsurance operations were poor due to WTC losses; however, it isn't reasonable to evaluate this business on short-term results.
- •
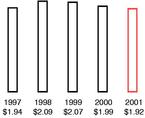
- Investment income after tax was $33.8 million, or $1.92 per share in 2001, compared to $34.2 million, or $1.99 per share in 2000.
- •
- Stockholders' equity at December 31, 2001 was $302.6 million, compared to $309.8 million at December 31, 2000.
- •
- Cash generated from operating activities was $84.6 million in 2001, compared to $47.0 million used in 2000, primarily due to payment of claim liabilities last year. Dividends to shareholders were $17.5 million paid from surplus because of net loss for the year.
- •
- At December 31, 2001, Zenith had long-term debt of $57.2 million, compared to $58.4 million at December 31, 2000. This debt matures on May 1, 2002 and cash exists in the parent Company to repay this obligation. Also outstanding was $65.7 million of 8.55% Capital Trust Securities issued in July 1998, maturing in 27 years. TheZenith's parent Company has $70.0 million of bank lines of credit available at year-end.
- •
- Zenith's subsidiaries are rated A-(Excellent) by A.M. Best Company. Moody's Investor's Service and Standard & Poor's have assigned an insurance financial strength rating of Baa1 (Adequate) and A- (Strong), respectively.
Information in the following table provides estimates of Zenith's net incurred losses and loss adjustment expenses for our Workers' Compensation and Reinsurance business by accident year,
6
LOSS RESERVE ADEQUACY IS ESSENTIAL FOR PRICING AND BALANCE SHEET STRENGTH.
evaluated in the year they were incurred and as they were subsequently evaluated in succeeding years. These data are of critical importance in judging the accuracy of our reserve estimates, as well as providing a guide to the setting of fair prices and rates. Our long-term reserve estimates for 1995 and prior have developed favorably based on our analysis of the data at the end of 2001. However, two significant trends in our insurance operations should be discussed relative to our loss reserve estimates for more recent years such as 1996, 1998 and 1999. First, the trend of increasing claims severity in the Workers' Compensation business caused us to increase our loss reserve estimates last year, principally for the 1999 accident year. We continually analyze our Workers' Compensation data and make every effort to price and reserve for this phenomena. Our analysis at year-end 2001 indicates we have adequately reserved for prior years, and that we are entering 2002 with appropriate rates. However, any unanticipated changes in claims severity and/or frequency may be reflected in future loss reserve estimates, and may require appropriate pricing adjustments.
Second, estimating catastrophe losses in the Reinsurance business is highly dependent upon the nature and timing of the event and our ability to obtain timely and accurate information with which to estimate our liability to pay losses. Loss reserve estimates for catastrophes in recent years, notably 1998 and 1999, have developed unfavorably, mainly attributable to Hurricane Georges in 1998 and the major European storms at the end of 1999. Older year loss reserves for casualty Reinsurance business prior to 1995 developed favorably in 2001. At the end of 2001 with respect to our WTC loss estimate, approximately 70% of the loss is attributable to our contractual maximum loss payable under our excess of loss reinsurance contracts; the remainder of the estimated loss is an estimate of the expected loss incurred on assumed quota share reinsurance contracts. There is considerable uncertainty as to the nature and amount of monetary losses associated with the attack on the World Trade Center, however, we believe we have reserved adequately at year end.
7
LOSS RESERVE ADEQUACY IS AN INHERENT RISK OF THE BUSINESS WHICH WE ENDEAVOR TO MINIMIZE THROUGH PROFESSIONAL CLAIM HANDLING AND
ESTIMATING TECHNIQUES.
|
|---|
Accident Year Reserve Development From Operations
|
|---|
|
|---|
| | | | Net incurred losses and loss adjustment expenses reported at end of year |
|
|---|
| Years in which losses were incurred | | | 1995 | | | 1996 | | | 1997 | | | 1998 | | | 1999 | | | 2000 | | | 2001 |
|
|---|
(Dollars in thousands) |
|
|
|
|
|
|
|
|
|
|
|
|
|
|
|
|
|
|
|
|
|
| Prior to 1995 | | $ | 2,043,207 | | $ | 2,031,870 | | $ | 2,023,559 | | $ | 2,601,752 | | $ | 2,604,758 | | $ | 2,610,441 | | $ | 2,592,458 |
| 1995 | | | 180,170 | | | 187,517 | | | 196,335 | | | 341,708 | | | 351,292 | | | 342,839 | | | 339,602 |
| Cumulative | | | 2,223,377 | | | 2,219,387 | | | 2,219,894 | | | 2,943,460 | | | 2,956,050 | | | 2,953,280 | | | 2,932,060 |
| 1996 | | | | | | 181,844 | | | 238,635 | | | 429,335 | | | 443,443 | | | 434,315 | | | 437,821 |
| Cumulative | | | | | | 2,401,231 | | | 2,458,529 | | | 3,372,795 | | | 3,399,493 | | | 3,387,595 | | | 3,369,881 |
| 1997 | | | | | | | | | 204,502 | | | 333,818 | | | 339,907 | | | 346,276 | | | 344,092 |
| Cumulative | | | | | | | | | 2,663,031 | | | 3,706,613 | | | 3,739,400 | | | 3,733,871 | | | 3,713,973 |
| 1998 | | | | | | | | | | | | 258,000 | | | 271,317 | | | 276,768 | | | 283,713 |
| Cumulative | | | | | | | | | | | | 3,964,613 | | | 4,010,717 | | | 4,010,639 | | | 3,997,686 |
| 1999 | | | | | | | | | | | | | | | 278,054 | | | 309,012 | | | 321,584 |
| Cumulative | | | | | | | | | | | | | | | 4,288,771 | | | 4,319,651 | | | 4,319,270 |
| 2000 | | | | | | | | | | | | | | | | | | 306,082 | | | 310,810 |
| Cumulative | | | | | | | | | | | | | | | | | | 4,625,733 | | | 4,630,080 |
| 2001 | | | | | | | | | | | | | | | | | | | | | 427,943 |
| Ratios: | | | | | | | | | | | | | | | | | | | | | |
| 1995 | | | 73.12% | | | 76.10% | | | 79.68% | | | 73.11% | | | 75.16% | | | 73.35% | | | 72.66% |
| 1996 | | | | | | 73.36% | | | 79.35% | | | 80.08% | | | 82.71% | | | 81.01% | | | 81.66% |
| 1997 | | | | | | | | | 75.04% | | | 72.56% | | | 73.88% | | | 75.26% | | | 74.79% |
| 1998 | | | | | | | | | | | | 74.76% | | | 78.62% | | | 80.20% | | | 82.21% |
| 1999 | | | | | | | | | | | | | | | 86.91% | | | 96.58% | | | 100.51% |
| 2000 | | | | | | | | | | | | | | | | | | 88.76% | | | 90.13% |
| 2001 | | | | | | | | | | | | | | | | | | | | | 89.74% |
|
-This analysis displays the development of accident year net incurred losses and loss adjustment expenses on a GAAP basis for accident years 1995-2001 for all property-casualty business. The total of net loss and loss adjustment expenses for all claims occurring within each annual period is shown first at the end of that year and then annually thereafter. The total cost includes both payments made and the estimate of future payments as of each year-end. Past development may not be an accurate indicator of future development since trends and conditions change.
-The data prior to 1999 have been restated to exclude the results of CalFarm Insurance Company, which was sold effective March 31, 1999. Incurred amounts for RISCORP are reported in 1998 and subsequent years but not in 1995-1997.
8
CAPITAL INCREASED BY $25 MILLION WITH THE SALE OF ONE MILLION SHARES
AT 150% OF BOOK VALUE.
INVESTMENTS
Investment activities are a major part of our revenues and earnings; we believe our portfolio is diversified to achieve a reasonable balance of risk and a stable source of earnings. Zenith primarily invests in debt securities, as compared to equities, and our largest holdings are U.S. Government securities. In comparison to other insurers, we believe our portfolio contains a smaller percentage of equities to total assets, and a larger percentage of cash or short-term securities.
- •
- Consolidated investment income after tax and after interest expense was $28.9 million, or $1.64 per share in 2001, compared to $30.6 million, or $1.78 per share in 2000. Average yields on this portfolio in 2001 were 5.6% before tax and 3.7% after tax, respectively, compared to 5.9% and 3.9%, respectively, in 2000.
- •
- During 2001, Zenith recorded net profits before tax from our investment portfolio of $9.2 million, compared to losses of $15.5 million the prior year. The gains were primarily from trading debt securities offset, in part, by writedowns or losses incurred on certain bonds due to declining credit quality or insolvencies.
- •
- Pre-tax income during 2001 from our real estate activities was $5.8 million, compared to $5.5 million the prior year.
- •
- Zenith's investment portfolio increased $92.0 million, or 10.8% in 2001.
- •
- Unrealized losses in our portfolio of fixed maturity investments were $0.6 million before tax in 2001, compared to $14.5 million, before tax the prior year.
Zenith's investment portfolio is recorded in the financial statements primarily at market value. Average life of the bond portfolio was 6.3 years at December 31, 2001, compared to 5.3 years at December 31, 2000. Portfolio quality is high with 95%, 94% and 95% rated investment grade at December 31, 2001, 2000 and 1999, respectively.
9
2001 WORKERS' COMPENSATION PERFORMANCE RESULTED IN A 15 PERCENTAGE POINT IMPROVEMENT IN OUR COMBINED RATIO TO 114%.
The major developments in the U.S. bond markets were continued low inflation and declining interest rates. Since we are capable of holding bonds to maturity, and the average maturities are relatively short, fluctuations in bond values do not significantly impact our operations.
Short-term investments and liquidity remained high as we searched for intelligent investment opportunities and maintained cash to repay our maturing debt in 2002. We have invested only a small amount of our capital in common stocks, since we believed the equity market was overpriced and would not provide a reasonable return. Management will continue to monitor conditions and at an appropriate time may reconsider our strategy.
|
|---|
Securities Portfolio
| At December 31, 2001
| | At December 31, 2000
|
|---|
|
| | | Amortized Cost* | | Market Value | | | Amortized Cost* | | Market Value |
|
| | | (Dollars in Thousands) |
| Short-Term Investments | $ | 119,066 | $ | 119,066 | | $ | 158,438 | $ | 158,438 |
| U.S. Government Bonds | | 176,371 | | 176,275 | | | 161,796 | | 162,262 |
| Taxable Bonds: | | | | | | | | | |
| Investment grade | | 490,183 | | 493,314 | | | 392,218 | | 385,044 |
| Non-investment grade | | 34,983 | | 31,655 | | | 42,216 | | 35,284 |
| Redeemable Preferred Stocks | | 27,023 | | 26,706 | | | 13,644 | | 12,752 |
| Other Preferred Stocks* | | 12,287 | | 11,888 | | | 10,532 | | 9,090 |
| Common Stocks* | | 29,411 | | 28,394 | | | 23,630 | | 27,301 |
|
*Equity securities at cost
| | | | | |
In 1993, we started a home-building operation in order to participate in the growth of the Las Vegas, Nevada housing market. During 2001, we closed and delivered 413 homes at an average selling price of $202,000, compared to 469 homes at an average selling price of $177,000 the prior year. Sales of $84.8 million and $5.8 million of pre-tax income were recorded during 2001, compared to sales of
10
INVESTMENT INCOME AFTER TAX PER SHARE
$84.5 million and $5.5 million of pre-tax income the previous year. Land presently owned at a cost of $30.0 million will support the construction of an estimated 1,300 homes over the next several years.
Changes in interest rates or other factors could affect future home sales (we have not seen any impact so far); we believe the land we have acquired is strategically located and has long-term value.
WORKERS' COMPENSATION
TheZenith is a specialty insurer with primary operations in California, Florida, Texas and 42 other states. Premiums written in 2001 were $423.8 million, an increase of 38% from the prior year. Underwriting losses pre-tax, were reduced to $58.3 million in 2001 compared to $87.9 million in the prior year. Included in underwriting losses were $5.8 million of pre-tax charges for Guaranty Fund assessments and a provision for the Reliance insolvency.
Growth of 38% is caused by the interaction of an increase in number of policies and a change in net rates, experience modifications and payrolls. At year-end 2001, there were 35,500 policies in force, up about 10% from the prior year.
TheZenith's book of business comprises primarily small employers and a few insureds in high-rise buildings. Therefore, we are in position to look for opportunities in this area, but we must charge for the terrorism exposure. With respect to bio-terrorism or travels by our insureds' employees to high profile areas, we are exposed on a more random basis.
We acknowledge TheZenith's underwriting losses are significant and unacceptable. However, they are declining as a result of higher prices, disciplined underwriting and additional revenues. Continued higher average claim costs (health care increases are significant) plus additional exposure to terrorism, necessitate rate increases. Our accident year loss ratios remain substantially below industry averages, as set forth in the table which is on the top of the next page.
11
LOSS RATIOS OUTPERFORM THE WORKERS' COMPENSATION INDUSTRY DUE TO CORE UNDERWRITING, PRICING, CLAIMS AND SERVICE DISCIPLINES.
|
|---|
| | California
| | Outside of California
|
|---|
Accident Year
Loss Ratios
|
|---|
| | Zenith
| | Industry
| | Zenith
| | Industry
|
|---|
|
|---|
| 1996 | | 64% | | 99% | | 51% | | 62% |
| 1997 | | 70% | | 107% | | 53% | | 70% |
| 1998 | | 70% | | 121% | | 56% | | 77% |
| 1999 | | 80% | | 126% | | 61% | | 81% |
| 2000 | | 72% | | 110% | | 64% | | 81% |
| 2001 | | 67% | | — | | 63% | | —
|
TheZenith's loss ratios outperform the industry due to a number of factors: adequate rates, reasonable reserving accuracy, disciplined underwriting and a commitment to quality services. At present, adverse industry results and estimates of large reserve shortfalls are causing many competitors to increase rates significantly. And apparently in some cases, to become more selective in their underwriting creating opportunities for our business.
This strategy causes our premium volume to fluctuate depending on our competitors' pricing strategies and appetites for unprofitable growth. At the same time, it allows us to maintain our discipline and record of producing low loss ratios and outperforming the industry on a consistent basis. Significantly, agents and brokers appreciate the value of our services and want to do business with us, even after long intervals, as long as our pricing is within the competitive "ballpark." Based on current market conditions, we expect California premium to grow faster than in other states.
Along with pricing changes and estimates of large industry reserve shortages, the most significant development last year was the terrorist attacks. Workers' Compensation losses are estimated between $1-$6 billion, the largest in history. (Fortunately, TheZenith did not experience a loss.) Losses will result in price increases adequate to restore the industry's financial health. Individual companies will
12
CLOSE MONITORING OF POLICYHOLDER EMPLOYEES AND LOCATIONS IS ESSENTIAL TO CONTROL OUR TERRORISM RISK.
adjust risk selection strategies and pricing due to the potential of further terrorist acts, lack of reinsurance for terrorism, and concentration of Employers in high profile locations.
2001 claim frequency trends remain favorable despite a weakening economy; on the contrary, severity trends continue to increase in amounts substantially greater than the rate of inflation. These trends are caused primarily by increases in health care costs, now in excess of 50% of our total loss costs. As a result, we must price our new and renewal business accordingly, and establish adequate reserves with the assumption that trends will increase about 15% per year. With this in mind, we are redoubling our efforts to protect ourselves and our insureds from excessive health care charges.
For example, here is a vignette of an unbelievable hospital bill we received this past year. An injured employee had routine back surgery and we were billed $560,000. TheZenith's nurses, claim managers and specialist Workers' Compensation attorneys immediately detected these charges were absurdly excessive. In turn, we prepared to litigate under unfair business practice statutes. Prior to filing the suit, the matter was settled for $20,000 plus an agreement that the hospital would alter its future billing practices to our Company. This story illustrates the required diligence to contain severity trends, and to point out an area of needed attention within the system. Workers' Compensation health care reform must be based on independent professional research because of the complexity of the subject, and the intense political involvement of the participants.
TheZenith is mindful that many of our policyholders are experiencing difficult times due to the economy and price increases. Workers' Compensation coverage, along with other insurance costs, are difficult to absorb. Unfortunately, there is no alternative to price increases due to cost and exposure trends, low levels of interest rates, and the lack of profitability during the past several years. However, employers who instill safe work practices, train their managers in proper Workers' Compensation administration, and cooperate with TheZenith's specialists to reduce loss ratios may well see savings in the ultimate cost of their insurance.
13
OUR TERRORISM RISK IS MINIMIZED BECAUSE WE DO NOT HAVE LARGE CONCENTRATIONS OF POLICYHOLDER EMPLOYEES IN HIGH-PROFILE LOCATIONS OR HIGH-RISE BUILDINGS.
With all due respect, we caution our agents and employers from choosing what may even be a worse choice: self-insurance, either directly or in part through large deductible plans. Why would a business assume Workers' Compensation exposures of uncertain amounts, including terrorism risk, when their basic operations are faced with difficulties of a recessionary environment and low interest rates? Isn't the certainty of fixed costs, with financing available, and access to quality specialist services a better choice? Considering the spread of risk principle of insurance and interest rate environment, the idea an employer or an underwriter can or should risk the Company's bottom line on the outcome of one risk to outperform the averages is simply not prudent.
Last year we wrote: "Incredibly, there are still a number of competitors significantly under-pricing accounts, with managing general agents, reinsurers and not-for-profit companies the major discounters. While their impact will be far less than in recent years, one would think the "message" would have been received by now. Unfortunately, it is easy to predict that the discounters will continue to erode their financial performance, and their ability to provide needed services to assist employers in controlling their costs." While these factors still exist to some degree, we are nevertheless able to find opportunities because of the effectiveness of our service capabilities.
Reinsurance pricing and availability were a possible concern after September 11th, since the Workers' Compensation industry and reinsurers absorbed the largest loss ever. We are pleased to report most of our loyal reinsurers continued to support our program, however at increased rates of about 28%. New reinsurers also expressed the desire to participate. Exclusion of coverage for terrorism excess of a $10 million loss was the major change. The definition of terrorism is quite broad, including, for example, ideological acts and, it is therefore possible future disputes may be anticipated.
14
TERRORISM COVERAGE WILL NOT BE OFFERED IN OUR REINSURANCE POLICIES; WE WILL MAKE A MODEST CHARGE FOR THIS EXPOSURE IN OUR WORKERS' COMPENSATION BUSINESS.
Reducing employer loss ratios, experience modifications, and ultimately the long-term cost of their insurance is our hallmark and our mission. We have specialized for many years in providing these services to employers with a history of high experience modifications. TheZenith's value-added services, implemented in partnership with our policyholders, have an excellent record of delivering against these objectives, and reducing the net cost of insurance to our customers.
- •
- Expert Safety and Health programs assist with accident and illness prevention, incident investigation and remediation, and safe-work practices education for management and employees.
- •
- Claims and Medical/Disability Management procedures facilitate prompt injury reporting, the use of recommended physicians (where permitted state-by-state), nurse case management of serious claims, analysis and negotiation of hospital and medical bills, and continuing communications and reviews to monitor and manage recoveries, costs and reserving.
- •
- Special Investigation Unit and specialized Workers' Compensation legal personnel protect employers from fraud and abuse, negotiate settlements where prudent, and represent policyholders throughout the litigation process as appropriate.
- •
- Return To Work programs place recovering employees in transitional duties with physician approval, improving employer morale and productivity, while containing costs. Recent legislation in California will provide tax credits to stimulate Return To Work involvement by employers.
- •
- Premium Auditors provide proper payroll classifications to assure accuracy and avoid unanticipated retroactive billing.
Quality services require a long-term commitment to the training and development of our Employees, and a stable, motivated work force. We are confident in the abilities of our people to provide above-average results which we witness on a daily basis.
15
AGENTS AND BROKERS APPRECIATE THE VALUE OF OUR SERVICES AND WANT TO DO BUSINESS WITH US, EVEN AFTER LONG INTERVALS, AS LONG AS OUR PRICING IS WITHIN THE COMPETITIVE "BALLPARK."
Regarding the California State Compensation Insurance Fund: its incredible growth, increased market share and decreasing financial strength have significant impacts on California market dynamics. Despite legislative hearings documenting these concerns, the only results are two provisions in the recently adopted legislation adding ex-officio Board members, and requiring a disclaimer of State liability in the Fund's advertising. State Fund officials dismiss these concerns as efforts to restrict their historic competitive role. Our issue is not competing with the State Fund, but rather whether their financial condition is assessed realistically in order to create and maintain a level playing field and not become a contingent financial burden to the State. A new Insurance Commissioner will be elected in California this year, and depending on who is elected, it's possible increased scrutiny and a focus on the facts may occur.
As a result of large insolvencies, it is expected the California Insurance Guarantee Association will be required to fund hundreds of millions of dollars of losses. Each of our policyholders (all policyholders in the State) will be assessed up to 2% of their premiums to cover these losses for several years. Further legislation is anticipated to deal with the needs of the Guaranty Association.
TheZenith further strengthened its financial position in connection with the sale of common stock, by entering into a 10% quota share for three years on new and renewal Workers' Compensation business. This will facilitate our historically conservative financial position while searching for future growth opportunities.
WORKERS' COMPENSATION REGULATION
Politically, significant changes affecting our operations were minimal this past year. Fortunately, the OSHA musculoskeletal regulations did not take effect, but ergonomics issues are a cause for concern and an area where we are increasing our capabilities.
In California, the Governor again vetoed Workers' Compensation legislation, but an improved version of the legislation has been enacted and signed in 2002 to become effective January 1, 2003. Major reform is the elimination of the treating physician presumption (except for pre-designated
16
WORKERS' COMPENSATION LEGISLATION IN CALIFORNIA CONTAINS MANY FAVORABLE REFORMS THAT WILL REDUCE FUTURE LOSS COSTS, DESPITE INCREASED BENEFITS.
personal physicians) which should help control escalating health care costs when it takes effect. Creation of a new management position to supervise the dispute resolution system should improve productivity and costs, and permit the Administrative Director to work more effectively on policy matters. Incentives have been provided to small and medium-sized employers to stimulate early Return To Work programs. And, a medical fee schedule for outpatient services and a pharmaceutical fee schedule will be established. The legislation also mandates an independent study of Workers' Compensation health care costs, since they continue to increase significantly. Benefits will be increased over the next four years by about 16% excluding the impact of reforms and without regard to any change in frequency. We view this as equitable since Workers' Compensation benefits have not changed in California since 1994.
On balance, this legislation is favorable to all concerned and we applaud the process which, for the first time, is based on many key provisions derived from independent research by the Commission on Health and Safety. Obviously, January 1, 2003 rate increases will be necessary to absorb the net costs of the legislation.
REINSURANCE
Since 1985, TheZenith has been selectively underwriting assumed treaty and facultative Reinsurance. Reinsurance represents 13% of our property-casualty volume, while reserves represent 19% of our total property-casualty reserves. We believe this business will continue to provide long-term profitable diversification to our basic Workers' Compensation operations.
WTC losses of September 11th were the largest insured loss ever, with our estimated net loss before taxes at $37.6 million, resulting in a net loss for the year of $31.9 million. Third quarter reserve estimates indicated an incurred loss of $31.0 million, subsequently revised upward to $37.6 million at year-end. Since the inception of our Reinsurance operation 16 years ago, the combined ratio has averaged 103%. Furthermore, we have benefited from investing the reserves. Although large losses
17
THE REINSURANCE BUSINESS CONTINUES TO PROVIDE LONG-TERM DIVERSIFICATION TO OUR BASIC WORKERS' COMPENSATION OPERATIONS.
from terrorism on U.S. soil were never contemplated, we were certainly aware of the possibility of substantial hurricane losses in Long Island and New York City. Terrorism coverage has been excluded in our future Reinsurance policies, and as indicated, prices and terms have been improved for 2002.
As previously stated, one of our objectives was not to risk more than 5% of our capital as a result of any large catastrophe. As projected, the net loss after tax and applicable property catastrophe premiums from 9/11 events was approximately 5% of our capital, a result consistent with our worst case planning.
Accounting for the property catastrophe Reinsurance business has a different result from our other property-casualty business. At the end of each reporting period, income is recognized without reserves being established if no major catastrophe has occurred. In our other businesses, reserves are mandated based upon actual events as well as expected loss patterns. As a result, there may be large fluctuations (positive or negative) in underwriting results for the property catastrophe Reinsurance business in the short-term since only actual events are considered and estimates are then established. Estimating an unprecedented loss such as 9/11, with significant disputes already pending, is not an exact science.
Unfortunately Congress did not legislate terrorism protection via Reinsurance, or its equivalent, prior to year-end. And, providing loans to the industry would be meaningless. Therefore, we urge Congress to provide a risk-sharing mechanism in conjunction with private market solutions.
401(K) PLAN
All Zenith employees are afforded the opportunity to participate in a tax-deferred savings plan organized under section 401(k) of the Internal Revenue Code. Zenith matches 50% of employee contributions that are 6% or less of their salary; at the close of 2001 approximately 86% of our employees were participating. Assets of the plan at year-end were $33.3 million and were placed among a variety of investment opportunities, with approximately 28% of Plan assets invested in our Company's stock.
18
WE ARE CONFIDENT IN THE ABILITIES OF OUR PEOPLE TO PROVIDE ABOVE-AVERAGE SERVICES WHICH WE WITNESS ON A DAILY BASIS.
Mindful of the possibility our employees might desire greater flexibility diversifying their invested retirement savings, we instituted changes to the plan early in 2002. First, the Company matching contributions are no longer automatically invested in Zenith stock. Rather, matching contributions are directed into the same investments our employees chose for their own contributions, and only into Company stock if the employee so chooses. (Note: we do not allow employees to direct more than 20% of their contributions to Company stock; a policy that will continue.) Second, we will allow employees over 40 years of age, with 10 years of service to redirect Company matching contributions made prior to these changes out of Company stock as desired.
These changes will help our employees make and implement sensible choices about their invested retirement savings in a changing and uncertain environment. The plan provides professional education, independent of our executives, to assist employees in their investment decisions. Hopefully, Congressional legislation will be adopted allowing employees to choose their own investments, including a reasonable investment in Zenith stock if they so choose.
INFORMATION TECHNOLOGY
Improving the functionality of our claims systems and delivering services via the Internet are our two primary objectives. Additionally, we are focused on consolidating our three separate systems into a single national network. Work in all these areas will continue in 2002, and beyond, as we insist on improving productivity.
ACCOUNTING DISCLOSURE
Our financial statements include full disclosure of the accounting policies, estimates and judgements used in their preparation. As we have discussed in previous reports, estimation of loss reserves is a significant component of the preparation of our financial statements. The table on page 8,
19
REDUCING EMPLOYER LOSS RATIOS, EXPERIENCE MODIFICATIONS, AND ULTIMATELY THE LONG-TERM COST OF THEIR INSURANCE IS OUR HALLMARK AND OUR MISSION.
which we have included for many years, clearly shows the history of our loss reserve estimates over the years. Our Workers' Compensation actuaries consider several methods of projecting reserves, the most important of which is trending paid losses. We discuss loss reserve estimates and other important accounting matters on pages 6 and 7 and in the Management's Discussion and Analysis and Notes to the Consolidated Financial Statements sections of this report.
CONCLUSION
We are in the business of managing insurance and investment risk on a profitable basis over the long term. As the recent past has demonstrated, losses take place in the short term based upon a variety of different factors. At present, more favorable trends exist in the Workers' Compensation and Reinsurance businesses.
Our actions over the past years have positioned us for continuing growth, declining combined ratios, enhanced financial strength and the restoration of profitability. I am excited about the opportunities ahead, and our entire management team is focused on improving shareholder value. Returns on equity in recent years have not been adequate or consistent with our long-term objectives; therefore, we are committed to restoring our historically-favorable performance. As always, our people are the key to delivering against these objectives. I believe we are blessed with superb, professional talent, and a disciplined profit and service culture made even stronger by recent events. Teamwork and continuing real-time changes to improve customer services are the key ingredients to our future.
Since the events of September 11th, we strengthened our financial position, and will retire our outstanding debt in May 2002 from existing funds. Future earnings will benefit since the funds to repay debt are invested at rates substantially less than the interest cost. Investment income should also benefit from improved cash flows and reinvestments at higher interest rates.
20
WE THANK OUR AGENTS, BROKERS, REINSURERS, SHAREHOLDERS, DIRECTORS AND EXCELLENT EMPLOYEES WHO HAVE ASSISTED THIS MANAGEMENT TEAM FOR THE PAST 25 YEARS WITH OUTSTANDING SERVICE.
Terrorism exposure has been eliminated from our Reinsurance business, but will continue to be a factor in our Workers' Compensation operations. As a result, we must make a reasonable charge for the exposure (where permitted), and closely monitor concentration of risk and locations most vulnerable to potential terrorist events.
We appreciate the confidence of our agents, brokers, reinsurers and shareholders and the wisdom and judgment of our distinguished Directors. These individuals and firms, along with our excellent employees, have assisted this management team for the past 25 years under my leadership, and I want to acknowledge their contributions to our progress and in positioning us for the future.

Stanley R. Zax
Chairman of the Board and President
Woodland Hills, California, March 2002
21
MANAGEMENT'S DISCUSSION AND ANALYSIS OF CONSOLIDATED FINANCIAL CONDITION AND RESULTS OF OPERATIONS
Forward-Looking Information
The Private Securities Litigation Reform Act of 1995 provides a safe harbor for forward-looking statements if accompanied by meaningful cautionary statements identifying important factors that could cause actual results to differ materially from those discussed. Forward-looking statements include those related to the plans and objectives of management for future operations, future economic performance, or projections of revenues, income, earnings per share, capital expenditures, dividends, capital structure, or other financial items. Statements containing words such asexpect, anticipate, believe, or similar words that are used in Management's Discussion and Analysis of Financial Condition and Results of Operations, in other parts of this report or in other written or oral information conveyed by or on behalf of Zenith National Insurance Corp. ("Zenith National") and subsidiaries (collectively, "Zenith") are intended to identify forward-looking statements. Zenith undertakes no obligation to update such forward-looking statements, which are subject to a number of risks and uncertainties that could cause actual results to differ materially from those projected. These risks and uncertainties include but are not limited to the following: (1) heightened competition, particularly intense price competition; (2) adverse state and federal legislation and regulation; (3) changes in interest rates causing fluctuations of investment income and fair values of investments; (4) changes in the frequency and severity of claims and catastrophes; (5) adequacy of loss reserves; (6) changing environment for controlling medical, legal and rehabilitation costs, as well as fraud and abuse; (7) the terrorist attacks of September 11, 2001, any future terrorist attacks and their aftermath; and (8) other risks detailed herein and from time to time in Zenith's other reports and filings with the Securities and Exchange Commission.
Overview
Zenith's long-term source of consolidated earnings is principally the income and investment income from the operation of its property-casualty insurance businesses ("P&C Operations") and its investment portfolio. The P&C Operations are composed of Workers' Compensation, Reinsurance and Other Property-Casualty (through March 31, 1999). Workers' Compensation represents insurance coverage for the statutorily prescribed benefits that employers are required to pay to their employees injured in the course of employment. During 2001, Zenith wrote workers' compensation insurance in 45 states but the largest concentrations, 49.5% and 22.3% of the Workers' Compensation premiums earned during 2001, were in California and Florida, respectively. Reinsurance principally consists of world-wide, assumed reinsurance of property losses from catastrophes and large property risks. Results of the Reinsurance operations can be adversely impacted in periods that sustain large catastrophe losses. Other Property-Casualty, which was operated by CalFarm Insurance Company ("CalFarm"), formerly a wholly-owned subsidiary of Zenith Insurance Company ("Zenith Insurance"), a wholly-owned subsidiary of Zenith National, represented multiple product line direct insurance other than workers' compensation principally in California. Effective March 31, 1999, Zenith sold CalFarm. Results of the P&C Operations for the three years ended December 31, 2001 are set forth in the table that follows.
The Real Estate operations develop land and primarily construct single-family residences in Las Vegas, Nevada. Investment operations provide income and realized gains on investments, primarily from investments in debt securities. The Parent operations represent Zenith National, a holding company which owns, directly or indirectly, all of the capital
22
stock of the P&C Operations, non-insurance companies and other investment securities.
The net loss in 2001 is mainly attributable to losses in the assumed Reinsurance operations associated with the World Trade Center events of September 11, 2001. See discussion below under "Reinsurance." The Workers' Compensation operations are not expected to incur any losses as a result of the events of September 11, 2001.
The comparability of the results of operations in 1999 compared to 2000 and 2001 is affected by two significant items. First, in the third quarter of 1999, Zenith recorded net charges of $50.0 million before tax ($32.5 million after tax, or $1.89 per share) associated with an increase in the estimated net liabilities for unpaid losses and loss adjustment expenses acquired from RISCORP (the "RISCORP Purchase Adjustment"—for a full description of the RISCORP Acquisition and the RISCORP Purchase Adjustment, see Note 14 to the Consolidated Financial Statements). Second, effective March 31, 1999, Zenith sold CalFarm which had previously operated Zenith's Other Property-Casualty operations. The sale of CalFarm resulted in a gain of $104.3 million after tax (see Note 13 to the Consolidated Financial Statements).
The comparative components of net (loss) income after tax for the three years ended December 31, 2001 are set forth in the following table:
| |
|---|
(Dollars in thousands)
| 2001
| | 2000
| | 1999
| |
|---|
| |
|---|
| Net investment income | $ | 33,841 | | $ | 34,243 | | $ | 35,632 | |
| Realized gains (losses) on investments | | 5,960 | | | (10,054 | ) | | 4,993 | |
| |
| Subtotal | | 39,801 | | | 24,189 | | | 40,625 | |
| Property-casualty underwriting results: | | | | | | | | | |
| | Loss excluding catastrophes and RISCORP Purchase Adjustment | | (32,831 | ) | | (53,251 | ) | | (40,404 | ) |
| | Catastrophe losses | | (27,105 | ) | | (14,690 | ) | | (12,285 | ) |
| | RISCORP Purchase Adjustment | | | | | | | | (32,500 | ) |
| |
| Property-casualty underwriting loss | | (59,936 | ) | | (67,941 | ) | | (85,189 | ) |
| Income from Real Estate operations | | 3,746 | | | 3,552 | | | 2,372 | |
| Interest expense | | (4,924 | ) | | (3,666 | ) | | (5,342 | ) |
| Parent expenses | | (2,487 | ) | | (3,927 | ) | | (2,701 | ) |
| |
| Loss before gain on sale of CalFarm and extraordinary item | | (23,800 | ) | | (47,793 | ) | | (50,235 | ) |
| Gain on sale of CalFarm | | | | | | | | 104,335 | |
| Extraordinary item-gain on extinguishment of debt | | | | | 993 | | | | |
| |
| Net (loss) income | $ | (23,800 | ) | $ | (46,800 | ) | $ | 54,100 | |
| |
23
The comparative results of the P&C Operations before tax and combined ratios for the three years ended December 31, 2001 are set forth in the table below. 1999 is presented both including and excluding the RISCORP Purchase Adjustment.
| |
|---|
(Dollars in thousands)
| | 2001
| | 2000
| | 1999(1)
| | 1999(2)
| |
|---|
| |
|---|
| Premiums earned: | | | | | | | | | | | | | |
| | Workers' Compensation: | | | | | | | | | | | | | |
| | | California | | $ | 205,835 | | $ | 137,497 | | $ | 107,929 | | $ | 107,929 | |
| | | Outside California | | | 210,013 | | | 163,336 | | | 164,325 | | | 170,925 | |
| |
| | Total Workers' Compensation | | | 415,848 | | | 300,833 | | | 272,254 | | | 278,854 | |
| | Reinsurance | | | 61,028 | | | 37,919 | | | 36,441 | | | 36,441 | |
| | Other Property-Casualty(3) | | | | | | | | | 54,108 | | | 54,108 | |
| |
| Total | | $ | 476,876 | | $ | 338,752 | | $ | 362,803 | | $ | 369,403 | |
| |
| Underwriting loss before tax: | | | | | | | | | | | | | |
| | Workers' Compensation | | $ | (58,329 | ) | $ | (87,854 | ) | $ | (72,543 | ) | $ | (122,543 | ) |
| | Reinsurance | | | (31,918 | ) | | (14,536 | ) | | (7,324 | ) | | (7,324 | ) |
| | Other Property-Casualty(3) | | | | | | | | | (22 | ) | | (22 | ) |
| |
| Total | | $ | (90,247 | ) | $ | (102,390 | ) | $ | (79,889 | ) | $ | (129,889 | ) |
| |
| Combined loss and expense ratios: | | | | | | | | | | | | | |
| | Workers' Compensation: | | | | | | | | | | | | | |
| | | Loss and loss adjustment expenses | | | 83.8% | | | 96.4% | | | 89.2% | | | 102.5% | |
| | | Underwriting expenses | | | 30.2 | | | 32.8 | | | 37.4 | | | 41.4 | |
| |
| Combined ratio | | | 114.0% | | | 129.2% | | | 126.6% | | | 143.9% | |
| |
| | Reinsurance: | | | | | | | | | | | | | |
| | | Loss and loss adjustment expenses | | | 136.9% | | | 124.0% | | | 105.0% | | | 105.0% | |
| | | Underwriting expenses | | | 15.4 | | | 14.3 | | | 15.1 | | | 15.1 | |
| |
| Combined ratio | | | 152.3% | | | 138.3% | | | 120.1% | | | 120.1% | |
| |
| | Other Property-Casualty(3): | | | | | | | | | | | | | |
| | | Loss and loss adjustment expenses | | | | | | | | | 66.5% | | | 66.5% | |
| | | Underwriting expenses | | | | | | | | | 33.5 | | | 33.5 | |
| |
| Combined ratio | | | | | | | | | 100.0% | | | 100.0% | |
| |
| Total: | | | | | | | | | | | | | |
| | | Loss and loss adjustment expenses | | | 90.6% | | | 99.4% | | | 87.4% | | | 97.5% | |
| | | Underwriting expenses | | | 28.3 | | | 30.8 | | | 34.6 | | | 37.7 | |
| |
| Combined ratio | | | 118.9% | | | 130.2% | | | 122.0% | | | 135.2% | |
| |
(1) Excluding RISCORP Purchase Adjustment
(2) Including RISCORP Purchase Adjustment
(3) CalFarm was sold effective March 31, 1999
24
Zenith's key operating goal for the P&C Operations is to achieve a combined ratio of 100% or lower. The combined ratio, expressed as a percentage, is the key measure of underwriting profitability traditionally used in the property-casualty insurance business. It is the sum of net incurred loss and loss adjustment expenses, underwriting expenses and policyholders' dividends, expressed as a percentage of net premiums earned.
The profitability of the P&C Operations is principally dependent upon the adequacy of rates charged to the insured for insurance protection; the frequency and severity of claims and catastrophes; the ability to accurately estimate and accrue reported and unreported losses in the correct period; and the ability to manage claim costs and keep operating expenses in line with premium volume. Some of the factors that continue to impact the business and economic environment in which Zenith operates include: intense price competition; poor operating results and reports of substantial under estimation of reported loss reserves in the national workers' compensation insurance industry; an uncertain political and regulatory environment, both state and federal; the outlook for economic growth in geographic areas where Zenith operates; the frequency and severity of claims and catastrophes; the changing environment for controlling medical, legal and rehabilitation costs, as well as fraud and abuse; and the terrorist attacks of September 11, 2001, any future attacks and the inability to purchase workers' compensation reinsurance coverage for terrorist acts in adequate amounts or at reasonable rates. Effective January 1, 2002, consistent with industry practice, losses arising from acts of terrorism in the United States were excluded from the coverage by many of the reinsurance companies from which Zenith purchases workers' compensation reinsurance. Zenith has purchased reinsurance protection specifically to cover losses, individually or in the aggregate, in 2002 from acts of terrorism up to $9.0 million in excess of $1.0 million. Effective January 1, 2002, in Zenith's assumed Reinsurance operations losses from acts of terrorism are excluded from the coverage provided by Zenith's assumed reinsurance contracts. Fluctuations in interest rates cause fluctuations in Zenith's investment income and the fair values of its investments. Although management is currently unable to predict the effect of any of the foregoing, these factors, related trends and uncertainties could have a material effect on Zenith's future operations, financial condition and cash flows.
The preparation of financial statements in accordance with Generally Accepted Accounting Principles (GAAP) requires both the use of estimates and judgments relative to the application of appropriate accounting policies. Zenith's accounting policies are described in the Notes to the Consolidated Financial Statements, but three particular matters associated with the application of GAAP and the use of estimates are important to an understanding of Zenith's financial statements. First, accounting for property and casualty insurance operations requires Zenith to estimate its liability for unpaid losses and loss adjustment expenses ("loss reserves") as of the balance sheet date. The amount by which estimated losses, measured subsequently by reference to payments and additional estimates, differ from those originally reported for a period is known as "development." Development is unfavorable when losses ultimately settle for more than the levels at which they were reserved or subsequent estimates indicate a basis for reserve increases on open claims. Development is favorable when losses ultimately settle for less than the amount reserved or subsequent estimates indicate a basis for reducing loss reserves on open claims. Favorable or unfavorable development of loss reserves is reflected currently in earnings. The impact of
25
loss reserve development on results of the P&C operations in each of the three years ended December 31, 2001 is discussed below. A 10-year history of the development of Zenith's loss reserves is set forth in the table on Pages 40 and 41. Zenith's current loss reserve estimates may be subject to development in future years and reserve development may take a very long time to appear because of the uncertainty inherent in currently estimating long term liabilities. Second, in addition to loss reserve estimates, accounting for property and casualty insurance operations requires Zenith to defer and amortize certain direct policy acquisition costs as the underlying policy premiums are earned. At December 31, 2001, deferred policy acquisition costs were $12.7 million related to unearned premiums of $71.3 million. If the expected claims costs and other policy related costs related to the unearned premiums exceeded those unearned premiums a premium deficiency would exist and policy acquisition costs that otherwise were deferred would be expensed. At December 31, 2001 Zenith's estimates indicated that there was no premium deficiency. Third, Zenith makes provision for deferred income taxes based on temporary differences between the tax basis and book basis of assets and liabilities. At December 31, 2001, Zenith recorded a net deferred tax asset of $34.5 million, including an asset of $33.3 million attributable to the fact that Internal Revenue Service regulations require property and casualty insurance companies to discount loss reserves for tax purposes. Zenith does not discount its loss reserves in its financial statements. Zenith's net deferred tax asset is expected to be fully recoverable because all future deductible amounts can be offset by anticipated future taxable income, including investment income or available refunds from prior years.
The following table shows the one-year loss reserve development for loss and loss adjustment expense for the P&C Operations. The one-year loss reserve development is the change recorded in the current year for the estimate of the loss reserves established at the end of the preceding year and reflects a cumulative adjustment to all estimates made in prior years.
|
|---|
(Dollars in thousands)
| | Workers'
Compensation
| | Reinsurance
| | Other
Property-
Casualty(1)
| | Total
|
|---|
|
|---|
| One-year loss development in: | | | | | | | | | | | | |
| | 2001 | | $ | 272 | | $ | 4,075 | | | | | $ | 4,347 |
| | 2000 | | | 8,251 | | | 22,629 | | | | | | 30,880 |
| | 1999(2) | | | 38,767 | | | 7,336 | | $ | (1,279 | ) | | 44,824 |
|
Favorable development is shown in brackets.
(1) CalFarm was sold effective March 31, 1999
(2) Adverse development in 1999 in the Workers' Compensation operation is attributable to the RISCORP Purchase Adjustment.
Zenith continually monitors loss development trends and data to establish adequate premium rates and loss reserves. Two continuing trends in the P&C Operations are significant to Zenith's loss reserve estimates. First, the trend of increasing claims severity in the Workers' Compensation operation has caused some development in prior year reserves. In 2000, Zenith increased its estimate of unpaid Workers' Compensation losses for principally the 1999 accident year by about $8.0 million. In 2001, Zenith's estimates of its prior year Workers' Compensation loss reserves were estimated to be adequate based on the current interpretation of the data, however, estimating the impact of any continuing severity trends is a major risk factor for estimating Zenith's Workers' Compensation loss reserves and for establishing appropriate rates.
Second, estimating catastrophe losses in the Reinsurance business is highly dependent upon the nature and timing of the event and Zenith's ability to obtain timely and accurate information with which to estimate its liability to pay losses. Loss reserve estimates for catastrophe losses in recent years have developed unfavorably as
26
discussed below. In 2001, Zenith incurred a very significant loss in connection with the attack on the World Trade Center on September 11. There is considerable uncertainty as to the nature and amount of monetary losses associated with the attack on the World Trade Center. Zenith has estimated its share of the loss to be approximately $48.0 million by estimating the probable impact to each of its reinsurance contracts based on currently available information. Approximately 70% of the loss is attributable to the contractual maximum loss payable by Zenith under its excess of loss reinsurance contracts; the remainder of the estimated loss is an estimate of its expected loss incurred on assumed quota share reinsurance contracts. Estimates of the impact of the World Trade Center loss and other catastrophes is based on the information that is currently available and such estimates could change based on any new information that becomes available or based upon reinterpretation of existing information.
Additional estimates of the impact of the events in 1999, principally storms in Europe in December of that year, caused unfavorable development in the Reinsurance operation in 2000 and 2001, offset in 2001 by favorable development of loss reserves for older years prior to 1995. Adverse development in the Reinsurance operations in 1999 was principally attributable to increased estimates in 1999 of the loss associated with Hurricane Georges, the principal catastrophe in 1998. The Workers' Compensation reserve strengthening in 1999 is attributable to the RISCORP Purchase Adjustment. In 1999, Zenith re-estimated the reserves acquired from RISCORP in 1998 (see Note 14 to the Consolidated Financial Statements) and the increase in the acquired reserves was recorded as adverse development in 1999 but should be distinguished from adverse development that represents re-estimates of liabilities that originated with Zenith.
Zenith has exposure to asbestos losses in its Workers' Compensation operations for medical, indemnity and loss adjustment expenses associated with covered workers' long-term exposure to asbestos or asbestos-containing materials. Most of these claims date back to the 1970's and early 1980's and Zenith's exposure is generally limited to a pro rata share of the workers' compensation-related loss for the period of time coverage was provided. Zenith also has potential exposure to environmental and asbestos losses and loss adjustment expenses beginning in 1985 through its Reinsurance operations but the business reinsured by Zenith in its Reinsurance operations contains exclusion clauses for environmental and asbestos losses. CalFarm (through March 31, 1999) wrote liability coverage under farmowners' and small commercial policies, however any such liabilities associated with CalFarm were retained by CalFarm when it was sold and Zenith retains no exposure to any such liabilities. Environmental and asbestos losses have not been material to Zenith's results of operations or financial condition and Zenith believes that its reserves for environmental and asbestos losses are appropriately established. However, due to the long term nature of these claims, the ultimate exposure may vary from the amounts currently reserved.
Inflation rates may impact the financial statements and operating results in several areas. Fluctuations in inflation rates impact the market value of the investment portfolio and yields on new investments. Inflation also impacts the portion of the loss reserves that relates to hospital and medical expenses and property claims and loss adjustment expenses, but not the portion of loss reserves that relates to workers' compensation indemnity payments for lost wages which are fixed by statute.
27
Adjustments for inflationary impacts are implicitly included as part of the P&C Operations' continual review of property-casualty reserve estimates. Actuarial account of increased costs is considered in setting adequate rates, and this is particularly important in the health care area where hospital and medical inflation rates have exceeded general inflation rates. Operating expenses, including payrolls, are impacted to a certain degree by the inflation rate.
Workers' Compensation
The following is a discussion of results of the Workers' Compensation operations as set forth in the preceding table excluding the impact of the RISCORP Purchase Adjustment in 1999.
For the past several years, national workers' compensation industry results have been extremely unprofitable as intense competition resulted in inadequate levels of premium rates at the same time as the industry experienced a general trend of declining frequency and of increasing claim severity. In addition, there are reports by certain industry organizations of significant under-reserving in the industry's reported results. Zenith's in-force Workers' Compensation premiums decreased consistently in the several years prior to 2000 as a result of Zenith's endeavors to maintain rate adequacy in the face of intense competition in the national workers' compensation insurance industry. Competitive pricing conditions began to improve in California and certain other states in 2000 and continued in 2001. As a result of this improvement and in conjunction with the rate increases described below, Zenith increased its in-force premiums in California from $98.1 million at December 31, 1999 to $146.7 million at December 31, 2000 and to $210.4 million at December 31, 2001. Outside of California, where competition and pricing are improving only in certain states, Zenith's in-force premiums increased from $145.8 million at December 31, 1999 to $162.4 million at December 31, 2000 and to $209.7 million at December 31, 2001. As a result, premiums earned in the Workers' Compensation operations increased in 2000 compared to 1999 and in 2001 compared to 2000.
Zenith continually monitors loss development trends and data to establish adequate premium rates and loss reserves. In 2000 and 2001, Zenith increased its Workers' Compensation premium rates in California as follows: effective January 1, 2000 by about 8%; effective September 1, 2000 by about 9%; effective January 1, 2001 by about 8%; and effective August 1, 2001 by about 5%. At the beginning of 2002, Zenith further increased its rates in California by about 26% including a 5% charge for terrorism. Rate increases in most of the other states in which it does business were implemented at January 1, 2001 and 2002. However, in Florida, rates are set by the Florida Department of Insurance, and were unchanged in 2000 and 2001.
Underwriting losses in the Workers' Compensation operations decreased in 2001 compared to 2000 principally due to a decrease in the loss ratio and because of the favorable impact of increased premium revenues on the claims operating expense and underwriting expense ratios. Underwriting losses in the Workers' Compensation operations increased in 2000 compared to 1999 principally because of a higher loss ratio in 2000. In 2000, Zenith increased its estimate of California losses for prior years, principally for 1999 as a result of higher than expected claims severity, and about $8.0 million of reserve strengthening is included in the loss ratio and underwriting loss in 2000.
Zenith expects that the future operating profitability of its Workers' Compensation operations will be dependent upon the following: 1) general levels of competition; 2) industry pricing; 3) legislative and regulatory actions; 4) the frequency and severity of terrorist acts, if any, similar to the World Trade Center
28
attack or anthrax events; and 5) management's ability to estimate the impact of any continuing adverse claim severity trends, including increases in the cost of healthcare, on the adequacy of loss reserves and premium rates. Also, claim frequency trends continue to decline, but the reasons therefor are not clear and management is unable to predict whether these trends will continue. Zenith is unable to predict when its Workers' Compensation operations will return to underwriting profitability, although it anticipates continued improvement in the short-run with increases in volume and prices.
In January 2002, the Governor of California signed legislation relating to workers' compensation in California which will become effective January 1, 2003. The legislation provides for increases over the next several years in the benefits payable to injured workers. Other changes include measures to help control costs and encourage return to work of injured workers. Zenith cannot quantify the impact of the legislation at this time, but believes that certain provisions will reduce the costs that would otherwise be associated with future benefits. The major risk factor is whether or not the legislation, or the economy or a combination of both, will change the long term favorable trend of reduced claim frequency and whether or not Zenith can estimate and implement on a timely basis appropriate, relevant rate increases.
In Florida, the Special Disability Trust Fund (the "Fund") assesses workers' compensation insurers to pay for what are commonly referred to as "Second Injuries." Historic assessments have been inadequate to completely fund obligations of the Fund. In late 1997, the Florida statute was amended so that the Fund will not be liable for, and will not reimburse employers or carriers for, Second Injuries occurring on or after January 1, 1998. Zenith Insurance has recorded its receivable from the Fund for Second Injuries based on specific claims and historical experience prior to January 1, 1998. At December 31, 2001 and 2000, the receivable from the Fund was $18.1 million and $31.1 million, respectively, related to the pre-January 1, 1998 claims.
On October 3, 2001, the Commonwealth Court of Pennsylvania issued an Order of Liquidation for Reliance Insurance Company ("Reliance") in response to a petition from the Pennsylvania Department of Insurance. At December 31, 2001, Reliance owed Zenith Insurance $6.0 million of reinsurance recoverable on paid and unpaid losses in connection with reinsurance arrangements assumed by Zenith Insurance in the 1996 acquisition of the Associated General Commerce Self-Insurers' Trust Fund. As of December 31, 2001, Zenith Insurance recorded a $3.0 million provision for impairment of the reinsurance recoverable from Reliance. Zenith Insurance cannot currently predict the ultimate outcome of this matter; but it is possible that if the Pennsylvania Department of Insurance increases its estimates of Reliance's unpaid liabilities or uncollectible reinsurance recoverables without considering additional investment income, Zenith Insurance may not recover any of its reinsurance recoverable from Reliance.
State Guarantee Funds ("Guarantee Funds") exist to ensure that policyholders (holders of direct insurance polices but not of reinsurance policies) receive payment of their claims if insurance companies become insolvent. The Guarantee Funds are funded primarily by statutorily prescribed assessments they bill to other insurance companies doing business in their states. Various mechanisms exist in these states for assessed insurance companies to recover these assessments. Upon the Order of Liquidation of Reliance, the Guarantee Funds became primarily liable for the payment of Reliance's policyholder liabilities. The declaration of an insolvency establishes the presumption that assessments by the Guarantee Funds are probable. Zenith writes workers'
29
compensation insurance in many of the states where Reliance has unpaid workers' compensation liabilities and expects to receive Guarantee Fund assessments, some of which may be based on certain of the premiums it has already earned at December 31, 2001. Accordingly, in the year ended December 31, 2001, Zenith recorded an estimate of $2.8 million (net of expected recoveries of $2.3 million recoverable before the end of 2002) for its expected liability at December 31, 2001 for Guarantee Fund assessments. This estimate is based on currently available information and could change based on additional information or reinterpretation of existing information concerning the Order of Liquidation for Reliance and the actions of the Guarantee Funds. Zenith also expects that it will receive continuing Guarantee Fund assessments in connection with the Reliance insolvency in many of the states in which it writes workers' compensation insurance. The ultimate impact of such assessments will depend upon the amount and timing of the assessments and of any recoveries to which Zenith is entitled.
Reinsurance
Results of the Reinsurance operations may be adversely impacted in years when large catastrophes occur. However, since its inception in 1985, the combined ratio of the Reinsurance operations through December 31, 2001 was 103.0%.
Underwriting losses in 2001 in the Reinsurance operations were attributable to losses incurred in connection with the terrorist attack on the World Trade Center on September 11, 2001. There is considerable uncertainty as to the nature and amount of monetary losses associated with the World Trade Center loss. Zenith has currently estimated its share of the World Trade Center loss to be $48.0 million before tax, both gross and net of reinsurance recoverable, by estimating the probable impact to each of its assumed reinsurance contracts based on currently available information. Approximately 70% of the loss is attributable to the contractual maximum loss payable by Zenith under its excess of loss reinsurance contracts; the remainder of the estimated loss is an estimate of its expected loss incurred on assumed quota share reinsurance contracts. Customarily, after a claim, catastrophe reinsurance contracts are renewed for the unexpired term of the original contract and an additional premium, called a reinstatement premium, is due in consideration of the renewal. Zenith has also estimated such reinstatement premiums in connection with its estimate of the World Trade Center loss. The ultimate impact of the World Trade Center loss after deducting original and reinstatement premium income on Zenith's assumed reinsurance contracts for 2001 is estimated to be $20.0 million before tax, or $13.0 million after tax. Zenith has written its assumed reinsurance business so that its exposure to reinsurance losses from any one event in a worst-case scenario is not expected to be more than approximately 5% of Zenith's consolidated stockholders' equity; the expected ultimate loss of $13.0 million after tax is within that 5% maximum.
In 2001, the Reinsurance operations were adversely impacted by $41.7 million of catastrophe losses before tax, including $37.6 million for the World Trade Center loss, after deducting additional premium income earned in the year attributable to original and reinstatement premiums. Catastrophe losses were $22.6 million and $18.9 million before tax in 2000 and 1999, respectively. Catastrophe losses in 2000 were attributable to additional estimates of the impact of the events in 1999. There were frequent catastrophes of a moderate size culminating in severe storms in Europe at the end of 1999. Estimates of the impact of catastrophes on the Reinsurance operations are based on the information that is currently available and such estimates could change based
30
on any new information that becomes available or based upon reinterpretation of existing information.
Effective January 1, 2002, consistent with industry practice in the aftermath of the events of September 11, 2001, losses arising from acts of terrorism were excluded from the coverage provided in Zenith's assumed reinsurance contracts.
Other Property-Casualty
The Other Property-Casualty operations, through CalFarm, offered automobile, farmowners, commercial coverages, group health and homeowners coverage, primarily in California. CalFarm was sold, effective March 31, 1999, to Nationwide Mutual Insurance Company resulting in a gain of $104.3 million after tax.
Underwriting results for 1999 were adversely impacted by intense competition and increased expenses, primarily due to computer upgrade costs and by losses in the group health line of business because of higher health care costs and increased utilization.
Real Estate Operations
For the years ended December 31, 2001, 2000 and 1999, total revenues recognized in the Real Estate operations were $84.8 million, $84.5 million and $58.7 million, respectively, and pre-tax income was $5.8 million, $5.5 million and $3.6 million, respectively. In 2001, 2000 and 1999, the number of home sales were 413, 469 and 366, respectively; and the average selling price per home was $202,000, $177,000 and $158,000, respectively. Land presently owned at a cost of $30.0 million will support the construction of an estimated 1,300 homes over the next several years. Changes in interest rates and other factors could affect future home sales, but Zenith believes the land it has acquired is strategically located and will have long term value.
Investments
At December 31, 2001 and 2000, Zenith's consolidated investment portfolio emphasized high quality, taxable bonds and short-term investments, supplemented by smaller portfolios of redeemable and other preferred and common stocks. Bonds constituted 74% and 68% and short-term investments constituted 13% and 19% of the carrying value of Zenith's consolidated investment portfolio at December 31, 2001 and 2000, respectively. Bonds with an investment grade rating represented 95% and 94% of the consolidated carrying values of bonds at December 31, 2001 and 2000, respectively. The average life of the consolidated portfolio was 5.6 years and 5.1 years at December 31, 2001 and 2000, respectively.
The change in the carrying value of Zenith's consolidated investment portfolio in 2001 was as follows:
| |
|---|
(Dollars in thousands)
| |
| |
| |
|---|
| |
|---|
| Carrying value at beginning of year | | | | $ | 852,734 | |
| | Purchases at cost | | | | | 1,383,346 | |
| | Maturities and redemptions | | | | | (69,210 | ) |
| | Proceeds from sales of investments | | | | | (1,197,022 | ) |
| | Net realized gains | | | | | 9,169 | |
| | Change in unrealized gains and losses, net | | | | | 9,908 | |
| | Net decrease in short-term investments | | | | | (41,966 | ) |
| | Net accretion of bonds and preferred stocks and other changes | | | | | (2,262 | ) |
| |
| Carrying value at end of year | | | | $ | 944,697 | |
| |
31
Zenith's investment portfolio increased in the year ended December 31, 2001 principally as a result of favorable cash flow from operations. Purchases and sales of securities in 2001 were higher than in the preceding two years because of increased trading activity in U.S. government bonds in 2001.
Zenith has identified certain securities, amounting to 97% and 96% of the investments in debt securities at December 31, 2001 and 2000, respectively, as "available-for-sale." Stockholders' equity increased by $8.8 million after deferred tax from December 31, 2000 to December 31, 2001 and increased by $9.6 million after deferred tax from December 31, 1999 to December 31, 2000 as a result of changes in the fair values of such investments. Stockholders' equity will fluctuate with changes in the fair values of "available-for-sale" securities. The total fair value of fixed maturity investments, including short-term investments, was $847.0 million and $753.8 million at December 31, 2001 and 2000, respectively. The unrealized gain (loss) on held-to-maturity and available-for-sale fixed maturity investments were as follows:
| |
|---|
| Held-to-Maturity
| | Available-for-Sale
| |
|---|
(Dollars in thousands)
| Before Tax
| | Before Tax
| | After Tax
| |
|---|
| |
|---|
| December 31, 2001 | $ | 691 | | $ | (1,301 | ) | $ | (846 | ) |
| December 31, 2000 | | 368 | | | (14,877 | ) | | (9,670 | ) |
| |
The yields on invested assets, which vary with the general level of interest rates, the average life of invested assets and the amount of funds available for investment, for the three years ended December 31, 2001 were as follows:
| |
|---|
| 2001
| | 2000
| | 1999
| |
|---|
| |
|---|
| Investment yield: | | | | | | |
| | Before tax | 5.6 | % | 5.9 | % | 5.5 | % |
| | After tax | 3.7 | | 3.9 | | 3.7 | |
| |
When, in the opinion of management, a decline in the fair value of an investment is considered to be "other than temporary," such investment is written down to its fair value. The determination of "other than temporary" includes, in addition to other relevant factors, a presumption that if the market value is below cost by a significant amount for a period of time, a write down is necessary. During the years ended December 31, 2001, 2000 and 1999, there were $12.7 million, $22.5 million, and $1.7 million, respectively, of such write downs, including $4.4 million and $7.3 million during the fourth quarters of 2001 and 2000, respectively.
In December 2000, Zenith sold approximately 183 acres of land located in Las Vegas, Nevada. The gain on the sale was $6.0 million, of which $3.6 million and $0.9 million were recognized in 2001 and 2000, respectively, and $1.5 million was deferred at December 31, 2001.
Parent
Parent expenses in 2000 include $1.8 million before tax of severance costs associated with the termination provisions of an employment contract of a company officer.
Liquidity and Capital Resources
The P&C Operations generally create liquidity because insurance premiums are collected prior to disbursements for claims and other policy benefits. Collected premiums may be invested, principally in fixed maturity securities, prior to their use in such disbursements, and investment income provides additional cash receipts. Claim payments may take place many years after the collection of premiums. In periods in which disbursements for claims and benefits, current acquisition costs and current operating and other expenses exceed operating cash receipts, cash flow is negative. Such negative cash flow is offset by cash flow from investments, principally from short-term investments and maturities of longer-term investments. The exact timing of the payment of claims and benefits cannot be predicted with certainty. The P&C Operations
32
maintain portfolios of invested assets with varying maturities and a substantial amount of short-term investments to provide adequate cash for the payment of claims. At December 31, 2001 and 2000, cash and short-term investments in the P&C Operations amounted to $63.5 million and $112.6 million, respectively.
Because of the increase in Workers' Compensation premiums, cash flow from operations was $84.6 million in the year ended December 31, 2001 and favorable cash flow from operations is expected to continue as Zenith's workers compensation premiums continue to increase in 2002. Cash used by operations decreased from $51.6 million in 1999 to $47.0 million in 2000, as Zenith's Workers' Compensation premiums began to increase in 2000. Cash used in operations in 2000 includes payment of $56.0 million of tax associated with the gain on the sale of CalFarm in 1999.
Zenith National requires cash to pay any dividends declared to its stockholders, make interest and principal payments on its outstanding debt obligations and fund its operating expenses. Such cash requirements are generally funded by dividends received from Zenith Insurance and financing or refinancing activities by Zenith National. Investment income from its investment portfolio also provides a current source of cash to Zenith National. The trend of available liquidity in Zenith National in the three years ended December 31, 2001 has been favorable, principally because of $130 million of dividends received from Zenith Insurance in 1999 as a result of the gain on the sale of CalFarm. Also, on December 5, 2001 Zenith National sold one million shares of its common stock, par value $1.00 per share, in a private placement for $25.00 per share, to a reinsurance subsidiary of Odyssey Re Holdings Corp. ("Odyssey Re") a subsidiary of Fairfax Financial Holdings Limited ("Fairfax"). After the sale, Fairfax owned approximately 42% of the outstanding common stock of Zenith National. The proceeds of the sale were $25.0 million and were added to Zenith National's short-term investments. Zenith National's cash, short term investments and other investments were $131.0 million at December 31, 2001. Zenith National's debt commitments are set forth in the table under Market Risk of Financial Instruments and such commitments include interest and principal in the amount of $59.8 million payable in May 2002 for Zenith National's outstanding Senior Notes. All of Zenith National's outstanding financing obligations are included in its Consolidated Financial Statements and the accompanying Notes. There are no liquidity or financing arrangements with unconsolidated entities. Zenith National's available invested assets and other sources of liquidity are currently expected to be sufficient to meet its requirements for liquidity in the short term and long term.
At December 31, 2001, Zenith National had two revolving, unsecured lines of credit in an aggregate amount of $70.0 million, all of which was available at December 31, 2001. Under the agreement covering one of these lines of credit, certain financial ratios are required to be maintained by Zenith National and by its subsidiaries. At December 31, 2001 Zenith met all of such financial ratios and does not expect these requirements to impact the availability of funds under the line of credit, if required.
The P&C Operations are subject to insurance regulations which restrict their ability to distribute dividends. Such dividend capabilities are set forth in Note 17 to the Consolidated Financial Statements. Such restrictions have not had, and under current regulations are not expected to have, a material adverse impact on the ability to pay dividends. The maximum dividend which can be paid to Zenith National without prior approval of the California Department of Insurance in 2002 is $22.8 million. In each of the years ended December 31, 2001 and 2000, Zenith National received $10.0 million of dividend payments from Zenith Insurance.
33
The amount of capital in the P&C Operations is maintained relative to standardized capital adequacy measures such as risk based capital where ratios such as net premiums written to statutory surplus measure capital adequacy. Risk based capital is used by regulators for regulatory financial surveillance purposes and by rating agencies to assign financial strength ratings to the P&C Operations and ratings for the debt issued by Zenith National. The P&C Operations at December 31, 2001 substantially exceeded the regulatory minimum risk based capital requirements. From time to time, the level of capitalization of the P&C Operations may be increased by contributions from Zenith National. Zenith National made a contribution of $14.2 million and $25.0 million to the capital and surplus of Zenith Insurance in 2001 and 2000, respectively.
In 2001, certain of Zenith's financial strength and debt ratings were reduced by rating agencies as follows: Moody's Investors Service ("Moody's") affirmed the financial strength rating of the P&C Operations at Baa1 (Adequate) and lowered Zenith National's debt ratings; Standard & Poor's ("S&P") reduced the financial strength rating of the P&C Operations from A (Strong) to A- (Strong) and lowered Zenith National's debt ratings; and A.M. Best Company (Best) lowered the financial strength rating of the P&C Operations from A (Excellent) to A- (Excellent). Generally, Moody's, S&P and Best indicated that they acted principally over concerns about recent operating losses in the P&C Operations. In 2001, Fitch Ratings assigned an A- (Strong) rating to the P&C Operations. The actions of such rating agencies have had no material impact on Zenith's operations and, in the future because of the available invested assets and available lines of credit, Zenith National has the flexibility, if necessary, to contribute capital to the P&C Operations.
Effective January 1, 2002, Zenith Insurance and Odyssey Re, an affiliate of Fairfax, entered into a 10% quota share ceded reinsurance agreement with respect to all new and renewal workers' compensation business written by Zenith Insurance in the three years commencing January 1, 2002. Quota share reinsurance allows the ceding company to increase the amount of business it writes while sharing the premiums and associated risks with the assuming company. The effect is similar to increasing the capital of the ceding company. Zenith expects that the quota share arrangement with Odyssey Re will favorably assist in the capitalization of the P&C Operations over the next three years.
In 1998, the National Association of Insurance Commissioners ("NAIC") adopted the Codification of Statutory Accounting Principles guidance (the "Codification"), which, effective January 1, 2001, replaced the Accounting Practices and Procedures manual as the NAIC's primary guidance on statutory accounting. (Statutory accounting is a comprehensive basis of accounting for insurance companies based on the Codification, state laws, regulations and general administrative rules.) The Codification provides guidance for the areas where statutory accounting had been silent and changed previous statutory accounting in some areas. The California and Texas Departments of Insurance have adopted the Codification. The Codification, as currently constituted, did not have a material impact on the statutory capital and surplus of the P&C Operations in 2001.
Insurance companies are required to have securities on deposit for the protection of policyholders in accordance with various states' regulations. At December 31, 2001 and 2000, investments carried at their fair value of $270.8 million and $235.9 million, respectively, were on deposit to comply with such regulations.
From time to time, Zenith National may make repurchases of its outstanding common shares or outstanding debt. At December 31, 2001, Zenith National was authorized to repurchase up to 929,000 shares of its common
34
stock at prevailing market prices pursuant to a share purchase program authorized by its Board of Directors. These purchases are discretionary and can be adequately funded from Zenith National's existing sources of liquidity. In 2001, Zenith National paid $1.3 million to repurchase $1.3 million aggregate principal amount of the outstanding 9% Senior Notes due 2002 (the "9% Notes"). In 2000, Zenith National paid $22.8 million to repurchase $16.5 million aggregate principal amount of the outstanding 9% Notes and $8.0 million aggregate liquidation amount of the outstanding 8.55% Capital Securities of the Zenith National Insurance Capital Trust I, a Delaware statutory business trust, all of the voting securities of which are owned by Zenith National. The repurchases in 2000 resulted in an extraordinary gain before tax of $1.5 million. Zenith National used its available cash balances to fund these purchases.
The Real Estate operations maintain a $50.0 million secured revolving credit facility from a bank ("Bank Line"), which it uses primarily for funding infrastructure development and home construction. No more than $20.0 million of the Bank Line may be outstanding for infrastructure development; there is no similar limitation on the use of the line for home construction. The bank's prior approval is required for any funding before draws may be taken. In addition to monthly interest payments, the maintenance of specified loan to value ratios, and principal curtailments under certain circumstances, the Bank Line requires the Real Estate operations to not exceed a prescribed leverage ratio and to maintain minimum interest coverage and minimum adjusted working capital. At December 31, 2001, the Real Estate operations were in compliance with all such requirements. Loans under the Bank Line bear interest at the prime rate plus 0.5%, resulting in interest on outstanding Bank Line loans at December 31, 2001 of 5.3%.
Funding for project infrastructure development precedes the funding of home construction in that project. A prescribed portion of the first construction draw for each home must be used to repay the infrastructure development funding. Repayment of funding for infrastructure development is due the earlier of two years from the date the funding was approved or upon the termination date of the Bank Line. Repayment of all construction draws for each home must be made the earlier of one year from the initial construction draw for that home or upon the termination date of the Bank Line. The Bank Line is for a renewable twelve month term but upon termination will be extended for twenty four months, during which time period the Real Estate operations may only draw funds previously approved, as well as, subject to certain limitations, request funding for constructing pre-sold homes. At December 31, 2001, $16.2 million was outstanding under the Bank Line. Zenith National also finances the land acquisitions of its Real Estate operations through inter-company loans. At December 31, 2001, Zenith National had $28.6 million of principal and accrued interest outstanding under such loans.
Market Risk of Financial Instruments
The fair value of the fixed maturity investment portfolio is exposed to interest rate risk—the risk of loss in fair value resulting from changes in prevailing market rates of interest for similar financial instruments. However, Zenith has the ability to hold fixed maturity investments to maturity. Zenith relies on the experience and judgment of senior management to monitor and mitigate the effects of market risk. Zenith does not utilize financial instrument hedges or derivative financial instruments to manage risks, nor does it enter into any swap, forward or options contracts, but will attempt to mitigate its exposure through active portfolio management. The allocation among various types of securities is adjusted from time to time based on market conditions, credit conditions, tax policy, fluctuations in interest rates and other factors. In addition, Zenith places the
35
majority of its investments in high quality, liquid securities and limits the amount of credit exposure to any one issuer.
The table below provides information about Zenith's financial instruments as of December 31, 2001 for which fair values are subject to changes in interest rates. For fixed maturity investments, the table presents fair value of investments held and weighted average interest rates on such investments by expected maturity dates. Such investments include redeemable preferred stock, corporate bonds, municipal bonds, government bonds and mortgage-backed securities. For Zenith's debt obligations, the table presents principal cash flows by expected maturity dates (including interest).
|
|---|
| | Expected Maturity Date
|
|---|
(Dollars in thousands)
| | 2002
| | 2003
| | 2004
| | 2005
| | 2006
| | Thereafter
| | Total
|
|---|
|
|---|
| Investments: | | | | | | | | | | | | | | | | | | | | | |
| | Held-to-maturity and available-for-sale securities: | | | | | | | | | | | | | | | | | | | | | |
| | | | Fixed rate | | $ | 44,533 | | $ | 172,576 | | $ | 26,135 | | $ | 42,347 | | $ | 105,828 | | $ | 336,531 | | $ | 727,950 |
| | | | Weighted average interest rate | | | 3.0% | | | 3.5% | | | 5.5% | | | 6.2% | | | 6.9% | | | 7.7% | | | 6.1% |
| | Short-term investments | | $ | 119,066 | | | | | | | | | | | | | | | | | $ | 119,066 |
| Debt and interest obligations of Zenith: | | | | | | | | | | | | | | | | | | | | | |
| | Payable to banks | | $ | 15,768 | | $ | 45 | | $ | 877 | | | | | | | | | | | $ | 16,690 |
| | Senior notes payable | | | 59,811 | | | | | | | | | | | | | | | | | | 59,811 |
| | Redeemable securities | | | 5,729 | | | 5,729 | | | 5,729 | | $ | 5,729 | | $ | 5,729 | | $ | 193,038 | | | 221,683 |
|
Recently Issued Accounting Standards
On July 20, 2001, the Financial Accounting Standards Board issued Statement of Financial Accounting Standards No. 141 ("SFAS No. 141"), "Business Combinations." The significant changes of SFAS No. 141 on the accounting for business combinations are (a) it requires the application of the purchase method of accounting and (b) it sets forth specific criteria for the recognition of intangible assets and goodwill resulting from the allocation of the purchase price. Goodwill and intangible assets recognized in a business combination are to be accounted for in accordance with Statement of Financial Accounting Standards No. 142 ("SFAS No. 142"), "Goodwill and Other Intangible Assets", discussed below. SFAS No. 141 is to be applied to all business combinations initiated after September 30, 2001 and all business combinations accounted for using the purchase method for which the date of acquisition is July 1, 2001 or later.
On July 20, 2001, the Financial Accounting Standards Board issued SFAS No. 142, which addresses the accounting for goodwill and other intangible assets. Under SFAS No. 142, goodwill and intangible assets with indefinite lives are no longer amortized and other intangible assets are amortized over their useful lives (which may exceed forty years). The new standard also requires that goodwill and intangible assets with indefinite lives be tested for impairment at least annually and sets forth criteria for recognition and measurement of impairment. SFAS No. 142 is required to be applied for all fiscal years beginning after December 15, 2001 and will be adopted by Zenith effective January 1, 2002, applicable to all goodwill and other intangibles recognized in its financial statements at that date. The unamortized carrying value of goodwill from Zenith's previous acquisitions was $21.5 million at December 31, 2001. Zenith has evaluated this goodwill for impairment at January 1, 2002 in accordance with SFAS No. 142 and it was determined not to be impaired at that date. Effective January 1, 2002, amortization expense for goodwill, which amounted to $0.9 million in 2001, will no longer be recorded.
36
FINANCIAL STATEMENTS

5-YEAR SUMMARY OF SELECTED FINANCIAL INFORMATION
Zenith National Insurance Corp. and Subsidiaries
| |
|---|
Years ended December 31,
| | Note(s)
| | 2001
| | 2000
| |
|---|
| |
| (Dollars and shares in thousands, except per share data) | | | | | | | | | |
| Revenues: | | 1, 2 | | | | | | | |
| Premiums earned | | | | $ | 476,876 | | $ | 338,752 | |
| Net investment income | | | | | 51,178 | | | 51,766 | |
| Realized gains (losses) on investments | | | | | 9,169 | | | (15,467 | ) |
| Real estate sales | | | | | 84,823 | | | 84,518 | |
| Service fee income | | | | | | | | | |
| |
| Total revenues | | | | | 622,046 | | | 459,569 | |
| |
| (Loss) income after tax and before realized (losses) gains and extraordinary item | | 1, 2 | | | (29,760 | ) | | (37,739 | ) |
| Per common share | | | | | (1.69 | ) | | (2.19 | ) |
| |
| Components of net (loss) income: | | | | | | | | | |
| Underwriting loss: | | | | | | | | | |
| Loss excluding catastrophes | | 1, 2 | | | (32,831 | ) | | (53,251 | ) |
| Catastrophe losses | | | | | (27,105 | ) | | (14,690 | ) |
| Net investment income | | | | | 33,841 | | | 34,243 | |
| Realized gains (losses) on investments | | | | | 5,960 | | | (10,054 | ) |
| Income from real estate operations | | | | | 3,746 | | | 3,552 | |
| Parent expenses and interest expense | | | | | (7,411 | ) | | (7,593 | ) |
| Gain on sale of CalFarm | | 2 | | | | | | | |
| Extraordinary item-gain on extinguishment of debt | | 3 | | | | | | 993 | |
| |
| Net (loss) income | | | | | (23,800 | ) | | (46,800 | ) |
| Per common share | | | | | (1.35 | ) | | (2.72 | ) |
| |
| Cash dividends per share to common stockholders | | | | | 1.00 | | | 1.00 | |
| |
| Weighted average common shares outstanding | | | | | 17,593 | | | 17,212 | |
| |
| Financial condition: | | 1, 2 | | | | | | | |
| Total assets | | | | $ | 1,540,059 | | $ | 1,472,190 | |
| Investments | | | | | 944,697 | | | 852,734 | |
| Unpaid losses and loss adjustment expenses | | | | | 946,822 | | | 877,883 | |
| Senior notes, bank debt and other notes payable | | 3 | | | 73,389 | | | 74,048 | |
| Redeemable securities | | 3 | | | 65,669 | | | 65,618 | |
| Total stockholders' equity | | | | | 302,611 | | | 309,776 | |
| Stockholders' equity per share | | 4 | | | 16.31 | | | 17.76 | |
| Return on average equity | | | | | (7.8)% | | | (14.3)% | |
| |
| Insurance statistics (GAAP): | | 1, 2 | | | | | | | |
| Paid loss and loss adjustment expense ratio | | | | | 67.9% | | | 90.9% | |
| Combined ratio: | | | | | | | | | |
| Loss and loss adjustment expense ratio | | | | | 90.6% | | | 99.4% | |
| Underwriting expense ratio | | | | | 28.3%
| | | 30.8%
| |
| Combined ratio | | | | | 118.9% | | | 130.2% | |
| Net premiums earned-to-surplus ratio | | | | | 1.6 | | | 1.1 | |
| Loss and loss adjustment expense reserves-to-surplus ratio (net of reinsurance) | | | | | 2.5 | | | 2.0 | |
| |
| (1) | | On April 1, 1998, Zenith acquired substantially all of the assets and certain liabilities of RISCORP, Inc. and subsidiaries (collectively, "RISCORP"). In 1999, Zenith recorded $50.0 million before tax ($32.5 million after tax, or $1.89 per share) of net charges associated with an increase in the purchase price of RISCORP (See Note 14 to the Consolidated Financial Statements). |
| (2) | | Zenith completed the sale of CalFarm Insurance Company ("CalFarm") effective March 31, 1999, resulting in a gain of $104.3 million after tax, or $6.08 per share, in the first quarter of 1999 (See Note 13 to the Consolidated Financial Statements). |
38
|
Years ended December 31,
|
|
|---|
1999
| | 1998
| | 1997
| |
|
|---|
|
| (Dollars and shares in thousands, except per share data) | | | | | | | | | | |
| Revenues: | | | | | | | | | | |
| Premiums earned | $ | 369,403 | | $ | 529,855 | | $ | 488,721 | | |
| Net investment income | | 53,662 | | | 53,593 | | | 52,332 | | |
| Realized gains (losses) on investments | | 7,682 | | | 11,602 | | | 14,008 | | |
| Real estate sales | | 58,670 | | | 37,737 | | | 45,419 | | |
| Service fee income | | 2,691 | | | 3,992 | | | | | |
|
| Total revenues | | 492,108 | | | 636,779 | | | 600,480 | | |
|
| (Loss) income after tax and before realized (losses) gains and extraordinary item | | (55,228 | ) | | 11,559 | | | 19,669 | | |
| Per common share | | (3.22 | ) | | 0.67 | | | 1.10 | | |
|
| Components of net (loss) income: | | | | | | | | | | |
| Underwriting loss: | | | | | | | | | | |
| Loss excluding catastrophes | | (72,904 | ) | | (11,230 | ) | | (10,217 | ) | |
| Catastrophe losses | | (12,285 | ) | | (7,475 | ) | | (975 | ) | |
| Net investment income | | 35,632 | | | 35,907 | | | 34,655 | | |
| Realized gains (losses) on investments | | 4,993 | | | 7,541 | | | 8,431 | | |
| Income from real estate operations | | 2,372 | | | 868 | | | 1,079 | | |
| Parent expenses and interest expense | | (8,043 | ) | | (6,511 | ) | | (4,873 | ) | |
| Gain on sale of CalFarm | | 104,335 | | | | | | | | |
| Extraordinary item-gain on extinguishment of debt | | | | | | | | | | |
|
| Net (loss) income | | 54,100 | | | 19,100 | | | 28,100 | | |
| Per common share | | 3.15 | | | 1.11 | | | 1.57 | | |
|
| Cash dividends per share to common stockholders | | 1.00 | | | 1.00 | | | 1.00 | | |
|
| Weighted average common shares outstanding | | 17,172 | | | 17,158 | | | 17,886 | | |
|
| Financial condition: | | | | | | | | | | |
| Total assets | $ | 1,573,786 | | $ | 1,818,726 | | $ | 1,252,156 | | |
| Investments | | 901,734 | | | 1,048,681 | | | 879,973 | | |
| Unpaid losses and loss adjustment expenses | | 880,929 | | | 997,647 | | | 613,266 | | |
| Senior notes, bank debt and other notes payable | | 94,955 | | | 93,851 | | | 88,216 | | |
| Redeemable securities | | 73,397 | | | 73,341 | | | | | |
| Total stockholders' equity | | 354,559 | | | 346,952 | | | 361,866 | | |
| Stockholders' equity per share | | 20.67 | | | 20.23 | | | 20.31 | | |
| Return on average equity | | 13.9% | | | 5.4% | | | 8.3% | | |
|
| Insurance statistics (GAAP): | | | | | | | | | | |
| Paid loss and loss adjustment expense ratio | | 96.0% | | | 82.9% | | | 66.9% | | |
| Combined ratio: | | | | | | | | | | |
| Loss and loss adjustment expense ratio | | 97.5% | | | 72.3% | | | 71.2% | | |
| Underwriting expense ratio | | 37.7%
| | | 33.0%
| | | 32.2%
| | |
| Combined ratio | | 135.2% | | | 105.3% | | | 103.4% | | |
| Net premiums earned-to-surplus ratio | | 1.1 | | | 1.2 | | | 1.4 | | |
| Loss and loss adjustment expense reserves-to-surplus ratio (net of reinsurance) | | 1.8 | | | 1.6 | | | 1.5 | | |
|
| (3) | | In 2001 and 2000, Zenith repurchased $1.3 million and $16.5 million, respectively, aggregate principal amount of the outstanding 9% Senior Notes due 2002. In 2000, Zenith repurchased $8.0 million aggregate liquidation amount of the outstanding 8.55% Capital Securities. |
| (4) | | Excluding the effect of Statement of Financial Accounting Standards No. 115, stockholders' equity per share was $16.36, $18.31, $21.80, $19.86 and $20.03 at December 31, 2001, 2000, 1999, 1998 and 1997, respectively. |
|
|
39
|
PROPERTY-CASUALTY LOSS DEVELOPMENT
Zenith National Insurance Corp. and Subsidiaries
The table that follows shows development of loss and loss adjustment expense liabilities as originally estimated on a generally accepted accounting principles basis at December 31 of each year presented. The accounting policies used to estimate these liabilities are described in Note 1 to the Consolidated Financial Statements and the significance of loss reserve development in the Consolidated Financial Statements is described in Management's Discussion and Analysis of Consolidated Financial Condition and Results of Operations.
Analysis of Loss and Loss Adjustment Expense Liability Development
| |
|---|
| | 2001
| | 2000
| | 1999
| |
|---|
| |
| (Dollars in thousands) | | | | | | | | | | |
| Liability for unpaid loss and loss adjustment expenses, net | | $ | 742,678 | | $ | 634,172 | | $ | 605,250 | |
| |
| Paid, net (cumulative) as of: | | | | | | | | | | |
| One year later | | | | | | 243,506 | | | 235,968 | |
| Two years later | | | | | | | | | 384,011 | |
| Three years later | | | | | | | | | | |
| Four years later | | | | | | | | | | |
| Five years later | | | | | | | | | | |
| Six years later | | | | | | | | | | |
| Seven years later | | | | | | | | | | |
| Eight years later | | | | | | | | | | |
| Nine years later | | | | | | | | | | |
| Ten years later | | | | | | | | | | |
| |
| Liability, net re-estimated as of: | | | | | | | | | | |
| One year later | | | | | | 638,519 | | | 636,130 | |
| Two years later | | | | | | | | | 635,750 | |
| Three years later | | | | | | | | | | |
| Four years later | | | | | | | | | | |
| Five years later | | | | | | | | | | |
| Six years later | | | | | | | | | | |
| Seven years later | | | | | | | | | | |
| Eight years later | | | | | | | | | | |
| Nine years later | | | | | | | | | | |
| Ten years later | | | | | | | | | | |
| |
| Favorable (deficient) development | | | | | $ | (4,347 | ) | $ | (30,500 | ) |
| |
| Net Liability — December 31, | | $ | 742,678 | | $ | 634,172 | | $ | 605,250 | |
Receivable from reinsurers and state trust funds
for paid and unpaid losses | | | 204,144 | | | 243,711 | | | 275,679 | |
| |
| Gross liability — December 31, | | | 946,822 | | | 877,883 | | | 880,929 | |
| Re-estimated liability, net of reinsurance | | | | | | 638,519 | | | 635,750 | |
Re-estimated receivable from reinsurers and state
trust funds for paid and unpaid losses | | | | | | 227,946 | | | 250,326 | |
| |
| Re-estimated liability, gross | | | | | | 866,465 | | | 886,076 | |
| |
| Favorable (deficient) development, gross | | | | | $ | 11,418 | | $ | (5,147 | ) |
| |
The analysis above presents the development of Zenith National Insurance Corp. and subsidiaries' balance sheet liabilities for unpaid loss and loss adjustment expenses. The first line in the table shows the liability for unpaid loss and loss adjustment expenses, net of reinsurance, as estimated at the end of each calendar year. The first section below shows the cumulative actual payments of loss and loss adjustment expenses that relate to each year-end liability as they were paid at the end of subsequent annual periods. The second section shows revised estimates of the original unpaid amounts, net of reinsurance, including the subsequent payments and re-estimates of the remaining unpaid liabilities. The next line shows the favorable or deficient developments of the original estimates for each year, net of reinsurance. This loss reserve development table is cumulative and, therefore, ending balances should not be added since the amount at the end of each calendar year includes activity for both the current and prior years. The liability at the end of each year includes an estimate of the amount yet unpaid and still due at the subsequent re-evaluation date for all previously estimated liabilities. For example, the liability at the end of 1998 includes an estimate of the amount still due on the 1997 and prior liabilities.
40
|
| |
|---|
| 1998
| | 1997
| | 1996
| | 1995
| | 1994
| | 1993
| | 1992
| | 1991
| |
|---|
| |
| (Dollars in thousands) | | | | | | | | | | | | | | | | | | | | | | | | |
| Liability for unpaid loss and loss adjustment expenses, net | $ | 599,357 | | $ | 418,529 | | $ | 419,451 | | $ | 357,652 | | $ | 365,296 | | $ | 385,629 | | $ | 380,388 | | $ | 354,789 | |
| |
| Paid, net (cumulative) as of: | | | | | | | | | | | | | | | | | | | | | | | | |
| One year later | | 244,402 | | | 137,681 | | | 149,195 | | | 127,428 | | | 116,193 | | | 119,158 | | | 124,303 | | | 124,186 | |
| Two years later | | 387,815 | | | 226,165 | | | 238,809 | | | 208,452 | | | 189,086 | | | 193,815 | | | 206,332 | | | 202,060 | |
| Three years later | | 474,055 | | | 280,615 | | | 289,673 | | | 250,865 | | | 236,623 | | | 238,268 | | | 257,922 | | | 252,011 | |
| Four years later | | | | | 320,621 | | | 322,887 | | | 278,760 | | | 262,775 | | | 271,090 | | | 288,034 | | | 284,734 | |
| Five years later | | | | | | | | 349,873 | | | 299,537 | | | 280,005 | | | 287,806 | | | 312,352 | | | 304,198 | |
| Six years later | | | | | | | | | | | 317,618 | | | 294,969 | | | 298,976 | | | 323,555 | | | 323,213 | |
| Seven years later | | | | | | | | | | | | | | 307,344 | | | 309,829 | | | 331,914 | | | 330,371 | |
| Eight years later | | | | | | | | | | | | | | | | | 319,343 | | | 340,990 | | | 336,626 | |
| Nine years later | | | | | | | | | | | | | | | | | | | | 348,125 | | | 349,155 | |
| Ten years later | | | | | | | | | | | | | | | | | | | | | | | 349,613 | |
| |
| Liability, net re-estimated as of: | | | | | | | | | | | | | | | | | | | | | | | | |
| One year later | | 645,460 | | | 402,551 | | | 423,327 | | | 358,249 | | | 359,658 | | | 371,537 | | | 381,758 | | | 369,480 | |
| Two years later | | 645,463 | | | 399,660 | | | 414,854 | | | 358,264 | | | 347,845 | | | 359,665 | | | 380,057 | | | 378,978 | |
| Three years later | | 632,511 | | | 392,001 | | | 410,924 | | | 351,831 | | | 339,076 | | | 356,475 | | | 378,383 | | | 377,713 | |
| Four years later | | | | | 404,743 | | | 398,561 | | | 348,226 | | | 332,834 | | | 348,916 | | | 382,382 | | | 379,440 | |
| Five years later | | | | | | | | 402,979 | | | 345,132 | | | 330,097 | | | 342,608 | | | 376,917 | | | 380,672 | |
| Six years later | | | | | | | | | | | 343,084 | | | 335,489 | | | 340,001 | | | 370,165 | | | 377,166 | |
| Seven years later | | | | | | | | | | | | | | 331,912 | | | 344,442 | | | 368,173 | | | 370,720 | |
| Eight years later | | | | | | | | | | | | | | | | | 340,283 | | | 372,922 | | | 368,921 | |
| Nine years later | | | | | | | | | | | | | | | | | | | | 368,976 | | | 372,834 | |
| Ten years later | | | | | | | | | | | | | | | | | | | | | | | 368,851 | |
| |
| Favorable (deficient) development | $ | (33,154 | ) | $ | 13,786 | | $ | 16,472 | | $ | 14,568 | | $ | 33,384 | | $ | 45,346 | | $ | 11,412 | | $ | (14,062 | ) |
| |
| Net Liability — December 31, | $ | 599,357 | | $ | 418,529 | | $ | 419,451 | | $ | 357,652 | | $ | 365,296 | | $ | 385,629 | | $ | 380,388 | | | | |
Receivable from reinsurers and state trust funds
for paid and unpaid losses | | 276,526 | | | 74,313 | | | 82,869 | | | 40,419 | | | 37,561 | | | 38,543 | | | 26,822 | | | | |
| | | | |
| Gross liability — December 31, | | 875,883 | | | 492,842 | | | 502,320 | | | 398,071 | | | 402,857 | | | 424,172 | | | 407,210 | | | | |
| Re-estimated liability, net of reinsurance | | 632,511 | | | 404,743 | | | 402,979 | | | 343,084 | | | 331,912 | | | 340,283 | | | 368,976 | | | | |
Re-estimated receivable from reinsurers and state
trust funds for paid and unpaid losses | | 296,842 | | | 96,002 | | | 93,064 | | | 65,815 | | | 59,967 | | | 68,004 | | | 79,103 | | | | |
| | | | |
| Re-estimated liability, gross | | 929,353 | | | 500,745 | | | 496,043 | | | 408,899 | | | 391,879 | | | 408,287 | | | 448,079 | | | | |
| | | | |
| Favorable (deficient) development, gross | $ | (53,470 | ) | $ | (7,903 | ) | $ | 6,277 | | $ | (10,828 | ) | $ | 10,978 | | $ | 15,885 | | $ | (40,869 | ) | | | |
| | | | |
Since conditions and trends that have affected loss and loss adjustment expense development in the past may not occur in the future in exactly the same manner, if at all, future results may not be reliably predicted by extrapolation of the data presented.
Information for 1998 includes the results of the acquisition of substantially all assets and certain liabilities from RISCORP, Inc. and subsidiaries (See Note 14 to the Consolidated Financial Statements). The data prior to 1999 have been restated to exclude the results of CalFarm Insurance Company, which was sold effective March 31, 1999 (See Note 13 to the Consolidated Financial Statements). Adverse development in 2001 on the reserves established at December 31, 2000 and adverse development in 2000 on the reserves established at December 31, 1999 is attributable, principally, to additional estimates of 1999 catastrophe losses. Adverse development in 1999 on the reserves established at December 31, 1998 is attributable, principally, to an increase in the reserves acquired from RISCORP (see Note 14 to the Consolidated Financial Statements).
41
CONSOLIDATED BALANCE SHEET
Zenith National Insurance Corp. and Subsidiaries
|
December 31,
| | Note(s)
| | 2001
| | 2000
|
|---|
|
| (Dollars in thousands) | | | | | | | | |
| Assets: | | | | | | | | |
| Investments: | | | | | | | | |
| Fixed maturities: | | | | | | | | |
| | At amortized cost (fair value $29,284 in 2001 and $24,891 in 2000) | | | | $ | 28,593 | | $ | 24,523 |
| | At fair value (cost $699,967 in 2001 and $585,351 in 2000) | | | | | 698,666 | | | 570,451 |
| Floating rate preferred stocks, at fair value (cost $6,799 in 2001 and 2000) | | | | | 6,093 | | | 5,699 |
| Convertible and non-redeemable preferred stocks, at fair value (cost $5,488 in 2001 and $3,733 in 2000) | | | | | 5,795 | | | 3,391 |
| Common stocks, at fair value (cost $29,411 in 2001 and $23,630 in 2000) | | | | | 28,394 | | | 27,301 |
| Short-term investments (at cost, which approximates fair value) | | | | | 119,066 | | | 158,438 |
| Other investments | | | | | 58,090 | | | 62,931 |
|
| Total investments | | 2, 3 | | | 944,697 | | | 852,734 |
Cash |
|
|
|
|
24,910 |
|
|
16,026 |
| Accrued investment income | | | | | 11,659 | | | 11,883 |
| Premiums receivable, less allowance for doubtful accounts of $7,704 in 2001 and $7,596 in 2000 | | | | | 86,823 | | | 76,405 |
| Receivable from reinsurers and state trust funds for paid and unpaid losses | | 6 | | | 263,500 | | | 305,341 |
| Deferred policy acquisition costs | | | | | 12,679 | | | 10,310 |
| Properties and equipment, less accumulated depreciation | | 4 | | | 49,192 | | | 49,827 |
| Deferred tax asset | | 5 | | | 34,526 | | | 35,123 |
| Current federal income tax receivable | | | | | 13,357 | | | 17,746 |
| Intangible assets | | 1 | | | 21,485 | | | 22,410 |
| Other assets | | 1 | | | 77,231 | | | 74,385 |
|
| Total assets | | | | $ | 1,540,059 | | $ | 1,472,190 |
|
The accompanying notes are an integral part of this statement.
42
|
December 31,
| | Note(s)
| | 2001
| | 2000
|
|---|
|
| (Dollars and shares in thousands) | | | | | | |
| Liabilities: | | | | | | |
| Policy liabilities and accruals: | | | | | | |
| | Unpaid loss and loss adjustment expenses | | 6 | | $946,822 | | $877,883 |
| | Unearned premiums | | | | 71,313 | | 58,907 |
| Policyholders' dividends accrued | | | | 3,316 | | 2,773 |
| Reserves on loss portfolio transfers | | | | 13,397 | | 14,471 |
| Payable to banks | | 3, 7 | | 16,186 | | 15,674 |
| Senior notes payable, less unamortized issue costs of $32 in 2001 and $126 in 2000 | | 3, 8, 11 | | 57,203 | | 58,374 |
| Other liabilities | | | | 63,542 | | 68,714 |
|
| Total liabilities | | | | 1,171,779 | | 1,096,796 |
|
|
|
|
|
|
|
|
Redeemable securities: |
|
|
|
|
|
|
| Company-obligated, mandatorily redeemable 8.55% Capital Securities of Zenith National Insurance Capital Trust I, holding solely 8.55% Subordinated Deferrable Interest Debentures due 2028 of Zenith National Insurance Corp., less unamortized issue cost and discount of $1,331 in 2001 and $1,382 in 2000 | | 3, 10, 11 | | 65,669 | | 65,618 |
|
| Commitments and contingent liabilities | | 15 | | | | |
| Stockholders' equity: | | | | | | |
| Preferred stock, $1 par — shares authorized 1,000; issued and outstanding, none in 2001 and 2000 | | | | | | |
| Common stock, $1 par — shares authorized 50,000; issued 25,571, outstanding 18,553 in 2001 issued 25,452, outstanding 17,443 in 2000 | | | | 25,571 | | 25,452 |
| Additional paid-in capital | | | | 291,348 | | 282,120 |
| Retained earnings | | | | 119,600 | | 161,174 |
| Accumulated other comprehensive loss — net unrealized depreciation on investments, net of deferred tax benefit of $951 in 2001 and $4,419 in 2000 | | 2 | | (1,766) | | (8,206) |
|
| | | | | 434,753 | | 460,540 |
| Treasury stock, at cost (7,018 shares in 2001 and 8,009 shares in 2000) | | 16 | | (132,142) | | (150,764) |
|
| Total stockholders' equity | | | | 302,611 | | 309,776 |
|
| Total liabilities, redeemable securities and stockholders' equity | | | | $1,540,059 | | $1,472,190 |
|
43
CONSOLIDATED STATEMENT OF OPERATIONS
Zenith National Insurance Corp. and Subsidiaries
|
Years ended December 31,
| | Note(s)
| | 2001
| | 2000
| | 1999
|
|---|
|
| (Dollars and shares in thousands, except per share data) | | | | | | | | | | | |
| Revenues: | | | | | | | | | | | |
| Premiums earned | | 12 | | $ | 476,876 | | $ | 338,752 | | $ | 369,403 |
| Net investment income | | 2 | | | 51,178 | | | 51,766 | | | 53,662 |
| Realized gains (losses) on investments | | 2 | | | 9,169 | | | (15,467 | ) | | 7,682 |
| Real estate sales | | | | | 84,823 | | | 84,518 | | | 58,670 |
| Service fee income | | | | | | | | | | | 2,691 |
|
| Total revenues | | | | | 622,046 | | | 459,569 | | | 492,108 |
|
| Expenses: | | | | | | | | | | | |
| Loss and loss adjustment expenses incurred | | 6, 12 | | | 432,290 | | | 336,962 | | | 360,172 |
| Policy acquisition costs | | | | | 87,823 | | | 62,891 | | | 65,266 |
| Other underwriting and operating expenses | | | | | 48,858 | | | 45,787 | | | 80,090 |
| Policyholders' dividends and participation | | | | | 1,978 | | | 1,544 | | | 610 |
| Real estate construction and operating costs | | | | | 79,060 | | | 79,054 | | | 55,020 |
| Interest expense | | 7, 8, 9, 10 | | | 7,576 | | | 5,640 | | | 8,218 |
|
| Total expenses | | | | | 657,585 | | | 531,878 | | | 569,376 |
|
| Gain on sale of CalFarm Insurance Company | | 13 | | | | | | | | | 160,335 |
|
| (Loss) income before federal income tax (benefit) expense and extraordinary item | | | | | (35,539 | ) | | (72,309 | ) | | 83,067 |
| Federal income tax (benefit) expense, including expense of $56,000 related to the sale of CalFarm Insurance Company in 1999 | | 5, 13 | | | (11,739 | ) | | (24,516 | ) | | 28,967 |
|
| (Loss) income before extraordinary item | | | | | (23,800 | ) | | (47,793 | ) | | 54,100 |
| Extraordinary item — gain on extinguishment of debt, net of federal income tax expense of $534 | | 11 | | | | | | 993 | | | |
|
| Net (loss) income | | | | $ | (23,800 | ) | $ | (46,800 | ) | $ | 54,100 |
|
| Net (loss) income per common share: | | | | | | | | | | | |
| Basic: | | | | | | | | | | | |
| (Loss) income before extraordinary item | | 19 | | $ | (1.35 | ) | $ | (2.78 | ) | $ | 3.15 |
| Extraordinary item — gain on extinguishment of debt, net of federal income tax expense | | 11 | | | | | | 0.06 | | | |
|
| Net (loss) income | | 19 | | $ | (1.35 | ) | $ | (2.72 | ) | $ | 3.15 |
|
| Diluted: | | | | | | | | | | | |
| (Loss) income before extraordinary item | | 19 | | $ | (1.35 | ) | $ | (2.78 | ) | $ | 3.15 |
| Extraordinary item — gain on extinguishment of debt, net of federal income tax expense | | 11 | | | | | | 0.06 | | | |
|
| Net (loss) income | | 19 | | $ | (1.35 | ) | $ | (2.72 | ) | $ | 3.15 |
|
The accompanying notes are an integral part of this statement.
44
CONSOLIDATED STATEMENT OF CASH FLOWS
Zenith National Insurance Corp. and Subsidiaries
| |
Years ended December 31,
| Note(s)
| | 2001
| | 2000
| | 1999
| |
|---|
| |
| (Dollars in thousands) | | | | | | | | | | | |
| Cash flows from operating activities: | | | | | | | | | | | |
| | Premiums collected | | | $ | 493,021 | | $ | 355,538 | | $ | 394,564 | |
| | Investment income received | | | | 50,319 | | | 48,802 | | | 51,170 | |
| | Proceeds from sales of real estate | | | | 84,823 | | | 84,518 | | | 58,670 | |
| | Net proceeds from trading portfolio investments | | | | 3,000 | | | | | | | |
| | Loss and loss adjustment expenses paid | | | | (320,852 | ) | | (298,777 | ) | | (321,510 | ) |
| | Underwriting and other operating expenses paid | | | | (152,204 | ) | | (124,928 | ) | | (156,631 | ) |
| | Real estate construction costs paid | | | | (79,265 | ) | | (81,820 | ) | | (71,690 | ) |
| | Interest paid | | | | (7,647 | ) | | (6,216 | ) | | (8,239 | ) |
| | Income taxes refunded (paid) | | | | 13,412 | | | (24,155 | ) | | 2,084 | |
| |
| Net cash provided by (used in) operating activities | | | | 84,607 | | | (47,038 | ) | | (51,582 | ) |
| |
| Cash flows from investing activities: | | | | | | | | | | | |
| | Purchases of investments: | | | | | | | | | | | |
| | | Investment securities available-for-sale | | | | (1,362,903 | ) | | (164,485 | ) | | (366,567 | ) |
| | | Fixed maturities held-to-maturity | | | | (9,956 | ) | | | | | | |
| | | Other investments | | | | (10,487 | ) | | (4,252 | ) | | (9,332 | ) |
| | Proceeds from maturities and redemptions of investments: | | | | | | | | | | | |
| | | Fixed maturities held-to-maturity | | | | 5,780 | | | 2,962 | | | 7,500 | |
| | | Investment securities available-for-sale | | | | 60,430 | | | 48,319 | | | 95,668 | |
| | Proceeds from sales of investments: | | | | | | | | | | | |
| | | Investment securities available-for-sale | | | | 1,180,668 | | | 173,490 | | | 233,742 | |
| | | Other investments | | | | 16,354 | | | 8,807 | | | 21,922 | |
| | Net decrease (increase) in short-term investments | | | | 41,966 | | | 25,026 | | | (41,746 | ) |
| | Cash payment to RISCORP | | | | | | | | | | (54,308 | ) |
| | Net proceeds from sale of CalFarm Insurance Company | 13 | | | | | | | | | 211,068 | |
| | Capital expenditures and other, net | | | | (7,135 | ) | | (5,789 | ) | | (15,189 | ) |
| |
| Net cash (used in) provided by investing activities | | | | (85,283 | ) | | 84,078 | | | 82,758 | |
| |
| Cash flows from financing activities: | | | | | | | | | | | |
| | Repurchase of redeemable securities | 11 | | | | | | (6,164 | ) | | | |
| | Repurchase of 9% Notes | 11 | | | (1,265 | ) | | (16,585 | ) | | | |
| | Sale of treasury shares | 22 | | | 25,000 | | | | | | | |
| | Cash advanced from bank lines of credit | 7 | | | | | | | | | 7,400 | |
| | Cash repaid on bank lines of credit | 7 | | | | | | | | | (12,400 | ) |
| | Cash advanced from bank construction loans | 7 | | | 63,316 | | | 73,988 | | | 56,970 | |
| | Cash repaid on bank construction loans | 7 | | | (62,804 | ) | | (77,992 | ) | | (52,397 | ) |
| | Cash dividends paid to common stockholders | | | | (17,502 | ) | | (17,183 | ) | | (17,165 | ) |
| | Proceeds from exercise of stock options | 16 | | | 3,022 | | | 7,246 | | | 4,322 | |
| | Purchase of treasury shares | 16 | | | (207 | ) | | (38 | ) | | (4,190 | ) |
| |
| Net cash provided by (used in) financing activities | | | | 9,560 | | | (36,728 | ) | | (17,460 | ) |
| |
| Net increase in cash | | | | 8,884 | | | 312 | | | 13,716 | |
| Cash at beginning of year | | | | 16,026 | | | 15,714 | | | 1,998 | |
| |
| Cash at end of year | | | $ | 24,910 | | $ | 16,026 | | $ | 15,714 | |
| |
| Reconciliation of net (loss) income to net cash flows from operating activities: | | | | | | | | | | | |
| Net (loss) income | | | $ | (23,800 | ) | $ | (46,800 | ) | $ | 54,100 | |
| Adjustments to reconcile net (loss) income to net cash flows provided by (used in) operating activities: | | | | | | | | | | | |
| | Net depreciation, amortization and accretion | | | | 6,842 | | | 5,588 | | | 8,369 | |
| | Realized gain on sale of CalFarm Insurance Company | 13 | | | | | | | | | (160,335 | ) |
| | Realized (gains) losses on investments | 2 | | | (9,169 | ) | | 15,467 | | | (7,682 | ) |
| | Net proceeds from sales of trading portfolio investments | | | | 3,000 | | | | | | | |
| | Decrease (increase) in: | | | | | | | | | | | |
| | | | Premiums receivable | | | | (10,418 | ) | | (1,819 | ) | | 22,528 | |
| | | | Receivable from reinsurers and state trust funds for paid and unpaid losses | | | | 41,562 | | | 36,184 | | | 44,507 | |
| | | | Real estate construction in progress and land held for development | | | | (1,271 | ) | | (4,408 | ) | | (20,041 | ) |
| | Increase (decrease) in: | | | | | | | | | | | |
| | | | Unpaid loss and loss adjustment expenses | | | | 68,939 | | | (3,046 | ) | | 8,823 | |
| | | | Unearned premiums | | | | 12,406 | | | 8,001 | | | (16,095 | ) |
| | | | Policyholders' dividends accrued | | | | 543 | | | (602 | ) | | (1,388 | ) |
| | | | Federal income tax | 5 | | | 1,673 | | | (48,136 | ) | | 31,062 | |
| | | | Other | | | | (5,700 | ) | | (7,467 | ) | | (15,430 | ) |
| |
| Net cash provided by (used in) operating activities | | | $ | 84,607 | | $ | (47,038 | ) | $ | (51,582 | ) |
| |
The accompanying notes are an integral part of this statement.
45
CONSOLIDATED STATEMENT OF STOCKHOLDERS' EQUITY
Zenith National Insurance Corp. and Subsidiaries
|
|---|
Three years ended December 31, 2001
| | Note(s)
| | Common
shares
outstanding
| | Preferred
stock $1 par
|
|---|
|
| (Dollars and shares in thousands, except per share data) | | | | | | |
| Balance at December 31, 1998 | | | | 17,148 | | |
| Net income for 1999 | | | | | | |
| Other comprehensive loss — net unrealized depreciation on investments, net of deferred tax benefit of $15,935 | | 2 | | | | |
| | | | | | | |
| Comprehensive income | | | | | | |
| Exercise of stock options | | 16 | | 187 | | |
| Tax benefit on options exercised in 1999 | | | | | | |
| Purchase of treasury shares at cost | | 16 | | (185 | ) | |
| Cash dividends declared to common stockholders ($1.00 per share, paid quarterly) | | | | | | |
|
| Balance at December 31, 1999 | | | | 17,150 | | |
| Net loss for 2000 | | | | | | |
| Other comprehensive income — net unrealized appreciation on investments, net of deferred tax expense of $6,349 | | 2 | | | | |
| | | | | | | |
| Comprehensive loss | | | | | | |
| Exercise of stock options | | 16 | | 295 | | |
| Tax benefit on options exercised in 2000 | | | | | | |
| Purchase of treasury shares at cost | | 16 | | (2 | ) | |
| Cash dividends declared to common stockholders ($1.00 per share, paid quarterly) | | | | | | |
|
| Balance at December 31, 2000 | | | | 17,443 | | |
| Net loss for 2001 | | | | | | |
| Other comprehensive income — net unrealized appreciation on investments, net of deferred tax expense of $3,468 | | 2 | | | | |
| | | | | | | |
| Comprehensive loss | | | | | | |
| Exercise of stock options | | 16 | | 119 | | |
| Tax benefit on options exercised in 2001 | | | | | | |
| Purchase of treasury shares at cost | | 16 | | (9 | ) | |
| Sale of treasury shares | | 16 | | 1,000 | | |
| Cash dividends declared to common stockholders ($1.00 per share, paid quarterly) | | | | | | |
|
| Balance at December 31, 2001 | | | | 18,553 | | |
|
The accompanying notes are an integral part of this statement.
46
|
| |
|---|
Three years ended December 31, 2001
| Common
stock $1 par
| | Additional
paid-in capital
| | Retained
earnings
| | Accumulated other
comprehensive
income (loss)(1)
| | Treasury
stock
| | Total
| |
|---|
| |
| (Dollars and shares in thousands, except per share data) | | | | | | | | | | | | | | | | | | |
| Balance at December 31, 1998 | $ | 24,970 | | $ | 270,679 | | $ | 188,243 | | $ | 9,596 | | $ | (146,536 | ) | $ | 346,952 | |
| Net income for 1999 | | | | | | | | 54,100 | | | | | | | | | 54,100 | |
| Other comprehensive loss — net unrealized depreciation on investments, net of deferred tax benefit of $15,935 | | | | | | | | | | | (29,594 | ) | | | | | (29,594 | ) |
| | | | | | | | | | | | | | | | | |
| |
| Comprehensive income | | | | | | | | | | | | | | | | | 24,506 | |
| Exercise of stock options | | 187 | | | 4,135 | | | | | | | | | | | | 4,322 | |
| Tax benefit on options exercised in 1999 | | | | | 83 | | | | | | | | | | | | 83 | |
| Purchase of treasury shares at cost | | | | | | | | | | | | | | (4,190 | ) | | (4,190 | ) |
| Cash dividends declared to common stockholders ($1.00 per share, paid quarterly) | | | | | | | | (17,114 | ) | | | | | | | | (17,114 | ) |
| |
| Balance at December 31, 1999 | | 25,157 | | | 274,897 | | | 225,229 | | | (19,998 | ) | | (150,726 | ) | | 354,559 | |
| Net loss for 2000 | | | | | | | | (46,800 | ) | | | | | | | | (46,800 | ) |
| Other comprehensive income — net unrealized appreciation on investments, net of deferred tax expense of $6,349 | | | | | | | | | | | 11,792 | | | | | | 11,792 | |
| | | | | | | | | | | | | | | | | |
| |
| Comprehensive loss | | | | | | | | | | | | | | | | | (35,008 | ) |
| Exercise of stock options | | 295 | | | 6,951 | | | | | | | | | | | | 7,246 | |
| Tax benefit on options exercised in 2000 | | | | | 272 | | | | | | | | | | | | 272 | |
| Purchase of treasury shares at cost | | | | | | | | | | | | | | (38 | ) | | (38 | ) |
| Cash dividends declared to common stockholders ($1.00 per share, paid quarterly) | | | | | | | | (17,255 | ) | | | | | | | | (17,255 | ) |
| |
| Balance at December 31, 2000 | | 25,452 | | | 282,120 | | | 161,174 | | | (8,206 | ) | | (150,764 | ) | | 309,776 | |
| Net loss for 2001 | | | | | | | | (23,800 | ) | | | | | | | | (23,800 | ) |
| Other comprehensive income — net unrealized appreciation on investments, net of deferred tax expense of $3,468 | | | | | | | | | | | 6,440 | | | | | | 6,440 | |
| | | | | | | | | | | | | | | | | |
| |
| Comprehensive loss | | | | | | | | | | | | | | | | | (17,360 | ) |
| Exercise of stock options | | 119 | | | 2,903 | | | | | | | | | | | | 3,022 | |
| Tax benefit on options exercised in 2001 | | | | | 154 | | | | | | | | | | | | 154 | |
| Purchase of treasury shares at cost | | | | | | | | | | | | | | (207 | ) | | (207 | ) |
| Sale of treasury shares | | | | | 6,171 | | | | | | | | | 18,829 | | | 25,000 | |
| Cash dividends declared to common stockholders ($1.00 per share, paid quarterly) | | | | | | | | (17,774 | ) | | | | | | | | (17,774 | ) |
| |
| Balance at December 31, 2001 | $ | 25,571 | | $ | 291,348 | | $ | 119,600 | | $ | (1,766 | ) | $ | (132,142 | ) | $ | 302,611 | |
| |
(1) |
|
Net unrealized appreciation (depreciation) on investments
|
47
NOTES TO CONSOLIDATED FINANCIAL STATEMENTS
ZENITH NATIONAL INSURANCE CORP. AND SUBSIDIARIES
NOTE 1
Summary of Accounting Policies, Operations and Principles of Consolidation
The financial statements have been prepared in accordance with generally accepted accounting principles ("GAAP") in the United States and include Zenith National Insurance Corp. ("Zenith National") and its subsidiaries (collectively, "Zenith"). All significant intercompany transactions and balances have been eliminated in consolidation. Zenith National is engaged through its wholly-owned property-casualty insurance subsidiaries (the "P&C Operations") in Workers' Compensation insurance, Reinsurance and (through March 31, 1999) Other Property-Casualty insurance (see Note 13). The P&C Operations sell insurance and reinsurance through agents and brokers and not directly to consumers. The P&C Operations are subject to regulation and supervision by the California and Texas Departments of Insurance. Zenith also conducts Real Estate, Investment and Parent operations. See Note 20 for a description of Zenith's business segments.
GAAP requires the use of assumptions and estimates in reporting certain assets and liabilities and related disclosures. Actual results could differ from those estimates.
The comparability of the results of operations in 1999 compared to 2000 and 2001 is affected by two significant items. First, in the third quarter of 1999, Zenith recorded net charges of $50.0 million before tax ($32.5 million after tax, or $1.89 per share) associated with an increase in the estimated net liabilities for unpaid losses and loss adjustment expenses acquired from RISCORP (the "RISCORP Purchase Adjustment"—for a full description of the RISCORP Purchase Adjustment, see Note 14). Second, effective March 31, 1999, Zenith Insurance Company ("Zenith Insurance"), a wholly owned subsidiary of Zenith National, sold CalFarm Insurance Company ("CalFarm") which had previously operated Zenith's Other Property-Casualty operations. The sale of CalFarm resulted in a gain of $104.3 million after tax (see Note 13).
Investments
Zenith's investments in debt and equity securities are identified in three categories as follows: held-to-maturity—those securities, which by their terms must be redeemed by the issuing company and that Zenith has the positive intent and ability to hold to maturity, and are reported at amortized cost; trading—those securities that are held principally for the purpose of selling in the near term and are reported at fair value with unrealized gains and losses included in earnings; and available-for-sale—those securities not classified as either held-to-maturity or trading and are reported at fair value with unrealized gains and losses excluded from earnings and reported as a separate component of stockholders' equity, net of deferred tax. Other investments are carried at cost.
Short-term investments include debt securities such as corporate, municipal and treasury securities with maturities of less than one year at the date of purchase. For these short-term investments, the amortized cost is a reasonable estimate of fair value. Investment income is recorded when earned. Realized capital gains and losses are calculated based on the cost of securities sold, which is determined by the "identified cost" method.
Cash
Cash includes currency on hand and demand deposits with financial institutions.
48
Recognition of Property-Casualty Revenue and Expense
Premiums are earned on a pro rata basis over the terms of the policies. Premiums applicable to the unexpired terms of policies in force are recorded as unearned premiums. Included with premiums earned is an estimate for earned but unbilled audit premiums. Workers' compensation premiums are determined based upon the payroll of the insured and applicable premium rates and are recorded as written when billed. Premiums for retrospectively-rated policies are also determined by the loss experience incurred by the policyholder.
Policy acquisition costs, consisting of commissions, premium taxes and certain other underwriting costs, are deferred and amortized as the related premiums are earned. A premium deficiency is recognized if the sum of expected claims costs, claims adjustment expenses, expected dividends to policyholders, unamortized acquisition costs and maintenance costs exceed the related unearned premiums. A premium deficiency would first be recognized by charging any unamortized acquisition costs to expense to the extent required to eliminate the deficiency. If the premium deficiency were greater than unamortized acquisition costs, a liability would be accrued for the excess deficiency. At December 31, 2001, deferred policy acquisition costs were $12.7 million and Zenith believes that there is no premium deficiency.
The P&C Operations make provisions for the settlement of all incurred claims, both reported and unreported. The liabilities for unpaid loss and loss adjustment expenses are estimates of the eventual costs of claims incurred but not settled, less estimates of salvage and subrogation. Estimates for reported claims are primarily determined by evaluation of individual reported claims and amounts reported by ceding companies. Estimates for claims incurred but not reported are based on experience with respect to the probable number and nature of such claims. The methods for making such estimates and for establishing the resulting liabilities are continually reviewed and updated and any adjustments resulting therefrom are reflected in earnings currently. Estimates of losses from environmental and asbestos-related claims are included in overall loss reserves and to date have not been material. Due to the significant uncertainties inherent in establishing such reserves, the ultimate exposure may vary from the amounts currently reserved.
An estimated provision for Workers' Compensation policyholders' dividends is accrued as the related premiums are earned. Such dividends do not become a fixed liability unless and until declared by the respective Boards of Directors of Zenith's insurance subsidiaries.
Insurance and reinsurance coverages expose Zenith to the risk of significant loss in the event of major loss events, known in the insurance industry as catastrophes. Catastrophes may cause significant contemporaneous financial statement losses since catastrophe losses may not be accrued in advance of the event. Underwriting losses in 2001 in the Reinsurance operations were attributable to losses incurred in connection with the terrorist attack on the World Trade Center on September 11, 2001. There is considerable uncertainty as to the nature and amount of monetary losses associated with the World Trade Center loss. Zenith has currently estimated its share of the World Trade Center loss to be $48.0 million before tax, both gross and net of reinsurance recoverable, by estimating the probable impact to each of its assumed reinsurance contracts based on currently available information. Approximately 70% of the loss is attributable to the contractual maximum loss payable by
49
Zenith under its excess of loss reinsurance contracts; the remainder of the estimated loss is an estimate of its expected loss incurred on assumed quota share reinsurance contracts. Customarily, after a claim, catastrophe reinsurance contracts are renewed for the unexpired term of the original contract and an additional premium, called a reinstatement premium, is due in consideration of the renewal. Zenith has also estimated such reinstatement premiums in connection with its estimate of the World Trade Center loss. The ultimate impact of the World Trade Center loss after deducting original and reinstatement premium income on Zenith's assumed reinsurance contracts for 2001 is estimated to be $20.0 million before tax, or $13.0 million after tax. Zenith has written its assumed reinsurance business so that its exposure to reinsurance losses from any one event in a worst-case scenario is not expected to be more than approximately 5% of Zenith's consolidated stockholders' equity; the expected ultimate loss of $13.0 million after tax is within that 5% maximum.
Approximately 49.5% and 22.3% of the premiums earned in the Workers' Compensation operations in 2001 was in California and Florida, respectively. The concentration of Zenith's business in these states makes the results of operations highly dependent upon the states' economies, social and cultural trends, legislative and regulatory changes, and catastrophic events such as windstorms and earthquakes.
Reinsurance
In accordance with general industry practices, the P&C Operations annually purchase, principally from large United States reinsurance companies, excess of loss reinsurance to protect Zenith against the impact of large, irregularly occurring losses. Such reinsurance reduces the magnitude of sudden and unpredictable changes in net income and the capitalization of the P&C Operations. Reinsurance makes the assuming reinsurer liable to the ceding company to the extent of the reinsurance. It does not, however, discharge the ceding company from its primary liability to its policyholders in the event the reinsurer is unable to meet its obligations under such reinsurance treaty. Zenith monitors the financial condition of its reinsurers and does not believe that it is exposed to any material credit risk through its ceded reinsurance arrangements other than in connection with Reliance Insurance Company ("Reliance"). Historically, no material amounts due from reinsurers have been written off as uncollectable, but in 2001, Zenith recognized an impairment for reinsurance recoverable from Reliance. Reinsurance recoverable from Reliance was acquired by Zenith from an acquisition in 1996 (see Note 15 for a complete description).
Earned premiums and loss and loss adjustment expenses incurred are stated in the Consolidated Statement of Operations after deduction of amounts ceded to reinsurers. Balances due from reinsurers on unpaid losses, including an estimate of such recoverables related to reserves for incurred but not reported losses, are reported as assets and are included in receivable from reinsurers even though amounts due on unpaid loss and loss adjustment expenses are not recoverable from the reinsurer until such losses are paid. Receivable from reinsurers on unpaid loss and loss adjustment expenses amounted to $221.5 million and $264.6 million at December 31, 2001 and 2000, respectively, of which approximately $142.6 million and $185.4 million, respectively, were reinsurance recoverables relating to reinsurance arrangements entered into by RISCORP and acquired by Zenith in the RISCORP Acquisition (see Note 14). Such RISCORP-related amounts are primarily recoverable from large United
50
States reinsurance companies. In connection with the RISCORP Acquisition, Zenith entered into an aggregate excess of loss reinsurance agreement which provides ceded reinsurance for unpaid losses assumed by Zenith from RISCORP up to $50.0 million in excess of $182.0 million. Also included in receivable from reinsurers on unpaid loss and loss adjustment expenses at December 31, 2001 is $35.2 million recoverable under such reinsurance. Amount receivable from reinsurers under such reinsurance, is secured by a trust account. The deferred benefit associated with such reinsurance was $12.1 million and $14.7 million at December 31, 2001 and 2000, respectively.
Real Estate Operations
Land, land development costs and construction costs, including costs of acquisition and development, property taxes and related interest, are capitalized. Such costs, and an estimate of the costs to complete a project, are recognized pro rata against sales of completed units. Such land and capitalized costs are included in other assets carried at a cost of $63.2 million and $61.1 million at December 31, 2001 and 2000, respectively. The profitability of the Real Estate operations is dependent upon real estate values, interest rates, construction costs, competition and management ability.
Properties and Equipment
Properties and equipment are stated at cost less accumulated depreciation. Depreciation is calculated on a straight-line basis using the following useful lives: buildings, 10 to 40 years; and furniture, fixtures and equipment, 3 to 10 years.
Expenditures for maintenance and repairs are charged to operations as incurred. Additions and improvements to buildings and other fixed assets are capitalized and depreciated over the useful lives of the properties and equipment. Upon disposition, the asset cost and related depreciation are removed from the accounts and the resulting gain or loss is included in income.
Intangible Assets
Intangible assets consist of the costs in excess of tangible assets acquired. The amounts assigned to assets acquired since 1970 were, through December 31, 2001, being amortized on a straight-line basis over 25 years. Amortization expense was $0.9 million, $0.8 million and $0.9 million in 2001, 2000 and 1999, respectively. Accumulated amortization was $3.6 million and $2.7 million at December 31, 2001 and 2000, respectively. Of the intangible assets at December 31, 2001 and 2000, $19.5 million and $20.4 million, respectively, were amortizable. Management periodically assesses the recoverability of these intangible assets based on a review of projected, undiscounted cash flows of the operations acquired. See Recently Issued Accounting Standards for a discussion of accounting for intangible assets effective January 1, 2002.
Recently Issued Accounting Standards
On July 20, 2001, the Financial Accounting Standards Board issued Statement of Financial Accounting Standards No. 141 ("SFAS No. 141"), "Business Combinations." The significant changes of SFAS No. 141 on the accounting for business combinations are (a) it requires the application of the purchase method of accounting and (b) it sets forth specific criteria for the recognition of intangible assets and goodwill resulting from the allocation of the purchase price. Goodwill and intangible assets recognized in a business combination are to be accounted for in accordance with Statement of Financial Accounting Standards No. 142 ("SFAS No. 142"), "Goodwill and Other Intangible Assets", discussed below. SFAS No. 141 is to be applied to all business combinations initiated
51
after September 30, 2001 and all business combinations accounted for using the purchase method for which the date of acquisition is July 1, 2001 or later.
On July 20, 2001, the Financial Accounting Standards Board issued SFAS No. 142, which addresses the accounting for goodwill and other intangible assets. Under SFAS No. 142, goodwill and intangible assets with indefinite lives are no longer amortized and other intangible assets are amortized over their useful lives (which may exceed forty years). The new standard also requires that goodwill and intangible assets with indefinite lives be tested for impairment at least annually and sets forth criteria for recognition and measurement of impairment. SFAS No. 142 is required to be applied for all fiscal years beginning after December 15, 2001 and will be adopted by Zenith effective January 1, 2002, applicable to all goodwill and other intangibles recognized in its financial statements at that date. The unamortized carrying value of goodwill from Zenith's previous acquisitions was $21.5 million at December 31, 2001. Zenith has evaluated this goodwill for impairment at January 1, 2002 in accordance with SFAS No. 142 and it was determined not to be impaired at that date. Effective January 1, 2002, amortization expense for goodwill, which amounted to $0.9 million in 2001, will no longer be recorded.
NOTE 2
Investments
The amortized cost and fair values of investments were as follows:
|
|---|
|
| | Gross unrealized
| |
| |
|
|---|
December 31, 2001
(Dollars in thousands)
| Amortized
cost
| | Fair
value
| | Carrying value
|
|---|
| | gains
| | (losses)
|
|---|
|
|---|
| Held-to-maturity: | | | | | | | | | | | | | | |
| | Corporate debt | $ | 5,314 | | $ | 275 | | | | | $ | 5,589 | | $ | 5,314 |
| | Mortgage-backed | | 23,279 | | | 416 | | | | | | 23,695 | | | 23,279 |
|
| Total held-to-maturity | $ | 28,593 | | $ | 691 | | | | | $ | 29,284 | | $ | 28,593 |
|
| Available-for-sale: | | | | | | | | | | | | | | |
| | U.S. government debt | $ | 143,311 | | $ | 389 | | $ | (873 | ) | $ | 142,827 | | $ | 142,827 |
| | State and local government debt | | 9,781 | | | 91 | | | (119 | ) | | 9,753 | | | 9,753 |
| | Corporate debt | | 497,689 | | | 8,571 | | | (9,134 | ) | | 497,126 | | | 497,126 |
| | Mortgage-backed | | 22,163 | | | 168 | | | (77 | ) | | 22,254 | | | 22,254 |
| | Redeemable preferred stocks | | 27,023 | | | 17 | | | (334 | ) | | 26,706 | | | 26,706 |
| | Equities | | 41,698 | | | 1,715 | | | (3,131 | ) | | 40,282 | | | 40,282 |
| | Short-term investments | | 119,066 | | | | | | | | | 119,066 | | | 119,066 |
|
Total available-
for-sale | $ | 860,731 | | $ | 10,951 | | $ | (13,668 | ) | $ | 858,014 | | $ | 858,014 |
|
|
|---|
|
| | Gross unrealized
| |
| |
|
|---|
December 31, 2000
(Dollars in thousands)
| Amortized
cost
| | Fair
value
| | Carrying value
|
|---|
| | gains
| | (losses)
|
|---|
|
|---|
| Held-to-maturity: | | | | | | | | | | | | | | |
| | Corporate debt | $ | 5,320 | | $ | 95 | | | | | $ | 5,415 | | $ | 5,320 |
| | Mortgage-backed | | 19,203 | | | 273 | | | | | | 19,476 | | | 19,203 |
|
| Total held-to-maturity | $ | 24,523 | | $ | 368 | | | | | $ | 24,891 | | $ | 24,523 |
|
| Available-for-sale: | | | | | | | | | | | | | | |
| | U.S. government debt | $ | 128,423 | | $ | 346 | | $ | (63 | ) | $ | 128,706 | | $ | 128,706 |
| | State and local government debt | | 14,170 | | | | | | (90 | ) | | 14,080 | | | 14,080 |
| | Corporate debt | | 402,523 | | | 2,758 | | | (16,932 | ) | | 388,349 | | | 388,349 |
| | Mortgage-backed | | 23,598 | | | | | | (4 | ) | | 23,594 | | | 23,594 |
| | Redeemable preferred stocks | | 13,644 | | | | | | (892 | ) | | 12,752 | | | 12,752 |
| | Equities | | 34,137 | | | 5,307 | | | (3,055 | ) | | 36,389 | | | 36,389 |
| | Short-term investments | | 158,438 | | | | | | | | | 158,438 | | | 158,438 |
|
Total available-
for-sale | $ | 774,933 | | $ | 8,411 | | $ | (21,036 | ) | $ | 762,308 | | $ | 762,308 |
|
| Trading: | | | | | | | | | | | | | | |
| | Corporate debt | $ | 2,993 | | | | | $ | (23 | ) | $ | 2,970 | | $ | 2,970 |
| | Equities | | 25 | | | | | | (23 | ) | | 2 | | | 2 |
|
| Total trading | $ | 3,018 | | | | | $ | (46 | ) | $ | 2,972 | | $ | 2,972 |
|
52
Debt securities, including short-term investments, by contractual maturity were as follows:
|
|---|
December 31, 2001
(Dollars in thousands)
| | Amortized
cost
| | Fair
value
|
|---|
|
|---|
| Held-to-maturity: | | | | | | |
| | Due after one year through five years | | $ | 13,323 | | $ | 13,651 |
| | Due after five years through ten years | | | 9,956 | | | 10,044 |
| | Due after ten years | | | 5,314 | | | 5,589 |
|
| | | $ | 28,593 | | $ | 29,284 |
|
| Available-for-sale: | | | | | | |
| | Due in one year or less | | $ | 163,022 | | $ | 163,599 |
| | Due after one year through five years | | | 331,727 | | | 332,936 |
| | Due after five years through ten years | | | 215,298 | | | 213,299 |
| | Due after ten years | | | 108,986 | | | 107,898 |
|
| | | $ | 819,033 | | $ | 817,732 |
|
Fluctuating interest rates will impact stockholders' equity, profitability and maturities of certain debt and preferred securities. Expected maturities may differ from contractual maturities because borrowers may have the right to call or prepay obligations with or without call or prepayment penalties. Mortgage-backed securities are shown as being due at their average expected maturity dates.
When, in the opinion of management, a decline in the fair value of an investment is considered to be "other than temporary," such investment is written down to its fair value. The determination of "other than temporary" includes, in addition to other relevant factors, a presumption that if the market value is below cost by a significant amount for a period of time, a write down is necessary. Such write downs are reflected as a reduction of net realized gains on investments. During the years ended December 31, 2001, 2000 and 1999, there were $12.7 million, $22.5 million and $1.7 million, respectively, of such write downs.
The gross realized gains on sales of investments classified as available-for-sale during 2001, 2000 and 1999 were $20.6 million, $8.7 million and $8.2 million, respectively, and the gross realized losses were $5.3 million, $2.4 million and $5.5 million, respectively. The change in net unrealized holding (losses) gains on trading securities, which is included in realized gains, was $46,000, $10,000 and $(96,000) for the years ended December 31, 2001, 2000 and 1999, respectively.
At December 31, 2001 and 2000, 97% and 96% of Zenith's consolidated portfolio of fixed maturity investments were classified as available-for-sale with the unrealized appreciation or depreciation recorded as a separate component of stockholders' equity. The change in fair value of fixed maturity investments classified as available-for-sale resulted in an increase in stockholders' equity of $8.8 million after deferred tax from December 31, 2000 to December 31, 2001, compared to an increase of $9.6 million from December 31, 1999 to December 31, 2000.
Realized and unrealized investment gains and losses on fixed maturity investments and equity securities are summarized as follows:
| |
|---|
Years ended December 31,
(Dollars in thousands)
| 2001
| | 2000
| | 1999
| |
|---|
| |
|---|
| Realized gains (losses): | | | | | | | | | |
| | Fixed maturities | $ | 753 | | $ | (19,063 | ) | $ | (503 | ) |
| | Equity securities | | 3,716 | | | 2,733 | | | 3,059 | |
| Change in fair value over (under) cost: | | | | | | | | | |
| | Fixed maturities | | 13,922 | | | 15,562 | | | (41,549 | ) |
| | Equity securities | | (3,645 | ) | | 3,297 | | | (5,984 | ) |
| |
53
Net investment income is detailed as follows:
| |
|---|
Years ended December 31,
(Dollars in thousands)
| 2001
| | 2000
| | 1999
| |
|---|
| |
|---|
| Fixed maturities: | | | | | | | | | |
| | Bonds | $ | 41,892 | | $ | 43,415 | | $ | 45,080 | |
| | Redeemable preferred stocks | | 2,086 | | | 1,165 | | | 1,362 | |
| Equity securities: | | | | | | | | | |
| | Floating rate preferred stocks | | 401 | | | 401 | | | 777 | |
| | Convertible and non-redeemable preferred stocks | | 256 | | | 254 | | | 350 | |
| | Common stocks | | 807 | | | 862 | | | 984 | |
| Short-term investments | | 6,973 | | | 9,355 | | | 8,327 | |
| Other | | 2,977 | | | 677 | | | 756 | |
| |
| Subtotal | | 55,392 | | | 56,129 | | | 57,636 | |
| Investment expenses | | (4,214 | ) | | (4,363 | ) | | (3,974 | ) |
| |
| Net investment income | $ | 51,178 | | $ | 51,766 | | $ | 53,662 | |
| |
Investments carried at their fair value of $270.8 million and $235.9 million at December 31, 2001 and 2000, respectively, were on deposit with regulatory authorities in compliance with insurance company regulations.
NOTE 3
Fair Values of Financial Instruments
Financial instruments are contractual obligations that result in the delivery of cash or an ownership interest in an entity. Disclosures regarding the fair value of financial instruments have been derived using external market sources or estimates using present value and other valuation techniques.
The following summarizes the carrying amounts and fair value of Zenith's financial instruments. For financial instruments not discussed below, the carrying amount is a reasonable estimate of the fair value.
|
|---|
December 31,
| | 2001
| | 2000
|
|---|
(Dollars in thousands)
| | Note
| | Carrying
value
| | Fair
value
| | Carrying
value
| | Fair
value
|
|---|
|
|---|
| Assets: | | | | | | | | | | | | | | |
| Investments: | | | | | | | | | | | | | | |
| | Trading securities | | 2 | | | | | | | | $ | 2,972 | | $ | 2,972 |
| | Other investments | | 2 | | $ | 944,697 | | $ | 945,388 | | | 849,762 | | | 850,130 |
| | | | |
| |
| |
| |
|
| | | | | | 944,697 | | | 945,388 | | | 852,734 | | | 853,102 |
| Liabilities: | | | | | | | | | | | | | | |
| Payable to banks | | 7 | | | 16,186 | | | 16,186 | | | 15,674 | | | 15,674 |
| Senior notes payable | | 8 | | | 57,203 | | | 57,203 | | | 58,374 | | | 58,374 |
| Redeemable securities | | 10 | | | 65,669 | | | 47,244 | | | 65,618 | | | 45,518 |
|
Fair values of investments are further detailed in Note 2.
The fair values for investments are determined using bond prices obtained from Merrill Lynch Securities Pricing Service and equity prices obtained from Muller Data, with exceptions obtained from Bloomberg financial news service and various broker-dealers.
NOTE 4
Properties and Equipment
Properties and equipment consist of the following:
| |
|---|
December 31,
(Dollars in thousands)
| | 2001
| | 2000
| |
|---|
| |
|---|
| Land | | $ | 9,650 | | $ | 9,650 | |
| Buildings | | | 32,732 | | | 31,751 | |
| Furniture, fixtures and equipment | | | 48,622 | | | 46,688 | |
| |
| Subtotal | | | 91,004 | | | 88,089 | |
| Accumulated depreciation | | | (41,812 | ) | | (38,262 | ) |
| |
| Total | | $ | 49,192 | | $ | 49,827 | |
| |
Depreciation expense was $7.1 million, $7.8 million and $9.9 million in the years ended December 31, 2001, 2000 and 1999, respectively.
54
NOTE 5
Federal Income Tax
The components of the (benefit) provision for tax on income are:
| |
|---|
Years ended December 31,
(Dollars in thousands)
| | 2001
| | 2000
| | 1999
| |
|---|
| |
|---|
| Current | | $ | (8,868 | ) | $ | (18,007 | ) | $ | 29,488 | |
| Deferred | | | (2,871 | ) | | (6,509 | ) | | (521 | ) |
| |
Federal income tax
(benefit) expense | | $ | (11,739 | ) | $ | (24,516 | ) | $ | 28,967 | |
| |
The difference between the statutory federal income tax rate of 35% and Zenith's effective tax rate on income, as reflected in the financial statements, is explained as follows:
| |
|---|
Years ended December 31,
(Dollars in thousands)
| | 2001
| | 2000
| | 1999
| |
|---|
| |
|---|
| Statutory federal income tax (benefit) expense | | $ | (12,439 | ) | $ | (25,308 | ) | $ | 29,074 | |
| Increase (reduction) in tax: | | | | | | | | | | |
| | Dividend received
deduction and tax-exempt interest | | | (576 | ) | | (596 | ) | | (765 | ) |
| | Non-deductible expenses and other | | | 1,276 | | | 1,388 | | | 658 | |
| |
Federal income tax
(benefit) expense | | $ | (11,739 | ) | $ | (24,516 | ) | $ | 28,967 | |
| |
Deferred tax is provided based upon temporary differences between the tax and book basis of assets and liabilities. The components of the deferred tax assets and liabilities were as follows:
|
|---|
| | 2001
Deferred Tax
| | 2000
Deferred Tax
|
|---|
Years ended December 31,
(Dollars in thousands)
|
|---|
| | Assets
| | Liabilities
| | Assets
| | Liabilities
|
|---|
|
|---|
| Investments | | $ | 7,085 | | | | | $ | 12,701 | | | |
| Deferred policy acquisition costs | | | | | $ | 4,438 | | | | | $ | 3,609 |
| Intangible assets | | | | | | 2,083 | | | | | | 2,199 |
| Properties and equipment | | | | | | 3,625 | | | | | | 3,742 |
| Unpaid loss and loss adjustment expenses discount | | | 33,306 | | | | | | 26,501 | | | |
| Limitation on deduction for unearned premiums | | | 5,114 | | | | | | 4,583 | | | |
| Policyholders' dividends accrued | | | 1,161 | | | | | | 971 | | | |
| Deferred income on retroactive reinsurance | | | 4,218 | | | | | | 5,131 | | | |
| Other | | | 4,131 | | | 10,343 | | | 1,686 | | | 6,900 |
|
| | | | 55,015 | | | 20,489 | | | 51,573 | | | 16,450 |
|
| Net deferred tax asset | | $ | 34,526 | | | | | $ | 35,123 | | | |
|
Zenith's net deferred tax asset is expected to be fully recoverable because all future deductible amounts can be offset by reversing deferred tax liabilities, recovery of federal income taxes paid within the statutory carryback period or anticipated future taxable income, including investment income. Property-casualty loss reserves are not discounted for book purposes, however the Tax Reform Act of 1986 requires property and casualty loss reserves to be discounted for tax purposes.
Zenith files a consolidated federal income tax return. The P&C Operations pay premium taxes on gross premiums written in lieu of most state income or franchise taxes.
55
NOTE 6
Liability for Unpaid Loss and Loss Adjustment Expenses
The following table represents a reconciliation of changes in the liability for unpaid loss and loss adjustment expenses:
| |
|---|
Years ended December 31,
(Dollars in thousands)
| | 2001
| | 2000
| | 1999
| |
|---|
| |
|---|
| Beginning of year, net of receivable from reinsurers | | $ | 634,172 | | $ | 605,250 | | $ | 708,684 | |
| Sale of CalFarm | | | | | | | | | (109,150 | ) |
| Incurred claims: | | | | | | | | | | |
| | Current year | | | 427,943 | | | 306,082 | | | 315,348 | |
| | Prior years | | | 4,347 | | | 30,880 | | | 44,824 | |
| |
| | Total incurred claims | | | 432,290 | | | 336,962 | | | 360,172 | |
| |
| Payments: | | | | | | | | | | |
| | Current year | | | (80,278 | ) | | (72,072 | ) | | (83,437 | ) |
| | Prior years | | | (243,506 | ) | | (235,968 | ) | | (271,019 | ) |
| |
| Total payments | | | (323,784 | ) | | (308,040 | ) | | (354,456 | ) |
| |
| End of year, net of receivable from reinsurers | | | 742,678 | | | 634,172 | | | 605,250 | |
| Receivable from reinsurers and state trust funds for paid and unpaid losses | | | 204,144 | | | 243,711 | | | 275,679 | |
| |
| End of year | | $ | 946,822 | | $ | 877,883 | | $ | 880,929 | |
| |
Adverse development in 2001 on the reserves established at December 31, 2000 and adverse development in 2000 on the reserves established at December 31, 1999 is attributable, principally, to additional estimates of 1999 catastrophe losses. Adverse development in 1999 on the reserves established at December 31, 1998 is attributable, principally, to an increase in the reserves acquired from RISCORP (see Note 14).
NOTE 7
Payable to Banks
At December 31, 2001, Zenith National had two revolving, unsecured lines of credit in an aggregate amount of $70.0 million, all of which was available at December 31, 2001. Under these agreements, certain restrictive covenants apply including the maintenance of certain financial ratios.
The Real Estate operations maintain a $50.0 million secured revolving credit facility from a bank ("Bank Line"), which it uses primarily for funding infrastructure development and home construction. No more than $20.0 million of the Bank Line may be outstanding for infrastructure development; there is no similar limitation on the use of the line for home construction. The bank's prior approval is required for any funding before draws may be taken. In addition to monthly interest payments, the maintenance of specified loan to value ratios, and principal curtailments under certain circumstances, the Bank Line requires the Real Estate operations to not exceed a prescribed leverage ratio and to maintain minimum interest coverage and minimum adjusted working capital. At December 31, 2001, the Real Estate operations were in compliance with all such requirements. Loans under the Bank Line bear interest at the prime rate plus 0.5%, resulting in interest on outstanding Bank Line loans at December 31, 2001 of 5.3%.
Funding for project infrastructure development precedes the funding of home construction in that project. A prescribed portion of the first construction draw for each home must be used to repay the infrastructure development funding. Repayment of funding for infrastructure development is due the earlier of two years from the date the funding was approved or upon the termination date of the Bank Line. Repayment of all construction draws for each home must be made the earlier of one year from the initial construction draw for that home or upon the termination date of the Bank Line. The Bank Line is for a renewable twelve month term but upon termination will be extended for twenty four months, during which time period the Real Estate operations may only draw funds previously approved, as well as, subject to certain limitations, request funding for constructing pre-sold homes.
56
At December 31, 2001, $16.2 million was outstanding under the Bank Line.
Zenith National also finances the land acquisitions of its Real Estate operations through inter-company loans. At December 31, 2001 Zenith National had $28.6 million of principal and accrued interest outstanding under such loans.
NOTE 8
Senior Notes Payable
Zenith National had $57.2 million and $58.5 million outstanding of the $75.0 million issued of its 9% Senior Notes due 2002 (the "9% Notes") at December 31, 2001 and 2000, respectively (see Note 11). Interest on the 9% Notes is payable semi-annually. The 9% Notes are general unsecured obligations of Zenith National. Issue costs of $1.2 million are being amortized over the term of the 9% Notes. In the years ended December 31, 2001, 2000 and 1999, $5.3 million, $5.8 million and $6.9 million, respectively, of interest and issue costs were expended. Covenants contained in the indenture include restrictions on the ability of Zenith National to incur secured debt and the right of holders of the 9% Notes to require Zenith National to repurchase the 9% Notes upon a decline in the rating of the 9% Notes within ninety days after the occurrence of certain events. Those events are: (a) a person or group becomes the beneficial owner of more than 50% of Zenith National common stock; (b) 10% or more of Zenith National common stock is acquired by Zenith National within any 12-month period; or (c) the sum of the fair market value of distributions (other than regular dividends or distributions of capital stock) and the consideration for purchases of Zenith National common stock by Zenith National during a 12-month period is 30% or more of the fair market value of outstanding Zenith National common stock.
NOTE 9
Interest Incurred
Interest incurred on borrowings was as follows:
|
|---|
Years ended December 31,
(Dollars in thousands)
| | 2001
| | 2000
| | 1999
|
|---|
|
|---|
| Interest capitalized for Real Estate operations | | $ | 5,230 | | $ | 8,364 | | $ | 7,048 |
| Interest expense not related to Real Estate operations | | | 7,576 | | | 5,640 | | | 8,218 |
|
| Total interest incurred | | $ | 12,806 | | $ | 14,004 | | $ | 15,266 |
|
NOTE 10
Redeemable Securities
Zenith National Insurance Capital Trust I, a Delaware statutory business trust (the "Trust"), all of the voting securities of which are owned by Zenith National, had $67.0 million outstanding of the $75.0 million issued of its 8.55% Capital Securities at December 31, 2001 and 2000 (see Note 11). The Capital Securities pay semi-annual cumulative cash distributions at the annual rate of 8.55% of the $1,000 liquidation amount per security.
The Trust had invested $77.3 million in Zenith National's 8.55% Subordinated Deferrable Interest Debentures due 2028 (the "Subordinated Debentures") at December 31, 2001 and 2000, which constitute the principal asset of the Trust. The semi-annual interest payments on the Subordinated Debentures may be deferred by Zenith National for up to ten consecutive semi-annual periods. The Subordinated Debentures are redeemable at any time by Zenith National at the then present value of the remaining scheduled payments of principal and interest. Payments on the Capital Securities, including distributions and redemptions, follow those of the Subordinated Debentures. Zenith National fully and unconditionally guaranteed the distributions on, and the liquidation amount
57
generally of, the Capital Securities to the extent the Trust has funds legally available therefor. Zenith National's guarantee of the Capital Securities, as well as the Subordinated Debentures, are subordinated to all other indebtedness of Zenith National.
The issue cost and discount on the Subordinated Debentures of $1.7 million are being amortized over the term of the Subordinated Debentures. During the years ended December 31, 2001, 2000 and 1999, $5.8 million, $5.9 million and $6.5 million, respectively, of interest, issue costs and discount were expensed.
NOTE 11
Extraordinary Item—Gain on Extinguishment of Debt
In 2000, Zenith National paid $22.8 million to repurchase $16.5 million aggregate principal amount of the outstanding 9% Notes and $8.0 million aggregate liquidation amount of the outstanding 8.55% Capital Securities. The repurchases resulted in an extraordinary gain before tax of $1.5 million. In 2001, Zenith National paid $1.3 million to repurchase $1.3 million aggregate principal amount of the outstanding 9% Notes. Zenith National used its available cash balances to fund these purchases.
NOTE 12
Reinsurance
Reinsurance transactions reflected in the financial statements were as follows:
| |
|---|
Years ended December 31,
(Dollars in thousands)
| | 2001
| | 2000
| | 1999
| |
|---|
| |
|---|
| Direct premiums earned | | $ | 427,331 | | $ | 307,514 | | $ | 345,085 | |
| Assumed premiums earned | | | 63,975 | | | 41,848 | | | 40,667 | |
| Ceded premiums earned | | | (14,430 | ) | | (10,610 | ) | | (16,349 | ) |
| |
| Net premiums earned | | $ | 476,876 | | $ | 338,752 | | $ | 369,403 | |
| |
| Ceded loss and loss adjustment expenses incurred | | $ | 5,728 | | $ | 8,186 | | $ | 58,948 | |
| |
Zenith Insurance (in its Workers' Compensation operations) maintains excess of loss and catastrophe reinsurance protection, which varies based on the type of coverage, as follows: excess of loss reinsurance per occurrence in excess of $0.6 million ($0.8 million in 2002) up to $60.0 million. Catastrophe reinsurance coverage provides additional coverage against aggregate losses per event up to $100.0 million (only 50% of this coverage was renewed in 2002).
Effective January 1, 2002, consistent with industry practice in the aftermath of the events of September 11, 2001, losses arising from acts of terrorism were excluded from the coverage by many of the reinsurers participating in Zenith's ceded reinsurance arrangements. However, Zenith has purchased protection covering up to $9.0 million, per occurrence or in the aggregate and in excess of $1.0 million, of losses arising out of terrorist acts for 2002.
Effective January 1, 2002, losses from acts of terrorism are excluded from the coverage provided by Zenith's assumed reinsurance contracts.
58
NOTE 13
Sale of CalFarm Insurance Company
Effective March 31, 1999, Zenith Insurance completed the sale of CalFarm for $273.0 million in cash to Nationwide Mutual Insurance Company. CalFarm wrote Zenith's Other Property-Casualty business, principally in California. The gain on the sale after tax was $104.3 million. After accounting for applicable taxes, expenses and certain intercompany transactions, the net proceeds from the sale that were available to Zenith Insurance for investment were $211.0 million, compared to cash and investments of $226.4 million that were excluded from Zenith's Consolidated Balance Sheet upon the sale of CalFarm.
NOTE 14
RISCORP Acquisition and the RISCORP Purchase Adjustment
On April 1, 1998, pursuant to an Asset Purchase Agreement dated June 17, 1997 (as amended from time to time, the "Asset Purchase Agreement") between Zenith Insurance and RISCORP, Zenith Insurance acquired substantially all of the assets and certain liabilities of RISCORP related to RISCORP's workers' compensation business ("the RISCORP Acquisition"). The total purchase price for such acquired assets and liabilities was determined by a three-step process in which RISCORP and its external accounting and actuarial consultants and Zenith Insurance and its external accounting and actuarial consultants made and presented their estimates of the GAAP values of the assets and liabilities acquired by Zenith Insurance to an independent third-party, acting as a Neutral Auditor and Neutral Actuary. Such estimates varied considerably, particularly with respect to the value of premiums receivable and the liability for unpaid losses and loss adjustment expenses. On March 19, 1999, the Neutral Auditor and Neutral Actuary issued its report determining the disputes between the parties. Zenith Insurance recorded the assets and liabilities acquired from RISCORP at their estimated fair values consistent with the values determined by the Neutral Auditor and Neutral Actuary. Zenith Insurance indicated that any new information that might become available with respect to certain assets and liabilities acquired from RISCORP may change the estimates of the carrying values of such amounts and such changes, if any, would be reflected in the results of operations for the period in which they occur.
In October of 1999, Zenith Insurance completed a review of the liabilities for unpaid losses and loss adjustment expenses in its Southeast operations, which principally consists of the operations acquired from RISCORP. The review was conducted with assistance from independent actuarial consultants. As a result of the review, Zenith Insurance recorded, in the third quarter of 1999, the RISCORP Purchase Adjustment, which mainly comprises an increase in the estimated net liabilities for unpaid losses and loss adjustment expenses acquired from RISCORP and adjustments to the carrying values of certain related reinsurance receivables.
The RISCORP Purchase Adjustment reduced income by $50.0 million ($32.5 million after tax, or $1.89 per share) in 1999.
59
NOTE 15
Commitments and Contingent Liabilities
Zenith has office space leases, equipment leases and automobile leases expiring through 2006. The minimum rentals on these operating leases as of December 31, 2001 were as follows:
|
|---|
(Dollars in thousands)
Years
| | Equipment
and
auto fleet
| | Offices
| | Total
|
|---|
|
|---|
| 2002 | | $ | 991 | | $ | 3,198 | | $ | 4,189 |
| 2003 | | | 621 | | | 2,065 | | | 2,686 |
| 2004 | | | 259 | | | 1,634 | | | 1,893 |
| 2005 | | | 61 | | | 1,047 | | | 1,108 |
| 2006 | | | | | | 221 | | | 221 |
|
| Total | | $ | 1,932 | | $ | 8,165 | | $ | 10,097 |
|
Rental expenses for the years ended December 31, 2001, 2000 and 1999 amounted to $5.4 million, $5.2 million and $5.7 million, respectively.
Other than the RISCORP litigation described below, Zenith National and its subsidiaries are defendants in various other litigation. In the opinion of management, after consultation with legal counsel, such litigation is either without merit or the ultimate liability, if any, will not have a material adverse effect on the consolidated financial condition, results of operations or cash flows of Zenith.
RISCORP Litigation
Zenith Insurance and RISCORP entered into a settlement agreement dated July 7, 1999 (the "Settlement Agreement") providing for the resolution of certain claims arising out of the RISCORP Acquisition. Pursuant to the Settlement Agreement, Zenith Insurance and RISCORP agreed, among other things, that RISCORP may request that the Neutral Auditor and Neutral Actuary (a) review an alleged error concerning the proper treatment of certain reinsurance treaties in its determinations with respect to the purchase price for the RISCORP Acquisition, without waiving whatever rights RISCORP may have to litigation of such issue, (b) determine whether the issue was properly in dispute before the Neutral Auditor and Neutral Actuary and (c) if so, determine the merits of the issue and whether a correction is appropriate. Zenith Insurance and RISCORP also agreed that Zenith Insurance would receive $6.0 million from an escrow account established pursuant to the Asset Purchase Agreement, and RISCORP would receive the balance of the escrow account. In a submission made to the Neutral Auditor and Neutral Actuary, RISCORP claimed that the purchase price for the RISCORP Acquisition should be adjusted by either $5.9 million or $23.4 million as a result of alleged errors in the original determination of the Neutral Auditor and Neutral Actuary with respect to the purchase price. On October 7, 1999, the Neutral Auditor and Neutral Actuary informed Zenith Insurance and RISCORP that it would not consider the issue raised by RISCORP because the issue had not previously been raised as a dispute pursuant to the procedures set forth in the engagement letter. On January 13, 2000, RISCORP filed a complaint against Zenith Insurance and the Neutral Auditor and Neutral Actuary in the Superior Court of Fulton County in the State of Georgia. On October 9, 2000, RISCORP filed a First Amended Complaint in the Superior Court of Fulton County. RISCORP's First Amended Complaint alleges causes of action for breach of contract against the Neutral Auditor and Neutral Actuary and, in conjunction, seeks a declaration that would have the effect of requiring Zenith to pay either $18.1 million (and related charges) or $5.9 million. RISCORP also has asserted causes of action for professional negligence solely against the Neutral Auditor and Neutral Actuary in which it seeks damages of either $18.1 million (and related charges) or $5.9 million. On May 1, 2001, the Superior Court granted in their entirety motions for judgment on the pleadings filed by Zenith Insurance and
60
the Neutral Auditor and Neutral Actuary. The Georgia Court of Appeals rejected RISCORP's petition for expedited review of the Superior Court's decision pending a determination of counterclaims filed by Zenith Insurance and the Neutral Auditor and Neutral Actuary before the Superior Court. Zenith is unable to predict the outcome of this litigation.
Contingencies Surrounding the Order of Liquidation of Reliance Insurance Company
On October 3, 2001, the Commonwealth Court of Pennsylvania issued an Order of Liquidation for Reliance in response to a petition from the Pennsylvania Department of Insurance. At December 31, 2001, Reliance owed Zenith Insurance $6.0 million of reinsurance recoverable on paid and unpaid losses in connection with reinsurance arrangements assumed by Zenith Insurance in its 1996 acquisition of the Associated General Commerce Self-Insurers' Trust Fund. As of December 31, 2001, Zenith Insurance recorded a $3.0 million provision for impairment of the reinsurance recoverable from Reliance. Zenith Insurance cannot currently predict the ultimate outcome of this matter; but it is possible that if the Pennsylvania Department of Insurance increases its estimates of Reliance's unpaid liabilities or uncollectible reinsurance recoverables without considering any additional investment income, Zenith Insurance may not recover any of its reinsurance recoverable from Reliance.
State Guarantee Funds ("Guarantee Funds") exist to ensure that policyholders (holders of direct insurance polices but not of reinsurance policies) receive payment of their claims if insurance companies become insolvent. The Guarantee Funds are funded primarily by statutorily prescribed assessments they bill to other insurance companies doing business in their states. Various mechanisms exist in these states for assessed insurance companies to recover these assessments. Upon the Order of Liquidation of Reliance, the Guarantee Funds became primarily liable for the payment of Reliance's policyholder liabilities. The declaration of an insolvency establishes the presumption that assessments by the Guarantee Funds are probable. Zenith writes workers' compensation insurance in many of the states where Reliance has unpaid workers' compensation liabilities and expects to receive Guarantee Fund assessments, some of which may be based on certain of the premiums it has already earned at December 31, 2001. Accordingly, in the year ended December 31, 2001, Zenith recorded an estimate of $2.8 million (net of expected recoveries of $2.3 million recoverable before the end of 2002) for its expected additional liability at December 31, 2001 for Guarantee Fund assessments associated with the Reliance insolvency. This estimate is based on currently available information and could change based on additional information or reinterpretation of existing information concerning the Order of Liquidation for Reliance and the actions of the Guarantee Funds. Zenith also expects that it will receive continuing Guarantee Fund assessments in connection with the Reliance insolvency in many of the states in which it writes workers' compensation insurance. The ultimate impact of such assessments will depend upon the amount and timing of the assessments and of any recoveries to which Zenith is entitled.
Contingencies Surrounding Recoverability of Special Disability Trust Fund Receivable
In Florida, the Special Disability Trust Fund (the "Fund") assesses workers' compensation insurers to pay for what are commonly referred to as "Second Injuries." Historic assessments have been inadequate to completely fund obligations of the Fund. In late 1997, the Florida statute was amended so that the Fund will not be liable for, and will not reimburse employers or carriers for, Second Injuries occurring on or
61
after January 1, 1998. Zenith Insurance has recorded its receivable from the Fund for Second Injuries based on specific claims and historical experience prior to January 1, 1998. At December 31, 2001 and 2000, the receivable from the Fund was $18.1 million and $31.1 million, respectively, related to the pre-January 1, 1998 claims.
NOTE 16
Common Stock
Under employee non-qualified stock option plans adopted by the Board of Directors and Stockholders of Zenith National in 1978 and in 1996, options are granted to certain officers and key employees for the purchase of Zenith National's common stock at 100% of the market price at the date of grant. The majority of the options outstanding at December 31, 2001 and 2000 expire five years after the date of the grant or three months after termination of employment and vest one-fourth per year after the first year. One grant for 1,000,000 shares is for a term of ten years and vests one-fifth per year after the first year.
Zenith has adopted the disclosure-only provisions of Statement of Financial Accounting Standards No. 123 ("SFAS No. 123"), "Accounting for Stock-Based Compensation." Accordingly, no compensation cost has been recognized for the stock option plans. Had compensation cost for Zenith's stock option plans been determined based on the fair value at the grant date for awards in 2001, 2000 and 1999 consistent with the provisions of SFAS No. 123, Zenith's net (loss) income and per share amounts would have been reduced to the pro-forma amounts indicated as follows:
|
|---|
| | 2001
| | 2000
| | 1999
|
|---|
Years ended December 31,
(Dollars in thousands, except per share data)
| | As Reported
| | Pro-
forma
| | As Reported
| | Pro-
forma
| | As Reported
| | Pro-
forma
|
|---|
|
|---|
| Net (loss) income | | $ | (23,800 | ) | $ | (24,600 | ) | $ | (46,800 | ) | $ | (48,300 | ) | $ | 54,100 | | $ | 52,600 |
| Net (loss) income per common share | | | | | | | | | | | | | | | | | | |
| | — basic(1) | | | (1.35 | ) | | (1.40 | ) | | (2.72 | ) | | (2.80 | ) | | 3.15 | | | 3.06 |
| | — diluted(1) | | | (1.35 | ) | | (1.40 | ) | | (2.72 | ) | | (2.80 | ) | | 3.15 | | | 3.06 |
|
(1) Additional common shares issuable under employee stock option plans using the treasury stock method are antidilutive for 2001 and 2000 because there is a loss from continuing operations for these years.
62
The fair value of each option grant was estimated on the date of grant using the Black-Scholes option pricing model with the following weighted average assumptions:
|
|---|
| | 2001 Grants
| | 2000 Grants
| | 1999 Grants
|
|---|
|
|---|
| Risk-free interest rates | | 4.45% - 4.92% | | 5.45% - 6.85% | | 5.36% - 6.30% |
| Dividend yields | | 3.45% | | 3.55% | | 4.34% - 5.08% |
| Volatility factors | | 23.39% - 23.47% | | 20.87% - 22.97% | | 20.30% - 20.56% |
| Weighted average expected life (five-year term options) | | 4.5 yrs. | | 4.5 yrs. | | 4.5 yrs. |
| Weighted average fair value per share | | $5.09 | | $4.44 | | $3.49 |
|
Additional information with respect to stock options was as follows:
|
|---|
(Shares in thousands)
| Number
of shares
| | Weighted average exercise price
|
|---|
|
|---|
| Outstanding at December 31, 1998 | 2,533 | | $ | 25.00 |
| Granted | 154 | | | 21.95 |
| Exercised | (187 | ) | | 23.11 |
| Expired or cancelled | (385 | ) | | 26.02 |
| |
| | | |
| Outstanding at December 31, 1999 | 2,115 | | | 24.76 |
| Granted | 537 | | | 21.15 |
| Exercised | (295 | ) | | 24.54 |
| Expired or cancelled | (209 | ) | | 25.76 |
| |
| | | |
| Outstanding at December 31, 2000 | 2,148 | | | 24.03 |
| Granted | 95 | | | 27.60 |
| Exercised | (119 | ) | | 25.38 |
| Expired or cancelled | (60 | ) | | 26.98 |
| |
| | | |
| Outstanding at December 31, 2001 | 2,064 | | | 24.03 |
|
Certain information on outstanding options at December 31, 2001 was as follows:
|
|---|
Range of exercise price
(Shares in thousands)
| | Number outstanding
| | Weighted average remaining life in years
| | Outstanding options weighted average exercise price
|
|---|
|
|---|
| $23.63 | | 1,000 | | 4.8 | | $ | 23.63 |
| 19.16 - 29.47 | | 1,064 | | 2.6 | | | 25.82 |
|
Options exercisable at December 31, 2001, 2000 and 1999 were 1,534,000, 1,205,000 and 1,127,000, respectively. Certain information on exercisable options at December 31, 2001 was as follows:
|
|---|
Range of exercise prices
(Shares in thousands)
| | Number exercisable
| | Exercisable options weighted average exercise price
|
|---|
|
|---|
| $23.63 | | 1,000 | | $ | 23.63 |
| 19.16 - 29.47 | | 534 | | | 24.35 |
|
From time to time, Zenith National may make repurchases of its outstanding common shares. At December 31, 2001, Zenith National was authorized to repurchase up to 929,000 shares of its common stock at prevailing market prices pursuant to a share purchase program authorized by its Board of Directors. These purchases are discretionary and can be adequately funded from Zenith National's existing sources of liquidity.
On December 5, 2001, Zenith National sold one million shares of its common stock, par value $1.00 per share, in a private placement for $25.00 per share to Odyssey Re Holding Corp. ("Odyssey Re"), a reinsurance subsidiary of Fairfax Financial Holdings Limited ("Fairfax") (see Note 22—Related Parties).
NOTE 17
Dividend Restrictions
The California and Texas Insurance Holding Company System Regulatory Acts limit the ability of Zenith Insurance to pay dividends to Zenith National, and of the insurance
63
subsidiaries of Zenith Insurance to pay dividends to Zenith Insurance, by providing that the appropriate insurance regulatory authorities in the states of California and Texas must approve any dividend that, together with all other such dividends paid during the preceding twelve months, exceeds the greater of: (a) 10% of the paying company's statutory surplus as regards policyholders at the preceding December 31; or (b) 100% of the net income for the preceding year. In addition, any such dividend must be paid from policyholders' surplus attributable to accumulated earnings. During 2001 and 2000, Zenith Insurance paid $10.0 million and $10.0 million, respectively, of dividends to Zenith National. During 1999, Zenith Insurance paid $130.0 million of dividends to Zenith National, including a $100.0 million dividend from the proceeds of the sale of CalFarm for which it received prior approval from the California Department of Insurance. Stockholder's equity of the P&C Operations, in accordance with GAAP, amounted to $302.9 million as of December 31, 2001, of which $22.8 million can be paid in 2002 to Zenith National in dividends without prior approval.
NOTE 18
Statutory Financial Data
Capital stock and surplus and net (loss) income of the P&C Operations on a statutory basis, as reported to regulatory authorities, were as follows:
|
|---|
Years ended December 31,
(Dollars in thousands)
| | 2001
| | 2000
| | 1999
|
|---|
|
|---|
| Capital stock and surplus | | $ | 253,586 | | $ | 262,315 | | $ | 297,969 |
| Net (loss) income | | | (14,614 | ) | | (60,737 | ) | | 68,507 |
|
The insurance business is subject to state-by-state regulation and legislation focused on solvency, pricing, market conduct, claims practices, underwriting, accounting, investment criteria and other areas. Such regulation and legislation is constantly changing and compliance is essential and is an inherent risk of the business.
NOTE 19
Earnings and Dividends Per Share
The following table sets forth the computation of basic and diluted net (loss) income per common share.
|
|---|
Years Ended December 31,
(Dollars in thousands,
except per share data)
| | 2001
| | 2000
| | 1999
|
|---|
|
|---|
| (A) Net (loss) income | | $ | (23,800 | ) | $ | (46,800 | ) | $ | 54,100 |
|
| (B) Weighted average outstanding shares during the period | | | 17,593 | | | 17,212 | | | 17,161 |
| Additional common shares issuable under employee stock option plans using the treasury stock method | | | 172 | | | 57 | | | 11 |
|
| (C) Weighted average number of common shares outstanding assuming exercise of stock options | | | 17,765 | | | 17,269 | | | 17,172 |
|
| Net (loss) income per common share: | | | | | | | | | |
| (A)/(B) — basic(1) | | $ | (1.35 | ) | $ | (2.72 | ) | $ | 3.15 |
| (A)/(C) — diluted(1) | | | (1.35 | ) | | (2.72 | ) | | 3.15 |
|
| Dividends per common share | | $ | 1.00 | | $ | 1.00 | | $ | 1.00 |
|
(1) Additional common shares issuable under employee stock option plans using the treasury stock method are antidilutive for 2001 and 2000 because there is a loss from continuing operations for these years.
Options to purchase 2,053,000 shares of common stock at an average price of $24.90 per share were outstanding as of December 31, 1999 but were not included in the computation of diluted earnings per share because the options' exercise prices were greater than the average market price of the common shares, and, therefore, the effect would be anti-dilutive.
64
NOTE 20
Segment Information
Zenith classifies its business into the following segments: Workers' Compensation, Reinsurance, Other Property-Casualty (through March 31, 1999 see Note 13), Real Estate, Investment and Parent. Segments are designated based on the types of products and services provided. Workers' Compensation represents insurance coverage for the statutorily prescribed benefits that employers are required to pay to their employees injured in the course of employment. Reinsurance principally consists of world-wide, assumed reinsurance of property losses from catastrophes and large property risks. Other Property-Casualty, which was operated by CalFarm and was sold effective March 31, 1999, represented multiple product line direct insurance other than workers' compensation primarily in California. The Real Estate operations develop land and primarily construct single-family residences in Las Vegas, Nevada. Investment operations provide income and realized gains on investments, primarily from investments in debt securities. The Parent operations represent Zenith National, a holding company which owns, directly or indirectly, all of the capital stock of the P&C Operations, non-insurance companies and other investment securities.
The accounting policies of the segments are the same as those described in Note 1. Zenith evaluates insurance operation performance based on the combined ratios and income or loss from operations before income tax, and the related investment income or realized gains or losses.
Information as to the operations of the segments is set forth below:
| |
|---|
(Dollars in thousands)
| Workers' Compensation
| | Reinsurance
| | Other Property- Casualty(1)
| | Real Estate
| | Investment
| | Parent
| | Total
| |
|---|
| |
|---|
| | | Year Ended December 31, 2001 | |
| |
| Revenues: | | | | | | | | | | | | | | | | | | | | | |
| Premiums earned | $ | 415,848 | | $ | 61,028 | | | | | | | | | | | | | | $ | 476,876 | |
| Net investment income | | | | | | | | | | | | | $ | 51,178 | | | | | | 51,178 | |
| Realized gains on investments | | | | | | | | | | | | | | 9,169 | | | | | | 9,169 | |
| Real estate sales | | | | | | | | | | $ | 84,823 | | | | | | | | | 84,823 | |
| |
| Total revenues | $ | 415,848 | | $ | 61,028 | | | | | $ | 84,823 | | $ | 60,347 | | | | | $ | 622,046 | |
| |
| Interest expense | | | | | | | | | | | | | | | | $ | (7,576 | ) | $ | (7,576 | ) |
| |
| (Loss) income before tax | | (58,329 | ) | | (31,918 | ) | | | | | 5,763 | | | 60,347 | | | (11,402 | ) | | (35,539 | ) |
| Federal income tax (benefit) expense | | (19,595 | ) | | (10,716 | ) | | | | | 2,017 | | | 20,546 | | | (3,991 | ) | | (11,739 | ) |
| |
| Net (loss) income | $ | (38,734 | ) | $ | (21,202 | ) | | | | $ | 3,746 | | $ | 39,801 | | $ | (7,411 | ) | $ | (23,800 | ) |
| |
| Combined ratios | | 114.0% | | | 152.3% | | | | | | | | | | | | | | | 118.9% | |
| |
| Total assets | $ | 450,331 | | $ | 43,108 | | | | | $ | 60,608 | | $ | 981,266 | | $ | 4,746 | | $ | 1,540,059 | |
| |
| (1) CalFarm was sold effective March 31, 1999 | |
65
| | | Year Ended December 31, 2000 | |
| |
| Revenues: | | | | | | | | | | | | | | | | | | | | | |
| Premiums earned | $ | 300,833 | | $ | 37,919 | | | | | | | | | | | | | | $ | 338,752 | |
| Net investment income | | | | | | | | | | | | | $ | 51,766 | | | | | | 51,766 | |
| Realized losses on investments | | | | | | | | | | | | | | (15,467 | ) | | | | | (15,467 | ) |
| Real estate sales | | | | | | | | | | $ | 84,518 | | | | | | | | | 84,518 | |
| |
| Total revenues | $ | 300,833 | | $ | 37,919 | | | | | $ | 84,518 | | $ | 36,299 | | | | | $ | 459,569 | |
| |
| Interest expense | | | | | | | | | | | | | | | | $ | (5,640 | ) | $ | (5,640 | ) |
| |
| (Loss) income before tax and extraordinary item | $ | (87,854 | ) | $ | (14,536 | ) | | | | $ | 5,464 | | $ | 36,299 | | $ | (11,682 | ) | $ | (72,309 | ) |
| Federal income tax (benefit) expense | | (29,558 | ) | | (4,891 | ) | | | | | 1,912 | | | 12,110 | | | (4,089 | ) | | (24,516 | ) |
| |
| (Loss) income before extraordinary item | | (58,296 | ) | | (9,645 | ) | | | | | 3,552 | | | 24,189 | | | (7,593 | ) | | (47,793 | ) |
| Extraordinary item(2) | | | | | | | | | | | | | | | | | 993 | | | 993 | |
| |
| Net (loss) income | $ | (58,296 | ) | $ | (9,645 | ) | | | | $ | 3,552 | | $ | 24,189 | | $ | (6,600 | ) | $ | (46,800 | ) |
| |
| Combined ratios | | 129.2% | | | 138.3% | | | | | | | | | | | | | | | 130.2% | |
| |
| Total assets | $ | 500,167 | | $ | 30,733 | | | | | $ | 59,133 | | $ | 880,643 | | $ | 1,514 | | $ | 1,472,190 | |
| |
| | | Year Ended December 31, 1999 | |
| |
| Revenues: | | | | | | | | | | | | | | | | | | | | | |
| Premiums earned | $ | 278,854 | | $ | 36,441 | | $ | 54,108 | | | | | | | | | | | $ | 369,403 | |
| Net investment income | | | | | | | | | | | | | $ | 53,662 | | | | | | 53,662 | |
| Realized gains on investments | | | | | | | | | | | | | | 7,682 | | | | | | 7,682 | |
| Real estate sales | | | | | | | | | | $ | 58,670 | | | | | | | | | 58,670 | |
| Service fee income | | 2,691 | | | | | | | | | | | | | | | | | | 2,691 | |
| |
| Total revenues | $ | 281,545 | | $ | 36,441 | | $ | 54,108 | | $ | 58,670 | | $ | 61,344 | | | | | $ | 492,108 | |
| |
| Interest expense | | | | | | | | | | | | | | | | $ | (8,218 | ) | $ | (8,218 | ) |
| |
| (Loss) income before tax and gain on sale of CalFarm | $ | (122,543 | ) | $ | (7,324 | ) | $ | (22 | ) | $ | 3,649 | | $ | 61,344 | | $ | (12,372 | ) | $ | (77,268 | ) |
| Gain on sale of CalFarm before tax | | | | | | | | 160,335 | | | | | | | | | | | | 160,335 | |
| Federal income tax (benefit) expense | | (42,199 | ) | | (2,494 | ) | | 55,993 | | | 1,277 | | | 20,719 | | | (4,329 | ) | | 28,967 | |
| |
| Net (loss) income | $ | (80,344 | ) | $ | (4,830 | ) | $ | 104,320 | | $ | 2,372 | | $ | 40,625 | | $ | (8,043 | ) | $ | 54,100 | |
| |
| Combined ratios | | 143.9% | | | 120.1% | | | 100.0% | | | | | | | | | | | | 135.2% | |
| |
(1) CalFarm was sold effective March 31, 1999
(2) Gain on extinguishment of debt (net of income tax)
NOTE 21
Employee Benefit and Retirement Plans
Zenith offers a tax deferred savings plan organized under Section 401(k) of the Internal Revenue Code for all of its subsidiaries' eligible employees. Zenith matches 50% of employee contributions that are 6% or less of salary on a current basis and is not liable for any future payments under the plan. For the years ended December 31, 2001, 2000 and 1999, Zenith contributed $1.5 million, $0.8 million and $1.2 million, respectively.
Zenith also offers a stock purchase plan, under which all employees are able to purchase shares of Zenith National common stock at market value. Zenith matches 25% of all employee purchases. For each of the three years ended December 31, 2001, 2000 and 1999, Zenith contributed $0.3 million.
NOTE 22
Related Parties
At December 31, 2001, Fairfax, through its subsidiaries, owned 7,809,000 or 42% of the total outstanding shares of common stock of Zenith National.
At December 31, 2001 and 2000, Zenith owned $9.1 million and $12.8 million,
66
respectively, at fair value of securities issued by Fairfax. In addition, at December 31, 2001 and 2000, Zenith owned $2.7 million and $3.0 million, respectively, at fair value of securities issued by TIG Capital Trust 1, a subsidiary of Fairfax. At December 31, 2001, Zenith owned $25.0 million at fair value of securities issued by Odyssey Re., a subsidiary of Fairfax.
The P&C Operations conduct assumed and ceded reinsurance transactions with subsidiaries of Fairfax. The following table summarizes the reinsurance transactions with the subsidiaries of Fairfax:
|
|---|
Years ended December 31,
(Dollars in thousands)
| | 2001
| | 2000
|
|---|
|
|---|
| Assumed Reinsurance: | | | | | | |
| | Unpaid loss and loss adjustment expenses | | $ | 266 | | $ | 118 |
| Ceded Reinsurance: | | | | | | |
| | Receivable from reinsurers on paid and unpaid losses | | | 3,795 | | | 4,480 |
|
Effective January 1, 2002, Zenith Insurance and Odyssey Re entered into a 10% quota share ceded reinsurance agreement with respect to all new and renewal workers' compensation business written by Zenith Insurance in the three years commencing January 1, 2002.
NOTE 23
Quarterly Financial Data (Unaudited)
| |
|---|
| 2001 Quarter Ended
| |
|---|
(Dollars in thousands,
except per share data)
| March
31
| | June
30
| | September
30
| | December
31
| |
|---|
| |
|---|
| Premiums earned | $ | 104,638 | | $ | 115,760 | | $ | 130,032 | | $ | 126,446 | |
| Net investment income | | 13,380 | | | 12,865 | | | 12,610 | | | 12,323 | |
| Realized gains on investments | | 137 | | | 1,865 | | | 4,101 | | | 3,066 | |
| Real estate sales | | 17,110 | | | 24,058 | | | 22,199 | | | 21,456 | |
| Net (loss) income | | (100 | ) | | 2,900 | | | (19,300 | ) | | (7,300 | ) |
| Net (loss) income per common share | | | | | | | | | | | | |
| | —basic(1) | | (0.01 | ) | | 0.17 | | | (1.10 | ) | | (0.41 | ) |
| | —diluted(1) | | (0.01 | ) | | 0.16 | | | (1.10 | ) | | (0.41 | ) |
| |
| |
|---|
| 2000 Quarter Ended
| |
|---|
(Dollars in thousands,
except per share data)
| March
31
| | June
30
| | September
30
| | December
31
| |
|---|
| |
|---|
| Premiums earned | $ | 77,139 | | $ | 78,306 | | $ | 87,692 | | $ | 95,615 | |
| Net investment income | | 13,561 | | | 13,000 | | | 12,861 | | | 12,344 | |
| Realized gains (losses) on investments | | 3,255 | | | (2,589 | ) | | (10,913 | ) | | (5,220 | ) |
| Real estate sales | | 16,434 | | | 22,099 | | | 23,278 | | | 22,707 | |
| Extraordinary item(2) | | 973 | | | | | | 20 | | | | |
| Net loss | | (4,400 | ) | | (19,600 | ) | | (12,200 | ) | | (10,600 | ) |
| Net loss per common share | | | | | | | | | | | | |
| | — basic(1) | | (0.26 | ) | | (1.14 | ) | | (0.71 | ) | | (0.61 | ) |
| | — diluted(1) | | (0.26 | ) | | (1.14 | ) | | (0.71 | ) | | (0.61 | ) |
| |
(1) Additional common shares issuable under employee stock option plans using the treasury stock method are antidilutive for first, third and fourth quarters of 2001 and for all four quarters of 2000 because there is a loss from continuing operations for these periods.
(2) Gain on extinguishment of debt after tax (see Note 11).
NOTE 24
Common Stock Market Prices (Unaudited)
The following table shows the high and low common stock prices during each quarter for the past two years.
|
|---|
| | 2001
| | 2000
|
|---|
Quarter ended
| | High
| | Low
| | High
| | Low
|
|---|
|
|---|
| March 31 | | $30.70 | | $22.80 | | $22.19 | | $18.75 |
| June 30 | | 27.92 | | 23.41 | | 24.94 | | 20.50 |
| September 30 | | 30.15 | | 23.78 | | 23.88 | | 20.81 |
| December 31 | | 29.30 | | 24.40 | | 29.75 | | 20.00 |
|
As of March 11, 2002, there were 247 registered holders of record of Zenith National common stock.
67
REPORT OF INDEPENDENT ACCOUNTANTS
To the Stockholders and Board of Directors of
Zenith National Insurance Corp.:
In our opinion, the accompanying consolidated balance sheets and the related consolidated statements of operations, cash flows, and stockholders' equity present fairly, in all material respects, the financial position of Zenith National Insurance Corp. and subsidiaries (the "Company") at December 31, 2001 and 2000, and the results of their operations and their cash flows for each of the three years in the period ended December 31, 2001, in conformity with accounting principles generally accepted in the United States of America. These financial statements are the responsibility of the Company's management; our responsibility is to express an opinion on these financial statements based on our audits. We conducted our audits of these statements in accordance with auditing standards generally accepted in the United States of America, which require that we plan and perform the audit to obtain reasonable assurance about whether the financial statements are free of material misstatement. An audit includes examining, on a test basis, evidence supporting the amounts and disclosures in the financial statements, assessing the accounting principles used and significant estimates made by management, and evaluating the overall financial statement presentation. We believe that our audits provide a reasonable basis for our opinion.
PricewaterhouseCoopers LLP
Los Angeles, California
February 6, 2002
68
CORPORATE DIRECTORY
CORPORATE DIRECTORY
Zenith National Insurance Corp.
Directors
Also Directors of Zenith
Insurance Company
Max M. Kampelman
Attorney, Of Counsel,
Fried, Frank, Harris,
Shriver & Jacobson
Robert J. Miller
Attorney, Senior Partner,
Jones Vargas
Leon E. Panetta
Founder and Director,
The Leon & Sylvia Panetta
Institute for Public Policy
William S. Sessions
Attorney,
Holland & Knight LLP
and Security Consultant
Harvey L. Silbert
Attorney, Of Counsel,
Christensen, Miller, Fink, Jacobs,
Glazer, Weil & Shapiro LLP
Gerald Tsai, Jr.
Management of
Private Investments
Michael Wm. Zavis
Attorney, Retired Founding Partner,
Katten Muchin & Zavis
Stanley R. Zax
Chairman of the Board
and President
Executive Officers
Stanley R. Zax
Chairman of the
Board and President
Jack D. Miller
Executive Vice President
Robert E. Meyer
Senior Vice President
William J. Owen
Senior Vice President,
Chief Financial Officer
and Treasurer
John J. Tickner
Senior Vice President
and Secretary
Officer
Hyman J. Lee Jr.
Vice President
Transfer Agent-
Common Stock
Mellon Investor
Services LLC
Los Angeles, CA
www.melloninvestor.com
Transfer Agent-
9% Senior Notes and
8.55% Capital Securities
Wells Fargo Corporate
Trust Services
Wells Fargo Bank Minnesota, N.A.
Minneapolis, MN
Corporate
Headquarters
21255 Califa Street
Woodland Hills, CA 91367
(818) 713-1000
www.thezenith.com
NYSE Trading Symbol
Common Stock—ZNT
Independent
Accountants
PricewaterhouseCoopers LLP
Los Angeles, CA
The Annual Report
on Form 10-K, for the year ended December 31, 2001 and our quarterly reports may be obtained at our website or free of charge upon written request to:
Chief Financial Officer
Zenith National
Insurance Corp.
21255 Califa Street
Woodland Hills, CA 91367
70
CORPORATE DIRECTORY
Zenith Insurance Company
Officers
Stanley R. Zax
Chairman of the
Board and President
Jack D. Miller
Executive Vice President,
and Chief Operating Officer
William J. Owen
Senior Vice President
Chief Financial Officer, Treasurer
and Assistant Secretary
John J. Tickner
Senior Vice President,
General Counsel and Secretary
Stephen J. Albers
Senior Vice President
James T. Braun
Senior Vice President
Ron R. Cordova
Senior Vice President
Dan M. Hair
Senior Vice President
John C. Hasbrouck
Senior Vice President
Robert L. Hernandez
Senior Vice President
Westley M. Heyward
Senior Vice President
Fred A. Hunt
Senior Vice President
Corey A. Ingber
Senior Vice President
Michael W. Jacobson
Senior Vice President
Edward G. Krisak
Senior Vice President
Robert E. Meyer
Senior Vice President
and Chief Actuary
Stephen M. Pratt
Senior Vice President
William J. Saake
Senior Vice President
Keith E. Trotman
Senior Vice President
Chris L. Uselton
Senior Vice President
Kari L. Van Gundy
Senior Vice President
Glen R. Zepnick
Senior Vice President
Bryan A. Anderson
Vice President
Jeffrey J. Beaudoin
Vice President
Everett M. Brookhart
Vice President
Suzanne M. Chapan
Vice President
Duane H. Chernow
Vice President
Douglas A. Claman
Vice President
Ronald W. Crabtree
Vice President
Mark T. Cross
Vice President
Gerald D. Curtin
Vice President
Charles J. Davis
Vice President
Anita Devan
Vice President
Bradley C. Eastwood
Vice President
Jesse R. Farese
Vice President
Eden C. Feder
Vice President
F. Stephen Fetchet
Vice President
Stephen T. Frye
Vice President
James C. Guidos
Vice President
Diane H. Heidenreich
Vice President and Assistant General Counsel
Carolyn N. Hinson
Vice President
David G. Hoppen
Vice President
Mark M. Jansen
Vice President
Lisa A. Krouse
Vice President and General
Counsel-Southeast
Steven M. Larsen
Vice President
Hyman J. Lee Jr.
Vice President and Assistant Secretary
Jonathan W. Lindsay
Vice President
Michael R. McFadden
Vice President
Colin S. Mitchell
Vice President
David A. O'Connor
Vice President
Michael J. Paladino
Vice President
Stephen D. Petrula
Vice President
Gemal K. Seede
Vice President
Alan I. Steinhardt
Vice President
John A. Swift
Vice President
John H. Weber
Vice President
Norman C. Winters
Vice President
71
CORPORATE DIRECTORY
TheZenith Marketing, Underwriting and Claims Offices
Los Angeles, CA
Corporate Headquarters
and Los Angeles Regional Office
21255 Califa Street
Woodland Hills, CA 91367
(818) 713-1000
www.thezenith.com
San Diego, CA
1660 N. Hotel Circle Drive
Suite 400
San Diego, CA 92108
(619) 299-6252
San Francisco, CA
425 California Street
Suite 1010
San Francisco, CA 94104
(415) 315-7004
Pleasanton, CA
4309 Hacienda Drive
Suite 200
Pleasanton, CA 94588
(925) 460-0600
Fresno, CA
575 E. Locust Avenue
Suite 101
Fresno, CA 93720
(559) 432-6660
Salt Lake City, UT
3 Triad Center
345 W. North Temple
Suite 175
Salt Lake City, UT 84180
(801) 741-4900
Austin, TX
1101 Capitol of Texas
Hwy.
South Bldg. J
Austin, TX 78746
(512) 306-1700
Dallas, TX
17304 Preston Road
Suite 800
Dallas, TX 75252
(972) 701-5700
Little Rock, AR
900 S. Shackelford Road
Suite 300
Little Rock, AR 72211
(877) 200-8600
Blue Bell, PA
2 Valley Square
Suite 301
Blue Bell, PA 19422
(215) 591-2900
Springfield, IL
2105 W. White Oaks Drive
Springfield, IL 62704
(217) 726-2900
Chicago, IL
550 Warrenville Road
Suite 200
Lisle, IL 60532
(630) 353-7300
Sarasota, FL
1390 Main Street
Sarasota, FL 34236
(941) 906-2000
Orlando, FL
3504 Lake Lynda Drive
Suite 400
Orlando, FL 32817
(800) 999-3242
Charlotte, NC
5832 Farm Pond Lane
Suite 300
Charlotte, NC 28212
(800) 200-2667
Birmingham, AL
10 Iverness Center Parkway
Suite 220
Birmingham, AL 35242
(800) 355-0708
Perma-Bilt, a Nevada Corporation
Officers
Daniel Schwartz
President
Robert M. Beville
Executive Vice President
David R. Durant
Vice President
Craig A. Hardy
Vice President
Ruth E. Ochoa
Vice President
Headquarters
7150 Pollock Drive
Suite 104
Las Vegas, NV 89119
(702) 896-9100
www.permabilthomes.com
72