QuickLinks -- Click here to rapidly navigate through this documentANNUAL REPORT 2002
ZENITH NATIONAL INSURANCE CORP.
FINANCIAL HIGHLIGHTS
Years ended December 31,
| | 2002
| | 2001
| | 2000
| |
|---|
| |
|---|
| RESULTS OF OPERATIONS: | | | (Dollars in thousands, except per share data) | |
| | Revenues(1) | | $ | 602,235 | | $ | 537,223 | | $ | 375,051 | |
| | |
| |
| |
| |
| | Income (loss) from continuing operations after tax and before extraordinary item(1)(2) | | | 1,016 | | | (29,606 | ) | | (51,345 | ) |
| | Income from discontinued operations after tax(1) | | | 9,184 | | | 3,746 | | | 3,552 | |
| | Extraordinary item — gain on extinguishment of debt after tax(3) | | | | | | | | | 993 | |
| | |
| |
| |
| |
| | Net income (loss)(2) | | $ | 10,200 | | $ | (25,860 | ) | $ | (46,800 | ) |
| | |
| |
| |
| |
| PER SHARE DATA: | | | | | | | | | | |
| | Income (loss) from continuing operations after tax and before extraordinary item(1)(2) | | $ | 0.05 | | $ | (1.68 | ) | $ | (2.99 | ) |
| | Income from discontinued operations after tax(1) | | | 0.49 | | | 0.21 | | | 0.21 | |
| | Extraordinary item — gain on extinguishment of debt after tax(3) | | | | | | | | | 0.06 | |
| | |
| |
| |
| |
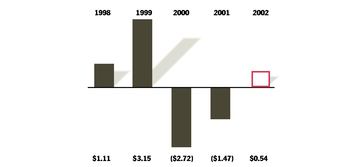
| | Net income (loss)(2) | | $ | 0.54 | | $ | (1.47 | ) | $ | (2.72 | ) |
| | |
| |
| |
| |
| | Stockholders' dividends | | $ | 1.00 | | $ | 1.00 | | $ | 1.00 | |
KEY STATISTICS: |
|
|
|
|
|
|
|
|
|
|
| | Combined ratio: | | | | | | | | | | |
| | | Including catastrophes | | | 106.5% | | | 118.9% | | | 130.2% | |
| | | Excluding catastrophes | | | 106.4% | | | 110.2% | | | 123.6% | |
| | Stockholders' equity(2) | | $ | 317,024 | | $ | 300,551 | | $ | 309,776 | |
| | Stockholders' equity per share(2) | | | 16.89 | | | 16.20 | | | 17.76 | |
| | Closing common stock price | | | 23.52 | | | 27.94 | | | 29.38 | |
(1) In 2002, we sold the home-building business and related real estate assets of Perma-Bilt, a Nevada Corporation. The results of the real estate business are presented as discontinued operations. The gain on the sale was $6.3 million after tax, or $0.34 per share.
(2) 2001 is restated to reflect equity method accounting for our investment in Advent Capital (Holdings) PLC.
(3) In 2000, Zenith repurchased a total of $16.5 million aggregate principal amount of then outstanding 9% Senior Notes due 2002 and $8.0 million aggregate liquidation amount of the outstanding 8.55% Capital Securities.
1
TABLE OF CONTENTS
| • | Financial Highlights | | 1 |
• |
Letter to Stockholders |
|
3 |
• |
Management's Discussion and Analysis of Consolidated
Financial Condition and Results of Operations |
|
28 |
• |
5-Year Summary of Selected Financial Information |
|
52 |
• |
Consolidated Balance Sheet |
|
54 |
• |
Consolidated Statement of Operations |
|
55 |
• |
Consolidated Statement of Cash Flows |
|
56 |
• |
Consolidated Statement of Stockholders' Equity |
|
58 |
• |
Notes to Consolidated Financial Statements |
|
60 |
• |
Report of Independent Accountants |
|
85 |
• |
Corporate Directory |
|
|
|
Zenith National Insurance Corp. |
|
86 |
|
Zenith Insurance Company |
|
87 |
|
TheZenith Marketing, Underwriting and Claims Offices |
|
88 |
TheZenith and Zenith are registered U.S. trademarks.
2
TO OUR STOCKHOLDERS
TheZenith's 2002 financial results reflect substantial growth in premium, improvement in combined ratios and the restoration of profitability after several difficult years. Our financial condition was also strengthened by the sale of our Las Vegas real estate operations, increase in cash flows and reduction of debt. As a result, we have available financial resources to grow our insurance businesses.
Corporate governance became a major issue this past year and, due to the fact that our Board of Directors has always consisted of predominantly independent Directors (other than myself), we are well positioned to comply with the numerous new legal requirements.
It is common knowledge in the insurance and investment worlds that insurance prices and terms are increasing at double-digit or greater amounts. Investors and analysts question how long this price trend will last. In my opinion, the combination of poor industry results for several years, low interest rates, industry reserve deficiencies, substantial industry equity and debt losses, terrorist risk, derivative risks and rating downgrades bodes well for pricing and profitability trends to extend longer than might otherwise be anticipated. In any event, we are in an excellent position to take advantage of available opportunities.
This report will candidly discuss our operations and our plans for the future. Despite our continuing improvement in results, we are mindful that we are operating in a riskier world after September 11 and, therefore, continue to focus on managing risk in a professional manner. Although we earned a profit in 2002, we are also aware that the level of profitability must substantially improve in order to achieve an adequate return on equity and internally generate capital.
3
ZENITH'S RESULTS REFLECT SUBSTANTIAL GROWTH IN PREMIUM, IMPROVEMENT IN COMBINED RATIOS AND THE RESTORATION OF PROFITABILITY.
PERFORMANCE SUMMARY
1. Insurance Operations:
- •
- Premiums earned increased to $557.1 million.
- •
- Underwriting losses were reduced by $54.0 million to $36.2 million in 2002.
- •
- The combined ratio improved to 106.5% from 118.9% in 2001.
2. Workers' Compensation:
- •
- Premiums in-force increased 45.0% to $609.4 million.
- •
- Policies in-force increased 11.2% to about 39,500.
- •
- Price increases are continuing, estimated at 21% for 2003 compared to 18% the prior year.
- •
- Underwriting losses declined by $14.5 million.
- •
- The combined ratio improved to 108.7% from 114.0% in 2001.
3. Additional Financial Stability:
- •
- Debt of $57.2 million was paid with internal funds.
- •
- The real estate business was sold and a gain of $6.3 million was recorded.
- •
- Cash flow from insurance operating activities was $144.9 million in 2002 compared to $91.2 million the prior year.
- •
- Statutory capital of the insurance business increased by $57.3 million.
4. Net Income:
- •
- Net income was $10.2 million compared to a net loss of $25.9 million in 2001.
- •
- Net income per share was $0.54 compared to a net loss per share of $1.47 the prior year.
- •
- Workers' Compensation reserve charge in the fourth quarter of 2002 was $19.5 million, or $1.04 per share.
- •
- World Trade Center net loss in 2001 was $24.4 million, or $1.39 per share.
4
STOCKHOLDERS' EQUITY PER SHARE

5. Investment Income:
- •
- $48.8 million in 2002 compared with $51.2 million the prior year.
- •
- Reduced due to lower interest rates.
- •
- The investment portfolio increased from $0.9 billion to $1.1 billion.
- •
- Realized capital losses after tax were $2.4 million, or $0.12 per share.
- •
- Unrealized gains were $26.8 million before tax compared to unrealized losses of $2.7 million the prior year.
ANALYSIS
The following table summarizes pre-tax underwriting performance during the past three years.
| |
|---|
Underwriting (Loss) Income
| | 2002
| | 2001
| | 2000
| |
|---|
| |
|---|
| | | | (Dollars in thousands) | |
| Workers' Compensation | | $ | (43,848 | ) | $ | (58,329 | ) | $ | (87,854 | ) |
| Reinsurance | | | 7,644 | | | (31,918 | ) | | (14,536 | ) |
| |
| Total underwriting loss | | | (36,204 | ) | | (90,247 | ) | | (102,390 | ) |
| |
| Catastrophes | | | (400 | ) | | (41,700 | ) | | (22,600 | ) |
| |
2002 results improved significantly.
- •
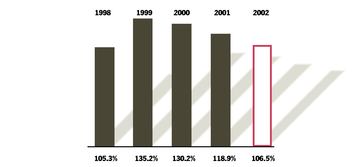
- The property-casualty combined ratio was 106.5% in 2002 compared to 118.9% the prior year.
- •
- The combined ratio for the Workers' Compensation operations was 108.7% in 2002 compared to 114.0% in 2001.
- •
- Accident year combined ratios for the Workers' Compensation operations were 103.2%, 119.1% and 131.3% for 2002, 2001, and 2000, respectively.
5
OUR FINANCIAL CONDITION WAS STRENGTHENED BY THE SALE OF OUR REAL ESTATE OPERATIONS, INCREASE IN CASH FLOWS AND REDUCTION OF DEBT.
- •
- 2002 accident year Reinsurance operations were excellent due to the absence of major disasters; however, it isn't reasonable to evaluate this business on short-term results.
- •
- Gross written insurance premiums were $640.9 million in 2002 compared to $503.7 million the prior year, an increase of 27.2%. Net written premiums increased 17.7% due, in part, to the previously announced 10% quota share on our Workers' Compensation business. Continued substantial growth in rates and premiums should generate continued earnings growth and internal capital generation, but may also necessitate additional statutory capital in order to maintain our ratings.
- •
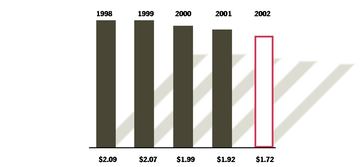
- Investment income after tax was $32.5 million, or $1.72 per share, in 2002 compared to $33.8 million, or $1.92 per share, in 2001. The per share decline was primarily due to an increase in our average outstanding shares of 1.3 million shares.
- •
- Stockholders' equity at December 31, 2002 was $317.0 million compared to $300.6 million at December 31, 2001.
- •
- Cash generated from insurance operations was $144.9 million in 2002 compared to $91.2 million in 2001.
- •
- At December 31, 2002, Zenith had no long-term debt compared to $57.2 million at December 31, 2001. There were $65.7 million outstanding of our 8.55% Capital Trust Securities issued in July 1998, maturing in 26 years. TheZenith's parent company had $70.0 million of bank lines of credit available at year-end, which can be utilized to provide statutory capital for our insurance subsidiaries. We borrowed $45.0 million to increase statutory capital in the early part of 2003. We plan to refinance these borrowings later in 2003.
6
INVESTMENT INCOME AFTER TAX PER SHARE
- •
- Zenith's subsidiaries are rated A- (Excellent) by A.M. Best Company. Moody's Investor's Service and Standard & Poor's have assigned insurance financial strength ratings of Baa1 (Adequate) and BBB+ (Good), respectively.
- •
- Dividends to shareholders were $18.7 million. Funds to pay dividends must come from either parent company financings or dividends paid from our insurance subsidiary.
Information in the following table provides estimates of Zenith's net incurred losses and loss adjustment expenses for our Workers' Compensation and Reinsurance business by accident year, evaluated in the year they were incurred and as they were subsequently evaluated in succeeding years. These data are of critical importance in judging the accuracy of our reserve estimates, as well as providing a guide to setting fair prices and rates. The accuracy of reserve estimates is one of our major business risks which we endeavor to manage professionally. Loss reserve estimates are refined continually in an ongoing process as experience develops and claims are reported and paid. Fluctuations occur from time to time, but we try to maintain a conservative actuarial approach in order to minimize the number and amount of adjustments. The fourth quarter charge of $30.0 million before tax was necessitated by recent data clearly indicating loss development and loss adjustment expenses at historically high levels (see page 10).
Estimating catastrophe losses in the Reinsurance business is highly dependent upon the nature and timing of the event and our ability to obtain timely and accurate information with which to estimate our liability to pay losses. There is considerable uncertainty as to the nature and amount of monetary losses associated with the attack on the World Trade Center; however, we believe we have reserved adequately at year-end and have not made any adjustments from the prior year.
7
LOSS DEVELOPMENT TRENDS NECESSITATED A FOURTH QUARTER RESERVE INCREASE TO RESTORE RESERVE ADEQUACY.
|
|---|
Accident Year Reserve Development from Operations
|
|---|
|
|---|
| | | | Net incurred losses and loss adjustment expenses reported at end of year |
|
|---|
| Years in which losses were incurred | | | 1996 | | | 1997 | | | 1998 | | | 1999 | | | 2000 | | | 2001 | | | 2002 |
|
|---|
(Dollars in thousands) |
|
|
|
|
|
|
|
|
|
|
|
|
|
|
|
|
|
|
|
|
|
| Prior to 1996(1) | | $ | 2,219,387 | | $ | 2,219,894 | | $ | 2,943,460 | | $ | 2,956,050 | | $ | 2,953,280 | | $ | 2,932,060 | | $ | 2,937,117 |
| 1996(1)(2) | | | 181,844 | | | 238,635 | | | 429,335 | | | 443,443 | | | 434,315 | | | 437,821 | | | 439,996 |
| Cumulative | | | 2,401,231 | | | 2,458,529 | | | 3,372,795 | | | 3,399,493 | | | 3,387,595 | | | 3,369,881 | | | 3,377,113 |
| 1997(1) | | | | | | 204,502 | | | 333,818 | | | 339,907 | | | 346,276 | | | 344,092 | | | 347,309 |
| Cumulative | | | | | | 2,663,031 | | | 3,706,613 | | | 3,739,400 | | | 3,733,871 | | | 3,713,973 | | | 3,724,422 |
| 1998 | | | | | | | | | 258,000 | | | 271,317 | | | 276,768 | | | 283,713 | | | 284,252 |
| Cumulative | | | | | | | | | 3,964,613 | | | 4,010,717 | | | 4,010,639 | | | 3,997,686 | | | 4,008,674 |
| 1999 | | | | | | | | | | | | 278,054 | | | 309,012 | | | 321,584 | | | 313,766 |
| Cumulative | | | | | | | | | | | | 4,288,771 | | | 4,319,651 | | | 4,319,270 | | | 4,322,440 |
| 2000 | | | | | | | | | | | | | | | 306,082 | | | 310,810 | | | 320,387 |
| Cumulative | | | | | | | | | | | | | | | 4,625,733 | | | 4,630,080 | | | 4,642,827 |
| 2001 | | | | | | | | | | | | | | | | | | 427,943 | | | 444,364 |
| Cumulative | | | | | | | | | | | | | | | | | | 5,058,023 | | | 5,087,191 |
| 2002 | | | | | | | | | | | | | | | | | | | | | 412,883 |
| Cumulative | | | | | | | | | | | | | | | | | | | | | 5,500,074 |
| Ratios: | | | | | | | | | | | | | | | | | | | | | |
| 1996 | | | 73.36% | | | 79.35% | | | 80.08% | | | 82.71% | | | 81.01% | | | 81.66% | | | 82.07% |
| 1997 | | | | | | 75.04% | | | 72.56% | | | 73.88% | | | 75.26% | | | 74.79% | | | 75.49% |
| 1998 | | | | | | | | | 74.76% | | | 78.62% | | | 80.20% | | | 82.21% | | | 82.37% |
| 1999 | | | | | | | | | | | | 86.91% | | | 96.58% | | | 100.51% | | | 98.07% |
| 2000 | | | | | | | | | | | | | | | 88.76% | | | 90.13% | | | 92.91% |
| 2001 | | | | | | | | | | | | | | | | | | 89.74% | | | 93.18% |
| 2002 | | | | | | | | | | | | | | | | | | | | | 74.12% |
|
This analysis displays the accident year net incurred losses and loss adjustment expenses on a GAAP basis for accident years 1996-2002 for all property-casualty business. The total of net loss and loss adjustment expenses for all claims occurring within each annual period is shown first at the end of that year and then annually thereafter. The total cost includes both payments made and the estimate of future payments as of each year-end. Past development may not be an accurate indicator of future development since trends and conditions change. The data prior to 1999 has been restated to exclude the results of CalFarm Insurance Company, which was sold effective March 31, 1999.
- (1)
- The acquisition of RISCORP in 1998 caused incurred losses prior to 1996, incurred losses for 1996 and incurred losses for 1997 to increase from 1997 to 1998.
- (2)
- The acquisition of the Associated General Commerce Self-Insurers' Trust Fund caused incurred losses for 1996 to increase from 1996 to 1997.
Loss reserve development in recent years has been attributable to higher than expected workers' compensation claim severity (discussed on page 9), adverse development of catastrophe losses and an increase in the loss reserves assumed in the purchase of RISCORP.
8
PROPERTY-CASUALTY COMBINED RATIO
2002 FOURTH QUARTER RESERVE DEVELOPMENT
Reserves for Workers' Compensation loss and loss adjustment expense were increased by $30.0 million pre-tax in the fourth quarter, adding 5.4 points to our combined ratio of 106.5%. This non-cash charge was necessitated by severity development due both to healthcare and indemnity cost inflation higher than previous estimates in the California operations, offset, in part, by favorable trends outside of California. The following table shows the average compound inflation rates in California for accident years 2000 and 2001 over the past five quarters.
|
|---|
Average Compound California Severity Inflation Rates
|
|---|
|
|---|
| | | Accident Years
2000 and 2001 |
|
|---|
| As reported at the end of: | | Paid
Medical
Inflation* | | Paid
Indemnity
Inflation* |
|
|---|
| 4th Quarter 2001 | | 12% | | 3% |
| 1st Quarter 2002 | | 11% | | 3% |
| 2nd Quarter 2002 | | 12% | | 4% |
| 3rd Quarter 2002 | | 15% | | 7% |
| 4th Quarter 2002 | | 17% | | 9% |
|
*Inflation equals the compound average rate of increase in average paid amounts per claim for accident year 2000 and accident year 2001.
9
INFLATION IMPACTED THIRD AND FOURTH QUARTER 2002 PAID DEVELOPMENT FACTORS IN CALIFORNIA.
The upward trend of California paid loss development trends are clearly observable in the following table:
|
|---|
California Paid Development Factors
|
|---|
|
|---|
| Valuation Period in Months | | Average Paid
Development
for Accident Years
1999 and 2000 | | Paid
Development
for Accident Year
2001 | | Quarter in Which Development Occurred |
|
|---|
| 12-15 | | 1.483 | | 1.474 | | 1st Quarter 2002 |
| 15-18 | | 1.335 | | 1.327 | | 2nd Quarter 2002 |
| 18-21 | | 1.215 | | 1.243 | | 3rd Quarter 2002 |
| 21-24 | | 1.186 | | 1.202 | | 4th Quarter 2002 |
|
| Valuation Period in Months | | Average Paid
Development
for Accident Years
1998 and 1999 | | Paid
Development
for Accident Year
2000 | | Quarter in Which Development Occurred |
|
|---|
24-27 |
|
1.139 |
|
1.138 |
|
1st Quarter 2002 |
| 27-30 | | 1.120 | | 1.129 | | 2nd Quarter 2002 |
| 30-33 | | 1.083 | | 1.114 | | 3rd Quarter 2002 |
| 33-36 | | 1.072 | | 1.085 | | 4th Quarter 2002 |
|
We will continue to update the above information to provide a clear understanding of the trends in our business.
10
NET INCOME (LOSS) PER COMMON SHARE
INVESTMENTS
Investment activities are a major part of our revenues and earnings; we believe our portfolio is diversified to achieve a reasonable balance of risk and a stable source of earnings. Zenith primarily invests in debt securities, as compared to equities, and our largest holdings are U.S. Government securities. In comparison to other insurers, we believe our portfolio contains a smaller percentage of equities to total assets, a larger percentage of cash or short-term securities and no derivative securities or credit enhancement exposure.
- •
- Consolidated investment income after tax and after interest expense was $29.2 million, or $1.54 per share, in 2002 compared to $28.9 million, or $1.64 per share, in 2001. Average yields on this portfolio in 2002 were 4.9% before tax and 3.3% after tax compared to 5.6% and 3.7%, respectively, in 2001.
- •
- During 2002, Zenith recorded net losses before tax from our investment portfolio of $3.6 million compared to profits of $9.2 million the prior year. The net losses were primarily from write-downs due to declining credit quality or insolvencies, partially offset by gains from sales of debt securities.
- •
- Pre-tax income during 2002 from our discontinued real estate activities was $14.1 million, compared to $5.8 million the prior year.
- •
- Zenith's investment portfolio increased $156.8 million, or 16.6%, in 2002.
- •
- Unrealized gains in our portfolio of fixed maturity investments were $29.8 million before tax in 2002 compared to unrealized losses of $1.3 million before tax the prior year.
Zenith's investment portfolio is recorded in the financial statements primarily at market value. Average life of the bond portfolio was 5.6 years at December 31, 2002 compared to 6.6 years at December 31, 2001. The bond portfolio quality is high, with 94% and 95% rated investment grade at December 31, 2002 and 2001, respectively.
11
INVESTMENT ACTIVITIES ARE A MAJOR PART OF OUR REVENUES AND EARNINGS; WE BELIEVE OUR PORTFOLIO IS DIVERSIFIED TO ACHIEVE A REASONABLE BALANCE OF RISK AND A STABLE SOURCE OF EARNINGS.
The major developments affecting the U.S. bond markets were continued low inflation and declining interest rates. Since we are capable of holding bonds to maturity, and the average maturities are relatively short, fluctuations in bond values do not significantly impact our operations.
Short-term investments and liquidity remained high as we searched for investment opportunities and maintained cash to repay our maturing debt in 2002. We have invested only a small amount of our capital in common stocks, since we believe the volatility in the market could impact our ability to expand our insurance business. Management will continue to monitor conditions and at an appropriate time may reconsider our strategy.
|
|---|
Securities Portfolio
| At December 31, 2002
| | At December 31, 2001
|
|---|
|
| | Amortized Cost* | Market Value | | Amortized Cost* | Market Value |
|
| | (Dollars in thousands) |
| U.S. Government bonds | $166,744 | $170,920 | | $166,590 | $166,522 |
| Taxable bonds: | | | | | |
| Investment grade | 488,495 | 517,050 | | 492,167 | 495,179 |
| Non-investment grade | 49,373 | 46,061 | | 34,983 | 31,655 |
| Municipal bonds | 53,665 | 54,312 | | 7,797 | 7,888 |
| Redeemable preferred stocks | 21,762 | 25,285 | | 27,023 | 26,706 |
| Other preferred stocks* | 12,855 | 13,115 | | 12,287 | 11,888 |
| Common stocks* | 38,831 | 35,519 | | 29,411 | 28,394 |
| Mortgage loans | 26,924 | 26,924 | | 23,149 | 23,149 |
| Short-term investments | 158,078 | 158,078 | | 119,066 | 119,066 |
| Other | 54,788 | 54,788 | | 31,771 | 31,771 |
|
| Total | $1,071,515 | $1,102,052 | | $944,244 | $942,218 |
|
*Equity securities at cost
| | | |
In 1993, we started a home-building operation in order to participate in the growth of the Las Vegas, Nevada housing market. Initially, we invested $250,000 and loaned money to purchase Nevada
12
ALTHOUGH WE EARNED A PROFIT IN 2002, WE ARE ALSO AWARE THAT THE LEVEL OF PROFITABILITY MUST SUBSTANTIALLY IMPROVE IN ORDER TO ACHIEVE AN ADEQUATE RETURN ON EQUITY AND INTERNALLY GENERATE CAPITAL.
land. We built about 3,000 homes and this past year our capital had grown to $17.5 million. We received an unsolicited offer to sell the home-building business and related real estate assets at an attractive price and consummated a sale in the fourth quarter with a capital gain of $6.3 million after tax. We also received repayment of $28.4 million of loans from our parent company to the real estate subsidiary. The sales transaction also includes the possibility of additional payments during the next three years based on the performance of the Las Vegas operations. Although we had mixed emotions about selling this attractive business, the sale strengthens the financial position of our Company, provides financial flexibility for our growth and should make it easier to analyze and understand our business.
As previously reported, we made two large equity investments this past year; $13.0 million for one million shares of Wynn Resorts (NASDAQ) and $14.6 million in Advent Capital, a Lloyd's reinsurance vehicle of which we now own 20.9%. I am on the Boards of each of these businesses, both of which have strong management teams that have excellent long-term track records.
WORKERS' COMPENSATION
TheZenith is a specialist with primary operations in California, Florida, Texas and 42 other states. Gross premiums written in 2002 were $581.5 million, an increase of 32.9% from the prior year. California premiums were 55.9% of the total. Underwriting losses pre-tax were reduced to $43.8 million in 2002 compared to $58.3 million in the prior year. Our combined ratio improved to 108.7% in 2002 from 114.0% the prior year.
Growth of about 33% and 38% these past two years was caused by the interaction of an increase in the number of policies and a change in net rates, experience modifications and payrolls. We estimate that about one-half of the 2002 growth in premiums was due to rate changes and the balance is from our growth in business. At year-end 2002, there were 39,500 policies in-force, up 11.2% from the prior year. Restaurants represent the largest premium class of insureds.
13
WORKERS' COMPENSATION PREMIUMS IN-FORCE INCREASED BY 45.0% AND OUR COMBINED RATIO IMPROVED TO 108.7% FROM 114.0% THE PRIOR YEAR.
For almost a century, workers' compensation has been a comprehensive safety net available to workers and their families. It is a state-regulated system that pays for medical care, replaces lost wages and pays death benefits, even if terrorism is the cause.
Subsequent to September 11, we have become more focused on controlling our terrorism exposure since this coverage is mandated by state law. TheZenith's book of business comprises primarily small employers, a few large employers and a few insureds in high-rise buildings. Fortunately, large numbers of our insured employees are not concentrated in a given area or in single locations in high profile risk areas. We track this information carefully. With respect to bio-terrorism or travels by our insureds' employees to high profile areas, we are exposed on a more random basis. In any event, depending upon the nature and scope of a terrorist attack, large numbers of people could be affected and losses could be sizeable. Similar comments could be made about large earthquakes.
Rates are estimated to have increased 18% in 2002 and rate increases of 21% are planned for 2003. California increases were larger and amounted to about 28%. California 2003 rate increases are estimated to date at 30%, including about 11% for the new benefit legislation, and additional increases may be necessary depending on developments, including specifically trends caused by the new benefit legislation and loss development. Although employers obviously do not favor cost increases, workers' compensation prices during much of the last decade declined and employers enjoyed huge savings. Recent increases have probably increased employers' cost as a percentage of payroll to levels existing about 10 years ago, but industry profitability has not been restored, much less an adequate return on equity.
Our underwriting losses are declining as a result of higher prices and lower frequency trends, although frequency trends for the most expensive claims (permanent partial disability) are beginning to increase as a result of our growth in business. Disciplined underwriting, quality services and
14
SUBSEQUENT TO SEPTEMBER 11, WE HAVE BECOME MORE FOCUSED ON CONTROLLING OUR TERRORISM EXPOSURE SINCE THIS COVERAGE IS MANDATED BY STATE LAW.
expense controls are improving financial results. Continued higher average claim costs (health care and disability rating increases are significant) plus exposure to terrorism are a reality and necessitate continued rate increases and underwriting discipline. Our accident year loss ratios remain substantially below industry averages, as set forth in the following table:
|
|---|
| | California
| | Outside of California
|
|---|
Accident Year
Loss Ratios
|
|---|
| | Zenith
| | Industry
| | Zenith
| | Industry
|
|---|
|
|---|
| 1997 | | 72% | | 111% | | 53% | | 69% |
| 1998 | | 74% | | 125% | | 54% | | 70% |
| 1999 | | 85% | | 134% | | 59% | | 74% |
| 2000 | | 79% | | 122% | | 59% | | 78% |
| 2001 | | 73% | | 105% | | 57% | | 77% |
| 2002 | | 60% | | 89% | | 51% | | —% |
TheZenith's loss ratios outperform the industry due to a number of factors: actuarial rates, reasonable (not perfect) reserving accuracy, disciplined underwriting and a commitment to quality services. At present, adverse industry results, low interest rates, new California benefits and estimates of large industry reserve shortfalls are causing rates to continue to increase significantly. We are writing more policies (an increase of 11.2%) but are continuing to be selective in choosing which accounts to insure.
This strategy causes our premium volume to fluctuate depending on our competitors' pricing and growth strategies compared to our own. At the same time, it allows us to maintain our discipline and record of producing low loss ratios and consistently outperforming the industry. Significantly, agents and brokers appreciate the value of our services and want to do business with us, as long as our pricing is within the competitive "ballpark." Based on current market conditions and the cost of the
15
OUR LOSS RATIOS OUTPERFORM THE INDUSTRY DUE TO A NUMBER OF FACTORS: ACTUARIAL RATES, REASONABLE RESERVING ACCURACY, DISCIPLINED UNDERWRITING AND A COMMITMENT TO QUALITY SERVICES.
recently effective new California benefits, we expect California premium dollars to continue to grow faster than in other states. At present, California is about a $15 billion market and our California in-force premium at year-end was $350.2 million compared to $210.4 million at the end of 2001. Our total in-force premium at year-end was $609.4 million.
Along with pricing changes and estimates of large industry reserve shortages, the most significant developments last year were the continued substantial cost increases in healthcare and reinsurance and the activities and discussion surrounding the California State Compensation Insurance Fund. Healthcare trends are averaging increases of 15% (more in California) and reinsurance costs increased by an estimate of 30%.
2002 claim frequency trends remain favorable despite a weakening economy; severity trends continue to increase in amounts substantially greater than the rate of inflation. Severity trends are caused primarily by significant increases in health care costs, now in excess of 50% of our total loss costs, and increases in disability ratings without benefit increases. We do not understand all of the causes of these trends and certainly are not aware of any major solutions that are either imminent or politically feasible. As a result, we must price our new and renewal business accordingly, and establish reserves with the assumption that severity trends will continue to increase by double-digit amounts per year. With this in mind, we are redoubling our efforts to protect ourselves and our insureds from excessive health care charges and other aspects of the claim process, which impact costs.
The California State Compensation Insurance Fund (the "Fund") has grown rapidly during the last several years to more than 40% of the market, and its financial strength has been questioned by many, including ourselves. It should be obvious that if the Fund undercuts pricing in the private market and continues to lose money to gain market share, it will not only weaken the Fund
16
EMPLOYERS WHO INSTILL SAFE WORK PRACTICES, TRAIN THEIR MANAGERS IN PROPER ADMINISTRATION, AND COOPERATE WITH OUR SPECIALISTS, MAY WELL SEE SAVINGS IN THE ULTIMATE COST OF THEIR INSURANCE.
financially and cause it to be in non-compliance with applicable law, but it will also adversely affect competition and the private market. During this past year, the Fund apparently raised rates and entered into reinsurance transactions to improve its financial strength while providing a needed market for certain California employers. Unfortunately, they were prevented from adding needed staff by a state hiring freeze until early this year. We are hopeful that Fund management will focus on its financial and operational needs rather than market share and operate in compliance with state law which states "The Fund shall…be fairly competitive with other insurers, and it is the intent of the Legislature that the Fund shall…be neither more nor less than self-supporting." In conclusion, we believe that a financially strong and competitive State Fund is in everyone's best interest.
On March 3, 2003, California Insurance Commissioner John Garamendi announced a plan to correct the State Fund's financial condition. The plan involves reducing premium income, increasing surplus, strengthening management and creating operating efficiencies. Specifically, brokers' commissions will be reduced, rate increases will be implemented on July 1 and new business will be restricted to situations in which insurance is not available from any other source. I believe that this plan, as implemented, will be in everyone's interest and congratulate the Insurance Commissioner for taking decisive action.
TheZenith is mindful that many of our policyholders are experiencing difficult times due to the economy and increases in insurance costs, including workers' compensation costs which are difficult to absorb. Some employers and industry critics conveniently forget that insurance was purchased at low rates for a number of years. Unfortunately, there is no alternative at this time to substantial price increases for the reasons previously discussed. However, employers who instill safe work practices, train their managers in proper workers' compensation administration, and cooperate with TheZenith's proven specialists will realize the best combination of service and savings. Certain small policyholders
17
THE ANSWER TO EMPLOYERS' CONCERNS ABOUT INCREASING WORKERS' COMPENSATION PREMIUMS IS REAL REFORM THAT REDUCES THE SYSTEM'S COST DRIVERS.
who rarely have claims cannot comprehend, however, the reason their insurance costs continue to increase. Although we can appreciate the problem, the basic principle of insurance requires that all insureds contribute to create a larger pool to pay for the ever increasing cost trends of all claims, even though each insured's claim history varies from zero claims to one or more in any year. The obvious answer to increasing costs is to reform the system so that rate decreases are justified.
Reducing employer loss ratios, experience modifications, and ultimately the long-term cost of their insurance is our hallmark and our mission. We have specialized for many years in providing necessary services and information to assist employers. TheZenith's value-added services, implemented in partnership with our policyholders, have an excellent record of reducing the net cost of insurance to some of our customers.
- •
- Expert Safety and Health professionals and programs assist with accident and illness prevention, incident investigation and remediation, and safe-work practices education for management and employees.
- •
- Claims and Medical/Disability Management procedures facilitate prompt injury reporting, the use of recommended physicians (where permitted state-by-state), nurse case management of serious claims, analysis and negotiation of hospital and medical bills, and ongoing communications and reviews to monitor and manage recoveries, costs and reserving.
- •
- Special Investigation Unit and specialized Workers' Compensation legal personnel protect employers from fraud and abuse, negotiate settlements where prudent, and represent policyholders and our Company throughout the litigation process as appropriate.
18
OUR SPECIALIST APPROACH TO WORKERS' COMPENSATION CUSTOMERS PROVIDES BOTH QUALITY SERVICES AND SAVINGS.
- •
- Return to Work programs place recovering employees in transitional duties with physician approval, improving employer morale and productivity, while containing costs. Recent legislation in California will provide future tax credits to stimulate Return to Work involvement by employers.
- •
- Premium Auditors provide proper payroll classifications to assure accuracy and avoid unanticipated retroactive billing.
- •
- E-Commerce on the Internet provides valuable current information to our agents and insureds. We quote and bind policies through TheZenith Connection and we anticipate this will grow in the future.
Quality services require a substantial infrastructure investment in experienced employees and technology, a long-term commitment and investment in the continuous training and development of our people, a stable, motivated workforce and teamwork among different talents. We are confident in the abilities of our people to provide above-average results and solve difficult problems. They are our most important asset. Even so, continuous improvements are needed in training and technology for us to reach our true potential in a fast-changing environment. We frequently audit our legal, claims and healthcare efforts with outside experts in order to assure the quality of our services and make adjustments, as needed.
As a result of large insolvencies, it is expected the California Insurance Guarantee Association will be required to fund hundreds of millions of dollars in losses. Each of our policyholders (and all policyholders in the State) will be assessed up to 2% of their premiums annually to cover these losses under current law for the forseeable future.
We explore acquisition opportunities from time to time. Although many acquisitions can be made at what appear to be cheap or reasonable prices, we have reached the conclusion that the time, risk
19
OUR PEOPLE ARE TALENTED AND PROVIDE OUR MOST IMPORTANT ASSET.
and talent needed to improve the quality of these "opportunities" are not worth the effort or the distraction from our own business. In summary, we have not found any well run insurance business with capable management at attractive prices to purchase.
WORKERS' COMPENSATION REGULATION
Our business is highly regulated and both positive and negative developments occur from time to time through regulation, legislation or court decisions.
The U.S. Government worked throughout 2002 on a plan under which the risk of loss from future terrorist acts would be shared for a limited period of time between the insurance industry and the government. Under the legislation enacted in November, workers' compensation losses would be covered above a deductible for a three-year period. The deductible would be 7%, 10% and 15% of the annual earned premiums of the insurer and its affiliates for the year prior to the attack and the government would pay 90% of a company's loss above its deductible up to its proportionate share of $100.0 billion of aggregate losses. Our deductible for 2003 appears to be about $38 million, for which we have purchased about $22.5 million of reinsurance. Unfortunately, the legislation is ambiguous with respect to a company like Zenith, where companies controlled by Fairfax own 42% of our outstanding stock and Fairfax has disclaimed control. If we were considered part of the Fairfax Group for purposes of this statute, the deductible amount would be substantially greater because Fairfax's total premiums would be added to ours. We are seeking clarification of this ambiguity from the U.S. Treasury Department.
In California, increased legislated benefits became effective January 1, 2003 and new, renewal and in-force prices were adjusted accordingly. Concerns exist as to whether the new benefits will change decade-long favorable frequency trends. Also, the new legislation modifies the "treating physician
20
E-COMMERCE PROVIDES VALUABLE INFORMATION TO OUR AGENTS AND INSUREDS; WE QUOTED ABOUT $97 MILLION OF WORKERS' COMPENSATION BUSINESS AND BOUND 23% OF IT IN 2002 THROUGH THEZENITH CONNECTION.
presumption" and provides other reforms, which may save money, but the proof will not be available for several years. As a result, estimating the correct premiums for this legislation is difficult and we will monitor developments carefully.
John Garamendi was re-elected Insurance Commissioner and took office early this year. During his prior term and based on recent statements, he is likely to focus discussion on universal health insurance or integrating health insurance and workers' compensation in a manner that may be perceived as reducing costs to business. We explored integration in the 1990's and were unable to achieve savings. In any event, structural changes to the system are legislative matters, and we certainly welcome any reasonable initiatives that can reduce the trend of cost increases.
In Florida, our second largest state, the Commissioner approved a 13.7% increase effective April 1, 2003 on policies written on or after January 1, 2003. The Commissioner has urged the legislature to enact reforms to the system that would result in premium reductions. A commission appointed by the Governor has filed a report with recommendations for major changes to the system, among which are better benefits for injured workers, lower rates for employers, safer workplaces and reduced fraud.
Substantial increases in premiums can be expected to lead to political discussion of reforms that may reduce rates or regulatory changes that may cause the same result. We are not able to predict whether any legislative or regulatory changes may occur. We are mindful, however, that well intentioned changes do not always bring about the desired results, and are skeptical that there is any political will to pursue serious and fundamental reform that will materially change the workers' compensation environment unless labor and management previously agree to such changes at the bargaining table.
21
IN CALIFORNIA, INCREASED BENEFITS BECAME EFFECTIVE JANUARY 1, 2003 AND NEW, RENEWAL AND IN-FORCE PRICES WERE ADJUSTED.
REINSURANCE ASSUMED BUSINESS
Since 1985, TheZenith has been selectively underwriting assumed treaty and facultative reinsurance and our combined ratio has averaged 101.6%. Reinsurance represents 9.3% of our property-casualty volume, while reserves represent 15.8% of our total property-casualty reserves. We believe this business will continue to provide long-term profitable diversification to our basic Workers' Compensation operations.
During 2002, the net written premium of this operation was $58.8 million compared to $65.6 million in 2001. Earned premium was $53.2 million compared to $61.0 million the prior year. Reinsurance premiums from year to year are not comparable since the 2001 premiums included reinstatement premiums from the World Trade Center losses. Underwriting profits of $7.6 million were recorded in 2002 compared to underwriting losses of $31.9 million the prior year. During the past two years, the majority of written premium was derived from worldwide catastrophe business.
Accounting for the property catastrophe Reinsurance business has a different result from our other property-casualty business. At the end of each reporting period, income is recognized without reserves being established if no major catastrophe has occurred. In our other businesses, reserves are mandated based upon actual events as well as expected loss patterns. As a result, there may be large fluctuations (positive or negative) in underwriting results for the property catastrophe Reinsurance business in the short-term since only actual events are considered and estimates are then established. Estimating an unprecedented loss such as September 11, with significant disputes already pending, is not an exact science. During 2002, we did not change our estimates of the September 11 losses, and we have paid $17.5 million, or 36% of the total loss estimate of $48.0 million.
22
2002 UNDERWRITING PROFITS FROM REINSURANCE OPERATIONS WERE $7.6 MILLION COMPARED TO LOSSES OF $31.9 MILLION THE PRIOR YEAR.
As previously mentioned, we now own 20.9% of Advent Capital, a Lloyd's reinsurance vehicle, which operates Syndicate 780. We will account for this investment under the equity method with a quarter lag. Although the equity method does not record the percentage of Advent Capital premium in our premium, from an analytical point of view our 20.9% ownership of Advent Capital would approximate about $30 million of additional annual reinsurance premium. Advent Capital specializes in worldwide property catastrophe reinsurance and certain marine coverages.
DIRECTORS
Our friend, partner, proud Zenith shareholder and Director for more than 25 years, Harvey Silbert, passed away this past September. Words can't adequately describe his favorable influence on our business and on me personally, which fortunately will continue over the long-term.
Alan Rothenberg, an attorney, former head of the State Bar of California, and CEO of the World Cup Soccer Championships held in the U.S. in 1994 joined our Board in September. I have known Alan for many years and anticipate that his business and legal background will contribute significantly to our Company in the years ahead.
CORPORATE GOVERNANCE
Zenith is strongly committed to the principles of good corporate governance. Except for myself, the members of your Board of Directors are all independent of management. There are three Board Committees, each also consisting of independent members: an Audit Committee, a Nominating and Corporate Governance Committee, and a Compensation Committee. Please visit our web site, www.thezenith.com, where you can read the charters of these committees and our Codes of Ethics. In addition to its regular meetings, the Board has met and will be meeting routinely in executive sessions, without the participation of management.
23
ZENITH IS STRONGLY COMMITTED TO THE PRINCIPLES OF GOOD CORPORATE GOVERNANCE AND, EXCEPT FOR MYSELF, THE MEMBERS OF YOUR BOARD OF DIRECTORS ARE ALL INDEPENDENT OF MANAGEMENT.
Our Audit Committee is independent and extremely well qualified. The Chairman is Michael Zavis, a Chicago lawyer who built a major law firm, practiced business law and has demonstrated for several years that he is highly qualified to chair this Committee. Mr. Gerald Tsai has been designated a financial expert under the SEC rules, and Messrs. Leon Panetta and Robert Miller are individuals with long government experience dealing with complex budget and financial issues and private sector experience as corporate directors.
We have had an Internal Audit Department for a number of years. We also outsource certain internal audit and other quality assurance activities to independent consulting firms. We have established a Disclosure Committee of senior executives to gather and assess all relevant information about the Company in order to assure that our disclosures are timely and complete.
INFORMATION TECHNOLOGY
Improving the functionality of our claims systems and delivering services via web-based technologies are our two primary objectives. We are building our systems around an architecture that will support more rapid adaptation to changing business dynamics, interfaces with multiple business partners, improved and streamlined critical information delivery and standardization of workflows around best practices. This improved method of integrating services is commonly referred to as "Web services technology." Additionally, we are focused on consolidating our three separate systems into a single national platform. Certain important milestones were achieved in 2002. For example, over 95% of our new and renewing policies are now processed on a single system. In addition, one of our claims systems was fully retired. Our systems recovery capability was substantially enhanced and proven through several successful tests and external validation. Work in all these areas will continue in 2003, and beyond, as we insist on improving productivity.
24
WE ARE ENCOURAGED BY THE DEMAND FOR OUR WORKERS' COMPENSATION POLICIES AND THE MORE FAVORABLE PRICING TRENDS.
ACCOUNTING DISCLOSURE
Our financial statements include full disclosure of the accounting policies, estimates and judgments used in their preparation. As we have discussed in previous reports, estimation of loss reserves is a significant component of the preparation of our financial statements. Our costs of goods sold (losses incurred) are not quantifiable with a high degree of certainty for several years until a large percentage of the claims for a given year are resolved.
Our Workers' Compensation actuaries perform comprehensive actuarial analysis every quarter and consider several methods of projecting reserves, the most important of which is trending paid losses. Assumptions are required to estimate reserves and the key assumption presently being used is that the most recent paid loss inflation trends for medical and indemnity should be reflected in our estimates of ultimate losses. Despite talented actuaries and reasonable efforts to predict loss reserve estimates, trends from time to time are different from estimates and charges must be made in the current period to earnings. This occurred in the fourth quarter of 2002 and resulted in $30.0 million of pre-tax charges reducing earnings in the quarter and for the year. We discuss loss reserve estimates and other important accounting matters on pages 7-10 and in the Management's Discussion and Analysis and in the Notes to Consolidated Financial Statements sections of this report.
CONCLUSION
We are in the business of managing insurance and investment risk on a profitable basis over the long-term. We are encouraged by the demand for our Workers' Compensation policies, the return to profitability and the more favorable pricing trends that continue in both the Workers' Compensation
25
WE EXPECT THE IMPROVED PRICING OF 2002 AND 2003 TO CONTINUE PRODUCING HEALTHY CASH FLOW TO PAY CLAIMS AND TO INCREASE INVESTABLE FUNDS.
and Reinsurance businesses. These trends caused revenue growth in excess of cost increases resulting in improving profitability. Unfortunately, low interest rates prevented us from maximizing our earnings potential, but had the favorable result of increasing the value of our bond portfolio.
Even though our profitability improved and favorable trends continue, we were disappointed by the unanticipated reserve development of $30.0 million pre-tax reported in the fourth quarter due to severity trends in excess of estimates in our California Workers' Compensation business. We have built double-digit loss cost trends in our pricing models and believe that our reserves are adequate and conservatively stated. Unfortunately, from time to time, our reserve estimates may prove to be inaccurate which is an inherent risk of estimates and the business. Due to the characteristics of our Workers' Compensation business, we can monitor necessary adjustments relatively quickly and adjust pricing, if necessary, in California, our largest premium state.
Assuming the demand for Workers' Compensation policies continues to remain strong, it is likely that we will need additional statutory capital in order to support the continuation of our A.M. Best rating of A-.
It has been our practice not to forecast results or provide earnings guidance. This is due primarily to two factors: 1) the opportunistic nature of our business and the risks inherent in it, including reserve fluctuations and 2) the need to prevent any pressure on our management to write insurance business at inadequate or unsatisfactory prices or terms in order to achieve forecasts. We have followed this practice for years and believe it assists in producing the best long-term results.
26
THE MOMENTUM OF OUR GROWING BUSINESS SHOULD PRODUCE A MULTI-YEAR TREND OF IMPROVING OPERATING FUNDAMENTALS AMIDST A CLIMATE OF POLITICAL AND ECONOMIC UNCERTAINTY.
Even though we do not forecast results or provide "guidance," we understand the need to achieve sustained earnings improvements and historically-low combined ratios in order to achieve adequate returns on equity and to internally generate capital. Despite the improving trends, we are as impatient as many of our shareholders to achieve favorable results. We respond in a timely fashion to appropriate and factual inquiries from shareholders and analysts as to our progress.
We expect the improved pricing of 2002 and 2003 to continue producing healthy cash flow to pay claims and to increase investable funds. The momentum of our growing business should produce a multi-year trend of improving operating fundamentals amidst a climate of political and economic uncertainty.
Our most important asset is our people. Skilled experienced insurance talent is the backbone of our business. It is clear to me that we must expand our internal training efforts in order to enhance the potential of our employees, both individually and as members of a team, focused on achieving our long-term objectives.
We appreciate the confidence of our agents, brokers, reinsurers and shareholders and the wisdom and judgment of our distinguished Directors. These individuals and firms, along with our excellent employees, have assisted this management team for the past 26 years under my leadership, and I acknowledge their contributions to our progress and in positioning us for the future.

Stanley R. Zax
Chairman of the Board and President
Woodland Hills, California, March 2003
27
MANAGEMENT'S DISCUSSION AND ANALYSIS OF CONSOLIDATED
FINANCIAL CONDITION AND RESULTS OF OPERATIONS
Zenith National Insurance Corp. ("Zenith National") is a holding company engaged, through its wholly-owned subsidiaries (primarily Zenith Insurance Company ("Zenith Insurance")), in the property and casualty insurance business. Unless otherwise indicated, all references to "Zenith," "we," "us," "our," the "Company" or similar terms refer to Zenith National together with its subsidiaries.
Forward-Looking Information
The Private Securities Litigation Reform Act of 1995 provides a safe harbor for forward-looking statements if accompanied by meaningful cautionary statements identifying important factors that could cause actual results to differ materially from those discussed. Forward-looking statements include those related to the plans and objectives of management for future operations, future economic performance, or projections of revenues, income, earnings per share, capital expenditures, dividends, capital structure, or other financial items. Statements containing words such asexpect, anticipate, believe, estimate, or similar words that are used in this Management's Discussion and Analysis of Consolidated Financial Condition and Results of Operations, in other parts of this report or in other written or oral information conveyed by or on behalf of Zenith, are intended to identify forward-looking statements. The Company undertakes no obligation to update such forward-looking statements, which are subject to a number of risks and uncertainties that could cause actual results to differ materially from those projected. These risks and uncertainties include, but are not limited to, the following: (1) competition; (2) adverse state and federal legislation and regulation; (3) changes in interest rates causing fluctuations of investment income and fair values of investments; (4) changes in the frequency and severity of claims and catastrophes; (5) adequacy of loss reserves; (6) changing environment for controlling medical, legal and rehabilitation costs, as well as fraud and abuse; (7) losses associated with terrorist attacks such as the attack on the World Trade Center on September 11, 2001, and (8) other risks detailed herein and from time to time in Zenith's other reports and filings with the Securities and Exchange Commission.
Overview
Zenith's long-term source of consolidated earnings is principally the income and investment income from the operation of its property-casualty insurance business (Workers' Compensation and Reinsurance) and its investment portfolio. Workers' Compensation represents insurance coverage for the statutorily prescribed benefits that employers are required to pay to their employees injured in the course of employment. During 2002, Zenith wrote workers' compensation insurance in 45 states, but the largest concentrations, 55% and 19% of the Workers' Compensation premiums earned during 2002, were in California and Florida, respectively. The concentration of Zenith's business in these states makes the results of operations highly dependent on the states' economic, social and cultural trends, legislative and regulatory changes, and catastrophic events such as windstorms and earthquakes. Reinsurance principally consists of assumed reinsurance of property losses from worldwide catastrophes and large property risks. Results of the Reinsurance operations can be adversely impacted in periods that sustain large catastrophe losses. Our investment portfolio provides income and realized gains on investments, primarily from investments in debt securities. The holding company activities of Zenith National are set forth as Parent Expenses
28
and Interest Expense. The comparative components of net income (loss) after tax for the three years ended December 31, 2002 are set forth in the table below.
| |
|---|
(Dollars in thousands)
| | 2002
| | 2001
| | 2000
| |
|---|
| |
|---|
| Net investment income | | $ | 32,489 | | $ | 33,841 | | $ | 34,243 | |
| Realized (losses) gains on investments | | | (2,360 | ) | | 5,960 | | | (10,054 | ) |
| |
| Subtotal | | | 30,129 | | | 39,801 | | | 24,189 | |
| Property-casualty underwriting results: | | | | | | | | | | |
| | Loss excluding catastrophes | | | (23,561 | ) | | (32,831 | ) | | (53,251 | ) |
| | Catastrophe losses | | | (260 | ) | | (27,105 | ) | | (14,690 | ) |
| |
| Property-casualty underwriting loss | | | (23,821 | ) | | (59,936 | ) | | (67,941 | ) |
| Interest expense | | | (3,317 | ) | | (4,924 | ) | | (3,666 | ) |
| Parent expenses | | | (3,338 | ) | | (2,487 | ) | | (3,927 | ) |
| Equity in earnings (losses) of investee | | | 1,363 | | | (2,060 | ) | | | |
| |
| Income (loss) from continuing operations before extraordinary item | | | 1,016 | | | (29,606 | ) | | (51,345 | ) |
| Income from discontinued operations(1) | | | 9,184 | | | 3,746 | | | 3,552 | |
| |
| Income (loss) before extraordinary item | | | 10,200 | | | (25,860 | ) | | (47,793 | ) |
| Extraordinary item-gain on extinguishment of debt | | | | | | | | | 993 | |
| |
| Net income (loss) | | $ | 10,200 | | $ | (25,860 | ) | $ | (46,800 | ) |
| |
(1) Includes realized gain on the sale of the real estate operations of $6.3 million in 2002.
Results of continuing operations improved in 2002 compared to 2001 and 2000 principally as a result of reduced underwriting losses in the insurance operations. Net income in 2002 was reduced by a charge of $19.5 million, or $1.04 per share, for an increase in workers' compensation loss reserves in the fourth quarter. The net loss in 2001 includes $24.4 million, or $1.39 per share, of estimated losses attributable to the World Trade Center events of September 11, 2001.
Results of the Workers' Compensation and Reinsurance operations for the three years ended December 31, 2002 are set forth in the table that follows.
| |
|---|
(Dollars in thousands)
| | 2002
| | 2001
| | 2000
| |
|---|
| |
|---|
| Premiums earned: | | | | | | | | | | |
| | Workers' Compensation: | | | | | | | | | | |
| | | California | | $ | 277,120 | | $ | 205,835 | | $ | 137,497 | |
| | | Outside California | | | 226,739 | | | 210,013 | | | 163,336 | |
| |
| | Total Workers' Compensation | | | 503,859 | | | 415,848 | | | 300,833 | |
| | Reinsurance | | | 53,196 | | | 61,028 | | | 37,919 | |
| |
| Total | | $ | 557,055 | | $ | 476,876 | | $ | 338,752 | |
| |
| Underwriting (loss) income before tax: | | | | | | | | | | |
| | Workers' Compensation | | $ | (43,848 | ) | $ | (58,329 | ) | $ | (87,854 | ) |
| | Reinsurance | | | 7,644 | | | (31,918 | ) | | (14,536 | ) |
| |
| Total | | $ | (36,204 | ) | $ | (90,247 | ) | $ | (102,390 | ) |
| |
| Combined loss and expense ratios: | | | | | | | | | | |
| | Workers' Compensation: | | | | | | | | | | |
| | | Loss and loss adjustment expenses | | | 80.9% | | | 83.8% | | | 96.4% | |
| | | Underwriting expenses | | | 27.8 | | | 30.2 | | | 32.8 | |
| |
| Combined ratio | | | 108.7% | | | 114.0% | | | 129.2% | |
| |
| | Reinsurance: | | | | | | | | | | |
| | | Loss and loss adjustment expenses | | | 64.7% | | | 136.9% | | | 124.0% | |
| | | Underwriting expenses | | | 20.9 | | | 15.4 | | | 14.3 | |
| |
| Combined ratio | | | 85.6% | | | 152.3% | | | 138.3% | |
| |
| Total: | | | | | | | | | | |
| | | Loss and loss adjustment expenses | | | 79.4% | | | 90.6% | | | 99.4% | |
| | | Underwriting expenses | | | 27.1 | | | 28.3 | | | 30.8 | |
| |
| Combined ratio | | | 106.5% | | | 118.9% | | | 130.2% | |
| |
The key operating goal for our insurance business is to achieve a combined ratio of 100% or lower. The combined ratio, expressed as a percentage, is the key measure of underwriting profitability traditionally used in the property-casualty insurance business. It is the sum of net incurred loss and loss adjustment expenses, underwriting expenses and policyholders' dividends, expressed as a percentage of net premiums earned.
29
Zenith's profitability is principally dependent upon the adequacy of rates charged to the insured for insurance protection; the frequency and severity of claims and catastrophes; the ability to accurately estimate and accrue reported and unreported losses in the correct period; and the ability to manage claim costs and operating expenses. Some of the factors that continue to impact the business and economic environment in which Zenith operates include: intense price competition; poor operating results and reports of substantial under estimation of reported loss reserves in the national workers' compensation insurance industry; an uncertain political and regulatory environment, both state and federal; the outlook for economic growth in geographic areas where Zenith operates; the frequency and severity of claims and catastrophes; the changing environment for controlling medical, legal and rehabilitation costs, as well as fraud and abuse; and any future terrorist attacks such as the September 11, 2001 attacks. Fluctuations in interest rates cause fluctuations in Zenith's investment income and the fair values of our investments. Although management is currently unable to predict the effect of any of the foregoing, these factors, related trends and uncertainties could have a material effect on Zenith's future operations, financial condition and cash flows.
Critical Accounting Policies and Estimates
The preparation of financial statements in accordance with generally accepted accounting principles ("GAAP") requires both the use of estimates and judgment relative to the application of appropriate accounting policies. Zenith's accounting policies are described in the Notes to Consolidated Financial Statements, but we believe that the following matters are particularly important to an understanding of Zenith's financial statements.
Loss Reserve Estimation. Accounting for property and casualty insurance operations requires us to estimate the liability for unpaid losses and loss adjustment expenses ("loss reserves") as of the balance sheet date. The amount by which estimated losses, measured subsequently by reference to payments and additional estimates, differ from those originally reported for a period is known as "development." Development is unfavorable when losses ultimately settle for more than the levels at which they were reserved or subsequent estimates indicate a basis for reserve increases on open claims. Development is favorable when losses ultimately settle for less than the amount reserved or subsequent estimates indicate a basis for reducing loss reserves on open claims. Favorable or unfavorable development of loss reserves is reflected currently in earnings. The impact of loss reserve development on the results of operations in each of the three years ended December 31, 2002 is discussed below under "Loss Reserves." Also included is a discussion of some of the assumptions underlying our loss reserve estimates and the sensitivity of our loss reserve estimates to our important assumptions. A 10-year history of the development of Zenith's loss reserves is set forth in the Property-Casualty Loss Development table in Item 1 of Zenith's Annual Report on Form 10-K for the year ended December 31, 2002. Our current loss reserve estimates may be subject to development in future years and reserve development may take a long time to appear because of the uncertainty inherent in currently estimating long-term liabilities.
Investments. The majority of our investments are investments in fixed maturity or equity securities, which are recorded at their fair values. Changes in these fair values are reflected as a separate component of stockholders' equity.
30
However, when, in the opinion of management, a decline in the fair value of an investment is considered to be "other-than-temporary," such investment is written-down to its fair value and the amount written-down is reflected in earnings as a realized loss. The determination of other-than-temporary includes, in addition to other relevant factors, a presumption that if the market value is below cost by a significant amount for a period of time, a write-down is necessary. During the years ended December 31, 2002, 2001 and 2000, there were $11.1 million, $12.7 million and $22.5 million, respectively, of such write-downs reflected as a reduction of net realized gains. A further discussion of investment write-downs is set forth under "Investments."
Deferred Policy Acquisition Costs. Certain direct policy acquisition costs consisting of commissions, premium taxes and certain other underwriting costs, are deferred and amortized as the underlying policy premiums are earned. At December 31, 2002 and 2001, deferred policy acquisition costs were $13.4 million and $12.7 million, respectively, related to unearned premiums of $97.4 million and $71.3 million, respectively. If the expected claims costs and other policy-related costs related to the unearned premiums exceeded those unearned premiums, a premium deficiency would exist and policy acquisition costs that otherwise were deferred would be expensed. At December 31, 2002 and 2001, our estimates indicated that there was no premium deficiency and a premium deficiency would not occur until our estimated loss and loss adjustment expense ratio in 2002 was increased by about 12 percentage points.
Deferred Income Taxes. Zenith makes provisions for deferred income taxes based on temporary differences between the tax bases and book bases of assets and liabilities. At December 31, 2002 and 2001, Zenith recorded net deferred tax assets of $32.4 million and $35.6 million, respectively, including assets of $35.8 million and $33.3 million, respectively, attributable to the fact that the Internal Revenue Code requires property and casualty insurance companies to discount the tax deduction for loss reserves. We do not discount loss reserves in our financial statements. We expect that the net deferred tax asset is fully recoverable because all future deductible amounts associated with temporary differences can be offset by anticipated future taxable income, including investment income or available refunds from prior years. If this assumption were to change, any amount of the net deferred tax asset which we could not expect to recover would be provided for as an allowance and would be reflected as an increase in income tax expense in the period in which it was established.
Loss Reserves
Our loss reserves were as follows:
|
|---|
December 31,
(Dollars in millions)
| | 2002
| | 2001
| | 2000
|
|---|
|
|---|
| Workers' compensation: | | | | | | | | | |
| | Unpaid loss and loss adjustment expenses | | $ | 910 | | $ | 802 | | $ | 778 |
| | Receivable from reinsurers and state trust funds for unpaid losses | | | 215 | | | 202 | | | 241 |
|
| Unpaid loss and loss adjustment expenses, net of reinsurance | | $ | 695 | | $ | 600 | | $ | 537 |
|
| Reinsurance: | | | | | | | | | |
| | Unpaid loss and loss adjustment expenses | | $ | 132 | | $ | 145 | | $ | 100 |
| | Receivable from reinsurers for unpaid losses | | | 1 | | | 2 | | | 3 |
|
| Unpaid loss and loss adjustment expenses, net of reinsurance | | $ | 131 | | $ | 143 | | $ | 97 |
|
| Total: | | | | | | | | | |
| | Unpaid loss and loss adjustment expenses | | $ | 1,042 | | $ | 947 | | $ | 878 |
| | Receivable from reinsurers and state trust funds for unpaid losses | | | 216 | | | 204 | | | 244 |
|
| Unpaid loss and loss adjustment expenses, net of reinsurance | | $ | 826 | | $ | 743 | | $ | 634 |
|
31
We continually monitor loss development trends and data to establish adequate premium rates and reasonable loss reserve estimates. Loss reserves, which are based on estimates, are inherently uncertain and represent a significant risk to the business which we attempt to mitigate by continually improving and refining our workers' compensation claims processing practices and by employing actuarial estimation methods. More information about our workers' compensation claims operation can be found in Item 1 of Zenith's Annual Report on Form 10-K for the year ended December 31, 2002 under "Loss and Loss Expense Reserves and Claims and Loss Developments." In our financial statements, actuarial techniques and methods are utilized to establish the most reasonably accurate estimate of loss reserves at a point in time including an estimate of the probable amount for unreported claims arising from accidents that have not yet been reported to the Company, commonly known in the industry as "incurred but not reported" or "IBNR." At the end of every quarter, our actuaries perform a comprehensive review of our loss reserves during which they consider the results of various methods of estimation. Generally, the results of any one method of estimation are not appropriate under all circumstances and do not produce reliable estimates for reserves for all accident years. Our actuaries use the results of their estimation methods to produce a single estimate (a "point estimate") of total loss reserves, and not a range of estimates. Management's best estimate of loss reserves (as recorded in the financial statements) is generally consistent with the actuarial estimate. At December 31, 2002, our loss reserves in the financial statements were lower than the actuarial point estimate by about $16 million (or 2%) of our loss reserves, net of reinsurance. The principal difference is attributable to management's estimate of liability reserves in the reinsurance business. Some of the important assumptions contained in our loss reserve estimates at December 31, 2002 are as follows:
Workers' compensation loss reserves. First, we made an assumption that our workers' compensation loss reserve estimates for claims in the most recent years should continue to reflect the historical trend of increasing claims severity. Severity is the average cost of a claim, which has increased consistently over recent years. The trend of increasing severity, or inflation, is attributable to a combination of factors that include increasing medical costs and increasing indemnity payments (reimbursements to injured workers for lost wages) per claim. We have also observed a decline in the number of claims being reported over the last several years. The declining frequency of claims contributes to the increasing severity trend because the frequency decline has been concentrated in less expensive claims (claims involving less time-off from work and less severe injuries). We have observed this continuing inflationary trend in the amounts we have already paid out for claims in the most recent accident years, and we have assumed that our estimate of the ultimate cost of these claims, and, therefore, our loss reserve estimates, must reflect substantially similar rates of inflation. The average severity trend, or inflation rate, contained in our year-end loss reserve estimates is an increase of 14% for the average cost of 1999 claims over 1998, 10% for 2000 claims over 1999, 17% for 2001 claims over 2000 and 10% for 2002 claims over 2001.
Second, we made an assumption that historical paid loss data are the most reliable indicator of the ultimate liability for loss reserves and we attributed greater weight to estimates using paid losses. Other data such as reserve estimates made by examiners in our claims department tend to reflect changes in
32
operating and management practices over the years and underlying trends may be obscured. To obtain loss reserve estimates, paid loss data are arrayed by year of the underlying accident ("accident years") and the cumulative paid amounts at the end of subsequent accounting periods are displayed. The historical annual increase in cumulative totals, known as development factors, are used to project the ultimate amount to be paid for all years. We assumed that the development factor for the most recent annual change, known as the most recent or the one-year development factor, is the most reliable indicator of the future because it reflects current underlying inflation trends, particularly health care costs.
Estimating the impact of the inflation trend is the major risk factor in our workers' compensation loss reserve estimates. Future earnings will be impacted by loss reserve development associated with any changes in our inflation assumptions. Estimates for the 2001 and 2002 accident year claims represent the majority of the uncertainty because these claims have the lowest proportionate amount of paid loss as of December 31, 2002. Therefore, our loss reserve estimates are most sensitive to changes in the assumption about inflation for the 2001 and 2002 accident years. Each one-point increase or decrease in the inflation rate for both of these accident years would increase or decrease our loss reserve estimates as of December 31, 2002 by approximately $10.0 million.
The following table shows the adverse (favorable) one-year loss reserve development for loss reserves in each of the three years ended December 31, 2002. The one-year loss reserve development is the change recorded in the current year for the estimate of the loss reserves established at the end of the preceding year and reflects a cumulative adjustment to all estimates made in prior years.
|
|---|
(Dollars in thousands)
| | Workers'
Compensation
| | Reinsurance
| | Total
|
|---|
|
|---|
| One-year loss development in: | | | | | | | | | |
| | 2002 | | $ | 29,346 | | $ | (178 | ) | $ | 29,168 |
| | 2001 | | | 272 | | | 4,075 | | | 4,347 |
| | 2000 | | | 8,251 | | | 22,629 | | | 30,880 |
|
In the fourth quarter of 2002, we increased our estimate of workers' compensation loss reserves for prior periods by $30.0 million. The change in the estimate was composed of $2.4 million related to claims for 2002, $21.2 million related to claims for 2001 and $6.4 million related to claims in 2000. Therefore, workers' compensation loss reserves of $536.7 million at December 31, 2000 would have been higher by $6.4 million (or 1.2%); loss reserves of $599.7 million at December 31, 2001 would have been higher by $27.6 million (or 4.6%); and loss reserves of $641.2 million at September 30, 2002 would have been higher by $30.0 million (or 4.7%). Workers' compensation loss reserves are stated here net of reinsurance.
During 2002, as in prior years, quarterly reviews of Zenith's workers' compensation reserves were performed. The observed paid loss development and inflation during the first two quarters were in-line with our estimates and expectations as of the previous year-end. The third quarter review showed greater than expected paid loss development and inflation. Given only one quarter of higher than expected inflation, we did not incorporate the new trend into our loss reserve estimates pending any confirmation of the increase in the inflation rate in any subsequent quarters. The fourth quarter review also showed higher than anticipated inflation.
Given the confirmation of the higher inflation trend in the fourth quarter, we
33
determined it was appropriate to increase our estimates of the ultimate losses for accident years 2000, 2001 and 2002 by $30.0 million to incorporate these higher levels of inflation. These adverse inflationary trends were most noticeable in our California business. Loss development trends elsewhere, principally in Florida, were more favorable than anticipated. The $30.0 million increase in loss reserves in 2002 was comprised of an increase of $50.0 million in California reserves offset by a decrease of $20.0 million in reserves outside of California, principally Florida.
In 2000, Zenith increased the estimate of unpaid Workers' Compensation losses for the 1999 accident year by about $8.0 million, principally as a result of higher than expected claims severity. This change in estimate means that workers' compensation loss reserves of $516.9 million at December 31, 1999 should have been higher by $8.0 million (or 1.5%).
Reinsurance loss reserves. Loss reserve estimates in our Reinsurance business are subject to uncertainties that are inherent to the reinsurance business. As a reinsurer, we are further removed from original loss events than we would be as a primary insurer. Therefore, we are subject to longer reporting lags. We are also subject to the estimates that ceding companies make before they determine when, if and how much to report to us. We operate a relatively small book of reinsurance business and therefore our historical data or industry-wide data have only limited value in making estimates of ultimate losses from currently reported paid and reported loss information. The inherent uncertainties in estimating our Reinsurance reserves affect us particularly in two ways. First, estimating catastrophe losses in the Reinsurance business is highly dependent upon the nature and timing of the event and Zenith's ability to obtain timely and accurate information with which to estimate its liability to pay losses. Therefore, our loss reserve estimates are subject to a higher risk of development when we report our results of operations after a large catastrophe loss has occurred. In 2002, we did not incur any significant catastrophe losses. The last major catastrophe loss we estimated was our share of the losses associated with the terrorist attack on the World Trade Center on September 11, 2001. We have estimated Zenith's share of the World Trade Center loss to be approximately $48.0 million, both gross and net of reinsurance recoverable, by estimating the probable impact to each of its reinsurance contracts based on currently available information. Approximately 70% of our estimated loss is attributable to the contractual maximum loss payable by Zenith under its excess of loss reinsurance contracts and therefore our loss cannot exceed the amount we have estimated and reserved on these contracts. The remainder of the estimated loss is an estimate of expected losses incurred on assumed quota share reinsurance contracts. The information we have received so far has resulted in no change in the estimate of Zenith's World Trade Center loss at December 31, 2002 compared to December 31, 2001.
Loss reserve estimates for catastrophe losses developed unfavorably in 2001 and 2000. In 1999, the worldwide catastrophe reinsurance business received a large number of claims attributable to a high frequency of natural disasters that year. These included hurricanes, tornadoes, earthquakes in Taiwan and Turkey and severe storms in Europe culminating in two very large storms at the end of December of 1999 in France. The amount of insurable damage in these storms and other events took time to assess and estimate and, therefore, our estimates at the end of 1999 and even at the end of 2000 were subject to the availability and reliability of estimates and claims being reported by the companies we reinsure. As a result of late reporting of claims and changes in estimates by companies we reinsure, we experienced adverse
34
development of our estimates in 2000 and to a lesser extent in 2001. In 2001, we raised our estimates of prior year loss reserves by $4.1 million, or 4.2% of the 2000 loss reserve estimate of $97.5 million for our Reinsurance business. In 2000, we raised our estimates of prior year loss reserves by $22.6 million, or 25.6% of the 1999 loss reserve estimate of $88.3 million.
Estimates of the impact of the World Trade Center loss and other catastrophes are based on the information that is currently available. Such estimates could change based on any new information that becomes available or based upon reinterpretation of existing information.
The second area of significant uncertainty in our reinsurance loss reserve estimates relates to liability reinsurance reserves. Our Reinsurance business currently emphasizes property catastrophe reinsurance. We have, since the inception of our Reinsurance operation, participated to a varying extent over the years in liability reinsurance, principally for general business liability coverage, directors' and officers' liability and excess liability and umbrella coverage. Liability reinsurance premiums represent about 20% of our Reinsurance earned premiums during the ten years ended December 31, 2002. Our actuaries make reserve estimates for liability reinsurance by projecting current reported losses to an estimated ultimate value using a combination of historical reporting patterns for our business and original loss ratio assumptions for the class of business and the year it was written. Our best estimate of these reserves, as recorded in the financial statements, is based on loss ratio estimates from the original pricing assumptions, modified for actual claims experience, and is about $16 million lower than the point estimate of our actuaries.
Asbestos and environmental loss reserves. Zenith has exposure to asbestos losses in its Workers' Compensation operations for medical, indemnity and loss adjustment expenses associated with covered workers' long-term exposure to asbestos or asbestos-containing materials. Many of the claims we have received date back to accidents in the 1960's, 1970's and early 1980's. Zenith's exposure is generally limited to a proportionate share of the workers' compensation-related loss for the period of time coverage was provided because other insurance companies also provided coverage during the period in which the claimant was exposed. In our history, we have paid and closed about 3,200 such asbestos-related workers' compensation claims for a total of $8.3 million, or approximately $2,600 per claim. At the end of 2002, we had 382 such claims open, and reserved for about $2.2 million, compared to our total workers' compensation loss reserves of $695.2 million, including an IBNR reserve estimate of $123.1 million.
Zenith also has potential exposure to environmental and asbestos losses and loss adjustment expenses beginning in 1985 through its Reinsurance operations, but the business reinsured by Zenith in these operations contains exclusion clauses for such losses. Environmental and asbestos losses have not been material to Zenith's results of operations or financial condition. Zenith believes that its reserves for environmental and asbestos losses are currently appropriately established.
Terrorism Risk Insurance Act of 2002
In November 2002, the Terrorism Risk Insurance Act of 2002 (the "Act") became effective. The principal purpose of the Act was to provide a role for the Federal Government in the provision of insurance for losses sustained in connection with terrorism. Prior to the Act, insurance (except for workers' compensation insurance) and reinsurance for losses arising out of acts of terrorism were severely restricted in their availability from private insurance and reinsurance companies. Under the Act, all
35
licensed insurers must offer terrorism coverage on most commercial lines of business. The Act is effective for the period from November 26, 2002 until December 31, 2005. The Secretary of the Treasury must certify an act for it to constitute an act of terrorism. The definition of terrorism excludes domestic acts of terrorism or acts of terrorism committed in the course of a war declared by Congress. Losses arising out of the act of terrorism must exceed $5.0 million. If an event is certified, then the Federal Government will reimburse losses not to exceed $100.0 billion in any year. Each insurance company will be responsible for a deductible based on a percentage of direct earned premiums in the previous calendar year — 7% in 2003, 10% in 2004 and 15% in 2005. For losses in excess of the deductible, the Federal Government will reimburse companies for 90% of the loss up to their proportionate share of $100.0 billion of aggregate losses. Policy surcharges may be required to recover certain of any losses reimbursed by the Federal Government.
The deductible for 2003 under the Act attributable to our Workers' Compensation business is approximately $38 million, based on the formula described above. However, due to the definitions of "affiliate" and "control" under the Act, it is unclear at this time if our direct earned premiums will be included with the direct earned premiums for U.S. exposures of the insurers controlled by Fairfax Financial Holdings Limited ("Fairfax") for purposes of calculating the deductible. In the event that Fairfax's premiums are included with Zenith's for purposes of the deductible calculations, the deductible would be substantially greater than $38 million.
Zenith intends to seek a determination from the U.S. Treasury Department that it is not an affiliate of Fairfax for purposes of calculating the deductible amount. Although companies controlled by Fairfax own 42% of the outstanding shares of Zenith National at December 31, 2002, in separate filings with the Departments of Insurance in California, Texas and New York, Fairfax has disclaimed control of Zenith National. Fairfax has also granted a proxy covering all its shares of Zenith National to an individual trustee with instructions to vote the shares in proportion to the voting of all other Zenith National shareholders. Fairfax and Zenith have no common Directors, management, employees or business infrastructure. We cannot be assured, however, that we will be able to obtain a favorable determination from the U.S. Treasury Department. We have purchased reinsurance for acts of terrorism in the amount of $9.0 million in excess of a retention of $1.0 million in 2003. In addition for 2003, we have purchased reinsurance for terrorism, excluding nuclear, biological and chemical attacks, up to 50% of losses of $27.0 million in excess of $10.0 million. The cost of such terrorism reinsurance is approximately $2.0 million including the reinsurance from $1.0 million to $10.0 million.
Notwithstanding the protection provided by the Act and by the other reinsurance we have purchased, the risk of severe losses to Zenith from acts of terrorism has not been eliminated because events may not be covered by, or may exceed the capacity of, our reinsurance protection. In our Workers' Compensation business, we monitor the geographical concentrations of insured employees to help mitigate the risk of loss from terrorist acts. Also, small businesses constitute a large proportion of our policies, and we avoid risks in high profile locations. In our Reinsurance business, most of the contracts we have written in 2002 and 2003 exclude losses from terrorism, and any terrorism exposure we have assumed is subject to our underwriting guidelines not to write business that could expose us to losses of greater than approximately $15 million after deducting applicable premium income and after tax. The impact of any future terrorist acts is
36
unpredictable, and the ultimate impact on Zenith, if any, of losses from any future terrorist acts will depend upon their nature, extent, location and timing.
Inflation
Inflation rates may impact the financial statements and operating results in several areas. Fluctuations in rates of inflation influence interest rates, which in turn impact the market value of the investment portfolio and yields on new investments. Inflation also impacts the portion of the loss reserves that relates to hospital and medical expenses and property claims and loss adjustment expenses, but not the portion of loss reserves that relates to workers' compensation indemnity payments for lost wages which are fixed by statute. Adjustments for inflationary impacts are implicitly included as part of the continual review of property-casualty reserve estimates. Actuarial account of increased costs is considered in setting adequate rates, and this is particularly important in the health care area where hospital and medical inflation rates have exceeded general inflation rates. Operating expenses, including payrolls, are impacted to a certain degree by the inflation rate.
Workers' Compensation
Workers' Compensation premiums earned increased in each of the three years ended December 31, 2002. This trend of increasing Workers' Compensation premiums earned started in 2000. Prior to 2000, we decreased our Workers' Compensation earned premiums consistently for several years because of unfavorable industry conditions, including intense competitive pricing pressure. In the past several years, national workers' compensation industry results have been extremely unprofitable as intense competition resulted in inadequate levels of premium rates at the same time as the industry experienced a general trend of declining frequency and of increasing claim severity. In addition, there are reports by certain industry organizations of significant under-estimation of loss reserves in the industry's reported results. Beginning in 2000 and continuing through 2002, competitive conditions began to improve, principally in California, and we began to increase our Workers' Compensation premium revenues through increases in the number of policies in-force and rates.
In the three years ended 2002, Zenith increased its Workers' Compensation premium rates in California as follows: effective January 1, 2000 by about 8%; effective September 1, 2000 by about 9%; effective January 1, 2001 by about 8%; effective August 1, 2001 by about 5%; in the first quarter of 2002 by about 26%; and effective August 1, 2002 by about 7%.
Our in-force premiums in California increased from $146.7 million at December 31, 2000 to $210.4 million at December 31, 2001 and to $350.2 million at December 31, 2002. Outside of California, where competition and pricing are improving only in certain states, our in-force premiums increased from $162.4 million at December 31, 2000 to $209.7 million at December 31, 2001 and to $259.2 million at December 31, 2002. The number of polices in-force in California increased from 15,600 at December 31, 2000 to 19,100 at December 31, 2001 and to 22,600 at December 31, 2002. Outside of California, the number of polices in-force decreased from 16,800 at December 31, 2000 to 16,400 at December 31, 2001 and increased to 16,900 at December 31, 2002.
In California, on January 1, 2003, workers' compensation legislation became effective that provides for increases in the benefits payable to injured workers. Other changes included in the legislation are intended to help control costs and encourage the return to work of injured workers. We cannot quantify the impact of the
37
legislation at this time, but we intend to estimate and implement appropriate rate increases. Effective January 1, 2003, Zenith implemented a rate increase of approximately 11% in California on new and renewal policies and approximately 5% on the unexpired term of policies in-force on January 1, 2003. Our California workers' compensation rates will be increased by a further 6.6% on April 1, 2003. The major risk factor is whether or not the legislation or the economy, or a combination of the two, will change the long-term favorable trend of reduced claim frequency and whether or not Zenith can estimate and implement timely and appropriate rate increases.
In Florida, rates are set by the Department of Insurance, and were unchanged in 2000 and in 2001. Effective August 1, 2002, the Florida Department of Insurance approved a 2.7% rate increase for new and renewal policies, and Zenith increased its Workers' Compensation premium rates in Florida accordingly. Zenith also implemented rate increases in most of the other states in which it does business at January 1, 2001 and 2002. The Florida Department of Insurance has implemented a 13.7% rate increase effective April 1, 2003 on new, renewal and in-force policies which were written on or after January 1, 2003. The Florida Insurance Commissioner has urged the legislature in Florida to enact reforms to the workers' compensation system, but no such reforms have been enacted at this time.
Net premiums earned in 2002 are net of $36.8 million of ceded earned premiums under a 10% quota share reinsurance agreement with a subsidiary of Fairfax effective January 1, 2002 on policies written on or after January 1, 2002. The effect of this quota share agreement is discussed further under "Liquidity and Capital Resources."
Underwriting losses in the Workers' Compensation operations decreased in 2002 compared to 2001 and decreased in 2001 compared to 2000. The improvement trend was principally due to a decrease in the loss ratio in 2002 compared to 2001 and in 2001 compared to 2000 and due to the favorable impact of increased premium revenues on the underwriting expense ratios. The estimated average cost of claims, or severity, increased in 2002 compared to 2001 and also increased in 2001 compared to 2000. These severity increases were offset by decreases in the frequency of claims and by the impact of higher premium rates in 2002 and 2001, resulting in a lower estimated loss ratio for 2002 compared to 2001 and for 2001 compared to 2000. Improvement in the loss ratio and combined ratio in 2002 compared to 2001 was reduced by the need to increase loss reserves by $30.0 million in the fourth quarter of 2002. Results of the Workers' Compensation operations in 2001 were impacted by a charge of $4.5 million before tax, or $2.9 million and $0.17 per share after tax, for uncollectible reinsurance and accrued guarantee fund assessments in connection with the Order of Liquidation for Reliance Insurance Company.
We expect that the future profitability of the Workers' Compensation operations will be dependent upon the following: 1) general levels of competition; 2) industry pricing; 3) general levels of interest rates; 4) legislative and regulatory actions; 5) the frequency and severity of terrorist acts, if any, similar to the World Trade Center attack of September 11, 2001; 6) management's ability to estimate the impact of any continuing adverse claim severity trends, including increases in the cost of healthcare, on the adequacy of loss reserve estimates and premium rates; and 7) the impact in California of the new legislation that increases workers' compensation benefits. Claim frequency trends continue to decline, but the reasons therefor are not clear, and management is unable to predict whether these trends will continue. Zenith is unable to predict when its Workers' Compensation operations will return to
38
underwriting profitability, although it anticipates continuing improvement in the combined ratio and profitability in the near term as earned premiums reflect recent rate increases. Also, operating results are expected to benefit from investing increases in cash flow from Workers' Compensation underwriting operations.
The Florida Special Disability Trust Fund ("SDTF") is a fund established in Florida to reimburse insurance companies and employers for the cost of certain workers' compensation claims. The SDTF was established to promote the re-hiring of injured workers by providing a reimbursement for certain qualifying claims made by a previously injured worker subsequent to their re-hiring. These claims are sometimes referred to as "second injuries." We are able to submit such second injury claims to the SDTF and, if the claims are accepted, we are reimbursed for part of the cost of the claim. The SDTF stopped accepting new second injury claims dated after January 1, 1998. Approximately 550 of our Florida claims have been accepted, for which we have recorded a recoverable of $13.1 million, net of amounts due to reinsurers, at December 31, 2002. The SDTF is funded by assessing a fee of 4.52% of premiums written in Florida, and we accrue the assessment as a liability when we write Florida business. If the legislature in Florida were to decide to cease or suspend the assessment, and thereby the funding of the SDTF, any recoverable that we may have at that time which is related to un-reimbursed claims might be at risk. However, we have no current information to indicate that the SDTF assessment in Florida will not continue. We continue to collect substantial recoveries for second injury claims from the SDTF. We received reimbursements from the SDTF of $5.6 million in 2002, $13.0 million in 2001 and $5.9 million in 2000. The SDTF is currently about 30 to 36 months behind schedule in reimbursing claims but we expect to fully recover the remaining amount receivable.
At December 31, 2002 and 2001, Reliance Insurance Company ("Reliance") owed Zenith Insurance $6.0 million of reinsurance recoverable on paid and unpaid losses in connection with the reinsurance arrangements assumed by Zenith Insurance in its 1996 acquisition of the Associated General Commerce Self-Insurers' Trust Fund.
In January 2001, Reliance was subject to a Supervision Order by the Pennsylvania Department of Insurance. This is not the same as insolvency. Based on the published 1999 financial statements for Reliance, which showed considerable net worth, we had no reason to conclude that we had an impairment of our reinsurance recoverable at the time of the Supervision Order. On May 29, 2001, the Pennsylvania Department of Insurance issued an Order of Rehabilitation for Reliance. Rehabilitation raises the possibility of compromise with Reliance's creditors. Therefore, we disclosed a contingency in the second quarter of 2001 related to possible impairment of our receivable from Reliance. With no information with which to estimate our impairment (no financial statements were filed by Reliance for 2000), we concluded that we could not determine the outcome of the contingency at that time. On October 3, 2001, the Commonwealth Court of the State of Pennsylvania approved an Order of Liquidation for Reliance, which was experiencing cash flow problems caused by slow reinsurance recoveries. At that time, an estimated balance sheet of Reliance was made available as of December 31, 2000, from which we estimated that we could expect to recover no more than 50% of our receivable. This established a range of outcomes for the amount impaired between $3.0 million and $6.0 million (i.e., we expect to recover an amount between 50% and nothing). We have no information with which to establish an estimate within that range as better than any other and, therefore, we recorded an impairment provision
39
of $3.0 million for our receivable from Reliance. We recorded the provision in the third quarter of 2001, the period for which the information became available to estimate the impairment provision. The impairment provision was $3.0 million at December 31, 2002 and 2001. The eventual outcome of this matter will be determined by the ultimate amount of Reliance's liabilities and whether or not Reliance has sufficient assets or can obtain recoveries and investment income in an amount sufficient to pay its liabilities. We will revise our impairment provision, if necessary, upon receipt of relevant information.
State Guarantee Funds ("Guarantee Funds") exist to ensure that policyholders (holders of direct insurance policies but not of reinsurance policies) receive payment of their claims if insurance companies become insolvent. The Guarantee Funds are funded primarily by statutorily prescribed assessments they bill to other insurance companies doing business in their states. Various mechanisms exist in some of these states for assessed insurance companies to recover these assessments. Upon the insolvency of an insurance company, the Guarantee Funds become primarily liable for the payment of its policyholder liabilities. The declaration of an insolvency establishes the presumption that assessments by the Guarantee Funds are probable. Zenith Insurance writes workers' compensation insurance in many states in which unpaid workers' compensation liabilities are the responsibility of the Guarantee Funds and has received, and expects to continue to receive, Guarantee Fund assessments, some of which may be based on certain of the premiums it has already earned at December 31, 2002. Zenith recorded an estimate of $6.0 million (net of expected recoveries of $2.0 million recoverable before the end of 2003) for its expected liability at December 31, 2002 for Guarantee Fund assessments. Recoveries are attributable to premium tax credits in various states. The amount of the recovery we have recorded is limited to credits applicable to, and recoverable from, premiums earned at December 31, 2002. The estimated expense for Guarantee Fund assessments was $4.1 million in 2002 compared to $3.5 million in 2001. Our estimated liability is based on currently available information and could change based on additional information or reinterpretation of existing information concerning the actions of the Guarantee Funds. Zenith expects that it will continue to accrue and receive Guarantee Fund assessments; and the ultimate impact of such assessments will depend upon the amount and timing of the assessments and of any recoveries to which Zenith is entitled.
Reinsurance
Underwriting income or loss and the combined ratio of the Reinsurance operations fluctuate significantly depending upon the incidence or absence of large catastrophe losses. However, since its inception in 1985, the combined ratio of the Reinsurance operations through December 31, 2002 was 101.6%.
In 2002, estimated catastrophe losses were $0.4 million attributable to European floods; otherwise, there were no major catastrophe losses in the year ended December 31, 2002. In 2001, the Reinsurance operations were adversely impacted by $41.7 million of catastrophe losses before tax, including $37.6 million for the World Trade Center loss, net of additional premium income earned in the year attributable to original and reinstatement premiums. Catastrophe losses of $22.6 million before tax in 2000 were attributable to additional estimates of the impact of the events in 1999 as discussed above under "Loss Reserves." There were frequent catastrophes of a moderate size culminating in severe storms in Europe at the end of 1999. Estimates of the impact of catastrophes on the Reinsurance operations are
40
based on the information that is available and such estimates could change based on any new information that becomes available or based upon reinterpretation of existing information.
Our assumed reinsurance business is written so that the exposure to reinsurance losses from any one event in a worst-case scenario is not expected to be more than approximately 5% of Zenith's consolidated stockholders' equity (or about $15 million). The ultimate impact of the World Trade Center loss of 2001 after deducting original and reinstatement premium income on Zenith's assumed reinsurance contracts for 2001 is estimated to be $20.0 million before tax, or $13.0 million after tax. The expected ultimate loss of $13.0 million after tax is within the 5% maximum.
Investments
Zenith's investment portfolio increased in 2002 principally as a result of favorable cash flow from operations offset in part by the use of funds in the repayment of senior indebtedness. At December 31, 2002, our investment portfolio was comprised of 74% fixed maturity securities, 14% short-term investments, 4% equity securities and 8% other investments including mortgage loans and our investment in Advent Capital (Holdings) PLC, a U.K. company ("Advent Capital"). Fixed maturity securities include corporate debt, U.S. Government securities and mortgage-backed securities issued by the Government National Mortgage Association ("GNMA"). The average maturity date of the fixed maturity portfolio, excluding short-term investments, was 5.7 years and 7.2 years at December 31, 2002 and 2001, respectively.
Investment income is an important component of our earnings. Investment income was comparable in each of the three years ended December 31, 2002 because declining interest rates were partly offset by increases in available invested assets. The average yields on the investment portfolio in each of the three years ended December 31, 2002 were as follows:
| |
|---|
| | 2002
| | 2001
| | 2000
| |
|---|
| |
|---|
| Investment yield: | | | | | | | |
| | Before tax | | 4.9 | % | 5.6 | % | 5.9 | % |
| | After tax | | 3.3 | | 3.7 | | 3.9 | |
| |
Certain securities, amounting to 89% and 97% of the investments in fixed maturity securities at December 31, 2002 and 2001, respectively, are identified as "available-for-sale." Stockholders' equity increased by $20.2 million after deferred tax from December 31, 2001 to December 31, 2002 and increased by $8.8 million after deferred tax from December 31, 2000 to December 31, 2001 as a result of changes in the fair values of such investments. Stockholders' equity will fluctuate with changes in the fair values of available-for-sale securities. The unrealized net gain (loss) on held-to-maturity and available-for-sale fixed maturity investments were as follows:
| |
|---|
| Held-to-maturity
| | Available-for-sale
| |
|---|
(Dollars in thousands)
| Before tax
| | Before tax
| | After tax
| |
|---|
| |
|---|
| December 31, 2002 | $ | 3,768 | | $ | 29,821 | | $ | 19,384 | |
| December 31, 2001 | | 691 | | | (1,301 | ) | | (846 | ) |
| |
The fair values of investment securities are generally obtained from market sources. However, the fair values of non-traded fixed maturity securities of $49.7 million at December 31, 2002 were determined using quantitative analytical techniques to arrive at an estimate of fair value. Such techniques include a comparison of the security to traded securities with similar maturity and credit rating characteristics. The underlying assumption in this methodology is that fair values of non-traded securities can be reasonably estimated because if they were traded, our non-traded securities would probably have market yields with spreads to U.S. Government
41
securities similar to the spread for traded securities with similar credit and maturity characteristics.
Unrealized losses in the investment portfolio at December 31, 2002 are not expected to have a material impact on liquidity because we can, if necessary, hold fixed maturity securities to maturity and because equity securities represent only about 4.4% of the portfolio. We diversify our corporate debt investments across a number of industries. The largest concentration of corporate debt is in investments in insurance companies (approximately $117.4 million at fair value at December 31, 2002). Investments in corporate debt expose us to the risk of loss of principal in the event of default by the issuer. Also, market prices of both corporate debt and equity investments can fall significantly below the prices at which we acquired the investment. We monitor our portfolio continuously and actively manage our investments to preserve principal values whenever possible. However, when, in the opinion of management, a decline in the fair value of an investment is considered to be other-than-temporary, such investment is written-down to its fair value as a charge to earnings in the form of a reduction of realized gains on investments. The determination of other-than-temporary includes, in addition to other relevant factors, a presumption that if the market value is below cost by a significant amount for a period of time, a write-down is necessary. During the years ended December 31, 2002, 2001 and 2000, there were $11.1 million, $12.7 million and $22.5 million, respectively, of such write-downs, including $3.8 million, $4.4 million and $7.3 million during the fourth quarters of 2002, 2001 and 2000, respectively. The amount of these write-downs was determined by the difference between the cost or amortized cost of the investment and its fair value at the time the other-than-temporary decline was identified. Corporate bankruptcies (including WorldCom and Global Crossing) of the issuer accounted for $5.5 million, $4.3 million and $6.3 million of the write-downs in 2002, 2001 and 2000, respectively. The remaining write-downs were attributable to the amount and length of time for which fair value of the investment was below cost under the previously described presumption.
Our own Investments Department manages our investment portfolio, and we do not rely on external portfolio managers. We continuously assess the prospects for individual securities as part of ongoing portfolio management, including the identification of other-than-temporary declines in fair values. This process includes reviewing historical and projected company financial performance, company-specific news and other developments, the outlook for industry sectors, credit ratings and macro-economic changes, including government policy initiatives. We believe that we have appropriately identified other-than-temporary declines in fair value in the three years ended December 31, 2002 and that our remaining unrealized losses are not other-than-temporary. We base this conclusion on our current understanding of the issuers of these securities as described above and because we have also established a presumption that an unrealized loss of a significant amount for a specific period of time is other-than-temporary. We have consistently applied this presumption for eleven years. We also have the ability and intent to hold securities with unrealized losses for a sufficient amount of time for them to recover their values or reach maturity. In some cases, securities that we have written-down to their fair values have subsequently recovered some of their values and we have recognized gains when we sold them.
Future earnings would be negatively impacted by any future write-downs of securities associated with other-than-temporary declines of their fair values. Investments that we currently own could be subject to default by the
42
issuer or could suffer declines in value that become other-than-temporary. In some cases, we have acquired corporate debt securities with investment grade ratings that have suffered rapid ratings downgrades and declines in value for reasons that are not easy to determine as events are unfolding. Following is some relevant information about our investment portfolio:
| |
|---|
| Securities with
| |
|---|
December 31, 2002
(Dollars in thousands)
| Unrealized gains
| | Unrealized losses
| |
|---|
| |
|---|
| Fixed maturity securities: | | | | | | |
| | Fair value | $ | 749,551 | | $ | 64,077 | |
| | Amortized cost | | 710,479 | | | 69,560 | |
| | Gross unrealized gain (loss) | | 39,072 | | | (5,483 | ) |
| | Fair value as a percentage of amortized cost | | 105.5 | % | | 92.1 | % |
| | Number of security positions held | | 225 | | | 26 | |
| | Number individually exceeding $0.5 million gain (loss) | | 9 | | | 3 | |
| |
| | Concentration of gains or losses by type or industry: | | | | | | |
| | | Insurance | $ | 8,084 | | $ | (1,376 | ) |
| | | GNMA | | 3,450 | | | | |
| | | Transportation services | | 3,036 | | | | |
| | | Food and beverage | | 2,650 | | | | |
| | | Communications | | 2,488 | | | | |
| | | Gas transmission | | | | | (2,301 | ) |
| | | Personal consumable goods | | 2,166 | | | | |
| | | Other | | 17,198 | | | (1,806 | ) |
| |
| | | Total | $ | 39,072 | | $ | (5,483 | ) |
| |
| | Investment grade: | | | | | | |
| | | Fair value | $ | 732,350 | | $ | 35,217 | |
| | | Amortized cost | | 694,554 | | | 36,112 | |
| | | Fair value as a percentage of amortized cost | | 105.4 | % | | 97.5 | % |
| | Non-investment grade: | | | | | | |
| | | Fair value | $ | 17,201 | | $ | 28,860 | |
| | | Amortized cost | | 15,925 | | | 33,448 | |
| | | Fair value as a percentage of amortized cost | | 108.0 | % | | 86.3 | % |
| |
| Equity securities: | | | | | | |
| | Fair value | $ | 28,820 | | $ | 19,814 | |
| | Cost | | 27,542 | | | 24,144 | |
| | Gross unrealized gain (loss) | | 1,278 | | | (4,330 | ) |
| | Fair value as a percentage of cost | | 104.6 | % | | 82.1 | % |
| | Number of security positions held | | 17 | | | 16 | |
| | Number individually exceeding $0.5 million gain (loss) | | 0 | | | 4 | |
| |
The table that follows sets forth the scheduled maturities of fixed maturity securities at December 31, 2002 based on their fair values.
|
|---|
| Securities with
|
|---|
December 31, 2002
(Dollars in thousands)
| Unrealized gains
| | Unrealized losses
|
|---|
|
|---|
| Maturity categories: | | | | | |
| 1 year or less | $ | 51,634 | | $ | 2,463 |
| After 1 year through 5 years | | 372,450 | | | 19,156 |
| After 5 years through 10 years | | 221,468 | | | 27,027 |
| After 10 years | | 103,999 | | | 15,431 |
|
| | $ | 749,551 | | $ | 64,077 |
|
The table below sets forth information about unrealized losses at December 31, 2002.
|
|---|
December 31, 2002
(Dollars in thousands)
| Fair
value
| | Unrealized
loss
| | Fair
value as a
percentage of
cost basis
|
|---|
|
|---|
| Fixed maturity securities with unrealized losses: | | | | | | | |
| Exceeding $0.1 million at 12/31/02 and for: | | | | | | | |
| | Less than 6 months (5 issues) | $ | 16,876 | | $ | (790 | ) | 95.5% |
| | 6-12 months (4 issues) | | 6,905 | | | (2,596 | ) | 72.7 |
| | More than 1 year (5 issues) | | 13,696 | | | (1,867 | ) | 88.0 |
| Less than $0.1 million at 12/31/02 (12 issues) | | 26,600 | | | (230 | ) | 99.1 |
|
| | $ | 64,077 | | $ | (5,483 | ) | 92.1% |
|
| Equity securities with unrealized losses: | | | | | | | |
| Exceeding $0.1 million at 12/31/02 and for: | | | | | | | |
| | Less than 6 months (8 issues) | $ | 10,224 | | $ | (3,138 | ) | 76.5% |
| | More than 1 year (2 issues) | | 7,437 | | | (1,028 | ) | 87.9 |
| Less than $0.1 million at 12/31/02 (6 issues) | | 2,153 | | | (164 | ) | 92.9 |
|
| | $ | 19,814 | | $ | (4,330 | ) | 82.1% |
|
Of the unrealized losses on fixed maturities at December 31, 2002, $2.3 million was attributable to two investments in Sonat, Inc. We own $5.0 million of par value of Sonat, Inc. 7.625% bonds maturing July 2011 and $2.0 million par value of Sonat, Inc. 6.625% bonds maturing February 2008. The amortized cost of these two investments was $5.1 million and $1.9 million, respectively, and the fair values were $3.3 million and $1.4 million, respectively, at December 31, 2002. The fair values were $4.9 million and $1.9 million,
43
respectively, at June 30, 2002 and $3.5 million and $1.7 million, respectively, at September 30, 2002. Sonat, Inc. is a subsidiary of El Paso Corporation, a natural gas processing and transportation company. Based on our assessment of the prospects for Sonat, Inc. and our intention to hold these securities, we believe it is likely that the fair values of our investments in Sonat, Inc. will recover. However, if these bonds do not recover to at least $4.1 million and $1.5 million, respectively, before March 31, 2003, they will be written-down to their fair values at that date, under a presumption that the decline in fair values is other-than-temporary.
Following is a summary of securities sold at a loss during the three years ended December 31, 2002.
| |
|---|
Years ended December 31,
(Dollars in thousands)
| | 2002
| | 2001
| | 2000
| |
|---|
| |
|---|
| Fixed maturity securities: | | | | | | | | | | |
| Realized losses on sales | | $ | (3,476 | ) | $ | (3,988 | ) | $ | (435 | ) |
| Fair value at the date of sale | | | 88,890 | | | 88,678 | | | 64,521 | |
| Number of securities sold | | | 19 | | | 28 | | | 22 | |
| Losses realized on securities with an unrealized loss preceding the sale for: | | | | | | | | | | |
| | Less than 3 months | | $ | (799 | ) | $ | (654 | ) | $ | (46 | ) |
| | 3-6 months | | | (1,976 | ) | | | | | (30 | ) |
| | 6-12 months | | | (58 | ) | | (18 | ) | | (15 | ) |
| | Greater than 12 months | | | (643 | ) | | (3,316 | ) | | (344 | ) |
| |
| Equity securities: | | | | | | | | | | |
| Gross realized losses on sales | | $ | (2,945 | ) | $ | (1,640 | ) | $ | (1,850 | ) |
| Fair value at the date of sale | | | 13,597 | | | 17,869 | | | 5,041 | |
| Number of securities sold | | | 83 | | | 56 | | | 25 | |
| Losses realized on securities with an unrealized loss preceding the sale for: | | | | | | | | | | |
| | Less than 3 months | | $ | (1,126 | ) | $ | (1,438 | ) | $ | (1,089 | ) |
| | 3-6 months | | | (1,230 | ) | | (87 | ) | | (738 | ) |
| | 6-12 months | | | (282 | ) | | (103 | ) | | (22 | ) |
| | Greater than 12 months | | | (307 | ) | | (12 | ) | | (1 | ) |
| |
At the time we sold these investments, we had the ability to hold them for a sufficient time for them to recover their values and the sales were not related to any liquidity needs. However, our intent to hold them changed because we changed our conclusion about the outlook for the performance of the issuer or its industry. In some cases we may have decided that our overall exposure to a particular issue or type of security or concentration within an industry should be reduced as part of ongoing portfolio management and asset allocation. At December 31, 2002, those securities which we are holding in our portfolio with an unrealized loss were compatible with our current view of appropriate asset allocation and issuer prospects. Any future changes in those assumptions could result in sales at a loss or write-downs of securities.
Mortgage loans at December 31, 2002 include a mortgage loan of $26.2 million secured by land located on Las Vegas Boulevard in Las Vegas, Nevada. The underlying property was valued in its then current condition at approximately $44.5 million in October 2002. The principal investor in the development company has also guaranteed $5.0 million of Zenith's mortgage loan. The mortgage loan matures on December 31, 2004 and bears interest at a rate of 8.0% on the first $22.5 million and 15.0% on the remaining balance. Zenith originally sold what was then approximately 183 acres of land to the development company in December 2000. The gain on the sale was $6.0 million, of which $3.6 million and $0.9 million were recognized in 2001 and 2000, respectively, and $1.5 million was deferred at December 31, 2002 and 2001.
Other investments at December 31, 2002 include $8.5 million of real estate investments and $27.6 million of investments in limited partnerships. The real estate investments consist of $5.0 million invested in the development company that is developing the previously described property on Las Vegas Boulevard and $3.5 million of vacant land in downtown Sarasota, Florida. Our limited partnership investments represent ten separate investments in which we typically represent a very small
44
percentage of the total capital of the partnership and which are reported at cost. However, if our share of the partnership capital is greater than 3%, we account for the investment on the equity method, and the carrying value of our investment is adjusted to reflect our share of the underlying equity of the partnership. These partnerships make long-term strategic investments in corporations, some of which are not publicly traded, with a view to exiting the investment position, sometimes after many years. The long-term value of some of these underlying investments are subject to uncertainties, including, in some cases, the impact of foreign economic and political developments. Write-downs of investments include $0.2 million in 2002 and $2.2 million in 2001 for other-than-temporary declines in the value of limited partnership investments.
On August 23, 2002, Zenith Insurance acquired 19.2 million Ordinary Shares of Advent Capital, a U.K. company, for $14.6 million in an open offer and placing of shares made in July 2002. As a result of the purchase, Zenith owns approximately 20.9% of the outstanding shares of Advent Capital. Advent Capital and its subsidiaries operate in the property and casualty insurance business in the United Kingdom by providing corporate capital to support the underwriting of various Lloyd's syndicates and by managing those syndicates. Zenith Insurance used available funds from its short-term investments to fund the purchase of the Advent Capital shares.
Prior to August 23, 2002, Zenith owned approximately 6.3% of the outstanding shares of Advent Capital and accounted for the investment on the cost basis. As of August 23, 2002, Zenith is accounting for its investment in Advent Capital based on the equity method in accordance with the provisions of Accounting Principles Board Opinion No. 18, "The Equity Method of Accounting for Investments in Common Stock ("APB No. 18"). The carrying value of the investment in the common stock of Advent Capital is equal to Zenith's equity in the underlying net assets of Advent Capital. In accordance with the provisions of APB No. 18, our investment in Advent Capital was restated in 2001 as if the equity method of accounting had been applied. The effect was a reduction in the carrying value of the investment of $3.2 million at December 31, 2001 and a reduction of net income for 2001 of $2.1 million, net of deferred tax benefit. The carrying value at December 31, 2002 was $18.3 million, including goodwill of $10.5 million. Fairfax also participated in the open offer and placing of shares by Advent Capital and after the purchase, through its subsidiaries. Fairfax owns approximately 47% of the outstanding shares of Advent Capital.
Under the criteria of Statement of Financial Accounting Standards No. 57, "Related Party Disclosures," certain of our investments meet the definition of investments in related parties. However, these investments were made in the ordinary course of business, in which we make investment and reinvestment decisions, and were purchased at prevailing market prices at the time of purchase. At December 31, 2002, Zenith owned $7.7 million at fair value of securities issued by Fairfax, $27.0 million at fair value of securities issued by Odyssey Re Holdings Corp., a New York Stock Exchange-listed subsidiary of Fairfax ("Odyssey Re"), and $2.4 million at fair value of securities issued by TIG Capital Trust I, also a subsidiary of Fairfax. As noted previously, Fairfax has disclaimed control of Zenith. We also owned $13.1 million at fair value of common stock of Wynn Resorts, Ltd. at December 31, 2002. Two of Zenith's Directors are also Directors of Wynn Resorts, Ltd.
45
Parent
Parent expenses in 2000 include $1.8 million before tax of severance costs associated with the termination provisions of an employment contract of a company officer.
Liquidity and Capital Resources
Zenith's insurance subsidiaries generally create liquidity because insurance premiums are collected prior to disbursements for claims and other policy benefits. Collected premiums may be invested, principally in fixed maturity securities, prior to their use in such disbursements, and investment income provides additional cash receipts. Claim payments may take place many years after the collection of premiums. In periods in which disbursements for claims and benefits, current policy acquisition costs and current operating and other expenses exceed operating cash receipts, cash flow is negative. Such negative cash flow is offset by cash flow from investments, principally from short-term investments and maturities of longer-term investments. The exact timing of the payment of claims and benefits cannot be predicted with certainty. The insurance subsidiaries maintain portfolios of invested assets with varying maturities and a substantial amount of short-term investments to provide adequate cash for the payment of claims. At December 31, 2002 and 2001, cash and short-term investments in the insurance subsidiaries amounted to $167.4 million and $63.5 million, respectively. The current trend of favorable cash flow from operations is attributable to the trend of increasing Workers' Compensation premiums. Cash used in operations in 2000 included $56.0 million of payment of federal income tax in connection with the sale of CalFarm Insurance Company, a subsidiary of Zenith Insurance, in 1999.
Insurance companies are required to have securities on deposit for the protection of policyholders in accordance with various states' regulations. At December 31, 2002 and 2001, investments with a fair value of $333.1 million and $270.8 million, respectively, were on deposit to comply with such regulations.
Zenith National requires cash to pay any dividends declared to its stockholders, make interest and principal payments on its outstanding debt obligations and fund its operating expenses. Such cash requirements are generally funded in the long-run by dividends received from Zenith Insurance and financing or refinancing activities by Zenith National. Cash, short-term investments and other available assets in Zenith National were $8.2 million and $131.0 million at December 31, 2002 and 2001, respectively. On May 1, 2002, Zenith National used $57.2 million of its available short-term investments to pay the principal of its 9% Senior Notes due 2002 ("9% Notes"). As a result of the repayment of the 9% Notes, interest expense was lower in 2002 compared to 2001. On September 6, 2002, Zenith National contributed $47.5 million to the capital of Zenith Insurance. Zenith National used $22.5 million of its available invested assets and borrowed $25.0 million under one of its available bank lines of credit to fund the contribution. On October 11, 2002, Zenith National repaid in full the $25.0 million borrowed under one of its bank lines of credit by using the $28.4 million received in repayment of intercompany loans from Perma-Bilt. (See "Discontinued Real Estate Operations" for information concerning the sale of the home- building business and related real estate assets.)
At December 31, 2002, Zenith National had two revolving, unsecured lines of credit in an aggregate amount of $70.0 million, all of which was available at December 31, 2002. One of these lines of credit, in the amount of $20.0 million, is a one-year revolving line of credit with a bank, expiring July 31, 2003. Interest is payable at the bank's prime rate on any borrowings under the line, and the agreement
46
does not subject Zenith to any covenants. The other line of credit is a $50.0 million credit agreement with a bank effective September 30, 2002. Borrowings under the agreement are available as follows: (a) up to $20.0 million may be drawn under Tranche A of the agreement; and (b) up to $30.0 million may be drawn under Tranche B of the agreement. Tranche A loans are due September 30, 2003. Tranche B loans are due September 30, 2005. Interest is payable on outstanding loans at either the bank's prime rate or a rate based on Eurodollar deposit rates plus a specified margin depending on Zenith's credit rating. The agreement contains covenants that require, among other things, Zenith to maintain certain financial ratios, including a minimum amount of capital in its insurance subsidiaries, a maximum debt-to-total capitalization ratio and a minimum interest coverage ratio. Zenith National must also maintain at least a BB counterparty rating from Standard and Poor's ("S&P"). Zenith was in compliance with all such requirements at December 31, 2002 and does not expect these requirements to impact the availability of funds under the line of credit, if required.
In January 2003, we borrowed $45.0 million under the lines of credit to make a further capital contribution to Zenith Insurance. We drew $30.0 million on Tranche B of the bank line. The interest rate on the Tranche B loan is 2.465%. The other $15.0 million was drawn on the bank line which is due July 31, 2003 and the interest rate is 4.25%. Available bank lines were reduced to $25.0 million as a result of the drawings. We anticipate re-financing the bank debt as soon as practicable, and will also pursue additional financing activities to support the growth of our insurance business.
Zenith National's insurance subsidiaries are subject to insurance regulations which restrict their ability to distribute dividends. These restrictions are set forth in Note 16 to the Consolidated Financial Statements. In 2003, Zenith Insurance may pay up to $31.0 million of dividends to Zenith National without the prior approval of the California Department of Insurance. Zenith Insurance did not pay any dividends to Zenith National in 2002. It paid dividends of $10.0 million to Zenith National in each of 2001 and 2000. In March 2003, Zenith Insurance paid a dividend of $10.0 million to Zenith National. The restrictions on the payment of dividends have not had, and under current regulations are not expected to have, a material adverse impact on the ability of Zenith Insurance to pay dividends. In a recent court ruling, a California statute that allowed a deduction for the dividends received from wholly-owned insurance companies in the determination of taxable income for the California Franchise Tax was held unconstitutional in certain circumstances. The consequences of the decision are unclear, but it is possible that the California Franchise Tax Board ("FTB") could take the position that the decision has caused the statute to be invalid for all purposes and disallow in its entirety the deduction for dividends received from insurance subsidiaries. If sustained, such action by the FTB would have the effect of imposing a tax of approximately 6% (after the benefit of a federal tax deduction) on any dividends paid from Zenith Insurance to Zenith National. We are unable to predict the ultimate outcome of this matter, which depends upon the actions of the FTB, the prospects for appropriate legislative relief and various tax strategies that may be available to Zenith to alleviate the consequences of any actions by the FTB.
The amount of capital in Zenith's insurance subsidiaries is maintained relative to standardized capital adequacy measures such as risk-based capital where ratios such as net premiums written to statutory surplus measure capital adequacy. Risk-based capital is used by regulators for financial surveillance purposes and by rating agencies to assign financial
47
strength ratings to Zenith's insurance subsidiaries and ratings for the debt issued by Zenith National. Insurance regulations require insurance companies to maintain capital and surplus at a minimum of 200% of regulatory risk-based capital. At December 31, 2002, Zenith Insurance's statutory capital and surplus was 349% of such minimum. From time to time, the level of capitalization of Zenith Insurance may be increased by contributions from Zenith National. Zenith National contributed $47.5 million, $14.2 million and $25.0 million to the capital and surplus of Zenith Insurance in 2002, 2001 and 2000, respectively. We will monitor the capital requirements, if any, of Zenith's insurance subsidiaries in connection with their business operations. We expect to be able to maintain adequate levels of capital from a combination of the earnings of the insurance subsidiaries and, if necessary and appropriate, contributions from Zenith National (funded from Zenith National's available lines of credit or other financing or refinancing activities by Zenith National) and quota share reinsurance such as described below. In January 2003, we contributed an additional $45.0 million from Zenith National to Zenith Insurance using available bank lines of credit.
Effective January 1, 2002, Zenith Insurance and a subsidiary of Odyssey Re entered into a 10% quota share ceded reinsurance agreement with respect to all new and renewal workers' compensation business written by Zenith Insurance in the three years commencing January 1, 2002. Quota share reinsurance allows the ceding company to increase the amount of business it writes while sharing the premiums and associated risks with the assuming company. The effect is similar to increasing the capital of the ceding company. Zenith expects that the quota share arrangement will favorably assist in the capitalization of Zenith Insurance over the term of the contract. Earned premiums ceded in connection with the quota share contract for the year ended December 31, 2002 were $36.8 million.
On December 5, 2001, Zenith National sold one million shares of its common stock, par value $1.00 per share, in a private placement for $25.00 per share to a subsidiary of Odyssey Re.
In 2002, A.M. Best Company ("A.M. Best") affirmed the financial strength rating of Zenith's insurance subsidiaries at A- (Excellent), Moody's Investor's Service ("Moody's") affirmed the rating at Baa1 (Adequate) and Fitch Ratings ("Fitch") affirmed the financial strength rating at A- (Strong). In 2002, S&P reduced the financial strength rating of Zenith's insurance subsidiaries from A- (Strong) to BBB+ (Good). The action by S&P had no material impact on Zenith's operations.
From time to time, Zenith National may make repurchases of its outstanding common shares or outstanding debt. At December 31, 2002, Zenith National was authorized to repurchase up to 929,000 shares of its common stock at prevailing market prices pursuant to a share repurchase program authorized by its Board of Directors. Any purchases are discretionary and can be adequately funded from Zenith National's existing sources of liquidity. In 2001, Zenith National paid $1.3 million to repurchase $1.3 million aggregate principal amount of the outstanding 9% Notes. In 2000, Zenith National paid $22.8 million to repurchase $16.5 million aggregate principal amount of the outstanding 9% Notes and $8.0 million aggregate liquidation amount of the outstanding 8.55% Capital Securities of the Zenith National Insurance Capital Trust I, a Delaware statutory business trust, all of the voting securities of which are owned by Zenith National. The repurchases in 2000 resulted in an extraordinary gain before tax of $1.5 million. Zenith National used its available cash balances to fund these purchases.
In connection with the sale of the home-building business and related real estate assets
48
on October 8, 2002, all indebtedness under the secured revolving credit facility for real estate infrastructure and construction loans was repaid in full by the buyer.
Discontinued Real Estate Operations
On October 8, 2002, Zenith closed the sale of its home-building business and related real estate assets in Las Vegas, Nevada to Meritage Corporation ("Meritage"). The business had been operated by Zenith National's indirect wholly-owned subsidiary, Perma-Bilt, a Nevada Corporation ("Perma-Bilt"). In the transaction, Meritage, through its wholly-owned subsidiary, MTH-Homes Nevada, Inc. ("MTH Nevada"), acquired substantially all of Perma-Bilt's assets, subject to the related liabilities, pursuant to a Master Transaction Agreement dated as of October 7, 2002, and related asset and real property acquisition agreements (the "Agreement"). Zenith received gross proceeds of $65.0 million in connection with the sale, including $28.4 million in repayment of intercompany loans to Zenith National from Perma-Bilt, and recorded a gain on the sale in the fourth quarter of 2002 of $6.3 million after tax. In addition to the consideration received in October 2002, the Agreement entitles us to receive 10% of MTH Nevada's pre-tax net income, subject to certain adjustments, for each of the twelve-month periods ending September 30, 2003, September 30, 2004 and September 30, 2005. We are currently unable to estimate how much, if anything, we might receive under this earn-out provision.
For the years ended December 31, 2002, 2001 and 2000, total revenues recognized in the Real Estate operations were $70.8 million, $84.8 million and $84.5 million, respectively, and pre-tax income, excluding the gain on the sale of the business in 2002, was $4.4 million, $5.8 million and $5.5 million, respectively.
Contractual Obligations and Contingent Liabilities
All of Zenith's outstanding financing obligations are included in the Consolidated Financial Statements and the accompanying Notes. There are no liquidity or financing arrangements with unconsolidated entities or any off-balance sheet arrangements. Zenith National's available invested assets and other sources of liquidity are currently expected to be sufficient to meet its requirements for liquidity in the short-term and long-term.
The table below sets forth the amounts of Zenith's contractual obligations, including interest payable, at December 31, 2002:
|
|---|
| | Payments due by period
|
|---|
(Dollars in thousands)
| | Redeemable securities including interest
| | Operating lease commitments
| | Total
|
|---|
|
|---|
| Less than 1 year | | $ | 5,729 | | $ | 4,568 | | $ | 10,297 |
| 1-3 years | | | 11,458 | | | 7,064 | | | 18,522 |
| 3-5 years | | | 11,458 | | | 3,783 | | | 15,241 |
| More than 5 years | | | 187,309 | | | 404 | | | 187,713 |
|
| Total | | $ | 215,954 | | $ | 15,819 | | $ | 231,773 |
|
Our contractual obligations under the outstanding Redeemable Securities are comprised of $149.0 million of interest payments over the next twenty-six years and $67.0 million of principal payable in 2028.
Zenith's contingent liabilities are discussed in Note 14 to the Consolidated Financial Statements. Accrued guarantee fund assessments would be payable within approximately one year, if they are ultimately assessed. We cannot currently predict the timing of the outcome of the contingencies surrounding reinsurance recoverable from Reliance or the contingencies surrounding recoveries from the SDTF.
49
Market Risk of Financial Instruments
The fair value of the fixed maturity investment portfolio is exposed to interest rate risk — the risk of loss in fair value resulting from changes in prevailing market rates of interest for similar financial instruments. However, Zenith has the ability to hold fixed maturity investments to maturity. Zenith relies on the experience and judgment of senior management to monitor and mitigate the effects of market risk. Zenith does not utilize financial instrument hedges or derivative financial instruments to manage risks, nor does it enter into any swap, forward or options contracts, but will attempt to mitigate its exposure through active portfolio management. The allocation among various types of securities is adjusted from time to time based on market conditions, credit conditions, tax policy, fluctuations in interest rates and other factors. In addition, Zenith places the majority of its investments in high-quality, liquid securities and limits the amount of credit exposure to any one issuer.
The table below provides information about Zenith's financial instruments for which fair values are subject to changes in interest rates. For fixed maturity investments, the table presents fair values of investments held and weighted average interest rates on such investments by expected maturity dates. Such investments include redeemable preferred stock, corporate bonds, municipal bonds, government bonds and mortgage-backed securities. For Zenith's debt obligations, the table presents principal cash flows by expected maturity dates (including interest).
| |
|---|
| | Expected maturity date
| |
|---|
December 31, 2002
(Dollars in thousands)
| |
|---|
| | 2003
| | 2004
| | 2005
| | 2006
| | 2007
| | Thereafter
| | Total
| |
|---|
| |
|---|
| Investments: | | | | | | | | | | | | | | | | | | | | | | |
| | Held-to-maturity and available-for-sale securities: | | | | | | | | | | | | | | | | | | | | | | |
| | | | Fixed rate | | $ | 54,096 | | $ | 72,654 | | $ | 52,034 | | $ | 157,424 | | $ | 79,501 | | $ | 397,919 | | $ | 813,628 | |
| | | | Weighted average interest rate | | | 2.6 | % | | 2.1 | % | | 3.4 | % | | 4.8 | % | | 3.7 | % | | 5.8 | % | | 4.7 | % |
| | Short-term investments | | $ | 158,078 | | | | | | | | | | | | | | | | | $ | 158,078 | |
| Debt and interest obligations of Zenith: | | | | | | | | | | | | | | | | | | | | | | |
| | Redeemable securities | | | 5,729 | | $ | 5,729 | | $ | 5,729 | | $ | 5,729 | | $ | 5,729 | | $ | 187,309 | | | 215,954 | |
| |
| |
|---|
| | Expected Maturity Date
| |
|---|
December 31, 2001
(Dollars in thousands)
| |
|---|
| | 2002
| | 2003
| | 2004
| | 2005
| | 2006
| | Thereafter
| | Total
| |
|---|
| |
|---|
| Investments: | | | | | | | | | | | | | | | | | | | | | | |
| | Held-to-maturity and available-for-sale securities: | | | | | | | | | | | | | | | | | | | | | | |
| | | | Fixed rate | | $ | 44,533 | | $ | 172,576 | | $ | 26,135 | | $ | 42,347 | | $ | 105,828 | | $ | 336,531 | | $ | 727,950 | |
| | | | Weighted average interest rate | | | 3.0 | % | | 3.5 | % | | 5.5 | % | | 6.2 | % | | 6.9 | % | | 7.7 | % | | 6.1 | % |
| | Short-term investments | | $ | 119,066 | | | | | | | | | | | | | | | | | $ | 119,066 | |
| Debt and interest obligations of Zenith: | | | | | | | | | | | | | | | | | | | | | | |
| | Senior notes payable | | | 59,811 | | | | | | | | | | | | | | | | | | 59,811 | |
| | Redeemable securities | | | 5,729 | | $ | 5,729 | | $ | 5,729 | | $ | 5,729 | | $ | 5,729 | | $ | 193,038 | | | 221,683 | |
| |
50
Recently Issued Accounting Standards
In April 2002, the Financial Accounting Standards Board ("FASB") issued Statement of Financial Accounting Standards No. 145, "Recision of FASB Statements No. 4, 44 and 64, Amendment of FASB Statement No. 13, and Technical Corrections" ("SFAS No. 145"). Among other things, SFAS No. 145 revises the criteria for classifying gains and losses associated with the extinguishment of debt as extraordinary and the accounting treatment of certain lease modifications. SFAS No. 145 is effective in fiscal year 2003, and we expect it will not have a material impact on Zenith's consolidated statements of financial position, results of operations or cash flows.
On July 30, 2002, the FASB issued Statement of Financial Accounting Standards No. 146, "Accounting for Costs Associated with Exit or Disposal Activities" ("SFAS No. 146"). Among other things, SFAS No. 146 establishes accounting guidelines for the recognition and measurement of a liability for the cost associated with an exit or disposal activity initially at its fair value in the period in which the liability is incurred, rather than at the date of a commitment to an exit or disposal plan. This standard is effective January 1, 2003 for all exit or disposal activities initiated after that date and we expect it will not have a material impact on Zenith's consolidated statements of financial position, results of operations or cash flows.
51
5-YEAR SUMMARY OF SELECTED FINANCIAL INFORMATION
Zenith National Insurance Corp. and Subsidiaries
| |
|---|
Years ended December 31,
| | Note(s)
| | 2002
| | 2001
| |
|---|
| |
| (Dollars and shares in thousands, except per share data) | | | | | | | | | |
| Revenues: | | 1, 2, 3 | | | | | | | |
| Premiums earned | | | | $ | 557,055 | | $ | 476,876 | |
| Net investment income | | | | | 48,811 | | | 51,178 | |
| Realized (losses) gains on investments | | | | | (3,631 | ) | | 9,169 | |
| Service fee income | | | | | | | | | |
| |
| Total revenues | | | | | 602,235 | | | 537,223 | |
| |
| Components of net income (loss) after tax: | | | | | | | | | |
| Underwriting loss: | | | | | | | | | |
| Loss excluding catastrophes | | 1, 2 | | | (23,561 | ) | | (32,831 | ) |
| Catastrophe losses | | | | | (260 | ) | | (27,105 | ) |
| Net investment income | | | | | 32,489 | | | 33,841 | |
| Realized (losses) gains on investments | | | | | (2,360 | ) | | 5,960 | |
| Parent expenses and interest expense | | | | | (6,655 | ) | | (7,411 | ) |
| Equity in earnings (losses) of investee | | 4 | | | 1,363 | | | (2,060 | ) |
| Gain on sale of CalFarm | | 2 | | | | | | | |
| |
| Income (loss) from continuing operations before extraordinary item | | | | | 1,016 | | | (29,606 | ) |
| |
| Income from discontinued real estate operations | | 3 | | | 9,184 | | | 3,746 | |
| Extraordinary item-gain on extinguishment of debt | | 5 | | | | | | | |
| |
| Net income (loss) | | | | | 10,200 | | | (25,860 | ) |
| |
| Per common share: | | | | | | | | | |
Income (loss) from continuing operations
before extraordinary item | | | | | 0.05 | | | (1.68 | ) |
| Net income (loss) | | | | | 0.54 | | | (1.47 | ) |
| |
| Cash dividends per share to common stockholders | | | | | 1.00 | | | 1.00 | |
| |
| Weighted average common shares outstanding | | | | | 18,895 | | | 17,593 | |
| |
| Financial condition: | | 1, 2 | | | | | | | |
| Total assets | | 4 | | $ | 1,615,113 | | $ | 1,537,999 | |
| Investments | | 4 | | | 1,098,284 | | | 941,527 | |
| Unpaid losses and loss adjustment expenses | | | | | 1,041,532 | | | 946,822 | |
| Senior notes and bank debt | | 3, 5 | | | | | | 57,203 | |
| Redeemable securities | | 5 | | | 65,719 | | | 65,669 | |
| Stockholders' equity | | 4 | | | 317,024 | | | 300,551 | |
| Stockholders' equity per share | | 4 | | | 16.89 | | | 16.20 | |
| Return on average equity | | | | | 3.3% | | | (8.5)% | |
| |
| Insurance statistics (GAAP): | | 1, 2 | | | | | | | |
| Paid loss and loss adjustment expense ratio | | | | | 64.4% | | | 67.9% | |
| Combined ratio: | | | | | | | | | |
| Loss and loss adjustment expense ratio | | | | | 79.4% | | | 90.6% | |
| Underwriting expense ratio | | | | | 27.1%
| | | 28.3%
| |
| Combined ratio | | | | | 106.5% | | | 118.9% | |
| Net premiums earned-to-surplus ratio | | | | | 1.5 | | | 1.6 | |
| Loss and loss adjustment expense reserves-to-surplus ratio (net of reinsurance) | | | | | 2.2 | | | 2.5 | |
| |
| (1) | | On April 1, 1998, Zenith acquired substantially all of the assets and certain liabilities of RISCORP, Inc. and subsidiaries (collectively, "RISCORP"). In 1999, Zenith recorded $50.0 million before tax ($32.5 million after tax, or $1.89 per share) of net charges associated with an increase in the purchase price of RISCORP. |
| (2) | | Zenith completed the sale of CalFarm Insurance Company ("CalFarm") effective March 31, 1999, resulting in a gain of $104.3 million after tax, or $6.08 per share, in the first quarter of 1999. |
| (3) | | The real estate assets and home-building business of Perma-Bilt, a Nevada Corporation were sold in 2002. Income from discontinued operations in 2002 includes the gain on the sale of $6.3 million after tax. Results for 2001 and prior have been restated to present the real estate business as discontinued operations.
|
52
Years ended December 31,
|
|
|---|
2000
| | 1999
| | 1998
| |
|
|---|
|
| (Dollars and shares in thousands, except per share data) | | | | | | | | | | |
| Revenues: | | | | | | | | | | |
| Premiums earned | $ | 338,752 | | $ | 369,403 | | $ | 529,855 | | |
| Net investment income | | 51,766 | | | 53,662 | | | 53,593 | | |
| Realized (losses) gains on investments | | (15,467 | ) | | 7,682 | | | 11,602 | | |
| Service fee income | | | | | 2,691 | | | 3,992 | | |
|
| Total revenues | | 375,051 | | | 433,438 | | | 599,042 | | |
|
| Components of net income (loss) after tax: | | | | | | | | | | |
| Underwriting loss: | | | | | | | | | | |
| Loss excluding catastrophes | | (53,251 | ) | | (72,904 | ) | | (11,230 | ) | |
| Catastrophe losses | | (14,690 | ) | | (12,285 | ) | | (7,475 | ) | |
| Net investment income | | 34,243 | | | 35,632 | | | 35,907 | | |
| Realized (losses) gains on investments | | (10,054 | ) | | 4,993 | | | 7,541 | | |
| Parent expenses and interest expense | | (7,593 | ) | | (8,043 | ) | | (6,511 | ) | |
| Equity in earnings (losses) of investee | | | | | | | | | | |
| Gain on sale of CalFarm | | | | | 104,335 | | | | | |
|
| Income (loss) from continuing operations before extraordinary item | | (51,345 | ) | | 51,728 | | | 18,232 | | |
|
| Income from discontinued real estate operations | | 3,552 | | | 2,372 | | | 868 | | |
| Extraordinary item-gain on extinguishment of debt | | 993 | | | | | | | | |
|
| Net income (loss) | | (46,800 | ) | | 54,100 | | | 19,100 | | |
|
| Per common share: | | | | | | | | | | |
Income (loss) from continuing operations
before extraordinary item | | (2.99 | ) | | 3.01 | | | 1.06 | | |
| Net income (loss) | | (2.72 | ) | | 3.15 | | | 1.11 | | |
|
| Cash dividends per share to common stockholders | | 1.00 | | | 1.00 | | | 1.00 | | |
|
| Weighted average common shares outstanding | | 17,212 | | | 17,172 | | | 17,158 | | |
|
| Financial condition: | | | | | | | | | | |
| Total assets | $ | 1,472,190 | | $ | 1,573,786 | | $ | 1,818,726 | | |
| Investments | | 852,734 | | | 901,734 | | | 1,048,681 | | |
| Unpaid losses and loss adjustment expenses | | 877,883 | | | 880,929 | | | 997,647 | | |
| Senior notes and bank debt | | 58,374 | | | 74,717 | | | 79,596 | | |
| Redeemable securities | | 65,618 | | | 73,397 | | | 73,341 | | |
| Stockholders' equity | | 309,776 | | | 354,559 | | | 346,952 | | |
| Stockholders' equity per share | | 17.76 | | | 20.67 | | | 20.23 | | |
| Return on average equity | | (14.3)% | | | 13.9% | | | 5.4% | | |
|
| Insurance statistics (GAAP): | | | | | | | | | | |
| Paid loss and loss adjustment expense ratio | | 90.9% | | | 96.0% | | | 82.9% | | |
| Combined ratio: | | | | | | | | | | |
| Loss and loss adjustment expense ratio | | 99.4% | | | 97.5% | | | 72.3% | | |
| Underwriting expense ratio | | 30.8%
| | | 37.7%
| | | 33.0%
| | |
| Combined ratio | | 130.2% | | | 135.2% | | | 105.3% | | |
| Net premiums earned-to-surplus ratio | | 1.1 | | | 1.1 | | | 1.2 | | |
| Loss and loss adjustment expense reserves-to-surplus ratio (net of reinsurance) | | 2.0 | | | 1.8 | | | 1.6 | | |
|
| (4) | | In 2002, Zenith acquired additional shares of Advent Capital (Holdings) PLC ("Advent Capital"). Effective 2002, the investment in Advent Capital is being accounted for under the equity method. 2001 has been restated to reflect the change in accounting from the cost method to the equity method. |
| (5) | | In 2001 and 2000, Zenith repurchased $1.3 million and $16.5 million, respectively, aggregate principal amount of the outstanding 9% Senior Notes due 2002. In 2000, Zenith repurchased $8.0 million aggregate liquidation amount of the outstanding 8.55% Capital Securities. In 2002, Zenith paid the outstanding principal of $57.2 million of its 9% Senior Notes due May 1, 2002.
|
53
CONSOLIDATED BALANCE SHEET
Zenith National Insurance Corp. and Subsidiaries
| |
December 31,
(Dollars in thousands)
| Note(s)
| | 2002
| | 2001
| |
|---|
| |
| Assets: | | | | | | | (Restated—see Note 1) | |
| Fixed maturity investments: | | | | | | | | |
| | At amortized cost (fair value $108,732 in 2002 and $29,284 in 2001) | | | $ | 104,964 | | $ | 28,593 | |
| | At fair value (amortized cost $675,075 in 2002 and $699,967 in 2001) | | | | 704,896 | | | 698,666 | |
| Equity securities, at fair value (cost $51,686 in 2002 and $41,698 in 2001) | | | | 48,634 | | | 40,282 | |
| Mortgage loans (at unpaid principal balance) | | | | 26,924 | | | 23,149 | |
| Short-term investments (at cost, which approximates fair value) | | | | 158,078 | | | 119,066 | |
| Investment in Advent Capital (Holdings) PLC | | | | 18,319 | | | 1,028 | |
| Other investments | | | | 36,469 | | | 30,743 | |
| |
| Total investments | 1, 2, 3 | | | 1,098,284 | | | 941,527 | |
| Cash | | | | 17,452 | | | 22,812 | |
| Accrued investment income | | | | 10,990 | | | 11,659 | |
| Premiums receivable, less bad debt allowance of $2,300 in 2002 and $7,704 in 2001 | | | | 77,298 | | | 86,823 | |
| Receivable from reinsurers and state trust funds for paid and unpaid losses | 7, 14 | | | 272,013 | | | 263,500 | |
| Deferred policy acquisition costs | | | | 13,374 | | | 12,679 | |
| Current and deferred income taxes | 5 | | | 35,820 | | | 48,993 | |
| Goodwill | 1 | | | 20,985 | | | 21,485 | |
| Real estate assets held for sale | 6 | | | | | | 66,384 | |
| Other assets | 4 | | | 68,897 | | | 62,137 | |
| |
| Total assets | | | $ | 1,615,113 | | $ | 1,537,999 | |
| |
| Liabilities: | | | | | | | | |
| Policy liabilities and accruals: | | | | | | | | |
| | Unpaid loss and loss adjustment expenses | 7 | | $ | 1,041,532 | | $ | 946,822 | |
| | Unearned premiums | | | | 97,387 | | | 71,313 | |
| Policyholders' dividends accrued | | | | 3,362 | | | 3,316 | |
| Senior notes payable, less unamortized issue costs of $32 in 2001 | 3, 9, 12 | | | | | | 57,203 | |
| Redeemable securities, less unamortized issue costs of $1,281 and $1,331 in 2002 and 2001 | 3, 11, 12 | | | 65,719 | | | 65,669 | |
| Real estate liabilities held for sale | 6 | | | | | | 21,953 | |
| Other liabilities | | | | 90,089 | | | 71,172 | |
| |
| Total liabilities | | | | 1,298,089 | | | 1,237,448 | |
| |
| Commitments and contingent liabilities | 14 | | | | | | | |
| Stockholders' equity: | | | | | | | | |
| Preferred stock, $1 par, 1,000 shares authorized; none issued or outstanding in 2002 or 2001 | | | | | | | | |
| Common stock, $1 par 50,000 shares authorized; issued 25,786 and 25,571 in 2002 and 2001, outstanding 18,768 and 18,553 in 2002 and 2001 | | | | 25,786 | | | 25,571 | |
| Additional paid-in capital | | | | 296,974 | | | 291,348 | |
| Retained earnings | | | | 109,008 | | | 117,540 | |
| Accumulated other comprehensive income (loss) | 19 | | | 17,398 | | | (1,766 | ) |
| |
| | | | | 449,166 | | | 432,693 | |
| Treasury stock, at cost (7,018 shares in 2002 and 2001) | 15 | | | (132,142 | ) | | (132,142 | ) |
| |
| Total stockholders' equity | | | | 317,024 | | | 300,551 | |
| |
| Total liabilities and stockholders' equity | | | $ | 1,615,113 | | $ | 1,537,999 | |
| |
The accompanying notes are an integral part of this statement.
54
CONSOLIDATED STATEMENT OF OPERATIONS
Zenith National Insurance Corp. and Subsidiaries
| |
Years ended December 31,
(Dollars and shares in thousands, except per share data)
| | Note(s)
| | 2002
| | 2001
| | 2000
| |
|---|
| |
| | | | | | | | | (Restated—see Note 1) | |
| Revenues: | | | | | | | | | | | | |
| Premiums earned | | 13 | | $ | 557,055 | | $ | 476,876 | | $ | 338,752 | |
| Net investment income | | 2 | | | 48,811 | | | 51,178 | | | 51,766 | |
| Realized (losses) gains on investments | | 2 | | | (3,631 | ) | | 9,169 | | | (15,467 | ) |
| |
| Total revenues | | | | | 602,235 | | | 537,223 | | | 375,051 | |
| |
| Expenses: | | | | | | | | | | | | |
| Loss and loss adjustment expenses incurred | | 7, 13 | | | 442,051 | | | 432,290 | | | 336,962 | |
| Policy acquisition costs | | 1 | | | 92,202 | | | 87,823 | | | 62,891 | |
| Other underwriting and operating expenses | | | | | 61,138 | | | 48,858 | | | 45,787 | |
| Policyholders' dividends and participation | | | | | 3,003 | | | 1,978 | | | 1,544 | |
| Interest expense | | 9, 10, 11, 12 | | | 5,102 | | | 7,576 | | | 5,640 | |
| |
| Total expenses | | | | | 603,496 | | | 578,525 | | | 452,824 | |
| |
| Loss from continuing operations before federal income tax benefit, equity in earnings of investee and extraordinary item | | | | | (1,261 | ) | | (41,302 | ) | | (77,773 | ) |
| Federal income tax benefit | | 5 | | | (914 | ) | | (13,756 | ) | | (26,428 | ) |
| |
| Loss from continuing operations after federal income tax benefit and before equity in earnings of investee and extraordinary item | | | | | (347 | ) | | (27,546 | ) | | (51,345 | ) |
| Equity in earnings (losses) of investee, net of federal income tax expense (benefit) of $734 in 2002 and $(1,110) in 2001 | | 2 | | | 1,363 | | | (2,060 | ) | | | |
| |
| Income (loss) from continuing operations before extraordinary item | | | | | 1,016 | | | (29,606 | ) | | (51,345 | ) |
| |
| Income from discontinued real estate operations, net of federal income tax expense of $1,547 in 2002, $2,017 in 2001 and $1,912 in 2000 | | 6 | | | 2,872 | | | 3,746 | | | 3,552 | |
| Gain on sale of real estate operations, net of federal income tax expense of $3,399 | | 6 | | | 6,312 | | | | | | | |
| |
| Total income from discontinued operations | | | | | 9,184 | | | 3,746 | | | 3,552 | |
| |
| Income (loss) before extraordinary item | | | | | 10,200 | | | (25,860 | ) | | (47,793 | ) |
| Extraordinary item — gain on extinguishment of debt, net of federal income tax expense of $534 | | 12 | | | | | | | | | 993 | |
| |
| Net income (loss) | | 15 | | $ | 10,200 | | $ | (25,860 | ) | $ | (46,800 | ) |
| |
| Net income (loss) per common share: | | | | | | | | | | | | |
| Basic: | | | | | | | | | | | | |
| Continuing operations | | | | $ | 0.05 | | $ | (1.68 | ) | $ | (2.99 | ) |
| Discontinued operations | | 6 | | | 0.50 | | | 0.21 | | | 0.21 | |
| Extraordinary item | | 12 | | | | | | | | | 0.06 | |
| |
| Net income (loss) | | 15, 18 | | $ | 0.55 | | $ | (1.47 | ) | $ | (2.72 | ) |
| |
| Diluted: | | | | | | | | | | | | |
| Continuing operations | | | | $ | 0.05 | | $ | (1.68 | ) | $ | (2.99 | ) |
| Discontinued operations | | 6 | | | 0.49 | | | 0.21 | | | 0.21 | |
| Extraordinary item | | 12 | | | | | | | | | 0.06 | |
| |
| Net income (loss) | | 15, 18 | | $ | 0.54 | | $ | (1.47 | ) | $ | (2.72 | ) |
| |
The accompanying notes are an integral part of this statement.
55
CONSOLIDATED STATEMENT OF CASH FLOWS
Zenith National Insurance Corp. and Subsidiaries
| |
Years ended December 31,
(Dollars in thousands)
| Note(s)
| | 2002
| | 2001
| | 2000
| |
|---|
| |
| | | | | | | | (Restated—see Note 1) | |
| Cash flows from operating activities: | | | | | | | | | | | |
| | Premiums collected | | | $ | 650,407 | | $ | 493,021 | | $ | 355,538 | |
| | Investment income received | | | | 49,439 | | | 50,319 | | | 48,802 | |
| | Net proceeds from trading portfolio investments | | | | | | | 3,000 | | | | |
| | Loss and loss adjustment expenses paid | 7 | | | (351,400 | ) | | (320,852 | ) | | (298,777 | ) |
| | Underwriting and other operating expenses paid | | | | (202,157 | ) | | (152,204 | ) | | (129,282 | ) |
| | Interest paid | | | | (6,078 | ) | | (7,647 | ) | | (6,216 | ) |
| | Income taxes (paid) refunded | | | | (740 | ) | | 14,662 | | | (22,175 | ) |
| |
| Net cash provided by (used in) continuing operating activities | | | | 139,471 | | | 80,299 | | | (52,110 | ) |
| Net cash provided by discontinued operating activities | 6 | | | 3,703 | | | 4,308 | | | 5,072 | |
| |
| Net cash provided by (used in) operating activities | | | | 143,174 | | | 84,607 | | | (47,038 | ) |
| |
| Cash flows from investing activities: | | | | | | | | | | | |
| | Purchases of investments: | | | | | | | | | | | |
| | | Investment securities available-for-sale | | | | (405,262 | ) | | (1,362,903 | ) | | (164,485 | ) |
| | | Fixed maturities held-to-maturity | | | | (90,207 | ) | | (9,956 | ) | | | |
| | | Other investments | | | | (22,722 | ) | | (10,487 | ) | | (4,252 | ) |
| | Proceeds from maturities and redemptions of investments: | | | | | | | | | | | |
| | | Fixed maturities held-to-maturity | | | | 13,704 | | | 5,780 | | | 2,962 | |
| | | Investment securities available-for-sale | | | | 42,660 | | | 60,430 | | | 48,319 | |
| | | Other investments | | | | 284 | | | | | | | |
| | Proceeds from sales of investments: | | | | | | | | | | | |
| | | Investment securities available-for-sale | | | | 370,674 | | | 1,180,668 | | | 173,490 | |
| | | Other investments | | | | 636 | | | 16,354 | | | 8,807 | |
| | Net (increase) decrease in short-term investments | | | | (38,167 | ) | | 41,966 | | | 25,026 | |
| | Net proceeds from sale of real estate operations | | | | 54,246 | | | | | | | |
| | Capital expenditures and other, net | | | | (6,353 | ) | | (7,036 | ) | | (5,727 | ) |
| |
| Net cash (used in) provided by continuing investing activities | 2 | | | (80,507 | ) | | (85,184 | ) | | 84,140 | |
| Net cash used in discontinued investing activities | 6 | | | (11 | ) | | (99 | ) | | (62 | ) |
| |
| Net cash (used in) provided by investing activities | | | | (80,518 | ) | | (85,283 | ) | | 84,078 | |
| |
| Cash flows from financing activities: | | | | | | | | | | | |
| | Repurchase of redeemable securities | 12 | | | | | | | | | (6,164 | ) |
| | Repayment of 9% Notes | 9 | | | (57,235 | ) | | | | | | |
| | Repurchase of 9% Notes | 12 | | | | | | (1,265 | ) | | (16,585 | ) |
| | Sale of treasury shares | 15 | | | | | | 25,000 | | | | |
| | Cash advanced from bank lines of credit | 8 | | | 25,000 | | | | | | | |
| | Cash repaid on bank lines of credit | 8 | | | (25,000 | ) | | | | | | |
| | Cash dividends paid to common stockholders | | | | (18,677 | ) | | (17,502 | ) | | (17,183 | ) |
| | Proceeds from exercise of stock options | 15 | | | 5,431 | | | 3,022 | | | 7,246 | |
| | Purchase of treasury shares | 15 | | | | | | (207 | ) | | (38 | ) |
| |
| Net cash (used in) provided by continuing financing activities | | | | (70,481 | ) | | 9,048 | | | (32,724 | ) |
| Net cash provided by (used in) discontinued financing activities | 6 | | | 367 | | | 512 | | | (4,004 | ) |
| |
| Net cash (used in) provided by financing activities | | | | (70,114 | ) | | 9,560 | | | (36,728 | ) |
| |
| Net (decrease) increase in cash | | | | (7,458 | ) | | 8,884 | | | 312 | |
| Net change in cash reclassified to real estate assets held for sale | 6 | | | 2,098 | | | 283 | | | (417 | ) |
| Cash at beginning of year | | | | 22,812 | | | 13,645 | | | 13,750 | |
| |
| Cash at end of year | | | $ | 17,452 | | $ | 22,812 | | $ | 13,645 | |
| |
The accompanying notes are an integral part of this statement.
Continued
56
CONSOLIDATED STATEMENT OF CASH FLOWS (CONTINUED)
Zenith National Insurance Corp. and Subsidiaries
| |
Years ended December 31,
(Dollars in thousands)
| Note(s)
| | 2002
| | 2001
| | 2000
| |
|---|
| |
| | | | | | | | (Restated—see Note 1) | |
| Reconciliation of net income (loss) to net cash flows from operating activities: | | | | | | | | | | | |
| Net income (loss) | | | $ | 10,200 | | $ | (25,860 | ) | $ | (46,800 | ) |
| Adjustments to reconcile net income (loss) to net cash flows provided by (used in) operating activities: | | | | | | | | | | | |
| | Income from discontinued operations | 6 | | | (9,184 | ) | | (3,746 | ) | | (3,552 | ) |
| | Net depreciation, amortization and accretion | | | | 6,003 | | | 6,730 | | | 5,465 | |
| | Realized losses (gains) on investments | 2 | | | 3,631 | | | (9,169 | ) | | 15,467 | |
| | Equity in (earnings) losses of investee | | | | (1,363 | ) | | 2,060 | | | | |
| | Net proceeds from sales of trading portfolio investments | | | | | | | 3,000 | | | | |
| | (Increase) decrease in: | | | | | | | | | | | |
| | | | Premiums receivable | | | | 9,525 | | | (10,418 | ) | | (1,819 | ) |
| | | | Receivable from reinsurers and state trust funds for paid and unpaid losses | 7 | | | (9,048 | ) | | 41,562 | | | 36,184 | |
| | | | Federal income tax | 5 | | | (1,654 | ) | | 1,302 | | | (48,152 | ) |
| | Increase (decrease) in: | | | | | | | | | | | |
| | | | Unpaid loss and loss adjustment expenses | 7 | | | 94,710 | | | 68,939 | | | (3,046 | ) |
| | | | Unearned premiums | | | | 26,074 | | | 12,406 | | | 8,001 | |
| | | | Policyholders' dividends accrued | | | | 46 | | | 543 | | | (602 | ) |
| | | | Accrued expenses | | | | 9,908 | | | (2,373 | ) | | 570 | |
| | | | Other | | | | 623 | | | (4,677 | ) | | (13,826 | ) |
| |
| Net cash provided by (used in) continuing operating activities | | | | 139,471 | | | 80,299 | | | (52,110 | ) |
| Net cash provided by discontinued operating activities | 6 | | | 3,703 | | | 4,308 | | | 5,072 | |
| |
| Net cash provided by (used in) operating activities | | | $ | 143,174 | | $ | 84,607 | | $ | (47,038 | ) |
| |
The accompanying notes are an integral part of this statement.
57
CONSOLIDATED STATEMENT OF STOCKHOLDERS' EQUITY
Zenith National Insurance Corp. and Subsidiaries
|
|---|
Three years ended December 31, 2002
(Dollars and shares in thousands, except per share data)
| | Note(s)
| | Common
shares
outstanding
| | Preferred
stock $1 par
|
|---|
|
| Balance at December 31, 1999 | | | | 17,150 | | |
| Net loss for 2000 | | | | | | |
| Other comprehensive income — unrealized gain on investments, net of deferred tax expense of $6,349 and net of reclassification adjustment | | 19 | | | | |
| | | | | | | |
| Comprehensive loss | | | | | | |
| Exercise of stock options | | 15 | | 295 | | |
| Tax benefit on options exercised in 2000 | | | | | | |
| Purchase of treasury shares at cost | | 15 | | (2 | ) | |
| Cash dividends declared to common stockholders ($1.00 per share, paid quarterly) | | | | | | |
|
| Balance at December 31, 2000 | | | | 17,443 | | |
| Net loss for 2001(1) | | 1 | | | | |
| Other comprehensive income — unrealized gain on investments, net of deferred tax expense of $3,468 and net of reclassification adjustment | | 19 | | | | |
| | | | | | | |
| Comprehensive loss | | | | | | |
| Exercise of stock options | | 15 | | 119 | | |
| Tax benefit on options exercised in 2001 | | | | | | |
| Purchase of treasury shares at cost | | 15 | | (9 | ) | |
| Sale of treasury shares | | 15 | | 1,000 | | |
| Cash dividends declared to common stockholders ($1.00 per share, paid quarterly) | | | | | | |
|
| Balance at December 31, 2001 | | | | 18,553 | | |
| Net income for 2002 | | | | | | |
| Other comprehensive income, net of tax: | | | | | | |
| Unrealized gain on investments, net of deferred tax expense of $10,320 and net of reclassification adjustment | | 19 | | | | |
| Foreign currency translation adjustment, net of deferred tax benefit of $1 | | | | | | |
| | | | | | | |
| Total other comprehensive income | | 19 | | | | |
| | | | | | | |
| Comprehensive income | | | | | | |
| Exercise of stock options | | 15 | | 215 | | |
| Tax benefit on options exercised in 2002 | | | | | | |
| Recognition of stock-based compensation | | 15 | | | | |
| Cash dividends declared to common stockholders ($1.00 per share, paid quarterly) | | | | | | |
|
| Balance at December 31, 2002 | | | | 18,768 | | |
|
The accompanying notes are an integral part of this statement.
|
| (1) | | 2001 net loss was restated — see Note 1.
|
58
|
| |
|---|
Three years ended December 31, 2002
(Dollars and shares in thousands, except per share data)
| Common
stock $1 par
| | Additional
paid-in capital
| | Retained
earnings
| | Accumulated other
comprehensive
income (loss)
| | Treasury
stock
| | Total
| |
|---|
| |
| Balance at December 31, 1999 | $ | 25,157 | | $ | 274,897 | | $ | 225,229 | | $ | (19,998 | ) | $ | (150,726 | ) | $ | 354,559 | |
| Net loss for 2000 | | | | | | | | (46,800 | ) | | | | | | | | (46,800 | ) |
| Other comprehensive income — unrealized gain on investments, net of deferred tax expense of $6,349 and net of reclassification adjustment | | | | | | | | | | | 11,792 | | | | | | 11,792 | |
| | | | | | | | | | | | | | | | | |
| |
| Comprehensive loss | | | | | | | | | | | | | | | | | (35,008 | ) |
| Exercise of stock options | | 295 | | | 6,951 | | | | | | | | | | | | 7,246 | |
| Tax benefit on options exercised in 2000 | | | | | 272 | | | | | | | | | | | | 272 | |
| Purchase of treasury shares at cost | | | | | | | | | | | | | | (38 | ) | | (38 | ) |
| Cash dividends declared to common stockholders ($1.00 per share, paid quarterly) | | | | | | | | (17,255 | ) | | | | | | | | (17,255 | ) |
| |
| Balance at December 31, 2000 | | 25,452 | | | 282,120 | | | 161,174 | | | (8,206 | ) | | (150,764 | ) | | 309,776 | |
| Net loss for 2001(1) | | | | | | | | (25,860 | ) | | | | | | | | (25,860 | ) |
| Other comprehensive income — unrealized gain on investments, net of deferred tax expense of $3,468 and net of reclassification adjustment | | | | | | | | | | | 6,440 | | | | | | 6,440 | |
| | | | | | | | | | | | | | | | | |
| |
| Comprehensive loss | | | | | | | | | | | | | | | | | (19,420 | ) |
| Exercise of stock options | | 119 | | | 2,903 | | | | | | | | | | | | 3,022 | |
| Tax benefit on options exercised in 2001 | | | | | 154 | | | | | | | | | | | | 154 | |
| Purchase of treasury shares at cost | | | | | | | | | | | | | | (207 | ) | | (207 | ) |
| Sale of treasury shares | | | | | 6,171 | | | | | | | | | 18,829 | | | 25,000 | |
| Cash dividends declared to common stockholders ($1.00 per share, paid quarterly) | | | | | | | | (17,774 | ) | | | | | | | | (17,774 | ) |
| |
| Balance at December 31, 2001 | | 25,571 | | | 291,348 | | | 117,540 | | | (1,766 | ) | | (132,142 | ) | | 300,551 | |
| Net income for 2002 | | | | | | | | 10,200 | | | | | | | | | 10,200 | |
| Other comprehensive income, net of tax: | | | | | | | | | | | | | | | | | | |
| Unrealized gain on investments, net of deferred tax expense of $10,320 and net of reclassification adjustment | | | | | | | | | | | 19,166 | | | | | | 19,166 | |
| Foreign currency translation adjustment, net of deferred tax benefit of $1 | | | | | | | | | | | (2 | ) | | | | | (2 | ) |
| | | | | | | | | | | | | | | | | |
| |
| Total other comprehensive income | | | | | | | | | | | | | | | | | 19,164 | |
| | | | | | | | | | | | | | | | | |
| |
| Comprehensive income | | | | | | | | | | | | | | | | | 29,364 | |
| Exercise of stock options | | 215 | | | 5,216 | | | | | | | | | | | | 5,431 | |
| Tax benefit on options exercised in 2002 | | | | | 373 | | | | | | | | | | | | 373 | |
| Recognition of stock-based compensation | | | | | 37 | | | | | | | | | | | | 37 | |
| Cash dividends declared to common stockholders ($1.00 per share, paid quarterly) | | | | | | | | (18,732 | ) | | | | | | | | (18,732 | ) |
| |
| Balance at December 31, 2002 | $ | 25,786 | | $ | 296,974 | | $ | 109,008 | | $ | 17,398 | | $ | (132,142 | ) | $ | 317,024 | |
| |
59
NOTES TO CONSOLIDATED FINANCIAL STATEMENTS
ZENITH NATIONAL INSURANCE CORP. AND SUBSIDIARIES
NOTE 1
Summary of Accounting Policies,
Operations and Principles of Consolidation
The accompanying financial statements have been prepared in accordance with generally accepted accounting principles ("GAAP") in the United States and include Zenith National Insurance Corp. ("Zenith National") and its subsidiaries (collectively, "Zenith"). All significant intercompany transactions and balances have been eliminated in consolidation. Zenith National is engaged through its wholly-owned property-casualty insurance subsidiaries (primarily Zenith Insurance Company ("Zenith Insurance")) in Workers' Compensation insurance and Reinsurance. Approximately 55% and 19% of the premiums earned in the Workers' Compensation operations in 2002 was in California and Florida, respectively. The concentration of Zenith's business in these states makes the results of operations highly dependent upon the states' economies, social and cultural trends, legislative and regulatory changes, and catastrophic events such as windstorms and earthquakes. Zenith sells insurance and reinsurance through agents and brokers and not directly to consumers and is subject to regulation and supervision by the California and Texas Departments of Insurance. In addition to the insurance business, Zenith conducts Investment and Parent operations. See Note 20 for a description of Zenith's business segments. Zenith's home-building business and related real estate assets were sold in 2002. The results of real estate operations and cash flows from real estate operations have been restated and presented as discontinued operations for all periods presented. The associated assets and liabilities at December 31, 2001 have been restated and presented as assets and liabilities held for sale (see Note 6). The carrying value of other investments, deferred income taxes and retained earnings at December 31, 2001 and results of operations for the year ended December 31, 2001 have been restated in connection with the acquisition of additional shares of Advent Capital (Holdings) PLC ("Advent Capital") in 2002 (see Note 2). Certain disclosures in the following notes have also been restated for the sale of the real estate operations and change in accounting for our investment in Advent Capital.
GAAP requires the use of assumptions and estimates in reporting certain assets and liabilities and related disclosures. Actual results could differ from those estimates.
Investments
Zenith's investments in debt and equity securities are identified in three categories as follows: (1) held-to-maturity — those securities, which by their terms must be redeemed by the issuing company and that Zenith has the positive intent and ability to hold to maturity and are reported at amortized cost; (2) trading — those securities that are held principally for the purpose of selling in the near term and are reported at fair value with unrealized gains and losses included in earnings; and (3) available-for-sale — those securities not classified as either held-to-maturity or trading and are reported at fair value with unrealized gains and losses excluded from earnings and reported as a separate component of stockholders' equity, net of deferred tax. There were no investments identified to the trading securities portfolio at December 31, 2002 or 2001. The majority of held-to-maturity securities are Government National Mortgage Association securities on which Zenith receives periodic returns of principal.
Short-term investments include debt securities such as corporate, municipal and treasury securities with maturities of less than one year at the date of purchase. For these
60
short-term investments, the amortized cost is a reasonable estimate of fair value.
Mortgage loans are carried at unpaid principal balance. All of the unpaid principal on Zenith's mortgage loans is considered to be collectible and there is no provision for uncollectible amounts. Other investments include: (1) investments in real estate that are reported at cost and (2) limited partnerships in which our investment typically represents a very small percentage of the total capital of the partnership and which are reported at cost. If our share of the partnership capital is greater than 3%, we account for the investment on the equity method, and the carrying value of our investment is adjusted to reflect our share of the underlying equity of the partnership. The investment in Advent Capital is accounted for under the equity method (see Note 2).
When, in the opinion of management, a decline in the fair value of an investment is considered to be "other-than-temporary," such investment is written-down to its fair value. The determination of other-than-temporary includes, in addition to other relevant factors, a presumption that if the market value is below cost by a significant amount for a period of time, a write-down is necessary. Such write-downs are reflected as a reduction of net realized gains on investments. During the years ended December 31, 2002, 2001 and 2000, there were $11.1 million, $12.7 million and $22.5 million, respectively, of such write-downs.
Investment income is recorded when earned. Realized capital gains and losses are calculated based on the cost of securities sold, which is determined by the "identified cost" method.
Cash
Cash includes currency on hand and demand deposits with financial institutions.
Recognition of Property-Casualty
Revenue and Expense
Revenue recognition. The consideration paid for an insurance or reinsurance policy is generally known as a "premium." Policy premiums paid by our policyholders and reinsured companies are the revenue stream attributable to our property-casualty insurance operations. Premiums are billed and collected according to policy terms, predominantly in the form of installments during the policy period. Any amounts receivable for billed premiums are charged-off if they are submitted to our in-house legal collections department. An estimate of amounts that are past due and which are likely to be charged-off is established as an allowance for doubtful accounts. Premiums are earned pro-rata over the terms of the policies. Billed premiums applicable to the unexpired terms of policies in-force are recorded as unearned premiums. Workers' compensation premiums are determined based upon the payroll of the insured and applicable premium rates. An audit of the policyholders' records is conducted after policy expiration, usually within about 90 days, to make a final determination of applicable premiums. Included with premiums earned is an estimate for earned but unbilled audit premiums. We can estimate earned but unbilled premiums because we keep track, by policy, of how much additional premium is billed in final audit invoices as a percentage of the original estimated amount that was billed. We use the historical percentage to estimate the probable additional amount that we have earned but not yet billed as of the balance sheet date. Estimated earned but not billed premiums included in premiums receivable were $11.5 million at December 31, 2002 and $9.9 million at December 31, 2001.
We have written a relatively small number of workers' compensation policies that are retrospectively-rated. Under this type of policy, the policyholder may be entitled, at a date
61
subsequent to policy expiration, to a refund or may owe us for additional premium based on the amount of losses sustained under the policy. These retrospective premium adjustments are confined to a limited amount plus or minus the standard amount of premium applicable to the policy. We can estimate these retrospective adjustments because we know the underlying loss experience of the policies involved. The estimated liability for return of premiums under retrospectively-rated workers' compensation policies included in unearned premiums was $4.4 million at December 31, 2002 and $5.4 million at December 31, 2001. The estimated amount receivable for additional premiums receivable under retrospectively-rated workers' compensation policies included in premiums receivable was $8.8 million at December 31, 2002 and $17.1 million at December 31, 2001. The decrease in the amount receivable is attributable to a reduction in the number of retrospectively-rated policies in our Florida workers' compensation business.
Catastrophe reinsurance contracts are customarily written to provide reinsurance for one event with a provision to reinstate the contract for the unexpired term of the original contract. An additional premium, called a reinstatement premium, is due in consideration of the reinstatement. If a catastrophe loss is reported and accrued, any unearned premium associated with the contract at that time becomes fully earned. The reinstatement premium is then earned over the remaining term of the contract. Additional premiums earned attributable to original and reinstatement premiums for catastrophe reinsurance contracts were $1.4 million in 2002 and $11.1 million in 2001.
Deferred policy acquisition costs. Policy acquisition costs, consisting of commissions, premium taxes and certain other underwriting costs, are deferred and amortized as the related premiums are earned. A premium deficiency is recognized if the sum of expected claims costs, claims adjustment expenses, expected dividends to policyholders, unamortized acquisition costs and maintenance costs exceed the related unearned premiums. A premium deficiency would first be recognized by charging any unamortized acquisition costs to expense to the extent required to eliminate the deficiency. If the premium deficiency were greater than unamortized acquisition costs, a liability would be accrued for the excess deficiency. At December 31, 2002 and 2001, deferred policy acquisition costs were $13.4 million and $12.7 million, respectively, and Zenith's estimate indicated that there was no premium deficiency and a premium deficiency would not occur until our estimated loss and loss adjustment expense ratio in 2002 was increased by about 12 percentage points.
Claims expense. Zenith makes provisions for the settlement of all incurred claims, both reported and unreported. The liabilities for unpaid loss and loss adjustment expenses are estimates of the eventual costs of claims incurred but not settled, less estimates of salvage and subrogation. Actuarial techniques and estimation methods are utilized to establish the most reasonably accurate estimate of loss reserves at a point in time including an estimate of the probable amount for unreported claims arising from accidents which have not yet been reported to the Company, commonly known in the industry as "incurred but not reported" or "IBNR." Estimates for reported claims are also determined by evaluation of individual reported claims and amounts reported by ceding companies. The methods for making such estimates and for establishing the resulting liabilities are continually reviewed and updated, and any adjustments resulting therefrom are reflected in earnings currently. Estimates of losses from environmental and asbestos-related claims are included in overall loss reserves and to date have not been material.
62
Policyholder dividends. An estimated provision for Workers' Compensation policyholders' dividends is accrued as the related premiums are earned. Such dividends do not become a fixed liability unless and until declared by the respective Boards of Directors of Zenith's insurance subsidiaries. The dividend to which a policyholder is entitled is set forth in the policy and is related to the amount of losses sustained under the policy. Dividends are paid after policy expiration (usually at 6 months and at 18 months). We are able to estimate any liability we may have because we know the underlying loss experience of the policies we have written with dividends and can estimate future dividend payments from the policy terms.
Catastrophes. Insurance and reinsurance coverages expose Zenith to the risk of significant loss in the event of major loss events, known in the insurance industry as catastrophes. Catastrophes may cause significant contemporaneous financial statement losses since catastrophe losses may not be accrued in advance of the event. Underwriting losses in 2001 in the Reinsurance operations were attributable to losses incurred in connection with the terrorist attack on the World Trade Center on September 11, 2001. There is considerable uncertainty as to the nature and amount of monetary losses associated with the World Trade Center loss. Zenith has currently estimated its share of the World Trade Center loss to be $48.0 million before tax, both gross and net of reinsurance recoverable, by estimating the probable impact to each of its assumed reinsurance contracts based on currently available information. Approximately 70% of the estimated loss is attributable to the contractual maximum loss payable by Zenith under its excess of loss reinsurance contracts; the remainder of the estimated loss is an estimate of its expected loss incurred on assumed quota share reinsurance contracts. The ultimate impact of the World Trade Center loss after deducting original and reinstatement premium income on Zenith's assumed reinsurance contracts for 2001 is estimated to be $20.0 million before tax, or $13.0 million after tax. Zenith has written its assumed reinsurance business so that its exposure to reinsurance losses from any one event in a worst-case scenario is not expected to be more than approximately 5% of Zenith's consolidated stockholders' equity; the expected ultimate loss of $13.0 million after tax is within that 5% maximum. The information we have received so far has resulted in no change in the estimate of Zenith's World Trade Center loss at December 31, 2002 compared to December 31, 2001. Estimates of the impact of the World Trade Center loss and other catastrophes are based on the information that is currently available and such estimates could change based on any new information that becomes available or based upon reinterpretation of existing information.
Reinsurance Ceded
In accordance with general industry practices, we annually purchase excess of loss reinsurance to protect Zenith against the impact of large, irregularly-occurring losses. Such reinsurance reduces the magnitude of sudden and unpredictable changes in net income and the capitalization of Zenith's insurance operations. Reinsurance makes the assuming reinsurer liable to the ceding company to the extent of the reinsurance. It does not, however, discharge the ceding company from its primary liability to its policyholders in the event the reinsurer is unable to meet its obligations under such reinsurance treaty. Zenith monitors the financial condition of its reinsurers and does not believe that it is exposed to any material credit risk through its ceded reinsurance arrangements other than in connection with Reliance Insurance Company ("Reliance"). Historically, no material amounts due from reinsurers have
63
been written-off as uncollectible, but in 2001, Zenith recognized an impairment for reinsurance recoverable from Reliance. Reinsurance recoverable from Reliance was acquired by Zenith from an acquisition in 1996 (see Note 14).
Earned premiums and loss and loss adjustment expenses incurred are stated in the Consolidated Statement of Operations after deduction of amounts ceded to reinsurers. Balances due from reinsurers on unpaid losses, including an estimate of such recoverables related to reserves for incurred but not reported losses, are reported as assets and are included in receivable from reinsurers even though amounts due on unpaid loss and loss adjustment expenses are not recoverable from the reinsurer until such losses are paid. Receivable from reinsurers on unpaid loss and loss adjustment expenses amounted to $220.6 million and $221.6 million at December 31, 2002 and 2001, respectively. Included in these amounts were reinsurance recoverables of $50.8 million and $67.8 million, respectively, relating to reinsurance arrangements entered into by RISCORP and acquired by Zenith in the acquisition of RISCORP in 1998. Such RISCORP-related reinsurance amounts are primarily recoverable from large United States reinsurance companies. In connection with the acquisition of RISCORP, Zenith entered into an aggregate excess of loss reinsurance agreement which provides ceded reinsurance for unpaid losses assumed by Zenith from RISCORP up to $50.0 million in excess of $182.0 million. Receivable from reinsurers on unpaid loss and loss adjustment expenses at December 31, 2002 and 2001 includes $24.8 million and $35.2 million, respectively, recoverable under such reinsurance and is secured by a trust account. The deferred benefit associated with such reinsurance was $10.3 million and $12.1 million at December 31, 2002 and 2001, respectively.
Properties and Equipment
Properties and equipment are stated at cost less accumulated depreciation. Depreciation is calculated on a straight-line basis using the following useful lives: buildings — 10 to 40 years; and furniture, fixtures and equipment — 3 to 10 years. Expenditures for maintenance and repairs are charged to operations as incurred. Additions and improvements to buildings and other fixed assets are capitalized and depreciated over the useful lives of the properties and equipment. Upon disposition, the asset cost and related depreciation are removed from the accounts and the resulting gain or loss is included in income.
Intangible Assets
Effective January 1, 2002, Zenith adopted the provisions of Statement of Financial Accounting Standards No. 142, "Goodwill and Other Intangible Assets" ("SFAS No. 142"), which addresses the accounting for goodwill and other intangible assets. Under SFAS No. 142, goodwill and intangible assets with indefinite lives are no longer amortized and other intangible assets are amortized over their useful lives (which may exceed forty years). The standard also requires that goodwill and intangible assets with indefinite lives be tested for impairment at least annually and sets forth criteria for recognition and measurement of impairment.
As of January 1, 2002, other than goodwill, Zenith had no intangible assets and had recognized goodwill from previous acquisitions. Zenith ceased the amortization of goodwill as of January 1, 2002. Goodwill was $21.0 million and $21.5 million at December 31, 2002 and 2001, respectively. Zenith evaluated this goodwill for impairment at January 1, 2002 as part of implementation of SFAS No. 142, and then at December 31, 2002 in accordance with the SFAS No. 142 annual goodwill impairment test requirement and determined that such goodwill was not impaired. Goodwill was reduced by
64
$0.5 million in 2002 to reflect the reduction of a contingent liability related to income taxes in an acquisition.
The following table presents Zenith's pro-forma net income (loss) and per share amounts excluding goodwill amortization expense:
| |
|---|
Years ended December 31,
(In thousands, except per share data)
| | 2002
| | 2001
| | 2000
| |
|---|
| |
|---|
| Net income (loss): | | | | | | | | | | |
| Net income (loss) as reported | | $ | 10,200 | | $ | (25,860 | ) | $ | (46,800 | ) |
| Goodwill amortization | | | | | | 925 | | | 925 | |
| |
| Pro-forma net income (loss) | | $ | 10,200 | | $ | (24,935 | ) | $ | (45,875 | ) |
| |
| Basic earnings per common share: | | | | | | | | | | |
| Net income (loss) as reported | | $ | 0.55 | | $ | (1.47 | ) | $ | (2.72 | ) |
| Goodwill amortization | | | | | | 0.05 | | | 0.05 | |
| |
| Pro-forma net income (loss) | | $ | 0.55 | | $ | (1.42 | ) | $ | (2.67 | ) |
| |
| Diluted earnings per common share: | | | | | | | | | | |
| Net income (loss) as reported | | $ | 0.54 | | $ | (1.47 | ) | $ | (2.72 | ) |
| Goodwill amortization | | | | | | 0.05 | | | 0.05 | |
| |
| Pro-forma net income (loss) | | $ | 0.54 | | $ | (1.42 | ) | $ | (2.67 | ) |
| |
Employee Stock Options
Under an employee non-qualified stock option plan adopted by the Board of Directors and Stockholders of Zenith National in 1996 (the "Plan"), options are granted to certain officers and key employees for the purchase of Zenith National's common stock at 100% of the market price at the date of grant. The majority of the options outstanding at December 31, 2002 and 2001 expire five years after the date of the grant or three months after termination of employment and vest one-fourth per year after the first year. One grant for 1,000,000 shares is for a term of ten years and vests one-fifth per year after the first year and expires on March 14, 2006.
The following table provides certain information regarding the shares authorized and outstanding under the Plan:
|
|---|
December 31,
(Shares in thousands)
| | 2002
|
|---|
|
|---|
| Number of shares to be issued upon exercise of outstanding options | | | 1,738 |
| Number of shares authorized for option grants | | | 2,676 |
| Number of shares remaining available for future issuance | | | 327 |
| Weighted-average exercise price of outstanding options | | $ | 23.93 |
|
Effective in the fourth quarter of 2002, Zenith adopted the fair value based method of recording stock-based employee compensation in accordance with the Statement of Financial Accounting Standards No. 123, "Accounting for Stock-Based Compensation" ("SFAS No. 123"). Zenith accounted for the change in accounting principle using the prospective method in accordance with the Statement of Financial Accounting Standards No. 148, "Accounting for Stock-Based Compensation—Transition and Disclosure" ("SFAS No. 148"). Under the prospective method, all employee stock option grants beginning with January 2002 were expensed over the stock option vesting period based on the fair value at the date the options were granted. Prior to the fourth quarter of 2002, Zenith applied the provisions of Accounting Principles Board Opinion No. 25, "Accounting for Stock Issued to Employees" ("APB No. 25") in accounting for stock options issued prior to January 2002. Under the intrinsic value method of APB No. 25, Zenith had not been required to recognize compensation expense for stock option grants. The effect of the change in accounting principle and the pro-forma effect of all stock options accounted for under the intrinsic value method for the three years ended December 31, 2002, 2001 and 2000 are set forth in Note 15.
65
Foreign Exchange
Translation gains or losses, net of applicable tax, associated with investments accounted for under the equity method are credited or charged directly to a separate component of other comprehensive income.
Recently Issued Accounting Standards
In April 2002, the Financial Accounting Standards Board ("FASB") issued Statement of Financial Accounting Standards No. 145, "Recision of FASB Statements No. 4, 44 and 64, Amendment of FASB Statement No. 13, and Technical Corrections" ("SFAS No. 145"). Among other things, SFAS No. 145 revises the criteria for classifying gains and losses associated with the extinguishment of debt as extraordinary and the accounting treatment of certain lease modifications. SFAS No. 145 is effective in fiscal year 2003, and we expect it will not have a material impact on Zenith's consolidated statements of financial position, results of operations or cash flows.
On July 30, 2002, the FASB issued Statement of Financial Accounting Standards No. 146, "Accounting for Costs Associated with Exit or Disposal Activities" ("SFAS No. 146"). Among other things, SFAS No. 146 establishes accounting guidelines for the recognition and measurement of a liability for the cost associated with an exit or disposal activity initially at its fair value in the period in which the liability is incurred, rather than at the date of a commitment to an exit or disposal plan. This standard is effective January 1, 2003 for all exit or disposal activities initiated after that date and we expect it will not have a material impact on Zenith's consolidated statements of financial position, results of operations or cash flows.
NOTE 2
Investments
The amortized cost and fair values of investments were as follows:
|
|---|
|
| | Gross unrealized
| |
| |
|
|---|
December 31, 2002
(Dollars in thousands)
| Amortized
cost
| | Fair
value
| | Carrying value
|
|---|
| | gains
| | (losses)
|
|---|
|
|---|
| Held-to-maturity: | | | | | | | | | | | | | | |
| | Corporate debt | $ | 5,308 | | $ | 318 | | | | | $ | 5,626 | | $ | 5,308 |
| | Mortgage-backed | | 99,656 | | | 3,450 | | | | | | 103,106 | | | 99,656 |
|
| Total held-to-maturity | $ | 104,964 | | $ | 3,768 | | | | | $ | 108,732 | | $ | 104,964 |
|
| Available-for-sale: | | | | | | | | | | | | | | |
| | U.S. government debt | $ | 67,088 | | $ | 726 | | | | | $ | 67,814 | | $ | 67,814 |
| | State and local government debt | | 53,665 | | | 769 | | $ | (122 | ) | | 54,312 | | | 54,312 |
| | Corporate debt | | 511,012 | | | 27,115 | | | (5,231 | ) | | 532,896 | | | 532,896 |
| | Mortgage-backed | | 21,548 | | | 3,043 | | | (2 | ) | | 24,589 | | | 24,589 |
| | Redeemable preferred stocks | | 21,762 | | | 3,651 | | | (128 | ) | | 25,285 | | | 25,285 |
| | Equities | | 51,686 | | | 1,278 | | | (4,330 | ) | | 48,634 | | | 48,634 |
| | Short-term investments | | 158,078 | | | | | | | | | 158,078 | | | 158,078 |
|
Total available-
for-sale | $ | 884,839 | | $ | 36,582 | | $ | (9,813 | ) | $ | 911,608 | | $ | 911,608 |
|
|
|---|
|
| | Gross unrealized
| |
| |
|
|---|
December 31, 2001
(Dollars in thousands)
| Amortized
cost
| | Fair
value
| | Carrying value
|
|---|
| | gains
| | (losses)
|
|---|
|
|---|
| Held-to-maturity: | | | | | | | | | | | | | | |
| | Corporate debt | $ | 5,314 | | $ | 275 | | | | | $ | 5,589 | | $ | 5,314 |
| | Mortgage-backed | | 23,279 | | | 416 | | | | | | 23,695 | | | 23,279 |
|
| Total held-to-maturity | $ | 28,593 | | $ | 691 | | | | | $ | 29,284 | | $ | 28,593 |
|
| Available-for-sale: | | | | | | | | | | | | | | |
| | U.S. government debt | $ | 143,311 | | $ | 389 | | $ | (873 | ) | $ | 142,827 | | $ | 142,827 |
| | State and local government debt | | 7,797 | | | 91 | | | | | | 7,888 | | | 7,888 |
| | Corporate debt | | 499,673 | | | 8,571 | | | (9,253 | ) | | 498,991 | | | 498,991 |
| | Mortgage-backed | | 22,163 | | | 168 | | | (77 | ) | | 22,254 | | | 22,254 |
| | Redeemable preferred stocks | | 27,023 | | | 17 | | | (334 | ) | | 26,706 | | | 26,706 |
| | Equities | | 41,698 | | | 1,715 | | | (3,131 | ) | | 40,282 | | | 40,282 |
| | Short-term investments | | 119,066 | | | | | | | | | 119,066 | | | 119,066 |
|
Total available-
for-sale | $ | 860,731 | | $ | 10,951 | | $ | (13,668 | ) | $ | 858,014 | | $ | 858,014 |
|
66
Debt securities, including short-term investments, by contractual maturity were as follows:
|
|---|
December 31, 2002
(Dollars in thousands)
| | Amortized
cost
| | Fair
value
|
|---|
|
|---|
| Held-to-maturity: | | | | | | |
| | Due after 1 year through 5 years | | $ | 99,656 | | $ | 103,106 |
| | Due after 10 years | | | 5,308 | | | 5,626 |
|
| Total held-to-maturity | | $ | 104,964 | | $ | 108,732 |
|
| Available-for-sale: | | | | | | |
| | Due in 1 year or less | | $ | 211,452 | | $ | 212,175 |
| | Due after 1 year through 5 years | | | 280,355 | | | 288,500 |
| | Due after 5 years through 10 years | | | 234,236 | | | 248,495 |
| | Due after 10 years | | | 107,110 | | | 113,804 |
|
| Total available-for-sale | | $ | 833,153 | | $ | 862,974 |
|
Mortgage-backed securities are shown as being due at their average expected maturity dates. Expected maturities may differ from contractual maturities because borrowers may have the right to call or prepay obligations with or without call or prepayment penalties.
The gross realized gains on sales of investments classified as available-for-sale during 2002, 2001 and 2000 were $11.8 million, $20.9 million and $8.7 million, respectively, and the gross realized losses were $6.4 million, $5.6 million and $2.4 million, respectively. The change in net unrealized holding (losses) gains on trading securities, which is included in realized gains, was $46,000 and $10,000 for the years ended December 31, 2001 and 2000, respectively.
At December 31, 2002 and 2001, 89% and 97% of Zenith's consolidated portfolio of fixed maturity investments were classified as available-for-sale with the unrealized appreciation or depreciation recorded as a separate component of stockholders' equity, net of deferred tax. The change in fair value of fixed maturity investments classified as available-for-sale resulted in an increase in stockholders'
equity of $20.2 million after deferred tax from December 31, 2001 to December 31, 2002, compared to an increase of $8.8 million from December 31, 2000 to December 31, 2001. Fluctuating interest rates will impact stockholders' equity, profitability and maturities of certain debt and preferred securities.
Realized and unrealized investment gains and losses on fixed maturity investments and equity securities were as follows:
| |
|---|
Years ended December 31,
(Dollars in thousands)
| 2002
| | 2001
| | 2000
| |
|---|
| |
|---|
| Realized (losses) gains: | | | | | | | | | |
| | Fixed maturities | $ | (3,245 | ) | $ | 753 | | $ | (19,063 | ) |
| | Equity securities | | (2,140 | ) | | 3,718 | | | 2,733 | |
| Change in fair value over (under) cost: | | | | | | | | | |
| | Fixed maturities | | 34,199 | | | 13,922 | | | 15,562 | |
| | Equity securities | | (1,636 | ) | | (3,645 | ) | | 3,297 | |
| |
Net investment income was as follows:
| |
|---|
Years ended December 31,
(Dollars in thousands)
| 2002
| | 2001
| | 2000
| |
|---|
| |
|---|
| Fixed maturities: | | | | | | | | | |
| | Bonds | $ | 44,421 | | $ | 41,892 | | $ | 43,415 | |
| | Redeemable preferred stocks | | 2,410 | | | 2,086 | | | 1,165 | |
| Equity securities: | | | | | | | | | |
| | Floating rate preferred stocks | | 401 | | | 401 | | | 401 | |
| | Convertible and non-redeemable preferred stocks | | 257 | | | 256 | | | 254 | |
| | Common stocks | | 663 | | | 807 | | | 862 | |
| Mortgage loans | | 1,903 | | | 2,690 | | | 138 | |
| Short-term investments | | 3,017 | | | 6,973 | | | 9,355 | |
| Other | | 549 | | | 287 | | | 539 | |
| |
| Subtotal | | 53,621 | | | 55,392 | | | 56,129 | |
| Investment expenses | | (4,810 | ) | | (4,214 | ) | | (4,363 | ) |
| |
| Net investment income | $ | 48,811 | | $ | 51,178 | | $ | 51,766 | |
| |
Investments with a fair value of $333.1 million and $270.8 million at December 31, 2002 and 2001, respectively, were on deposit with regulatory authorities in compliance with insurance company regulations.
67
On August 23, 2002, Zenith Insurance acquired 19.2 million Ordinary Shares of Advent Capital, a U.K. company, for $14.6 million in an open offer and placing of shares made in July 2002. As a result of the purchase, Zenith owns approximately 20.9% of the outstanding shares of Advent Capital. Advent Capital and its subsidiaries operate in the property and casualty insurance business in the United Kingdom by providing corporate capital to support the underwriting of various Lloyd's syndicates and by managing those syndicates. Zenith Insurance used available funds from its short-term investments to fund the purchase of the Advent Capital shares.
Prior to August 23, 2002, Zenith owned approximately 6.3% of the outstanding shares of Advent Capital and accounted for the investment on the cost basis. As of August 23, 2002, Zenith is accounting for its investment in Advent Capital based on the equity method in accordance with the provisions of Accounting Principles Board Opinion No. 18, "The Equity Method of Accounting for Investments in Common Stock" ("APB No. 18"). The carrying value of the investment in the common stock of Advent Capital is equal to Zenith's equity in the underlying net assets of Advent Capital. In accordance with the provisions of APB No. 18, our investment in Advent Capital was restated in 2001 as if the equity method of accounting had been applied. The effect was a reduction in the carrying value of the investment of $3.2 million at December 31, 2001 and a reduction of net income for 2001 of $2.1 million, net of deferred tax benefit. The carrying value at December 31, 2002 was $18.3 million, including goodwill of $10.5 million.
At December 31, 2002, Zenith has accounted for its investment in Advent Capital using Advent Capital's September 30, 2002 financial statements. Zenith will continue to report its share of Advent Capital's income and net assets lagged by one quarter in order to allow sufficient time for Advent Capital to prepare the information.
Advent Capital's shareholders' equity at September 30, 2002 and December 31, 2001 was approximately $57.4 million and $3.3 million, respectively, after adjustments to reflect GAAP in the United States. Advent Capital's consolidated revenues were approximately $130.3 million for the nine months ended September 30, 2002, and net income was approximately $6.5 million, after adjustments to reflect GAAP in the United States. For the year ended December 31, 2001, Advent Capital's consolidated revenues were approximately $237.0 and net loss was approximately $53.2 million, after adjustments to reflect GAAP in the United States. The net loss in 2001 was attributable principally to Advent Capital's losses in connection with the terrorist attack on the World Trade Center on September 11, 2001.
Fairfax Financial Holdings Limited ("Fairfax") also participated in the open offer and placing of shares by Advent Capital and after the purchase, through its subsidiaries, Fairfax owns approximately 47% of Advent Capital. Companies controlled by Fairfax owned 42% of the outstanding common stock of Zenith National at December 31, 2002. Notwithstanding its ownership of 42% of Zenith National's common stock, Fairfax, in separate filings with the Departments of Insurance in California, Texas and New York, has disclaimed control of Zenith.
68
NOTE 3
Fair Values of Financial Instruments
Financial instruments are contractual obligations that result in the delivery of cash or an ownership interest in an entity. Disclosures regarding the fair value of financial instruments have been derived using external market sources or estimates using present value and other valuation techniques.
The following summarizes the carrying amounts and fair value of Zenith's financial instruments. For financial instruments not discussed below, the carrying amount is a reasonable estimate of the fair value.
|
|---|
| | 2002
| | 2001
|
|---|
December 31,
| |
| |
Carrying
value
| |
|
|---|
(Dollars in thousands)
| | Carrying
value
| | Fair
value
| | Fair
value
|
|---|
|
|---|
| Assets: | | | | | | | | | | | | |
| Non-trading investments | | $ | 1,098,284 | | $ | 1,102,052 | | $ | 941,527 | | $ | 942,218 |
| Liabilities: | | | | | | | | | | | | |
| Senior notes payable | | | | | | | | | 57,203 | | | 57,203 |
| Redeemable securities | | | 65,719 | | | 49,974 | | | 65,669 | | | 47,244 |
|
Fair values of investments, which are further detailed in Note 2, are determined using bond prices obtained from Merrill Lynch Securities Pricing Service and equity prices obtained from Muller Data. When prices for securities cannot be obtained from these sources, they are obtained from Bloomberg financial news service and various broker-dealers, or the fair value is estimated using analytical methods.
NOTE 4
Properties and Equipment
Properties and equipment, included in other assets, consist of the following:
| |
|---|
December 31,
(Dollars in thousands)
| | 2002
| | 2001
| |
|---|
| |
|---|
| Land | | $ | 9,650 | | $ | 9,650 | |
| Buildings | | | 32,696 | | | 32,617 | |
| Furniture, fixtures and equipment | | | 45,151 | | | 47,964 | |
| |
| Subtotal | | | 87,497 | | | 90,231 | |
| Accumulated depreciation | | | (39,182 | ) | | (41,283 | ) |
| |
| Total | | $ | 48,315 | | $ | 48,948 | |
| |
Depreciation expense was $6.2 million, $7.1 million and $7.8 million and in the years ended December 31, 2002, 2001 and 2000, respectively.
NOTE 5
Federal Income Tax
Zenith files a consolidated federal income tax return. The insurance subsidiaries pay premium taxes on gross premiums written in lieu of most state income or franchise taxes.
Current taxes receivable and deferred income taxes were:
|
|---|
December 31,
(Dollars in thousands)
| | 2002
| | 2001
|
|---|
|
|---|
| Current federal income tax receivable | | $ | 3,422 | | $ | 13,357 |
| Deferred income tax asset | | | 32,398 | | | 35,636 |
|
| Current and deferred income taxes | | $ | 35,820 | | $ | 48,993 |
|
The components of the provision (benefit) for tax on the loss from continuing operations were:
| |
|---|
Years ended December 31,
(Dollars in thousands)
| | 2002
| | 2001
| | 2000
| |
|---|
| |
|---|
| Current | | $ | 2,535 | | $ | (10,566 | ) | $ | (19,245 | ) |
| Deferred | | | (3,449 | ) | | (3,190 | ) | | (7,183 | ) |
| |
| Federal income tax benefit | | $ | (914 | ) | $ | (13,756 | ) | $ | (26,428 | ) |
| |
69
The difference between the statutory federal income tax rate of 35% and Zenith's effective tax rate on loss from continuing operations, as reflected in the financial statements, was as follows:
| |
|---|
Years ended December 31,
(Dollars in thousands)
| | 2002
| | 2001
| | 2000
| |
|---|
| |
|---|
| Statutory federal income tax benefit | | $ | (441 | ) | $ | (14,456 | ) | $ | (27,220 | ) |
| (Reduction) increase in tax: | | | | | | | | | | |
| | Dividend received
deduction and tax-exempt interest | | | (780 | ) | | (576 | ) | | (596 | ) |
| | Reduction in tax estimate for a prior year | | | (789 | ) | | | | | | |
| | Non-deductible expenses and other | | | 1,096 | | | 1,276 | | | 1,388 | |
| |
| Federal income tax benefit | | $ | (914 | ) | $ | (13,756 | ) | $ | (26,428 | ) |
| |
Deferred tax is provided based upon temporary differences between the tax and book basis of assets and liabilities. The components of the deferred tax assets and liabilities were as follows:
|
|---|
| | 2002
| | 2001
|
|---|
| |
|
|---|
| | Deferred Tax
| | Deferred Tax
|
|---|
| |
|
|---|
Years ended December 31,
(Dollars in thousands)
|
|---|
| | Assets
| | Liabilities
| | Assets
| | Liabilities
|
|---|
|
|---|
| Investments | | | | | $ | 5,962 | | $ | 8,195 | | | |
| Deferred policy acquisition costs | | | | | | 4,681 | | | | | $ | 4,438 |
| Properties and equipment | | | | | | 2,826 | | | | | | 3,625 |
| Unpaid loss and loss adjustment expenses discount | | $ | 35,775 | | | | | | 33,306 | | | |
| Limitation on deduction for unearned premiums | | | 8,455 | | | | | | 5,114 | | | |
| Policyholders' dividends accrued | | | 1,177 | | | | | | 1,161 | | | |
| Deferred income on retroactive reinsurance | | | 3,599 | | | | | | 4,218 | | | |
| Deferred gain on land sale | | | | | | 2,433 | | | | | | 2,433 |
| Other | | | 2,142 | | | 2,848 | | | 2,048 | | | 7,910 |
|
| | | | 51,148 | | | 18,750 | | | 54,042 | | | 18,406 |
|
| Net deferred tax asset | | $ | 32,398 | | | | | $ | 35,636 | | | |
|
Zenith's net deferred tax asset is expected to be fully recoverable because all future deductible amounts can be offset by reversing deferred tax liabilities, recovery of federal income taxes paid within the statutory carryback period or anticipated future taxable income, including investment income. Property-casualty loss reserves are not discounted for book purposes; however, the Tax Reform Act of 1986 requires property and casualty loss reserves to be discounted for tax purposes.
NOTE 6
Discontinued Operations — Sale of
Real Estate Business
On October 8, 2002, Zenith closed the sale of its home-building business and related real estate assets in Las Vegas, Nevada to Meritage Corporation ("Meritage"). The business had been operated by Zenith National's indirect wholly-owned subsidiary, Perma-Bilt, a Nevada corporation ("Perma-Bilt"). In the transaction, Meritage, through its wholly-owned subsidiary, MTH-Homes Nevada, Inc. ("MTH Nevada"), acquired substantially all of Perma-Bilt's assets, subject to the related liabilities, pursuant to a Master Transaction Agreement, dated as of October 7, 2002, and related asset and real property acquisition agreements (the "Agreement").
Zenith received gross proceeds of $65.0 million in connection with the sale, including $28.4 million in repayment of intercompany loans to Zenith National from Perma-Bilt. Zenith recorded a gain on the sale in the fourth quarter of 2002 of $6.3 million after tax.
In addition to the consideration received in October 2002, the Agreement entitles Zenith to receive 10% of MTH Nevada's pre-tax net income, subject to certain adjustments, for each of the twelve-month periods ending September 30, 2003, September 30, 2004 and September 30, 2005. We are currently unable to
70
estimate how much, if anything, Zenith might receive under this earn-out provision.
For the years ended December 31, 2002, 2001 and 2000, the results of operations and cash flows for Zenith's Real Estate business have been restated and presented as discontinued operations, and at December 31, 2001, the assets and liabilities have been restated and classified as "real estate assets held for sale" and "real estate liabilities held for sale" in Zenith's Consolidated Balance Sheet.
The following table summarizes the assets and liabilities classified as "held for sale":
|
|---|
December 31,
(Dollars in thousands)
| | 2001
|
|---|
|
|---|
| Assets: | | | |
| | Cash and short-term investments | | $ | 2,098 |
| | Land and real estate construction in progress | | | 63,243 |
| | Other assets | | | 1,043 |
|
| Total real estate assets held for sale | | $ | 66,384 |
|
| Liabilities: | | | |
| | Payable to banks | | $ | 16,186 |
| | Accounts payable and other liabilities | | | 5,767 |
|
| Total real estate liabilities held for sale | | $ | 21,953 |
|
The following table summarizes the revenues and income from discontinued Real Estate operations:
|
|---|
Years ended December 31,
(Dollars in thousands)
| | 2002
| | 2001
| | 2000
|
|---|
|
|---|
| Real estate sales | | $ | 70,789 | | $ | 84,823 | | $ | 84,518 |
|
| Income from discontinued operations before federal income tax expense | | $ | 4,419 | | $ | 5,763 | | $ | 5,464 |
| Income tax expense | | | 1,547 | | | 2,017 | | | 1,912 |
|
| Income from discontinued operations after federal income tax expense | | $ | 2,872 | | $ | 3,746 | | $ | 3,552 |
|
Prior to the sale of the Real Estate operations, land, land development costs and construction costs, including costs of acquisition and development, property taxes and related interest, were capitalized. Such costs, and an estimate of the costs to complete a project, were recognized pro-rata against sales of completed units.
NOTE 7
Liability for Unpaid Loss and
Loss Adjustment Expenses
The following table represents a reconciliation of changes in the liability for unpaid loss and loss adjustment expenses:
| |
|---|
Years ended December 31,
(Dollars in thousands)
| | 2002
| | 2001
| | 2000
| |
|---|
| |
|---|
| Beginning of year, net of receivable from reinsurers | | $ | 742,678 | | $ | 634,172 | | $ | 605,250 | |
| Incurred claims: | | | | | | | | | | |
| | Current year | | | 412,883 | | | 427,943 | | | 306,082 | |
| | Prior years | | | 29,168 | | | 4,347 | | | 30,880 | |
| |
| | Total incurred claims | | | 442,051 | | | 432,290 | | | 336,962 | |
| |
| Payments: | | | | | | | | | | |
| | Current year | | | (119,762 | ) | | (80,278 | ) | | (72,072 | ) |
| | Prior years | | | (239,098 | ) | | (243,506 | ) | | (235,968 | ) |
| |
| Total payments | | | (358,860 | ) | | (323,784 | ) | | (308,040 | ) |
| |
| End of year, net of receivable from reinsurers | | | 825,869 | | | 742,678 | | | 634,172 | |
| Receivable from reinsurers and state trust funds for unpaid losses | | | 215,663 | | | 204,144 | | | 243,711 | |
| |
| End of year | | $ | 1,041,532 | | $ | 946,822 | | $ | 877,883 | |
| |
Adverse development in 2002 is principally attributable to an increase in workers' compensation loss reserves in the fourth quarter as a result of higher than previously estimated claims severity. Adverse development in 2001 on the reserves established at December 31, 2000 and adverse development in 2000 on the reserves established at December 31, 1999 is attributable, principally, to additional estimates of 1999 catastrophe losses in the reinsurance business.
71
NOTE 8
Bank Lines of Credit
At December 31, 2002, Zenith National had two revolving, unsecured lines of credit in an aggregate amount of $70.0 million, all of which was available at December 31, 2002. One of these lines of credit, in the amount of $20.0 million, is a one-year revolving line of credit with a bank, expiring July 31, 2003. Interest is payable at the bank's prime rate on any borrowings under the line, and the agreement does not subject Zenith to any covenants. The other line of credit is a $50.0 million credit agreement with a bank effective September 30, 2002. Borrowings under the agreement are available as follows: (a) up to $20.0 million may be drawn under Tranche A of the agreement; and (b) up to $30.0 million may be drawn under Tranche B of the agreement. Tranche A loans are due September 30, 2003. Tranche B loans are due September 30, 2005. Interest is payable on outstanding loans at either the bank's prime rate or a rate based on Eurodollar deposit rates plus a specified margin depending on Zenith's credit rating. Zenith National drew down $25.0 million on the Tranche B loan in the third quarter of 2002, but repaid the entire borrowing in the fourth quarter of 2002 from the $28.4 million received in repayment of intercompany loans from Perma-Bilt. The agreement contains covenants that require, among other things, Zenith to maintain certain financial ratios, including a minimum amount of capital in its insurance subsidiaries, a maximum debt-to-total capitalization ratio and a minimum interest coverage ratio. Zenith National must also maintain at least a BB counterparty rating from Standard and Poor's. Zenith was in compliance with all such requirements at December 31, 2002 and does not expect these requirements to impact the availability of funds under the line of credit, if required.
In January 2003, we borrowed $45.0 million under the lines of credit to make a capital contribution to Zenith Insurance. We drew $30.0 million on Tranche B of the $50.0 million credit agreement. The interest rate is 2.465% on the Tranche B loan. The other $15.0 million was drawn on the bank line which is due July 31, 2003 and the interest rate is 4.25%. Available bank lines were reduced to $25.0 million as a result of these drawings.
NOTE 9
Senior Notes Payable
On May 1, 2002, Zenith National used $57.2 million of its available short-term investments to pay the principal of its 9% Senior Notes due May 1, 2002 (the "9% Notes").
Zenith National had $57.2 million outstanding of the $75.0 million issued of its 9% Notes at December 31, 2001 (see Note 12), which were general unsecured obligations of Zenith National. Interest on the 9% Notes was payable semi-annually. Issue costs of $1.2 million were being amortized over the term of the 9% Notes. In the years ended December 31, 2002, 2001 and 2000, $1.7 million, $5.3 million and $5.8 million, respectively, of interest and issue costs were expensed.
NOTE 10
Interest Incurred
Interest incurred on borrowings was as follows:
|
|---|
Years ended December 31,
(Dollars in thousands)
| | 2002
| | 2001
| | 2000
|
|---|
|
|---|
| Interest capitalized for discontinued Real Estate operations | | $ | 3,356 | | $ | 5,230 | | $ | 8,364 |
| Interest expense not related to discontinued Real Estate operations | | | 5,102 | | | 7,576 | | | 5,640 |
|
| Total interest incurred | | $ | 8,458 | | $ | 12,806 | | $ | 14,004 |
|
72
NOTE 11
Redeemable Securities
Zenith National Insurance Capital Trust I, a Delaware statutory business trust (the "Trust"), all of the voting securities of which are owned by Zenith National, had $67.0 million outstanding of the $75.0 million issued of its 8.55% Capital Securities at December 31, 2002 and 2001. The Capital Securities pay semi-annual cumulative cash distributions at the annual rate of 8.55% of the $1,000 liquidation amount per security.
The Trust had invested $77.3 million in Zenith National's 8.55% Subordinated Deferrable Interest Debentures due 2028 (the "Subordinated Debentures") at December 31, 2002 and 2001, which constitute the principal asset of the Trust. The semi-annual interest payments on the Subordinated Debentures may be deferred by Zenith National for up to ten consecutive semi-annual periods. The Subordinated Debentures are redeemable at any time by Zenith National at the then present value of the remaining scheduled payments of principal and interest. Payments on the Capital Securities, including distributions and redemptions, follow those of the Subordinated Debentures. Zenith National fully and unconditionally guaranteed the distributions on, and the liquidation amount generally of, the Capital Securities to the extent the Trust has funds legally available therefor. Zenith National's guarantee of the Capital Securities, as well as the Subordinated Debentures, are subordinated to all other indebtedness of Zenith National.
The issue cost and discount on the Subordinated Debentures of $1.7 million are being amortized over the term of the Subordinated Debentures. During the years ended December 31, 2002, 2001 and 2000, $5.8 million, $5.8 million and $5.9 million, respectively, of interest, issue costs and discount were expensed.
The aggregate maturities for all long-term borrowings for each of the five years after December 31, 2002 are as follows:
|
|---|
Maturing in:
(Dollars in thousands)
| | Amount
|
|---|
|
|---|
| 2003 | | | |
| 2004 | | | |
| 2005 | | | |
| 2006 | | | |
| 2007 | | | |
| Thereafter | | $ | 67,000 |
|
| Total | | $ | 67,000 |
|
NOTE 12
Extraordinary Item:
Gain on Extinguishment of Debt
In 2000, Zenith National paid $22.8 million to repurchase $16.5 million aggregate principal amount of the outstanding 9% Notes and $8.0 million aggregate liquidation amount of the outstanding 8.55% Capital Securities. The repurchases resulted in an extraordinary gain before tax of $1.5 million. In 2001, Zenith National paid $1.3 million to repurchase $1.3 million aggregate principal amount of the outstanding 9% Notes. Zenith National used its available cash balances to fund these purchases.
NOTE 13
Reinsurance
We annually purchase excess of loss reinsurance to protect Zenith against the impact of large, irregularly-occurring losses in its Workers' Compensation business. Such reinsurance reduces the magnitude of sudden and unpredictable changes in net income and the capitalization of insurance operations. Zenith
73
maintains excess of loss and catastrophe reinsurance protection, which varies based on the type of coverage, as follows: excess of loss reinsurance per occurrence in excess of $1.0 million up to $150.0 million except between $60.0 million and $100.0 million, Zenith has retained 50% of any loss.
Effective January 1, 2002, Zenith Insurance and a subsidiary of Odyssey Reinsurance Corp., a subsidiary of Fairfax ("Odyssey Re") entered into a 10% quota share ceded reinsurance agreement with respect to all new and renewal workers' compensation business written by Zenith Insurance in the three years commencing January 1, 2002. Quota share reinsurance allows the ceding company to increase the amount of business it writes while sharing the premiums and associated risks with the assuming company. The effect is similar to increasing the capital of the ceding company. Zenith expects that the quota share arrangement will favorably assist in the capitalization of its insurance subsidiaries over the term of the quota share reinsurance contract.
Reinsurance transactions reflected in the financial statements were as follows:
| |
|---|
Years ended December 31,
(Dollars in thousands)
| | 2002
| | 2001
| | 2000
| |
|---|
| |
|---|
| Direct premiums earned | | $ | 555,023 | | $ | 427,331 | | $ | 307,514 | |
| Assumed premiums earned | | | 59,771 | | | 63,975 | | | 41,848 | |
| Ceded premiums earned | | | (57,739 | ) | | (14,430 | ) | | (10,610 | ) |
| |
| Net premiums earned | | $ | 557,055 | | $ | 476,876 | | $ | 338,752 | |
| |
| Ceded loss and loss adjustment expenses incurred | | $ | 24,704 | | $ | 5,728 | | $ | 8,186 | |
| |
2002 ceded premiums and loss and loss adjustment expenses incurred reflect the results of the quota share agreement with the subsidiary of Odyssey Re.
NOTE 14
Commitments and Contingent Liabilities
Zenith has office space leases, equipment leases and automobile leases expiring through 2008. The minimum rentals on these operating leases as of December 31, 2002 were as follows:
|
|---|
(Dollars in thousands)
Years
| | Equipment
and
auto fleet
| | Offices
| | Total
|
|---|
|
|---|
| 2003 | | $ | 1,024 | | $ | 3,544 | | $ | 4,568 |
| 2004 | | | 509 | | | 3,549 | | | 4,058 |
| 2005 | | | 100 | | | 2,906 | | | 3,006 |
| 2006 | | | 14 | | | 2,002 | | | 2,016 |
| 2007 | | | 5 | | | 1,762 | | | 1,767 |
| 2008 | | | | | | 404 | | | 404 |
|
| Total | | $ | 1,652 | | $ | 14,167 | | $ | 15,819 |
|
Rental expenses for the years ended December 31, 2002, 2001 and 2000 amounted to $5.0 million, $5.4 million and $5.2 million, respectively.
Settlement of RISCORP Litigation and Resolution of Contingency
On April 1, 1998, pursuant to an Asset Purchase Agreement dated June 17, 1997 (the "Asset Purchase Agreement") between Zenith Insurance and RISCORP Inc. and certain of its subsidiaries (collectively, "RISCORP"), Zenith Insurance acquired substantially all of the assets and certain liabilities of RISCORP related to RISCORP's workers' compensation business (the "RISCORP Acquisition"). On January 13, 2000, RISCORP filed a complaint against Zenith Insurance and another defendant in the Superior Court of Fulton County in the State of Georgia. RISCORP's lawsuit sought a declaration that would have had the effect of requiring Zenith to pay either $18.1 million (and related charges) or $5.9 million. On September 4, 2002, by stipulation, the litigation filed by RISCORP was dismissed with prejudice and with no liability to Zenith.
74
Contingencies Surrounding Reinsurance Receivable from Reliance
At December 31, 2002 and 2001, Reliance owed Zenith Insurance $6.0 million of reinsurance recoverable on paid and unpaid losses in connection with the reinsurance arrangements assumed by Zenith Insurance in its 1996 acquisition of the Associated General Commerce Self-Insurers' Trust Fund.
In January 2001, Reliance was subject to a Supervision Order by the Pennsylvania Department of Insurance. This is not the same as insolvency. Based on the published 1999 financial statements for Reliance, which showed considerable net worth, we had no reason to conclude that we had an impairment of our reinsurance recoverable at the time of the Supervision Order. On May 29, 2001, the Pennsylvania Department of Insurance issued an Order of Rehabilitation for Reliance. Rehabilitation raises the possibility of compromise with Reliance's creditors. Therefore, we disclosed a contingency in the second quarter of 2001 related to possible impairment of our receivable from Reliance. With no information with which to estimate our impairment (no financial statements were filed by Reliance for 2000), we concluded that we could not determine the outcome of the contingency at that time. On October 3, 2001, the Commonwealth Court of the State of Pennsylvania approved an Order of Liquidation for Reliance, which was experiencing cash flow problems caused by slow reinsurance recoveries. At that time, an estimated balance sheet of Reliance was made available as of December 31, 2000, from which we estimated that we could expect to recover no more than 50% of our receivable. This established a range of outcomes for the amount impaired between $3.0 million and $6.0 million (i.e., we expect to recover an amount between 50% and nothing). We have no information with which to establish an estimate within that range as better than any other and, therefore, we recorded an impairment provision of $3.0 million for our receivable from Reliance. We recorded the provision in the third quarter of 2001, the period for which the information became available to estimate the impairment provision. The impairment provision was $3.0 million at December 31, 2002 and 2001. The eventual outcome of this matter will be determined by the ultimate amount of Reliance's liabilities and whether or not Reliance has sufficient assets or can obtain recoveries and investment income in an amount sufficient to pay its liabilities. We will revise our impairment provision, if necessary, upon receipt of relevant information.
Contingencies Surrounding State Guarantee Fund Assessments
State Guarantee Funds ("Guarantee Funds") exist to ensure that policyholders (holders of direct insurance policies but not of reinsurance policies) receive payment of their claims if insurance companies become insolvent. The Guarantee Funds are funded primarily by statutorily prescribed assessments they bill to other insurance companies doing business in their states. Various mechanisms exist in some of these states for assessed insurance companies to recover these assessments. Upon the insolvency of an insurance company, the Guarantee Funds become primarily liable for the payment of its policyholder liabilities. The declaration of an insolvency establishes the presumption that assessments by the Guarantee Funds are probable. Zenith Insurance writes workers' compensation insurance in many states in which unpaid workers' compensation liabilities are the responsibility of the Guarantee Funds and has received, and expects to continue to receive, Guarantee Fund assessments, some of which may be based on certain of the premiums it has already earned at December 31, 2002.
75
Zenith recorded an estimate of $6.0 million (net of expected recoveries of $2.0 million recoverable before the end of 2003) for its expected liability at December 31, 2002 for Guarantee Fund assessments. Recoveries are attributable to premium tax credits in various states. The amount of the recovery we have recorded is limited to credits applicable to, and recoverable from, premiums earned at December 31, 2002. The estimated expense for Guarantee Fund assessments was $4.1 million in 2002 compared to $3.5 million in 2001. Our estimated liability is based on currently available information and could change based on additional information or reinterpretation of existing information concerning the actions of the Guarantee Funds. Zenith expects that it will continue to accrue and receive Guarantee Fund assessments; and the ultimate impact of such assessments will depend upon the amount and timing of the assessments and of any recoveries to which Zenith is entitled.
Contingencies Surrounding Recoverability of Special Disability Trust Fund Receivable
The Florida Special Disability Trust Fund ("SDTF") is a fund established in Florida to reimburse insurance companies and employers for the cost of certain workers' compensation claims. The SDTF was established to promote the re-hiring of injured workers by providing a reimbursement for certain qualifying claims made by a previously injured worker subsequent to their re-hiring. These claims are sometimes referred to as "second injuries." We are able to submit such second injury claims to the SDTF and, if the claims are accepted, we are reimbursed for part of the cost of the claim. The SDTF stopped accepting new second injury claims dated after January 1, 1998. Approximately 550 of our Florida claims have been accepted, for which we have recorded a recoverable of $13.1 million, net of amounts due to reinsurers, at December 31, 2002. We bill the SDTF and receive reimbursements as we make payments on accepted claims. The SDTF is funded by assessing a fee of 4.52% of premiums written in Florida, and we accrue the assessment as a liability when we write Florida business. If the legislature in Florida were to decide to cease or suspend the assessment, and thereby the funding of the SDTF, any recoverable that we may have at that time which is related to un-reimbursed claims might be at risk. However, we have no current information to indicate that the SDTF assessment in Florida will not continue. We continue to collect substantial recoveries for second injury claims from the SDTF. We received reimbursements from the SDTF of $5.6 million in 2002, $13.0 million in 2001 and $5.9 million in 2000. The SDTF is currently about 30 to 36 months behind schedule in reimbursing claims but we expect to fully recover the remaining amount receivable.
Other Litigation
Zenith National and its subsidiaries are defendants in various litigation. In the opinion of management, after consultation with legal counsel, such litigation is either without merit or the ultimate liability, if any, is not expected to have a material adverse effect on the consolidated financial condition, results of operations or cash flows of Zenith.
76
NOTE 15
Common Stock
Effective in the fourth quarter of 2002, Zenith began to expense the cost of employee stock options using the fair value based method of recording stock options in accordance with SFAS No. 123 and accounted for the change in accounting principle using the prospective method in accordance with SFAS No. 148 (see Note 1). The total cost of Zenith's 2002 option grants, which will be reflected in earnings ratably through 2006, is estimated to be about $0.2 million before tax. The pro-forma effect of all stock options accounted for under the intrinsic value method for the years ended December 31, 2002, 2001 and 2000 was as follows:
| |
|---|
Years ended December 31,
(Dollars in thousands, except per share data)
| | 2002
| | 2001
| | 2000
| |
|---|
| |
|---|
| Net income (loss) as reported(2) | | $ | 10,200 | | $ | (25,860 | ) | $ | (46,800 | ) |
| Stock-based employee compensation expense included in reported net income (loss), net of income tax benefit | | | 24 | | | | | | | |
| Total stock-based employee compensation expense determined under fair value method for all awards, net of income tax benefit | | | (424 | ) | | (800 | ) | | (1,500 | ) |
| |
| Pro-forma net income (loss) | | $ | 9,800 | | $ | (26,660 | ) | $ | (48,300 | ) |
| |
Net income (loss) per share — basic(1) |
|
|
|
|
|
|
|
|
|
|
| | Net income (loss) per share as reported | | $ | 0.55 | | $ | (1.47 | ) | $ | (2.72 | ) |
| | Net income (loss) per share — pro-forma | | | 0.52 | | | (1.52 | ) | | (2.80 | ) |
Net income (loss) per share — diluted(1) |
|
|
|
|
|
|
|
|
|
|
| | Net income (loss) per share as reported | | | 0.54 | | | (1.47 | ) | | (2.72 | ) |
| | Net income (loss) per share — pro-forma | | | 0.52 | | | (1.52 | ) | | (2.80 | ) |
| |
(1) Additional common shares issuable under employee stock option plans using the treasury stock method are anti-dilutive for 2001 and 2000 because there is a loss from continuing operations for these years.
(2) 2001 is restated for equity in losses of investee (see Note 1).
The fair value of each option grant was estimated on the date of grant using the Black-Scholes option pricing model with the following weighted average assumptions:
|
|---|
| | 2002 Grants
| | 2001 Grants
| | 2000 Grants
|
|---|
|
|---|
| Risk-free interest rates | | 4.16% - 4.29% | | 4.45% - 4.92% | | 5.45% - 6.85% |
| Dividend yields | | 4.21% | | 3.45% | | 3.55% |
| Volatility factors | | 24.00% - 24.09% | | 23.39% - 23.47% | | 20.87% - 22.97% |
| Weighted average expected life (five-year term options) | | 4.5 yrs. | | 4.5 yrs. | | 4.5 yrs. |
| Weighted average fair value per share | | $5.23 | | $5.09 | | $4.44 |
|
77
Additional information with respect to stock options was as follows:
|
|---|
(Shares in thousands)
| Number
of shares
| | Weighted average exercise price
|
|---|
|
|---|
| Outstanding at December 31, 1999 | 2,115 | | $ | 24.76 |
| Granted | 537 | | | 21.15 |
| Exercised | (295 | ) | | 24.54 |
| Expired or cancelled | (209 | ) | | 25.76 |
| |
| | | |
| Outstanding at December 31, 2000 | 2,148 | | | 24.03 |
| Granted | 95 | | | 27.60 |
| Exercised | (119 | ) | | 25.38 |
| Expired or cancelled | (60 | ) | | 26.98 |
| |
| | | |
| Outstanding at December 31, 2001 | 2,064 | | | 24.03 |
| Granted | 90 | | | 31.19 |
| Exercised | (215 | ) | | 25.34 |
| Expired or cancelled | (201 | ) | | 26.73 |
| |
| | | |
| Outstanding at December 31, 2002 | 1,738 | | | 23.93 |
|
Certain information on outstanding options at December 31, 2002 was as follows:
|
|---|
Range of exercise price
(Shares in thousands)
| | Number outstanding
| | Weighted average remaining life in years
| | Outstanding options weighted average exercise price
|
|---|
|
|---|
| $23.63 | | 1,000 | | 3.2 | | $ | 23.63 |
| 19.16 - 31.32 | | 738 | | 2.5 | | | 23.66 |
|
Options exercisable at December 31, 2002, 2001 and 2000 were 1,378,000, 1,534,000 and 1,205,000, respectively. Certain information on exercisable options at December 31, 2002 was as follows:
|
|---|
Range of exercise prices
(Shares in thousands)
| | Number exercisable
| | Exercisable options weighted average exercise price
|
|---|
|
|---|
| $23.63 | | 1,000 | | $ | 23.63 |
| 19.16 - 31.32 | | 378 | | | 22.93 |
|
From time to time, Zenith National may make repurchases of its outstanding common shares. At December 31, 2002, Zenith National was authorized to repurchase up to 929,000 shares of its common stock at prevailing market prices pursuant to a share repurchase program authorized by its Board of Directors. Any purchases are discretionary and can be adequately funded from Zenith National's existing sources of liquidity.
On December 5, 2001, Zenith National sold one million shares of its common stock, par value $1.00 per share, in a private placement for $25.00 per share to Odyssey Re.
NOTE 16
Dividend Restrictions
The California and Texas Insurance Holding Company System Regulatory Acts limit the ability of Zenith Insurance to pay dividends to Zenith National, and of the insurance subsidiaries of Zenith Insurance to pay dividends to Zenith Insurance, by providing that the appropriate insurance regulatory authorities in the states of California and Texas must approve any dividend that, together with all other such dividends paid during the preceding twelve months, exceeds the greater of: (a) 10% of the paying company's statutory surplus as regards policyholders at the preceding December 31; or (b) 100% of the net income for the preceding year. In addition, any such dividend must be paid from policyholders' surplus attributable to accumulated earnings. In each of the years ended December 31, 2001 and 2000, Zenith Insurance paid $10.0 million in dividends to Zenith National. Zenith Insurance did not pay any dividends to Zenith National in 2002. Stockholders' equity of Zenith's insurance operations, in accordance with GAAP, amounted to $382.9 million as of December 31, 2002, of which $31.0 million can be paid in 2003 to Zenith National in dividends without prior approval. In March 2003, Zenith Insurance paid a dividend of $10.0 million to Zenith National.
The restrictions on the payment of dividends have not had, and under current regulations are not expected to have, a material
78
adverse impact on the ability to pay dividends. In a recent court ruling, a California statute that allowed a deduction for the dividends received from wholly-owned insurance companies in the determination of taxable income for the California Franchise Tax was held unconstitutional in certain circumstances. The consequences of the decision are unclear, but it is possible that the California Franchise Tax Board ("FTB") could take the position that the decision has caused the statute to be invalid for all purposes and disallow in its entirety the deduction for dividends received from insurance subsidiaries. If sustained, such action by the FTB would have the effect of imposing a tax of approximately 6% (after the benefit of a federal tax deduction) on any dividends paid from Zenith Insurance to Zenith National. Zenith is unable to predict the ultimate outcome of this matter, which depends upon the actions of the FTB, the prospects for appropriate legislative relief and various tax strategies that may be available to Zenith to alleviate the consequences of any actions by the FTB.
NOTE 17
Statutory Financial Data
Statutory capital stock and surplus and net income (loss) of Zenith's insurance subsidiaries, as reported to regulatory authorities, were as follows:
| |
|---|
Years ended December 31,
(Dollars in thousands)
| | 2002
| | 2001
| | 2000
| |
|---|
| |
|---|
| Capital stock and surplus | | $ | 309,810 | | $ | 252,466 | | $ | 262,315 | |
| Net income (loss) | | | 19,220 | | | (15,429 | ) | | (60,737 | ) |
| |
The insurance business is subject to state-by-state regulation and legislation focused on solvency, pricing, market conduct, claims practices, underwriting, accounting, investment criteria and other areas. Such regulation and legislation is constantly changing and compliance is essential and is an inherent risk of the business.
NOTE 18
Earnings and Dividends Per Share
The following table sets forth the computation of basic and diluted net income (loss) per common share.
| |
|---|
Years ended December 31,
(Dollars in thousands,
except per share data)
| | 2002
| | 2001
| | 2000
| |
|---|
| |
|---|
| (A) Net income (loss) | | $ | 10,200 | | $ | (25,860 | ) | $ | (46,800 | ) |
| |
| (B) Weighted average outstanding shares during the period | | | 18,702 | | | 17,593 | | | 17,212 | |
| Additional common shares issuable under employee stock option plans using the treasury stock method | | | 193 | | | 172 | | | 57 | |
| |
| (C) Weighted average number of common shares outstanding assuming exercise of stock options | | | 18,895 | | | 17,765 | | | 17,269 | |
| |
| Net income (loss) per common share: | | | | | | | | | | |
| (A)/(B) — basic(1) | | $ | 0.55 | | $ | (1.47 | ) | $ | (2.72 | ) |
| (A)/(C) — diluted(1) | | | 0.54 | | | (1.47 | ) | | (2.72 | ) |
| |
| Dividends per common share | | $ | 1.00 | | $ | 1.00 | | $ | 1.00 | |
| |
(1) Additional common shares issuable under employee stock option plans using the treasury stock method are anti-dilutive for 2001 and 2000 because there is a loss from continuing operations for these years. In these periods, diluted earnings per share uses (B) as the denominator.
Options to purchase 333,000 shares of common stock at an average price of $29.02 per share were outstanding as of December 31, 2002 but were not included in the computation of diluted earnings per share because the options' exercise prices were greater than the average market price of the common shares, and, therefore, the effect would be anti-dilutive.
79
NOTE 19
Other Comprehensive Income
The following summaries present the components of comprehensive income, attributable to unrealized gains and loses on investments for the three years ended December 31, 2002:
|
|---|
(Dollars in thousands)
| | Before
tax
| | After
tax
|
|---|
|
|---|
| Year ended December 31, 2002 |
|
| Unrealized gain on securities: | | | | | | |
| | Unrealized holding gain on available-for-sale investments arising during the year | | $ | 23,596 | | $ | 15,337 |
| | Reclassification adjustment for realized loss included in net income | | | 5,890 | | | 3,829 |
|
| Net unrealized gain | | $ | 29,486 | | $ | 19,166 |
|
| Year ended December 31, 2001 |
|
| Unrealized gain on securities: | | | | | | |
| | Unrealized holding gain on available-for-sale investments arising during the year | | $ | 5,059 | | $ | 3,289 |
| | Reclassification adjustment for realized loss included in net loss | | | 4,848 | | | 3,151 |
|
| Net unrealized gain | | $ | 9,907 | | $ | 6,440 |
|
| Year ended December 31, 2000 |
|
| Unrealized gain on securities: | | | | | | |
| | Unrealized holding gain on available-for-sale investments arising during the year | | $ | 1,064 | | $ | 692 |
| | Reclassification adjustment for realized loss included in net loss | | | 17,077 | | | 11,100 |
|
| Net unrealized gain | | $ | 18,141 | | $ | 11,792 |
|
NOTE 20
Segment Information
Zenith classifies its business into the following segments: Workers' Compensation, Reinsurance, Real Estate (through October 8, 2002, the date of the sale of the Real Estate operations), Investment and Parent. Segments are designated based on the types of products and services provided. Workers' Compensation represents insurance coverage for the statutorily prescribed benefits that employers are required to pay to their employees injured in the course of employment. Reinsurance principally consists of assumed reinsurance of property losses from worldwide catastrophes and large property risks. The Real Estate operations developed land and primarily constructed single-family residences in Las Vegas, Nevada (see Note 6). Investment operations provide income and realized gains on investments, primarily from investments in debt securities. The Parent operations represent Zenith National, a holding company which owns, directly or indirectly, all of the capital stock of the insurance operations, non-insurance companies and other investment securities.
The accounting policies of the segments are the same as those described in Note 1. Zenith evaluates insurance operation performance based on the combined ratios and income or loss from operations before income tax, and the related investment income or realized gains or losses.
80
Information as to the operations of the segments is set forth below:
| |
|---|
(Dollars in thousands)
| Workers' Compensation
| | Reinsurance
| | Real Estate(1)
| | Investment(2)
| | Parent
| | Total
| |
|---|
| |
|---|
| | | Year ended December 31, 2002 | |
| |
| Revenues: | | | | | | | | | | | | | | | | | | |
| Premiums earned | $ | 503,859 | | $ | 53,196 | | | | | | | | | | | $ | 557,055 | |
| Net investment income | | | | | | | | | | $ | 48,811 | | | | | | 48,811 | |
| Realized losses on investments | | | | | | | | | | | (3,631 | ) | | | | | (3,631 | ) |
| |
| Total revenues | | 503,859 | | | 53,196 | | | | | | 45,180 | | | | | | 602,235 | |
| |
| Interest expense | | | | | | | | | | | | | $ | (5,102 | ) | | (5,102 | ) |
| |
| (Loss) income from continuing operations before tax and equity in earnings of investee | | (43,848 | ) | | 7,644 | | | | | | 45,180 | | | (10,237 | ) | | (1,261 | ) |
| Federal income tax (benefit) expense | | (15,058 | ) | | 2,675 | | | | | | 15,051 | | | (3,582 | ) | | (914 | ) |
| |
| (Loss) income from continuing operations after tax and before equity in earnings of investee | | (28,790 | ) | | 4,969 | | | | | | 30,129 | | | (6,655 | ) | | (347 | ) |
| Equity in earnings of investee, net of tax expense of $734 | | | | | | | | | | | 1,363 | | | | | | 1,363 | |
| |
| (Loss) income from continuing operations | | (28,790 | ) | | 4,969 | | | | | | 31,492 | | | (6,655 | ) | | 1,016 | |
| |
| Income from discontinued operations, net of tax expense of $1,547 | | | | | | | $ | 2,872 | | | | | | | | | 2,872 | |
| Gain on sale of real estate operations, net of tax expense of $3,399 | | | | | | | | 6,312 | | | | | | | | | 6,312 | |
| |
| Total income from discontinued operations | | | | | | | | 9,184 | | | | | | | | | 9,184 | |
| |
| Net (loss) income | $ | (28,790 | ) | $ | 4,969 | | $ | 9,184 | | $ | 31,492 | | $ | (6,655 | ) | $ | 10,200 | |
| |
| Combined ratios | | 108.7% | | | 85.6% | | | | | | | | | | | | 106.5% | |
| |
| Investment in Advent Capital | | | | | | | | | | | 18,319 | | | | | | 18,319 | |
| |
| Total assets | $ | 443,982 | | $ | 41,704 | | | | | $ | 1,126,726 | | $ | 2,701 | | $ | 1,615,113 | |
| |
| | | Year ended December 31, 2001 | |
| |
| Revenues: | | | | | | | | | | | | | | | | | | |
| Premiums earned | $ | 415,848 | | $ | 61,028 | | | | | | | | | | | $ | 476,876 | |
| Net investment income | | | | | | | | | | $ | 51,178 | | | | | | 51,178 | |
| Realized gains on investments | | | | | | | | | | | 9,169 | | | | | | 9,169 | |
| |
| Total revenues | | 415,848 | | | 61,028 | | | | | | 60,347 | | | | | | 537,223 | |
| |
| Interest expense | | | | | | | | | | | | | $ | (7,576 | ) | | (7,576 | ) |
| |
| (Loss) income from continuing operations before tax and equity in losses of investee | | (58,329 | ) | | (31,918 | ) | | | | | 60,347 | | | (11,402 | ) | | (41,302 | ) |
| Federal income tax (benefit) expense | | (19,595 | ) | | (10,716 | ) | | | | | 20,546 | | | (3,991 | ) | | (13,756 | ) |
| |
| (Loss) income from continuing operations after tax and before equity in losses of investee | | (38,734 | ) | | (21,202 | ) | | | | | 39,801 | | | (7,411 | ) | | (27,546 | ) |
| Equity in losses of investee, net of tax benefit of $1,110 | | | | | | | | | | | (2,060 | ) | | | | | (2,060 | ) |
| |
| (Loss) income from continuing operations | | (38,734 | ) | | (21,202 | ) | | | | | 37,741 | | | (7,411 | ) | | (29,606 | ) |
| |
| Income from discontinued operations, net of tax expense of $2,017 | | | | | | | $ | 3,746 | | | | | | | | | 3,746 | |
| |
| Net (loss) income | $ | (38,734 | ) | $ | (21,202 | ) | $ | 3,746 | | $ | 37,741 | | $ | (7,411 | ) | $ | (25,860 | ) |
| |
| Combined ratios | | 114.0% | | | 152.3% | | | | | | | | | | | | 118.9% | |
| |
| Investment in Advent Capital | | | | | | | | | | | 1,028 | | | | | | 1,028 | |
| |
| Total assets | $ | 451,441 | | $ | 43,108 | | $ | 62,706 | | $ | 975,998 | | $ | 4,746 | | $ | 1,537,999 | |
| |
| (1) Discontinued Real Estate operations — see Note 1. | |
| (2) Restated in 2001 for equity in losses of investee — see Note 1. | |
81
| |
|---|
(Dollars in thousands)
| Workers' Compensation
| | Reinsurance
| | Real Estate(1)
| | Investment
| | Parent
| | Total
| |
|---|
| |
|---|
| | | Year ended December 31, 2000 | |
| |
| Revenues: | | | | | | | | | | | | | | | | | | |
| Premiums earned | $ | 300,833 | | $ | 37,919 | | | | | | | | | | | $ | 338,752 | |
| Net investment income | | | | | | | | | | $ | 51,766 | | | | | | 51,766 | |
| Realized losses on investments | | | | | | | | | | | (15,467 | ) | | | | | (15,467 | ) |
| |
| Total revenues | | 300,833 | | | 37,919 | | | | | | 36,299 | | | | | | 375,051 | |
| |
| Interest expense | | | | | | | | | | | | | $ | (5,640 | ) | | (5,640 | ) |
| |
| (Loss) income from continuing operations before tax and extraordinary item | | (87,854 | ) | | (14,536 | ) | | | | | 36,299 | | | (11,682 | ) | | (77,773 | ) |
| Federal income tax (benefit) expense | | (29,558 | ) | | (4,891 | ) | | | | | 12,110 | | | (4,089 | ) | | (26,428 | ) |
| |
| (Loss) income from continuing operations before extraordinary item | | (58,296 | ) | | (9,645 | ) | | | | | 24,189 | | | (7,593 | ) | | (51,345 | ) |
| Income from discontinued operations, net of tax expense of $1,912 | | | | | | | $ | 3,552 | | | | | | | | | 3,552 | |
| |
| (Loss) income before extraordinary item | | (58,296 | ) | | (9,645 | ) | | 3,552 | | | 24,189 | | | (7,593 | ) | | (47,793 | ) |
| Extraordinary item, net of tax expense of $534(3) | | | | | | | | | | | | | | 993 | | | 993 | |
| |
| Net (loss) income | $ | (58,296 | ) | $ | (9,645 | ) | $ | 3,552 | | $ | 24,189 | | $ | (6,600 | ) | $ | (46,800 | ) |
| |
| Combined ratios | | 129.2% | | | 138.3% | | | | | | | | | | | | 130.2% | |
| |
(1) Discontinued Real Estate Operations — see Note 1.
(3) Gain on extinguishment of debt (net of income tax) — see Note 12.
NOTE 21
Employee Benefit and Retirement Plans
Zenith offers a tax deferred savings plan organized under Section 401(k) of the Internal Revenue Code for all of its subsidiaries' eligible employees. Zenith matches 50% of employee contributions that are 6% or less of salary on a current basis and is not liable for any future payments under the plan. For the years ended December 31, 2002, 2001 and 2000, Zenith contributed $1.7 million, $1.5 million and $0.8 million, respectively.
Zenith also offers a stock purchase plan, under which all employees are able to purchase shares of Zenith National common stock at market value. Zenith matches 25% of all employee purchases. For the years ended December 31, 2002, 2001 and 2000, Zenith contributed $0.4 million, $0.3 million and $0.3 million, respectively.
NOTE 22
Related Parties
At December 31, 2002, companies controlled by Fairfax owned 7,811,000 shares, or 42%, of the total outstanding shares of common stock of Zenith National. Fairfax has disclaimed control of Zenith in separate filings with the Departments of Insurance in California, Texas and New York. Fairfax has also granted a proxy covering all its shares of Zenith National to an individual trustee with instructions to vote the shares in proportion to the voting of all other Zenith National shareholders.
At December 31, 2002 and 2001, Zenith owned $7.7 million and $9.1 million, respectively, at fair value of securities issued by Fairfax. In addition, Zenith owned $2.4 million and $2.7 million, respectively, at fair value of securities issued by TIG Capital Trust I, a subsidiary of Fairfax. At December 31, 2002 and 2001, Zenith owned $27.0 million at fair value of securities issued by Odyssey Re Holdings Corp., a New York Stock Exchange-listed subsidiary of Fairfax. Zenith also owned $13.1 million at fair
82
value of common stock of Wynn Resorts, Ltd. at December 31, 2002. Two of Zenith's Directors are also Directors of Wynn Resorts, Ltd.
On December 5, 2001, Zenith National sold one million shares of its common stock, par value $1.00 per share, in a private placement for $25.00 per share to a subsidiary of Odyssey Re.
Zenith's insurance operations conduct assumed and ceded reinsurance transactions with subsidiaries of Fairfax. Effective January 1, 2002, Zenith Insurance and a subsidiary of Odyssey Re entered into a 10% quota share ceded reinsurance agreement with respect to all new and renewal workers' compensation business written by Zenith Insurance in the three years commencing January 1, 2002. The following table summarizes the reinsurance transactions with the subsidiaries of Fairfax:
|
|---|
Years ended December 31,
(Dollars in thousands)
| | 2002
| | 2001
|
|---|
|
|---|
| Assumed Reinsurance: | | | | | | |
| | Unpaid loss and loss adjustment expenses | | $ | 118 | | $ | 266 |
| Ceded Reinsurance: | | | | | | |
| | Ceded reinsurance premiums earned | | | 36,772 | | | |
| | Unpaid loss and loss adjustment expenses | | | 32,482 | | | 3,795 |
| | Unearned premiums | | | 7,257 | | | |
|
In 2002, Zenith entered into an assumed quota share reinsurance contract with a Lloyds syndicate managed by Advent Capital. Assumed reinsurance premiums earned in 2002 were $2.7 million, of which $0.9 million were receivable at December 31, 2002. Unpaid loss and loss adjustment expenses were $2.0 million, and unearned premiums were $2.4 million at December 31, 2002.
NOTE 23
Quarterly Financial Data (Unaudited)
| |
|---|
| 2002 Quarter Ended
| |
|---|
(Dollars in thousands,
except per share data)
| March
31
| | June
30
| | September
30
| | December
31
| |
|---|
| |
|---|
| Premiums earned | $ | 121,274 | | $ | 127,530 | | $ | 149,898 | | $ | 158,353 | |
| Net investment income | | 12,662 | | | 12,808 | | | 11,960 | | | 11,381 | |
| Realized (losses) gains on investments | | (828 | ) | | (26 | ) | | 1,108 | | | (3,885 | ) |
| |
| Income (loss) from continuing operations | | 1,911 | | | 5,477 | | | 7,740 | | | (14,112 | ) |
| Income from discontinued operations | | 889 | | | 1,023 | | | 960 | | | 6,312 | |
| |
| Net income (loss) | | 2,800 | | | 6,500 | | | 8,700 | | | (7,800 | ) |
| |
| Net income (loss) per common share | | | | | | | | | | | | |
| | — basic(1) | $ | 0.15 | | $ | 0.35 | | $ | 0.46 | | $ | (0.42 | ) |
| | — diluted(1) | | 0.15 | | | 0.34 | | | 0.46 | | | (0.42 | ) |
| |
| |
|---|
| 2001 Quarter Ended
| |
|---|
(Dollars in thousands,
except per share data)
| March
31
| | June
30
| | September
30
| | December
31(3)
| |
|---|
| |
|---|
| Premiums earned | $ | 104,638 | | $ | 115,760 | | $ | 130,032 | | $ | 126,446 | |
| Net investment income | | 13,380 | | | 12,865 | | | 12,610 | | | 12,323 | |
| Realized gains on investments | | 137 | | | 1,865 | | | 4,101 | | | 3,066 | |
| |
| Loss (income) from continuing operations | | (823 | ) | | 1,486 | | | (20,166 | ) | | (10,103 | ) |
| Income from discontinued operations | | 723 | | | 1,414 | | | 866 | | | 743 | |
| |
| Net (loss) income | | (100 | ) | | 2,900 | | | (19,300 | ) | | (9,360 | ) |
| |
| Net (loss) income per common share | | | | | | | | | | | | |
| | —basic(2) | $ | (0.01 | ) | $ | 0.17 | | $ | (1.10 | ) | $ | (0.52 | ) |
| | —diluted(2) | | (0.01 | ) | | 0.16 | | | (1.10 | ) | | (0.52 | ) |
| |
(1) Additional common shares issuable under employee stock option plans using the treasury stock method are anti-dilutive for the fourth quarter of 2002 because there is a loss from continuing operations for that period.
(2) Additional common shares issuable under employee stock option plans using the treasury stock method are anti-dilutive for the first, third and fourth quarters of 2001 because there is a loss from continuing operations for those periods.
(3) Fourth quarter of 2001 is restated for equity method accounting for Advent Capital.
83
The fourth quarters of 2002 and 2001 include write-downs for other-than-temporary declines in the fair values of investments of $3.8 million and $4.4 million, respectively, before tax. The fourth quarter of 2002 includes a charge of $30.0 million before tax for increased workers' compensation loss reserves. The fourth quarter of 2001 includes catastrophe losses of $9.2 million before tax.
NOTE 24
Common Stock Market Prices (Unaudited)
The following table shows the high and low common stock prices during each quarter for the past two years.
|
|---|
| | 2002
| | 2001
|
|---|
Quarter ended
| | High
| | Low
| | High
| | Low
|
|---|
|
|---|
| March 31 | | $31.25 | | $27.36 | | $30.70 | | $22.80 |
| June 30 | | 32.25 | | 28.90 | | 27.92 | | 23.41 |
| September 30 | | 31.81 | | 23.35 | | 30.15 | | 23.78 |
| December 31 | | 29.45 | | 22.00 | | 29.30 | | 24.40 |
|
As of March 7, 2003, there were 250 registered holders of record of Zenith National common stock.
84
REPORT OF INDEPENDENT ACCOUNTANTS
To the Stockholders and Board of Directors of
Zenith National Insurance Corp.:
In our opinion, the accompanying consolidated balance sheets and the related consolidated statements of operations, cash flows and stockholders' equity present fairly, in all material respects, the financial position of Zenith National Insurance Corp. and subsidiaries (the "Company") at December 31, 2002 and 2001, and the results of their operations and their cash flows for each of the three years in the period ended December 31, 2002, in conformity with accounting principles generally accepted in the United States of America. These financial statements are the responsibility of the Company's management; our responsibility is to express an opinion on these financial statements based on our audits. We conducted our audits of these statements in accordance with auditing standards generally accepted in the United States of America, which require that we plan and perform the audit to obtain reasonable assurance about whether the financial statements are free of material misstatement. An audit includes examining, on a test basis, evidence supporting the amounts and disclosures in the financial statements, assessing the accounting principles used and significant estimates made by management, and evaluating the overall financial statement presentation. We believe that our audits provide a reasonable basis for our opinion.
As discussed in Note 1 to the Consolidated Financial Statements, effective January 1, 2002, the Company adopted the provisions of Statement of Financial Accounting Standards No. 142, "Goodwill and Other Intangible Assets." Also, as discussed in Note 1 to the Consolidated Financial Statements, during the year ended December 31, 2002, the Company changed its method of accounting for its investment in Advent Capital (Holdings) PLC from the cost method to the equity method.
PricewaterhouseCoopers LLP
Los Angeles, California
February 4, 2003
85
CORPORATE DIRECTORY
Zenith National Insurance Corp.
Directors
Also Directors of
Zenith Insurance Company
Max M. Kampelman
Attorney, Of Counsel,
Fried, Frank, Harris,
Shriver & Jacobson
Robert J. Miller
Attorney, Senior Partner,
Jones Vargas
Leon E. Panetta
Founder and Director,
The Leon & Sylvia Panetta
Institute for Public Policy
Alan I. Rothenberg
Attorney, Retired Partner
Latham & Watkins LLP
William S. Sessions
Attorney,
Holland & Knight LLP
and Security Consultant
Gerald Tsai, Jr.
Management of
Private Investments
Michael Wm. Zavis
Attorney, Retired Founding Partner,
Katten Muchin Zavis Rosenman
Stanley R. Zax
Chairman of the Board
and President
Executive Officers
Stanley R. Zax
Chairman of the
Board and President
Jack D. Miller
Executive Vice President
Robert E. Meyer
Senior Vice President
William J. Owen
Senior Vice President,
Chief Financial Officer
and Treasurer
John J. Tickner
Senior Vice President
and Secretary
Officer
Hyman J. Lee Jr.
Vice President
Transfer Agent-
Common Stock
Mellon Investor Services LLC
85 Challenger Road
Ridgefield Park, NJ 07660
www.melloninvestor.com
Transfer Agent-
8.55% Capital Securities
Wells Fargo Corporate Trust Services
Wells Fargo Bank Minnesota, N.A.
Minneapolis, MN
Corporate
Headquarters
21255 Califa Street
Woodland Hills, CA 91367
(818) 713-1000
www.thezenith.com
NYSE Trading Symbol
Common Stock—ZNT
Independent
Accountants
PricewaterhouseCoopers LLP
Los Angeles, CA
The Annual Report
on Form 10-K for the year ended December 31, 2002, our quarterly
reports on Form 10-Q, current
reports on Form 8-K and all
amendments to these reports may
be obtained at our website at www.thezenith.com or free of
charge upon written request to:
Chief Financial Officer
Zenith National Insurance Corp.
21255 Califa Street
Woodland Hills, CA 91367
86
CORPORATE DIRECTORY
Zenith Insurance Company
Officers
Stanley R. Zax
Chairman of the
Board and President
Jack D. Miller
Executive Vice President,
and Chief Operating Officer
William J. Owen
Senior Vice President
Chief Financial Officer, Treasurer
and Assistant Secretary
John J. Tickner
Senior Vice President,
General Counsel and Secretary
Stephen J. Albers
Senior Vice President
Ron R. Cordova
Senior Vice President
Anita Devan
Senior Vice President
Dan M. Hair
Senior Vice President
John C. Hasbrouck
Senior Vice President
Robert L. Hernandez
Senior Vice President
Westley M. Heyward
Senior Vice President
Fred A. Hunt
Senior Vice President
Corey A. Ingber
Senior Vice President
Edward G. Krisak
Senior Vice President
Eden C. Feder
Senior Vice President
Robert E. Meyer
Senior Vice President
and Chief Actuary
Stephen M. Pratt
Senior Vice President
William J. Saake
Senior Vice President
Keith E. Trotman
Senior Vice President
Chris L. Uselton
Senior Vice President
Glen R. Zepnick
Senior Vice President
Bryan A. Anderson
Vice President
Rhen C. Bass
Vice President
Jenny S. Baum
Vice President
Brian R. Beams
Vice President
Jeffrey J. Beaudoin
Vice President
Everett M. Brookhart
Vice President
Suzanne M. Chapan
Vice President
Duane H. Chernow
Vice President
Douglas A. Claman
Vice President
Ronald W. Crabtree
Vice President
Mark T. Cross
Vice President
Gerald D. Curtin
Vice President
Charles J. Davis
Vice President
Bradley C. Eastwood
Vice President
Jesse R. Farese
Vice President
F. Stephen Fetchet
Vice President
Stephen T. Frye
Vice President
James C. Guidos
Vice President
Keith Hanenian
Vice President
Diane H. Heidenreich
Vice President and Assistant
General Counsel
Carolyn N. Hinson
Vice President
David G. Hoppen
Vice President
Matthew A. Jacobson
Vice President
Mark M. Jansen
Vice President
Lisa A. Krouse
Vice President
Steven M. Larsen
Vice President
Hyman J. Lee Jr.
Vice President and
Assistant Secretary
Jonathan W. Lindsay
Vice President
Michael R. McFadden
Vice President
Timothy I. Mertz
Vice President
Colin S. Mitchell
Vice President
David A. O'Connor
Vice President
Stephen D. Petrula
Vice President
Alan I. Steinhardt
Vice President
John A. Swift
Vice President
Denise M. Watkins
Vice President
John H. Weber
Vice President
Norman C. Winters
Vice President
87
CORPORATE DIRECTORY
TheZenith Marketing, Underwriting and Claims Offices
Los Angeles, CA
Corporate Headquarters
and Los Angeles Regional Office
21255 Califa Street
Woodland Hills, CA 91367
(818) 713-1000
www.thezenith.com
San Diego, CA
1660 N. Hotel Circle Drive
Suite 400
San Diego, CA 92108
(619) 299-6252
San Francisco, CA
425 California Street
Suite 1010
San Francisco, CA 94104
(415) 315-7004
Pleasanton, CA
4309 Hacienda Drive
Suite 200
Pleasanton, CA 94588
(925) 460-0600
Fresno, CA
575 E. Locust Avenue
Suite 101
Fresno, CA 93720
(559) 432-6660
Salt Lake City, UT
3 Triad Center
345 W. North Temple
Suite 175
Salt Lake City, UT 84180
(801) 741-4900
Austin, TX
1101 Capitol of Texas Hwy.
South Bldg. J
Austin, TX 78746
(512) 306-1700
Blue Bell, PA
2 Valley Square
Suite 301
Blue Bell, PA 19422
(215) 591-2900
Springfield, IL
2105 W. White Oaks Drive
Springfield, IL 62704
(217) 726-2900
Lisle, IL
550 Warrenville Road
Suite 200
Lisle, IL 60532
(630) 353-7300
Sarasota, FL
1390 Main Street
Sarasota, FL 34236
(941) 906-2000
Orlando, FL
3504 Lake Lynda Drive
Suite 400
Orlando, FL 32817
(800) 999-3242
Charlotte, NC
5832 Farm Pond Lane
Suite 300
Charlotte, NC 28212
(800) 200-2667
Birmingham, AL
10 Iverness Center Parkway
Suite 220
Birmingham, AL 35242
(800) 355-0708
88
QuickLinks