QuickLinks -- Click here to rapidly navigate through this document
ANNUAL REPORT 2003
| ZENITH NATIONAL INSURANCE CORP. | |
| Years Ended December 31, | 2003 | 2002 | 2001 | |||||||||
|---|---|---|---|---|---|---|---|---|---|---|---|---|
| RESULTS OF OPERATIONS: | (Dollars in thousands, except per share data) | |||||||||||
| Total revenues | $ | 849,335 | $ | 602,235 | $ | 537,223 | ||||||
| Net investment income after tax | 37,966 | 32,489 | 33,841 | |||||||||
| Realized gains (losses) after tax | 12,631 | (2,360 | ) | 5,960 | ||||||||
Income (loss) from continuing operations after tax | 65,846 | 1,016 | (29,606 | ) | ||||||||
| Income from discontinued operations after tax(1) | 1,154 | 9,184 | 3,746 | |||||||||
| Net income (loss) | $ | 67,000 | $ | 10,200 | $ | (25,860 | ) | |||||
| PER SHARE DATA: | ||||||||||||
| Income (loss) from continuing operations after tax(2) | $ | 3.33 | $ | 0.05 | $ | (1.68 | ) | |||||
| Income from discontinued operations after tax(1)(2) | 0.05 | 0.49 | 0.21 | |||||||||
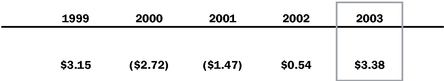
| Net income (loss)(2) | $ | 3.38 | $ | 0.54 | $ | (1.47 | ) | |||||
| Stockholders' dividends | $ | 1.00 | $ | 1.00 | $ | 1.00 | ||||||
KEY STATISTICS: | ||||||||||||
| Combined ratio: | ||||||||||||
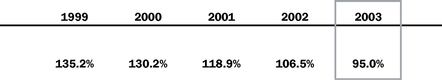
| Including catastrophes | 95.0% | 106.5% | 118.9% | |||||||||
| Excluding catastrophes | 95.0% | 106.4% | 110.2% | |||||||||
| Stockholders' equity | $ | 383,246 | $ | 317,024 | $ | 300,551 | ||||||
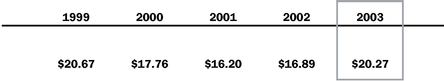
| Stockholders' equity per share | 20.27 | 16.89 | 16.20 | |||||||||
| Closing common stock price | 32.55 | 23.52 | 27.94 | |||||||||
(1) In 2002, we sold the home-building business and related real estate assets of Perma-Bilt, a Nevada Corporation. The results of the real estate business are presented as discontinued operations. The gain on the sale in 2002 was $6.3 million after tax, or $0.34 per share. Additional sales proceeds of $1.8 million before tax ($1.2 million after tax) were received in 2003 under the earn-out provision of the sale.
(2) Diluted net income per share for the year ended December 31, 2003 reflects the impact of additional shares issuable as a result of the convertibility of Zenith's 5.75% Convertible Senior Notes. If the convertibility of the 5.75% Convertible Senior Notes had been included for the entire year in 2003, diluted net income per share would have been $2.96 for the year ended December 31, 2003 (See Notes 10, 20 and 26 to the Consolidated Financial Statements).
1
| • | Financial Highlights | 1 | |
• | Letter to Stockholders | 3 | |
• | Management's Discussion and Analysis of Consolidated Financial Condition and Results of Operations | 28 | |
• | 5-Year Summary of Selected Financial Information | 54 | |
• | Consolidated Balance Sheet | 58 | |
• | Consolidated Statement of Operations | 59 | |
• | Consolidated Statement of Cash Flows | 60 | |
• | Consolidated Statement of Stockholders' Equity and Consolidated Statement of Comprehensive Income | 62 | |
• | Notes to Consolidated Financial Statements | 63 | |
• | Report of Independent Registered Public Accounting Firm | 94 | |
• | Corporate Directory | ||
Zenith National Insurance Corp. | 96 | ||
Zenith Insurance Company | 97 | ||
TheZenith Marketing, Underwriting and Claims Offices | 98 |
TheZenith and Zenith are registered U.S. trademarks.
2
The year 2003 was a year of accomplishment for TheZenith. The financial highlights speak for themselves. Most importantly, profits were at acceptable levels for the first time in several years. Net income was $67.0 million, or $3.38 per diluted share.
Our results benefited primarily from improved results in the California workers' compensation market, growth in investment income due to substantial increases in cash flow for investments and from realized capital gains. Continuation of favorable operating trends in the new year aided by the legislated reforms in California and Florida, our two largest states, provide optimism for the future.
Our focused service strategy resulted in record in-force premium growth of $256.3 million or 42.1% from the prior year. At December 31, 2003, there were 41,500 policies in-force compared to 39,500 the prior year with in-force premium of $865.7 million.
Our financial strength continued to improve with shareholders' equity increasing by $66.2 million to $383.2 million and our average return on equity for the year was 18.8%. Also, we sold $125 million of 5.75% Convertible Senior Notes to provide additional funds to support our growth, and the Notes are presently convertible into 5 million shares of Zenith common stock.
We believe that our loss reserves are conservatively stated and their adequacy has been enhanced by reform legislation enacted this past year in California and Florida. Even so, our major unknown continues to be the risk inherent in the performance of our prior year reserves, although we believe this risk is substantially less than it may have been in the recent past.
TheZenith today is the largest publicly-owned workers' compensation specialist in the U.S. due to the talent and professionalism of our people, the agents and brokers who trust us with their business and the diverse employer base that we insure. Our emphasis is not on size or growth for the sake of growth, but in providing value-added services to our customers and attractive returns to our shareholders.
3
WORKERS' COMPENSATION PREMIUMS IN-FORCE GREW TO $865.7 MILLION,
OR A 42.1% INCREASE OVER 2002; 41,500 POLICIES WERE IN-FORCE
COMPARED TO 39,500 THE PRIOR YEAR.
Maintaining customer confidence and the integrity and productivity of our company depends on the excellent quality of TheZenith talent.
We will discuss the above and the challenges and opportunities facing us in detail in the balance of this report.
FINANCIAL HIGHLIGHTS
1. Insurance Operations:
- •
- Premiums earned grew to $773.8 million, an increase of 38.9%.
- •
- Underwriting profits were $38.8 million compared to losses of $36.2 million in 2002.
- •
- Combined ratio improved to 95.0% from 106.5% in 2002.
2. Workers' Compensation:
- •
- Premiums in-force increased 42.1% to $865.7 million.
- •
- Policies in-force increased 5.1% to about 41,500.
- •
- Price increases are continuing, estimated at 8% for 2004 compared to 35% the prior year.
- •
- Underwriting profits were $29.3 million compared to losses of $43.8 million in 2002.
- •
- Combined ratio improved to 95.9% from 108.7% in 2002.
- •
- Industry combined ratio for 2003 estimated at 109.5% by A.M. Best Company.
3. Additional Financial Stability:
- •
- Cash flow from insurance operating activities was $291.5 million in 2003 compared to $144.9 million the prior year.
- •
- Statutory capital of the insurance business increased by $150.0 million to $459.8 million.
- •
- Shareholders' equity increased by $66.2 million to $383.2 million.
- •
- $125 million of 5.75% Convertible Senior Notes were sold and are presently convertible into 5 million shares of Zenith National common stock.
4
STOCKHOLDERS' EQUITY PER SHARE
- •
- Market capitalization of TheZenith at year-end was $778.3 million, including 5.0 million shares issuable in connection with the Convertible Senior Notes, compared to $441.4 million at December 31, 2002.
4. Net Income:
- •
- Net income was $67.0 million compared to $10.2 million in 2002.
- •
- Net income per diluted share was $3.38 compared to $0.54 the prior year.
5. Investment Income:
- •
- Investment income was $56.1 million in 2003 compared with $48.8 million the prior year.
- •
- Reduced average yield due to lower interest rates.
- •
- Investment portfolio increased from $1.1 billion in 2002 to $1.5 billion in 2003.
- •
- Capital gains in 2003 were $19.4 million compared to capital losses of $3.6 million the prior year.
- •
- Unrealized gains were $44.2 million before tax compared to $26.8 million the prior year.
ANALYSIS
The following table summarizes pre-tax underwriting performance during the past three years:
| Underwriting Income (Loss) | 2003 | 2002 | 2001 | |||||||
|---|---|---|---|---|---|---|---|---|---|---|
| (Dollars in thousands) | ||||||||||
| Workers' compensation | $ | 29,260 | $ | (43,848 | ) | $ | (58,329 | ) | ||
| Reinsurance | 9,562 | 7,644 | (31,918 | ) | ||||||
| Total underwriting income (loss) | $ | 38,822 | $ | (36,204 | ) | $ | (90,247 | ) | ||
| Catastrophe losses | $ | 0 | $ | 400 | $ | 41,700 | ||||
5
SHAREHOLDERS' EQUITY INCREASED FROM $317.0 MILLION TO $383.2
MILLION; AVERAGE RETURN ON EQUITY FOR 2003 WAS 18.8%.
2003 results improved significantly:
- •
- Property-casualty combined ratio was 95.0% in 2003 compared to 106.5% the prior year.
- •
- Combined ratio for the workers' compensation operations was 95.9% in 2003 compared to 108.7% in 2002.
- •
- Accident year combined ratios for the workers' compensation operations were 93.9%, 102.7% and 117.8% for 2003, 2002 and 2001, respectively.
- •
- 2003 accident year reinsurance operations were excellent due to the absence of major disasters; however, it isn't reasonable to evaluate this business on short-term results.
- •
- Gross written insurance premiums were $900.0 million in 2003 compared to $640.9 million the prior year, an increase of 40.4%. Net written premiums increased 36.4%, a lower increase, due to the effect of the previously announced 10% quota share on our workers' compensation business.
- •
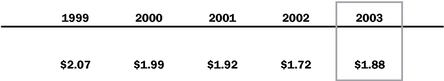
- Investment income after tax was $38.0 million, or $1.88 per share, in 2003 compared to $32.5 million, or $1.72 per share, in 2002.
- •
- Stockholders' equity at December 31, 2003 was $383.2 million compared to $317.0 million at December 31, 2002.
- •
- Cash generated from insurance operations was $291.5 million in 2003 compared to $144.9 million in 2002.
- •
- At December 31, 2003, Zenith had debt of $120.4 million due to the sale of the 5.75% Convertible Senior Notes in March 2003. These notes are convertible into Zenith common stock until March 31, 2004 with future conversion dependent upon the price of Zenith common stock. There were $65.8 million outstanding of our 8.55% Capital Trust Securities issued in July 1998, maturing in 25 years. TheZenith's parent company had $72.4 million of cash and investments and bank lines of credit of $50.0 million available at year-end, which can be utilized to provide statutory capital for our insurance subsidiaries or for general corporate purposes.
6
NET INCOME (LOSS) PER COMMON SHARE
- •
- Zenith's subsidiaries are rated A- (Excellent) by A.M. Best Company. Moody's Investors Service and Standard & Poor's have assigned insurance financial strength ratings of Baa1 (Adequate) and BBB+ (Good), respectively.
- •
- Dividends to shareholders were $18.8 million in 2003.
RESERVES
Information in the following table provides estimates of Zenith's net incurred losses and loss adjustment expenses for our workers' compensation and reinsurance businesses by accident year, evaluated in the year they were incurred and as they were subsequently evaluated in succeeding years. These data are of critical importance in judging the historical accuracy of our reserve estimates, as well as providing a guide to setting fair prices and rates. The accuracy of reserve estimates is one of our major business risks which we endeavor to manage professionally. Loss reserve estimates are refined continually in an ongoing process as experience develops, new information is obtained and evaluated and claims are reported and paid. For example, reform legislation enacted in California during 2003 may benefit loss development by about $35 million, however at this time we have not reflected any amounts in our financial statements as we wait and watch for the facts to develop. Adverse loss development was lower in 2003 than in the prior year. For additional information on reserving, the reader should turn to pages 36 to 41 of this report.
Estimating catastrophe losses in the reinsurance business is highly dependent upon the nature and timing of the event and our ability to obtain timely and accurate information with which to estimate our liability to pay losses. There remains considerable uncertainty as to the nature and amount of monetary losses associated with the attack on the World Trade Center; however, we believe we have reserved adequately at year-end and have not made any adjustments since the fourth quarter of 2001.
7
RESERVE ADEQUACY MUST BE APPARENT FOR A SUBSTANTIAL PERIOD OF
TIME TO CONFIRM OUR UNDERWRITING PROFITABILITY, AND TO GIVE US
CONFIDENCE WE ARE DEALING PRUDENTLY WITH CLAIM COST FACTORS.
| Accident Year Reserve Development from Operations | |||||||||||||||||||||
|---|---|---|---|---|---|---|---|---|---|---|---|---|---|---|---|---|---|---|---|---|---|
| Net incurred losses and loss adjustment expenses reported at end of year | |||||||||||||||||||||
Years in which losses were incurred | 1997 | 1998 | 1999 | 2000 | 2001 | 2002 | 2003 | ||||||||||||||
(Dollars in thousands) | |||||||||||||||||||||
| Prior to 1997(1) | $ | 2,379,237 | $ | 3,293,503 | $ | 3,320,201 | $ | 3,308,303 | $ | 3,290,589 | $ | 3,297,821 | $ | 3,293,232 | |||||||
| 1997(1) | 193,363 | 322,679 | 328,768 | 335,137 | 332,953 | 336,170 | 335,692 | ||||||||||||||
| Cumulative | 2,572,600 | 3,616,182 | 3,648,969 | 3,643,440 | 3,623,542 | 3,633,991 | 3,628,924 | ||||||||||||||
| 1998 | 250,657 | 263,974 | 269,425 | 276,370 | 276,909 | 282,469 | |||||||||||||||
| Cumulative | 3,866,839 | 3,912,943 | 3,912,865 | 3,899,912 | 3,910,900 | 3,911,393 | |||||||||||||||
| 1999 | 262,932 | 293,890 | 306,462 | 298,644 | 310,080 | ||||||||||||||||
| Cumulative | 4,175,875 | 4,206,755 | 4,206,374 | 4,209,544 | 4,221,473 | ||||||||||||||||
| 2000 | 289,946 | 294,674 | 304,251 | 311,853 | |||||||||||||||||
| Cumulative | 4,496,701 | 4,501,048 | 4,513,795 | 4,533,326 | |||||||||||||||||
| 2001 | 409,586 | 426,007 | 437,452 | ||||||||||||||||||
| Cumulative | 4,910,634 | 4,939,802 | 4,970,778 | ||||||||||||||||||
| 2002 | 391,960 | 375,199 | |||||||||||||||||||
| Cumulative | 5,331,762 | 5,345,977 | |||||||||||||||||||
| 2003 | 523,707 | ||||||||||||||||||||
| Cumulative | 5,869,684 | ||||||||||||||||||||
| Loss and loss adjustment expense ratios: | |||||||||||||||||||||
| 1997 | 71.0% | 70.1% | 71.5% | 72.8% | 72.4% | 73.1% | 73.0% | ||||||||||||||
| 1998 | 72.6% | 76.5% | 78.1% | 80.1% | 80.2% | 81.9% | |||||||||||||||
| 1999 | 83.4% | 93.2% | 97.2% | 94.7% | 98.3% | ||||||||||||||||
| 2000 | 85.6% | 87.0% | 89.8% | 92.1% | |||||||||||||||||
| 2001 | 85.9% | 89.3% | 91.7% | ||||||||||||||||||
| 2002 | 70.4% | 67.4% | |||||||||||||||||||
| 2003 | 67.7% | ||||||||||||||||||||
This analysis displays the accident year net incurred losses and loss adjustment expenses on a GAAP basis for accident years prior to 1997 and for each of the accident years 1997-2003 for all property-casualty business. The total of net loss and loss adjustment expenses for all claims occurring within each annual period is shown first at the end of that year and then annually thereafter. The total cost includes both payments made and the estimate of future payments as of each year-end. Past development may not be an accurate indicator of future development since trends and conditions change. Data for 2002 and prior have been restated to reclassify certain expenses previously classified as unallocated loss adjustment expenses (See Note 25 on page 91). The data prior to 1999 have been restated to exclude the results of CalFarm Insurance Company, which was sold effective March 31, 1999.
Adverse loss reserve development in recent years has been attributable to higher than expected workers' compensation claim severity, adverse development of catastrophe losses and an increase in the loss reserves assumed in the purchase of RISCORP.
- (1)
- The acquisition of RISCORP in 1998 caused incurred losses for 1997 and prior to increase from 1997 to 1998.
8
INVESTMENT INCOME AFTER TAX PER SHARE
INVESTMENTS
Investment activities are a major part of our revenues and earnings; we believe our portfolio is diversified to achieve a reasonable balance of risk and a stable source of earnings. Zenith primarily invests in debt securities, as compared to equity securities, and our largest holdings are cash and U.S. Government securities. In comparison to other insurers, we believe our portfolio contains a smaller percentage of equity securities to total assets, a larger percentage of cash or short-term securities and no derivative securities or credit enhancement exposure.
- •
- Consolidated investment income after tax and after interest expense was $29.9 million, or $1.55 per share, in 2003 compared to $29.2 million, or $1.54 per share, in 2002. Average yields on this portfolio in 2003 were 4.4% before tax and 2.9% after tax compared to 4.9% and 3.3%, respectively, in 2002.
- •
- During 2003, Zenith recorded capital gains before tax of $19.4 million compared to losses of $3.6 million the prior year.
- •
- Zenith's investment portfolio increased $432.2 million, or 39.4%, in 2003 to $1.5 billion.
- •
- Net unrealized gains in our portfolio of fixed maturity investments were $25.7 million before tax in 2003 compared to $29.8 million before tax the prior year.
- •
- Zenith's investment portfolio is recorded in the financial statements primarily at market value. Average life of the bond portfolio was 7.3 years at December 31, 2003 compared to 5.6 years at December 31, 2002. The bond portfolio quality is high, with 97% and 94% rated investment grade at December 31, 2003 and 2002, respectively.
9
INVESTMENT INCOME AFTER TAX WAS $38.0 MILLION, OR $1.88 PER
SHARE, IN 2003 COMPARED TO $32.5 MILLION, OR $1.72 PER SHARE,
THE PRIOR YEAR.
The major developments affecting the U.S. bond markets were continued low inflation and fluctuating interest rates. Since we are capable of holding bonds to maturity, and the average maturities are relatively short, fluctuations in bond values do not significantly impact our operations.
Short-term investments and liquidity remained high as we searched for investment opportunities. We have invested only a small amount of our capital in common stocks, since we believe the volatility in the market could impact our ability to expand our insurance business. Management will continue to monitor conditions and, at an appropriate time, may reconsider our strategy.
| Securities Portfolio | December 31, 2003 | December 31, 2002 | |||
|---|---|---|---|---|---|
| Amortized Cost* | Market Value | Amortized Cost* | Market Value | ||
| (Dollars in thousands) | |||||
| U.S. Government bonds | $ 296,566 | $ 298,890 | $ 166,744 | $ 170,920 | |
| Taxable bonds: | |||||
| Investment grade | 572,101 | 593,552 | 488,495 | 517,050 | |
| Non-investment grade | 39,913 | 41,343 | 49,373 | 46,061 | |
| Municipal bonds | 123,510 | 122,827 | 53,665 | 54,312 | |
| Redeemable preferred stocks | 21,752 | 24,750 | 21,762 | 25,285 | |
| Other preferred stocks* | 10,241 | 10,772 | 12,855 | 13,115 | |
| Common stocks* | 34,211 | 52,189 | 38,831 | 35,519 | |
| Mortgage loans* | 39,123 | 39,123 | 26,924 | 26,924 | |
| Short-term investments | 285,760 | 285,760 | 158,078 | 158,078 | |
| Other* | 63,100 | 63,100 | 54,788 | 54,788 | |
| Total | $1,486,277 | $1,532,306 | $1,071,515 | $1,102,052 | |
*Equity securities and other investments at cost, mortgage loans at unpaid principal balance. | |||||
10
PROPERTY-CASUALTY COMBINED RATIO
From time to time, on a selective basis, we find excellent real estate investment opportunities. During 2003 we pursued two investments, as follows:
- •
- We are developing a 3.2 acre site near our Sarasota, Florida office with a partner. The project will include a Whole Foods market, a parking structure, 23,000 square feet of commercial property and 95 condominium residences. Construction has commenced on the market, which is scheduled to open October 2004. Construction has also commenced on the balance of the project.
- •
- We financed land development in California on a first mortgage basis with a bonus interest based on the profitable sale of the development. The loan commitment was for $15.0 million for two years with interest and a profit participation. The land development is fully entitled for 494 family homes and 231 condominiums.
WORKERS' COMPENSATION
TheZenith is a specialist with primary operations in California and Florida and 43 other states. We believe that TheZenith ranks amongst the top five underwriters in California and Florida, the two states in which we write the majority of our business. We do not have any planned goals as to size, market share or ranking, but are focused on providing quality services to our insureds and a fair return to our shareholders.
Gross premiums written in 2003 were $848.8 million, an increase of 46.0% from the prior year. California premiums were 65.4% of the total. Underwriting profits pre-tax were a record $29.3 million in 2003 compared to underwriting losses of $43.8 million in the prior year. During the past five years, our net loss has been reduced to $46.2 million including this year's profits, and we are focused on further improvements in 2004.
Our combined ratio improved to 95.9% in 2003 from 108.7% the prior year. Industry combined ratios for workers' compensation are estimated at 109.5% and 112.2%, respectively, for 2003 and 2002.
11
THEZENITH HAS BECOME THE LARGEST PUBLICLY-OWNED WORKERS'
COMPENSATION SPECIALIST IN THE U.S., HOWEVER, OUR EMPHASIS
HAS NEVER BEEN ON GROWTH FOR GROWTH'S SAKE.
We are pleased with our strategy and culture which have produced results substantially better than industry averages over a long period of time.
Premium growth of about 46% and 33% these past two years was a result of the interaction of an increase in the number of policies and a change in net rates, experience modifications and payrolls. We estimate that the majority of the growth in premiums was due to rate changes and the balance is from our growth in payroll and policies. At year-end 2003, there were 41,500 policies in-force, up 5.1% from the prior year. We have a very diversified group of policies; by size, geography and classes of business, including charities and not-for-profit employers. We offer guaranteed cost, deductible, dividend and retro plans, but the vast majority of our policies are guaranteed cost. Restaurants represent the largest premium class of insureds.
Rates are estimated to have increased 35% in 2003 and rate increases of 8% are estimated for 2004. California increases were larger and amounted to about 46% in 2003. California 2004 rate increases are expected at this time to be lower than in the past two years due to the recently enacted reform legislation (which is discussed later herein), but at amounts still sufficient to cover the estimated loss cost trends and also to provide a reasonable underwriting profit. Specifically, policyholders in the first half of the year will receive increases instituted in April and July of last year which approximate 15%. Additional rate changes may be necessary or advisable depending on developments, including specifically trends caused by the new benefit and reform legislation, interest rate levels and loss development, but these decisions will be made later in the current year, if necessary.
Our underwriting profits are a result of premium growth, moderate frequency trends and high severity trends coupled with our consistently focused service strategy. Specifically, rate increases continue to exceed estimated loss cost trends. These pricing trends must continue until the estimated loss cost trends are moderated by facts. Specifically, reserve adequacy must be apparent for some time
12
THE COMBINED RATIO FOR THE WORKERS' COMPENSATION OPERATIONS
WAS 95.9% COMPARED TO 108.7% IN 2002; CONTINUING OUR HISTORIC
TREND OF BEING BELOW INDUSTRY AVERAGES.
in order for our underwriting profitability to be confirmed and we have a high degree of comfort that we are dealing prudently with the historically high claim cost trend phenomena. This is crucial with respect to the recent accident years where data are more speculative and estimates are more significant. Our accident year loss ratios remain substantially below industry averages, as set forth in the following table:
| | California | Outside of California | ||||||
|---|---|---|---|---|---|---|---|---|
| Accident Year Loss Ratios | ||||||||
| Zenith | Industry | Zenith | Industry | |||||
| 1998 | 74% | 124% | 54% | 81% | ||||
| 1999 | 86% | 131% | 60% | 88% | ||||
| 2000 | 79% | 116% | 60% | 88% | ||||
| 2001 | 76% | 100% | 56% | 79% | ||||
| 2002 | 62% | 80% | 50% | 71% | ||||
| 2003 | 54% | — | 50% | — | ||||
The favorable comparisons set forth above are due to a number of factors: actuarial rates, agency relationships, reasonable (not perfect) reserving accuracy, disciplined underwriting and our commitment to quality services. At present, improving industry results, the less aggressive strategy of the California State Compensation Insurance Fund ("the Fund") and favorable reform legislation are improving the operating environment, although changing economic conditions and healthcare trends continue to be a source of concern. We are writing more policies (an increase of 5.1% in 2003) but are continuing to be selective in choosing which accounts to insure. All opportunities do not necessarily provide an adequate price for the risks involved (i.e., the claims to be acquired). We have an experienced underwriting team that makes these decisions based on the perceived merits or claim
13
WHILE RATE INCREASES CONTINUE TO EXCEED ESTIMATED LOSS COST
TRENDS FOR THE FIRST TIME IN MANY YEARS, THESE PRICING TRENDS
MUST BE SUSTAINED UNTIL THE LOSS COST FACTORS ARE VALIDATED
BY FACTS.
expectations of each account or group. We see healthy competition in the marketplace, including employers' increased appetite for retaining insurance risk, but do not see competitors "buying business at discount prices" as was the case for several years. The need to generate an adequate return on capital in a low interest rate environment and greater scrutiny from Sarbanes-Oxley legislation and rating agencies appear to be constraining irresponsible competition.
Our strategy causes our premium volume to fluctuate depending on our competitors' pricing and growth strategies compared to our own. We adhere to disciplined and consistent underwriting principles and we are dedicated to pricing strategies anticipated to generate an underwriting profit. Significantly, our agents and brokers appreciate the value of our services and continue to place more accounts with us than in the past. Based on current market conditions, we expect California premium dollars and number of policyholders to continue to grow faster than in other states.
At present, California is about a $25 billion market and our California in-force premium at year-end was $587.9 million compared to $350.2 million at the end of 2002. Our total in-force premium at year-end was $865.7 million, an increase of 42.1% from the prior year. (In-force premiums differ from the accounting statement terminology of written and earned premium and are estimates of the premium to be received on all policies prior to their expirations.) Early 2004 results reflect continued growth.
Claim frequency trends in 2003 remain favorable despite the increase in new business and the changing economy; severity trends continue to increase in amounts substantially greater than the rate of inflation and historical trends, but in line with our estimates. Severity trends are caused primarily by significant increases in health care costs, now in excess of 50% of our total loss costs, increases in the duration and amount of temporary disability and increases in disability ratings. We do not understand all of the causes of these trends and certainly are not aware of any major solutions that
14
WE DO NOT FAVOR LIMITING PAYMENTS TO LEGITIMATELY INJURED
WORKERS, HOWEVER, THE SUBJECTIVE NATURE OF THE SYSTEM AND
THE DELAYS IN THE DISPUTE RESOLUTION SYSTEM PROVIDE FOCUS
FOR CHANGE.
are either imminent or politically feasible, although recent reform legislation in California and Florida will tend to provide some favorable moderation in the next few years and assist in maintaining reserve adequacy. With this in mind, we continue our efforts to protect our financial strength and our insureds by establishing adequate rates, by challenging excessive health care services/charges and other questionable aspects of the claim process.
The most frequently asked question from analysts and investors concerns the role of the California Insurance Commissioner in the rate making process. California is an open rating (deregulated) state with respect to workers' compensation. In this regard, the Commissioner's only role is to approve advisory pure premium rate filings of the Workers' Compensation Insurance Rating Bureau. Insurers in California can set their own rates and ignore the approved pure premium. In fact, many of the insurers that got into financial trouble or became insolvent sold insurance at prices less than the approved pure premium. We have made clear to those who inquire of us that TheZenith establishes its own rates based on the work product of our actuaries and we adjust those rates as indicated from time to time based upon developments. As such, our rates are currently higher than the statewide average ratio of written premium to the California approved pure premium rate level. As required by law, we have taken into account the Rating Bureau's estimate of the financial impact of the recently enacted reform legislation. In fact, if it were not for the reforms our rates would have been about 20% higher.
The Fund has grown rapidly during the last several years to more than 50% of the market, and its financial strength has been questioned by many, including the Insurance Commissioner. The Fund will benefit to the greatest extent from the new reform legislation. Notwithstanding, it appears to be operating its business in a less aggressive posture than the last several years. As a result, agents and brokers seem to be diversifying their business among insurers to a greater extent than in the past
15
RATES ARE A FUNCTION OF THE SYSTEM AND ITS TRENDS; POLITICAL
RHETORIC OR CRITICISM FROM APPLICANT ATTORNEYS WILL NOT RESULT
IN LOWER PRICES UNTIL THE TRUE COST DRIVERS ARE REDUCED.
which provides additional opportunities for TheZenith. It seems to be the policy of the Insurance Commissioner to cause the Fund to shrink and for competitors to increase their market share. Unfortunately, there is a major dispute between the Fund and the Insurance Commissioner as to the Commissioner's power to regulate the Fund and, until the dispute is resolved, the long-term situation with the Fund and its operations may not be clear.
TheZenith is mindful that many of our policyholders are experiencing difficult times due to the economy and increases in insurance costs, including workers' compensation premiums, which are difficult to absorb. This is particularly the case with charities and not-for-profit insureds. It is also the case for self-insureds, cities, counties and governmental entities due to the cost drivers in the system. Some employers and industry critics conveniently forget that insurance was purchased at low rates for a number of years. Unfortunately, there is no alternative at this time to continued cost-based pricing designed to achieve profits. We need not apologize to our customers or anyone else for being in business to make profits. We do not enjoy charging high rates any more than employers do in paying them, but rates are a direct result of the system and its trends. Political rhetoric or criticisms from applicant attorneys will not result in lower prices unless the true cost drivers are reduced. However, employers who instill safe work practices, train their managers in proper workers' compensation administration, and cooperate with TheZenith's proven specialists will realize the best combination of service and savings. Even though rates may not decline, a focus on impacting experience modifications can lead to lower prices for some employers. We urge our customers, along with their agents and brokers, to become more proactive in helping to minimize claims and control the related costs.
16
CONTRARY TO THE PAST SEVERAL YEARS, COMPETITORS DO NOT SEEM
TO BE "BUYING THE BUSINESS AT DISCOUNT PRICES;" RATHER THERE
IS MORE INTELLIGENT COMPETITION IN THE MARKETPLACE.
Certain small policyholders who rarely have claims cannot comprehend, however, the reason their insurance costs continue to increase. Although we can appreciate the problem, the basic principle of insurance requires that all insureds contribute to create a larger pool to pay for the ever increasing cost trends of all claims, even though each insured's claim history varies from zero claims to one or more in any year. Small policyholders frequently have large claims that cost from hundreds of thousands of dollars to more than a million dollars.
The obvious answer to high or increasing prices is to enact additional substantive reforms to the system so that rate decreases are justified. In California, discussion continues about the possibility of additional reforms (particularly to the disability component), more active efforts to fight fraud and even, perhaps, 24-hour coverage advocated by the Insurance Commissioner. Certainly there are political pressure and various proposals to adopt legislation that will result in lower prices, but the plans discussed so far do not appear to justify the stated objective of reducing costs to the national average. Whether there is any realism to additional reforms that will reduce rates substantially, and, if enacted, will have the anticipated results, remains to be seen. It is possible that if substantive legislative reforms are not enacted that initiatives may be placed on the November 2004 ballot for consideration by the voters.
As a result of large insolvencies, it is expected the California Insurance Guarantee Association will be required to fund hundreds of millions of dollars in losses. Under current law, each of our policyholders (and all policyholders in the State) will be assessed up to 2% of their premiums annually to cover these losses for the foreseeable future.
Our catastrophe management strategies are designed to mitigate our exposure to earthquakes and terrorism. Through a combination of reinsurance and carefully tracking our exposures with technology, we are focused on controlling our risk.
17
SOME EMPLOYERS AND INDUSTRY CRITICS CONVENIENTLY FORGET THAT
INSURANCE HAS BEEN PURCHASED AT LOW RATES FOR A NUMBER OF
YEARS, ADVERSELY IMPACTING THE INDUSTRY.
THEZENITH'S MISSION
Reducing employer loss ratios, experience modifications and ultimately the long-term cost of their insurance is our hallmark and our mission. We have specialized for many years in providing necessary services and information to assist employers. TheZenith's value-added services, implemented in partnership with our policyholders, agents and brokers, have an excellent record of reducing the net cost of insurance to many of our customers.
- •
- Expert Safety and Health professionals and programs assist with accident and illness prevention, incident investigation and remediation, and safe work practices education for management and employees.
- •
- Claims and Medical/Disability Management procedures facilitate prompt injury reporting, the use of recommended physicians (where permitted state-by-state), nurse case management of serious claims, analysis and negotiation of hospital and medical bills, and ongoing communications and reviews to monitor and manage recoveries, costs and reserving. We attempt to minimize claims costs by primarily utilizing the services of our internal claim staff, including claim, health and legal professionals.
- •
- Special Investigation Unit and a newly formed Healthcare Investigation Team work together with specialized workers' compensation legal personnel to protect employers from fraud and abuse, negotiate settlements where prudent, and represent policyholders and our Company throughout the litigation process as appropriate.
- •
- Return-to-Work programs place recovering employees in transitional duties with physician approval, improving employer morale and productivity, while containing costs. We have intensified our efforts to work with employers in this important area.
18
WE CONTINUE TO PROTECT OURSELVES BY ESTABLISHING ADEQUATE RATES
AND BY CHALLENGING EXCESSIVE HEALTH CARE SERVICES AND CHARGES,
AND OTHER QUESTIONABLE ASPECTS OF THE CLAIM PROCESS.
- •
- Premium Auditors provide proper payroll classifications to assure accuracy and avoid unanticipated retroactive billing.
- •
- E-Commerce on the Internet provides valuable current information to our agents and insureds. We quote and bind policies through TheZenith Connection and we anticipate this will continue to grow in the future.
Quality services require a substantial infrastructure investment in experienced employees and technology. Change continues at a rapid pace and, therefore, we have a long-term commitment to invest in the continuous training and development of our people. Our objective is a stable, self-motivated workforce with teamwork among different talents providing an above average result. As our business has grown and its complexity increased, we have hired and trained additional employees to continue our quality services. At year-end 2003, there were 1,400 employees serving our customers compared to 1,200 at the end of 2002. We are confident in the abilities of our people to build upon and continue to improve our services and their effectiveness in a fast changing environment. Our people are our most important asset. Training, teamwork and technology along with specialization are providing major improvements in our focus and capabilities.
CALIFORNIA AND FLORIDA 2003 REFORMS
California and Florida, the two states in which we write the majority of our business, passed reform legislation in 2003. The approach to reform was different in each state, but coincidentally the estimated impact will be about the same on future rates: a reduction of about 14% due to reforms. Since California rates would have increased without the reforms, our January 1, 2004 California rates will remain unchanged from those in effect since July 1, 2003.
In Florida, the primary changes related to compensability of claims, disability benefits and attorney fees. In California, the primary changes related to medical costs.
19
CALIFORNIA AND FLORIDA HAVE MADE FAVORABLE CHANGES TO THEIR
RESPECTIVE SYSTEMS AND THE POLITICIANS INVOLVED SHOULD BE
CONGRATULATED FOR A JOB WELL DONE.
The following is a summary of major items that will impact costs in both states:
FLORIDA
- 1.
- Requires physicians to treat only objective, relevant medical findings.
- 2.
- Clear and convincing evidence is needed to prove causation.
- 3.
- Work-related accident must be more than 50% responsible for injury and subsequent disability.
- 4.
- Permanent disability benefits are only available until the beneficiary reaches the age of 75 and if the employee is unable to engage in at least sedentary employment within a 50-mile radius of home.
- 5.
- Hourly fees for employee's attorneys are eliminated.
CALIFORNIA
- 1.
- Vocational rehabilitation benefit eliminated.
- 2.
- Chiropractic and physical therapy benefits limited to 24 visits per injury.
- 3.
- Out-patient fee schedule adopted and set at 120% of Medicare fee schedule.
- 4.
- Treating physician presumption eliminated retroactively (previously eliminated for injuries after January 1, 2003).
- 5.
- Medical treatment utilization guidelines to be adopted.
- 6.
- Spinal surgery dispute procedure adopted.
- 7.
- Pharmaceutical fee schedule adopted at 100% of the Medi-Cal reimbursement rate.
As is always the case with complex workers' compensation legislation, it is necessary to study carefully the impact of changes to discern whether there may be unanticipated consequences. With this caution in mind, we believe both states have made favorable changes to their respective systems and the politicians involved should be congratulated for a job well done. In California, there are favorable changes other than those taken into account from a short-term financial point of view, which may provide additional benefits in the future, although it will take some time before the financial impact becomes clear.
20
THE CORNERSTONE OF THE CALIFORNIA SYSTEM IS THAT ALL MATTERS
RELATING TO CONSTRUCTION OF LAW ARE TO BE LIBERALLY CONSTRUED
IN FAVOR OF THE CLAIMANT; FACTS ARE DETERMINED BY A
PREPONDERANCE OF THE EVIDENCE.
Unfortunately, we think this latter point has been overlooked due to political rhetoric trying to claim credit for the largest amount of short-term savings. We certainly do not know how to measure the impact of the utilization guidelines mentioned above which presently do not even exist, much less how they will be interpreted and applied when they do exist, if they are then implemented.
ADDITIONAL CALIFORNIA REFORMS
The Governor and Legislators should make sure that legislated reforms previously enacted are implemented as intended. This will require considerable training of judges, attorneys, medical providers and claims personnel, and will not happen quickly.
We do not favor limiting payments to legitimately injured workers, but we do believe that the subjective nature of the permanent disability system and the delays in the dispute resolution system provide legitimate focus for change. For example, the excessive number of weeks of temporary disability payments in non-serious injuries must be controlled in California, as is the case in several other states. The rules governing benefits where allegations involve multiple body parts need to be clarified and modifications are required to deal with pre-existing conditions. Also, consistency, timeliness and productivity must be incorporated into the dispute resolution system. The lack of productivity and timely resolution of disputes increases costs and therefore premiums. Since dispute resolution in the trial courts of California has been speeded up significantly, it is reasonable to believe that the same thing can be accomplished in the workers' compensation system. The statutory authority for a Court Administrator exists, but the Governor has not appointed anyone to this position.
Further, we support any legislative changes that are specific and quantifiable leading to lower prices, but are mindful of the political difficulty in accomplishing such results. If policy makers are serious about further reforms, they must start with a fundamental change in the philosophy of the system. At present, the perception of the system is that all matters are to be liberally construed in
21
PRICE COMPETITION PROVIDES THE BEST SYSTEM FOR EMPLOYERS, ALLOWING
FOR REGIONAL PRICE DIFFERENTIALS BASED ON COSTS, AND THE PREVENTION
OF POLITICAL INTERFERENCE IN THE RATE MAKING PROCESS.
favor of the injured worker. This is not the case with the facts, which are to be determined, as in all civil proceedings, by a preponderance of the evidence. We would argue that these principles are not clearly understood and that until this system is based on fairness to all parties, alleged additional reforms to the disability system will be speculative at best in substantially reducing costs.
Some politicians, labor unions and applicant attorney groups argue that our prices must be regulated by the Insurance Commissioner. We disagree! Price competition provides the best system for our customers. It allows for regional price differentials based on costs and prevents political interference in the rate making process. Certainly the re-introduction of rate regulation in California, with its potential for politicization of the process, will not attract new entrants or capital to the marketplace and will do nothing to change the cost trends observed by both insurers and self-insurers alike. Interestingly, the California Insurance Commissioner does not request or support regulation of workers' compensation insurance rates.
REINSURANCE ASSUMED BUSINESS
Since 1985, TheZenith has been selectively underwriting assumed treaty and facultative reinsurance and our combined ratio has averaged 100.3%. Reinsurance represents 5.7% of our property-casualty volume, while reinsurance loss reserves represent 13.6% of our total property-casualty loss reserves. We believe this business will continue to provide long-term profitable diversification to our basic workers' compensation operations.
During 2003, net written premium of this operation was $51.2 million compared to $58.8 million in 2002. Earned premium was $61.0 million compared to $53.2 million the prior year. Underwriting profits of $9.6 million were recorded in 2003 compared to $7.6 million the prior year. During the past two years, the majority of written premium was derived from worldwide catastrophe business.
22
REINSURANCE, PRIMARILY PROPERTY CATASTROPHE, PROVIDES PROFITABLE
DIVERSIFICATION.
Accounting for the property catastrophe reinsurance business has a different result from our other property-casualty business. At the end of each reporting period, income is recognized without reserves being established if no major catastrophe has occurred. In our other businesses, reserves are mandated based upon actual events as well as expected loss patterns. As a result, there may be large fluctuations (positive or negative) in underwriting results for the property catastrophe reinsurance business in the short-term since only actual events are considered and estimates are then established. Estimating an unprecedented loss such as September 11, with significant disputes already pending, is not an exact science. During 2003 and 2002, we did not change our estimates of the September 11 losses, and we have paid $30.0 million, or 63% of the total loss estimate of $48.0 million.
As previously reported, we now own 20.9% of Advent Capital (Holdings) PLC, a Lloyd's reinsurance vehicle, which operates Lloyd's Syndicate 780. We are accounting for this investment under the equity method with a quarter lag. Although the equity method does not record our percentage share of Advent Capital premium in our revenues, from an analytical point of view, our 20.9% ownership of Advent Capital would approximate about $34 million of additional annual reinsurance premium. Advent Capital specializes in worldwide property catastrophe reinsurance and certain other coverages and our 2003 financial statements include $2.8 million after tax for our proportionate share of Advent Capital's net income.
CORPORATE GOVERNANCE
Zenith is strongly committed to the principles of excellent corporate governance. Except for myself, the members of your Board of Directors are all independent of management. There are three Board Committees, each also consisting of independent members: An Audit Committee, a Nominating and Corporate Governance Committee, and a Compensation Committee. Please visit our web site,
23
TECHNOLOGY SYSTEMS ARE BEING BUILT TO SUPPORT RAPID ADAPTATION OF
BUSINESS DYNAMICS, INTERFACES WITH MULTIPLE PARTNERS, STREAMLINED
DATA DELIVERY, AND WORKFLOW STANDARDIZATION AROUND BEST PRACTICES.
www.thezenith.com, where you can read the charters of these committees, our corporate governance guidelines and our codes of ethics. In addition to its regular meetings, the Board has met, and will be meeting routinely in executive sessions, without the participation of management.
Our Audit Committee is independent and extremely well qualified. The Chairman is Michael Zavis, a Chicago attorney who built a major law firm, practiced business law and has demonstrated for several years that he is highly qualified to chair this Committee. Mr. Gerald Tsai has been designated a financial expert under the rules of the Securities and Exchange Commission, and Messrs. Leon Panetta and Robert Miller are individuals with long government experience dealing with complex budget and financial issues and each with private sector experience as corporate directors.
We have had an Internal Audit Department for a number of years. We also outsource certain internal audit and other quality assurance activities to independent consulting firms. We have established a Disclosure Committee of senior executives to gather and assess all relevant information about the Company in order to assure that our disclosures are timely and complete.
Under the Sarbanes-Oxley Act of 2002, we will be required to include an internal control report, commencing with our 2004 Annual Report, containing management's assertions regarding the effectiveness of the company's internal controls over financial reporting. As of year-end, we had completed the necessary documentation and evaluation of our internal controls over financial reporting and we believe that quality controls are already in place. Using our intranet, we have built a sustainable, long-term repository for internal control documentation, monitoring and testing. We are well-positioned to be in full compliance with the above requirements.
INFORMATION TECHNOLOGY
Improving the functionality of our claims systems and delivering services via web-based technologies are our two primary objectives. We are building our systems around an architecture that
24
ZENITH IS STRONGLY COMMITTED TO THE PRINCIPLES OF PROPER
CORPORATE GOVERNANCE; EXCEPT FOR MYSELF, THE MEMBERS OF
YOUR BOARD OF DIRECTORS ARE ALL INDEPENDENT OF MANAGEMENT.
will support more rapid adaptation to changing business dynamics, interfaces with multiple business partners, improved and streamlined critical information delivery and the standardization of workflows around best practices. This improved method of integrating services is commonly referred to as "web services technology." Additionally, we are focused on consolidating our three separate systems into a single national platform. Certain significant milestones were achieved in 2003. For example, we completely retired one of the three legacy systems involved in our consolidation project and all of our policies are now issued from a single system. Also, we implemented an optical character recognition (OCR) system for medical bill processing; a web-based portal for internal data reporting and further expanded a major E-commerce relationship from California into Florida, our second largest state.
We are pleased with interest in, and access to, our website: www.thezenith.com. During 2003 there were more than 500,000 visits to our website with more than 5,000 copies of the 2002 Annual Report downloaded.
ACCOUNTING DISCLOSURE
Our financial statements include full disclosure of the accounting policies, estimates and judgments used in their preparation. As we have discussed in previous reports, estimation of loss reserves is a significant component of the preparation of our financial statements. Our cost of goods sold (losses incurred) are not quantifiable with a high degree of certainty for several years until a large percentage of the claims for a given year are resolved.
Our workers' compensation actuaries perform comprehensive actuarial analysis every quarter and consider several methods of projecting reserves, the most important of which is trending paid losses and tracking specifically permanent partial disability claims, the most costly. Assumptions are required to estimate reserves and the key assumption presently being used is that the most recent paid loss inflation trends for medical and indemnity should be reflected in our estimates of ultimate losses. We
25
SKILLED, EXPERIENCED INSURANCE TALENT FOCUSED ON OUR SERVICE
MISSION IS OUR MOST IMPORTANT ASSET.
discuss loss reserve estimates and other important accounting matters on pages 7-8, in the Management's Discussion and Analysis and in the Notes to Consolidated Financial Statements included in this report.
CONCLUSION
Zenith is in the business of managing insurance and investment risk on a profitable basis over the long-term. We are encouraged by the demand for our workers' compensation policies, the growth in cash flow, the increase in size of our investment portfolio and the achievement of a return on equity of 18.8% in 2003. The record profitable growth of our business this past year is a remarkable achievement of our entire organization. We believe our company is in the strongest financial condition that it has been in for quite some time.
Our current accident year results are excellent. As a result, our profitability improved and favorable trends continue. We are hopeful of building upon and improving these trends in the current year. Our major unknown continues to be the risk inherent in the performance of our prior year reserves, an inherent risk in our business. We have built double-digit loss cost trends in our pricing models and reserve estimates and believe that our reserves are adequate and conservatively stated.
Expectations are for favorable pricing and growth, along with the recent reforms in California and Florida, to produce healthy cash flows to pay claims and to increase investable funds. The momentum of our business and focused service strategies should continue to produce favorable operating fundamentals. This is essential to build surplus and improve ratings that were negatively impacted during the long period of predatory pricing by competitors. Underwriting discipline and sustainable profitability are necessities. Long-term additional reforms to the California workers' compensation system are a possibility, but politics in California after the recall campaign are difficult to predict. Certainly, reforms that improve the system should provide greater predictability to our financial results.
26
MOMENTUM OF OUR GROWING BUSINESS AND FOCUSED SERVICE
STRATEGIES SHOULD DELIVER POLICYHOLDER BENEFITS AND
ENHANCE SHAREHOLDER VALUE.
Our most important asset is our people. Skilled, experienced insurance talent is the backbone of our business. Due to our growth, we have added additional management and staff to our workforce. We continue our internal training efforts and improvements in technology in order to enhance the potential of our employees, both individually and as members of teams. We are quite proud of the accomplishments of our entire organization and their self-motivated desire to improve their already high level of performance as the size and complexity of our business continue to grow.
Our investment portfolio is liquid and of high quality. We have large sums due in one year or less to invest and anticipate strong cash flow this year. Our focus is on improving investment income in a conservative manner so that principal values remain relatively stable as the economy strengthens and inflation expectations fluctuate.
We appreciate the confidence of our agents, brokers, policyholders, reinsurers, investors and shareholders and the wisdom and judgment of our distinguished Directors. Their interaction and teamwork with our excellent employees provide a unique culture driving our focused services. Our specialist strategy distinguishes TheZenith from many of its competitors and delivers substantial policyholder benefits and thereby creation of shareholder value.
In conclusion, we are strong financially and operationally and are well positioned to pursue opportunities.

Stanley R. Zax
Chairman of the Board and President
Woodland Hills, California, March 2004
27
MANAGEMENT'S DISCUSSION AND ANALYSIS
OF CONSOLIDATED FINANCIAL CONDITION
AND RESULTS OF OPERATIONS
Zenith National Insurance Corp. ("Zenith National") is a holding company engaged, through its wholly-owned subsidiaries (primarily Zenith Insurance Company ("Zenith Insurance")), in the property and casualty insurance business. Unless otherwise indicated, all references to "Zenith," "we," "us," "our," the "Company" or similar terms refer to Zenith National together with its subsidiaries.
The Private Securities Litigation Reform Act of 1995 provides a safe harbor for forward-looking statements if accompanied by meaningful cautionary statements identifying important factors that could cause actual results to differ materially from those discussed. Forward-looking statements include those related to the plans and objectives of management for future operations, future economic performance, or projections of revenues, income, earnings per share, capital expenditures, dividends, capital structure, or other financial items. Statements containing words such asexpect, anticipate, believe, estimate, or similar words that are used in this Management's Discussion and Analysis of Consolidated Financial Condition and Results of Operations ("MD&A"), in other parts of this report or in other written or oral information conveyed by or on behalf of Zenith, are intended to identify forward-looking statements. The Company undertakes no obligation to update such forward-looking statements, which are subject to a number of risks and uncertainties that could cause actual results to differ materially from those projected. These risks and uncertainties include, but are not limited to, the following: (1) competition; (2) adverse state and federal legislation and regulation; (3) changes in interest rates causing fluctuations of investment income and fair values of investments; (4) changes in the frequency and severity of claims and catastrophes; (5) adequacy of loss reserves; (6) changing environment for controlling medical, legal and rehabilitation costs, as well as fraud and abuse; (7) losses associated with any terrorist attacks that impact our workers' compensation business in excess of our reinsurance protection; and (8) other risks detailed herein and from time to time in Zenith's other reports and filings with the Securities and Exchange Commission (the "SEC").
Overview
Zenith is in the business of managing insurance risk and investment risk with the major risk factors set forth in the preceding paragraph. Our main business activity is the workers' compensation insurance business and we also operate a small assumed reinsurance business. We measure our performance by our ability to build increased stockholders' equity over the long-term. Following is a summary of how our business has performed recently and how we expect the trends to continue for the foreseeable future:
1) Revenues. In each of the three years ended December 31, 2003, we have consistently increased our premium revenues in our workers' compensation business, as a result of rate increases and additional policies. We expect that revenue growth will continue, but at a slower pace as recent reform legislation in our key states moderate the increases in underlying claim costs.
2) Income (loss) from Workers' Compensation Operations. For many years, we have recorded losses in our workers' compensation business but in 2003 we made substantial progress against this trend and recorded income from our Workers' Compensation operations. We expect to continue to record income from our Workers' Compensation operations because our rate increases are higher than our current estimates of increases in loss costs.
3) Loss reserves. In the last few years, our loss reserve estimates have proven to be
28
inadequate by relatively small amounts. As of the end of 2003, we believe our estimates have a lower risk of adverse development in the future because of the assumptions we have made to estimate the underlying claim costs and, in addition, recent reform legislation will mitigate the trend of increasing costs.
4) Financial condition. At the end of 2003, the capital adequacy of our insurance operations has improved, after several years of declines and ratings downgrades. In addition to net income in 2003, our capital resources were further enhanced when we sold $125.0 million of 5.75% Convertible Senior Notes due March 30, 2023 (the "Convertible Notes"). If we continue to record income from operations in our Workers' Compensation and Reinsurance Businesses, we expect that our financial condition will improve further.
5) Investments and investment income. We have increased our investment portfolio in each of the last three years as a result of favorable cash flow from our growing workers' compensation business. However, our investment income has not increased correspondingly due to the trend of lower interest rates. In 2003, the increase in our investment portfolio more than offset the decline in interest rates and we expect that current levels of cash flow will continue to generate increased investment income. In 2003, we also generated capital gains of $19.4 million, but we cannot predict future capital gains or losses with any reasonable certainty.
6) Stockholders' equity. Our stockholders' equity declined for several years after 1999 because of losses in our workers' compensation business and catastrophe losses in our reinsurance business. In 2002, stockholders' equity increased modestly and in 2003, we increased stockholders' equity per share from $16.89 at December 31, 2002 to $20.27 at December 31, 2003, principally as a result of net income which represented a return on average equity of 18.8% in 2003.
More information about these key elements of our performance follows below.
Results of Operations
Summary Results by Segment. The comparative components of net income (loss) for the three years ended December 31, 2003 are set forth in the following table. Our business is comprised of the following segments: Investments; Workers' Compensation; Reinsurance; and Parent. Results of the Investments segment include investment income and realized gains and losses on investments and we do not allocate investment income to our Workers' Compensation or Reinsurance segments. Income (loss) from operations of the Workers' Compensation and Reinsurance segments is determined solely by deducting from net premiums earned, net losses and loss adjustment expenses incurred and underwriting and other operating expenses incurred. The results of the Parent segment include interest
29
expense and the general operating expenses of Zenith National.
| (Dollars in thousands) | 2003 | 2002 | 2001 | ||||||||
|---|---|---|---|---|---|---|---|---|---|---|---|
| Net investment income | $ | 56,103 | $ | 48,811 | $ | 51,178 | |||||
| Realized gains (losses) on investments | 19,433 | (3,631 | ) | 9,169 | |||||||
| Income from Investment operations | 75,536 | 45,180 | 60,347 | ||||||||
| Income (loss) from operations of: | |||||||||||
| Workers' Compensation | 29,260 | (43,848 | ) | (58,329 | ) | ||||||
| Reinsurance | 9,562 | 7,644 | (31,918 | ) | |||||||
| Parent | (17,694 | ) | (10,237 | ) | (11,402 | ) | |||||
| Income (loss) from continuing operations before tax and before equity in earnings of investee | 96,664 | (1,261 | ) | (41,302 | ) | ||||||
| Income tax expense (benefit) | 33,664 | (914 | ) | (13,756 | ) | ||||||
| Income (loss) from continuing operations before equity in earnings of investee | 63,000 | (347 | ) | (27,546 | ) | ||||||
| Equity in earnings (losses) of investee after tax | 2,846 | 1,363 | (2,060 | ) | |||||||
| Income (loss) from continuing operations after tax | 65,846 | 1,016 | (29,606 | ) | |||||||
| Income from discontinued operations after tax | 1,154 | 9,184 | 3,746 | ||||||||
| Net income (loss) | $ | 67,000 | $ | 10,200 | $ | (25,860 | ) | ||||
Results of continuing operations improved in 2003 compared to 2002 and in 2002 compared to 2001 principally as a result of improved results of operations in the Workers' Compensation segment and because the results of the Reinsurance segment in 2001 included approximately $37.6 million for our share of losses associated with the World Trade Center.
The key operating goal for our insurance business is to achieve a combined ratio of 100% or lower. The combined ratio, expressed as a percentage, is the key measure of underwriting profitability traditionally used in the property-casualty insurance business. It is the sum of net incurred loss and loss adjustment expenses, underwriting and other operating expenses expressed as a percentage of net premiums earned. Results of the workers' compensation and reinsurance operations for the three years ended December 31, 2003 are set forth in the table that follows:
| (Dollars in thousands) | 2003 | 2002 | 2001 | |||||||||
|---|---|---|---|---|---|---|---|---|---|---|---|---|
| Premiums earned: | ||||||||||||
| Workers' compensation: | ||||||||||||
| California | $ | 458,312 | $ | 277,120 | $ | 205,835 | ||||||
| Outside California | 254,484 | 226,739 | 210,013 | |||||||||
| Total workers' compensation | 712,796 | 503,859 | 415,848 | |||||||||
| Reinsurance | 61,003 | 53,196 | 61,028 | |||||||||
| Total | $ | 773,799 | $ | 557,055 | $ | 476,876 | ||||||
| Income (loss) from operations before tax: | ||||||||||||
| Workers' compensation | $ | 29,260 | $ | (43,848 | ) | $ | (58,329 | ) | ||||
| Reinsurance | $ | 9,562 | $ | 7,644 | $ | (31,918 | ) | |||||
| Combined loss and expense ratios: | 2003 | 2002 | 2001 | |||||
|---|---|---|---|---|---|---|---|---|
| Workers' compensation: | ||||||||
| Loss and loss adjustment expenses(1) | 69.9 | % | 76.7 | % | 79.4 | % | ||
| Underwriting and other operating expenses(1) | 26.0 | 32.0 | 34.6 | |||||
| Combined ratio | 95.9 | % | 108.7 | % | 114.0 | % | ||
| Reinsurance: | ||||||||
| Loss and loss adjustment expenses | 65.5 | % | 64.7 | % | 136.9 | % | ||
| Underwriting and other operating expenses | 18.8 | 20.9 | 15.4 | |||||
| Combined ratio | 84.3 | % | 85.6 | % | 152.3 | % | ||
(1) Certain prior period workers' compensation operating expenses have been reclassified to conform to the current presentation (see Note 25 to the Consolidated Financial Statements).
The improvement trend in our net income and combined ratios from 2001 to 2003 exhibits the current favorable trend of increased workers' compensation rates and premium revenues and the growth of our investment portfolio through favorable cash flow from insurance operations. These trends are continuing in the first quarter of 2004, as we have further added to our premium revenues and investment portfolio. However, revenue growth is not an independent objective; we will continue to focus on rate adequacy, attractive returns to our stockholders and the delivery of quality services to our policyholders. The principal risks to the future profitability of our business are related to 1) the adequacy of our loss reserve estimates; 2) competition and industry pricing; 3) general
30
levels of interest rates; 4) the frequency and severity of claims and catastrophes; 5) the impact of enacted reform legislation in California and Florida and any future legislative changes; and 6) the incidence and magnitude of any terrorist attacks that affect our workers' compensation business in excess of our reinsurance protection.
Workers' Compensation Operations. In the workers' compensation business, we provide insurance coverage for the statutorily prescribed benefits that employers are required to provide to their employees who may be injured in the course of employment. In this line of business, injuries and claims are expected to happen and this fact presents us with two significant challenges. First, we must estimate, in advance, the expected cost of the claims that will occur during the term of the policies that we have written. Because we do not know the actual "cost of goods sold" until many years after our policies have expired and the claims have been paid, we may make decisions today about our prices and about significant estimates for policy liabilities in our financial statements that may prove to have materially different outcomes several years from now. In addition to the challenge of estimating our own loss costs, we must also recognize and manage the fact that our competitors will sometimes make different decisions about estimated loss costs and our prices may sometimes substantially exceed theirs. We have established a long standing operating principle that we will strive for adequate rates and not discount our prices in order to maintain market share or revenue goals. As a result, our workers' compensation premium revenues may fluctuate depending on the behavior of our competitors and other factors. During periods of contraction, our profitability will be impacted by the need to maintain and pay for our considerable service infrastructure from a smaller revenue base (which will result in an increase to our expense ratio). When we grow our business, our profitability will benefit from a reduced expense ratio. Beginning in 2000 and continuing through 2003, competitive conditions in the workers' compensation industry have improved and we have increased our revenues, although industry results continue to be unsatisfactory according to data from the National Council for Compensation Insurance ("NCCI").
Second, the ultimate amount we pay for the claims that are reported to us is determined, in part, by our efforts to manage that outcome. We devote considerable resources to try to effectively manage workers' compensation claims and we strive to control the cost of delivering appropriate benefits in an environment that includes significant regulation, continuous legislative changes, fraud and abuse. We describe in more detail the principal uncertainties involved in estimating and managing loss costs and our approach to managing this risk below under "Loss Reserves."
Rising costs in recent years have necessitated significant rate increases, particularly in California. Our workers' compensation revenues have increased in each of the last three years, reflecting this pricing trend and also from additional policies. The combined ratio of our workers' compensation business has improved in each of the last three years as rate increases have outpaced the growth in estimated loss costs, leading to lower loss ratios and lower expense ratios.
Premiums and number of policies in-force in California and outside of California were as follows. In-force premiums are a measure of the
31
amount of premiums billed or to be billed on all un-expired policies at the date shown:
| | California | Outside of California | ||||||||
|---|---|---|---|---|---|---|---|---|---|---|
| December 31, (Dollars in millions) | Premiums in-force | Policies in-force | Premiums in-force | Policies in-force | ||||||
| 2003 | $ | 587.9 | 25,900 | $ | 277.8 | 15,600 | ||||
| 2002 | 350.2 | 22,600 | 259.2 | 16,900 | ||||||
| 2001 | 210.4 | 19,100 | 209.7 | 16,400 | ||||||
Overall effective rate increases were about 35% in 2003 and 19% in 2002, including rate increases in California of 46% and 27% in 2003 and 2002, respectively. Although we have increased our premiums significantly in 2003 and 2002, we believe that the increases in premiums in-force are substantially higher than the increases in underlying exposure to covered employees at risk of injury. We also believe that payroll is our best indicator of exposure. For policies incepting in 2003 and 2002, we estimate that the underlying payroll associated with our policies in-force increased by smaller percentages than the increases in premiums during the same periods:
| | Annual Increase in Insured Payroll | ||||
|---|---|---|---|---|---|
| Policies Incepted in the Year | California Only | Total Company | |||
| 2003 | 15 | % | 5 | % | |
| 2002 | 12 | 13 | |||
Net premiums earned in 2003 and 2002 are net of $78.5 million and $36.8 million, respectively, of ceded earned premiums under a 10% quota share reinsurance agreement with a subsidiary of Fairfax Financial Holdings Limited, a Toronto based financial services holding company ("Fairfax"), effective January 1, 2002 on policies written on or after January 1, 2002. The effect of this quota share agreement is discussed further under "Liquidity and Capital Resources."
Workers' Compensation Legislation in California and Florida. During 2003, Zenith wrote workers' compensation insurance in 45 states, but the largest concentrations, 64% and 18% of the workers' compensation premiums earned during 2003, were in California and Florida, respectively. The concentration of Zenith's business in these states makes the results of operations highly dependent on the states' economic, social and cultural trends, legislative and regulatory changes, and catastrophic events such as windstorms and earthquakes.
In California, significant workers' compensation legislation was enacted twice in recent years. Effective January 1, 2003, legislation provided for increases in indemnity benefits to injured workers. Benefits were increased by an average of approximately 6% in 2003, followed by further increases of approximately 7% in 2004 and will be increased by a further 2% in 2005. In September of 2003, workers' compensation legislation was enacted in California with the principal objective of reducing costs. The legislation contains provisions which primarily seek to reduce medical costs and does not directly impact indemnity payments to injured workers. The principal changes in the legislation that impact medical costs are as follows: 1) a reduction in the reimbursable amount for certain physician fees, outpatient surgeries, pharmaceutical products and certain durable medical equipment; 2) a limitation on the number of chiropractor or physical therapy office visits; 3) the introduction of medical utilization guidelines; 4) a requirement for second opinions on certain spinal surgeries; and 5) a repeal of the presumption of correctness afforded to the treating physician, except where the employee has pre-designated a treating physician.
In addition, the recent California legislation establishes, with some exceptions, a prohibition on doctors referring their workers' compensation patients to outpatient surgery centers in which they have a financial interest, changes the number of working days allowed by an insurance company to pay medical bills and increases penalties for late payment of
32
medical bills. The other substantive change included in the legislation that does not relate to medical costs is a repeal of certain vocational rehabilitation benefits.
In California, insurance companies are required by law to set adequate workers' compensation insurance rates for their own use. Under the recent legislation in California, Zenith Insurance must certify that its workers' compensation rates for January 1, 2004 reflect the reduction in costs from such reform legislation. On November 12, 2003, Zenith Insurance filed with the California Department of Insurance its California workers' compensation rates for use on or after January 1, 2004 that reflect an overall average rate change of 0% when compared to Zenith's rates in effect since July 1, 2003. Zenith's rate filing of November 12, 2003 includes all of the estimated cost savings from the legislation and the required certification and these rates are currently in effect as filed.
In Florida, legislation was enacted effective October 1, 2003 which provides changes to the workers' compensation system. Such changes are designed to expedite the dispute resolution process, provide greater compliance and enforcement authority to combat fraud, revise certain indemnity benefits and increase medical reimbursement fees for physicians and surgical procedures. One of the intended outcomes of the proposed legislation is a reduction in the overall costs associated with delivering workers' compensation benefits in the state of Florida. The rates that we and other insurance companies use for workers' compensation insurance in Florida are set by the Florida Department of Insurance ("Florida DOI"). The Florida DOI has decreased rates by 14%, effective October 1, 2003, which offsets the 13.7% increase in rates as of April 1, 2003.
In both California and Florida, the major risk factor associated with these recent legislative changes is whether the current rates we are using for our workers' compensation policies are justified by the estimated savings in the legislation. We are monitoring the data closely to see how the facts develop relative to this risk.
Reinsurance Operations. In assumed reinsurance, we provide coverage that protects other insurance and reinsurance companies from the accumulation of large losses from natural disasters, known as "catastrophes" in the insurance business. The expectation is that, over the long-run, we will receive claims with a high severity and low frequency. Results of the reinsurance operations will be favorable in the absence of catastrophes and may be unfavorable in periods when they occur. Consequently, the results of operations will fluctuate and this business should be evaluated over the long-run. Since its inception in 1985, the combined ratio of the reinsurance operations through December 31, 2003 was 100.3%.
In 2002, estimated catastrophe losses were $0.4 million before tax attributable to European floods. Otherwise, there were no major catastrophe losses that impacted the reinsurance treaties we wrote in the years ended December 31, 2003 and 2002 and our combined ratios for reinsurance were comparable between these two years. In 2001, the reinsurance operations were adversely impacted by $41.7 million of catastrophe losses before tax, including $37.6 million for the World Trade Center loss, net of additional premium income earned in the year attributable to original and reinstatement premiums. Estimating catastrophe losses in the reinsurance business is highly dependent upon the nature and timing of the event and Zenith's ability to obtain timely and accurate information with which to estimate its liability to pay losses. Estimates of the impact of catastrophes on the reinsurance operations are based on the information that is currently available and such estimates could change based on new information that becomes available or
33
based upon reinterpretation of existing information.
The ultimate impact of the World Trade Center loss of 2001 after deducting original and reinstatement premium income on Zenith's assumed reinsurance contracts for 2001 is estimated to be $20.0 million before tax, or $13.0 million after tax. Our assumed reinsurance business is written so that the exposure to reinsurance losses from any one event in a worst-case scenario, after the benefit of the applicable premium and reinstatement premium and income taxes, is not expected to be more than approximately 5% of Zenith's consolidated stockholders' equity (or about $19 million). The expected ultimate loss for the World Trade Center of $13.0 million after tax is within the 5% maximum.
Equity Investee — Advent Capital. We also participate in the worldwide reinsurance business through an investment in a company that operates in the property and casualty insurance business in the United Kingdom. On August 23, 2002, Zenith Insurance acquired 19.2 million Ordinary Shares of Advent Capital (Holdings) PLC ("Advent Capital") for $14.6 million in an open offer and placing of shares made in July 2002. As a result of the purchase, Zenith Insurance owns approximately 20.9% of the outstanding shares of Advent Capital. Advent Capital and its subsidiaries provide corporate capital to support the underwriting of certain Lloyd's of London syndicates and manage those syndicates. The syndicates operate in the global insurance and reinsurance business with an emphasis on property catastrophe reinsurance.
Prior to August 23, 2002, Zenith Insurance owned approximately 6.3% of the outstanding shares of Advent Capital and accounted for the investment on the cost basis. As of August 23, 2002, we are accounting for the investment in Advent Capital using the equity method of accounting, on a one quarter lag to allow sufficient time for Advent Capital to prepare its financial statements. The equity method was retroactively applied to 2001. The carrying value of the investment in the common stock of Advent Capital is equal to Zenith's equity in the underlying net assets of Advent Capital. The carrying value at December 31, 2003 and 2002 was $25.2 million and $18.3 million, respectively, including goodwill of approximately $11 million. Fairfax also participated in the open offer and placing of shares by Advent Capital and after the purchase, through its subsidiaries, Fairfax owns approximately 47% of the outstanding shares of Advent Capital at December 31, 2003.
As is the case with our own reinsurance business, Advent Capital's results of operations and our share of Advent Capital's net income is subject to fluctuations caused by catastrophe losses. The loss in 2001 was attributable to losses associated with the attack on the World Trade Center. Our share of Advent Capital's income in 2003 was reduced by about $0.9 million by adverse development of the World Trade Center loss recorded by Advent Capital in 2003. Our exposure to any losses associated with our investment in Advent Capital is limited to the carrying value of our investment.
Parent. The holding company activities of Zenith National are presented as parent expenses and interest expense in our financial statements. Interest expense was higher in 2003 because of the additional interest incurred on the $125.0 million of Convertible Notes that we issued in March of 2003.
Investment Income. Investment income and realized gains and losses are discussed below under "Investments."
Critical Accounting Policies and Estimates
The preparation of financial statements in accordance with generally accepted accounting principles ("GAAP") requires both the use of
34
estimates and judgment relative to the application of appropriate accounting policies. Zenith's accounting policies are described in the Notes to Consolidated Financial Statements, but we believe that the following matters are particularly important to an understanding of Zenith's financial statements because changes in these estimates or changes in the assumptions used to make them could have a material impact on the results of operations, financial condition and cash flows.
Loss Reserve Estimation. Accounting for property and casualty insurance operations requires us to estimate the liability for the ultimate cost of unpaid losses and loss adjustment expenses ("loss reserves") as of the balance sheet date. Estimates of loss reserves are inherently uncertain because the ultimate amount we pay under many of the claims we have incurred as of the balance sheet date will not be known for many years. The amount by which estimated losses, measured subsequently by reference to payments and additional estimates, differ from those originally reported for a period is known as "development." Development is unfavorable when losses ultimately settle for more than the levels at which they were reserved or subsequent estimates indicate a basis for reserve increases on open claims. Development is favorable when losses ultimately settle for less than the amount reserved or subsequent estimates indicate a basis for reducing loss reserves on open claims. Favorable or unfavorable development of loss reserves is reflected currently in earnings. The impact of loss reserve development on the results of operations in each of the three years ended December 31, 2003 is discussed below under "Loss Reserves." Also included is a discussion of some of the assumptions underlying our loss reserve estimates and the sensitivity of our loss reserve estimates to our important assumptions.
Investments. The majority of our investments are investments in fixed maturity or equity securities, which are recorded at their fair values. Changes in these fair values are reflected as a separate component of stockholders' equity. However, when, in the opinion of management, a decline in the fair value of an investment is considered to be "other-than-temporary," such investment is written-down to its fair value and the amount written-down is reflected in earnings as a realized loss. The determination of other-than-temporary includes, in addition to other relevant factors, a presumption that if the market value is below cost by a significant amount for a period of time, a write-down is necessary. Notwithstanding this presumption, the determination of other-than-temporary impairment requires judgment about future prospects for an investment and is therefore a matter of inherent uncertainty. In some cases we have recognized gains upon the sale of investments that we had previously written-down. A discussion of investment write-downs is set forth under "Investments."
Deferred Policy Acquisition Costs. Certain direct policy acquisition costs consisting of commissions, premium taxes and certain other underwriting costs, are deferred and amortized as the underlying policy premiums are earned. At December 31, 2003 and 2002, deferred policy acquisition costs in our workers' compensation business were $14.0 million and $12.5 million, respectively, related to workers' compensation unearned premiums of $97.9 million and $75.8 million, respectively. If the expected claims costs and other policy-related costs related to the unearned premiums exceeded those unearned premiums, a premium deficiency would exist and policy acquisition costs that otherwise were deferred would be expensed. At December 31, 2003 and 2002, our estimates indicated that there was no premium deficiency and a premium deficiency would not occur until our estimated workers' compensation loss and
35
loss adjustment expense ratio in 2003 was increased by about 19 percentage points. Because our loss ratios are dependent upon our estimates of loss reserves, the same inherent uncertainty that is present in our loss reserve estimates could impact our deferred acquisition costs.
Deferred Income Taxes. Zenith makes provisions for deferred income taxes based on temporary differences between the tax bases and book bases of assets and liabilities. At December 31, 2003 and 2002, Zenith recorded net deferred tax assets of $28.0 million and $32.4 million, respectively, including deferred tax assets of $42.1 million and $35.8 million, respectively, attributable to the fact that the Internal Revenue Code requires property and casualty insurance companies to discount the tax deduction for loss reserves. We do not discount loss reserves in our financial statements. We expect that the net deferred tax asset is fully recoverable because all future deductible amounts associated with temporary differences can be offset by taxes previously paid and by anticipated future taxable income, including investment income. If this assumption were to change, any amount of the net deferred tax asset which we could not expect to recover would be provided for as an allowance and would be reflected as an increase in income tax expense in the period in which it was established.
Loss Reserves
Our loss reserves were as follows:
| December 31, (Dollars in millions) | 2003 | 2002 | 2001 | |||||||
|---|---|---|---|---|---|---|---|---|---|---|
| Workers' compensation: | ||||||||||
| Unpaid loss and loss adjustment expenses | $ | 1,086 | $ | 910 | $ | 802 | ||||
| Receivable from reinsurers and state trust funds for unpaid losses | 230 | 215 | 202 | |||||||
| Unpaid loss and loss adjustment expenses, net of reinsurance | $ | 856 | $ | 695 | $ | 600 | ||||
| Reinsurance: | ||||||||||
| Unpaid loss and loss adjustment expenses | $ | 135 | $ | 132 | $ | 145 | ||||
| Receivable from reinsurers for unpaid losses | 1 | 2 | ||||||||
| Unpaid loss and loss adjustment expenses, net of reinsurance | $ | 135 | $ | 131 | $ | 143 | ||||
| Total: | ||||||||||
| Unpaid loss and loss adjustment expenses | $ | 1,221 | $ | 1,042 | $ | 947 | ||||
| Receivable from reinsurers and state trust funds for unpaid losses | 230 | 216 | 204 | |||||||
| Unpaid loss and loss adjustment expenses, net of reinsurance | $ | 991 | $ | 826 | $ | 743 | ||||
We establish loss reserves in our financial statements that represent an estimate of amounts needed to pay and administer claims with respect to insured and reinsured events that have occurred, including events that have not yet been reported to us. Reserves are estimates and are inherently uncertain; they do not and cannot represent an exact measure of liability. Accordingly, our reserves may prove to be inadequate to cover our actual losses or they may prove to exceed the ultimate amount of our actual losses. In our financial statements, actuarial techniques and methods are utilized to establish the most reasonably accurate estimate of loss reserves. At the end of every quarter, our actuaries perform a comprehensive review of our loss reserves during which they consider the results of various methods of estimation. Generally, the results of any one method of
36
estimation are not appropriate under all circumstances and do not produce reliable estimates for reserves for all accident years. Our actuaries use the results of their estimation methods to produce a single estimate (a "point estimate") of total loss reserves, and not a range of estimates. The estimate of loss reserves at December 31, 2003 as recorded in the financial statements is consistent with the actuarial point estimate.
Our actuaries produce a point estimate using the results of various methods of estimation. However, these various methods do not produce separate point estimates. The point estimate is prepared as follows: Our actuaries prepare reserve estimates based upon paid loss patterns, incurred loss patterns and claim count methods for all accident years. The actuarial point estimate is based on a selection of the results of these various methods depending upon both the age of the accident year and the geographic state of the injury. For more mature accident years, all of the methods produce very similar loss estimates and our actuarial point selections are based upon an average of these methods. For the more recent accident years, our actuarial estimate is based on both the paid loss patterns and assumed rates of inflation. Since the number of claims is relatively certain, the inflation assumption is the key assumption in establishing loss reserve estimates for these years. Management establishes loss reserve estimates in the financial statements that provide for substantial rates of inflation and at December 31, 2003 the loss reserves, net of reinsurance ceded, recorded in the financial statements were $991.0 million compared to the actuarial point estimate of loss reserves, of $978.0 million. We believe that this difference is not significant in the context of the amounts being estimated, because the difference is less than the difference that a change of 1% in the assumed inflation rate would produce. We discuss our inflation assumptions in detail below under Workers' Compensation Loss Reserves.
Any changes in loss reserve estimates are reflected in our results of operations during the period in which the changes are made. Adverse development results in a charge to our earnings and favorable development results in an increase in our earnings. The following table shows the adverse (favorable) one-year loss reserve development for loss reserves in each of the three years ended December 31, 2003. The one-year loss reserve development is the change recorded in the current year for the estimate of the loss reserves established at the end of the preceding year and reflects a cumulative adjustment to all estimates made in prior years.
| (Dollars in thousands) | Workers' Compensation | Reinsurance | Total | |||||||
|---|---|---|---|---|---|---|---|---|---|---|
| One-year loss development in: | ||||||||||
| 2003 | $ | 13,923 | $ | 292 | $ | 14,215 | ||||
| 2002 | 29,346 | (178 | ) | 29,168 | ||||||
| 2001 | 272 | 4,075 | 4,347 | |||||||
The $29.3 million adverse reserve development in 2002 was driven entirely by increased paid loss inflation rates for the 2000 and 2001 years in California workers' compensation. Specifically, the compound inflation rate for medical payments for these two years increased from 12% to 17% in the paid loss data during the third and fourth quarters of 2002. The compound indemnity inflation rate increased from 3% to 9% in the paid loss data during the third and fourth quarters of 2002. The $13.9 million adverse loss reserve development during 2003 reflects another approximate 2% increase in the paid loss inflation rates for the 2000 and 2001 accident years in the first two quarters of 2003.
37
Workers' Compensation Loss Reserves
In our workers' compensation business, we attempt to mitigate the risk of loss reserve development as follows:
(1)Through pricing:
We attempt to estimate our loss costs as accurately as possible, not only to establish reasonable loss reserve estimates but also to provide a basis upon which to establish rates that are adequate to cover such loss costs and our operating expenses and to provide a reasonable return to us. Our workers' compensation rate increases have been substantial in recent years due to the trend of increasing costs, particularly in California. Our overall effective rate increases in 2003 are about 35% compared to 19% in 2002. Included in these changes are increases of 46% in California for 2003 compared to 27% in 2002. In our workers' compensation business, policy premiums are a function of the applicable rate applied to the policyholders' payroll and an experience-based modification factor. We believe that, after taking these rate increases into effect, our earned premiums per $100 dollars of insured payrolls at December 31, 2003 exceed our estimated loss costs per $100 dollars of insured payrolls by a more substantial margin than they have over the last two years. In other words, our price increases are estimated to be greater than our current estimates of increases in underlying loss costs, but due to recent trends, we will not know this with a high degree of confidence for several years.
(2)Through actuarial estimation techniques:
Actuarial estimation techniques require considerable judgment to establish the relevance of historical payment and claim reporting and settlement patterns under current facts and circumstances. The principal uncertainty in our workers' compensation loss reserve estimates at this time is caused by the trend of increasing severity. Severity is the average cost of a claim, which has increased consistently over recent years. The trend of increasing severity, or inflation, is attributable to both increasing medical costs (payments to providers to treat injured workers) and increasing indemnity payments (payments to injured workers for lost wages) per claim. The trend of temporary disability increases in California is growing at three times the rate of permanent disability costs. We have also observed a decline in the number of certain claims being reported over the last several years. The declining frequency of claims contributes to the increasing severity trend because the frequency decline has been concentrated in less expensive claims (claims involving less time-off from work and less severe injuries). We have observed this continuing inflationary trend in the amounts we have already paid out for claims in the most recent accident years, and we have assumed that our estimate of the ultimate cost of these claims, and, therefore, our loss reserve estimates, must reflect substantially similar rates of inflation.
At December 31, 2003, the accident year paid loss inflation rates in our paid loss data and the implied accident year inflation rates in our selections of ultimate losses were as follows:
| | Average Paid Loss per Claim Annual Inflation Evaluated After (Number of Months) | | Implied Inflation in Selected Ultimate Loss Estimate | ||||||||||||
|---|---|---|---|---|---|---|---|---|---|---|---|---|---|---|---|
| Accident Year | 12 | 24 | 36 | 48 | 60 | 72 | |||||||||
| 1998 | 15 | % | 9 | % | 9 | % | 9 | % | 9 | % | 11 | % | 13 | % | |
| 1999 | 14 | 14 | 15 | 14 | 15 | 16 | |||||||||
| 2000 | 2 | 10 | 11 | 13 | 14 | ||||||||||
| 2001 | 18 | 16 | 16 | 19 | |||||||||||
| 2002 | -2 | 2 | 6 | ||||||||||||
| 2003 | 11 | 21 | |||||||||||||
In our workers' compensation business, our loss reserve estimates are most susceptible to material estimation risk in the most recent
38
accident years and we do not typically see significant changes of estimates of accident years that are more than four years old. If the average annual inflation rates in our workers' compensation loss reserve estimates for each of the 2001, 2002 and 2003 accident years were increased or decreased by 1 percentage point in each year, our loss reserve estimates at December 31, 2003 would increase or decrease by about $21 million.
We expect that recent California workers' compensation reform legislation should mitigate the inflation trend as a result of the impact of lower unit medical costs, utilization guidelines and the elimination of the treating physician presumption. Estimates of the effect of the reform legislation published by the California Workers' Compensation Insurance Rating Bureau imply that our loss reserve estimates could be reduced by somewhere between $30 and $40 million. However, these estimates reflect judgments about the changes in behavior of the participants in the California workers' compensation system and are therefore uncertain. If and when paid loss data in California confirms the impact of the legislation, we will reflect the savings in our loss reserve estimates.
In 2003 and 2002, there was adverse loss reserve development of $14.0 million and $30.0 million, respectively. If this had been recognized in the prior periods, our workers' compensation reserves, net of reinsurance, at December 31, 2002 and 2001 would have been higher by approximately 2% and 7%, respectively. As a percentage of workers' compensation premiums earned, adverse development was 2.0% and 6.0% in 2003 and 2002, respectively. The adverse reserve development in 2002 was driven entirely by increased paid loss inflation rates for the 2000 and 2001 years in California workers' compensation. Specifically, the compound inflation rate for medical payments for these two years increased from 12% to 17% in the paid loss data during the third and fourth quarters of 2002. The compound indemnity inflation rate increased from 3% to 9% in the paid loss data during the third and fourth quarters of 2002. The adverse loss reserve development during 2003 reflects another approximate 2% increase in the paid loss inflation rates for the 2000 and 2001 accident years in the first two quarters of 2003.
(3)Through our operations:
Our workers' compensation loss costs can be broadly divided into the categories of medical and indemnity costs. Paid loss inflation trends by category at December 31, 2003 were as follows:
| | Average Medical Paid per Claim Annual Inflation Evaluated After (Number of Months) | ||||||||||
|---|---|---|---|---|---|---|---|---|---|---|---|
| Accident Year | 12 | 24 | 36 | 48 | 60 | ||||||
| 1999 | 13 | % | 16 | % | 16 | % | 15 | % | 15 | % | |
| 2000 | 0 | 10 | 12 | 13 | |||||||
| 2001 | 24 | 19 | 16 | ||||||||
| 2002 | -4 | 0 | |||||||||
| 2003 | 13 | ||||||||||
| | Average Indemnity Paid per Claim Annual Inflation Evaluated After (Number of Months) | ||||||||||
|---|---|---|---|---|---|---|---|---|---|---|---|
| Accident Year | 12 | 24 | 36 | 48 | 60 | ||||||
| 1999 | 19 | % | 12 | % | 15 | % | 14 | % | 16 | % | |
| 2000 | -3 | 6 | 6 | 9 | |||||||
| 2001 | 8 | 12 | 15 | ||||||||
| 2002 | 3 | 2 | |||||||||
| 2003 | 5 | ||||||||||
We are attempting to mitigate the inflation trends and any adverse development as follows:
Medical Costs:
A substantial portion of the treatments for which we provide reimbursement are governed by a fee schedule in most of the states in which we do business. These fee schedules do not impact utilization of services and do not cover
39
all medical costs. Our medical management and legal departments provide the following services:
Bill review and negotiation. Fee schedules and preferred provider networks provide a basic constraint on unit medical costs. However, providers are not required to bill us according to the fee schedule or based on a contractual network rate. We review all medical bills for appropriate coding and adjust the amount we pay to the lower of the fee schedule or the contractual network amount. Bills received in 2003 were about $143 million above the fee schedule and were reduced to the fee schedule by our efforts which include the use of technology provided by an independent bill review company. Disputes are resolved by negotiation or litigation.
Utilization controls. We have seen significant variation among claims in the number and frequency of office visits for items such as physical therapy and chiropractic treatment; the number and cost of MRI's and other sophisticated tests; and the appropriateness of various surgeries, primarily related to back injuries. We utilize medical experts, nurses, protocols and guidelines to control excess utilization and, where appropriate, litigation. Recent California legislation will provide further assistance in controlling utilization which is not medically appropriate.
Pharmacy. Our principal control over the cost of drugs is through the use of pharmacy networks and, after the recent California legislation, a pharmacy fee schedule. We also monitor prescription patterns to identify outliers.
Settlements. In California and Florida and many of the others states in which we conduct our workers' compensation business, we are able to settle and close workers' compensation claims in exchange for lump sum payments. In some claim settlements, only the indemnity component of the claim may be settled and future medical costs will continue. Our ability to execute successful settlement strategies is a significant determinant of our average medical or indemnity cost per claim.
Indemnity Costs:
Disability ratings. Disability payments vary with the extent of injury (the disability rating), the wages of the injured worker and the length of time for which the claimant is unable to work or perform modified duties. Our average disability rating has increased in recent years.
Return-to-work strategies. The number of weeks for which temporary disability payments will be made can be mitigated by returning injured workers to their employment. Our return-to-work specialists and vocational rehabilitation specialists focus their efforts on return-to-work, including return to modified duties or alternative employment.
Benefit changes. Disability benefits are periodically revised by state legislation as was recently the case in California and Florida. These revisions change our average indemnity costs and may impact the frequency of claims. However, these legislative changes in benefits are known in advance and we endeavor to adjust our rates appropriately in response to such changes.
Litigation. Many of our workers' compensation claimants are represented by attorneys. We have not observed a noticeable increase in the proportion of represented claims, but in California, for example, approximately 40% of our claims involving indemnity benefits are represented by attorneys. We use our own in-house attorneys to participate in these claims, which may involve denial of coverage, settlement of contested issues or lump sum settlement amounts.
The inflation trend that we have experienced and which we are currently trying to estimate in our workers' compensation loss reserves may be a result of some of or all of the foregoing matters and our initiatives and recent
40
legislative changes could mitigate the trend. However, there may be other causes that we have not yet identified or the initiatives we have undertaken may be ineffective, in which case we could experience rates of inflation that exceed our current estimates, resulting in adverse loss development in the future.
Reinsurance Loss Reserves
Loss reserve estimates in our reinsurance business are subject to uncertainties that are inherent to the reinsurance business. As a reinsurer, we are further removed from original loss events than we would be as a primary insurer. Therefore, we are subject to longer reporting lags. We are also subject to the estimates that ceding companies make before they determine when, if and how much to report to us. We operate a relatively small book of reinsurance business and therefore our historical data or industry-wide data have only limited value in making estimates of ultimate losses from currently reported paid and reported loss information. When we are estimating losses for catastrophes, our estimates are highly dependent upon the nature and timing of the event and our ability to obtain timely and accurate information with which to estimate our liability to pay losses. Therefore, our loss reserve estimates are subject to a higher risk of development when we report our results of operations after a large catastrophe loss has occurred. There were no major catastrophes that impacted the reinsurance treaties we have written in 2003 and 2002. The last major catastrophe loss we estimated was our share of the losses associated with the terrorist attack on the World Trade Center on September 11, 2001. We have estimated Zenith's share of the World Trade Center loss to be approximately $48.0 million, both gross and net of reinsurance recoverable, by estimating the probable impact to each of its reinsurance contracts based on currently available information. Approximately 70% of our estimated loss is attributable to the contractual maximum loss payable by Zenith under its excess of loss reinsurance contracts and therefore our loss cannot exceed the amount we have estimated and reserved on these contracts. The remainder of the estimated loss is an estimate of expected losses incurred on assumed quota share reinsurance contracts. As a result of the information we have received so far, we have made no changes in the estimate of our share of the World Trade Center loss since the fourth quarter of 2001. As of December 31, 2003, we have paid out approximately 63% of our estimated World Trade Center loss.
41
Loss reserve estimates for catastrophe losses developed unfavorably in 2001. In 1999, the worldwide catastrophe reinsurance business received a large number of claims attributable to a high frequency of natural disasters that year. These included hurricanes, tornadoes, earthquakes in Taiwan and Turkey and severe storms in Europe culminating in two very large storms at the end of December of 1999 in France. The amount of insurable damage in these storms and other events took time to assess and estimate and, therefore, our estimates at the end of 1999 and even at the end of 2000 were subject to the availability and reliability of estimates and claims being reported by the companies we reinsure. As a result of late reporting of claims and changes in estimates by companies we reinsure, we experienced adverse development of our estimates in 2001. In 2001, we raised our estimates of prior year loss reserves by $4.1 million, or 4.2% of the 2000 loss reserve estimate of $97.5 million for our reinsurance business.
Estimates of the impact of the World Trade Center loss and other catastrophes are based on the information that is currently available. Such estimates could change based on any new information that becomes available or based upon reinterpretation of existing information.
Asbestos and Environmental Loss Reserves
Zenith has exposure to asbestos losses in its workers' compensation operations which have not been material to results of operations or financial condition in any year or in the aggregate. In our history, we have paid and closed about 3,400 such asbestos-related workers' compensation claims for a total of $8.9 million, or approximately $2,600 per claim. At the end of 2003, we had about 500 such claims open, and reserved for about $2.8 million, compared to our total workers' compensation loss reserves of $856.3 million.
Zenith also has potential exposure to environmental and asbestos losses and loss adjustment expenses beginning in 1985 through its reinsurance operations, but the business reinsured by Zenith in these operations contains exclusion clauses for such losses. Zenith believes that its reserves for environmental and asbestos losses are currently appropriately established.
Investments
We invest the cash from our capital and from our operations primarily in fixed maturity securities with investment grade ratings. We do this because these investments provide a stable source of income over the long-run, although interest rates for this type of investment have been historically low for the last few years. When we grow our insurance business, we are able to generate more investment income because our investment portfolio increases with favorable cash flow. We have maintained a high proportion of short-term investments and short maturities recently to mitigate the risk of falling prices for fixed maturity securities if rates should rise. Changes in interest rates impact our investment income and cause fluctuations in the carrying values of the majority of our investments (these changes are reflected as changes in stockholders' equity).
In 2003, the increase in the portfolio more than offset declining interest rates resulting in an increase in investment income. Investment income in 2002 was comparable to 2001 because declining interest rates were offset to a lesser extent by increases in available invested assets. The average yields on the investment portfolio in each of the three years ended December 31, 2003 were as follows:
| | 2003 | 2002 | 2001 | ||||
|---|---|---|---|---|---|---|---|
| Before tax(1) | 4.4 | % | 4.9 | % | 5.6 | % | |
| After tax | 2.9 | 3.3 | 3.7 | ||||
(1) Reflects the pre-tax equivalent yield on tax-exempt securities.
42
At December 31, 2003, our investment portfolio was comprised of 71% fixed maturity securities, 19% short-term investments, 4% equity securities and 6% other investments including mortgage loans and our investment in Advent Capital. Fixed maturity securities include primarily corporate debt, U.S. Government securities, municipal bonds and mortgage-backed securities issued by the Government National Mortgage Association ("GNMA"). Of the fixed maturity portfolio, including short-term investments, 97% were rated investment grade at December 31, 2003 compared to 94% at December 31, 2002. The average maturity date of the fixed maturity portfolio, excluding short-term investments, was 7.3 years and 5.7 years at December 31, 2003 and 2002, respectively.
Certain securities, amounting to 91% and 89% of the investments in fixed maturity securities and short-term investments at December 31, 2003 and 2002, respectively, are identified as available-for-sale. Stockholders' equity will fluctuate with changes in the fair values of available-for-sale securities. Stockholders' equity decreased by $2.7 million after deferred tax from December 31, 2002 to December 31, 2003 and increased by $20.2 million after deferred tax from December 31, 2001 to December 31, 2002 as a result of changes in the fair values of such investments.
The unrealized net gain on held-to-maturity and available-for-sale fixed maturity investments were as follows:
| | Held-to-Maturity | Available-for-Sale | |||||||
|---|---|---|---|---|---|---|---|---|---|
| December 31, (Dollars in thousands) | |||||||||
| Before Tax | Before Tax | After Tax | |||||||
| 2003 | $ | 1,812 | $ | 25,708 | $ | 16,710 | |||
| 2002 | 3,768 | 29,821 | 19,384 | ||||||
The fair values of investment securities are generally obtained from market sources. However, the fair values of non-traded fixed maturity securities of $44.4 million at December 31, 2003 were estimated using quantitative analytical techniques to arrive at an estimate of fair value. Such techniques include a comparison of the security to traded securities with similar maturity and credit rating characteristics. The underlying assumption in this methodology is that fair values of non-traded securities can be reasonably estimated because if they were traded, our non-traded securities would probably have market yields similar to traded securities with similar credit and maturity characteristics.
We diversify our corporate debt investments across a number of industries. The largest concentration of corporate debt is in investments in insurance companies (approximately $112.2 million at fair value at December 31, 2003). Investments in corporate debt expose us to the risk of loss of principal in the event of default by the issuer. Also, market prices of both corporate debt and equity investments can fall significantly below the prices at which we acquired the investment. We monitor our portfolio continuously and actively manage our investments to preserve principal values whenever possible. However, when, in the opinion of management, a decline in the fair value of an investment is considered to be other-than-temporary, such investment is written-down to its fair value as a charge to earnings in the form of a reduction of realized gains on investments. The determination of other-than-temporary includes, in addition to other relevant factors, a presumption that if the market value is below cost by a significant amount for a period of time, a write-down is necessary. The amount of any write-downs are
43
determined by the difference between cost or amortized cost of the investment and its fair value at the time the other-than-temporary decline was identified. For the three years ended December 31, 2003, write-downs reduced realized gains on investments as follows:
| Years Ended December 31, (Dollars in millions) | 2003 | 2002 | 2001 | ||||||
|---|---|---|---|---|---|---|---|---|---|
| Write-downs | $ | 2.9 | $ | 11.1 | $ | 12.7 | |||
The write-downs in 2003 were principally attributable to the impairment of two limited partnership investments. Corporate bankruptcies (including WorldCom and Global Crossing) of the issuer accounted for $5.5 million and $4.3 million of the write-downs in 2002 and 2001, respectively. The remaining write-downs in 2002 and 2001 were attributable to the amount and length of time for which fair value of the investment was below cost under the previously described presumption and $2.2 million related to impairment of a limited partnership investment in 2001.
Our internal investments department manages our investment portfolio, and we do not rely on external portfolio managers. We continuously assess the prospects for individual securities as part of ongoing portfolio management, including the identification of other-than-temporary declines in fair values. This process includes reviewing the amount and length of time of unrealized losses on investments, historical and projected company financial performance, company-specific news and other developments, the outlook for industry sectors, credit ratings and macro-economic changes, including government policy initiatives. We believe that we have appropriately identified other-than-temporary declines in fair value in the three years ended December 31, 2003 and that our remaining unrealized losses are not other-than-temporary. We base this conclusion on our current understanding of the issuers of these securities as described above and because we have also established a presumption that an unrealized loss of a significant amount for a specific period of time is other-than-temporary. We have consistently applied this presumption for twelve years. We also have the ability and intent to hold securities with unrealized losses for a sufficient amount of time for them to recover their values or reach maturity. In some cases, securities that we have written-down to their fair values have subsequently recovered some of their values and we have recognized gains when we sold them.
Future earnings would be negatively impacted by any future write-downs of securities associated with other-than-temporary declines of their fair values. Investments that we currently own could be subject to default by the issuer or could suffer declines in value that become other-than-temporary. In some cases, we have acquired corporate debt securities with investment grade ratings that have suffered rapid ratings downgrades and declines in value for reasons that are not easy to determine as events are unfolding. Following is some
44
information about unrealized gains and losses in our investment portfolio:
| | Securities with | ||||||||
|---|---|---|---|---|---|---|---|---|---|
| December 31, 2003 (Dollars in thousands) | Unrealized Losses | Unrealized Gains | |||||||
| Fixed maturity securities: | |||||||||
| Fair value | $ | 335,054 | $ | 746,308 | |||||
| Amortized cost | 340,639 | 713,203 | |||||||
| Unrealized (loss) gain | (5,585 | ) | 33,105 | ||||||
| Fair value as a percentage of amortized cost | 98.4 | % | 104.6 | % | |||||
| Number of security positions held | 59 | 231 | |||||||
| Number individually exceeding $0.5 million (loss) gain | 0 | 6 | |||||||
| Concentration of unrealized gains or losses by type or industry: | |||||||||
| Municipal bonds | $ | (1,711 | ) | $ | 1,028 | ||||
| Machinery, equipment and furniture | (866 | ) | 1,232 | ||||||
| Food and beverage | (632 | ) | 2,321 | ||||||
| Utilities | (473 | ) | 319 | ||||||
| Transportation services | (401 | ) | 1,924 | ||||||
| Petroleum refining | (366 | ) | 1,543 | ||||||
| Financial institutions | (287 | ) | 1,639 | ||||||
| Plastics, materials and synthetics | (242 | ) | 636 | ||||||
| Pharmaceuticals | (170 | ) | 566 | ||||||
| Chemicals | (154 | ) | 614 | ||||||
| GNMA | (93 | ) | 1,991 | ||||||
| Insurance | 7,315 | ||||||||
| Other | (190 | ) | 11,977 | ||||||
| Total | $ | (5,585 | ) | $ | 33,105 | ||||
| Investment grade: | |||||||||
| Fair value | $ | 334,603 | $ | 703,670 | |||||
| Amortized cost | 340,137 | 672,040 | |||||||
| Fair value as a percentage of amortized cost | 98.4 | % | 104.7 | % | |||||
| Non-investment grade: | |||||||||
| Fair value | $ | 451 | $ | 42,638 | |||||
| Amortized cost | 502 | 41,163 | |||||||
| Fair value as a percentage of amortized cost | 89.8 | % | 103.6 | % | |||||
| Equity securities: | |||||||||
| Fair value | $ | 2,418 | $ | 60,543 | |||||
| Cost | 2,448 | 42,004 | |||||||
| Unrealized (loss) gain | (30 | ) | 18,539 | ||||||
| Fair value as a percentage of cost | 98.8 | % | 144.1 | % | |||||
| Number of security positions held | 2 | 21 | |||||||
| Number individually exceeding $0.5 million (loss) gain | 0 | 3 | |||||||
As of December 31, 2003, $15.0 million of the unrealized gain on equity securities is attributable to an investment in 1.0 million shares of common stock of Wynn Resorts, Limited with a cost basis of $13.0 million.
The table that follows sets forth the scheduled maturities of fixed maturity securities at December 31, 2003 based on their fair values.
| | Securities with | |||||
|---|---|---|---|---|---|---|
| December 31, 2003 (Dollars in thousands) | Unrealized Losses | Unrealized Gains | ||||
| 1 year or less | $ | 90,711 | ||||
| After 1 year through 5 years | $ | 130,618 | 248,389 | |||
| After 5 years through 10 years | 96,144 | 306,924 | ||||
| After 10 years | 108,292 | 100,284 | ||||
| $ | 335,054 | $ | 746,308 | |||
The table below sets forth information about fixed maturity securities with unrealized losses at December 31, 2003:
| December 31, 2003 (Dollars in thousands) | Fair Value | Unrealized Losses | %(1) | ||||||
|---|---|---|---|---|---|---|---|---|---|
| Less than 3 months (16 issues) | $ | 188,211 | $ | (529 | ) | 99.7 | % | ||
| 3-6 months (19 issues) | 67,609 | (1,403 | ) | 98.0 | |||||
| 6-12 months (22 issues) | 78,699 | (3,600 | ) | 95.6 | |||||
| 12-18 months (1 issue) | 84 | (2 | ) | 97.7 | |||||
| Greater than 18 months (1 issue) | 451 | (51 | ) | 89.8 | |||||
| $ | 335,054 | $ | (5,585 | ) | 98.4 | % | |||
(1) Fair value as a percentage of cost basis.
The aging of unrealized losses on equity securities at December 31, 2003 is not presented because such unrealized losses are not material to Zenith's consolidated financial condition, results of operations or cash flows. At December 31, 2003, there were no investments in fixed maturity or equity securities with unrealized losses that individually exceeded $0.5 million. The majority of unrealized losses on fixed maturity securities at December 31, 2003 is attributable to acquisitions of certain municipal and investment grade corporate
45
securities at the end of the first quarter and during the second quarter of 2003. These securities declined in value due to a general decrease in prices for these types of securities since they were acquired. Unrealized losses in the investment portfolio at December 31, 2003 are not expected to have a material impact on liquidity because we can, if necessary, hold fixed maturity securities to maturity and because equity securities represent only about 4% of the portfolio.
The gross realized gains on sales of investments classified as available-for-sale during 2003, 2002 and 2001 were $31.7 million, $11.8 million and $20.9 million, respectively, and the gross realized losses were $11.2 million, $6.4 million and $5.6 million, respectively. Following is a summary of securities sold at a loss during the three years ended December 31, 2003:
| Years Ended December 31, (Dollars in thousands) | 2003 | 2002 | 2001 | ||||||||
|---|---|---|---|---|---|---|---|---|---|---|---|
| Fixed maturity securities: | |||||||||||
| Realized losses on sales | $ | (7,768 | ) | $ | (3,476 | ) | $ | (3,988 | ) | ||
| Fair value at the date of sale | 247,061 | 88,890 | 88,678 | ||||||||
| Number of securities sold | 42 | 19 | 28 | ||||||||
| Losses realized on securities with an unrealized loss preceding the sale for: | |||||||||||
| Less than 3 months | $ | (2,898 | ) | $ | (799 | ) | $ | (654 | ) | ||
| 3-6 months | (2,775 | ) | (1,976 | ) | |||||||
| 6-12 months | (181 | ) | (58 | ) | (18 | ) | |||||
| Greater than 12 months | (1,914 | ) | (643 | ) | (3,316 | ) | |||||
| Equity securities: | |||||||||||
| Realized losses on sales | $ | (3,406 | ) | $ | (2,945 | ) | $ | (1,640 | ) | ||
| Fair value at the date of sale | 19,315 | 13,597 | 17,869 | ||||||||
| Number of securities sold | 23 | 83 | 56 | ||||||||
| Losses realized on securities with an unrealized loss preceding the sale for: | |||||||||||
| Less than 3 months | $ | (145 | ) | $ | (1,126 | ) | $ | (1,438 | ) | ||
| 3-6 months | (1,103 | ) | (1,230 | ) | (87 | ) | |||||
| 6-12 months | (857 | ) | (282 | ) | (103 | ) | |||||
| Greater than 12 months | (1,301 | ) | (307 | ) | (12 | ) | |||||
At the time we sold these investments, we had the ability to hold them for a sufficient time for them to recover their values and the sales were not related to any liquidity needs. However, our intent to hold them changed because we changed our conclusion about the outlook for the performance of the issuer or its industry. In some cases, we may have decided that our overall exposure to a particular issue or type of security or concentration within an industry should be reduced as part of ongoing portfolio management and asset allocation. At December 31, 2003, those securities which we are holding in our portfolio with an unrealized loss were compatible with our current view of appropriate asset allocation and issuer prospects. Any future changes in those assumptions could result in sales at a loss or write-downs of securities.
Other investments at December 31, 2003 are comprised of 12 different investments in limited partnerships and real estate joint ventures. These partnerships make long-term strategic investments in corporations, many of which are not publicly traded, with a view to exiting the investment position, sometimes after many years. The long-term value of some of these underlying investments are subject to uncertainties, including, in some cases, the impact of foreign economic and political developments. Write-downs of investments included $2.8 million in 2003, $0.2 million in 2002 and $2.2 million in 2001 for other-than-temporary impairments of limited partnership investments.
Under the criteria of Statement of Financial Accounting Standards No. 57, "Related Party Disclosures," certain of our investments meet the definition of investments in related parties. However, these investments were made in the ordinary course of business, in which we make investment and reinvestment decisions, and were purchased at prevailing market prices at the time of purchase. The following table sets
46
forth Zenith's investment in related parties, at fair value:
| December 31, (Dollars in thousands) | 2003 | 2002 | |||||
|---|---|---|---|---|---|---|---|
| Fairfax & subsidiaries: | |||||||
| Fairfax | $ | 17,209 | $ | 7,750 | |||
| Odyssey Re Holdings Corp | 27,246 | 26,948 | |||||
| Crum & Forster Holding Corp | 2,778 | ||||||
| TIG Capital Trust I | 2,400 | ||||||
| Wynn Resorts, Limited | 28,010 | 13,110 | |||||
Two of Zenith's Directors are also Directors of Wynn Resorts, Limited.
Terrorism Exposure and the Terrorism Risk Insurance Act of 2002
Under our workers' compensation policies, we are required to provide workers' compensation benefits for losses arising from acts of terrorism. The impact of any terrorist act is unpredictable, and the ultimate impact on us will depend upon the nature, extent, location and timing of such an act. We attempt to mitigate the risk of loss from terrorism as follows:
Our excess of loss reinsurance provides protection for losses from domestic acts of terrorism (except for nuclear, biological or chemical attacks in excess of $10.0 million). We have purchased additional reinsurance for foreign acts of terrorism in the amount of $9.0 million in excess of a retention of $1.0 million in 2004. In addition for 2004, we have purchased reinsurance for foreign acts of terrorism, excluding nuclear, biological and chemical attacks, up to losses of $68.0 million in excess of $10.0 million, except that we have retained $10.0 million, or 50%, of any aggregate losses between $20.0 million and $40.0 million. The cost of such terrorism reinsurance in 2004 is approximately $6.0 million including the reinsurance from $1.0 million to $10.0 million. This cost will be offset by approximately $1.7 million of terrorism surcharge premiums.
In November 2002, the Terrorism Risk Insurance Act of 2002 (the "Act") became effective and is effective for the period from November 26, 2002 until December 31, 2005. The Act may also provide us with reinsurance protection under certain circumstances and subject to certain limitations. The Secretary of the Treasury must certify an act for it to constitute an act of terrorism. The definition of terrorism excludes domestic acts of terrorism or acts of terrorism committed in the course of a war declared by Congress. Losses arising from an act of terrorism must exceed $5.0 million to qualify for reimbursement. If an event is certified, the Federal Government will reimburse losses not to exceed $100.0 billion in any year. Each insurance company is responsible for a deductible based on a percentage of direct earned premiums in the previous calendar year. For losses in excess of the deductible, the Federal Government will reimburse 90% of the insurer's loss, up to the insurer's proportionate share of the $100.0 billion.
The Act contemplates that affiliated insurers will be treated collectively as one entity by the U.S. Treasury Department for purposes of calculating direct earned premiums and, therefore, an insurer's deductible. As of December 31, 2003, companies controlled by Fairfax owned approximately 41% of our outstanding common stock. Fairfax has disclaimed any control of Zenith and has granted to a trustee a proxy to vote all of the shares of our common stock held by Fairfax and its subsidiaries in proportion to the voting of all other Zenith National stockholders. In January 2004, we received a final determination from the Treasury Department in which it determined that the direct earned premiums for U.S. exposures of the insurers controlled by Fairfax (the "Fairfax direct earned premiums") are required to be combined with our direct earned premiums for purposes of calculating our deductible under the Act. Including the
47
Fairfax direct earned premiums with ours, our deductible for 2004 is approximately $251 million.
Notwithstanding the protection provided by the reinsurance we have purchased and any protection provided by the Act, the risk of severe losses to Zenith from acts of terrorism has not been eliminated because events may not be covered by, or may exceed the capacity of, our reinsurance protection. In our workers' compensation business, we monitor the geographical concentrations of insured employees to help mitigate the risk of loss from terrorist acts. Also, small businesses constitute a large proportion of our policies, and we avoid risks in high profile locations. In our reinsurance business, any terrorism exposure we have assumed is subject to our underwriting guidelines not to write business that could expose us to losses from a single event of greater than approximately $19 million after deducting applicable premium income and after tax.
Discontinued Real Estate Operations
On October 8, 2002, Zenith closed the sale of its home-building business and related real estate assets in Las Vegas, Nevada to Meritage Corporation ("Meritage"). The business had been operated by Zenith National's indirect wholly-owned subsidiary, Zenith of Nevada, Inc. (formerly, Perma-Bilt, a Nevada Corporation ("Perma-Bilt")). In the transaction, Meritage, through its wholly-owned subsidiary, MTH-Homes Nevada, Inc. ("MTH Nevada"), acquired substantially all of Perma-Bilt's assets, subject to the related liabilities, pursuant to a Master Transaction Agreement dated as of October 7, 2002, and related asset and real property acquisition agreements (the "Agreement"). Zenith received gross proceeds of $65.0 million in connection with the sale, including $28.4 million in repayment of intercompany loans to Zenith National from Perma-Bilt, and recorded a gain on the sale in the fourth quarter of 2002 of $6.3 million after tax.
In addition to the consideration received in October 2002, the Agreement entitles Zenith to receive 10% of MTH Nevada's pre-tax net income, subject to certain adjustments, for each of the twelve-month periods ending September 30, 2003, September 30, 2004 and September 30, 2005. In the fourth quarter of 2003, we received a payment of $1.8 million before tax ($1.2 million after tax) for the twelve months ended September 30, 2003 under the earn-out provision which is recorded as gain on sale of real estate operations. We are currently unable to estimate the amount, if any, of payments we might receive under this earn-out provision for the remaining two years, although in the current year we expect a lower payment than in 2003 due to a shortage of available land inventory for part of the year.
For the years ended December 31, 2002 and 2001, the results of operations and cash flows for Zenith's real estate business are presented as discontinued operations. The following table summarizes the revenues and income from discontinued real estate operations:
| Years Ended December 31, (Dollars in thousands) | 2002 | 2001 | ||||
|---|---|---|---|---|---|---|
| Real estate sales | $ | 70,789 | $ | 84,823 | ||
| Income from discontinued real estate operations before tax | $ | 4,419 | $ | 5,763 | ||
| Income tax expense | 1,547 | 2,017 | ||||
| Income from discontinued real estate operations after tax | $ | 2,872 | $ | 3,746 | ||
Liquidity and Capital Resources
The primary concerns in managing our liquidity are (a) in the insurance subsidiaries, the need to ensure that there is adequate cash available to pay claims and (b) in the holding company, Zenith National, which has no operating revenues, the need to ensure that
48
there is adequate cash to service debt obligations and pay any dividends declared to our stockholders. The management of capital resources is primarily concerned with ensuring that there is adequate capital to operate our insurance business within the criteria imposed by regulatory requirements and within the criteria used by rating agencies to assign financial strength ratings.
Liquidity. Zenith's insurance subsidiaries generally create liquidity because insurance premiums are collected prior to disbursements for claims which may take place many years after the collection of premiums. Collected premiums may be invested, prior to their use in such disbursements, and investment income provides additional cash receipts. In periods in which disbursements for claims and benefits, current policy acquisition costs and current operating and other expenses exceed operating cash receipts, cash flow is negative. Such negative cash flow is offset by cash flow from investments, principally from short-term investments and maturities of longer-term investments. The exact timing of the payment of claims and benefits cannot be predicted with certainty. The insurance subsidiaries maintain portfolios of invested assets with varying maturities and a substantial amount of short-term investments to provide adequate cash for the payment of claims. At December 31, 2003 and 2002, cash and short-term investments in the insurance subsidiaries amounted to $275.6 million and $167.4 million, respectively. In addition to these short-term investments at December 31, 2003, we had $445.8 million, at fair value, of available-for-sale debt securities maturing within five years. These securities, in conjunction with our short term investments and positive cash flow from operations provide adequate sources of liquidity for the expected payment of our loss reserves in the near future. We do not expect to have sell securities or use our credit facilities to pay our policy liabilities as they come due. The current trend of favorable cash flow from operations is attributable to the trend of increasing workers' compensation rates and premiums and is expected to continue in 2004.
Insurance companies are required to have securities on deposit for the protection of policyholders in accordance with various states' regulations. At December 31, 2003 and 2002, investments with a fair value of $442.3 million and $333.1 million, respectively, were on deposit to comply with such regulations.
Zenith National requires cash to pay any dividends declared to its stockholders, make interest and principal payments on its outstanding debt obligations, fund its operating expenses, and, from time to time, to make capital contributions to Zenith Insurance. Such cash requirements are generally funded in the long-run by dividends received from Zenith Insurance and financing or refinancing activities by Zenith National. Cash, short-term investments and other investments in Zenith National were $72.4 million and $8.2 million at December 31, 2003 and 2002, respectively. The increase in 2003 was principally attributable to the net proceeds from the issuance of $125.0 million aggregate principal amount of the Convertible Notes (see below) offset by a capital contribution to Zenith Insurance.
On March 21, 2003, Zenith National issued $125.0 million aggregate principal amount of the Convertible Notes in a private placement, from which Zenith National received net proceeds of $120.0 million (see Note 10 to the Consolidated Financial Statements for a full description of the Convertible Notes). Each $1,000 principal amount of the Convertible Notes is convertible at each holder's option into 40 shares of Zenith National's common stock, par value $1.00 per share, subject to adjustment, under certain circumstances including if the price of Zenith National's common stock reaches specified thresholds. The initial conversion rate of 40
49
shares for each $1,000 principal amount of Convertible Notes is equivalent to an initial conversion price of $25.00 per share of Zenith National's common stock. The sale price of Zenith National's common stock exceeded the conversion price of $25.00 per share at December 31, 2003 by 120% for 20 trading days during the last 30 trading days of the fourth quarter of 2003. As a result of this event, the Convertible Notes will be convertible during the period beginning on January 1, 2004 and ending on March 31, 2004 (maximum number of shares that could be required to be issued is 5.0 million). Whether the Convertible Notes will be convertible after March 31, 2004 will depend upon the occurrence of the events specified in the Indenture dated March 21, 2003, including the sale price of Zenith National's common stock.
At December 31, 2003, Zenith National had two unsecured lines of credit in the aggregate amount of $50.0 million, all of which was available. One of these lines of credit, in the amount of $20.0 million, is a one-year revolving line of credit with a bank, expiring August 1, 2004. Interest is payable at the bank's prime rate on any borrowings under the line, and the agreement does not subject Zenith to any financial covenants. The other line of credit originally was a $50.0 million revolving credit agreement with a bank effective September 30, 2002 that consisted of the following: (a) Tranche A of the agreement for up to $20.0 million; and (b) Tranche B of the agreement for up to $30.0 million. The Tranche A commitment expired September 29, 2003 and was not renewed by Zenith National. Any loans under Tranche B would be due September 30, 2005. Interest is payable on outstanding loans at either the bank's prime rate or a rate based on Eurodollar deposit rates plus a specified margin depending on Zenith's credit rating. This credit agreement, as amended, contains covenants that require, among other things, Zenith National to maintain certain financial ratios, including a minimum amount of capital in its insurance subsidiaries, a maximum debt-to-total capitalization ratio and a minimum interest coverage ratio. We were in compliance with all of these covenants at December 31, 2003. There were no outstanding borrowings under the two bank lines of credit at December 31, 2003. We currently do not anticipate any need to draw on our bank lines of credit because, as a result of the issuance of the Convertible Notes, Zenith National's current cash and available invested assets are sufficient for any foreseeable requirements at this time.
Zenith National's insurance subsidiaries are subject to insurance regulations which restrict their ability to distribute dividends. These restrictions are set forth in Note 18 to the Consolidated Financial Statements. In 2004, Zenith Insurance would be able to pay up to $70.9 million of dividends to Zenith National without the prior approval of the California Department of Insurance. Zenith Insurance paid $10.0 million in dividends to Zenith National in each of 2003 and 2001. No dividends were paid to Zenith National in 2002. The restrictions on the payment of dividends have not had, and under current regulations are not expected to have, a material adverse impact on the ability of Zenith Insurance to pay dividends. In a recent court ruling, a California statute that allowed a deduction for the dividends received from wholly-owned insurance companies in the determination of taxable income for the California Franchise Tax was held unconstitutional in certain circumstances. The consequences of the decision are unclear, but the California Franchise Tax Board ("FTB") has taken the position that the decision has caused the statute to be invalid for all purposes and will disallow in its entirety the deduction for dividends received from insurance subsidiaries. If sustained, such action by the FTB would have the effect of imposing a tax of approximately 6%
50
(after the benefit of a federal tax deduction) on any dividends paid from Zenith Insurance to Zenith National. We are unable to predict the ultimate outcome of this matter, which depends upon the actions of the FTB, the prospects for appropriate legislative relief and various tax strategies that may be available to Zenith to alleviate the consequences of any actions by the FTB.
Capital Resources. In our insurance subsidiaries, cash and liquid investments are required to pay claims and expenses, but the amount of capital in our insurance subsidiaries influences how much premium we can write. Sources of capital for the insurance subsidiaries include the earnings generated by insurance and investment operations, contributions of capital by the holding company, Zenith National, and quota share ceded reinsurance. The amount of capital in Zenith's insurance subsidiaries is maintained relative to standardized capital adequacy measures such as risk-based capital where ratios such as net premiums written to statutory surplus measure capital adequacy. Risk-based capital is used by regulators for financial surveillance purposes and by rating agencies to assign financial strength ratings to Zenith's insurance subsidiaries and ratings for the debt issued by Zenith National. Insurance regulations require insurance companies to maintain capital and surplus at a minimum of 200% of regulatory risk-based capital. At December 31, 2003, Zenith Insurance's statutory capital and surplus was 330% of such minimum.
In 2004, A.M. Best Company ("A.M. Best") affirmed the financial strength rating of Zenith's insurance subsidiaries at A- (Excellent), Moody's Investors Service ("Moody's") affirmed the rating at Baa1 (Adequate) and Fitch Ratings ("Fitch") affirmed the financial strength rating at A- (Strong). In 2003, Standard & Poor's Rating Services ("S&P") affirmed the rating at BBB+ (Good). The ratings assigned by these agencies are primarily concerned with the ability of our insurance subsidiaries to pay the claims of policyholders and are therefore of interest to our agents and policyholders (and potential policyholders). Our competitive position is partly determined by these financial strength ratings and therefore we could be adversely affected by a reduction in these ratings. We currently believe that the most influential of these ratings is the rating assigned by A.M. Best. In the A.M. Best rating scheme, ratings of B+ to A++ are considered "Secure" and ratings of B and below are considered "Vulnerable." However, we believe that any reduction in our A.M. Best rating below A- could cause a reduction in the number of policies we write in both our workers' compensation business and our assumed reinsurance business and this could have a material adverse effect on our results of operations and our financial position. In addition to the assigned rating, these rating agencies also provide an accompanying rating outlook for the company. The rating outlook is currently "stable" for the A.M. Best, Moody's and Fitch ratings and "negative" for the S&P rating.
From time to time, the level of capitalization of Zenith Insurance may be increased by contributions from Zenith National. In January 2003, we borrowed $45.0 million under our two bank lines of credit to make a capital contribution to Zenith Insurance. All of the borrowing was repaid out of the net proceeds from the issuance of the Convertible Notes on March 21, 2003. On September 6, 2002, Zenith National contributed $47.5 million to the capital and surplus of Zenith Insurance. Zenith National used $22.5 million of its available invested assets and borrowed $25.0 million under one of its available bank lines of credit to fund the contribution. On October 11, 2002, Zenith National repaid the $25.0 million in full by using funds received in repayment of intercompany loans from Perma-Bilt after the sale of the home-building business and related
51
real estate assets. We will monitor the capital requirements, if any, of Zenith's insurance subsidiaries in connection with their business operations. We expect to be able to maintain adequate levels of capital from a combination of the earnings of the insurance subsidiaries and, if necessary and appropriate, contributions from Zenith National (funded from Zenith National's available invested assets, lines of credit or other financing or refinancing activities by Zenith National) and quota share reinsurance such as described below.
Zenith Insurance and a subsidiary of Odyssey Reinsurance Corp. ("Odyssey Re"), a subsidiary of Fairfax, entered into a 10% quota share ceded reinsurance agreement with respect to all new and renewal workers' compensation business written by Zenith Insurance in the three years commencing January 1, 2002. Quota share reinsurance allows the ceding company to increase the amount of business it writes while sharing the premiums and associated risks with the assuming company. The effect is similar to increasing the capital of the ceding company. Earned premiums ceded in connection with the quota share contract for the years ended December 31, 2003 and 2002 were $78.5 million and $36.8 million, respectively. Zenith expects that the quota share arrangement will favorably assist in the capitalization of its insurance subsidiaries over the term of the quota share reinsurance contract.
On May 1, 2002, Zenith National used $57.2 million of its available short-term investments to pay the outstanding principal of its 9% Senior Notes due May 1, 2002. On December 5, 2001, Zenith National sold one million shares of its common stock, par value $1.00 per share, in a private placement for $25.00 per share to a subsidiary of Odyssey Re.
From time to time, Zenith National may make repurchases of its outstanding common shares or outstanding debt. At December 31, 2003, Zenith National was authorized to repurchase up to 929,000 shares of its common stock at prevailing market prices pursuant to a share repurchase program authorized by its Board of Directors. Any purchases are discretionary and can be adequately funded from Zenith National's existing sources of liquidity.
Inflation
Inflation rates may impact the financial statements and operating results in several areas. Fluctuations in rates of inflation influence interest rates, which in turn impact the market value of the investment portfolio and yields on new investments. Inflation also impacts the portion of losses and loss reserves that relates to hospital and medical expenses and property claims and loss adjustment expenses, but not the portion of losses and loss reserves that relates to workers' compensation indemnity payments for lost wages which are fixed by statute. Adjustments for inflationary impacts are implicitly included as part of the continual review of property-casualty reserve estimates. Actuarial account of increased costs is considered in setting adequate rates, and this is particularly important in the health care area where hospital and medical inflation rates have exceeded general inflation rates. Operating expenses, including payrolls, are impacted to a certain degree by the inflation rate.
Contractual Obligations and Contingent Liabilities
All of Zenith's outstanding financing obligations are included in the Consolidated Financial Statements and the accompanying Notes. There are no liquidity or financing arrangements with unconsolidated entities or any off-balance sheet arrangements. Zenith National's available invested assets and other sources of liquidity are currently expected to be sufficient to meet its requirements for liquidity in the short-term and long-term.
52
Our loss reserves do not have contractual maturity dates. However, based on historical payment patterns, we have included an estimate of when we expect our loss reserves to be paid in the following table. The exact timing of the payment of claims cannot be predicted with certainty. We maintain a portfolio of investments with varying maturities and a substantial amount of short-term investments to provide adequate cash flows for the payment of claims.
The table below sets forth the amounts of Zenith's contractual obligations, including interest payable, at December 31, 2003:
| | Payments Due by Period | ||||||||||||||
|---|---|---|---|---|---|---|---|---|---|---|---|---|---|---|---|
| December 31, 2003 (Dollars in thousands) | |||||||||||||||
| Redeemable Securities | Convertible Notes | Operating Lease Commitments | Loss Reserves | Total | |||||||||||
| Less than 1 year | $ | 5,729 | $ | 128,594 | $ | 6,294 | $ | 302,869 | $ | 443,486 | |||||
| 1-3 years | 11,458 | 9,078 | 351,729 | 372,265 | |||||||||||
| 3-5 years | 11,458 | 4,929 | 170,386 | 186,773 | |||||||||||
| More than 5 years | 181,580 | 820 | 395,765 | 578,165 | |||||||||||
| Total | $ | 210,225 | $ | 128,594 | $ | 21,121 | $ | 1,220,749 | $ | 1,580,689 | |||||
Our contractual obligations under the outstanding Redeemable Securities are comprised of $143.2 million of interest payments over the next 25 years and $67.0 million of principal payable in 2028. Our contractual obligations under the outstanding Convertible Notes are comprised of $3.6 million of interest payments in the first quarter of 2004 and $125.0 million of principal that may be due in 2004 by way of conversion because the holders of our Convertible Notes have the right to convert their notes into our common stock during the first quarter of 2004. Whether the notes will be convertible after March 31, 2004 will depend upon the occurrence of events specified in the Indenture, including the sale price of our common stock. If the Convertible Notes are not converted or redeemed prior to the scheduled maturity in 2023, the total interest obligation over the term would be $140.2 million. In addition, Zenith may be required to pay contingent interest during any six-month period commencing with the six-month period beginning September 30, 2008 if the average market price of a Convertible Note for the five trading days ending on the second trading day immediately preceding the relevant six-month period equals 120% or more of the principal amount of the Convertible Notes. See Note 10 to the Consolidated Financial Statements for more information concerning the Convertible Notes.
Zenith's contingent liabilities are discussed in Note 16 to the Consolidated Financial Statements. Accrued guarantee fund assessments would be payable within approximately one year, if they are ultimately assessed. We cannot currently predict the timing or the outcome of the contingencies surrounding reinsurance recoverable from Reliance Insurance Company or the contingencies surrounding recoveries from the Florida Special Disability Trust Fund.
Market Risk of Financial Instruments
The fair value of the fixed maturity investment portfolio is exposed to interest rate risk — the risk of loss in fair value resulting from changes in prevailing market rates of interest for similar financial instruments. However, Zenith has the ability to hold fixed maturity investments to maturity. Zenith relies on the experience and judgment of senior management to monitor and mitigate the effects of market risk. Zenith does not utilize financial instrument hedges or derivative financial instruments to manage risks, nor does it enter into any swap, forward or option contracts, but will attempt to mitigate its exposure through active portfolio management. The allocation among various types of securities is adjusted from time to time based on market conditions, credit conditions, tax policy, fluctuations in interest rates and other factors. In addition,
53
Zenith places the majority of its investments in high-quality, liquid securities and limits the amount of credit exposure to any one issuer.
The table below provides information about Zenith's financial instruments for which fair values are subject to changes in interest rates. For fixed maturity investments, the table presents fair values of investments held and weighted average interest rates on such investments by expected maturity dates. Such investments include corporate bonds, municipal bonds, government bonds, redeemable preferred stock, and mortgage-backed securities. For Zenith's debt obligations, the table presents principal cash flows by expected maturity dates (including interest).
| | Expected Maturity Date | ||||||||||||||||||||||
|---|---|---|---|---|---|---|---|---|---|---|---|---|---|---|---|---|---|---|---|---|---|---|---|
| December 31, 2003 (Dollars in thousands) | |||||||||||||||||||||||
| 2004 | 2005 | 2006 | 2007 | 2008 | Thereafter | Total | |||||||||||||||||
| Investments: | |||||||||||||||||||||||
| Held-to-maturity and available-for-sale securities: | |||||||||||||||||||||||
| Fixed rate | $ | 90,711 | $ | 43,934 | $ | 195,209 | $ | 80,195 | $ | 59,669 | $ | 611,644 | $ | 1,081,362 | |||||||||
| Weighted average interest rate | 1.7% | 1.9% | 2.6% | 3.5% | 3.9% | 5.1% | 4.1% | ||||||||||||||||
| Short-term investments | $ | 285,760 | $ | 285,760 | |||||||||||||||||||
| Debt and interest obligations of Zenith: | |||||||||||||||||||||||
| Convertible Notes payable(1) | 128,594 | 128,594 | |||||||||||||||||||||
| Redeemable securities | 5,729 | $ | 5,729 | $ | 5,729 | $ | 5,729 | $ | 5,729 | $ | 181,580 | 210,225 | |||||||||||
| | Expected Maturity Date | ||||||||||||||||||||||
|---|---|---|---|---|---|---|---|---|---|---|---|---|---|---|---|---|---|---|---|---|---|---|---|
| December 31, 2002 (Dollars in thousands) | |||||||||||||||||||||||
| 2003 | 2004 | 2005 | 2006 | 2007 | Thereafter | Total | |||||||||||||||||
| Investments: | |||||||||||||||||||||||
| Held-to-maturity and available-for-sale securities: | |||||||||||||||||||||||
| Fixed rate | $ | 54,096 | $ | 72,654 | $ | 52,034 | $ | 157,424 | $ | 79,501 | $ | 397,919 | $ | 813,628 | |||||||||
| Weighted average interest rate | 2.6% | 2.1% | 3.4% | 4.8% | 3.7% | 5.8% | 4.7% | ||||||||||||||||
| Short-term investments | $ | 158,078 | $ | 158,078 | |||||||||||||||||||
| Debt and interest obligations of Zenith: | |||||||||||||||||||||||
| Redeemable securities | 5,729 | $ | 5,729 | $ | 5,729 | $ | 5,729 | $ | 5,729 | $ | 187,309 | 215,954 | |||||||||||
(1) The Convertible Notes are shown with an expected maturity date in 2004 because the note holders have the right to convert their notes into our common stock in the first quarter of 2004 (See discussion of the Convertible Notes under "Contractual Obligations and Contingent Liabilities" in MD&A).
54
5-YEAR SUMMARY OF SELECTED FINANCIAL INFORMATION
AND FINANCIAL STATEMENTS
(This page has been left blank intentionally.)
55
5-YEAR SUMMARY OF SELECTED FINANCIAL INFORMATION
Zenith National Insurance Corp. and Subsidiaries
| | ||||||||||||
|---|---|---|---|---|---|---|---|---|---|---|---|---|
| Years Ended December 31, | | | | |||||||||
| Note(s) | 2003 | 2002 | 2001 | |||||||||
| (Dollars and shares in thousands, except per share data) | ||||||||||||
| Revenues: | 2,3,6 | |||||||||||
| Premiums earned | 1 | $ | 773,799 | $ | 557,055 | $ | 476,876 | |||||
| Net investment income | 56,103 | 48,811 | 51,178 | |||||||||
| Realized gains (losses) on investments | 19,433 | (3,631 | ) | 9,169 | ||||||||
| Service fee income | ||||||||||||
| Total revenues | 849,335 | 602,235 | 537,223 | |||||||||
| Components of net income (loss): | 2,6 | |||||||||||
| Income (loss) from operations of Workers' Compensation | 5,6 | $ | 29,260 | $ | (43,848 | ) | $ | (58,329 | ) | |||
| Reinsurance | 4 | 9,562 | 7,644 | (31,918 | ) | |||||||
| Other Property-Casualty | 2 | |||||||||||
| Net investment income | 56,103 | 48,811 | 51,178 | |||||||||
| Realized gains (losses) on investments | 19,433 | (3,631 | ) | 9,169 | ||||||||
| Parent expenses and interest expense | 7,8 | (17,694 | ) | (10,237 | ) | (11,402 | ) | |||||
| Gain on sale of CalFarm | 2 | |||||||||||
| Income (loss) from continuing operations before tax and before equity in earnings of investee | 96,664 | (1,261 | ) | (41,302 | ) | |||||||
| Income tax expense (benefit) | 33,664 | (914 | ) | (13,756 | ) | |||||||
| Income (loss) from continuing operations before equity in earnings of investee | 63,000 | (347 | ) | (27,546 | ) | |||||||
| Equity in earnings (losses) of investee after tax | 2,846 | 1,363 | (2,060 | ) | ||||||||
| Income (loss) from continuing operations after tax | 65,846 | 1,016 | (29,606 | ) | ||||||||
| Income from discontinued operations after tax | 3 | 1,154 | 9,184 | 3,746 | ||||||||
| Net income (loss) | $ | 67,000 | $ | 10,200 | $ | (25,860 | ) | |||||
| Per common share: | ||||||||||||
| Income (loss) from continuing operations | 7 | $ | 3.33 | $ | 0.05 | $ | (1.68 | ) | ||||
| Net income (loss) | 7 | 3.38 | 0.54 | (1.47 | ) | |||||||
| Cash dividends per share to common stockholders | 1.00 | 1.00 | 1.00 | |||||||||
| Weighted average common shares outstanding | 7 | 20,183 | 18,895 | 17,593 | ||||||||
| Financial condition: | 2 | |||||||||||
| Total assets | $ | 2,023,704 | $ | 1,615,113 | $ | 1,537,999 | ||||||
| Investments | 1,530,494 | 1,098,284 | 941,527 | |||||||||
| Unpaid losses and loss adjustment expenses | 1,220,749 | 1,041,532 | 946,822 | |||||||||
| Senior notes | 8 | 57,203 | ||||||||||
| Convertible senior notes | 7 | 120,436 | ||||||||||
| Redeemable securities | 8 | 65,769 | 65,719 | 65,669 | ||||||||
| Stockholders' equity | 383,246 | 317,024 | 300,551 | |||||||||
| Stockholders' equity per share | 20.27 | 16.89 | 16.20 | |||||||||
| Return on average equity | 18.8% | 3.3% | (8.5)% | |||||||||
| Insurance statistics (GAAP): | ||||||||||||
| Combined ratio: | ||||||||||||
| Workers' Compensation | 5,6 | 95.9% | 108.7% | 114.0% | ||||||||
| Reinsurance | 4 | 84.3% | 85.6% | 152.3% | ||||||||
| Net premiums earned-to-surplus ratio | 1.5 | 1.5 | 1.6 | |||||||||
| Loss and loss adjustment expense reserves-to-surplus ratio (net of reinsurance) | 2.0 | 2.2 | 2.5 | |||||||||
| (7) | On March 21, 2003, Zenith issued $125.0 million aggregate principal amount of 5.75% Convertible Senior Notes due March 30, 2023 ("Convertible Notes") and received net proceeds of approximately $120.0 million. 2003 includes interest expense of $6.0 million before tax ($3.9 million after tax) on the Convertible Notes. Diluted average outstanding shares and earnings per share for the year ended December 31, 2003 reflects the impact of additional shares issuable as a result of the convertibility of the Notes as of the fourth quarter. If the convertibility of the Notes had been included for the entire year in 2003, diluted net income per share would have been $2.96 for the year ended December 31, 2003 (see Notes 10, 20 and 26 to the Consolidated Financial Statements). | |
| (8) | In 2001 and 2000, Zenith repurchased $1.3 million and $16.5 million, respectively, aggregate principal amount of the outstanding 9% Senior Notes due 2002. In 2000, Zenith repurchased $8.0 millon aggregate liquidation amount of outstanding 8.55% Capital Securities of Zenith National Insurance Capital Trust I, all of the voting securities of which are owned by Zenith. A gain of $1.6 million before tax ($1.0 million after tax) was recorded on repurchases in 2000. The gain was previously recorded as an extraordinary item and has been reclassified to reduce interest expense in conformity with Statement of Financial Accounting Standards No. 145, "Rescission of FASB Statements No. 4, 44 and 64, Amendments of FASB Statement No. 13 and Technical Corrections." In 2002, Zenith paid the outstanding principal of $57.2 million of its 9% Senior Notes due May 1, 2002. | |
| (9) | Certain prior period workers' compensation operating expenses have been reclassified to conform to the current presentation (see Note 25 to the Consolidated Financial Statements). |
56
| Years Ended December 31, | 2000 | 1999 | | |||||
|---|---|---|---|---|---|---|---|---|
| (Dollars and shares in thousands, except per share data) | ||||||||
| Revenues: | ||||||||
| Premiums earned | $ | 338,752 | $ | 369,403 | ||||
| Net investment income | 51,766 | 53,662 | ||||||
| Realized gains (losses) on investments | (15,467 | ) | 7,682 | |||||
| Service fee income | 2,691 | |||||||
| Total revenues | 375,051 | 433,438 | ||||||
| Components of net income (loss): | ||||||||
| Income (loss) from operations of Workers' Compensation | $ | (87,854 | ) | $ | (122,543 | ) | ||
| Reinsurance | (14,536 | ) | (7,324 | ) | ||||
| Other Property-Casualty | (22 | ) | ||||||
| Net investment income | 51,766 | 53,662 | ||||||
| Realized gains (losses) on investments | (15,467 | ) | 7,682 | |||||
| Parent expenses and interest expense | (10,155 | ) | (12,372 | ) | ||||
| Gain on sale of CalFarm | 160,335 | |||||||
| Income (loss) from continuing operations before tax and before equity in earnings of investee | (76,246 | ) | 79,418 | |||||
| Income tax expense (benefit) | (25,894 | ) | 27,690 | |||||
| Income (loss) from continuing operations before equity in earnings of investee | (50,352 | ) | 51,728 | |||||
| Equity in earnings (losses) of investee after tax | ||||||||
| Income (loss) from continuing operations after tax | (50,352 | ) | �� | 51,728 | ||||
| Income from discontinued operations after tax | 3,552 | 2,372 | ||||||
| Net income (loss) | $ | (46,800 | ) | $ | 54,100 | |||
| Per common share: | ||||||||
| Income (loss) from continuing operations | $ | (2.93 | ) | $ | 3.01 | |||
| Net income (loss) | (2.72 | ) | 3.15 | |||||
| Cash dividends per share to common stockholders | 1.00 | 1.00 | ||||||
| Weighted average common shares outstanding | 17,212 | 17,172 | ||||||
| Financial condition: | ||||||||
| Total assets | $ | 1,472,190 | $ | 1,573,786 | ||||
| Investments | 852,734 | 901,734 | ||||||
| Unpaid losses and loss adjustment expenses | 877,883 | 880,929 | ||||||
| Senior notes | 58,374 | 74,717 | ||||||
| Convertible senior notes | ||||||||
| Redeemable securities | 65,618 | 73,397 | ||||||
| Stockholders' equity | 309,776 | 354,559 | ||||||
| Stockholders' equity per share | 17.76 | 20.67 | ||||||
| Return on average equity | (14.3)% | 13.9% | ||||||
| Insurance statistics (GAAP): | ||||||||
| Combined ratio: | ||||||||
| Workers' Compensation | 129.2% | 143.9% | ||||||
| Reinsurance | 138.3% | 120.1% | ||||||
| Net premiums earned-to-surplus ratio | 1.1 | 1.1 | ||||||
| Loss and loss adjustment expense reserves-to-surplus ratio (net of reinsurance) | 2.0 | 1.8 | ||||||
| (1) | Net premiums earned in 2003 and 2002 are net of $78.5 million and $36.8 million, respectively, of ceded premiums earned in connection with a 10% ceded quota share reinsurance agreement effective January 1, 2002 for policies effective on or after January 1, 2002. | |
| (2) | Zenith completed the sale of CalFarm Insurance Company ("CalFarm") effective March 31, 1999, resulting in a gain of $104.3 million after tax, or $6.08 per share, in the first quarter of 1999. | |
| (3) | The real estate assets and home-building business of Perma-Bilt, a Nevada Corporation were sold in 2002. Income from discontinued operations in 2002 includes the gain on the sale of $6.3 million after tax. In the fourth quarter of 2003, we received a payment of $1.8 million before tax ($1.2 million after tax) of additional sales proceeds under the earn-out provision of the sale. | |
| (4) | 2002, 2001, 2000 and 1999 include catastrophe losses before tax of $0.4 million, $41.7 million, $22.6 million and $18.9 million, respectively. | |
| (5) | 2002 includes a charge of $30.0 million before tax ($19.5 million after tax, or $1.04 per share) for increased workers' compensation loss reserves in the fourth quarter of 2002. | |
| (6) | On April 1, 1998, Zenith acquired substantially all of the assets and certain liabilities of RISCORP, Inc. and subsidiaries (collectively, "RISCORP"). In 1999, Zenith recorded $50.0 million before tax ($32.5 million after tax, or $1.89 per share) of net charges associated with an increase in the purchase price of RISCORP. |
57
Zenith National Insurance Corp. and Subsidiaries
| December 31, (Dollars and shares in thousands) | | 2003 | 2002 | ||||||
|---|---|---|---|---|---|---|---|---|---|
| Assets: | |||||||||
| Fixed maturity investments: | |||||||||
| At amortized cost (fair value $124,778 in 2003 and $108,732 in 2002) | $ | 122,966 | $ | 104,964 | |||||
| At fair value (amortized cost $930,876 in 2003 and $675,075 in 2002) | 956,584 | 704,896 | |||||||
| Equity securities, at fair value (cost $44,452 in 2003 and $51,686 in 2002) | 62,961 | 48,634 | |||||||
| Mortgage loans (at unpaid principal balance) | 39,123 | 26,924 | |||||||
| Short-term investments (at cost or amortized cost, which approximates fair value) | 285,760 | 158,078 | |||||||
| Investment in Advent Capital (Holdings) PLC | 25,188 | 18,319 | |||||||
| Other investments | 37,912 | 36,469 | |||||||
| Total investments | 1,530,494 | 1,098,284 | |||||||
| Cash | 8,006 | 17,452 | |||||||
| Accrued investment income | 13,119 | 10,990 | |||||||
| Premiums receivable, less bad debt allowance of $578 in 2003 and $2,300 in 2002 | 70,044 | 77,298 | |||||||
| Receivable from reinsurers and state trust funds for paid and unpaid losses and prepaid reinsurance premiums | 269,530 | 272,013 | |||||||
| Deferred policy acquisition costs | 11,922 | 13,374 | |||||||
| Deferred tax asset | 28,022 | 32,398 | |||||||
| Current income tax receivable | 3,422 | ||||||||
| Goodwill | 20,985 | 20,985 | |||||||
| Other assets | 71,582 | 68,897 | |||||||
| Total assets | $ | 2,023,704 | $ | 1,615,113 | |||||
| Liabilities: | |||||||||
| Policy liabilities and accruals: | |||||||||
| Unpaid loss and loss adjustment expenses | $ | 1,220,749 | $ | 1,041,532 | |||||
| Unearned premiums | 111,250 | 97,387 | |||||||
| Policyholders' dividends accrued | 3,033 | 3,362 | |||||||
| Convertible senior notes payable, less unamortized issue costs of $4,564 in 2003 | 120,436 | ||||||||
| Redeemable securities, less unamortized issue costs of $1,231 in 2003 and $1,281 in 2002 | 65,769 | 65,719 | |||||||
| Current income tax payable | 14,062 | ||||||||
| Other liabilities | 105,159 | 90,089 | |||||||
| Total liabilities | 1,640,458 | 1,298,089 | |||||||
| Commitments and contingent liabilities (See Note 16) | |||||||||
Stockholders' equity: | |||||||||
| Preferred stock, $1 par, 1,000 shares authorized; none issued or outstanding in 2003 or 2002 | |||||||||
| Common stock, $1 par 50,000 shares authorized; issued 25,928 in 2003 and 25,786 in 2002, outstanding 18,910 in 2003 and 18,768 in 2002 | 25,928 | 25,786 | |||||||
| Additional paid-in capital | 300,448 | 296,974 | |||||||
| Retained earnings | 157,191 | 109,008 | |||||||
| Accumulated other comprehensive income | 31,821 | 17,398 | |||||||
| 515,388 | 449,166 | ||||||||
| Treasury stock, at cost (7,018 shares in 2003 and 2002) | (132,142 | ) | (132,142 | ) | |||||
| Total stockholders' equity | 383,246 | 317,024 | |||||||
| Total liabilities and stockholders' equity | $ | 2,023,704 | $ | 1,615,113 | |||||
The accompanying notes are an integral part of this statement.
58
CONSOLIDATED STATEMENT OF OPERATIONS
Zenith National Insurance Corp. and Subsidiaries
| Years Ended December 31, (Dollars and shares in thousands, except per share data) | 2003 | 2002 | 2001 | |||||||||
|---|---|---|---|---|---|---|---|---|---|---|---|---|
| Revenues: | ||||||||||||
| Premiums earned | $ | 773,799 | $ | 557,055 | $ | 476,876 | ||||||
| Net investment income | 56,103 | 48,811 | 51,178 | |||||||||
| Realized gains (losses) on investments | 19,433 | (3,631 | ) | 9,169 | ||||||||
| Total revenues | 849,335 | 602,235 | 537,223 | |||||||||
| Expenses: | ||||||||||||
| Loss and loss adjustment expenses incurred | 537,922 | 421,128 | 413,933 | |||||||||
| Policy acquisition costs | 107,792 | 92,202 | 87,823 | |||||||||
| Underwriting and other operating expenses | 92,122 | 82,061 | 67,215 | |||||||||
| Policyholders' dividends | 2,485 | 3,003 | 1,978 | |||||||||
| Interest expense | 12,350 | 5,102 | 7,576 | |||||||||
| Total expenses | 752,671 | 603,496 | 578,525 | |||||||||
| Income (loss) from continuing operations before tax and equity in earnings of investee | 96,664 | (1,261 | ) | (41,302 | ) | |||||||
| Income tax expense (benefit) | 33,664 | (914 | ) | (13,756 | ) | |||||||
| Income (loss) from continuing operations after tax and before equity in earnings of investee | 63,000 | (347 | ) | (27,546 | ) | |||||||
| Equity in earnings (losses) of investee, net of income tax expense (benefit) of $1,532 in 2003, $734 in 2002 and $(1,110) in 2001 | 2,846 | 1,363 | (2,060 | ) | ||||||||
| Income (loss) from continuing operations | 65,846 | 1,016 | (29,606 | ) | ||||||||
| Income from discontinued real estate operations, net of income tax expense of $1,547 in 2002 and $2,017 in 2001 | 2,872 | 3,746 | ||||||||||
| Gain on sale of real estate operations, net of income tax expense of $621 in 2003 and $3,399 in 2002 | 1,154 | 6,312 | ||||||||||
| Total income from discontinued operations | 1,154 | 9,184 | 3,746 | |||||||||
| Net income (loss) | $ | 67,000 | $ | 10,200 | $ | (25,860 | ) | |||||
Net income (loss) per common share: | ||||||||||||
| Basic: | ||||||||||||
| Continuing operations | $ | 3.50 | $ | 0.05 | $ | (1.68 | ) | |||||
| Discontinued operations | 0.06 | 0.50 | 0.21 | |||||||||
| Net income (loss) | $ | 3.56 | $ | 0.55 | $ | (1.47 | ) | |||||
| Diluted: | ||||||||||||
| Continuing operations | $ | 3.33 | $ | 0.05 | $ | (1.68 | ) | |||||
| Discontinued operations | 0.05 | 0.49 | 0.21 | |||||||||
| Net income (loss) | $ | 3.38 | $ | 0.54 | $ | (1.47 | ) | |||||
The accompanying notes are an integral part of this statement.
59
CONSOLIDATED STATEMENT OF CASH FLOWS
Zenith National Insurance Corp. and Subsidiaries
| Years Ended December 31, (Dollars in thousands) | | 2003 | 2002 | 2001 | |||||||||
|---|---|---|---|---|---|---|---|---|---|---|---|---|---|
| Cash flows from operating activities: | |||||||||||||
| Premiums collected | $ | 912,400 | $ | 650,407 | $ | 493,021 | |||||||
| Investment income received | 56,343 | 49,439 | 50,319 | ||||||||||
| Net proceeds from trading portfolio investments | 3,000 | ||||||||||||
| Loss and loss adjustment expenses paid | (368,989 | ) | (330,477 | ) | (302,495 | ) | |||||||
| Underwriting and other operating expenses paid | (284,604 | ) | (223,080 | ) | (170,561 | ) | |||||||
| Interest paid | (10,058 | ) | (6,078 | ) | (7,647 | ) | |||||||
| Income taxes (paid) refunded | (21,320 | ) | (740 | ) | 14,662 | ||||||||
| Net cash provided by continuing operating activities | 283,772 | 139,471 | 80,299 | ||||||||||
| Net cash provided by discontinued operating activities | 3,703 | 4,308 | |||||||||||
| Net cash provided by operating activities | 283,772 | 143,174 | 84,607 | ||||||||||
| Cash flows from investing activities: | |||||||||||||
| Purchases of investments: | |||||||||||||
| Fixed maturity securities held-to-maturity | (54,270 | ) | (90,207 | ) | (9,956 | ) | |||||||
| Fixed maturity securities available-for-sale | (1,100,628 | ) | (356,961 | ) | (1,295,508 | ) | |||||||
| Equity securities available-for-sale | (61,948 | ) | (48,301 | ) | (67,395 | ) | |||||||
| Other investments | (24,435 | ) | (22,722 | ) | (10,487 | ) | |||||||
| Proceeds from maturities and redemptions of investments: | |||||||||||||
| Fixed maturity securities held-to-maturity | 36,034 | 13,704 | 5,780 | ||||||||||
| Fixed maturity securities available-for-sale | 27,984 | 42,660 | 60,430 | ||||||||||
| Other investments | 8,992 | 284 | |||||||||||
| Proceeds from sales of investments: | |||||||||||||
| Fixed maturity securities available-for-sale | 831,707 | 334,506 | 1,117,116 | ||||||||||
| Equity securities available-for-sale | 72,410 | 36,168 | 63,552 | ||||||||||
| Other investments | 2,790 | 636 | 16,354 | ||||||||||
| Net (increase) decrease in short-term investments | (127,129 | ) | (38,167 | ) | 41,966 | ||||||||
| Net proceeds from sale of real estate operations | 1,775 | 54,246 | |||||||||||
| Capital expenditures and other, net | (10,857 | ) | (6,353 | ) | (7,036 | ) | |||||||
| Net cash used in continuing investing activities | (397,575 | ) | (80,507 | ) | (85,184 | ) | |||||||
| Net cash used in discontinued investing activities | (11 | ) | (99 | ) | |||||||||
| Net cash used in investing activities | (397,575 | ) | (80,518 | ) | (85,283 | ) | |||||||
| Cash flows from financing activities: | |||||||||||||
| Net proceeds from issuance of convertible senior notes | 119,990 | ||||||||||||
| Repayment of 9% Senior Notes | (57,235 | ) | |||||||||||
| Repurchase of 9% Senior Notes | (1,265 | ) | |||||||||||
| Sale of treasury shares | 25,000 | ||||||||||||
| Cash advanced from bank lines of credit | 46,500 | 25,000 | |||||||||||
| Cash repaid on bank lines of credit | (46,500 | ) | (25,000 | ) | |||||||||
| Cash dividends paid to common stockholders | (18,786 | ) | (18,677 | ) | (17,502 | ) | |||||||
| Proceeds from exercise of stock options | 3,153 | 5,431 | 3,022 | ||||||||||
| Purchase of treasury shares | (207 | ) | |||||||||||
| Net cash provided by (used in) continuing financing activities | 104,357 | (70,481 | ) | 9,048 | |||||||||
| Net cash provided by discontinued financing activities | 367 | 512 | |||||||||||
| Net cash provided by (used in) financing activities | 104,357 | (70,114 | ) | 9,560 | |||||||||
| Net (decrease) increase in cash | (9,446 | ) | (7,458 | ) | 8,884 | ||||||||
| Net change in cash reclassified to real estate assets held for sale | 2,098 | 283 | |||||||||||
| Cash at beginning of year | 17,452 | 22,812 | 13,645 | ||||||||||
| Cash at end of year | $ | 8,006 | $ | 17,452 | $ | 22,812 | |||||||
The accompanying notes are an integral part of this statement.
Continued
60
CONSOLIDATED STATEMENT OF CASH FLOWS (CONTINUED)
Zenith National Insurance Corp. and Subsidiaries
| Years Ended December 31, (Dollars in thousands) | | 2003 | 2002 | 2001 | ||||||||||
|---|---|---|---|---|---|---|---|---|---|---|---|---|---|---|
| Reconciliation of net income (loss) to net cash flows from operating activities: | ||||||||||||||
| Net income (loss) | $ | 67,000 | $ | 10,200 | $ | (25,860 | ) | |||||||
| Adjustments to reconcile net income (loss) to net cash flows provided by operating activities: | ||||||||||||||
| Income from discontinued operations | (1,154 | ) | (9,184 | ) | (3,746 | ) | ||||||||
| Net depreciation, amortization and accretion | 9,320 | 6,003 | 6,730 | |||||||||||
| Realized (gains) losses on investments | (19,433 | ) | 3,631 | (9,169 | ) | |||||||||
| Equity in (earnings) losses of investee | (2,846 | ) | (1,363 | ) | 2,060 | |||||||||
| Net proceeds from sales of trading portfolio investments | 3,000 | |||||||||||||
| (Increase) decrease in: | ||||||||||||||
| Accrued investment income | (2,129 | ) | 669 | 224 | ||||||||||
| Premiums receivable | 12,419 | 9,525 | (10,418 | ) | ||||||||||
| Receivable from reinsurers and state trust funds for paid and unpaid losses and prepaid reinsurance premiums | (2,808 | ) | (9,048 | ) | 41,562 | |||||||||
| Deferred policy acquisition costs | 1,452 | (695 | ) | (2,369 | ) | |||||||||
| Federal income tax | 12,344 | (1,654 | ) | 1,302 | ||||||||||
| Increase (decrease) in: | ||||||||||||||
| Unpaid loss and loss adjustment expenses | 179,217 | 94,710 | 68,939 | |||||||||||
| Unearned premiums | 13,863 | 26,074 | 12,406 | |||||||||||
| Accrued expenses | 13,220 | 13,594 | (1,594 | ) | ||||||||||
| Other | 3,307 | (2,991 | ) | (2,768 | ) | |||||||||
| Net cash provided by continuing operating activities | 283,772 | 139,471 | 80,299 | |||||||||||
| Net cash provided by discontinued operating activities | 3,703 | 4,308 | ||||||||||||
| Net cash provided by operating activities | $ | 283,772 | $ | 143,174 | $ | 84,607 | ||||||||
The accompanying notes are an integral part of this statement.
61
CONSOLIDATED STATEMENT OF STOCKHOLDERS' EQUITY
Zenith National Insurance Corp. and Subsidiaries
| Years Ended December 31, (Dollars in thousands, except per share data) | 2003 | 2002 | 2001 | ||||||||||
|---|---|---|---|---|---|---|---|---|---|---|---|---|---|
| Preferred stock, $1 par: | |||||||||||||
| Beginning of year | none | none | none | ||||||||||
| End of year | none | none | none | ||||||||||
| Common stock, $1 par: | |||||||||||||
| Beginning of year | $ | 25,786 | $ | 25,571 | $ | 25,452 | |||||||
| Exercise of stock options | 142 | 215 | 119 | ||||||||||
| End of year | $ | 25,928 | $ | 25,786 | $ | 25,571 | |||||||
| Additional paid-in capital: | |||||||||||||
| Beginning of year | $ | 296,974 | $ | 291,348 | $ | 282,120 | |||||||
| Exercise of stock options | 3,011 | 5,216 | 2,903 | ||||||||||
| Tax benefit on options exercised | 403 | 373 | 154 | ||||||||||
| Sale of treasury shares | 6,171 | ||||||||||||
| Recognition of stock-based compensation | 60 | 37 | |||||||||||
| End of year | $ | 300,448 | $ | 296,974 | $ | 291,348 | |||||||
| Retained earnings: | |||||||||||||
| Beginning of year | $ | 109,008 | $ | 117,540 | $ | 161,174 | |||||||
| Net income (loss) | 67,000 | 10,200 | (25,860 | ) | |||||||||
| Cash dividends declared to common stockholders ($1.00 per share, paid quarterly) | (18,817 | ) | (18,732 | ) | (17,774 | ) | |||||||
| End of year | $ | 157,191 | $ | 109,008 | $ | 117,540 | |||||||
| Accumulated other comprehensive income (loss): | |||||||||||||
| Beginning of year | $ | 17,398 | $ | (1,766 | ) | $ | (8,206 | ) | |||||
| Net unrealized appreciation on investments, net of deferred tax expense and reclassification adjustment | 11,341 | 19,166 | 6,440 | ||||||||||
| Foreign currency translation adjustment, net of deferred tax expense (benefit) | 3,082 | (2 | ) | ||||||||||
| End of year | $ | 31,821 | $ | 17,398 | $ | (1,766 | ) | ||||||
| Treasury stock at cost: | |||||||||||||
| Beginning of year | $ | (132,142 | ) | $ | (132,142 | ) | $ | (150,764 | ) | ||||
| Purchase of treasury shares | (207 | ) | |||||||||||
| Sale of treasury shares | 18,829 | ||||||||||||
| End of year | $ | (132,142 | ) | $ | (132,142 | ) | $ | (132,142 | ) | ||||
| Total stockholders' equity | $ | 383,246 | $ | 317,024 | $ | 300,551 | |||||||
CONSOLIDATED STATEMENT OF COMPREHENSIVE INCOME
Zenith National Insurance Corp. and Subsidiaries
| Years Ended December 31, (Dollars in thousands) | 2003 | 2002 | 2001 | ||||||||
|---|---|---|---|---|---|---|---|---|---|---|---|
| Net income (loss) | $ | 67,000 | $ | 10,200 | $ | (25,860 | ) | ||||
| Other comprehensive income (loss), net of tax: | |||||||||||
| Net change in unrealized appreciation on investments | 11,341 | 19,166 | 6,440 | ||||||||
| Change in foreign currency translation adjustment | 3,082 | (2 | ) | ||||||||
| Comprehensive income (loss) | $ | 81,423 | $ | 29,364 | $ | (19,420 | ) | ||||
The accompanying notes are an integral part of these statements.
62
ZENITH NATIONAL INSURANCE CORP. AND SUBSIDIARIES
NOTES TO CONSOLIDATED FINANCIAL STATEMENTS
NOTE 1
Summary of Operations and
Principles of Consolidation
The accompanying financial statements have been prepared in accordance with generally accepted accounting principles ("GAAP") in the United States and include Zenith National Insurance Corp. ("Zenith National") and its subsidiaries (collectively, "Zenith"). All significant intercompany transactions and balances have been eliminated in consolidation. Zenith National is engaged through its wholly-owned property-casualty insurance subsidiaries (primarily Zenith Insurance Company ("Zenith Insurance")) in workers' compensation insurance and reinsurance. Approximately 64% and 18% of the premiums earned in the workers' compensation operations in 2003 were in California and Florida, respectively. The concentration of Zenith's business in these states makes the results of operations highly dependent upon the states' economies, social and cultural trends, legislative and regulatory changes, and catastrophic events such as windstorms and earthquakes. Zenith sells insurance and reinsurance through agents and brokers and not directly to consumers and is subject to regulation and supervision by the California and Texas Departments of Insurance. In addition to the insurance business, Zenith conducts investment and parent operations. See Note 22 for a description of Zenith's business segments. Zenith's home-building business and related real estate assets were sold in 2002. The results of real estate operations and cash flows from real estate operations are presented as discontinued operations (see Note 8). Results of operations of Zenith's investment in Advent Capital (Holdings) PLC ("Advent Capital") are presented as equity in earnings (losses) of investee (see Note 4). Certain items, including certain operating expenses and related items of cash flow, in prior periods have been reclassified to conform to the 2003 presentation (see Note 25).
GAAP requires the use of assumptions and estimates in reporting certain assets and liabilities and related disclosures. Actual results could differ from those estimates.
NOTE 2
Summary of Accounting Policies
Investments
Zenith's investments in debt and equity securities are identified in three categories as follows: (1) held-to-maturity — those securities, which by their terms must be redeemed by the issuing company and that Zenith has the positive intent and ability to hold to maturity are reported at amortized cost; (2) trading — those securities that are held principally for the purpose of selling in the near term are reported at fair value with unrealized gains and losses included in earnings; and (3) available-for-sale — those securities not classified as either held-to-maturity or trading are reported at fair value with unrealized gains and losses excluded from earnings and reported in a separate component of stockholders' equity, net of deferred tax. There were no investments identified to the trading securities portfolio at December 31, 2003 or 2002. The majority of held-to-maturity securities are Government National Mortgage Association securities on which Zenith receives periodic returns of principal.
Short-term investments include debt securities such as corporate, municipal and treasury securities with maturities of less than one year at the date of purchase. For these short-term investments, the cost or amortized cost is a reasonable estimate of fair value.
Mortgage loans are carried at unpaid principal balance. All of the unpaid principal on Zenith's mortgage loans is considered to be
63
collectible and there is no provision for uncollectible amounts. Other investments include: investments in real estate joint ventures and investments in limited partnerships. If our share of the partnership capital is greater than 3%, we account for the investment on the equity method, and the carrying value of our investment is adjusted to reflect our share of the underlying equity of the partnership. If our share of the partnership capital is less than 3%, we account for the investment at cost which is also a reasonable estimate of fair value. The investment in Advent Capital is accounted for under the equity method (see Note 4).
When, in the opinion of management, a decline in the fair value of an investment is considered to be other-than-temporary, such investment is written-down to its fair value as a charge to earnings in the form of a reduction of realized gains on investments. The determination of other-than-temporary includes, in addition to other relevant factors, a presumption that if the market value is below cost by a significant amount for a period of time, a write-down is necessary. The amount of any write-downs are determined by the difference between cost or amortized cost of the investment and its fair value at the time the other-than-temporary decline was identified. During the years ended December 31, 2003, 2002 and 2001, there were $2.9 million, $11.1 million and $12.7 million, respectively, of such write-downs.
Investment income is recorded when earned. Realized capital gains and losses are calculated based on the cost of securities sold, which is determined by the "identified cost" method.
Cash
Cash includes currency on hand and demand deposits with financial institutions.
Recognition of Property-Casualty
Revenue and Expense
Revenue recognition. The consideration paid for an insurance or reinsurance policy is generally known as a "premium." Policy premiums billed to and paid by our policyholders and reinsured companies are the revenue stream attributable to our property-casualty insurance operations. Premiums are billed and collected according to policy terms, predominantly in the form of installments during the policy period. Premiums are earned pro-rata over the terms of the policies. Billed premiums applicable to the unexpired terms of policies in-force are recorded as unearned premiums. Workers' compensation premiums are determined based upon the payroll of the insured and applicable premium rates. An audit of the policyholders' records is conducted after policy expiration, usually within about 90 days, to make a final determination of applicable premiums. Included with premiums earned is an estimate for earned but unbilled final audit premiums. We can estimate earned but unbilled premiums because we keep track, by policy, of how much additional premium is billed in final audit invoices as a percentage of the original estimated amount that was billed. We use the historical percentage to estimate the probable additional amount that we have earned but not yet billed as of the balance sheet date. Estimated earned but not billed premiums included in premiums receivable were $13.0 million at December 31, 2003 and $11.5 million at December 31, 2002.
Any amounts receivable for billed premiums are charged-off if they are submitted to our in-house legal collections department. An estimate of amounts that are likely to be charged-off is established as an allowance for doubtful accounts as of the balance sheet date. The estimate is comprised of specific accounts that are past due and are considered probable to be charged-off and a provision against
64
remaining accounts receivable based on historical charge-off data. Specific accounts included in the provision at December 31, 2002 and prior were higher because our legacy policy billing and collections system then in use in Florida and North Carolina did not facilitate timely charge-offs.
We have written a relatively small number of workers' compensation policies that are retrospectively-rated. Under this type of policy, at a date subsequent to policy expiration, the policyholder may be entitled to a refund or may owe us for additional premium based on the amount of losses sustained under the policy. These retrospective premium adjustments are confined to a limited amount plus or minus the standard amount of premium applicable to the policy. We can estimate these retrospective premium adjustments because we know the underlying loss experience of the policies involved. The estimated liability for return of premiums under retrospectively-rated workers' compensation policies included in unearned premiums was $4.0 million at December 31, 2003 and $4.4 million at December 31, 2002. The estimated amount receivable for additional premiums receivable under retrospectively-rated workers' compensation policies included in premiums receivable was $4.6 million at December 31, 2003 and $8.8 million at December 31, 2002. The decrease in the amount receivable is attributable to the fact that we no longer wrote retrospectively-rated policies in Florida in 2003.
Catastrophe reinsurance contracts are customarily written to provide reinsurance for losses associated with one catastrophic event with a provision to reinstate the contract for the unexpired term of the original contract. An additional premium, called a reinstatement premium, is due in consideration of the reinstatement. If a catastrophe loss is reported and we accrue an estimate for loss, any unearned premium associated with the contract at that time becomes fully earned. The reinstatement premium is then earned over the remaining term of the contract. Additional premiums earned attributable to original and reinstatement premiums for catastrophe reinsurance contracts were none in 2003, $1.4 million in 2002 and $11.1 million in 2001.
Deferred policy acquisition costs. Policy acquisition costs, consisting of commissions, premium taxes and certain other underwriting costs, are deferred and amortized as the related premiums are earned. Policy acquisition costs amortized in 2003, 2002 and 2001 were $107.8 million, $92.2 million, and $87.8 million, respectively. Unearned ceding commissions on ceded reinsurance are reported as a reduction of deferred policy acquisition costs. At December 31, 2003 and 2002, net deferred policy acquisition costs were $11.9 million and $13.4 million, respectively, net of unearned ceding commissions of $3.7 million and $3.1 million, respectively. Ceded unearned premiums of $9.6 million and $7.3 million, respectively, were included in receivable from reinsurers and state trust funds for paid and unpaid losses and prepaid reinsurance premiums in the accompanying consolidated balance sheet.
A premium deficiency is recognized if the sum of expected claims costs, claims adjustment expenses, expected dividends to policyholders, unamortized acquisition costs and maintenance costs exceed the related unearned premiums. A premium deficiency would first be recognized by charging any unamortized acquisition costs to expense to the extent required to eliminate the deficiency. If the premium deficiency were greater than unamortized acquisition costs, a liability would be accrued for the excess deficiency. We do not consider anticipated investment income when determining if a premium deficiency exists. Our estimates indicate that there was no premium deficiency at December 31, 2003 and 2002.
65
Claims expense. Zenith makes provisions for the settlement of all incurred claims, both reported and unreported. The liabilities for unpaid loss and loss adjustment expenses are estimates of the eventual costs of claims incurred but not settled. Actuarial techniques and estimation methods are utilized to establish the most reasonably accurate estimate of loss reserves at a point in time including an estimate of the probable amount for unreported claims arising from accidents which have not yet been reported to the Company, commonly known in the industry as "incurred but not reported" or "IBNR." Estimates for reported claims are also determined by evaluation of individual reported claims and amounts reported by ceding companies. The methods for making such estimates and for establishing the resulting liabilities are continually reviewed and updated, and any adjustments resulting therefrom are reflected in earnings currently. Estimates of losses from environmental and asbestos-related claims are included in overall loss reserves and to date have not been material.
Catastrophes. Insurance and reinsurance coverages expose Zenith to the risk of significant loss in the event of major loss events, known in the insurance industry as catastrophes. Catastrophes may cause significant contemporaneous financial statement losses since catastrophe losses may not be accrued in advance of the event. Underwriting losses in 2001 in the reinsurance operations were attributable to losses incurred in connection with the terrorist attack on the World Trade Center on September 11, 2001. There is considerable uncertainty as to the nature and amount of monetary losses associated with the World Trade Center loss. Zenith has currently estimated its share to be $48.0 million before tax, both gross and net of reinsurance recoverable, by estimating the probable impact to each of its assumed reinsurance contracts based on currently available information. Approximately 70% of our estimated loss is attributable to the contractual maximum loss payable by Zenith under its excess of loss reinsurance contracts and therefore our loss cannot exceed the amount we have estimated and reserved on these contracts. The remainder of the estimated loss is an estimate of its expected loss incurred on assumed quota share reinsurance contracts. The ultimate impact of the World Trade Center loss, after deducting original and reinstatement premium income on Zenith's assumed reinsurance contracts for 2001, is estimated to be $20.0 million before tax, or $13.0 million after tax. Zenith has written its assumed reinsurance business so that its exposure to reinsurance losses from any one event in a worst-case scenario, after the benefit of the applicable premium and reinstatement premium and income taxes, is not expected to be more than approximately 5% of Zenith's consolidated stockholders' equity (currently about $19 million). The expected ultimate loss for the World Trade Center of $13.0 million after tax was within that 5% maximum. As a result of the information we have received so far, we have made no changes in the estimate of our World Trade Center loss since the fourth quarter of 2001.
Estimates of the impact of the World Trade Center loss and other catastrophes are based on the information that is currently available. Such estimates could change based on any new information that becomes available or based upon reinterpretation of existing information.
Policyholders' dividends. An estimated provision for workers' compensation policyholders' dividends is accrued as the related premiums are earned. Such dividends do not become a fixed liability unless and until declared by the respective Boards of Directors of
66
Zenith's insurance subsidiaries. The dividend to which a policyholder may be entitled is set forth in the policy and is related to the amount of losses sustained under the policy. Dividends are paid after policy expiration (usually at 6 months and at 18 months). We are able to estimate any liability we may have because we know the underlying loss experience of the policies we have written with dividends and can estimate future dividend payments from the policy terms.
Reinsurance Ceded
In accordance with general industry practices, we purchase excess of loss reinsurance to protect Zenith against the impact of large, irregularly-occurring losses in the workers' compensation business. Such reinsurance reduces the magnitude of sudden and unpredictable changes in net income and the capitalization of Zenith's insurance operations. Reinsurance makes the assuming reinsurer liable to the ceding company to the extent of the reinsurance. It does not, however, discharge the ceding company from its primary liability to its policyholders in the event the reinsurer is unable to meet its obligations under such reinsurance treaty. Zenith monitors the financial condition of its reinsurers and does not believe that it is exposed to any material credit risk through its ceded reinsurance arrangements other than in connection with Reliance Insurance Company ("Reliance"). Historically, no material amounts due from reinsurers have been written-off as uncollectible, but in 2001, Zenith recognized an impairment for certain reinsurance recoverable from Reliance which relates to reinsurance recoverable that we acquired through an acquisition in 1996 (see Note 16).
Earned premiums and loss and loss adjustment expenses incurred are stated in the Consolidated Statement of Operations after deduction of amounts ceded to reinsurers. Balances due from reinsurers on unpaid losses, including an estimate of such recoverables related to reserves for incurred but not reported losses, are reported as assets and are included in receivable from reinsurers even though amounts due on unpaid loss and loss adjustment expenses are not recoverable from the reinsurer until such losses are paid. Receivable from reinsurers on unpaid loss and loss adjustment expenses amounted to $228.3 million and $220.6 million at December 31, 2003 and 2002, respectively. In connection with the acquisition of RISCORP in 1998, Zenith entered into an aggregate excess of loss reinsurance agreement which provides ceded reinsurance for unpaid losses assumed by Zenith from RISCORP up to $50.0 million in excess of $182.0 million. Receivable from reinsurers on unpaid loss and loss adjustment expenses at December 31, 2003 and 2002 includes $16.2 million and $24.8 million, respectively, recoverable under such reinsurance and is secured by a trust account. The deferred benefit associated with such reinsurance was $5.2 million and $10.3 million at December 31, 2003 and 2002, respectively.
Properties and Equipment
Properties and equipment are stated at cost less accumulated depreciation. Depreciation is calculated on a straight-line basis using the following useful lives: buildings — 10 to 40 years; and furniture, fixtures and equipment — 3 to 10 years. Expenditures for maintenance and repairs are charged to operations as incurred. Additions and improvements to buildings and other fixed assets are capitalized and depreciated over the useful lives of the properties and equipment. Upon disposition, the asset cost and related depreciation are removed from the accounts and the resulting gain or loss is included in income.
67
Intangible Assets
Effective January 1, 2002, Zenith adopted the provisions of Statement of Financial Accounting Standards No. 142, "Goodwill and Other Intangible Assets" ("SFAS No. 142"), which addresses the accounting for goodwill and other intangible assets. Under SFAS No. 142, goodwill and intangible assets with indefinite lives are no longer amortized and other intangible assets are amortized over their useful lives (which may exceed 40 years). The standard also requires that goodwill and intangible assets with indefinite lives be tested for impairment at least annually and sets forth criteria for recognition and measurement of impairment.
At December 31, 2003 and 2002, Zenith had recognized goodwill from previous acquisitions and, other than goodwill, Zenith had no intangible assets. Zenith ceased the amortization of goodwill as of January 1, 2002. Goodwill was $21.0 million at December 31, 2003 and 2002 net of accumulated amortization of $3.6 million and is included in assets of the workers' compensation reporting segment. Zenith evaluated this goodwill for impairment at January 1, 2002 as part of the implementation of SFAS No. 142, and then at December 31, 2002 and 2003 in accordance with the requirement of SFAS No. 142 to annually test for goodwill impairment and determined that such goodwill was not impaired.
The following table presents Zenith's pro forma net income (loss) and per share amounts excluding goodwill amortization expense:
| Years Ended December 31, (In thousands, except per share data) | 2003 | 2002 | 2001 | |||||||
|---|---|---|---|---|---|---|---|---|---|---|
| Net income (loss) as reported | $ | 67,000 | $ | 10,200 | $ | (25,860 | ) | |||
| Add: goodwill amortization | 925 | |||||||||
| Pro forma net income (loss) | $ | 67,000 | $ | 10,200 | $ | (24,935 | ) | |||
| Basic earnings per common share as reported | $ | 3.56 | $ | 0.55 | $ | (1.47 | ) | |||
| Add: goodwill amortization | 0.05 | |||||||||
| Pro forma basic earnings per common share | $ | 3.56 | $ | 0.55 | $ | (1.42 | ) | |||
| Diluted earnings per common share as reported | $ | 3.38 | $ | 0.54 | $ | (1.47 | ) | |||
| Add: goodwill amortization | 0.05 | |||||||||
| Pro forma diluted earnings per common share | $ | 3.38 | $ | 0.54 | $ | (1.42 | ) | |||
68
Employee Stock Options
Under an employee non-qualified stock option plan adopted by the Board of Directors and stockholders of Zenith National in 1996 (the "Plan"), options are granted to certain officers and key employees for the purchase of Zenith National's common stock at 100% of the market price at the date of grant. The majority of the options outstanding at December 31, 2003 and 2002 expire five years after the date of the grant or three months after termination of employment and vest one-fourth per year after the first year. One grant for 1,000,000 shares is for a term of ten years and vests one-fifth per year after the first year and expires on March 14, 2006.
Effective in the fourth quarter of 2002, Zenith adopted the fair value based method of recording stock-based employee compensation in accordance with Statement of Financial Accounting Standards No. 123, "Accounting for Stock-Based Compensation" ("SFAS No. 123"). Zenith accounted for the change in accounting principle using the prospective method in accordance with Statement of Financial Accounting Standards No. 148, "Accounting for Stock-Based Compensation — Transition and Disclosure" ("SFAS No. 148"). Under the prospective method, all employee stock option grants beginning with January 2002 were expensed over the stock option vesting period based on the fair value at the date the options were granted. Prior to the fourth quarter of 2002, Zenith applied the provisions of Accounting Principles Board Opinion No. 25, "Accounting for Stock Issued to Employees" ("APB No. 25") in accounting for stock options issued prior to January 2002. Under the intrinsic value method of APB No. 25, Zenith had not been required to recognize compensation expense for stock option grants. The effect of the change in accounting principle and the pro forma effect of all stock options accounted for under the intrinsic value method for the three years ended December 31, 2003, 2002 and 2001 was as follows:
| Years Ended December 31, (Dollars in thousands, except per share data) | 2003 | 2002 | 2001 | ||||||||
|---|---|---|---|---|---|---|---|---|---|---|---|
| Net income (loss) as reported | $ | 67,000 | $ | 10,200 | $ | (25,860 | ) | ||||
| Stock-based employee compensation expense included in reported net income (loss), net of income tax benefit | 39 | 24 | |||||||||
| Total stock-based employee compensation expense determined under fair value method for all awards, net of income tax benefit | (300 | ) | (424 | ) | (800 | ) | |||||
| Pro forma net income (loss) | $ | 66,739 | $ | 9,800 | $ | (26,660 | ) | ||||
Net income (loss) per share — basic | |||||||||||
| Net income (loss) per share as reported | $ | 3.56 | $ | 0.55 | $ | (1.47 | ) | ||||
| Net income (loss) per share — pro forma | 3.55 | 0.52 | (1.52 | ) | |||||||
Net income (loss) per share — diluted | |||||||||||
| Net income (loss) per share as reported | 3.38 | 0.54 | (1.47 | ) | |||||||
| Net income (loss) per share — pro forma | 3.37 | 0.52 | (1.52 | ) | |||||||
Foreign Currency Translation
Translation gains or losses, net of applicable tax, associated with foreign currency investments accounted for under the equity method are credited or charged directly to a separate component of other comprehensive income.
69
NOTE 3
Investments
The amortized cost, fair value and carrying value of investments were as follows:
| | | Gross Unrealized | | | |||||||||||
|---|---|---|---|---|---|---|---|---|---|---|---|---|---|---|---|
| December 31, 2003 (Dollars in thousands) | Amortized Cost | Fair Value | Carrying Value | ||||||||||||
| Gains | (Losses) | ||||||||||||||
| Held-to-maturity: | |||||||||||||||
| Corporate debt | $ | 5,301 | $ | 895 | $ | 6,196 | $ | 5,301 | |||||||
| Mortgage-backed securities | 93,382 | 1,986 | $ | (93 | ) | 95,275 | 93,382 | ||||||||
| State and local government debt | 24,283 | (976 | ) | 23,307 | 24,283 | ||||||||||
| Total held-to-maturity | $ | 122,966 | $ | 2,881 | $ | (1,069 | ) | $ | 124,778 | $ | 122,966 | ||||
| Available-for-sale: | |||||||||||||||
| U.S. government debt | $ | 203,184 | $ | 473 | $ | (42 | ) | $ | 203,615 | $ | 203,615 | ||||
| State and local government debt | 99,227 | 1,028 | (735 | ) | 99,520 | 99,520 | |||||||||
| Corporate debt | 586,246 | 24,519 | (3,686 | ) | 607,079 | 607,079 | |||||||||
| Mortgage-backed securities | 20,467 | 1,155 | (2 | ) | 21,620 | 21,620 | |||||||||
| Redeemable preferred stocks | 21,752 | 3,049 | (51 | ) | 24,750 | 24,750 | |||||||||
| Equity securities | 44,452 | 18,539 | (30 | ) | 62,961 | 62,961 | |||||||||
| Short-term investments | 285,760 | 285,760 | 285,760 | ||||||||||||
| Total available-for-sale | $ | 1,261,088 | $ | 48,763 | $ | (4,546 | ) | $ | 1,305,305 | $ | 1,305,305 | ||||
| | | Gross Unrealized | | | |||||||||||
|---|---|---|---|---|---|---|---|---|---|---|---|---|---|---|---|
| December 31, 2002 (Dollars in thousands) | Amortized Cost | Fair Value | Carrying Value | ||||||||||||
| Gains | (Losses) | ||||||||||||||
| Held-to-maturity: | |||||||||||||||
| Corporate debt | $ | 5,308 | $ | 318 | $ | 5,626 | $ | 5,308 | |||||||
| Mortgage-backed securities | 99,656 | 3,450 | 103,106 | 99,656 | |||||||||||
| Total held-to-maturity | $ | 104,964 | $ | 3,768 | $ | 108,732 | $ | 104,964 | |||||||
| Available-for-sale: | |||||||||||||||
| U.S. government debt | $ | 67,088 | $ | 726 | $ | 67,814 | $ | 67,814 | |||||||
| State and local government debt | 53,665 | 769 | $ | (122 | ) | 54,312 | 54,312 | ||||||||
| Corporate debt | 511,012 | 27,115 | (5,231 | ) | 532,896 | 532,896 | |||||||||
| Mortgage-backed securities | 21,548 | 3,043 | (2 | ) | 24,589 | 24,589 | |||||||||
| Redeemable preferred stocks | 21,762 | 3,651 | (128 | ) | 25,285 | 25,285 | |||||||||
| Equity securities | 51,686 | 1,278 | (4,330 | ) | 48,634 | 48,634 | |||||||||
| Short-term investments | 158,078 | 158,078 | 158,078 | ||||||||||||
| Total available- for-sale | $ | 884,839 | $ | 36,582 | $ | (9,813 | ) | $ | 911,608 | $ | 911,608 | ||||
Debt securities, including short-term investments, by contractual maturity were as follows:
| December 31, 2003 (Dollars in thousands) | Amortized Cost | Fair Value | |||||
|---|---|---|---|---|---|---|---|
| Held-to-maturity: | |||||||
| Due after 1 year through 5 years | $ | 22,712 | $ | 23,890 | |||
| Due after 5 years through 10 years | 43,360 | 42,602 | |||||
| Due after 10 years | 56,894 | 58,286 | |||||
| Total held-to-maturity | $ | 122,966 | $ | 124,778 | |||
| Available-for-sale: | |||||||
| Due in 1 year or less | $ | 90,034 | $ | 90,711 | |||
| Due after 1 year through 5 years | 343,898 | 355,117 | |||||
| Due after 5 years through 10 years | 345,944 | 360,466 | |||||
| Due after 10 years | 151,000 | 150,290 | |||||
| Total available-for-sale | $ | 930,876 | $ | 956,584 | |||
Mortgage-backed securities are shown as being due at their average expected maturity dates. Expected maturities may differ from contractual maturities because borrowers may have the right to call or prepay obligations with or without call or prepayment penalties.
70
The table below sets forth information about fixed maturity securities with unrealized losses at December 31, 2003:
| December 31, 2003 (Dollars in thousands) | Fair Value | Unrealized Losses | Number of issues | ||||||
|---|---|---|---|---|---|---|---|---|---|
| Less than 12 months: | |||||||||
| U.S. government debt | $ | 127,091 | $ | (42 | ) | 2 | |||
| Municipal bonds | 70,332 | (1,711 | ) | 22 | |||||
| Mortgage-backed securities | 13,827 | (93 | ) | 3 | |||||
| Corporate debt | 123,269 | (3,686 | ) | 30 | |||||
| $ | 334,519 | $ | (5,532 | ) | 57 | ||||
| Greater than 12 months: | |||||||||
| Mortgage-backed securities | $ | 84 | $ | (2 | ) | 1 | |||
| Corporate debt | 451 | (51 | ) | 1 | |||||
| $ | 535 | $ | (53 | ) | 2 | ||||
| Total fixed maturity securities: | |||||||||
| U.S. government debt | $ | 127,091 | $ | (42 | ) | 2 | |||
| Municipal bonds | 70,332 | (1,711 | ) | 22 | |||||
| Mortgage-backed securities | 13,911 | (95 | ) | 4 | |||||
| Corporate debt | 123,720 | (3,737 | ) | 31 | |||||
| Total fixed maturity securities: | $ | 335,054 | $ | (5,585 | ) | 59 | |||
The aging of unrealized losses on equity securities at December 31, 2003 is not presented because such unrealized losses are not material to Zenith's consolidated financial condition, results of operations or cash flows. At December 31, 2003, there were no investments in fixed maturity or equity securities with unrealized losses that individually exceeded $0.5 million. The unrealized losses on fixed maturity securities at December 31, 2003 is attributable principally to acquisitions of municipal and investment grade corporate securities at the end of the first quarter and during the second quarter of 2003. These securities declined in value due to a general decrease in prices for these types of securities since they were acquired. Zenith has assessed that the unrealized losses reflected above are not individually material and do not reflect an other-than-temporary impairment.
The gross realized gains on sales of investments classified as available-for-sale during 2003, 2002 and 2001 were $31.7 million, $11.8 million and $20.9 million, respectively, and the gross realized losses were $11.2 million, $6.4 million and $5.6 million, respectively. The change in net unrealized holding gains on trading securities, which is included in realized gains, was $46,000 for the year ended December 31, 2001.
At December 31, 2003 and 2002, 91% and 89% of Zenith's consolidated portfolio of fixed maturity investments were classified as available-for-sale with the unrealized appreciation or depreciation recorded as a separate component of stockholders' equity, net of deferred tax. The change in fair value of fixed maturity investments classified as available-for-sale resulted in a decrease in stockholders' equity of $2.7 million after deferred tax from December 31, 2002 to December 31, 2003, compared to an increase of $20.2 million from December 31, 2001 to December 31, 2002. Fluctuating interest rates will impact stockholders' equity, profitability and maturities of certain debt and preferred securities.
Net realized and unrealized investment gains and losses on fixed maturity securities and equity securities were as follows:
| Years Ended December 31, (Dollars in thousands) | 2003 | 2002 | 2001 | |||||||
|---|---|---|---|---|---|---|---|---|---|---|
| Net realized gains (losses): | ||||||||||
| Fixed maturity securities | $ | 17,442 | $ | (3,245 | ) | $ | 753 | |||
| Equity securities | 3,035 | (2,140 | ) | 3,718 | ||||||
| Change in fair value (under) over cost: | ||||||||||
| Fixed maturity securities | (6,069 | ) | 34,199 | 13,922 | ||||||
| Equity securities | 21,561 | (1,636 | ) | (3,645 | ) | |||||
71
Net investment income was as follows:
| Years Ended December 31, (Dollars in thousands) | 2003 | 2002 | 2001 | |||||||
|---|---|---|---|---|---|---|---|---|---|---|
| Fixed maturities: | ||||||||||
| Bonds | $ | 50,634 | $ | 44,421 | $ | 41,892 | ||||
| Redeemable preferred stocks | 2,165 | 2,410 | 2,086 | |||||||
| Equity securities: | ||||||||||
| Common stocks | 842 | 663 | 807 | |||||||
| Floating rate preferred stocks | 401 | 401 | 401 | |||||||
| Convertible and non-redeemable preferred stocks | 126 | 257 | 256 | |||||||
| Mortgage loans | 2,955 | 1,903 | 2,690 | |||||||
| Short-term investments | 2,309 | 3,017 | 6,973 | |||||||
| Other | 438 | 549 | 287 | |||||||
| Subtotal | 59,870 | 53,621 | 55,392 | |||||||
| Investment expenses | (3,767 | ) | (4,810 | ) | (4,214 | ) | ||||
| Net investment income | $ | 56,103 | $ | 48,811 | $ | 51,178 | ||||
Investments with a fair value of $442.3 million and $333.1 million at December 31, 2003 and 2002, respectively, were on deposit with regulatory authorities in compliance with insurance company regulations.
In December 2003, the Financial Accounting Standards Board issued a revised Interpretation No. 46, "Consolidation of Variable Interest Entities ("VIE") — an interpretation of Accounting Research Bulletin No. 51, "Consolidated Financial Statements"' ("FIN No. 46-R"). A VIE is an entity for which the total equity investment at risk is not sufficient to permit the entity to finance its activities without additional subordinated financial support provided by any party, including equity holders, or in which equity investors as a group do not have the characteristics of a controlling financial interest. Among other things, FIN No. 46-R requires the consolidation of the assets, liabilities and results of operations of a VIE by the primary beneficiary. FIN No. 46-R also requires the disclosure of information concerning a VIE by an entity that holds a significant variable interest but is not the primary beneficiary. Certain disclosure requirements of FIN No. 46-R are effective for financial statements issued after December 31, 2003, and FIN No. 46-R applies to all entities subject to FIN No. 46-R no later than the end of the first reporting period that ends after March 15, 2004. In the normal course of our investing activities, we have made investments in three real estate development ventures that we believe meet the definition of a significant variable interest in a VIE but for which we are not the primary beneficiary.
First, Zenith has a mortgage loan outstanding that matures on December 31, 2004, with the possibility of an extension, to a real estate joint venture and bears interest at a rate of 8% on any principal balance of $22.5 million or less and 15% on any principal balance in excess of $22.5 million. The mortgage loan is recorded at the unpaid principal balance of $23.5 million at December 31, 2003 and is secured by the land, last appraised at $44.5 million on October 29, 2002. We also invested $5.0 million in the joint venture and this investment is carried at our share of the venture's equity. The joint venture is developing what was originally approximately 183 acres of land located on Las Vegas Boulevard in Las Vegas, Nevada. Our maximum exposure to any losses as a result of our investment in this joint venture is limited to the amount of the investment of $5.0 million and the amount of any unpaid principal and interest on the mortgage. We first became involved in this venture in December 2000.
Second, in July 2003, Zenith Insurance extended a $15.0 million loan bearing an interest rate of 12% maturing on June 30, 2005, with the possibility of an extension, to a real estate joint venture, that is developing approximately 590 acres of land that is fully entitled for 494 family homes and 231 condominiums and is located in Santa Barbara County, California. The mortgage loan is recorded at the unpaid principal balance
72
of $15.0 million at December 31, 2003 and is secured by the land, last appraised at $36.0 million on June 2, 2003. In addition, we are entitled to 20% of certain of the development company's remaining net profit on any sale of the land. Our maximum exposure to any losses as a result of this loan is limited to the amount of any unpaid principal and interest on the mortgage.
Third, in March 2003, Zenith Insurance formed a real estate joint venture with a partner to develop a 3.2 acre site in Sarasota, Florida. The project will include a parking structure, 23,000 square feet of commercial property and 95 condominium residences. Construction has commenced on the project. Zenith Insurance and the partner originally each invested $1.8 million in the joint venture in exchange for a 50% equity interest each. Subsequently in 2003, Zenith Insurance and the partner each invested an additional $1.7 million. This investment is carried at our share of the venture's equity. Our maximum exposure to any losses as a result of our investment in this joint venture is limited to the amount of our investment of $3.5 million as of December 31, 2003.
NOTE 4
Equity Investment in Advent Capital
On August 23, 2002, Zenith Insurance acquired 19.2 million Ordinary Shares of Advent Capital, a U.K. company, for $14.6 million in an open offer and placing of shares made in July 2002. As a result of the purchase, Zenith Insurance owns approximately 20.9% of the outstanding shares of Advent Capital. Advent Capital and its subsidiaries operate in the property and casualty insurance business in the United Kingdom by providing corporate capital to support the underwriting of certain Lloyd's of London syndicates and by managing those syndicates. The syndicates operate in the global insurance and reinsurance business with an emphasis on property catastrophe reinsurance. Zenith Insurance used available funds from its short-term investments to fund the purchase of the Advent Capital shares.
Prior to August 23, 2002, Zenith Insurance owned approximately 6.3% of the outstanding shares of Advent Capital and accounted for the investment on the cost basis. As of August 23, 2002, we are accounting for the investment in Advent Capital using the equity method of accounting in accordance with the provisions of Accounting Principles Board Opinion No. 18, "The Equity Method of Accounting for Investments in Common Stock" ("APB No. 18"). The equity method was retroactively applied to 2001. The carrying value of the investment in the common stock of Advent Capital is equal to Zenith Insurance's equity in the underlying net assets of Advent Capital. The carrying value at December 31, 2003 and 2002 was $25.2 million and $18.3 million, respectively, including goodwill of approximately $11 million. The amount of Zenith's stockholders' equity which represents undistributed earnings of Advent Capital is $2.1 million at December 31, 2003. Our exposure to any losses associated with our investment in Advent Capital is limited to the carrying value of our investment.
At December 31, 2003 and 2002, Zenith Insurance has accounted for its investment in Advent Capital using Advent Capital's September 30, 2003 and 2002 financial statements, respectively. Results for 2003, 2002 and 2001 are for the 12 month periods ended September 30, 2003, 2002 and 2001, respectively. Zenith Insurance will continue to report its share of Advent Capital's income and net assets lagged by one quarter to allow sufficient time for Advent Capital to prepare its financial statements.
73
The tables that follow contain summary information with respect to Advent Capital's results of operations for each of the twelve months ended September 30, 2003, 2002 and 2001 and Advent Capital's financial position as of September 30, 2003 and 2002, after adjustments to reflect GAAP in the United States:
| Twelve Months Ended September 30, (Dollars in thousands) | 2003 | 2002 | 2001 | ||||||
|---|---|---|---|---|---|---|---|---|---|
| Revenues | $ | 179,661 | $ | 197,655 | $ | 194,118 | |||
| Claims incurred net of reinsurance | 89,538 | 146,950 | 206,056 | ||||||
| Profit (loss) on ordinary activities before taxation | 30,716 | 6,205 | (72,444 | ) | |||||
| Profit (loss) on ordinary activities after taxation | 21,358 | 4,539 | (50,990 | ) | |||||
| September 30, (Dollars in thousands) | | 2003 | 2002 | |||||
|---|---|---|---|---|---|---|---|---|
| Assets: | ||||||||
| Investments | $ | 176,613 | $ | 185,882 | ||||
| Deferred acquisition costs | 12,995 | 33,691 | ||||||
| Reinsurance recoverable on paid and unpaid losses | 869,871 | 859,538 | ||||||
| Debtors | 187,008 | 356,186 | ||||||
| Liabilities: | ||||||||
| Provision for unearned premiums | $ | 85,758 | $ | 214,627 | ||||
| Provision for outstanding claims | 1,148,483 | 1,069,346 | ||||||
| Stockholders' equity: | $ | 83,480 | $ | 57,353 | ||||
The net loss in 2001 was attributable principally to Advent Capital's losses in connection with the terrorist attack on the World Trade Center on September 11, 2001.
Fairfax Financial Holdings Limited ("Fairfax") also participated in the open offer and placing of shares by Advent Capital and after the purchase, through its subsidiaries, Fairfax owns approximately 47% of the outstanding shares of Advent Capital at December 31, 2003 (see Note 24 for a discussion of related parties).
NOTE 5
Fair Values of Financial Instruments
Financial instruments are contractual obligations that result in the delivery of cash or an ownership interest in an entity. The following summarizes the carrying value and fair value of Zenith's financial instruments. For financial instruments not discussed below, the carrying amount is a reasonable estimate of the fair value.
| | 2003 | 2002 | ||||||||||
|---|---|---|---|---|---|---|---|---|---|---|---|---|
| December 31, | | Carrying Value | | |||||||||
| (Dollars in thousands) | Carrying Value | Fair Value | Fair Value | |||||||||
| Assets: | ||||||||||||
| Investments | $ | 1,530,494 | $ | 1,532,306 | $ | 1,098,284 | $ | 1,102,052 | ||||
| Liabilities: | ||||||||||||
| Convertible senior notes payable | 120,436 | 158,186 | ||||||||||
| Redeemable securities | 65,769 | 64,094 | 65,719 | 49,974 | ||||||||
Fair values of investments, which are further detailed in Note 3, were determined using bond prices obtained from Merrill Lynch Securities Pricing Service and equity prices obtained from Muller Data. When prices for securities cannot be obtained from these sources, they are obtained from the Bloomberg financial news service and various broker-dealers, or the fair value is estimated using analytical methods. The fair values of non-traded fixed maturity securities of $44.4 million and $49.7 million at December 31, 2003 and 2002, respectively, were estimated using quantitative analytical techniques, which techniques compare such securities with the prices of traded securities with similar characteristics. The fair values of the 5.75% Convertible Senior Notes due March 30, 2023 (the "Convertible Notes") and redeemable securities were estimated using quantitative analytical techniques, which techniques compare the Convertible Notes to the price of our common stock and the redeemable securities to the price of traded securities with similar characteristics.
74
NOTE 6
Properties and Equipment
Properties and equipment, included in other assets, consist of the following:
| December 31, (Dollars in thousands) | 2003 | 2002 | |||||
|---|---|---|---|---|---|---|---|
| Land | $ | 9,650 | $ | 9,650 | |||
| Buildings | 32,967 | 32,696 | |||||
| Furniture, fixtures and equipment | 55,178 | 45,151 | |||||
| Subtotal | 97,795 | 87,497 | |||||
| Accumulated depreciation | (45,733 | ) | (39,182 | ) | |||
| Total | $ | 52,062 | $ | 48,315 | |||
Depreciation expense was $6.6 million, $6.2 million and $7.1 million in the years ended December 31, 2003, 2002 and 2001, respectively.
NOTE 7
Income Tax
Zenith files a consolidated federal income tax return. The insurance subsidiaries pay premium taxes on gross premiums written in lieu of most state income or franchise taxes.
The components of the provision (benefit) for tax on the income (loss) from continuing operations before equity in earnings of investee were:
| Years Ended December 31, (Dollars in thousands) | 2003 | 2002 | 2001 | |||||||
|---|---|---|---|---|---|---|---|---|---|---|
| Current | $ | 37,457 | $ | 2,535 | $ | (10,566 | ) | |||
| Deferred | (3,793 | ) | (3,449 | ) | (3,190 | ) | ||||
| Income tax expense (benefit) | $ | 33,664 | $ | (914 | ) | $ | (13,756 | ) | ||
The difference between the statutory income tax rate of 35% and Zenith's effective tax rate on income (loss) from continuing operations before tax and equity in earnings of its investee, as reflected in the financial statements, was as follows:
| Years Ended December 31, (Dollars in thousands) | 2003 | 2002 | 2001 | ||||||||
|---|---|---|---|---|---|---|---|---|---|---|---|
| Statutory income tax expense (benefit) | $ | 33,832 | $ | (441 | ) | $ | (14,456 | ) | |||
| (Reduction) increase in tax: | |||||||||||
| Dividend received deduction and tax-exempt interest | (1,482 | ) | (780 | ) | (576 | ) | |||||
| Reduction in tax estimate for a prior year | (789 | ) | |||||||||
| Non-deductible expenses and other | 1,314 | 1,096 | 1,276 | ||||||||
| Income tax expense (benefit) | $ | 33,664 | $ | (914 | ) | $ | (13,756 | ) | |||
Deferred tax is provided based upon temporary differences between the tax and book basis of assets and liabilities. The components of the deferred tax assets and liabilities were as follows:
| | 2003 | 2002 | ||||||||||
|---|---|---|---|---|---|---|---|---|---|---|---|---|
| | ||||||||||||
| | Deferred Tax | Deferred Tax | ||||||||||
| | ||||||||||||
| December 31, (Dollars in thousands) | ||||||||||||
| Assets | Liabilities | Assets | Liabilities | |||||||||
| Investments | $ | 23,334 | $ | 8,395 | ||||||||
| Deferred policy acquisition costs | 4,173 | 4,681 | ||||||||||
| Properties and equipment | 4,061 | 2,826 | ||||||||||
| Unpaid loss and loss adjustment expenses discount | $ | 42,060 | $ | 35,775 | ||||||||
| Limitation on deduction for unearned premiums | 9,059 | 8,455 | ||||||||||
| Policyholders' dividends accrued | 1,062 | 1,177 | ||||||||||
| Deferred income on retroactive reinsurance | 1,807 | 3,599 | ||||||||||
| Other | 7,821 | 2,219 | 2,142 | 2,848 | ||||||||
| 61,809 | 33,787 | 51,148 | 18,750 | |||||||||
| Net deferred tax asset | $ | 28,022 | $ | 32,398 | ||||||||
Zenith's net deferred tax asset is expected to be fully recoverable because all future deductible amounts can be offset by recovery of income taxes paid within the statutory carry-back period or anticipated future taxable income, including investment income. Property-casualty loss reserves are not discounted for
75
book purposes; however, the Tax Reform Act of 1986 requires property and casualty loss reserves to be discounted for tax purposes.
NOTE 8
Discontinued Operations — Sale
of Real Estate Business
On October 8, 2002, Zenith closed the sale of its home-building business and related real estate assets in Las Vegas, Nevada to Meritage Corporation ("Meritage"). The business had been operated by Zenith National's indirect wholly-owned subsidiary, Zenith of Nevada, Inc. (formerly, Perma-Bilt, a Nevada corporation ("Perma-Bilt")). In the transaction, Meritage, through its wholly-owned subsidiary, MTH-Homes Nevada, Inc. ("MTH Nevada"), acquired substantially all of Perma-Bilt's assets, subject to the related liabilities, pursuant to a Master Transaction Agreement, dated as of October 7, 2002, and related asset and real property acquisition agreements (the "Agreement"). Zenith received gross proceeds of $65.0 million in connection with the sale, including $28.4 million in repayment of intercompany loans to Zenith National from Perma-Bilt, and recorded a gain on the sale in the fourth quarter of 2002 of $6.3 million after tax.
In addition to the consideration received in October 2002, the Agreement entitles Zenith to receive 10% of MTH Nevada's pre-tax net income, subject to certain adjustments, for each of the twelve-month periods ending September 30, 2003, September 30, 2004 and September 30, 2005. In the fourth quarter of 2003, we received a payment of $1.8 million before tax ($1.2 million after tax) for the twelve months ended September 30, 2003 under the earn-out provision which is recorded as gain on sale of real estate operations. We are currently unable to estimate the amount, if any, of payments we might receive under this earn-out provision for the remaining two years although in 2004 we expect a lower payment than in 2003 due to a shortage of available land inventory for part of the year.
For the years ended December 31, 2002 and 2001, the results of operations and cash flows for Zenith's real estate business are presented as discontinued operations. The following table summarizes the revenues and income from discontinued real estate operations:
| Years Ended December 31, (Dollars in thousands) | 2002 | 2001 | ||||
|---|---|---|---|---|---|---|
| Real estate sales | $ | 70,789 | $ | 84,823 | ||
| Income from discontinued real estate operations before tax | $ | 4,419 | $ | 5,763 | ||
| Income tax expense | 1,547 | 2,017 | ||||
| Income from discontinued real estate operations after tax | $ | 2,872 | $ | 3,746 | ||
Prior to the sale of the real estate operations, we capitalized land, land development costs and construction costs, including costs of acquisition and development, property taxes and related interest. Such costs, and an estimate of the costs to complete a project, were recognized pro rata against sales of completed units.
76
NOTE 9
Liability for Unpaid Loss and
Loss Adjustment Expenses
The following table represents a reconciliation of changes in the liability for unpaid loss and loss adjustment expenses:
| Years Ended December 31, (Dollars in thousands) | 2003 | 2002 | 2001 | ||||||||
|---|---|---|---|---|---|---|---|---|---|---|---|
| Beginning of year, net | $ | 825,869 | $ | 742,678 | $ | 634,172 | |||||
| Incurred claims: | |||||||||||
| Current year | 523,707 | 391,960 | 409,586 | ||||||||
| Prior years | 14,215 | 29,168 | 4,347 | ||||||||
| Total incurred claims | 537,922 | 421,128 | 413,933 | ||||||||
| Payments: | |||||||||||
| Current year | (91,871 | ) | (98,839 | ) | (61,921 | ) | |||||
| Prior years | (281,043 | ) | (239,098 | ) | (243,506 | ) | |||||
| Total payments | (372,914 | ) | (337,937 | ) | (305,427 | ) | |||||
| End of year, net | 990,877 | 825,869 | 742,678 | ||||||||
| Receivable from reinsurers and state trust funds for unpaid losses | 229,872 | 215,663 | 204,144 | ||||||||
| End of year, gross | $ | 1,220,749 | $ | 1,041,532 | $ | 946,822 | |||||
Adverse development in 2003 and 2002 is principally attributable to increases in workers' compensation loss reserves as a result of higher than previously estimated claim inflation. Adverse development in 2001 on the reserves established at December 31, 2000 is attributable, principally, to additional estimates of catastrophe losses in the reinsurance business.
NOTE 10
Convertible Senior Notes Payable
On March 21, 2003, Zenith National issued $125.0 million aggregate principal amount of the Convertible Notes in a private placement, from which Zenith National received net proceeds of $120.0 million. The Convertible Notes are general unsecured obligations of Zenith National and rank equally with Zenith's other unsecured and unsubordinated obligations. Interest on the Convertible Notes is payable semi-annually on March 30 and September 30, beginning September 30, 2003. In addition, Zenith National will pay contingent interest during any six-month period commencing with the six-month period beginning September 30, 2008 if the average market price of a Convertible Note for the five trading days ending on the second trading day immediately preceding the relevant six-month period equals 120% or more of the principal amount of the Convertible Notes. Each $1,000 principal amount of the Convertible Notes is convertible at each holder's option into 40 shares of Zenith National's common stock, par value $1.00 per share, (subject to adjustment as provided in the Indenture dated March 21, 2003, by and between Zenith National and Wells Fargo Bank Minnesota, N.A., as Trustee (the "Indenture")) only if: (i) during any fiscal quarter (beginning with the third quarter of 2003) the sale price of the common stock for at least 20 trading days in the 30 trading-day period ending on the last trading day of the immediately preceding fiscal quarter exceeds 120% of the conversion price on that 30th trading day; (ii) after the 30th day following the initial issuance of the Convertible Notes, the credit rating assigned to the Convertible Notes by Standard & Poor's Rating Services falls below BB- or is suspended or withdrawn; (iii) Zenith has called the Convertible Notes for redemption; or (iv) certain corporate events have occurred. The initial conversion rate of 40 shares for each $1,000 principal amount of Convertible Notes is equivalent to an initial conversion price of $25.00 per share of Zenith National's common stock. The sale price of Zenith National's common stock exceeded the conversion price of $25.00 per share at December 31, 2003 by 120% for 20 trading days during the last 30 trading days of the fourth quarter of 2003. As a result of this event, each holder of the notes will have the right to convert their Convertible Notes into Zenith's common stock at a conversion rate of
77
40 shares per $1,000 principal amount of Convertible Notes during the period beginning on January 1, 2004 and ending on March 31, 2004 (maximum number of shares that could be required to be issued is 5.0 million). Whether the Convertible Notes will be convertible after March 31, 2004 will depend upon the occurrence of the events specified in the Indenture, including the sale price of Zenith National's common stock.
Zenith may redeem some or all of the Convertible Notes for cash on or after March 30, 2008 at the prices specified in the Indenture. Each holder may require Zenith to repurchase all or a portion of its Convertible Notes on March 30, 2010, March 30, 2013, March 30, 2018, or, subject to certain exceptions, upon a change of control of Zenith. If any holder requires Zenith to repurchase its Convertible Notes in any of these events, Zenith may choose to pay the repurchase price in cash or shares of its common stock or a combination of cash and shares of its common stock.
On July 18, 2003, Zenith filed a shelf registration statement with the Securities and Exchange Commission (the "SEC") with respect to the resale of the Convertible Notes and the shares of its common stock issuable upon conversion of the Convertible Notes. The shelf registration statement was declared effective by the SEC on August 7, 2003.
Issue costs and discount of $5.0 million are being amortized using the effective interest method over the time from issuance to March 30, 2010. During the year ended December 31, 2003, $6.0 million of interest, issue costs and discount were expensed.
An affiliate of Fairfax purchased $30.0 million aggregate principal amount of the Convertible Notes. Companies controlled by Fairfax own 41% of the outstanding shares of Zenith National at December 31, 2003 (without giving effect to the shares issuable upon conversion of the Convertible Notes). Interest incurred and paid on the $30.0 million of Convertible Notes in 2003 were $1.3 million and $0.9 million, respectively. See Note 24 for a discussion of related parties.
NOTE 11
Redemption of Senior Notes Payable
On May 1, 2002, Zenith National used $57.2 million of its available short-term investments to pay the principal of its 9% Senior Notes due May 1, 2002 (the "9% Notes").
In 2001, Zenith National used $1.3 million of its available cash to repurchase $1.3 million aggregate principal amount of then outstanding 9% Notes. Interest on the 9% Notes was payable semi-annually. Issue costs of $1.2 million were being amortized over the term of the 9% Notes. In the years ended December 31, 2002 and 2001, $1.7 million and $5.3 million, respectively, of interest and issue costs were expensed.
NOTE 12
Redeemable Securities
Zenith National Insurance Capital Trust I, a Delaware statutory business trust (the "Trust"), all of the voting securities of which are owned by Zenith National, had $67.0 million outstanding of the $75.0 million issued of its 8.55% Capital Securities at December 31, 2003 and 2002. The Capital Securities pay semi-annual cumulative cash distributions at the annual rate of 8.55% of the $1,000 liquidation amount per security.
The Trust had invested $77.3 million in Zenith National's 8.55% Subordinated Deferrable Interest Debentures due 2028 (the "Subordinated Debentures") at December 31, 2003 and 2002, which constitute the principal asset of the Trust. The semi-annual interest payments on the Subordinated Debentures may be deferred by Zenith National for up to ten consecutive semi-annual periods. The Subordinated
78
Debentures are redeemable at any time by Zenith National at the then present value of the remaining scheduled payments of principal and interest. Payments on the Capital Securities, including distributions and redemptions, follow those of the Subordinated Debentures. Zenith National fully and unconditionally guaranteed the distributions on, and the liquidation amount generally of, the Capital Securities to the extent the Trust has funds legally available therefor. Zenith National's guarantee of the Capital Securities, as well as the Subordinated Debentures, is subordinated to all other indebtedness of Zenith National.
The issue cost and discount on the Subordinated Debentures of $1.7 million are being amortized over the term of the Subordinated Debentures. During each of the years ended December 31, 2003, 2002 and 2001, $5.8 million of interest, issue costs and discount were expensed.
The aggregate maturities for all of Zenith's long-term borrowings for each of the five years after December 31, 2003 was as follows:
| Maturing in: (Dollars in thousands) | Redeemable Securities | Convertible Notes | Total | ||||||
|---|---|---|---|---|---|---|---|---|---|
| 2004 | $ | 125,000 | $ | 125,000 | |||||
| 2005 | |||||||||
| 2006 | |||||||||
| 2007 | |||||||||
| 2008 | |||||||||
| Thereafter | $ | 67,000 | 67,000 | ||||||
| Total | $ | 67,000 | $ | 125,000 | $ | 192,000 | |||
The maturity of the outstanding Convertible Notes is presented as being due in 2004 because the holders of our Convertible Notes have the right to convert their notes into our common stock during the first quarter of 2004. Whether the notes will be convertible after March 31, 2004 will depend upon the occurrence of events specified in the Indenture, including the sale price of our common stock. If the Convertible Notes are not converted or redeemed, their scheduled maturity is March 2023.
NOTE 13
Bank Lines of Credit
At December 31, 2003, Zenith National had two unsecured lines of credit in the aggregate amount of $50.0 million, all of which was available. One of these lines of credit, in the amount of $20.0 million, is a one-year revolving line of credit with a bank, expiring August 1, 2004. Interest is payable at the bank's prime rate on any borrowings under the line, and the agreement does not subject Zenith to any financial covenants. The other line of credit originally was a $50.0 million revolving credit agreement with a bank effective September 30, 2002 that consisted of the following: (a) Tranche A of the agreement for up to $20.0 million; and (b) Tranche B of the agreement for up to $30.0 million. The Tranche A commitment expired September 29, 2003 and was not renewed by Zenith National. Any loans under Tranche B would be due September 30, 2005. Interest is payable on outstanding loans at either the bank's prime rate or a rate based on Eurodollar deposit rates plus a specified margin depending on Zenith's credit rating. This credit agreement, as amended, contains covenants that require, among other things, Zenith National to maintain certain financial ratios, including a minimum amount of capital in its insurance subsidiaries, a maximum debt-to-total capitalization ratio and a minimum interest coverage ratio. We were in compliance with all of these covenants at December 31, 2003.
In January 2003, we borrowed $45.0 million under our two bank lines of credit to make a capital contribution to Zenith Insurance, all of which was repaid from the net proceeds from the issuance of the Convertible Notes on March 21, 2003. In 2002, we borrowed $25.0 million to make a capital contribution to Zenith Insurance and repaid the borrowing from the proceeds of the sale of the real estate business. There were no outstanding borrowings
79
under the two bank lines of credit at December 31, 2003 and 2002.
We currently do not anticipate any need to draw on our bank lines of credit because, as a result of the issuance of the Convertible Notes, Zenith National's current cash and available invested assets are sufficient for any foreseeable requirements at this time.
NOTE 14
Interest Incurred
Interest incurred on borrowings, including the amortization of issuance costs and discounts, was as follows:
| Years Ended December 31, (Dollars in thousands) | 2003 | 2002 | 2001 | ||||||
|---|---|---|---|---|---|---|---|---|---|
| Interest capitalized for discontinued real estate operations | $ | 3,356 | $ | 5,230 | |||||
| Interest expense not related to discontinued real estate operations | $ | 12,350 | 5,102 | 7,576 | |||||
| Total interest incurred | $ | 12,350 | $ | 8,458 | $ | 12,806 | |||
NOTE 15
Reinsurance
We purchase excess of loss reinsurance to protect Zenith against the impact of large, irregularly-occurring losses in the workers' compensation business. Such reinsurance reduces the magnitude of sudden and unpredictable changes in net income and the capitalization of Zenith's insurance operations. Zenith maintains excess of loss and catastrophe reinsurance protection which provides protection for losses in excess of $1.0 million up to $150.0 million. In 2003, we retained 50% of any losses between $60.0 million and $100.0 million (of which there were none) and in 2004 we will retain one third of any losses between $75.0 million and $150.0 million.
Effective January 1, 2002, Zenith Insurance and a subsidiary of Odyssey Reinsurance Corp. ("Odyssey Re"), a subsidiary of Fairfax, entered into a 10% quota share ceded reinsurance agreement with respect to all new and renewal workers' compensation business written by Zenith Insurance in the three years commencing January 1, 2002. Quota share reinsurance allows the ceding company to increase the amount of business it writes while sharing the premiums and associated risks with the assuming company. The effect is similar to increasing the capital of the ceding company. Zenith expects that the quota share arrangement will favorably assist in the capitalization of its insurance subsidiaries over the term of the quota share reinsurance contract.
Reinsurance transactions reflected in the financial statements were as follows:
| Years Ended December 31, (Dollars in thousands) | 2003 | 2002 | 2001 | |||||||
|---|---|---|---|---|---|---|---|---|---|---|
| Direct premiums earned | $ | 815,446 | $ | 555,023 | $ | 427,331 | ||||
| Assumed premiums earned | 70,684 | 59,771 | 63,975 | |||||||
| Ceded premiums earned | (112,331 | ) | (57,739 | ) | (14,430 | ) | ||||
| Net premiums earned | $ | 773,799 | $ | 557,055 | $ | 476,876 | ||||
| Ceded loss and loss adjustment expenses incurred | $ | 26,645 | $ | 24,704 | $ | 5,728 | ||||
2003 and 2002 ceded premiums and loss and loss adjustment expenses incurred reflect the results of the quota share agreement with the subsidiary of Odyssey Re.
80
NOTE 16
Commitments and Contingent Liabilities
Zenith has office space leases, equipment leases and automobile leases expiring through 2010. The minimum rentals on these operating leases as of December 31, 2003 were as follows:
| (Dollars in thousands) Years | Equipment and Auto Fleet | Offices | Total | ||||||
|---|---|---|---|---|---|---|---|---|---|
| 2004 | $ | 1,456 | $ | 4,838 | $ | 6,294 | |||
| 2005 | 1,046 | 4,185 | 5,231 | ||||||
| 2006 | 431 | 3,416 | 3,847 | ||||||
| 2007 | 45 | 3,221 | 3,266 | ||||||
| 2008 | 21 | 1,642 | 1,663 | ||||||
| 2009 | 655 | 655 | |||||||
| 2010 | 165 | 165 | |||||||
| Total | $ | 2,999 | $ | 18,122 | $ | 21,121 | |||
Rental expenses for the years ended December 31, 2003, 2002 and 2001 amounted to $5.9 million, $5.0 million and $5.4 million, respectively.
Contingencies Surrounding Reinsurance Receivable from Reliance Insurance Company
At December 31, 2003 and 2002, Reliance owed Zenith Insurance $6.0 million of reinsurance recoverable on paid and unpaid losses in connection with the reinsurance arrangements assumed by Zenith Insurance in its 1996 acquisition of the Associated General Commerce Self-Insurers' Trust Fund.
In January 2001, Reliance was subject to a Supervision Order by the Pennsylvania Department of Insurance. This is not the same as insolvency. Based on the published 1999 financial statements for Reliance, which showed considerable net worth, we had no reason to conclude that we had an impairment of our reinsurance recoverable at the time of the Supervision Order. On May 29, 2001, the Pennsylvania Department of Insurance issued an Order of Rehabilitation for Reliance. Rehabilitation raises the possibility of compromise with Reliance's creditors. Therefore, we disclosed a contingency in the second quarter of 2001 related to possible impairment of our receivable from Reliance. With no information with which to estimate our impairment (no financial statements were filed by Reliance for 2000), we concluded that we could not determine the outcome of the contingency at that time. On October 3, 2001, the Commonwealth Court of Pennsylvania approved an Order of Liquidation for Reliance, which was experiencing cash flow problems caused by slow reinsurance recoveries. At that time, an estimated balance sheet of Reliance was made available as of December 31, 2000, from which we estimated that we could expect to recover no more than 50% of our receivable. This established a range of outcomes for the amount impaired between $3.0 million and $6.0 million (i.e., we expect to recover an amount between 50% and nothing). We have no information with which to establish an estimate within that range as better than any other and, therefore, we recorded an impairment provision of $3.0 million for our receivable from Reliance. We recorded the provision in the third quarter of 2001, the period for which the information became available to estimate the impairment provision. The impairment provision was $3.0 million at December 31, 2003 and 2002. The eventual outcome of this matter will be determined by the ultimate amount of Reliance's liabilities and whether or not Reliance has sufficient assets or can obtain recoveries and investment income in an amount sufficient to pay its liabilities. We will revise our impairment provision, if necessary, upon receipt of relevant information.
Contingencies Surrounding State
Guarantee Fund Assessments
State guarantee funds ("Guarantee Funds") exist to ensure that policyholders (holders of direct insurance policies but not of reinsurance policies) receive payment of their claims if insurance companies become insolvent. The
81
Guarantee Funds are funded primarily by statutorily prescribed assessments they bill to other insurance companies doing business in their states. Various mechanisms exist in some of these states for assessed insurance companies to recover these assessments. Upon the insolvency of an insurance company, the Guarantee Funds become primarily liable for the payment of the insolvent company's liabilities to policyholders. The declaration of an insolvency establishes the presumption that assessments by the Guarantee Funds are probable. Zenith Insurance writes workers' compensation insurance in many states in which unpaid workers' compensation liabilities are the responsibility of the Guarantee Funds and has received, and expects to continue to receive, Guarantee Fund assessments, some of which may be based on certain of the premiums it has already earned at December 31, 2003.
Zenith recorded an estimate of $6.9 million (net of expected recoveries of $2.1 million recoverable before the end of 2004) for its expected liability at December 31, 2003 for Guarantee Fund assessments. Recoveries are attributable to premium tax credits in various states. The amount of the recovery we have recorded is limited to credits applicable to, and recoverable from, premiums earned at December 31, 2003. The estimated expense for Guarantee Fund assessments was $3.4 million in 2003 compared to $4.1 million in 2002 and $3.5 million in 2001. Our estimated liability is based on currently available information and could change based on additional information or reinterpretation of existing information concerning the actions of the Guarantee Funds. Zenith expects that it will continue to accrue and receive Guarantee Fund assessments; and the ultimate impact of such assessments will depend upon the amount and timing of the assessments and of any recoveries to which Zenith is entitled.
Contingencies Surrounding Recoverability of Special Disability Trust Fund Receivable
The Florida Special Disability Trust Fund ("SDTF") is a fund established to reimburse insurance companies and employers for the cost of certain workers' compensation claims. The SDTF was established to promote the re-hiring of injured workers by providing a reimbursement for certain qualifying claims made by a previously injured worker subsequent to their re-hiring. These claims are sometimes referred to as "second injuries." We are able to submit such second injury claims to the SDTF and, if the claims are accepted, we are reimbursed for part of the cost of the claim. The SDTF stopped accepting new second injury claims dated after January 1, 1998. Approximately 550 of our Florida claims have been accepted, for which we have recorded a recoverable of $8.9 million, net of amounts due to reinsurers, at December 31, 2003. We bill the SDTF and receive reimbursements as we make payments on accepted claims. The SDTF is funded by assessing a fee of 4.52% of premiums written in Florida, and we accrue the assessment as a liability when we write Florida business. If the legislature in Florida were to decide to cease or suspend the assessment, and thereby the funding of the SDTF, any recoverable that we may have at that time which is related to un-reimbursed claims might be at risk. However, we have no current information to indicate that the SDTF assessment in Florida will not continue. We continue to collect substantial recoveries for second injury claims from the SDTF and although the SDTF is currently about 36 to 42 months behind schedule in reimbursing claims, we expect to fully recover the remaining amount receivable.
Litigation
Zenith National and its subsidiaries are defendants in various litigation. In the opinion of management, after consultation with legal
82
counsel, such litigation is either without merit or the ultimate liability, if any, is not expected to have a material adverse effect on the consolidated financial condition, results of operations or cash flows of Zenith.
NOTE 17
Common Stock
A summary of our common stock activity for the three years ended December 31, 2003 are as follows:
| Years Ended December 31, (Shares in thousands) | 2003 | 2002 | 2001 | |||||
|---|---|---|---|---|---|---|---|---|
| Common shares outstanding: | ||||||||
| Beginning of year | 18,768 | 18,553 | 17,443 | |||||
| Exercise of stock options | 142 | 215 | 119 | |||||
| Purchase of treasury shares | (9 | ) | ||||||
| Sale of treasury shares | 1,000 | |||||||
| End of year | 18,910 | 18,768 | 18,553 | |||||
Effective in the fourth quarter of 2002, Zenith began to expense the cost of employee stock options using the fair value based method of recording stock options in accordance with SFAS No. 123 and accounted for the change in accounting principle using the prospective method in accordance with SFAS No. 148 (see Note 2). The total cost of Zenith's 2002 option grants (no options were granted in 2003), which will be reflected in earnings ratably through 2006, is estimated to be about $0.2 million before tax.
The fair value of each option grant (there were no option grants in 2003) was estimated on the date of grant using the Black-Scholes option pricing model with the following weighted average assumptions:
| | 2002 Grants | 2001 Grants | ||
|---|---|---|---|---|
| Risk-free interest rates | 4.16% - 4.29% | 4.45% - 4.92% | ||
| Dividend yields | 4.21% | 3.45% | ||
| Volatility factors | 24.00% - 24.09% | 23.39% - 23.47% | ||
| Weighted average expected life (five-year term options) | 4.5 yrs. | 4.5 yrs. | ||
| Weighted average fair value per share | $5.23 | $5.09 | ||
The following table provides certain information regarding the shares authorized and outstanding under the Plan:
| December 31, (Shares in thousands) | 2003 | ||
|---|---|---|---|
| Number of shares to be issued upon exercise of outstanding options | 1,470 | ||
| Number of shares authorized for option grants | 2,676 | ||
| Number of shares remaining available for future issuance | 452 | ||
| Weighted-average exercise price of outstanding options | $ | 23.71 | |
Additional information with respect to stock options was as follows:
| (Shares in thousands) | Number of Shares | Weighted Average Exercise Price | ||
|---|---|---|---|---|
| Outstanding at December 31, 2000 | 2,148 | $ | 24.03 | |
| Granted | 95 | 27.60 | ||
| Exercised | (119 | ) | 25.38 | |
| Expired or cancelled | (60 | ) | 26.98 | |
| Outstanding at December 31, 2001 | 2,064 | 24.03 | ||
| Granted | 90 | 31.19 | ||
| Exercised | (215 | ) | 25.34 | |
| Expired or cancelled | (201 | ) | 26.73 | |
| Outstanding at December 31, 2002 | 1,738 | 23.93 | ||
| Exercised | (143 | ) | 22.08 | |
| Expired or cancelled | (125 | ) | 28.68 | |
| Outstanding at December 31, 2003 | 1,470 | 23.71 | ||
Certain information on outstanding options at December 31, 2003 was as follows:
| December 31, 2003 | Remaining Life in Years(A) | Outstanding Options Exercise Price(A) | |||||
|---|---|---|---|---|---|---|---|
| Range of Exercise Price (Shares in thousands) | Number Outstanding | ||||||
| $23.63 | 1,000 | 2.20 | $ | 23.63 | |||
| 19.16 - 31.32 | 470 | 1.76 | 23.01 | ||||
(A) Weighted Average
Options exercisable at December 31, 2003, 2002 and 2001 were 1,312,000, 1,378,000 and 1,534,000, respectively. Certain information on
83
exercisable options at December 31, 2003 was as follows:
| December 31, 2003 Range of Exercise Prices (Shares in thousands) | Number Exercisable | Exercisable Options Exercise Price(A) | |||
|---|---|---|---|---|---|
| $23.63 | 1,000 | $ | 23.63 | ||
| 19.16 - 31.32 | 312 | 19.91 | |||
(A) Weighted Average
From time to time, Zenith National may make repurchases of its outstanding common shares. At December 31, 2003, Zenith National was authorized to repurchase up to 929,000 shares of its common stock at prevailing market prices pursuant to a share repurchase program authorized by its Board of Directors. Any purchases are discretionary and can be adequately funded from Zenith National's existing sources of liquidity.
On December 5, 2001, Zenith National sold one million shares of its common stock, par value $1.00 per share, in a private placement for $25.00 per share to Odyssey Re.
NOTE 18
Dividend Restrictions
The California and Texas Insurance Holding Company System Regulatory Acts limit the ability of Zenith Insurance to pay dividends to Zenith National, and of the insurance subsidiaries of Zenith Insurance to pay dividends to Zenith Insurance, by providing that the appropriate insurance regulatory authorities in the states of California and Texas must approve any dividend that, together with all other such dividends paid during the preceding twelve months, exceeds the greater of: (a) 10% of the paying company's statutory surplus as regards policyholders at the preceding December 31; or (b) 100% of the net income for the preceding year. In addition, any such dividend must be paid from policyholders' surplus attributable to accumulated earnings. Such restrictions on dividends are not cumulative. In each of the years ended December 31, 2003, and 2001, Zenith Insurance paid $10.0 million in dividends to Zenith National. Zenith Insurance did not pay any dividends to Zenith National in 2002. Stockholders' equity of Zenith's insurance operations, in accordance with GAAP, amounted to $507.3 million as of December 31, 2003, of which $70.9 million can be paid in 2004 to Zenith National in dividends without prior approval of the California Department of Insurance.
The restrictions on the payment of dividends have not had, and under current regulations are not expected to have, a material adverse impact on the ability to pay dividends. In a recent court ruling, a California statute that allowed a deduction for the dividends received from wholly-owned insurance companies in the determination of taxable income for the California Franchise Tax was held unconstitutional in certain circumstances. The consequences of the decision are unclear, but the California Franchise Tax Board ("FTB") has taken the position that the decision has caused the statute to be invalid for all purposes and will disallow in its entirety the deduction for dividends received from insurance subsidiaries. If sustained, such action by the FTB would have the effect of imposing a tax of approximately 6% (after the benefit of a federal tax deduction) on any dividends paid from Zenith Insurance to Zenith National. Zenith is unable to predict the ultimate outcome of this matter, which depends upon the actions of the FTB, the prospects for appropriate legislative relief and various tax strategies that may be available to Zenith to alleviate the consequences of any actions by the FTB.
84
NOTE 19
Statutory Financial Data
Statutory capital stock and surplus and net income (loss) of Zenith's insurance subsidiaries, as reported to regulatory authorities, were as follows:
| Years Ended December 31, (Dollars in thousands) | 2003 | 2002 | 2001 | |||||||
|---|---|---|---|---|---|---|---|---|---|---|
| Capital stock and surplus | $ | 459,805 | $ | 309,810 | $ | 252,466 | ||||
| Net income (loss) | 72,127 | 19,220 | (15,429 | ) | ||||||
The insurance business is subject to state-by-state regulation and legislation focused on solvency, pricing, market conduct, claims practices, underwriting, accounting, investment criteria and other areas. Such regulation and legislation is constantly changing. Compliance is essential and is an inherent risk of the business.
NOTE 20
Earnings and Dividends Per Share
The following table sets forth the computation of basic and diluted net income (loss) per common share.
| Years Ended December 31, (In thousands, except per share data) | 2003 | 2002 | 2001 | |||||||
|---|---|---|---|---|---|---|---|---|---|---|
| (A) Income (loss) from continuing operations | $ | 65,846 | $ | 1,016 | $ | (29,606 | ) | |||
| (B) Income from discontinued operations | 1,154 | 9,184 | 3,746 | |||||||
| (C) Net income (loss) | $ | 67,000 | $ | 10,200 | $ | (25,860 | ) | |||
| (D) Interest expense on the Convertible Notes, net of tax(2) | $ | 1,264 | ||||||||
| (E) Weighted average outstanding shares during the period | 18,806 | 18,702 | 17,593 | |||||||
Additional common shares issuable under employee stock option plans using the treasury stock method(1) | 127 | 193 | 172 | |||||||
Common shares issuable upon conversion of the Convertible Notes(2) | 1,250 | |||||||||
| (F) Weighted average number of common shares outstanding assuming exercise of stock options | 20,183 | 18,895 | 17,765 | |||||||
| Net income (loss) per common share: | ||||||||||
| Basic: | ||||||||||
| (A)/(E) Continuing operations | $ | 3.50 | $ | 0.05 | $ | (1.68 | ) | |||
| (B)/(E) Discontinued operations | 0.06 | 0.50 | 0.21 | |||||||
| (C)/(E) Net income (loss) | $ | 3.56 | $ | 0.55 | $ | (1.47 | ) | |||
| Diluted: | ||||||||||
| ((A)+(D))/(F) Continuing operations | $ | 3.33 | $ | 0.05 | $ | (1.68 | ) | |||
| (B)/(F) Discontinued operations | 0.05 | 0.49 | 0.21 | |||||||
| ((C)+(D))/(F) Net income (loss) | $ | 3.38 | $ | 0.54 | $ | (1.47 | ) | |||
| Dividends per common share | $ | 1.00 | $ | 1.00 | $ | 1.00 | ||||
(1) Employee stock options
Additional common shares issuable under employee stock option plans using the treasury stock method are anti-dilutive for 2001 because there is a loss from continuing operations. In 2001,
85
diluted earnings per share uses (E) as the denominator.
Options to purchase 55,000 and 333,000 shares of common stock at an average price of $31.32 and $29.02 per share were outstanding as of December 31, 2003 and 2002, respectively, but were not included in the computation of diluted earnings per share because the options' exercise prices were greater than the average market price of the common shares, and, therefore, the effect would be anti-dilutive.
(2) Convertible Notes
Holders of our Convertible Notes will have the right to convert their notes into Zenith's common stock during the first quarter of 2004 because the contingent conversion condition related to our stock price was met in the fourth quarter of 2003. In accordance with Statement of Financial Accounting Standards No. 128, "Earnings per Share" ("EPS") ("SFAS No. 128"), diluted average outstanding shares includes an additional 5.0 million shares that would be issuable in connection with any Convertible Notes that could be so converted. The additional 5.0 million shares are included as of the beginning of the fourth quarter of 2003, the period in which the contingent conversion condition related to our stock price was met, thereby increasing diluted outstanding shares for the fourth quarter of 2003 by 5.0 million shares and by 1.25 million shares for the year ended December 31, 2003. After tax interest expense related to the Convertible Notes of $1.3 million for the fourth quarter of 2003 is added back to net income in computing diluted earnings per share.
NOTE 21
Other Comprehensive Income
Other comprehensive income is comprised of changes in unrealized appreciation on investments and changes in foreign currency translation adjustments. The following table summarizes the components of accumulated other comprehensive income:
| December 31, (Dollars in thousands) | 2003 | 2002 | ||||||
|---|---|---|---|---|---|---|---|---|
| Net unrealized appreciation on investments, before tax | $ | 44,217 | $ | 26,769 | ||||
| Deferred tax expense | 15,476 | 9,369 | ||||||
| Net unrealized appreciation on investments, net of tax | $ | 28,741 | $ | 17,400 | ||||
| Foreign currency translation adjustment, before tax | $ | 4,739 | $ | (3 | ) | |||
| Deferred tax expense (benefit) | 1,659 | (1 | ) | |||||
| Foreign currency translation adjustment, net of tax | $ | 3,080 | $ | (2 | ) | |||
| Total accumulated other comprehensive income: | $ | 31,821 | $ | 17,398 | ||||
The following table summarizes the components of our other comprehensive income, other than net income, for the three years ended December 31, 2003:
| (Dollars in thousands) | Pre-Tax | Income Tax Effect | After-Tax | |||||||
|---|---|---|---|---|---|---|---|---|---|---|
| Year Ended December 31, 2003 | ||||||||||
| Net unrealized appreciation arising during period | $ | 19,492 | $ | 6,823 | $ | 12,669 | ||||
| Less: reclassification adjustment for realized gain included in net income | (2,044 | ) | (716 | ) | (1,328 | ) | ||||
| Net change in unrealized appreciation on investments | 17,448 | 6,107 | 11,341 | |||||||
| Net change in foreign currency translation | 4,742 | 1,660 | 3,082 | |||||||
| Total other comprehensive income | $ | 22,190 | $ | 7,767 | $ | 14,423 | ||||
| Year Ended December 31, 2002 | ||||||||||
| Net unrealized appreciation arising during period | $ | 23,596 | $ | 8,259 | $ | 15,337 | ||||
| Plus: reclassification adjustment for realized loss included in net income | 5,890 | 2,061 | 3,829 | |||||||
| Net change in unrealized appreciation on investments | 29,486 | 10,320 | 19,166 | |||||||
| Net change in foreign currency translation | (3 | ) | (1 | ) | (2 | ) | ||||
| Total other comprehensive income | $ | 29,483 | $ | 10,319 | $ | 19,164 | ||||
| Year Ended December 31, 2001 | ||||||||||
| Net unrealized appreciation arising during period | $ | 5,059 | $ | 1,770 | $ | 3,289 | ||||
| Plus: reclassification adjustment for realized loss included in net loss | 4,848 | 1,697 | 3,151 | |||||||
| Net change in unrealized appreciation on investments | 9,907 | 3,467 | 6,440 | |||||||
| Total other comprehensive income | $ | 9,907 | $ | 3,467 | $ | 6,440 | ||||
86
NOTE 22
Segment Information
Zenith classifies its business into the following segments: workers' compensation, reinsurance, real estate (through October 8, 2002, the date of the sale of the real estate operations), investment and parent. Segments are designated based on the types of products and services provided. Workers' compensation represents insurance coverage for the statutorily prescribed benefits that employers are required to provide to their employees injured in the course of employment. Reinsurance principally consists of assumed reinsurance of property losses from worldwide catastrophes and large property risks. The real estate operations developed land and primarily constructed single-family residences in Las Vegas, Nevada (see Note 8). Investment operations provide income and realized gains on investments, primarily from investments in debt securities. The parent operations represent Zenith National, a holding company which owns, directly or indirectly, all of the capital stock of the insurance operations, non-insurance companies and other investment securities.
The accounting policies of the segments are the same as those described in Note 2. Income (loss) from operations of the Workers' Compensation and Reinsurance segments is determined solely by deducting from net premiums earned, net losses and loss adjustment expenses incurred and underwriting and other operating expenses incurred. The combined ratio is the sum of net incurred losses and loss adjustment expenses and underwriting and other operating expenses expressed as a percentage of net premiums earned. Results of the Investments segment include investment income and realized gains and losses on investments and we do not allocate investment income to our Workers' Compensation or Reinsurance segments. The results of the Parent segment include interest expense and the general operating expenses of Zenith National.
87
Information as to the operations of the segments is set forth below:
| (Dollars in thousands) | Workers' Compensation | Reinsurance | Real Estate(1) | Investment | Parent | Total | |||||||||||||
|---|---|---|---|---|---|---|---|---|---|---|---|---|---|---|---|---|---|---|---|
| Year Ended December 31, 2003 | |||||||||||||||||||
| Revenues: | |||||||||||||||||||
| Premiums earned | $ | 712,796 | $ | 61,003 | $ | 773,799 | |||||||||||||
| Net investment income | $ | 56,103 | 56,103 | ||||||||||||||||
| Realized gains on investments | 19,433 | 19,433 | |||||||||||||||||
| Total revenues | 712,796 | 61,003 | 75,536 | 849,335 | |||||||||||||||
| Interest expense | $ | (12,350 | ) | (12,350 | ) | ||||||||||||||
| Income (loss) from continuing operations before tax and equity in earnings of investee | 29,260 | 9,562 | 75,536 | (17,694 | ) | 96,664 | |||||||||||||
| Income tax expense (benefit) | 11,570 | 3,347 | 24,939 | (6,192 | ) | 33,664 | |||||||||||||
| Income (loss) from continuing operations after tax and before equity in earnings of investee | 17,690 | 6,215 | 50,597 | (11,502 | ) | 63,000 | |||||||||||||
| Equity in earnings of investee, net of tax expense of $1,532 | 2,846 | 2,846 | |||||||||||||||||
| Income (loss) from continuing operations | 17,690 | 6,215 | 53,443 | (11,502 | ) | 65,846 | |||||||||||||
| Gain on sale of real estate operations, net of tax expense of $621 | $ | 1,154 | 1,154 | ||||||||||||||||
| Net income (loss) | $ | 17,690 | $ | 6,215 | $ | 1,154 | $ | 53,443 | $ | (11,502 | ) | $ | 67,000 | ||||||
| Combined ratios | 95.9 | % | 84.3 | % | |||||||||||||||
| Investment in Advent Capital | 25,188 | $ | 25,188 | ||||||||||||||||
| Total assets | $ | 447,950 | $ | 34,586 | 1,534,487 | 6,681 | 2,023,704 | ||||||||||||
(1) Gain on sale of real estate operations represents a payment received in the fourth quarter of 2003 of additional sales proceeds under the earn-out provision of the sale of Zenith's home-building business and related real estate assets in October 2002 (See Note 2 and Note 8).
88
| (Dollars in thousands) | Workers' Compensation | Reinsurance | Real Estate(1) | Investment | Parent | Total | |||||||||||||
|---|---|---|---|---|---|---|---|---|---|---|---|---|---|---|---|---|---|---|---|
| Year Ended December 31, 2002 | |||||||||||||||||||
| Revenues: | |||||||||||||||||||
| Premiums earned | $ | 503,859 | $ | 53,196 | $ | 557,055 | |||||||||||||
| Net investment income | $ | 48,811 | 48,811 | ||||||||||||||||
| Realized losses on investments | (3,631 | ) | (3,631 | ) | |||||||||||||||
| Total revenues | 503,859 | 53,196 | 45,180 | 602,235 | |||||||||||||||
| Interest expense | $ | (5,102 | ) | (5,102 | ) | ||||||||||||||
| (Loss) income from continuing operations before tax and equity in earnings of investee | (43,848 | ) | 7,644 | 45,180 | (10,237 | ) | (1,261 | ) | |||||||||||
| Income tax (benefit) expense | (15,058 | ) | 2,675 | 15,051 | (3,582 | ) | (914 | ) | |||||||||||
| (Loss) income from continuing operations after tax and before equity in earnings of investee | (28,790 | ) | 4,969 | 30,129 | (6,655 | ) | (347 | ) | |||||||||||
| Equity in earnings of investee, net of tax expense of $734 | 1,363 | 1,363 | |||||||||||||||||
| (Loss) income from continuing operations | (28,790 | ) | 4,969 | 31,492 | (6,655 | ) | 1,016 | ||||||||||||
| Income from discontinued real estate operations, net of tax expense of $1,547 | $ | 2,872 | 2,872 | ||||||||||||||||
| Gain on sale of real estate operations, net of tax expense of $3,399 | 6,312 | 6,312 | |||||||||||||||||
| Total income from discontinued operations | 9,184 | 9,184 | |||||||||||||||||
| Net (loss) income | $ | (28,790 | ) | $ | 4,969 | $ | 9,184 | $ | 31,492 | $ | (6,655 | ) | $ | 10,200 | |||||
| Combined ratios | 108.7 | % | 85.6 | % | |||||||||||||||
| Investment in Advent Capital | 18,319 | $ | 18,319 | ||||||||||||||||
| Total assets | $ | 443,982 | $ | 41,704 | 1,126,726 | 2,701 | 1,615,113 | ||||||||||||
Year Ended December 31, 2001 | |||||||||||||||||||
| Revenues: | |||||||||||||||||||
| Premiums earned | $ | 415,848 | $ | 61,028 | $ | 476,876 | |||||||||||||
| Net investment income | $ | 51,178 | 51,178 | ||||||||||||||||
| Realized gains on investments | 9,169 | 9,169 | |||||||||||||||||
| Total revenues | 415,848 | 61,028 | 60,347 | 537,223 | |||||||||||||||
| Interest expense | $ | (7,576 | ) | (7,576 | ) | ||||||||||||||
| (Loss) income from continuing operations before tax and equity in losses of investee | (58,329 | ) | (31,918 | ) | 60,347 | (11,402 | ) | (41,302 | ) | ||||||||||
| Income tax (benefit) expense | (19,595 | ) | (10,716 | ) | 20,546 | (3,991 | ) | (13,756 | ) | ||||||||||
| (Loss) income from continuing operations after tax and before equity in losses of investee | (38,734 | ) | (21,202 | ) | 39,801 | (7,411 | ) | (27,546 | ) | ||||||||||
| Equity in loss of investee, net of tax benefit of $1,110 | (2,060 | ) | (2,060 | ) | |||||||||||||||
| (Loss) income from continuing operations | (38,734 | ) | (21,202 | ) | 37,741 | (7,411 | ) | (29,606 | ) | ||||||||||
| Income from discontinued real estate operations, net of tax expense of $2,017 | $ | 3,746 | 3,746 | ||||||||||||||||
| Net (loss) income | $ | (38,734 | ) | $ | (21,202 | ) | $ | 3,746 | $ | 37,741 | $ | (7,411 | ) | $ | (25,860 | ) | |||
| Combined ratios | 114.0 | % | 152.3 | % | |||||||||||||||
(1) Discontinued real estate operations — see Note 2 and Note 8.
89
The following table is a reconciliation of our segment results to our Consolidated Statement of Operations:
| Year ended December 31, (Dollars in thousands) | 2003 | 2002 | 2001 | ||||||||
|---|---|---|---|---|---|---|---|---|---|---|---|
| Income (loss) from operations of: | |||||||||||
| Workers' compensation | $ | 29,260 | $ | (43,848 | ) | $ | (58,329 | ) | |||
| Reinsurance | 9,562 | 7,644 | (31,918 | ) | |||||||
| Parent | (17,694 | ) | (10,237 | ) | (11,402 | ) | |||||
| Net investment income | 56,103 | 48,811 | 51,178 | ||||||||
| Realized gains (losses) on investments | 19,433 | (3,631 | ) | 9,169 | |||||||
| Income (loss) from continuing operations before tax and before equity in earnings of investee | 96,664 | (1,261 | ) | (41,302 | ) | ||||||
| Income tax expense (benefit) | 33,664 | (914 | ) | (13,756 | ) | ||||||
| Income (loss) from continuing operations after tax and before equity in earnings of investee | 63,000 | (347 | ) | (27,546 | ) | ||||||
| Equity in earnings (losses) of investee after tax | 2,846 | 1,363 | (2,060 | ) | |||||||
| Income (loss) from continuing operations | 65,846 | 1,016 | (29,606 | ) | |||||||
| Income from discontinued operations after tax | 1,154 | 9,184 | 3,746 | ||||||||
| Net income (loss) | $ | 67,000 | $ | 10,200 | $ | (25,860 | ) | ||||
NOTE 23
Employee Benefit and Retirement Plans
Zenith offers a tax deferred savings plan organized under Section 401(k) of the Internal Revenue Code for all of its subsidiaries' eligible employees. Zenith matches 50% of employee contributions that are 6% or less of salary on a current basis and is not liable for any future payments under the plan. For the years ended December 31, 2003, 2002 and 2001, Zenith contributed $1.9 million, $1.7 million and $1.5 million, respectively.
Zenith also offers a stock purchase plan, under which all employees are able to purchase shares of Zenith National common stock at market value. Zenith matches 25% of all employee purchases. For the years ended December 31, 2003, 2002 and 2001, Zenith contributed $0.4 million, $0.4 million and $0.3 million, respectively.
NOTE 24
Related Parties
At December 31, 2003, companies controlled by Fairfax owned 7,822,000 shares, or 41%, of the total outstanding shares of common stock of Zenith National. Fairfax has disclaimed control of Zenith National in separate filings with the departments of insurance in California, Texas and New York. Fairfax has also granted a proxy covering all its shares of Zenith National to an individual trustee with instructions to vote the shares in proportion to the voting of all other Zenith National shareholders, subject to limited exceptions. Fairfax and Zenith have no common directors, management, employees or business infrastructure.
The following table shows Zenith's investment in its related parties, at fair value:
| December 31, (Dollars in thousands) | 2003 | 2002 | |||||
|---|---|---|---|---|---|---|---|
| Fairfax & subsidiaries: | |||||||
| Fairfax | $ | 17,209 | $ | 7,750 | |||
| Odyssey Re Holdings Corp | 27,246 | 26,948 | |||||
| Crum & Forster Holding Corp | 2,778 | ||||||
| TIG Capital Trust I | 2,400 | ||||||
| Wynn Resorts, Limited | 28,010 | 13,110 | |||||
Two of Zenith's Directors are also Directors of Wynn Resorts, Limited.
An affiliate of Fairfax purchased $30.0 million aggregate principal amount of the Convertible Notes in 2003. On December 5, 2001, Zenith National sold one million shares of its common stock, par value $1.00 per share, in
90
a private placement for $25.00 per share to a subsidiary of Odyssey Re.
Zenith's insurance operations conduct assumed and ceded reinsurance transactions with subsidiaries of Fairfax. Effective January 1, 2002, Zenith Insurance and a subsidiary of Odyssey Re entered into a 10% quota share ceded reinsurance agreement with respect to all new and renewal workers' compensation business written by Zenith Insurance in the three years commencing January 1, 2002. Also, in 2002, Zenith entered into an assumed quota share reinsurance contract with a Lloyd's syndicate managed by Advent Capital. The following table summarizes the reinsurance transactions with the subsidiaries of Fairfax and the Lloyd's syndicate:
| | Subsidiaries of Fairfax | Lloyd's syndicate | |||||||||||
|---|---|---|---|---|---|---|---|---|---|---|---|---|---|
| Years Ended December 31, (Dollars in thousands) | |||||||||||||
| 2003 | 2002 | 2003 | 2002 | ||||||||||
| Assumed Reinsurance: | |||||||||||||
| Assumed reinsurance premiums earned | $ | 2,569 | $ | 2,714 | |||||||||
| Loss and loss adjustment expenses incurred | 1,806 | 2,205 | |||||||||||
| Underwriting and other operating expenses | 455 | 225 | |||||||||||
| Assumed reinsurance premiums receivable | 9 | 928 | |||||||||||
| Unpaid loss and loss adjustment expenses | $ | 118 | $ | 118 | 3,175 | 2,036 | |||||||
| Unearned premiums | 2,388 | ||||||||||||
| Ceded Reinsurance: | |||||||||||||
| Ceded reinsurance premiums earned | 78,500 | 36,772 | |||||||||||
| Loss and loss adjustment expenses incurred | 41,283 | 22,063 | |||||||||||
| Underwriting and other operating expenses | 31,531 | 15,846 | |||||||||||
| Unpaid loss and loss adjustment expenses | 50,928 | 26,607 | |||||||||||
| Unearned premiums | 9,625 | 7,257 | |||||||||||
NOTE 25
Reclassification of Operating Expenses
For the purpose of financial reporting under both GAAP and statutory accounting, we identify our operating expenses among four broad categories of expense — loss adjustment expenses; policy acquisition expenses; investments expenses; and underwriting and other operating expenses. In the second quarter of 2003, the California Department of Insurance concluded its financial examination of our insurance subsidiaries, Zenith Insurance Company and ZNAT Insurance Company, and recommended that we review our methodology for allocating expenses in determining which expenses should be included among these categories. This was the only recommendation resulting from the Department of Insurance's financial examination. In the second quarter of 2003, we re-assessed the allocation of certain of our general operating expenses to determine whether or not these expenses should be classified as relating to claims and loss adjustment or whether they should be classified as other operating expenses. As a result, certain expenses that we had previously classified as related to claims and loss adjustment in our workers' compensation business are now classified as other operating expenses. We have reclassified expenses in the prior periods presented to conform to this revised classification. The reclassification of these expenses had no effect on net income or the combined ratios for any of the periods
91
presented herein. The effect on the periods presented is as follows:
| Years Ended December 31, (Dollars in thousands) | 2003 | 2002 | 2001 | ||||||||
|---|---|---|---|---|---|---|---|---|---|---|---|
| Effect on workers' compensation: | |||||||||||
| Decrease in loss and loss adjustment expenses incurred | $ | (5,225 | ) | $ | (20,923 | ) | $ | (18,357 | ) | ||
| Increase in underwriting and other operating expenses | 5,225 | 20,923 | 18,357 | ||||||||
| Net effect | $ | 0 | $ | 0 | $ | 0 | |||||
| Effect on workers' compensation ratios: | |||||||||||
| Decrease in loss and loss adjustment expenses incurred | (0.7 | %) | (4.2 | %) | (4.4 | %) | |||||
| Increase in underwriting and other operating expenses | 0.7 | % | 4.2 | % | 4.4 | % | |||||
| Net effect on combined ratios: | 0 | % | 0 | % | 0 | % | |||||
| Effect on total property and casualty ratios: | |||||||||||
| Decrease in loss and loss adjustment expenses incurred | (0.7 | %) | (3.8 | %) | (3.8 | %) | |||||
| Increase in underwriting and other operating expenses | 0.7 | % | 3.8 | % | 3.8 | % | |||||
| Net effect on combined ratios: | 0 | % | 0 | % | 0 | % | |||||
NOTE 26
Quarterly Financial Data (Unaudited)
Quarterly results for the years ended December 31, 2003 and 2002 were as follows:
| | 2003 Quarter Ended | ||||||||||||
|---|---|---|---|---|---|---|---|---|---|---|---|---|---|
| (Dollars in thousands, except per share data) | March 31 | June 30 | September 30 | December 31 | |||||||||
| Premiums earned | $ | 173,404 | $ | 185,457 | $ | 200,712 | $ | 214,226 | |||||
| Net investment income | 12,567 | 14,366 | 14,975 | 14,195 | |||||||||
| Realized gains on investments | 716 | 11,207 | 2,712 | 4,798 | |||||||||
| Income from continuing operations | 11,700 | 18,400 | 16,100 | 19,646 | |||||||||
| Income from discontinued operations | 1,154 | ||||||||||||
| Net income | $ | 11,700 | $ | 18,400 | $ | 16,100 | $ | 20,800 | |||||
| Net income per common share | |||||||||||||
| — basic | $ | 0.62 | $ | 0.98 | $ | 0.86 | $ | 1.10 | |||||
| — diluted | 0.62 | 0.97 | 0.85 | 0.92 | |||||||||
| | 2002 Quarter Ended | |||||||||||||
|---|---|---|---|---|---|---|---|---|---|---|---|---|---|---|
| (Dollars in thousands, except per share data) | March 31 | June 30 | September 30 | December 31 | ||||||||||
| Premiums earned | $ | 121,274 | $ | 127,530 | $ | 149,898 | $ | 158,353 | ||||||
| Net investment income | 12,662 | 12,808 | 11,960 | 11,381 | ||||||||||
| Realized (losses) gains on investments | (828 | ) | (26 | ) | 1,108 | (3,885 | ) | |||||||
| Income (loss) from continuing operations | 1,911 | 5,477 | 7,740 | (14,112 | ) | |||||||||
| Income from discontinued operations | 889 | 1,023 | 960 | 6,312 | ||||||||||
| Net income (loss) | $ | 2,800 | $ | 6,500 | $ | 8,700 | $ | (7,800 | ) | |||||
| Net income (loss) per common share | ||||||||||||||
| — basic | $ | 0.15 | $ | 0.35 | $ | 0.46 | $ | (0.42 | ) | |||||
| — diluted(1) | 0.15 | 0.34 | 0.46 | (0.42 | ) | |||||||||
(1) Additional common shares issuable under employee stock option plans using the treasury stock method are anti-dilutive for the fourth quarter of 2002 because there is a loss from continuing operations for that period.
The fourth quarter of 2002 includes write-downs for other-than-temporary declines in the fair values of investments of $3.8 million, before tax, and a charge of $30.0 million before tax for increased workers' compensation loss reserves.
Diluted net income per share in the fourth quarter of 2003 includes an additional 5.0 million shares that would be issuable in connection with the Convertible Notes (see Note 20). After tax interest expense related to the Convertible Notes of $1.3 million for the fourth quarter of 2003 is added back to net income in computing diluted earnings per share.
The table below shows the pro forma presentation of diluted earnings per share assuming that we had issued the Convertible Notes on January 1, 2001 and included the
92
5.0 million shares contingently issuable upon conversion during all periods presented:
| Years Ended December 31, (Dollars in thousands) | 2003 | 2002 | 2001 | ||||||||
|---|---|---|---|---|---|---|---|---|---|---|---|
| Income (loss) from continuing operations after tax as reported | $ | 65,846 | $ | 1,016 | $ | (29,606 | ) | ||||
| Plus interest expense on the notes after tax(1) | 3,911 | ||||||||||
| Pro forma income (loss) from continuing operations after tax | $ | 69,757 | $ | 1,016 | $ | (29,606 | ) | ||||
| Net income (loss) as reported | $ | 67,000 | $ | 10,200 | $ | (25,860 | ) | ||||
| Plus interest expense on the notes after tax(1) | 3,911 | ||||||||||
| Pro forma net income (loss) | $ | 70,911 | $ | 10,200 | $ | (25,860 | ) | ||||
| Diluted outstanding shares as reported | 20,183 | 18,895 | 17,593 | ||||||||
| Additional shares issuable assuming conversion of the notes(1) | 3,750 | 5,000 | |||||||||
| Pro forma diluted outstanding shares | 23,933 | 23,895 | 17,593 | ||||||||
| Diluted income (loss) from continuing operations per share: | |||||||||||
| As reported | $ | 3.33 | $ | 0.05 | $ | (1.68 | ) | ||||
| Pro forma | 2.91 | 0.04 | (1.68 | ) | |||||||
| Diluted net income (loss) per share: | |||||||||||
| As reported | 3.38 | 0.54 | (1.47 | ) | |||||||
| Pro forma | 2.96 | 0.43 | (1.47 | ) | |||||||
(1) After tax interest expense incurred in 2003 on the Convertible Notes is added back to net income for the period in calculating diluted EPS. Additional common shares issuable attributable to the conversion of the Convertible Notes would have been anti-dilutive for the year ended December 31, 2001 because there is a loss from continuing operations.
NOTE 27
Common Stock Market Prices (Unaudited)
The following table shows the high and low common stock prices during each quarter for the past two years.
| | 2003 | 2002 | ||||||
|---|---|---|---|---|---|---|---|---|
| Quarter Ended | High | Low | High | Low | ||||
| March 31 | $24.22 | $19.15 | $31.25 | $27.36 | ||||
| June 30 | 30.23 | 21.30 | 32.25 | 28.90 | ||||
| September 30 | 29.65 | 26.00 | 31.81 | 23.35 | ||||
| December 31 | 32.85 | 27.81 | 29.45 | 22.00 | ||||
As of March 3, 2004, there were 229 registered holders of record of Zenith National common stock.
93
REPORT OF INDEPENDENT REGISTERED PUBLIC ACCOUNTING FIRM
To the Stockholders and Board of Directors of
Zenith National Insurance Corp.:
In our opinion, the accompanying consolidated balance sheets and the related consolidated statements of operations, cash flows, stockholders' equity and comprehensive income present fairly, in all material respects, the financial position of Zenith National Insurance Corp. and subsidiaries (the "Company") at December 31, 2003 and 2002, and the results of their operations and their cash flows for each of the three years in the period ended December 31, 2003, in conformity with accounting principles generally accepted in the United States of America. These financial statements are the responsibility of the Company's management. Our responsibility is to express an opinion on these financial statements based on our audits. We conducted our audits of these statements in accordance with the standards of the Public Company Accounting Oversight Board (United States). Those standards require that we plan and perform the audit to obtain reasonable assurance about whether the financial statements are free of material misstatement. An audit includes examining, on a test basis, evidence supporting the amounts and disclosures in the financial statements, assessing the accounting principles used and significant estimates made by management, and evaluating the overall financial statement presentation. We believe that our audits provide a reasonable basis for our opinion.
As discussed in Note 2 to the Consolidated Financial Statements, effective January 1, 2002, the Company adopted the provisions of Statement of Financial Accounting Standards No. 142, "Goodwill and Other Intangible Assets."
PricewaterhouseCoopers LLP
Los Angeles, California
February 6, 2004
94
CORPORATE DIRECTORY
CORPORATE DIRECTORY
Zenith National Insurance Corp.
Directors
Also Directors of
Zenith Insurance Company
Max M. Kampelman
Attorney, Of Counsel,
Fried, Frank, Harris,
Shriver & Jacobson
Robert J. Miller
Attorney, Senior Partner,
Jones Vargas
Leon E. Panetta
Founder and Director,
The Leon & Sylvia Panetta
Institute for Public Policy
Alan I. Rothenberg
Attorney; Chairman, First Century Bank;
Retired Partner,
Latham & Watkins LLP
William S. Sessions
Attorney,
Holland & Knight LLP
and Security Consultant
Gerald Tsai, Jr.
Management of
Private Investments
Michael Wm. Zavis
Attorney, Retired Founding Partner,
Katten Muchin Zavis Rosenman
Stanley R. Zax
Chairman of the Board
and President
Executive Officers
Stanley R. Zax
Chairman of the
Board and President
Jack D. Miller
Executive Vice President
Robert E. Meyer
Senior Vice President
William J. Owen
Senior Vice President,
Chief Financial Officer
and Treasurer
John J. Tickner
Senior Vice President
and Secretary
Officer
Hyman J. Lee Jr.
Vice President
Transfer Agent-
Common Stock
Mellon Investor Services LLC
85 Challenger Road
Ridgefield Park, NJ 07660
www.melloninvestor.com
Transfer Agent-
8.55% Capital Securities
Wells Fargo Corporate Trust Services
Wells Fargo Bank, National Association
Minneapolis, MN
Transfer Agent-
Convertible Senior Notes
Wells Fargo Corporate Trust Services
Wells Fargo Bank, National Association
Minneapolis, MN
Corporate
Headquarters
21255 Califa Street
Woodland Hills, CA 91367
(818) 713-1000
NYSE Trading Symbol
Common Stock — ZNT
Independent Registered
Public Accounting Firm
PricewaterhouseCoopers LLP
Los Angeles, CA
The Annual Report
on Form 10-K for the year ended December 31, 2003, quarterly
reports on Form 10-Q, current
reports on Form 8-K and all
amendments to these reports may
be obtained at our website at www.thezenith.com or free of
charge upon written request to:
Chief Financial Officer
Zenith National Insurance Corp.
21255 Califa Street
Woodland Hills, CA 91367
Website
www.thezenith.com
96
CORPORATE DIRECTORY
Zenith Insurance Company
Officers
Stanley R. Zax
Chairman of the
Board and President
Jack D. Miller
Executive Vice President
and Chief Operating Officer
Robert E. Meyer
Senior Vice President
and Chief Actuary
William J. Owen
Senior Vice President,
Chief Financial Officer, Treasurer
and Assistant Secretary
John J. Tickner
Senior Vice President,
General Counsel and Secretary
Stephen J. Albers
Senior Vice President
Bryan A. Anderson
Senior Vice President
Ron R. Cordova
Senior Vice President
Anita Devan
Senior Vice President
Eden M. Feder
Senior Vice President
Dan M. Hair
Senior Vice President
John C. Hasbrouck
Senior Vice President
Robert L. Hernandez
Senior Vice President
Westley M. Heyward
Senior Vice President
Fred A. Hunt
Senior Vice President
Corey A. Ingber
Senior Vice President
Matthew A. Jacobson
Senior Vice President
Denise M. Koestner
Senior Vice President
Edward G. Krisak
Senior Vice President
Jonathan W. Lindsay
Senior Vice President
William J. Saake
Senior Vice President
Keith E. Trotman
Senior Vice President
Chris L. Uselton
Senior Vice President
John H. Weber
Senior Vice President
Glen R. Zepnick
Senior Vice President
A. Mary Ames
Vice President
Rhen C. Bass
Vice President
Jenny S. Baum
Vice President
Brian R. Beams
Vice President
Jeffrey J. Beaudoin
Vice President
Kathleen M. Burns
Vice President
Linda J. Carmody
Vice President
Suzanne M. Chapan
Vice President
Duane H. Chernow
Vice President
Douglas A. Claman
Vice President
Jason T. Clarke
Vice President
Ronald W. Crabtree
Vice President
Mark T. Cross
Vice President
Gerald D. Curtin
Vice President
Charles J. Davis
Vice President
Bradley C. Eastwood
Vice President
J. Rae Farese
Vice President
F. Stephen Fetchet
Vice President
Stephen T. Frye
Vice President
Michael B. Gillikin
Vice President
James C. Guidos
Vice President
Keith Hanenian
Vice President
Diane H. Heidenreich
Vice President and Assistant
General Counsel
Jackie C. Hilston
Vice President
Carolyn N. Hinson
Vice President
David G. Hoppen
Vice President
Mark M. Jansen
Vice President
Lisa A. Krouse
Vice President
Hyman J. Lee Jr.
Vice President and
Assistant Secretary
Donald C. Marshall
Vice President
Michael R. McFadden
Vice President
Timothy I. Mertz
Vice President
Colin S. Mitchell
Vice President
David A. O'Connor
Vice President
Charlene C. Ossler
Vice President
S. Daniel Petrula
Vice President
Tracy S. Pletcher
Vice President
Alan I. Steinhardt
Vice President
John A. Swift
Vice President
Norman C. Winters
Vice President
97
CORPORATE DIRECTORY
TheZenith Marketing, Underwriting and Claims Offices
Los Angeles, CA
Corporate Headquarters
and Los Angeles Regional Office
21255 Califa Street
Woodland Hills, CA 91367
(818) 713-1000
www.thezenith.com
San Diego, CA
1660 N. Hotel Circle Drive
Suite 400
San Diego, CA 92108
(800) 533-6212
San Francisco, CA
425 California Street
Suite 1010
San Francisco, CA 94104
(415) 986-0187
Pleasanton, CA
4309 Hacienda Drive
Suite 200
Pleasanton, CA 94588
(925) 460-0600
Sacramento, CA
1601 Response Road
Suite 200
Sacramento, CA 95815
(800) 677-1104
Fresno, CA
575 E. Locust Avenue
Suite 101
Fresno, CA 93720
(559) 432-6660
Austin, TX
1101 Capitol of Texas Hwy.
South Bldg. J
Austin, TX 78746
(512) 306-1700
Blue Bell, PA
2 Valley Square
Suite 301
Blue Bell, PA 19422
(877) 311-0703
Springfield, IL
2105 W. White Oaks Drive
Springfield, IL 62704
(217) 726-2900
Lisle, IL
701 Warrenville Road
Suite 300
Lisle, IL 60532
(800) 446-7304
Sarasota, FL
1390 Main Street
Sarasota, FL 34236
(941) 906-2000
Orlando, FL
3504 Lake Lynda Drive
Suite 400
Orlando, FL 32817
(800) 999-3242
Charlotte, NC
900 W. Trade Street
900 Building, 6th Floor
Charlotte, NC 28202
(800) 200-2667
Birmingham, AL
10 Inverness Center Parkway
Suite 220
Birmingham, AL 35242
(800) 355-0708
98