ZENITH NATIONAL INSURANCE CORP. 2006
ANNUAL REPORT 2006
FINANCIAL HIGHLIGHTS
Year Ended December 31,
| | 2006
| | 2005
| | 2004
| |
|
|---|
|
|---|
RESULTS OF OPERATIONS: |
|
|
(Dollars in thousands, except per share data) |
|
|
| Total revenues | | $ | 1,063,888 | | $ | 1,280,124 | | $ | 1,044,880 | | |
| Net investment income after tax | | | 70,926 | | | 53,358 | | | 42,265 | | |
| Realized gains on investments after tax | | | 8,695 | | | 14,446 | | | 24,726 | | |
Income from continuing operations after tax |
|
$ |
258,700 |
|
$ |
156,447 |
|
$ |
117,714 |
|
|
| Gain on sale of discontinued real estate segment after tax (1) | | | | | | 1,253 | | | 1,286 | | |
| | |
| |
| |
| | |
| Net income | | $ | 258,700 | | $ | 157,700 | | $ | 119,000 | | |
| | |
| |
| |
| | |
PER SHARE DATA (2): |
|
|
|
|
|
|
|
|
|
|
|
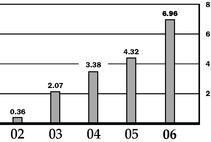
| Income from continuing operations after tax | | $ | 6.96 | | $ | 4.29 | | $ | 3.35 | | |
| Gain on sale of discontinued real estate segment after tax (1) | | | | | | 0.03 | | | 0.03 | | |
| | |
| |
| |
| | |
| Net income | | $ | 6.96 | | $ | 4.32 | | $ | 3.38 | | |
| | |
| |
| |
| | |
| Cash dividends declared per common share | | $ | 1.26 | | $ | 0.94 | | $ | 0.75 | | |
KEY STATISTICS: |
|
|
|
|
|
|
|
|
|
|
|
| Underwriting income (loss) before tax (3): | | | | | | | | | | | |
| Workers' compensation | | $ | 313,576 | | $ | 213,244 | | $ | 104,098 | | |
| Reinsurance | | | (20,508 | ) | | (56,183 | ) | | (11,956 | ) | |
| Combined ratios (4): | | | | | | | | | | | |
| Workers' compensation | | | 66.3 | % | | 80.9 | % | | 88.5 | % | |
| Reinsurance | | | 264.4 | % | | 187.1 | % | | 128.2 | % | |
| Stockholders' equity | | $ | 940,720 | | $ | 712,795 | | $ | 502,147 | | |
| Stockholders' equity per share | | | 25.41 | | | 19.14 | | | 17.28 | | |
| Closing common stock price | | | 46.91 | | | 46.12 | | | 33.23 | | |
(1) In 2002, we sold our home-building business and related real estate assets. Gains of $1.9 million and $2.0 million before tax ($1.3 million and $1.3 million after tax) were recorded from additional sales proceeds received in 2005 and 2004, respectively, under the earn-out provision of the sale. The last such payment under the earn-out provision was received in 2005.
(2) Diluted per share amounts reflect the impact of additional shares issuable in connection with our 5.75% Convertible Senior Notes.
(3) Underwriting income (loss) before tax from the workers' compensation and reinsurance segments is determined by deducting net loss and loss adjustment expenses incurred and underwriting and other operating expenses incurred from net premiums earned.
(4) The combined ratio, expressed as a percentage, is a key measurement of profitability traditionally used in the property-casualty insurance business. The combined ratio is the sum of the loss and loss adjustment expense ratio and the underwriting and other operating expense ratio. The loss and loss adjustment expense ratio is the percentage of net incurred loss and loss adjustment expenses to net premiums earned. The underwriting and other operating expense ratio is the percentage of underwriting and other operating expenses to net premiums earned. The key operating goal for our insurance segments is to achieve a combined ratio of 100% or lower and to achieve a workers' compensation combined ratio that is at least three percentage points lower than the combined ratio of the national workers' compensation industry.
1
TABLE OF CONTENTS
| • | Letter to Stockholders | | 3 |
• |
Accident Year Reserve Development From Operations |
|
23 |
• |
Stock Price Performance |
|
24 |
• |
Management's Discussion and Analysis of Consolidated
Financial Condition and Results of Operations |
|
25 |
• |
5-Year Summary of Selected Financial Information |
|
54 |
• |
Consolidated Balance Sheets |
|
56 |
• |
Consolidated Statements of Operations |
|
57 |
• |
Consolidated Statements of Cash Flows |
|
58 |
• |
Consolidated Statements of Stockholders' Equity and Consolidated Statements of Comprehensive Income |
|
60 |
• |
Notes to Consolidated Financial Statements |
|
61 |
• |
Report of Independent Registered Public Accounting Firm |
|
87 |
• |
Certifications and Management's Report on Internal Controls over Financial Reporting |
|
89 |
• |
Corporate Directory |
|
|
|
Zenith National Insurance Corp. |
|
94 |
|
Zenith Insurance Company |
|
95 |
|
Zenith Office Locations |
|
96 |
TheZenith and Zenith are registered U.S. trademarks.
2
TO OUR STOCKHOLDERS
2006 marked my 30th year as your Chairman, and on this occasion I am particularly pleased to report record earnings and earnings per share as a result of our 2006 workers' compensation underwriting performance. I thank our entire staff for their excellent work and invite each and every one to join me with a sense of pride for attaining this achievement.
Net income was $258.7 million or $6.96 per share, compared to $157.7 million or $4.32 per share in 2005. Losses from our reinsurance business, which we have exited and is in runoff, reduced 2006 net income by $13.3 million or $0.36 per share and reduced 2005 net income by $36.5 million or $0.99 per share.
Financial reports include both our workers' compensation and reinsurance operations. Claim trends continue to be favorable in the workers' compensation segment, delivering substantial underwriting profits and positive cash flow for investment. However, the reinsurance business had a negative impact due to the loss development associated with 2004 and 2005 hurricanes.
Zenith's investment income increased from $79.2 million to $106.3 million due primarily to an increase in the average yield of the portfolio where about 35% is held in securities with a maturity of one year or less.
Our financial strength was significantly improved as a result of our 2006 workers' compensation performance and increased investment income, offset, in part, by additional reinsurance losses. Stockholders' dividends were increased 34% during the year to an annual rate of $1.40 per share; an aggregate of $458.7 million in dividends has been declared over the past 30 years.
We approach the New Year with optimism because we believe our specialist workers' compensation experience and service strategy will continue to support favorable results for our policyholders, claimants and stockholders alike. Zenith's staff is committed to managing risk in a professional manner and we are pursuing our new initiative to expand the highest quality healthcare services to our seriously injured claimants to help them return to work and productivity while recovering from job-related injuries. Maximizing stockholder value over the long-term is our
3
RECORD EARNINGS AND EARNINGS PER SHARE ARE A RESULT OF OUR 2006 WORKERS' COMPENSATION UNDERWRITING PERFORMANCE.
fundamental objective which is supported by our highly effective business and service model. Competition is always present in our business, however it is more intense at this time in California than during the recent past. Our long-term underwriting and pricing philosophy has been to forego market share in favor of maintaining profitablity in a competitive price market.
We have strong corporate governance practices with excellent controls and our disclosures provide full transparency.
As always, the primary thrust of these annual reports is to address the future, its challenges and opportunities. However, please indulge me in a moment of reminiscence.
Thirty years ago back in 1977, our after-tax profit was $3.0 million, stockholders' equity was $12.9 million and our total assets were $88.9 million. Certain goals and commitments were expressed at that time such as achieving above-average underwriting performance over a sustained period of time, and sharing our success with our talented people in the form of bonuses and stock options.
Management and staff have delivered. Total stockholders' dividends declared since 1978 were $458.7 million, stock repurchases totaled $151.0 million and stockholders' equity is $940.7 million at year-end. Our people have performed beyond our expectations, as we continue to focus on further progress to reach our full potential.
As one of my dear friends and a Zenith stockholder says, "Only in America!"
FINANCIAL SUMMARY — 2006 & 2005
Net Income: + 64.0%.
Workers' Compensation Underwriting Income: + 47.1%.
Investment Income: + 34.2%.
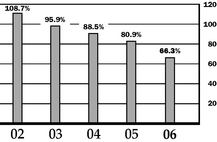
Workers' Compensation Combined Ratio: 66.3% v. 80.9%.
Stockholders Equity: + 32.0%.
Return on Average Equity: 31.8% v. 26.3%.
Stockholders' Dividends Declared: + 34.0%.
4
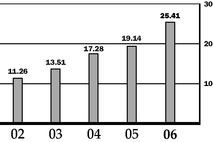
STOCKHOLDERS' EQUITY PER SHARE
ANALYSIS
The following table summarizes pre-tax workers' compensation and reinsurance underwriting results during the past three years:
| |
|---|
Segment Income (Loss)
| | 2006
| | 2005
| | 2004
| |
|---|
| |
|---|
| | | | (Dollars in thousands) | |
| Workers' Compensation | | $ | 313,576 | | $ | 213,244 | | $ | 104,098 | |
Reinsurance |
|
|
(20,508 |
) |
|
(56,183 |
) |
|
(11,956 |
) |
| |
2006 results improved compared to 2005 in several key areas:
- •
- Net income increased by $101.0 million.
- •
- Workers' compensation underwriting results improved by $100.3 million.
- •
- Reinsurance underwriting results improved by $35.7 million.
- •
- Investment income pre-tax increased by $27.1 million.
- •
- Workers' compensation calendar year combined ratio was 66.3% in 2006 compared to 80.9%.
- •
- Favorable workers' compensation loss reserve development increased to $161.3 million from $26.3 million.
- •
- Workers' compensation accident year combined ratio was 80.0% compared to 81.8%.
- •
- Stockholders' equity at December 31, 2006 was $940.7 million compared to $712.8 million, a 32.0% increase in contrast to the property-casualty industry growth in surplus of 13.5% as estimated by A.M. Best Company.
- •
- Stockholders' equity, plus dividends paid to stockholders, has grown at an annual rate of 24.5% for one year, 23.7% for three years and 17.7% for five years.
- •
- Stockholders' equity per share was $25.41 compared to $19.14.
- •
- Dividends declared to stockholders were $47.0 million compared to $33.4 million.
5
STOCKHOLDERS' EQUITY AT DECEMBER 31, 2006 WAS $940.7 MILLION COMPARED TO $712.8 MILLION AT DECEMBER 31, 2005; PER SHARE WAS $25.41 COMPARED TO $19.14.
The most frequently asked question I receive from investors is why don't we repurchase common stock. There are several reasons:
- 1.
- After doing so in the 1990's, it was difficult to see how our stockholders benefited. This would be particularly true today with the stock selling substantially above book value.
- 2.
- Increased dividends, we believe, are the best way of sharing our success with stockholders.
- 3.
- The assumption that we have excess capital in substantial amounts may or may not be reasonable. As a specialist with concentrations of business in California and Florida, we are prevented from receiving higher ratings from rating agencies despite our performance. Equally important, we are always searching for additional beneficial opportunities to apply our capital in our business or through acquisitions.
- 4.
- We do not want to interfere with the liquidity in our common stock.
- 5.
- Weakening our financial strength by borrowing large sums in order to buy a material amount of stock is not prudent.
RESERVES
Information in the table on page 23 provides estimates of Zenith's net incurred loss and loss adjustment expenses for our workers' compensation and reinsurance segments by accident year, evaluated in the year they were incurred and as they were subsequently evaluated in succeeding years. These data are of critical importance in judging the historical accuracy of our reserve estimates, as well as providing a guide to setting fair prices and rates. The accuracy of reserve estimates is one of our major business risks which we endeavor to manage professionally. It is not realistic to believe that 100% accuracy is achievable when forecasting the future. As a result, loss reserve estimates are refined continually in an ongoing process as experience develops, new information is obtained and evaluated, and claims are reported and paid. The inflation or deflation trend of paid claim costs in
6
NET INCOME PER COMMON SHARE
recent years, compared to the assumptions included in the loss reserve estimates for each accident year, is the most important factor at this time in understanding our reserve situation. Data from 2003, 2004, and 2005 indicate deflation for the recent accident years compared to substantial inflation in prior years. The primary causes of these developments are the California legislative reforms enacted in 2003 and 2004, Florida reforms enacted in 2003, and the long-term trend of declining claim frequency. Due to the relatively small sample of paid claim amounts compared to estimated total claim costs for 2003 through 2006, and the small percentage of costly claims settled, inflation estimates in loss reserves are higher than short-term paid deflation rates and our actuaries' view of future trends. As a result, financial statement reserves currently exceed our actuaries' point estimates. This is necessary due to the length of time required to settle long-term cases post reforms, uncertainties in the long-term outcome of the reforms and the fact that in the not-too-distant past, before the reforms, our track record of reserving accuracy was weak. In order to refine our loss reserve estimates, new models have been created which should bring the actuarial and accounting results into alignment quicker as new data are received and the risk of major change diminishes. The key factors influencing the result of the model and the exercise of our judgment are the timing of claim settlements and the ultimate number of higher-cost claims. For additional information about reserving and inflation trends, please turn to pages 33 to 40 of this report.
Estimating catastrophe losses in the reinsurance business is highly dependent upon the nature of the event and our ability to obtain timely and accurate information with which to estimate our liability for losses. Given our limited involvement in this business, industry models do not really help in establishing estimated loss reserves. There remains the possibility of additional losses associated with the hurricanes in 2004 and 2005 and the casualty business written earlier, although at this point we do not believe there is material exposure to adverse loss development.
7
DIVIDENDS DECLARED TO SHAREHOLDERS WERE $47.0 MILLION IN 2006 COMPARED TO $33.4 MILLION IN 2005.
INVESTMENTS
Investment activities are a major part of our revenues and earnings; we believe our portfolio is diversified to achieve a reasonable balance of risk and a stable source of earnings. Regulations require Zenith to primarily invest in debt securities, as compared to equity securities; our largest holdings are cash and short-term U.S. Government securities. Compared to other insurers we believe our portfolio consists of a smaller percentage of equity securities to total assets and a larger percentage of cash or short-term securities, with no derivative securities or credit enhancement exposure.
- •
- Zenith's investment portfolio was $2.3 billion at year end.
- •
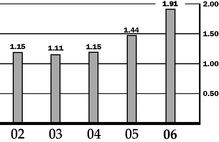
- Consolidated investment income after tax and after interest expense was $67.5 million, or $1.82 per share in 2006 compared to $47.7 million, or $1.35 per share in 2005. Average yields on this portfolio in 2006 were 4.8% before tax and 3.2% after tax compared to 3.9% and 2.6%, respectively, in 2005.
- •
- During 2006, Zenith recorded capital gains before tax of $13.4 million compared to $22.2 million the prior year.
- •
- Net unrealized gains in our portfolio were $19.1 million before tax at year end 2006 compared to $1.5 million before tax at year end 2005. The increase is due to higher unrealized gains on equity investments, partially offset by higher unrealized losses on fixed maturity investments as a result of increases in interest rates.
- •
- Zenith's investment portfolio is recorded in the financial statements primarily at market value. Average maturity of the fixed maturity portfolio was 3.7 years at December 31, 2006 compared to 3.8 years at December 31, 2005. The portfolio quality is high, with 93% and 95% of fixed maturity securities rated investment grade at December 31, 2006 and 2005, respectively.
8
INVESTMENT INCOME AFTER TAX PER SHARE
The major developments affecting the U.S. bond markets were increasing inflation, narrower spreads between corporate and government bonds and fluctuating interest rates with the Federal Reserve Board raising short-term rates, pausing at mid-year. Long-term rates ended the year at a 4.81% yield for 30-year U.S. Government bonds compared to 4.54% the prior year. Since we are capable of holding bonds to maturity, and the average maturities are relatively short, fluctuations in bond values do not significantly impact our operations.
Short-term investments and liquidity remain high as we search for investment opportunities. Concerns about the economy, politics, inflation and geopolitical issues suggest a continuation of higher cash holdings than would otherwise be the case. We have invested only a small amount of our capital in common stocks, since we believe the volatility in the market could impact our ability to expand our insurance business.
|
|---|
Securities Portfolio
| At December 31, 2006
| | At December 31, 2005
|
|---|
|
|---|
| Amortized Cost*
| Market Value
| | Amortized Cost*
| Market Value
|
|---|
|
|---|
| | (Dollars in Thousands) |
Short-term investments:
U.S. Govt. and other securities
maturing within 2 years | $944,796 | $943,720 | | $1,153,516 | $1,151,982 |
| Other fixed maturity securities: | | | | | |
| Taxable, investment grade | 915,888 | 909,468 | | 706,382 | 706,746 |
| Taxable, non-investment grade | 156,619 | 154,749 | | 78,457 | 76,582 |
| Municipal bonds | 133,887 | 132,414 | | 125,926 | 124,001 |
| Redeemable preferred stocks | 26,094 | 26,727 | | 25,436 | 26,685 |
| Other preferred stocks* | 2,819 | 2,818 | | 3,317 | 3,328 |
| Common stocks* | 66,195 | 95,500 | | 64,731 | 69,976 |
| Other* | 7,616 | 7,616 | | 7,402 | 7,402 |
|
| Total | $2,253,914 | $2,273,012 | | $2,165,167 | $2,166,702 |
|
*Equity securities and other investments at cost. |
9
INVESTMENT INCOME INCREASED FROM $79.2 MILLION IN 2005 TO $106.3 MILLION IN 2006 DUE PRIMARILY TO AN INCREASE IN THE AVERAGE YIELD OF THE PORTFOLIO.
WORKERS' COMPENSATION
Zenith is a workers' compensation specialist with 56 years of experience supporting primary operations in California and Florida, with additional business in 43 other states. We estimate that Zenith ranks among the top five underwriters in California and Florida, the two states in which we conduct approximately 85% of our business. Our philosophy does not include any planned goals as to size, market share or ranking, but is focused entirely on providing quality services to our insureds and claimants, generating underwriting profits and delivering an above-average return to our stockholders over time.
Gross premiums written in 2006 were $939.5 million, a decrease of 17.5% from the prior year, with California premiums representing 61.9% of the total. The decrease in premiums is due primarily to rate reductions in California and Florida, and our California pricing and underwriting strategy in comparison to our competition. Profits before tax in this segment were a record $313.6 million in 2006 compared to $213.2 million in 2005. During the past five years, our profit from this segment was $616.3 million, or 14.8% of earned premium.
Zenith's combined ratio (ratio of losses and expenses to total premiums) improved to 66.3% in 2006 from 80.9% the prior year. Industry combined ratios for workers' compensation are estimated at 95.5% and 102.4% for 2006 and 2005, respectively. Profits resulted from improved accident year loss ratios and reserve releases from prior years. Claim cost deflation in recent years as set forth on the schedule on page 37 has led to the release of reserves in the current year and if new data continue to indicate stability in our claim costs, additional reserve releases can be anticipated as the reserving risk diminishes. The lowering of loss ratios in earlier years also has the impact of lowering accident year loss ratios in the current year assuming all other factors remain constant. Obviously, the reverse would also be true if claim costs were increasing.
10
WORKERS' COMPENSATION PREMIUM EARNED
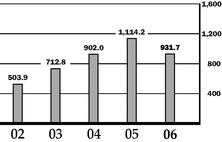
(in millions)
Improved profitability has been shared with our customers in California and Florida as indicated by the rate reductions in the following table:
| |
|---|
Effective Date of Change
| | California
| | Florida
| |
|---|
| |
|---|
| January 1, 2004 | | 0.0 | % | 0.0 | % |
| July 1, 2004 | | 10.0 | | | |
| January 1, 2005 | | 2.0 | | 4.0 | |
| July 1, 2005 | | 12.0 | | | |
| January 1, 2006 | | 13.0 | | 13.4 | |
| July 1, 2006 | | 5.0 | | | |
| January 1, 2007 | | 4.4 | | 12.5 | |
| |
In addition to the above, further price reductions have resulted from lower experience modifications and individual pricing adjustments which are measured retroactively, and, therefore, filed rates alone do not provide a complete picture. We have also paid dividends to our policyholders of $24.9 million in 2006, $4.4 million in 2005 and $2.8 million in 2004.
Declining claim frequency and severity and reduced rates to our customers are the major business trends during the past few years. These factors have resulted in improved profitability, lower accident year loss ratios and strengthened reserve performance. Deflation relating to claim costs is clearly evident in the schedule on page 37 as are the assumptions relating to establishing loss reserves in our financial statements. Due to the uncertainties indicated, our California rate changes have lagged short-term cost decreases and our competitors' pricing, consistent with our long-term strategy of maintaining price discipline.
11
ZENITH WORKERS' COMPENSATION COMBINED RATIO (RATIO OF LOSSES AND EXPENSES TO TOTAL PREMIUMS) IMPROVED TO 66.3% IN 2006 FROM 80.9% THE PRIOR YEAR.
Comparative workers' compensation accident year loss ratios both within and outside California compared to rating bureau estimated loss ratios are set forth in the following table:
|
|---|
| | California
| | Outside of California
|
|---|
Accident Year
Loss Ratios
|
|---|
| | Zenith
| | Industry
| | Zenith
| | Industry
|
|---|
|
|---|
| 2000 | | 87% | | 123% | | 57% | | 89% |
| 2001 | | 78% | | 104% | | 58% | | 78% |
| 2002 | | 64% | | 81% | | 50% | | 70% |
| 2003 | | 44% | | 52% | | 42% | | 64% |
| 2004 | | 33% | | 31% | | 37% | | 61% |
| 2005 | | 29% | | 30% | | 34% | | 60% |
| 2006 | | 34% | | — | | 33% | | — |
The California portion of the table indicates that during 2000 to 2003 we have loss ratios substantially below industry averages, and thereafter they are about even with industry averages. The 2004 and 2005 relationships may be temporary and primarily a result of our assumptions in loss reserve estimates compared to the industry at this time. As time passes and actual data replace estimates for both Zenith and the industry, we expect the traditional relationship to reappear. This can occur by Zenith's loss ratios going down, the industry's going up or some combination of the two. In this regard, the California Rating Bureau also estimates that insurers' reserves are $8.2 billion overstated.
Favorable long-term results as compared to the industry are due to a number of factors: workers' compensation specialization, a long-standing goal and culture to achieve underwriting profitability, application of our own actuarial rates in California, well-established agency relationships, reasonable (not perfect) reserving accuracy, disciplined underwriting, technical support for our services, our commitment to quality and intelligent risk taking. Most importantly, the focus on underwriting
12
WORKERS' COMPENSATION COMBINED RATIO
profits, decentralization in tandem with adequate controls, low turnover of key employees and improving service capabilities (particularly the integration of claims, legal and health experts) make a significant difference. Profitable industry results in California and a growing economy continue to provide an attractive operating environment. Legislative reforms have resulted in dramatic initial short-term benefits to our customers to a greater extent than could have been reasonably anticipated when they were enacted. Industry results that project 2004 and 2005 accident year combined ratios of 54% are unprecedented and unbelievable. As a result, prices have dropped substantially and competition in the California market place is more aggressive. Also, in many cases lower prices for our customers result from declining rates combined with reduced experience modification factors.
Zenith adheres to disciplined and consistent underwriting and customer service principles, and a commitment to pricing strategies based on realistic assumptions anticipated to generate an underwriting profit. Significantly, our agents and brokers offer numerous opportunities for business, however, we are selective and successful in writing only a small proportion of the prospective new accounts. We do, however, write a substantial percentage of renewal accounts; testimony to our mission of customer satisfaction. Based on current market conditions, we expect California to continue to be our most important and profitable market. Underwriting profit margins will be primarily dependent upon new data relating to claim cost trends and the frequency of the more costly claims, partially offset by rate decreases. In other words, will the current short-term benefits from reforms continue throughout the entire claim cycle of a given accident year? Due to the importance of the reforms and the short period since their adoption we do not know the answer to this important question nor do we know whether the trends from claim patterns prior to the reforms will re-assert themselves.
13
RESERVE ADEQUACY IS STRONG AS FINANCIAL STATEMENT RESERVES EXCEED ACTUARIAL POINT ESTIMATE IN CONCERT WITH CONTINUING CLAIM COST DEFLATION.
We measure our progress based on payroll trends which we believe is a more accurate assessment of size and exposure, rather than premiums or policy count. The following five-year table compares premiums, payroll and policy count both within and outside of California.
|
|---|
| | California
| | Outside California
| | Total
|
|---|
| | Premiums
In-Force
| | Policies
In-Force
| | Insured
Payrolls
| | Premiums
In-Force
| | Policies
In-Force
| | Insured
Payrolls
| | Premiums
In-Force
| | Policies
In-Force
| | Insured
Payrolls
|
|---|
|
|---|
| | | | (Dollars in millions) |
| December 31, 2006 | | $ | 501.2 | | 24,600 | | $ | 9,200.3 | | $ | 332.8 | | 17,200 | | $ | 12,404.5 | | $ | 834.0 | | 41,800 | | $ | 21,604.8 |
| December 31, 2005 | | | 722.9 | | 27,500 | | | 9,930.3 | | | 326.9 | | 16,900 | | | 11,236.3 | | | 1,049.8 | | 44,400 | | | 21,166.6 |
| December 31, 2004 | | | 731.3 | | 27,200 | | | 9,310.0 | | | 311.0 | | 16,200 | | | 10,410.5 | | | 1,042.3 | | 43,400 | | | 19,720.5 |
| December 31, 2003 | | | 587.9 | | 25,900 | | | 7,476.8 | | | 277.8 | | 15,600 | | | 8,974.8 | | | 865.7 | | 41,500 | | | 16,451.6 |
| December 31, 2002 | | | 350.2 | | 22,600 | | | 6,606.6 | | | 259.2 | | 16,900 | | | 8,562.0 | | | 609.4 | | 39,500 | | | 15,168.6 |
| December 31, 2001 | | | 210.4 | | 19,100 | | | 5,556.9 | | | 209.7 | | 16,400 | | | 7,468.7 | | | 420.1 | | 35,500 | | | 13,025.6 |
|
Our five year growth in payrolls was 66% with the current year at 2%, primarily a result of reduced payrolls in California due to our pricing and underwriting strategy in comparison to our competition, which is more than offset by increases in payroll outside California. The table also shows that payrolls are larger outside California which is the opposite of premiums.
Claim frequency trends in 2006 remained favorable as they have for a number of years. We observed a significant drop in the frequency of our highest-cost California claims for the first time, and if this trend continues it will bode well for the ongoing deflation of our claim costs. The following table shows the trend in the number of California permanent partial disability ("PPD") claims (our highest cost claims) at various dates:
|
|---|
| | Number of California PPD Claims Reported after Number of Months
|
|---|
Accident Year
| | 12
| | 24
| | 36
| | 48
| | 60
|
|---|
|
|---|
| 2002 | | 3,320 | | 2,820 | | 2,735 | | 2,715 | | 2,683 |
| 2003 | | 4,091 | | 3,117 | | 2,912 | | 2,861 | | |
| 2004 | | 3,972 | | 2,862 | | 2,668 | | | | |
| 2005 | | 3,346 | | 2,641 | | | | | | |
| 2006 | | 2,236 | | | | | | | | |
|
14
DECLINING CLAIM FREQUENCY AND SEVERITY, REDUCED RATES TO OUR CUSTOMERS AND INCREASED COMPETITION ARE THE MAJOR BUSINESS TRENDS DURING THE PAST FEW YEARS.
The claims data in the table on page 14 represent approximately 20% of the California claims reported in an accident year and about 90% of the costs. As is evident, the ultimate number of claims is not apparent until about 36 months. This reduction of reported claims for the 2006 accident year will be monitored closely to see how it evolves during the next two years. Since the average cost of these types of claims is approximately $75,000, a permanent frequency reduction as indicated above would be material.
Severity trends in recent years have continued at reduced levels and our ultimate loss estimates reflect caution regarding the long-term outcome of the reform legislation. Severity impact is caused primarily by healthcare and pharmacy cost treatment trends, the duration and amount of temporary disability, benefit levels and permanent disability ratings. California reforms have required that we become more effective in dealing with healthcare issues than in the past. Healthcare inflation, in general, continues to increase in the 8-9% range per year. In contrast, California workers' compensation healthcare costs have declined from 2002-2005. It is unclear whether this short-term trend will continue or materially reflect the long-term pattern of increases. Historically, long-term trends tend to be interrupted for relatively short periods, but the current situation may prove different due to medical networks, utilization guidelines and peer review, plus the rescinding of the treating physician presumption. While it is obvious, it is worth saying, the longer healthcare costs for our business remain at reduced levels and claim cost deflation continues, the more beneficial it will be for our customers and stockholders.
Quality healthcare and improved medical management from claim inception to outcome are essential to helping our injured workers return to work and productivity while recovering from job-related injuries. Highly experienced healthcare experts are in consultation with us in designing and implementing improved medical management practices and systems. During 2006, we engaged a
15
CALIFORNIA INDUSTRY RESULTS THAT PROJECT 2004 AND 2005 ACCIDENT YEAR COMBINED RATIOS OF 54% AND $8 BILLION OVER-RESERVED ARE UNPRECEDENTED, BUT WILL THE ESTIMATES BE VALIDATED AS ADDITIONAL DATA EMERGE?
full-time medical expert with a long history of involvement in the California workers' compensation system to direct and coordinate our efforts. Employers tend to believe over-treatment is the norm while labor argues under-treatment of injured workers is prevalent. We believe these different views can only be balanced with quality medical treatment, based upon best practices and outcome data. As a result, we are working to change our business practices to upgrade the quality of medical care around best practices supported by data and outcome measures. We are also funding research at the Rand Corporation to establish best practices for carpal tunnel claims.
As a result of large insurance company insolvencies several years ago, it is expected the California Insurance Guarantee Association will continue funding hundreds of millions of dollars in losses. Under current law, each of our policyholders (and all policyholders in the State) will continue to be assessed up to 2% of their premiums annually to cover these losses for the foreseeable future.
Our catastrophe management strategies are designed to mitigate our exposure to earthquakes and terrorism. Through a combination of reinsurance, underwriting controls and careful tracking of our exposures supported by technology, we are focused on effectively managing our risks. Since we do not routinely insure large employers with large concentrations of employees or companies located in perceived target areas, we are in a good position to minimize the impact of possible terrorist acts. During the fourth quarter of 2005, a modified version of the Terrorism Risk Insurance Act ("TRIA") was extended for two years. Deductibles applicable to workers' compensation are 20.0% of the 2006 direct premiums earned provided the total industry loss is more than $100 million in 2007.
WORKERS' COMPENSATION AND CALIFORNIA POLITICS
Workers' compensation and California politics are inseparable. Changes are being lobbied and discussed on a continuing basis. The success of the recent reforms has reduced employer costs (including governmental entities) and acted as a stimulant to the economy greater than could have
16
WE OBSERVED A SIGNIFICANT DROP IN THE 2006 FREQUENCY OF OUR HIGHEST-COST CALIFORNIA CLAIMS FOR THE FIRST TIME, AND IF THIS CONTINUES IT WILL BODE WELL FOR ONGOING DEFLATION OF OUR CLAIM COSTS.
been accomplished by a large tax decrease. Since growth of tax revenue is essential to the State of California, we are optimistic the reforms will continue despite occasional rhetoric to the contrary. No legislative changes to the reforms were made in 2006.
One of the most controversial aspects of the reforms is a change in the permanent disability rating system. The goal of the revised rating schedule was to give consideration to diminished future earning capacity in place of diminished ability to compete in the labor market. The guidelines of the American Medical Association were to be used as in many other states as opposed to subjective considerations unique to California. The legislature delegated the implementation of the changes to the Administrative Director. Critics and so-called experts without real data are already pressing for legislative changes with litigation underway. We believe legislative changes should not be considered until reliable and accurate data establish that the reforms created unintended negative consequences to seriously injured workers. We do not believe that meaningful data will be available for several years, at the earliest, or that studies predicting the results will be credible. Interestingly, due to these factors, and explicitly acknowledging that they were not desirous of changing the reforms without data, the California legislature passed legislation in 2006 increasing cash benefits to injured workers. The Governor vetoed this legislation indicating that studies would be conducted to determine the scope of the problem, if any. Undoubtedly, in an election year this may have been a good political decision, but fairness to injured workers and the dollar amount of benefits must be given consideration sooner rather than later.
Litigation relating to permanent disability guidelines and apportionment continues. In a significant decision, a unanimous court upheld the validity of the guidelines, but permitted expert testimony to be considered. This case is on appeal as is a case before the California Supreme Court on how to apply apportionment.
17
HEALTHCARE INFLATION, IN GENERAL, CONTINUES TO INCREASE IN THE 8-9% RANGE PER YEAR; IN CONTRAST CALIFORNIA'S WORKERS' COMPENSATION HEALTHCARE COSTS HAVE DECLINED FROM 2002-2005.
Healthcare and workers' compensation can be expected to receive political attention. Critics argue that injured workers do not receive adequate or timely medical care thereby enriching insurers. Also, 24-hour coverage is again being advanced as part of the political effort to obtain universal healthcare. Utilization guidelines and penalties are the subject of recent regulations. Whether modifications, if any, of the existing rules will be based on facts, politics, court decisions or some combination is not clear at this time.
REINSURANCE
Despite the fact we are no longer active in the reinsurance business, we are required to report it as a separate segment. During 2006, we incurred a loss of $20.5 million compared to a loss of $56.2 million the prior year. At year end we had $106.1 million of reserves for estimated losses, which will take many years to pay.
CORPORATE GOVERNANCE
Zenith's Board of Directors and its management are committed to governance policies and practices that help assure we are among the leaders in this important area. Meetings of Zenith's Audit, Compensation and Nominating and Corporate Governance Committees consistently include oversight reviews to make certain our Company is in the forefront of compliance with the highest standards of corporate governance. We frequently obtain outside legal review of our various charters and policies for compliance with changing laws and regulations and best corporate practices.
Over the past three years, Zenith's management and Audit Committee have spent considerable time and resources to comply with Sarbanes-Oxley and Section 404 requirements. Section 404 relates to management's responsibilities to establish and maintain adequate internal controls over financial reporting and to evaluate the effectiveness of these controls at year-end. We believe that we have
18
WE ARE UPGRADING MEDICAL CARE AROUND BEST PRACTICES SUPPORTED BY DATA AND OUTCOME MEASURES, AND WE ARE FUNDING CARPAL TUNNEL BEST PRACTICES RESEARCH AT THE RAND CORP.
maintained effective controls and welcome the recently proposed guidance from the Securities and Exchange Commission ("SEC") and the Public Company Accounting Oversight Board regarding management's and our external auditor's evaluation of internal control over financial reporting. We expect the new guidance will allow us to recognize efficiencies and reduce costs while maintaining our strong financial reporting controls.
Zenith's management and Board of Directors also strive to fully comply with the SEC's new rules regarding executive compensation, related person transactions and director independence disclosures. We believe that our 2007 proxy statement provides full transparency regarding all of these important disclosures. The objectives we initially set for executive compensation thirty years ago remain today — to provide long-term incentives and reward executives for above average performance over a sustained period of time.
INFORMATION TECHNOLOGY
The use of effective technology combined with quality and timely management information are two key components of our business strategy. We continue to build our systems around an architecture that supports rapid changes in our business environment as well as the ability to interface with multiple external partners. In addition, we focus particular attention and resources on the internal and external security of our systems and the information contained within them.
Our highest priority is to use technology to enable standardized workflows around "best practices" and to provide "real time" information to management and to our underwriting, claims, claims-legal and medical specialists.
The Internet has become an important part of our business and we continue to look for ways to enhance our product and services through new content and technology upgrades. Our external website, www.thezenith.com, has become a repository for valuable information regarding workers'
19
WITH REGARD TO CORPORATE GOVERNANCE, WE BELIEVE OUR CONTROLS ARE EXCELLENT AND OUR DISCLOSURES PROVIDE FULL TRANSPARENCY AND ACCOUNTABILITY.
compensation as well as the portal for our agents to receive rapid quotes for their customers. We received over 1.2 million visits to our site in 2006 and we expect this number to rise as we offer our e-commerce products more widely in 2007.
Our continuing investment in technology, combined with our people and our specialization in workers' compensation, allows us to continually upgrade our services and capabilities and positions us for future opportunities.
ACCOUNTING DISCLOSURE
Our financial statements include full disclosure of the accounting policies, estimates and assumptions used in their preparation. As we have discussed earlier in this report, estimating our workers' compensation loss costs and loss reserves is one of our major business risks. Our loss costs, or cost of goods sold, are not quantifiable with a high degree of certainty for several years until a large percentage of the claims for a given year are closed. This is particularly true in light of the California and Florida reforms where it is difficult to know whether the initial trends will continue over the long term.
Zenith's actuaries perform comprehensive analyses of our loss reserves on a quarterly basis. Assumptions are required to project estimates of loss costs and loss reserves, with the key assumption being the rate of deflation in the most recent accident years of our workers' compensation loss reserves. In the table on page 37, we show the available data concerning paid loss inflation and deflation for the past several accident years and the rates we have assumed in our loss reserve estimate. We also provide a discussion of the long-term uncertainly surrounding the trends of our workers' compensation loss costs. Under all of these circumstances, including our track record of reserving accuracy prior to the reforms, our financial statement loss reserve estimates are higher than our actuaries' point estimate. Over time we expect the accounting and actuarial estimates to be approximately the same.
20
OUR BUSINESS MODEL IS A SPECIALIST FOCUSED ON AN EFFECTIVE, CUSTOMER-SENSITIVE SERVICE STRATEGY EXECUTED WITH DISCIPLINE.
California insurance law also requires that we file financial statements prepared in accordance with Department of Insurance ("DOI") regulations (statutory basis) which differ from those contained in this report (GAAP basis). Based on information we submitted to the DOI, the DOI has informed us that they have no objection to the manner in which we reflected these regulations in our statutory financial statements for the year ended 2006 as described on page 80 of this report.
CONCLUSION
Improved underwriting performance and financial strength provide optimism to believe we can continue to produce excellent results for our agents, insureds and stockholders. Deflationary loss cost trends during the past three accident years combined with our underwriting and pricing discipline are providing substantial short-term workers' compensation profitability. Our returns on equity have been above average during the past three years. Despite declining written premiums in California during 2005 and 2006, our market share increased from 3.7% to 5.3% from 2003 to 2005, the latest available data.
Zenith is motivated to take advantage of opportunities and to meet the challenges ahead. Our business model as a specialist is focused on an effective, customer-sensitive service strategy executed with discipline. Our rate decreases in California have not compromised rate adequacy and are responsive to our cautious view of favorable short-term claim cost trends. We anticipate the continuation of current claim trends will generate above-average returns despite competition being more aggressive than in the recent past. Unfortunately, it will require a few more years of data to be relatively certain that the deflationary loss cost trends will be applicable to the entire distribution of an accident year's claims. As new data are received and assessed, we will adjust our reserve position, accident year loss ratios and pricing accordingly.
21
OUR GOAL OF ABOVE-AVERAGE UNDERWRITING PERFORMANCE ESTABLISHED 30 YEARS AGO CONTINUES TO BE OUR FOCUS.
Zenith's financial strength continues to grow and dividends to stockholders have been increased twice during 2006. Our Board of Directors will continue to evaluate future dividends in relation to our performance, financial strength and regulatory requirements.
The contributions of our distinguished Board of Directors serve as an inspiration to us all. We appreciate the confidence and support of our agents, brokers, policyholders, reinsurers, investors, lenders and stockholders. In conclusion, we are well positioned to manage risk professionally and to continue to enhance stockholder value over the long-term in a prudent manner. Our company consists of professionals with ambition, intelligence and motivation focused on delivering value to our customers, necessary services to our claimants and above-average returns to our stockholders, many of whom are employees of Zenith. Our goal of above-average underwriting performance established 30 years ago is imbedded in our culture and continues to be our focus.

Stanley R. Zax
Chairman of the Board and President
Woodland Hills, California, February 2007
22
ACCIDENT YEAR RESERVE DEVELOPMENT FROM OPERATIONS
| |
|---|
| | Net incurred loss and loss adjustment expenses reported at end of year
| |
|---|
Years in which losses were incurred
| |
|---|
| | 2000
| | 2001
| | 2002
| | 2003
| | 2004
| | 2005
| | 2006
| |
|---|
| |
|---|
| | | | (Dollars in thousands) | |
| Prior to 2001 | | $ | 4,496,701 | | $ | 4,501,048 | | $ | 4,513,795 | | $ | 4,533,326 | | $ | 4,565,999 | | $ | 4,620,658 | | $ | 4,627,548 | |
| 2001 | | | | | | 409,586 | | | 426,007 | | | 437,452 | | | 447,619 | | | 454,475 | | | 457,882 | |
| 2002 | | | | | | | | | 391,960 | | | 375,199 | | | 397,817 | | | 413,764 | | | 419,553 | |
| 2003 | | | | | | | | | | | | 523,707 | | | 471,615 | | | 443,744 | | | 440,190 | |
| 2004 | | | | | | | | | | | | | | | 615,397 | | | 538,906 | | | 490,530 | |
| 2005 | | | | | | | | | | | | | | | | | | 730,770 | | | 625,292 | |
| 2006 | | | | | | | | | | | | | | | | | | | | | 464,106 | |
Calendar Year Adverse (Favorable) Prior Period Development |
|
|
|
|
$ |
4,347 |
|
$ |
29,168 |
|
$ |
14,215 |
|
$ |
13,366 |
|
$ |
(26,900 |
) |
$ |
(141,322 |
) |
Loss and loss adjustment expense ratios: |
|
|
|
|
|
|
|
|
|
|
|
|
|
|
|
|
|
|
|
|
|
|
| 2000 | | | 85.6 | % | | 87.0 | % | | 89.8 | % | | 92.1 | % | | 94.9 | % | | 96.3 | % | | 96.1 | % |
| 2001 | | | | | | 85.9 | % | | 89.3 | % | | 91.7 | % | | 93.9 | % | | 95.3 | % | | 96.0 | % |
| 2002 | | | | | | | | | 70.4 | % | | 67.4 | % | | 71.4 | % | | 74.3 | % | | 75.3 | % |
| 2003 | | | | | | | | | | | | 67.7 | % | | 60.9 | % | | 57.3 | % | | 56.9 | % |
| 2004 | | | | | | | | | | | | | | | 65.2 | % | | 57.1 | % | | 51.9 | % |
| 2005 | | | | | | | | | | | | | | | | | | 62.0 | % | | 53.0 | % |
| 2006 | | | | | | | | | | | | | | | | | | | | | 49.2 | % |
| |
This analysis displays the accident year net incurred loss and loss adjustment expenses on a GAAP basis for accident years prior to 2001 and for each of the accident years 2001-2006 for our workers' compensation and reinsurance businesses, together. The total of net loss and loss adjustment expenses for all claims occurring within each annual period is shown first at the end of that year and then annually thereafter. The total cost includes both payments made and the estimate of future payments as of each year-end. Past development may not be an accurate indicator of future development since trends and conditions change.
The total change in our incurred loss estimates for all prior accident years in 2006 was a net decrease of approximately $141.3 million, comprised of $161.3 million for our workers' compensation loss reserves, partially offset by an increase of approximately $20.0 million for our reinsurance loss reserves. The favorable development of our workers' compensation loss reserves during 2006 principally reflects a reduction of estimated losses for the 2005 and 2004 accident years. The adverse development of incurred losses in our reinsurance business during 2006 reflects increased estimated losses primarily attributable to Hurricanes Wilma and Rita based on claims and information we received in 2006.
23
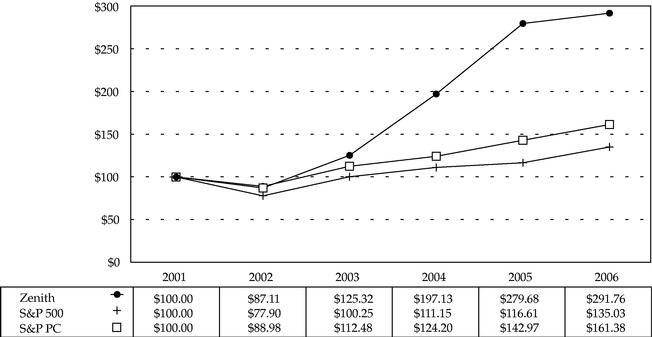
STOCK PRICE PERFORMANCE
The Stock Price Performance Graph below compares the cumulative total returns of the Common Stock, par value $1.00 per share of Zenith National Insurance Corp., ticker symbol ZNT ("Zenith"), the Standard and Poor's 500 Stock Index ("S&P 500") and the Standard and Poor's 500 Property-Casualty Insurance Index ("S&P PC") for a five year period. Stock price performance is based on historical results and is not necessarily indicative of future stock price performance. The following graph assumes $100 was invested at the close of trading on the last trading day preceding the first day of the fifth preceding year in Zenith, the S&P 500 and the S&P PC. The calculation of cumulative total return assumes reinvestment of dividends. The graph was prepared by Standard and Poor's Institutional Market Services, which obtained factual materials from sources believed by it to be reliable, but which disclaims responsibility for any errors or omissions contained in such data.
Comparative Five-Year Total Returns
Zenith, S&P 500 and S&P PC
(Performance Results Through 12/31/06)
24
MANAGEMENT'S DISCUSSION AND ANALYSIS OF CONSOLIDATED FINANCIAL CONDITION AND RESULTS OF OPERATIONS
ZENITH NATIONAL INSURANCE CORP. AND SUBSIDIARIES
Zenith National Insurance Corp. ("Zenith National") is a holding company engaged, through its wholly-owned subsidiaries (primarily Zenith Insurance Company ("Zenith Insurance")), in the workers' compensation insurance business, nationally, and the assumed reinsurance business. In September 2005, we announced our exit from the assumed reinsurance business and we ceased writing and renewing assumed reinsurance contracts. Unless otherwise indicated, all references to "Zenith," "we," "us," "our," the "Company" or similar terms refer to Zenith National together with its subsidiaries.
The Private Securities Litigation Reform Act of 1995 provides a safe harbor for forward-looking statements if accompanied by meaningful cautionary statements identifying important factors that could cause actual results to differ materially from those discussed. Forward-looking statements include those related to the plans and objectives of management for future operations, future economic performance, or projections of revenues, income, earnings per share, capital expenditures, dividends, capital structure, or other financial items. Statements containing words such asexpect, anticipate, believe, estimate, or similar words that are used in this Management's Discussion and Analysis of Consolidated Financial Condition and Results of Operations ("MD&A"), in other parts of this report or in other written or oral information conveyed by or on behalf of Zenith, are intended to identify forward-looking statements. The Company undertakes no obligation to update such forward-looking statements, which are subject to a number of risks and uncertainties that could cause actual results to differ materially from those projected. These risks and uncertainties include, but are not limited to, the following: (1) competition; (2) adverse state and federal legislation and regulation; (3) changes in interest rates causing fluctuations of investment income and fair values of investments; (4) changes in the frequency and severity of claims and catastrophes; (5) adequacy of loss reserves; (6) changing environment for controlling medical, legal and rehabilitation costs, as well as fraud and abuse; (7) losses associated with any terrorist attacks that impact our workers' compensation business in excess of our reinsurance protection; (8) losses caused by nuclear, biological, chemical or radiological events whether or not there is any applicable reinsurance protection; and (9) other risks detailed herein and from time to time in Zenith's other reports and filings with the Securities and Exchange Commission ("SEC").
OVERVIEW
We are in the business of managing insurance and investment risk with the major risk factors set forth in the preceding paragraph. Our main business activity is the workers' compensation insurance business. We measure our performance by our ability to increase stockholders' equity over the long-term. Following is a summary of our recent business performance and how we expect the trends to continue for the foreseeable future:
Revenues. Our revenues are comprised of the net premiums earned from our workers' compensation and reinsurance segments and the net investment income and realized gains from our investments segment. The most significant trends in our revenues in the year ended December 31, 2006 compared to the prior year were the decrease in California workers' compensation net premiums earned and the decline in reinsurance premiums due to our exit from the business, partially offset by higher investment income. The 2006 decline in California workers' compensation premiums principally reflects rate decreases as a result of
25
favorable loss costs trends from the 2003 and 2004 legislative reforms combined with our pricing and underwriting strategy in comparison to our competition. 2006 workers' compensation premiums outside California were comparable to 2005, with rate decreases offset by growth in insured payrolls.
Our operating goals do not include objectives for revenues or market share but rather emphasize pricing and underwriting discipline to maintain profitability. We expect similar workers' compensation premium trends in 2007 as in 2006. Our workers' compensation premiums are discussed further under "Results of Operations — Workers' Compensation Segment" on pages 28 to 30.
Income (Loss) from Workers' Compensation and Reinsurance Segments. The results of our workers' compensation and reinsurance segments are as follows:
| |
|---|
| | Year Ended December 31,
| |
|---|
(Dollars in thousands)
| | 2006
| | 2005
| | 2004
| |
|---|
| |
|---|
| Income (loss) before tax from: | | | | | | | |
| | Workers' compensation | | $ | 313,576 | | $ | 213,244 | | $ | 104,098 | |
| | Reinsurance (1) | | | (20,508 | ) | | (56,183 | ) | | (11,956 | ) |
| |
(1) Includes catastrophe losses before taxes of $19.9 million ($12.9 million after tax), $69.2 million ($45.0 million after tax), and $21.1 million ($13.7 million after tax) in 2006, 2005 and 2004, respectively. Catastrophe losses in 2006 represent increased estimated losses from the 2005 hurricanes.
Loss Reserves. We recognized $161.3 million and $26.3 million of pre-tax favorable development on prior year workers' compensation loss reserve estimates in the years ended December 31, 2006 and 2005, respectively. The favorable development in 2006 reflects a continuation of deflation trends in the paid loss data for recent accident years, offset, in part, by the pre-tax adverse development of reinsurance reserves of $19.9 million related to the 2005 hurricanes. The favorable development in 2005 reflects net favorable development on prior year loss reserves as a result of deflation trends in the paid loss data for recent accident years, partially offset by a re-allocation of our workers' compensation loss reserves to older accident years to better reflect the facts and trends known at that time.
There is uncertainty as to whether the short-term paid loss trends, which reflect the benefits of the 2003 and 2004 legislative reforms in California and 2003 reforms in Florida, will continue over the long-term and we will not know the full impact of these reforms with a high degree of confidence for several years. We have established loss reserves based on our best estimates which provide that ultimate loss costs will be higher than indicated from the current paid loss claim data for recent accident years. If these paid trends continue, we expect to recognize additional favorable development for prior accident years in the future, however we cannot currently predict if and to what extent such development will occur. We discuss the assumptions we made about the inflation trends and associated uncertainties for recent accident years under "Loss Reserves" on pages 33 to 40.
Investments Segment. Our investment portfolio increased by $106.7 million in the year ended December 31, 2006, principally as a result of favorable net cash flow from operations in 2006. We expect favorable net cash flow from operations in 2007. Investment income increased in each of the three years ended December 31, 2006 because of increases in the investment portfolio in each of these years and higher
26
short-term interest rates in 2006 and 2005. At December 31, 2006, $0.9 billion of the investment portfolio was in fixed maturities of two years or less compared to $1.2 billion at December 31, 2005.
We recorded realized gains from investments in each of the last three years, but we cannot predict future realized gains from investments.
Stockholders' Equity. During the last three years, our consolidated stockholders' equity increased from $502.1 million ($17.28 per share) at December 31, 2004 to $712.8 million ($19.14 per share) at December 31, 2005 and to $940.7 million ($25.41 per share) at December 31, 2006. Stockholders' equity will primarily depend upon the future level of net income and any fluctuations in the values of our investments.
More information about the key elements of our performance follows below.
RESULTS OF OPERATIONS
Summary Results by Segment. Our business is classified into the following segments: investments; workers' compensation; reinsurance; and parent. Our real estate segment was discontinued in 2002. Income from operations of the investments segment includes investment income and realized gains and losses on investments and we do not allocate investment income to the results of our workers' compensation and reinsurance segments. Income (loss) from operations of the workers' compensation and reinsurance segments is determined by deducting net loss and loss adjustment expenses incurred and underwriting and other operating expenses incurred from net premiums earned. The loss from operations of the parent segment includes interest expense and the general operating expenses of Zenith National. The comparative components of net income are set forth in the following table:
| |
|---|
| | Year Ended December 31,
| |
|---|
(Dollars in thousands)
| | 2006
| | 2005
| | 2004
| |
|---|
| |
|---|
| Net investment income | | $ | 106,294 | | $ | 79,200 | | $ | 61,876 | |
| Realized gains on investments | | | 13,377 | | | 22,224 | | | 38,579 | |
| |
| Income before tax from investments segment | | | 119,671 | | | 101,424 | | | 100,455 | |
| Income (loss) before tax from: | | | | | | | | | | |
| | Workers' compensation segment | | | 313,576 | | | 213,244 | | | 104,098 | |
| | Reinsurance segment | | | (20,508 | ) | | (56,183 | ) | | (11,956 | ) |
| | Parent segment | | | (11,927 | ) | | (20,938 | ) | | (19,051 | ) |
| |
| Income from continuing operations before tax and equity in earnings of investee | | | 400,812 | | | 237,547 | | | 173,546 | |
| Income tax expense | | | 142,112 | | | 81,894 | | | 57,213 | |
| |
| Income from continuing operations after tax and before equity in earnings of investee | | | 258,700 | | | 155,653 | | | 116,333 | |
| Equity in earnings of investee after tax | | | | | | 794 | | | 1,381 | |
| |
| Income from continuing operations after tax | | | 258,700 | | | 156,447 | | | 117,714 | |
| Gain on sale of discontinued real estate segment after tax | | | | | | 1,253 | | | 1,286 | |
| |
| Net income | | $ | 258,700 | | $ | 157,700 | | $ | 119,000 | |
| |
Net income improved in 2006 compared to 2005, and in 2005 compared to 2004, principally as a result of improved results in the workers' compensation segment, offset, in part, by catastrophe losses in the reinsurance segment in 2006, 2005 and 2004.
27
The combined ratio, expressed as a percentage, is a key measurement of profitability traditionally used in the property-casualty insurance business. The combined ratio is the sum of the loss and loss adjustment expense ratio and the underwriting and other operating expense ratio. The loss and loss adjustment expense ratio is the percentage of net incurred loss and loss adjustment expenses to net premiums earned. The underwriting and other operating expense ratio is the percentage of underwriting and other operating expenses to net premiums earned. The key operating goal for our insurance segments is to achieve a combined ratio of 100% or lower and to achieve a workers' compensation combined ratio that is at least three percentage points lower than the combined ratio of the national workers' compensation industry.
The combined ratios reported for the workers' compensation and reinsurance segments were as follows:
|
|---|
| | Year Ended December 31,
|
|---|
| | 2006
| | 2005
| | 2004
|
|---|
|
|---|
| Workers' compensation: | | | | | | |
| | Loss and loss adjustment expenses | | 31.4% | | 53.0% | | 64.6% |
| | Underwriting and other operating expenses (1) (2) | | 34.9% | | 27.9% | | 23.9% |
|
| Combined ratio | | 66.3% | | 80.9% | | 88.5% |
|
| Reinsurance: | | | | | | |
| | Loss and loss adjustment expenses (3) | | 245.4% | | 175.4% | | 107.6% |
| | Underwriting and other operating expenses | | 19.0% | | 11.7% | | 20.6% |
|
| Combined ratio | | 264.4% | | 187.1% | | 128.2% |
|
(1) Includes additional policyholders' dividends of 3.6 and 1.5 percentage points for 2006 and 2005, respectively, related to prior accident years.
(2) The underwriting and other operating expense ratio is lower in 2004 by approximately 2 percentage points due to the benefit of ceding commissions received in 2004 on a 10% quota share ceded reinsurance agreement, which terminated effective December 31, 2004.
(3) Includes catastrophe losses before taxes of $19.9 million, $69.2 million and $21.1 million for 2006, 2005 and 2004, respectively.
Workers' compensation reported accident year combined ratios were as follows:
| |
|---|
| | Year Ended December 31,
| |
|---|
| | 2006
| | 2005
| | 2004
| |
|---|
| |
|---|
| Combined ratio | | 66.3% | | 80.9% | | 88.5% | |
| Prior Accident Year Items: | | | | | | | |
| | Favorable (Unfavorable) loss reserve development | | 17.3% | | 2.4% | | (2.2% | ) |
| | Policyholders' Dividends (1) | | (3.6% | ) | (1.5% | ) | | |
| |
| Total Prior Accident Year | | 13.7% | | 0.9% | | (2.2% | ) |
| |
| Accident Year Combined Ratio | | 80.0% | | 81.8% | | 86.3% | |
| |
(1) Additional policyholders' dividends in 2006 and 2005 related to prior accident years.
Net premiums earned in the workers' compensation and reinsurance segments were as follows:
|
|---|
| | Year Ended December 31,
|
|---|
(Dollars in thousands)
| | 2006
| | 2005
| | 2004
|
|---|
|
|---|
| Workers' compensation: | | | | | | | | | |
| | California | | $ | 582,282 | | $ | 762,095 | | $ | 621,284 |
| | Outside California | | | 349,457 | | | 352,099 | | | 280,763 |
|
| Total workers' compensation (1) | | | 931,739 | | | 1,114,194 | | | 902,047 |
| Reinsurance (2) | | | 12,478 | | | 64,506 | | | 42,378 |
|
| Net premiums earned | | $ | 944,217 | | $ | 1,178,700 | | $ | 944,425 |
|
(1) Net premiums earned in 2004 are net of $98.7 million of ceded premiums earned in connection with a 10% quota share ceded reinsurance agreement, which terminated effective December 31, 2004.
(2) 2006 reflects the impact of our previously announced exit from the reinsurance business.
Workers' Compensation Segment. In the workers' compensation segment, we provide insurance coverage for the statutorily prescribed benefits that employers are required to provide to their employees who may be injured in the course of employment. We establish our prices (except in those states, primarily Florida, where we are required by regulation to use mandated rates) with the goal of achieving a combined ratio under 100%. We continually analyze data and use our best judgment about loss cost trends, particularly claim inflation, to set adequate premium rates and loss reserves.
28
The combined ratio of our workers' compensation segment improved and income from this segment increased in 2006 compared to 2005, and in 2005 compared to 2004. These favorable trends reflect a lower reported current accident year loss and loss adjustment expense ratio in 2006 compared to 2005, and in 2005 compared to 2004. Favorable development of prior year loss reserves was higher in 2006 compared to 2005, and in 2005 compared to 2004 (in 2004 there was unfavorable development). These benefits were offset, in part, by higher underwriting and other operating expense ratios in 2006 compared to 2005, and 2005 compared to 2004, and by a decrease in net premiums earned in 2006. The lower loss and loss adjustment expense ratio estimates for prior accident years recorded in 2006 and 2005 caused us to re-evaluate and increase our estimate for accrued policyholder dividends for prior accident years, resulting in an increase in the underwriting and other operating expense ratio of 3.6 and 1.5 percentage points, respectively. The estimates we made for our loss costs in recent accident years are subject to considerable uncertainty because of fluctuating rates of claims cost inflation and deflation including the impact of the 2003 and 2004 workers' compensation legislative reforms. We discuss the assumptions we made about the inflation trends and associated uncertainties for recent accident years under "Loss Reserves" on pages 33 to 40.
Workers' compensation premiums in-force, number of policies in-force and insured payrolls in California and outside of California are shown in the following table. Premiums in-force is a measure of the amount of premiums billed or to be billed on all un-expired policies at the date shown; and insured payroll is our best indicator of exposure.
|
|---|
(Dollars in millions)
| | Premiums
in-force
| | Policies
in-force
| | Insured
Payrolls
|
|---|
|
|---|
| California | | | | | | | | |
| December 31, 2006 | | $ | 501.2 | | 24,600 | | $ | 9,200.3 |
| December 31, 2005 | | | 722.9 | | 27,500 | | | 9,930.3 |
| December 31, 2004 | | | 731.3 | | 27,200 | | | 9,310.0 |
Outside California |
|
|
|
|
|
|
|
|
| December 31, 2006 | | $ | 332.8 | | 17,200 | | $ | 12,404.5 |
| December 31, 2005 | | | 326.9 | | 16,900 | | | 11,236.3 |
| December 31, 2004 | | | 311.0 | | 16,200 | | | 10,410.5 |
Total |
|
|
|
|
|
|
|
|
| December 31, 2006 | | $ | 834.0 | | 41,800 | | $ | 21,604.8 |
| December 31, 2005 | | | 1,049.8 | | 44,400 | | | 21,166.6 |
| December 31, 2004 | | | 1,042.3 | | 43,400 | | | 19,720.5 |
|
Premiums in-force in California as of December 31, 2006 decreased compared to December 31, 2005 principally as a result of rate decreases due to favorable loss cost trends from the 2003 and 2004 legislative reforms, combined with our pricing and underwriting strategy in comparison to our competition in the California market as reflected in the decline in insured payrolls and policies in-force. Premiums in-force outside California increased in 2006 as growth in insured payrolls exceeded rate reductions.
In California, the state in which the largest amount of our workers' compensation premiums is earned, we set our own rates based upon actuarial analysis of current and anticipated loss cost trends. The short-term data for loss costs indicate a favorable impact from the 2003 and 2004 legislative reforms discussed under "Workers' Compensation Reform Legislation" on page 30. As a result of these favorable trends we have reduced our California premium rates in a manner that we believe deals prudently with the uncertainty about the long-term outcome of loss costs trends for recent accident years. These manual rates do not necessarily indicate the rates charged to our policyholders because employers' experience modification factors are subject to revision,
29
annually; and our underwriters are given authority to increase (debit) or decrease (credit) manual rates based upon individual risk characteristics. The following table sets forth the manual rate change percentages in California, as well as the change in average rates charged in California on renewal business for each period. The change in the average renewal rate takes into consideration changes in manual rates as well as the changes in experience modification factors and net credits or debits applied by our underwriters (decreases are shown in parentheses).
| |
|---|
Effective date of change
| | Manual
Rate
Change
| | Average
Renewal
Charged Rate
Change
| |
|---|
| |
|---|
| January 1, 2004 | | 0.0 | % | (4.0 | )% |
| July 1, 2004 | | (10.0 | ) | (12.0 | ) |
| January 1, 2005 | | (2.0 | ) | 0.0 | |
| July 1, 2005 | | (12.0 | ) | (19.0 | ) |
| January 1, 2006 | | (13.0 | ) | (15.0 | ) |
| July 1, 2006 | | (5.0 | ) | (13.0 | ) |
| January 1, 2007 | | (4.4 | ) | | |
| |
Future California premium rate decisions will be based on the data about loss costs trends or upon any modification to the workers' compensation system while maintaining our goal of achieving a combined ratio under 100%.
In Florida, the state in which the second largest amount of our workers' compensation premium is earned, rates for workers' compensation insurance are set by the Florida Department of Insurance. Manual rate change percentages in Florida were as follows:
| |
|---|
Effective date of change
| | Manual Rate
Change
| |
|---|
| |
|---|
| January 1, 2004 | | 0.0 | % |
| January 1, 2005 | | (4.0 | ) |
| January 1, 2006 | | (13.4 | ) |
| January 1, 2007 | | (12.5 | ) |
| |
Most of our workers' compensation policies are non-participating but we issue certain policies for which the policyholder may participate in favorable claims experience through a dividend. An estimated provision for workers' compensation policyholders' dividends is accrued as the related premiums are earned. In addition, Florida statutes require payment of additional policyholders' dividends to Florida policyholders pursuant to a formula based on underwriting results. As of December 31, 2006 and 2005, we accrued $34.1 million and $16.0 million, respectively, for Florida dividends payable for prior accident years. The 2005 amount was paid in 2006.
Workers' Compensation Reform Legislation. During 2006, we wrote workers' compensation insurance in 45 states, but the largest concentrations, 62.5% and 22.2% of our workers' compensation net premiums earned during 2006, were in California and Florida, respectively. The concentration of our workers' compensation business in these states makes the results of our operations dependent on trends that are characteristic of these states as compared to national trends, e.g., state legislation, competition and workers' compensation loss costs inflation or deflation trends.
In California, workers' compensation reform legislation was enacted in October 2003 and April 2004 with the principal objectives of lowering the trend of increasing costs and improving fairness in the system. The principal changes in the legislation of 2003 included: 1) a reduction in the reimbursable amount for certain physician fees, outpatient surgeries, pharmaceutical products and certain durable medical equipment; 2) a limitation on the number of chiropractor or physical therapy office visits; 3) the introduction of medical utilization guidelines; 4) a requirement for second opinions on certain spinal surgeries; 5) a repeal of the presumption of correctness afforded to the treating physician, except where the employee has pre-designated a treating
30
physician; and 6) a presumption of correctness is to be afforded to the evidence-based medical utilization guidelines developed by the American College of Occupational and Environmental Medicine.
The principal changes in the legislation of 2004 included: 1) employers and insurers are authorized, beginning in 2005, to establish networks of medical providers within which injured workers are required to be treated (an independent medical review would be allowed if the claimant disputes the treatment recommended in the network only after obtaining the opinions of three network physicians); 2) within one working day of filing a claim form, a claimant must be afforded necessary treatment for up to $10,000 in medical fees (however, employers and insurers still have up to 90 days to investigate the compensability of a claim); 3) a methodology for apportioning disabilities between covered, work-related and prior causes was created such that employers are only liable for the portion of permanent disability that accrues from a covered, work-related injury; 4) Temporary Disability ("TD") benefits are not to exceed 104 weeks within 2 years of the first TD payment, but cases with certain specified injuries will be allowed up to 240 weeks of TD benefits within 5 years of the date of injury; 5) Permanent Disability ("PD") ratings are based on a new, objective disability rating schedule effective January 1, 2005 (and for some injuries prior to January 1, 2005) as well as upon the injured workers' diminished future earning capacity, rather than their ability to compete in the open labor market (PD benefits were revised to make available higher benefits to more severely injured workers and lower benefits to less severely injured workers); 6) incentives were created to encourage employers to offer return-to-work programs; and 7) new medical-legal processes for resolving disputed medical issues were created.
In Florida, legislation was enacted effective October 1, 2003, which provides changes to the workers' compensation system. Such changes are designed to expedite the dispute resolution process, provide greater compliance and enforcement authority to combat fraud, revise certain indemnity benefits and increase medical reimbursement fees for physicians and surgical procedures. One of the intended outcomes of the legislation is a reduction in the overall cost associated with delivering workers' compensation benefits in the state of Florida.
During the 2006 California legislative sessions, there were no legislative changes to the workers' compensation reforms. We anticipate on-going discussions regarding the implementation of the California reforms particularly as they relate to determination of disability and the level of benefits to injured workers with permanent disabilities. We cannot currently predict if any substantial changes will occur.
Reinsurance Segment. In September 2005, we exited the reinsurance business and we ceased writing and renewing assumed reinsurance contracts. We received earned premiums and were subject to continuing exposure to losses until our in-force assumed reinsurance contracts expired. The majority of our excess of loss assumed reinsurance contracts expired on December 31, 2005, and the remainder fully expired in 2006. Also, under our quota share assumed reinsurance contracts we assumed premiums through the third quarter of 2006. Consequently, premiums earned from assumed reinsurance contracts in 2006 were substantially less than in 2005.
We will be paying our assumed reinsurance claims for several years and the results of the reinsurance segment, principally consisting of any changes to loss reserve estimates and resulting adjustments to contractual premium, will continue to be included in the results of continuing operations.
31
In assumed reinsurance, we provided coverage that protects other insurance and reinsurance companies from the accumulation of large losses from major loss events, known in the insurance industry as "catastrophes." Results of the reinsurance segment were favorable in the absence of catastrophes and unfavorable in periods when they occurred and, consequently, the results of this segment fluctuated. The results of the reinsurance segment for the year ended December 31, 2006 includes $19.9 million ($12.9 million after tax, or $0.35 per share) of increased estimated losses attributable to claims and information we received in 2006 regarding losses primarily from Hurricanes Wilma and Rita which occurred in the second half of 2005.
The $56.2 million loss before tax in the reinsurance segment for the year ended December 31, 2005 was due to estimated catastrophe losses of $69.2 million ($45.0 million after tax, or $1.21 per share) net of additional premiums earned from reinstatement premiums. Catastrophe losses in 2005 were attributable to Hurricanes Katrina, Rita and Wilma.
The $12.0 million loss before tax in the reinsurance segment for the year ended December 31, 2004 was due to catastrophe losses of $21.1 million before tax ($13.7 million after tax, or $0.37 per share). Catastrophe losses in 2004 were attributable to $26.8 million from the Florida hurricanes of 2004 offset by a $5.7 million reduction of previously estimated loss reserves, net of reinstatement premiums, for the 2001 World Trade Center Loss ("WTC").
Estimating catastrophe losses in the reinsurance business is highly dependent upon the nature and timing of the event and our ability to obtain timely and accurate information with which to estimate our liability to pay losses. Estimates of the impact of catastrophes on the reinsurance segment are based on the information that is currently available and such estimates could change based on new information that becomes available or based upon reinterpretation of existing information. We describe in more detail the uncertainty surrounding catastrophe loss reserve estimates in the "Loss Reserves" section following.
Investments Segment. Investment income and realized gains and losses are discussed in the "Investments" section following.
Parent Segment. The parent segment loss reflects the holding company activities of Zenith National. The parent segment loss before tax was as follows:
|
|---|
| | Year Ended December 31,
|
|---|
(Dollars in thousands)
| | 2006
| | 2005
| | 2004
|
|---|
|
|---|
| Interest expense | | $ | 5,275 | | $ | 8,757 | | $ | 13,051 |
| Parent expenses | | | 6,652 | | | 12,181 | | | 6,000 |
|
| Parent segment loss | | $ | 11,927 | | $ | 20,938 | | $ | 19,051 |
|
Interest expense was less in 2006 compared to 2005 and in 2005 compared to 2004 because $123.8 million aggregate principle amount of our 5.75% Convertible Senior Notes due March 30, 2023 ("Convertible Notes") was converted into our common stock during 2005. Interest expense on the Convertible Notes is added back to net income in the computation of diluted earnings per share (see Note 14 to the Consolidated Financial Statements).
Parent expenses in 2005 include $4.7 million related to the conversion of certain of the Convertible Notes in 2005 (see Note 9 to the Consolidated Financial Statements).
Equity in Earnings of Investee. Since the second quarter of 2005, our investment in Advent Capital (Holdings) PLC ("Advent Capital") is no longer accounted for under the equity method as our ownership was reduced from 20.9% to less than 10% and we no longer have representation on the board of directors.
32
At December 31, 2006 and 2005, we owned 22.1 million shares of Advent Capital common stock, which is included in equity securities and is recorded at fair value. On June 3, 2005, Advent Capital sold 114.3 million shares of its common stock in a public offering at the United States dollar equivalent of $0.64 per share. On the same date, Advent Capital common stock was listed for trading on the Alternative Investments Market of the London Stock Exchange ("AIM") under the symbol ADV LN.
To reflect the new, publicly traded price of Advent Capital, we reduced the carrying value of this investment to its fair value resulting in a charge of $9.5 million before tax ($6.2 million after tax) in the second quarter of 2005 as a reduction of realized gains on investments. The charge resulted from the difference between the fair value of our investment in Advent Capital, based upon the offering price for Advent Capital's common stock, and the carrying value of the investment under the equity method as of the date of the public offering.
Discontinued Real Estate Segment. In 2002, we sold our home-building business and related real estate assets to MTH-Homes Nevada, Inc. ("MTH Nevada"), a wholly-owned subsidiary of Meritage Corporation.
In addition to the consideration received in 2002, we were entitled to receive 10% of MTH Nevada's pre-tax net income, subject to certain adjustments, for each of the twelve-month periods ending September 30, 2003, September 30, 2004 and September 30, 2005. We recorded additional gains under the earn-out provision of the sale agreement for all three twelve month periods, including $1.9 million ($1.3 million after tax) and $2.0 million ($1.3 million after tax) in 2005 and 2004, respectively. The last such payment under the earn-out provision was received in 2005.
LOSS RESERVES
Accounting for the workers' compensation and reinsurance segments requires us to estimate the liability for the expected ultimate cost of unpaid losses and loss adjustment expenses as of the balance sheet date ("loss reserves"). Our loss reserves were as follows:
|
|---|
| | December 31,
|
|---|
(Dollars in millions)
| | 2006
| | 2005
|
|---|
|
|---|
| Workers' compensation segment: | | | | | | |
| | Unpaid losses and loss adjustment expenses | | $ | 1,416 | | $ | 1,523 |
| | Less: Receivable from reinsurers for unpaid losses | | | 221 | | | 243 |
|
| Unpaid losses and loss adjustment expenses, net of reinsurance | | $ | 1,195 | | $ | 1,280 |
|
| Reinsurance segment: | | | | | | |
| | Unpaid losses and loss adjustment expenses gross and net of reinsurance receivable | | $ | 106 | | $ | 180 |
|
| Total: | | | | | | |
| | Unpaid losses and loss adjustment expenses | | $ | 1,522 | | $ | 1,703 |
| | Less: Receivable from reinsurers for unpaid losses | | | 221 | | | 243 |
|
| Unpaid losses and loss adjustment expenses, net of reinsurance | | $ | 1,301 | | $ | 1,460 |
|
Loss reserves are estimates and are inherently uncertain; they do not and cannot represent an exact measure of ultimate liability. Accordingly, as we receive new information and update our assumptions over time regarding the ultimate liability, our loss reserves may prove to be inadequate to cover our actual losses or they may prove to exceed the ultimate amount of our actual losses. The amount by which estimated losses, measured subsequently by reference to payments and additional estimates, differ from those originally reported for a period is known as "development." Development is favorable when losses ultimately settle for less than the amount reserved or subsequent estimates indicate a basis for reducing loss reserves on open claims. Development is unfavorable when losses ultimately settle for more than the levels
33
at which they were reserved or subsequent estimates indicate a basis for reserve increases on open claims. Favorable or unfavorable development of loss reserves is reflected in our Consolidated Statements of Operations in the period the change is made.
The following table shows the (favorable) adverse one-year loss reserve development for loss reserves in each of the three years ended December 31, 2006. The one-year loss reserve development is the change recorded in the current year for the estimate of the loss reserves established at the end of the preceding year and reflects a cumulative adjustment to estimates for all accident years.
| |
|---|
(Dollars in thousands)
| | Workers' Compensation
| | Reinsurance
| | Total
| |
|---|
| |
|---|
| One-year loss development in: | | | | | | | | | | |
| | 2006 | | $ | (161,252 | ) | $ | 19,930 | | $ | (141,322 | ) |
| | 2005 | | | (26,289 | ) | | (611 | ) | | (26,900 | ) |
| | 2004 | | | 20,249 | | | (6,883 | ) | | 13,366 | |
| |
When losses are reported to us, we establish, individually, estimates of the ultimate cost of the claims, known as "case reserves." These case reserves are continually monitored and revised in response to new information and for amounts paid. Our actuaries use this information about reported claims in some of their estimation techniques. In estimating our total loss reserves, we have to make provision for two types of loss development. At the end of any calendar period, there are a number of claims that have not yet been reported but will arise out of accidents that have already occurred. These are referred to in the insurance industry as incurred but not reported ("IBNR") claims. In addition to this provision for late reported claims, we also have to estimate the extent to which the case reserves on known claims may also develop. These types of reserves are referred to in the insurance industry as "bulk" reserves. Our loss reserves make provision for both IBNR and bulk reserves in total, but not separately. We are required to file exhibits with state insurance departments which reflect the sum of our IBNR and bulk reserves.
At December 31, 2006 and 2005, IBNR and bulk reserves included in unpaid losses and loss adjustment expenses, net of reinsurance, were as follows:
|
|---|
| | December 31,
|
|---|
(Dollars in millions)
| | 2006
| | 2005
|
|---|
|
|---|
| Workers' compensation | | $ | 382 | | $ | 408 |
| Reinsurance | | | 19 | | | 54 |
|
| Total IBNR & bulk reserves | | $ | 401 | | $ | 462 |
|
We perform a comprehensive review of our loss reserves at the end of every quarter and, in conjunction with actuarial techniques and methods, we employ judgment to establish the most reasonably accurate estimate of loss reserves based on the most recent relevant data. During 2006 we recognized $161.3 million of favorable development on prior accident year workers' compensation loss reserves which primarily reflects the improvement in the paid loss trends during 2006 combined with attributing more weight to these paid trends in management's assessment of loss reserves. The loss reserve estimates recorded in the financial statements included assumptions of ultimate loss trends that were higher than the paid trends for recent accident years. In addition, the loss reserve estimates recorded in the financial statements were higher than the actuarial point estimates by approximately $109 million and $104 million at December 31, 2006 and 2005, respectively. A description of the actuarial estimation process, the role of management, and our assumptions in determining loss reserve estimates, as well as the associated uncertainties, are discussed below.
Receivables from reinsurers are a function of estimated loss reserves and are therefore subject to similar uncertainties. In addition,
34
reinsurance recoverables may ultimately prove to be uncollectible if the reinsurer is unable to perform under the contract. Reinsurance contracts do not relieve us of our obligations to our policyholders. We monitor the financial condition of our reinsurers and do not believe that we are currently exposed to any material credit risk through our ceded reinsurance arrangements because most of our reinsurance is recoverable from large, well-capitalized reinsurance companies.
Workers' Compensation Loss Reserves. In our workers' compensation business, the large majority of claims are reported to us promptly and therefore, as of the balance sheet date, the number of IBNR claims is relatively insignificant. The greater part of the challenge in estimating loss reserves is associated with estimating ultimate loss costs across a population of claims for each accident year. The principal uncertainty in our workers' compensation loss reserve estimates at this time is caused by the trend of increasing severity (inflation) in the years prior to 2002 compared to the deflation trend in more recent years. Severity is the average cost of a claim as measured by the total cost of claims for a year divided by the number of claims in that year. The annual rate of claim cost inflation (or deflation) is the year over year percentage change in claim severity. Inflation or deflation is attributable to factors which include changes in health care costs, legislative reforms to the workers' compensation system and the number of expensive claims relative to the total number of claims in a year. Expensive claims are those involving permanent disability of an injured worker. Historically in California, the expensive claims have contributed about 20% of the number of claims and 90% of the cost of all claims. We have observed deflationary trends in the amounts we have paid for claims in recent accident years compared to increasing inflation trends for claim payments in 2001 and prior. However, expensive claims are paid over several years, and ultimate costs are difficult to estimate because of such factors as the on-going and possibly increasing need for medical care, length of disability, life expectancy and benefits for dependents. These expensive claims often result in some form of a settlement with the injured worker which generally takes place many years after the injury. There is uncertainty as to whether the recent deflationary data will be sustained as the expensive claims are settled. We have also recently observed a reduction in the number of California permanent disability claims in 2005 and 2006 as compared to 2004 and prior accident years, reflecting the change in the permanent disability rating system effective January 1, 2005. This reduction in expensive claims for the 2005 and 2006 accident years as compared to prior accident years is not yet fully reflected in the paid loss data trends due to the longer time lag in paying and settling these claims. Also, the ultimate number of expensive claims for the 2005 and 2006 accident year is still uncertain.
Our actuaries produce a point estimate for workers' compensation loss reserves using the results of various methods of estimation. However, these various methods do not produce separate point estimates. Our actuaries prepare reserve estimates using our own historical claims data and based upon many of the common actuarial methodologies for estimating loss reserves, such as paid development methods, incurred development methods, Bornhuetter-Ferguson indications and claim count methods, which our actuaries use to determine reserve estimates for all accident years. A customized method is used for more recent accident years related to business written in California to focus on the impacts of the legislative reforms in determining loss reserves. The actuarial point estimate is based on a selection of the results of these various methods depending upon both the age of the accident
35
year and the geographic state of the injury. For more mature accident years, all of the methods produce very similar loss estimates and our actuarial point selections are based upon incurred loss development methods because our actuaries believe this most accurately reflects the required reserves for the relatively few claims that remain open. For recent accident years related to business written outside of California, our actuarial point selections are also based on the incurred loss development methods because our actuaries believe this method most accurately reflects the required reserves based on their analysis of the data and understanding of the claim environments in which we operate. For the more recent accident years related to business written in California, our actuaries use a loss reserving model which estimates the differing affects of the 2003 and 2004 legislative reforms on five categories of benefit types. The five benefit types are: (1) temporary disability indemnity, (2) vocational rehabilitation, (3) permanent disability indemnity, (4) medical costs and (5) allocated expense. For each of these types of benefits, our actuaries review the historical paid trends and make adjustments to reflect the known effects of the reforms (e.g., limitations on temporary disability indemnity benefits and eliminating vocational rehabilitation benefits). Our actuaries then use judgment to forecast ultimate inflation rates for each benefit type allowing for the late emergence of costs for the most serious cases based on historical trends. The selected inflation rate produces an estimate of loss reserves for each benefit type and the actuarial point selection is equal to the sum of the estimated loss reserves for all five benefit types for each accident year.
The inflation or deflation assumption is the key assumption in establishing loss reserve estimates for recent accident years. The 2003 and 2004 legislative reforms in California and the 2003 reforms in Florida, as well as delays in settling and closing the most serious cases in recent accident years in California as compared to historical trends, have resulted in uncertainty in determining the ultimate inflation assumptions for the most recent accident years. Management reviews the actuarial point estimate each quarter and establishes loss reserve estimates in the financial statements that provide for fluctuating rates of claim cost inflation using the most recent relevant data and incorporates judgment regarding the inherent uncertainties of ultimate loss costs. These uncertainties include the length of time required to settle long-term, expensive cases, uncertainties in the long-term outcome of reforms and the fact that in certain years prior to reforms our loss reserves proved to be inadequate. The differences between the actuarial point estimate and the loss reserves recorded in the financial statements are principally caused by the differences in the inflation assumptions used by management as compared to the actuarial inflation assumptions for the 2003 and 2004 accident years, as well as the impact of these inflation assumption differences on the 2005 and 2006 accident year ultimate loss estimates (changes to inflation rates for a particular accident year also change the ultimate loss estimate for each subsequent accident year). Over time, as the data for these accident years mature and uncertainty surrounding the ultimate outcome of the workers' compensation claim costs diminishes, we expect the difference between our financial statement loss reserves and our actuarial point estimates will decrease.
When we estimate our loss reserves, we do so in the aggregate for all years, and then allocate them to each accident year. This allows us to look at the year-over-year change in claim severity, or inflation — our most important concept for understanding adequate loss reserve estimates. By allocating loss reserves to individual accident years, we produce an implied rate of inflation for each year. Each
36
quarter, we receive additional data about the inflation rate in paid losses for each accident year as we pay and close additional claims. We use these and other data to determine if any changes in our inflation assumptions are appropriate. The allocation of loss reserves between accident years is less certain for more recent accident years, for which there is less paid loss data and greater uncertainty caused by the legislative reforms in 2003 and 2004. Any changes in our assumptions about inflation rates will cause a change in our loss reserve estimates, although our view of the adequacy of the total loss reserve estimate may be unchanged if the effect of the change in the inflation assumptions has the effect of reallocating the loss reserve estimate among accident years.
At December 31, 2006, the workers' compensation accident year paid loss inflation rates (negative inflation or deflation rates are shown in parentheses) in our paid loss data and the assumptions of accident year inflation rates in our estimates of ultimate losses were as follows:
| |
| |
| |
| |
| |
| |
| |
| |
| |
| |
| | Assumed Inflation (Deflation) in Estimated Ultimate Losses
| |
|---|
(Dollars in
Thousands)
| | Estimated Ultimate Losses (A)
| | Average Paid Loss per Claim Annual Inflation (Deflation) Evaluated After (Number of Months)
| |
|---|
| |
| |
| | June 30, 2006
| |
| |
| |
|---|
Accident
Year
| |
| | 12
| | 24
| | 36
| | 48
| | 60
| | 72
| | 84
| | 96
| | 108
| | December 31, 2006
| | September 30, 2006
| | March 31, 2006
| | December 31, 2005
| |
|---|
| |
|---|
| 1998 | | $ | 220,802 | | 15 | % | 9 | % | 9 | % | 9 | % | 9 | % | 11 | % | 13 | % | 13 | % | 14 | % | 14 | % | 14 | % | 14 | % | 14 | % | 14 | % |
| 1999 | | | 220,032 | | 14 | | 15 | | 15 | | 14 | | 15 | | 15 | | 16 | | 15 | | | | 16 | | 16 | | 16 | | 16 | | 16 | |
| 2000 | | | 240,350 | | 2 | | 10 | | 11 | | 13 | | 13 | | 13 | | 12 | | | | | | 14 | | 14 | | 14 | | 14 | | 14 | |
| 2001 | | | 313,136 | | 18 | | 16 | | 16 | | 15 | | 15 | | 14 | | | | | | | | 17 | | 17 | | 17 | | 17 | | 17 | |
| 2002 | | | 327,111 | | (2 | ) | 2 | | 4 | | 4 | | 3 | | | | | | | | | | 7 | | 8 | | 8 | | 8 | | 8 | |
| 2003 | | | 348,269 | | 11 | | 2 | | (2 | ) | (4 | ) | | | | | | | | | | | 5 | | 5 | | 6 | | 6 | | 6 | |
| 2004 | | | 355,250 | | (7 | ) | (11 | ) | (15 | ) | | | | | | | | | | | | | (5 | ) | (1 | ) | 0 | | 2 | | 5 | |
| 2005 | | | 390,669 | | (2 | ) | (8 | ) | | | | | | | | | | | | | | | (11 | ) | (11 | ) | (2 | ) | 3 | | 6 | |
| 2006 | | | 360,663 | | 7 | | | | | | | | | | | | | | | | | | (4 | ) | (6 | ) | 0 | | 0 | | | |
| |
- (A)
- Estimated ultimate losses for an accident year represent the estimated aggregate amount we expect to pay for all claims that will be reported for that year for losses and allocated loss adjustment expenses. Loss reserves are the liability for the unpaid portion of ultimate losses, computed by subtracting the amount paid from the ultimate loss estimate as of the balance sheet date.
In 2006, we received the following information:
- •
- We paid and closed additional claims and the paid loss deflation trends in recent accident years continued, primarily in the 2004 and 2005 accident years with decreases of 4 and 6 percentage points, respectively.
- •
- We observed a change in the mix of claims for the 2005 and 2006 accident years. The number of California permanent disability claims (expensive claims) relative to the total number of claims decreased compared to 2004 and prior accident years.
- •
- The California Workers' Compensation Insurance Rating Bureau ("WCIRB") recently published its current estimate of California workers' compensation loss experience based on data through September 30, 2006. Their loss ratio estimates are 30% and 31% for accident years 2005 and 2004, respectively, and their combined ratios estimates are 54% for both 2005 and 2004. Their estimate of the California worker's compensation industry aggregate reserve redundancy for all accident years increased to $8.2 billion using data through September 30, 2006 from $5.0 billion using data through December 31, 2005, and from $0.5 billion using data through September 30, 2005. Their analysis contains some specific anticipated savings from the reforms and also relies significantly on the most current paid loss trends.
37
- •
- During the recent California legislative session, it became clear that there is currently no intent to retroactively change the workers' compensation reforms, although we anticipate on-going discussions regarding prospectively increasing benefits to injured workers with permanent disabilities.
- •
- The California Workers' Compensation Appeals Board upheld the validity of the 2005 permanent disability rating schedule, but it ruled that expert testimony or other expert evidence will be permitted in the determination of permanent disability on a case by case basis.
Considerable judgment is used in determining our inflation assumptions and each quarter we consider and evaluate the most recent trends, new information and the payment of additional claims, as well as the inherent uncertainties discussed previously. During 2006, we decreased the inflation assumption 10 percentage points for the 2004 accident year to reflect changes in paid loss deflation trends for this accident year, as well as attributing more weight to the paid loss trends because of the passage of time and because more claims were closed. We also considered the WCIRB's growing confidence in the 2004 loss cost savings as a result of the legislative reforms. We also reduced our inflation assumptions in estimated losses for the 2005 accident year by 17 percentage points to reflect both the change in the paid loss deflation during 2006 and the observed change in the mix of claims to fewer expensive claims. These lower inflation assumptions resulted in net favorable development of $161.3 million in 2006, principally related to a reduction of estimated losses for the 2005 and 2004 accident years.
The $161.3 million decrease in loss reserves during the year ended December 31, 2006 for accident year 2005 and prior was 12.6% of our estimated workers' compensation net loss reserves at December 31, 2005. As a percentage of workers' compensation net premiums earned for the year ended December 31, 2006, the favorable development of our workers' compensation loss reserves was 17.3%.
Our current accident year combined ratio estimate is impacted by, among other factors, changes in estimates for prior year losses. The favorable development in the 2004 and 2005 accident years, as well as the observed change in the mix of claims to fewer expensive claims for the 2005 and 2006 accident years, had a favorable impact on our ultimate loss estimate for the 2006 accident year. Our 2006 accident year loss and loss adjustment expense ratio and combined ratio estimates are 48.7% and 80.0%, respectively.
During 2005, we reduced our inflation assumptions in estimated losses for the 2003 and 2004 accident years compared to December 31, 2004 to reflect the favorable paid loss deflation trends. The lower inflation assumptions resulted in net favorable development of $100.8 million in 2005 for the 2004 and 2003 accident years, of which $74.5 million was reallocated to increase reserves for older accident years. The net decrease in loss reserves during the year ended December 31, 2005 for accident years 2004 and prior was $26.3 million, or 2.4% of our estimated workers' compensation net loss reserves at December 31, 2004. As a percentage of workers' compensation net premium earned in 2005, the favorable development of our workers' compensation loss reserves was 2.4%.
At December 31, 2004, our inflation assumptions resulted in a reallocation of loss reserve estimates by accident year primarily from 2004 and 2003 to older accident years. The net increase in workers' compensation loss reserves in 2004 for accident years 2003 and prior was $20.2 million, or 2.4% of our workers' compensation net loss reserves at December 31,
38
2003. As a percentage of workers' compensation net premiums earned in 2004, this adverse development of our workers' compensation loss reserves was 2.2%.
Different assumptions about the inflation or deflation rates would change our workers' compensation loss reserve estimates, and a material change is reasonably possible although we cannot predict if and to what extent such a change will occur. A change in the assumed inflation rate for any particular accident year would change our estimate of ultimate losses for that accident year by an amount equal to the change in the inflation rate multiplied by the estimated loss for that year. Such a change in the inflation rate for a particular accident year would also change the estimated ultimate loss for each subsequent accident year. For example, if the average annual inflation rate for each of the accident years 2001 through 2006 were decreased by one percentage point in each year, our loss reserve estimates at December 31, 2006 would decrease by about $70.7 million as illustrated in the table that follows:
|
|---|
(Dollars in thousands)
| | Assumption Currently Used
| | Revised Assumption
|
|---|
|
|---|
Accident Year
| | Assumed
Inflation
(Deflation)
Rate
| | (a)
Cumulative
Inflation
Factor
| | (b)
Estimated
Ultimate
Losses
| | Assumed
Inflation
(Deflation)
Rate
| | (c)
Cumulative
Inflation
Factor
| | [(c)/(a)]x(b)]
Estimated
Ultimate
Losses
|
|---|
|
|---|
| 2001 | | 17 | % | 1.170 | | $ | 313,136 | | 16 | % | 1.160 | | $ | 310,460 |
| 2002 | | 7 | | 1.252 | | | 327,111 | | 6 | | 1.230 | | | 321,363 |
| 2003 | | 5 | | 1.314 | | | 348,269 | | 4 | | 1.279 | | | 338,992 |
| 2004 | | (5 | ) | 1.249 | | | 355,250 | | (6 | ) | 1.202 | | | 341,882 |
| 2005 | | (11 | ) | 1.111 | | | 390,669 | | (12 | ) | 1.058 | | | 372,032 |
| 2006 | | (4 | ) | 1.067 | | | 360,663 | | (5 | ) | 1.005 | | | 339,706 |
| | | | | | |
| | | | | |
|
| | | | | | | $ | 2,095,098 | | | | | | $ | 2,024,435 |
| | | | | | | | | | | | Decrease | | $ | 70,663 |
|
In California, as of December 31, 2006, we have closed only 34%, 11% and 1% of our 2004, 2005 and 2006 expensive permanent disability cases, respectively. These closing ratios are slower than the ratios we experienced prior to reforms and are too small for us to conclude at this time that the recent decline in the short-term inflation rate will offset the long-term inflation in workers' compensation health care costs, which have historically exceeded general health care costs. As a result, we have established current loss reserves based on our best estimate that the cumulative inflation rates from 2002 to 2006 will be higher than observed in our paid claim data, but lower than the actual inflation rates observed during 1998 - 2001.
We believe our loss reserve estimates are adequate. However, the actual ultimate inflation (or deflation) rate will not be known with any certainty for several years. We assume that general health care inflation trends will continue and will impact our long-term claim costs and loss reserves. The extent to which this may be offset by benefits from the reform legislation and recently observed reduction in the number of California expensive claims is uncertain. We will evaluate our best estimate of inflation rates and reserves every quarter to reflect the most current data.
Reinsurance Loss Reserves. Loss reserve estimates in our reinsurance segment are subject to uncertainties that are inherent to the reinsurance business. As a reinsurer, we are further removed from the original loss events than we would be as a primary insurer. Therefore, we are subject to longer reporting lags. We are also subject to the estimates that
39
ceding companies make before they determine when, if and how much to report to us. When we are estimating losses for catastrophes, our estimates are highly dependent upon the nature and timing of the event and our ability to obtain timely and accurate information with which to estimate our liability. In September 2005, we exited the reinsurance business and ceased writing and renewing assumed reinsurance. As of December 31, 2006, all of our assumed reinsurance contracts are fully expired and our continuing exposure is limited to loss reserve development, if any, on prior accident years and resulting adjustments to contractual premium.
Estimated catastrophe losses in 2006 reflect $19.9 million of increased estimated losses primarily attributable to Hurricanes Wilma and Rita based on claims and information we received in 2006.
In 2005, we recorded our estimate of the impact of losses arising from Hurricanes Katrina, Rita and Wilma of $69.2 million, net of reinstatement premiums.
In 2004, we recorded our estimate of the impact of the Florida hurricanes of $26.8 million, net of reinstatement premiums. In the fourth quarter of 2004, we also revised our estimate of losses from the WTC in 2001. In view of the time that had elapsed from the date of the loss and an absence of additional reported losses, we reduced our WTC estimate by $5.7 million — the amount of outstanding IBNR, net of reinstatement premiums.
Estimates of the impact of catastrophe losses are based on the information that is currently available and such estimates could change based on any new information that becomes available or based upon any reinterpretation of existing information.
Asbestos and Environmental Loss Reserves. We have exposure to asbestos losses in our workers' compensation segment which have not been material to results of operations or financial condition in any year or in the aggregate. In our history, we have paid and closed approximately 4,000 such asbestos-related workers' compensation claims for a total of $10.8 million. At December 31, 2006, we had approximately 500 such claims open with loss reserves of $4.1 million compared to our total workers' compensation net loss reserves of $1.2 billion.
We also have potential exposure to environmental and asbestos losses and loss adjustment expenses beginning in 1985 through our reinsurance segment, but the business we reinsured in this segment contains exclusion clauses for such losses. We believe that our reserves for environmental and asbestos losses are currently appropriately established.
INVESTMENTS
We invest the net cash flow from our operations and from our capital primarily in fixed maturity securities with investment-grade ratings. These investments provide a stable source of income over the long-run, although, in the short-run, changes in interest rates impact the amount of investment income we earn. As a result of favorable cash flow from our workers' compensation segment our investment portfolio increased. Recently, we have maintained a high proportion of investments with short-term maturities.
The increase in investment income during each of the three years ending December 31, 2006 was principally the result of the increase in our investment portfolio and higher short-term interest rates in 2006 and 2005.
40
The average yields on the investment portfolio were as follows:
| |
|---|
| | Year Ended December 31,
| |
|---|
| | 2006
| | 2005
| | 2004 (2)
| |
|---|
| |
|---|
| Before tax(1) | | 4.8 | % | 3.9 | % | 3.8 | % |
| After tax | | 3.2 | | 2.6 | | 2.5 | |
| |
(1) Reflects the pre-tax equivalent yield on tax-exempt securities.
(2) Investment income in 2004 includes $2.7 million of contingent interest on a mortgage loan.
Net realized gains from sales of investments will vary each year based on market performance and opportunities. Realized gains from real estate investments contributed $1.7 million, $8.3 million and $15.5 million to net realized gains in 2006, 2005 and 2004, respectively. In 2006, we recorded a $2.1 million realized investment gain on proceeds received from a class action settlement relating to the WorldCom, Inc. securities litigation. Previously in 2002, we recognized a loss of $3.9 million on our investment in WorldCom, Inc., which we also sold in 2002. Net realized gains were reduced by a charge of $9.5 million before tax ($6.2 million after tax) in the second quarter of 2005 associated with Advent Capital (see description under "Equity in Earnings of Investee" on page 32).
Our investment portfolio was comprised as follows:
| |
|---|
| | December 31,
| |
|---|
| | 2006
| | 2005
| |
|---|
| |
|---|
| Fixed Maturity Securities | | 65 | % | 54 | % |
| Short-term Investments | | 30 | | 42 | |
| Equity Securities | | 4 | | 3 | |
| Other Investments | | 1 | | 1 | |
| |
| | | 100 | % | 100 | % |
| |
Fixed maturity securities include primarily corporate bonds, U.S. Government bonds, municipal bonds and mortgage-backed securities issued by the Government National Mortgage Association ("GNMA"). Of the fixed maturity portfolio, including short-term investments, 93% and 95% were rated investment grade at December 31, 2006 and December 31, 2005, respectively. The average maturity of the fixed maturity portfolio, including short-term investments, was 3.7 years and 3.8 years at December 31, 2006 and December 31, 2005, respectively. The duration of the fixed maturity portfolio including short-term investments was 2.8 years and 2.9 years as of December 31, 2006 and December 31, 2005, respectively.
At December 31, 2006 and 2005, 90% and 93%, respectively, of the investments in fixed maturity securities and short-term investments were classified as available-for-sale. Total unrealized net losses in our fixed maturity securities at December 31, 2006 and 2005 were $10.2 million and $3.7 million, respectively. Stockholders' equity will fluctuate with changes in the fair values of available-for-sale securities. Stockholders' equity decreased by $4.0 million after deferred tax from December 31, 2005 to December 31, 2006 and by $14.8 million after deferred tax from December 31, 2004 to December 31, 2005 as a result of changes in the fair values of fixed maturity investments classified as available-for-sale.
The unrealized net (losses) gains on available-for-sale fixed maturity investments were as follows:
| |
|---|
| | Available-for-Sale
| |
|---|
(Dollars in thousands)
| | Before Tax
| | After Tax
| |
|---|
| |
|---|
| December 31, | | | | | | | |
| 2006 | | $ | (9,562 | ) | $ | (6,215 | ) |
| 2005 | | | (3,423 | ) | | (2,225 | ) |
| 2004 | | | 19,322 | | | 12,559 | |
| |
The fair values of investment securities are generally obtained from market sources. However, the fair values of non-traded fixed maturity securities of $20.6 million and $41.0 million at December 31, 2006 and December 31, 2005, respectively, were estimated
41
using a quantitative analytical technique to arrive at an estimate of fair value. This technique compares the security to traded securities with similar maturity and credit rating characteristics. The underlying assumption in this methodology is that fair values of non-traded securities can be reasonably estimated because if they were traded, our non-traded securities would probably have market yields similar to traded securities with similar credit and maturity characteristics. The fair value of a non-traded common stock investment at December 31, 2006 and 2005 was estimated based on the net asset value of the company which is comprised principally of real estate holdings. Translated into United States dollars, the estimated fair value was $37.3 million and $23.7 million at December 31, 2006 and December 31, 2005, respectively.
We diversify our corporate debt investments across a number of industries. The largest concentration of corporate debt investments is in insurance companies (fair values of approximately $183.9 million and $120.2 million at December 31, 2006 and 2005, respectively). Investments in corporate debt expose us to the risk of loss of principal in the event of default by the issuer. Also, market prices of both corporate debt and equity investments can fall significantly below the prices at which we acquired the investment. We monitor our portfolio continuously and actively manage our investments to preserve principal values whenever possible. When, in the opinion of management, a decline in the fair value of an investment below its cost or amortized cost is considered to be other-than-temporary, such investment is written-down to its fair value. The amount written-down is recorded in earnings as a realized loss on investments. The determination of other-than-temporary includes, in addition to other relevant factors, a presumption that if the fair value is below cost by a significant amount for a period of time, a write-down is necessary. Investment write-downs reduced realized gains on investments as follows:
|
|---|
| | Year Ended
December 31,
|
|---|
(Dollars in thousands)
| | 2006
| | 2005
| | 2004
|
|---|
|
|---|
| Write-downs | | none | | $ | 9,547 | | $ | 68 |
|
The write-down in 2005 was attributable to our investment in Advent Capital.
Our internal investments department manages our investment portfolio and we do not rely on external portfolio managers. We continuously assess the prospects for individual securities as part of ongoing portfolio management, including the identification of other-than-temporary declines in fair values. This process includes reviewing the amount and length of time of unrealized losses on investments, historical and projected company financial performance, company-specific news and other developments, the outlook for industry sectors, credit ratings and macro-economic changes, including government policy initiatives. We believe that we have appropriately identified other-than-temporary declines in fair value in the three years ended December 31, 2006, and that our remaining unrealized losses at December 31, 2006 are not other-than-temporary. We base this conclusion on our current understanding of the issuers of these securities, as described above, and because we have also established a presumption that an unrealized loss of a significant amount for a specific period of time is other-than-temporary. We have consistently applied this presumption for fifteen years. We also have the ability and intent to hold securities with unrealized losses for a sufficient amount of time for them to recover their values or reach maturity.
Investments that we currently own could be subject to default by the issuer or could suffer future declines in value that become
42
other-than-temporary. Unrealized losses on fixed maturity securities at December 31, 2006 are principally attributable to increases in short-term interest rates in 2006 and 2005.
Set forth below is information about unrealized gains and losses in our investment portfolio at December 31, 2006:
|
|---|
| | Securities
with Unrealized
|
|---|
(Dollars in thousands)
| | Losses
| | Gains
|
|---|
|
|---|
| Fixed maturity securities: | | | | | | |
| | Fair value | | $ | 991,879 | | $ | 495,210 |
| | Amortized cost | | | 1,010,102 | | | 487,193 |
| | Unrealized (loss) gain | | | (18,223 | ) | | 8,017 |
| | Fair value as a percentage of amortized cost | | | 98.2% | | | 101.7% |
| | Number of security positions held | | | 187 | | | 112 |
|
| | Concentration of unrealized (losses) gains by type or industry: | | | | | | |
| | | Hotels | | $ | (2,715 | ) | $ | 191 |
| | | Municipal bonds | | | (1,827 | ) | | 354 |
| | | Food and beverage | | | (1,285 | ) | | 129 |
| | | Petroleum | | | (1,234 | ) | | 30 |
| | | Machinery | | | (1,169 | ) | | 103 |
| | | Financial institutions | | | (1,092 | ) | | 1,043 |
| | | Pharmaceuticals | | | (1,025 | ) | | 123 |
| | | Utilities | | | (940 | ) | | 206 |
| | | Insurance companies | | | (828 | ) | | 2,970 |
| | | Personal goods | | | (700 | ) | | 228 |
| | | GNMA | | | (691 | ) | | 881 |
| | | Other | | | (4,717 | ) | | 1,759 |
|
| | | Total | | $ | (18,223 | ) | $ | 8,017 |
|
| Fixed maturity securities: | | | | | | |
| | Investment grade: | | | | | | |
| | | Fair value | | $ | 914,960 | | $ | 411,855 |
| | | Amortized cost | | | 928,540 | | | 406,550 |
| | | Fair value as a percentage of amortized cost | | | 98.5% | | | 101.3% |
| | Non-investment grade: | | | | | | |
| | | Fair value | | $ | 76,919 | | $ | 83,355 |
| | | Amortized cost | | | 81,562 | | | 80,643 |
| | | Fair value as a percentage of amortized cost | | | 94.3% | | | 103.4% |
|
| Equity securities: | | | | | | |
| | Fair value | | $ | 3,463 | | $ | 94,855 |
| | Cost | | | 3,477 | | | 65,537 |
| | Unrealized (loss) gain | | | (14 | ) | | 29,318 |
| | Fair value as a percentage of cost | | | 99.6% | | | 144.7% |
| | Number of security positions held | | | 3 | | | 22 |
|
The table below sets forth the fair value of fixed maturity securities at December 31, 2006 based on their scheduled maturities:
|
|---|
| | Securities with Unrealized
|
|---|
(Dollars in thousands)
| | Losses
| | Gains
|
|---|
|
|---|
| 1 year or less | | $ | 101,853 | | $ | 14,051 |
| After 1 year through 5 years | | | 303,526 | | | 220,093 |
| After 5 years through 10 years | | | 573,967 | | | 235,401 |
| After 10 years | | | 12,533 | | | 25,665 |
|
| Total | | $ | 991,879 | | $ | 495,210 |
|
The tables below set forth information about fixed maturity securities with unrealized losses at December 31, 2006:
| |
|---|
(Dollars in thousands)
| | Fair
Value
| | Unrealized
Losses
| | Fair Value
as a % of
Cost Basis
| |
|---|
| |
|---|
| Fixed maturity securities with unrealized losses: | | | | | | | | | |
| Individually exceeding $0.5 million and for: | | | | | | | | | |
| | 6-12 months (1 issue) | | $ | 8,888 | | $ | (1,218 | ) | 87.9 | % |
| | Greater than 12 months (3 issues) | | | 43,363 | | | (2,584 | ) | 94.4 | % |
| Less than $0.5 million (183 issues) | | | 939,628 | | | (14,421 | ) | 98.5 | % |
| |
| Total | | $ | 991,879 | | $ | (18,223 | ) | 98.2 | % |
| |
The aging of unrealized losses on equity securities at December 31, 2006 is not presented because such unrealized losses are not material to our consolidated financial condition, results of operations or cash flows. At December 31, 2006, there were no investments in fixed maturity or equity securities with individually material unrealized losses.
43
The following is a summary of securities sold at a loss:
| |
|---|
| | Year Ended December 31,
| |
|---|
(Dollars in thousands)
| | 2006
| | 2005
| | 2004
| |
|---|
| |
|---|
| Fixed maturity securities: | | | | | | | | | | |
| Realized losses on sales | | $ | (3,163 | ) | $ | (10,248 | ) | $ | (2,648 | ) |
| Fair value at the date of sale | | | 1,721,649 | | | 2,236,432 | | | 309,254 | |
| Number of securities sold | | | 23 | | | 48 | | | 18 | |
| Losses realized on securities with an unrealized loss preceding the sale for: | | | | | | | | | | |
| | Less than 3 months | | $ | (826 | ) | $ | (2,388 | ) | $ | (1,748 | ) |
| | 3-6 months | | | | | | (2,839 | ) | | (213 | ) |
| | 6-12 months | | | (1,103 | ) | | (4,324 | ) | | (686 | ) |
| | Greater than 12 months | | | (1,234 | ) | | (697 | ) | | (1 | ) |
| |
| Equity securities: | | | | | | | | | | |
| Realized losses on sales | | $ | (560 | ) | $ | (2,031 | ) | $ | (2,099 | ) |
| Fair value at the date of sale | | | 5,768 | | | 17,271 | | | 20,334 | |
| Number of securities sold | | | 3 | | | 17 | | | 23 | |
| Losses realized on securities with an unrealized loss preceding the sale for: | | | | | | | | | | |
| | Less than 3 months | | $ | (407 | ) | $ | (699 | ) | $ | (1,891 | ) |
| | 3-6 months | | | | | | (602 | ) | | (208 | ) |
| | 6-12 months | | | (153 | ) | | (730 | ) | | | |
| |
Sales of investments at a loss result from ongoing portfolio management, for example, in response to changes in interest rates, changes in our view of the prospects for an issuer or its industry and changes in our views about appropriate asset concentrations and allocation. At the time we sold these investments at a loss, we had the ability to hold them for the long-term and the sales were not related to any liquidity needs. At December 31, 2006, those securities which we are holding in our portfolio with an unrealized loss were compatible with our current view of appropriate asset allocation and issuer prospects. Any future changes in those assumptions could result in sales at a loss or write-downs of securities.
Under the criteria of Statement of Financial Accounting Standards No. 57, "Related Party Disclosures," our investments in the common stock of Wynn Resorts, Limited ("Wynn Common Stock") and in the Wynn Las Vegas LLC corporate bonds ("Wynn Bonds") meet the definition of investments in related parties. However, these investments were made in the ordinary course of business, in which we make investment and reinvestment decisions, and were purchased at prevailing market prices at the time of purchase. The table below sets forth the fair value of our investment in these related parties:
|
|---|
| | December 31,
|
|---|
(Dollars in thousands)
| | 2006
| | 2005
|
|---|
|
|---|
| | Wynn Common Stock | | $ | 16,424 | | $ | 13,713 |
| | Wynn Bonds | | | 9,938 | | | 9,725 |
|
| | Total | | $ | 26,362 | | $ | 23,438 |
|
Two of Zenith's Directors are also Directors of Wynn Resorts, Limited.
We sold shares of Wynn Common Stock in 2006 and 2005 and recognized gains of $6.1 million and $25.5 million, respectively.
TERRORISM EXPOSURE AND THE TERRORISM RISK INSURANCE ACT OF 2002
Under our workers' compensation policies, we are required to provide workers' compensation benefits for losses arising from acts of terrorism. The impact of any terrorist act is unpredictable, and the ultimate impact on us will depend upon the nature, extent, location and timing of such an act. Any such impact on us could have a material adverse affect on our business and financial condition.
We have purchased reinsurance for domestic acts of terrorism up to $150 million in excess of a $1 million retention and we retain 50% of any losses between $10 million and $20 million. The reinsurance for foreign acts of terrorism is up to $75 million in excess of a $1 million retention and we retain 50% of any losses between $10 million and $20 million. Both of these coverages exclude losses from nuclear, biological and chemical attacks for losses in
44
excess of $20 million and we retain 15% of any such losses between $10 million and $20 million.
In 2005, the Terrorism Risk Insurance Act of 2002 ("Act"), was extended through December 31, 2007. It is unclear at this time whether the Act or a modified version will be extended beyond December 31, 2007. The Act, as modified in 2005, may provide us with reinsurance protection for losses arising out of terrorist acts under certain circumstances and subject to certain limitations. The U.S. Treasury Secretary must certify an act for it to constitute an act of terrorism. The definition of terrorism excludes domestic acts of terrorism or acts of terrorism committed in the course of a war declared by the U.S. Congress. The losses arising from an act of terrorism must exceed a threshold amount to qualify for reimbursement. The threshold is $100 million in 2007. If an event is certified, the U.S. Federal Government will reimburse losses not to exceed $100 billion in any year. Each insurance company is responsible for a deductible based on a percentage of its direct earned premiums in the previous calendar year. Our deductible is $192.8 million in 2007. For losses in excess of the deductible in 2007, the U.S. Federal Government will reimburse 85% of the insurer's loss, up to the insurer's proportionate share of the $100 billion limit.
Notwithstanding the protection provided by the reinsurance we have purchased and any protection provided by the Act, the risk of severe losses to us from acts of terrorism has not been eliminated because events may not be covered by, or may exceed the capacity of, our reinsurance protection. Also, an act of terrorism may impact the business community at large, impacting our ability to conduct business, even if any losses we sustain are covered by our reinsurance or any protection provided by the Act. Accordingly, any acts of terrorism could materially adversely affect our business and financial condition.
In our workers' compensation business, we monitor the geographical concentrations of insured employees to help mitigate the risk of loss from terrorist acts and other catastrophes. Also, small businesses constitute a large proportion of our policies, and we avoid risks in high profile locations.
LIQUIDITY AND CAPITAL RESOURCES
The primary concerns in managing our liquidity are (a) the need to ensure that there is adequate cash available in the insurance subsidiaries to pay claims, and (b) the need to ensure the holding company, Zenith National, which has no operating revenues, has adequate cash to service our debt obligations and pay any dividends declared to our stockholders. The management of capital resources is primarily concerned with ensuring that there is adequate capital to operate our insurance business within the criteria imposed by regulatory requirements and within the criteria used by rating agencies to assign financial strength ratings.
Liquidity. Our insurance subsidiaries generally create liquidity because insurance premiums are collected prior to disbursements for claims which may take place many years after the collection of premiums. Collected premiums may be invested, prior to their use in such disbursements, and investment income provides additional cash receipts. In periods in which disbursements for claims and benefits, current policy acquisition costs and current operating and other expenses exceed operating cash receipts, cash flow is negative. Such negative cash flow is offset by cash flow from investments, principally from short-term investments and maturities of longer-term investments. The exact timing of the payment of claims and benefits cannot be predicted with certainty. The insurance subsidiaries maintain portfolios of invested assets with varying maturities and a substantial amount of short-term investments to provide adequate cash
45
for the payment of claims. At December 31, 2006, short-term investments and fixed maturity investments maturing within two years in the insurance subsidiaries amounted to $0.9 billion. These securities, in conjunction with our positive cash flow from operations, provide adequate sources of liquidity for the expected payment of our loss reserves in the near future. We do not expect to sell securities or use our credit facility to pay our policy liabilities as they come due.
Net cash flow provided by operating activities was positive for the year ended December 31, 2006 but lower than net cash flow provided by operating activities for the year ended December 31, 2005 and 2004 due to lower workers' compensation premiums and our exit from the reinsurance business as shown in the table below:
| |
|---|
| | December 31,
| |
|---|
(Dollars in thousands)
| | 2006
| | 2005
| | 2004
| |
|---|
| |
|---|
| Net cash flow from workers' compensation business | | $ | 228,882 | | $ | 419,634 | | $ | 375,756 | |
| Net cash used in reinsurance business | | | (73,536 | ) | | (35,219 | ) | | (5,064 | ) |
| Investment income received | | | 73,818 | | | 72,066 | | | 62,337 | |
| Interest and other expenses paid by parent | | | (6,170 | ) | | (19,329 | ) | | (18,010 | ) |
| Income taxes paid | | | (124,004 | ) | | (92,292 | ) | | (69,128 | ) |
| |
| Net cash provided by operating activities | | $ | 98,990 | | $ | 344,860 | | $ | 345,891 | |
| |
We expect positive cash flow from operations in 2007.
Our insurance subsidiaries are required to have securities on deposit for the protection of policyholders in accordance with various states' regulations. At December 31, 2006 and 2005, investments with a fair value of $1.3 billion and $0.9 billion, respectively, were on deposit to comply with such regulations.
Zenith National requires cash to pay any dividends declared to our stockholders, make interest and principal payments on our outstanding debt obligations, fund our operating expenses, and, from time to time, to make capital contributions to Zenith Insurance. Such cash requirements are generally funded in the long-run by dividends received from Zenith Insurance and financing or refinancing activities by Zenith National. Cash, short-term investments and other marketable investments in Zenith National were $69.4 million and $65.1 million at December 31, 2006 and 2005, respectively. Zenith National's available invested assets and other sources of liquidity are currently expected to be sufficient to meet its requirements for liquidity in the short-term and long-term.
Our insurance subsidiaries are subject to insurance regulations which restrict their ability to distribute dividends. These restrictions are set forth in Note 13 to the Consolidated Financial Statements. In 2007, Zenith Insurance expects to be able to pay up to $225.9 million of dividends to Zenith National without the prior approval of the California Department of Insurance. Zenith Insurance paid dividends to Zenith National of $50.0 million, $30.0 million and $20.0 million in 2006, 2005 and 2004, respectively. The restrictions on the payment of dividends have not had, and under current regulations are not expected to have, a material adverse impact on the ability of Zenith Insurance to pay dividends.
In 2003, we issued $125.0 million aggregate principal amount of the Convertible Notes in a private placement, from which Zenith National received net proceeds of $120.0 million (see Note 9 to the Consolidated Financial Statements for a full description of the Convertible Notes). Our Convertible Notes are convertible at each holder's option into shares of our common stock under certain circumstances including if the price of our common stock reaches specified thresholds. In 2005, holders of the Convertible Notes converted $123.8 million aggregate principal amount into shares of our common stock. Each holder of the remaining $1.2 million of Convertible Notes has the right to convert the Convertible Notes into our common stock at a
46
conversion rate of 59.988 shares per $1,000 principal amount of Convertible Notes during the period beginning on January 1, 2007 and ending on March 31, 2007. Whether the Convertible Notes will be convertible after March 31, 2007 will depend upon the occurrence of the events specified in the Indenture governing the Convertible Notes, including the sale price of our common stock. At December 31, 2006, the maximum number of shares that could be required to be issued upon conversion of the remaining Convertible Notes is approximately 69,000.
In 2006 and 2004, we paid $0.5 million to repurchase $0.5 million of aggregate principal amount and paid $7.6 million to repurchase $8.0 million of aggregate principal amount, respectively, of the outstanding 8.55% Capital Securities of Zenith National Insurance Capital Trust I, all voting securities of which are owned by Zenith National ("Redeemable Securities"). We used our available cash balances to fund these purchases.
At December 31, 2006, we had a $30.0 million revolving credit agreement with a bank which on February 16, 2007, was renewed with an expiration date of February 16, 2010. Interest is payable on outstanding loans at either the bank's prime rate or a rate based on Eurodollar deposit rates plus a specified margin depending on our credit rating. This credit agreement contains covenants that require, among other things, we maintain certain financial ratios, including a minimum amount of capital in our insurance subsidiaries, a maximum debt-to-total capitalization ratio and a minimum interest coverage ratio. We were in compliance with all of these covenants at December 31, 2006. There was no amount drawn under the line of credit in 2006 or 2005 nor do we currently anticipate the need to draw on the line of credit for the foreseeable future.
Capital Resources. In our insurance subsidiaries, cash and liquid investments are required to pay claims and expenses, but the amount of capital in our insurance subsidiaries influences how much premium we can write. The principal sources of capital for the insurance subsidiaries are the earnings generated by the workers' compensation and investments segments and contributions of capital by Zenith National. The amount of capital in our insurance subsidiaries is maintained relative to standardized capital adequacy measures such as risk-based capital where ratios such as net premiums written to statutory surplus measure capital adequacy. Risk-based capital is used by regulators for financial surveillance purposes and by rating agencies to assign financial strength ratings to our insurance subsidiaries and ratings for the debt issued by Zenith National. Insurance regulations require insurance companies to maintain capital at a minimum of 200% of regulatory risk-based capital. At December 31, 2006, our statutory capital of $559.5 million was 577% of such minimum. Statutory capital at December 31, 2006 has been reduced by $360.3 million for the excess statutory reserves required solely because we are domiciled in California (see Note 13 to the Consolidated Financial Statements). Excluding this excess statutory reserve, our statutory capital at December 31, 2006 would be $919.8 million, which is 948% of regulatory risk-based capital and on a comparable basis to other insurers who are subject to industry rules promulgated by the National Association of Insurance Commissioners.
In 2006, A.M. Best Company ("A.M. Best") affirmed the financial strength rating of our insurance subsidiaries at A- (Excellent), Standard & Poor's Rating Services ("S&P") raised the rating to A- (strong), Moody's Investors Service ("Moody's") raised the rating to A3 (Good) and Fitch Ratings ("Fitch") raised the financial strength rating to A (Strong). Our competitive position is partly determined by
47
these financial strength ratings and therefore we could be affected by a reduction in these ratings. We currently believe that the most influential of these ratings is the rating assigned by A.M. Best. In the A.M. Best rating scheme, ratings of B+ to A++ are considered "Secure" and ratings of B and below are considered "Vulnerable." However, we believe that a reduction in our A.M. Best rating below A- could cause a reduction in the number of policies we write in our workers' compensation segment. In addition to the assigned rating, these rating agencies also provide an accompanying rating outlook for the company. The rating outlook is currently "stable" for the A.M. Best, S&P, Moody's and Fitch ratings.
From time to time, we may make repurchases of our outstanding common stock shares or outstanding debt. At December 31, 2006, we were authorized to repurchase up to 929,000 shares of our common stock at prevailing market prices pursuant to a share repurchase program authorized by our Board of Directors. Any purchases are discretionary and can be adequately funded from our existing sources of liquidity. We have not repurchased any material amounts of our common stock under this repurchase program since 2001 and do not expect to repurchase common stock shares during 2007.
INFLATION
Inflation rates may impact the financial statements and operating results in several areas. Changes in rates of inflation influence interest rates, which in turn impact the market value of the investment portfolio and yields on new investments. Inflation also impacts the portion of losses and loss reserves that relates to hospital and medical expenses and property claims and loss adjustment expenses but not the portion of losses and loss reserves that relates to workers' compensation indemnity payments for lost wages, which are fixed by statute. Adjustments for inflationary impacts are included as part of the continual review of loss reserve estimates. Actuarial account of increases or decreases in costs is considered in setting adequate workers' compensation premium rates, and this is particularly important in the health care area where hospital and medical inflation rates have historically exceeded general inflation rates. Operating expenses, including payrolls, are impacted to a certain degree by the inflation rate.
CONTRACTUAL OBLIGATIONS AND CONTINGENT LIABILITIES
All of our outstanding financing obligations are included in the Consolidated Financial Statements and the accompanying Notes. There are no liquidity or financing arrangements with unconsolidated entities or any off-balance sheet arrangements. Our available invested assets and other sources of liquidity are currently expected to be sufficient to meet our requirements for liquidity in the short-term and long-term.
The table below sets forth the amounts of our contractual obligations, including interest payable, at December 31, 2006:
|
|---|
| | Payments Due by Period
|
|---|
(Dollars in thousands)
| | Less than 1 year
| | 1-3 years
| | 3-5 years
| | More than
5 years
| | Total
|
|---|
|
|---|
| Loss reserves | | $ | 317,461 | | $ | 332,084 | | $ | 164,527 | | $ | 708,208 | | $ | 1,522,280 |
| Policyholders' dividends accrued | | | 47,759 | | | 9,313 | | | | | | | | | 57,072 |
| Redeemable securities | | | 5,002 | | | 10,004 | | | 10,004 | | | 143,529 | | | 168,539 |
| Convertible notes | | | 1,216 | | | | | | | | | | | | 1,216 |
| Operating lease commitments | | | 8,724 | | | 10,610 | | | 3,227 | | | | | | 22,561 |
|
| Total | | $ | 380,162 | | $ | 362,011 | | $ | 177,758 | | $ | 851,737 | | $ | 1,771,668 |
|
Our loss reserves do not have contractual maturity dates and the exact timing of the payment of claims cannot be predicted with certainty. However, based upon historical payment patterns, we have included an estimate of when we expect our loss reserves (without the benefit of any reinsurance recoveries) to be paid. We maintain a portfolio of investments with varying maturities and a substantial
48
amount of short-term investments to provide adequate cash for the payment of claims. We do not expect to have to sell securities or use our credit facilities to pay claims.
Our contractual obligations under the outstanding Redeemable Securities are comprised of $110.0 million of interest payments over the next 22 years and $58.5 million of principal payable in 2028. Our contractual obligations under the outstanding Convertible Notes are comprised of $1.2 million of principal that may be due in 2007 because the holders of the Convertible Notes currently have the right to convert their notes into our common stock during the first quarter of 2007 as a result of the triggering of the contingent conversion condition relative to our stock price at the end of the fourth quarter of 2006. Whether the notes will be convertible after March 31, 2007 will depend upon the occurrence of events specified in the Indenture governing the Convertible Notes, including the sale price of our common stock. If the Convertible Notes are not converted or redeemed prior to the scheduled maturity in 2023, the total interest obligation over the remaining term would be approximately $1.1 million. See Note 9 to the Consolidated Financial Statements for more information concerning the Convertible Notes.
Our commitments and contingencies are disclosed in Note 11 to the Consolidated Financial Statements.
MARKET RISK OF FINANCIAL INSTRUMENTS
The fair value of the fixed maturity investment portfolio is exposed to interest rate risk — the risk of loss in fair value resulting from changes in prevailing market rates of interest for similar financial instruments. However, we have the ability to hold fixed maturity investments to maturity. We rely on the experience and judgment of senior management to monitor and mitigate the effects of market risk. We do not utilize financial instrument hedges or derivative financial instruments to manage risks, nor do we enter into any swap, forward or option contracts, but will attempt to mitigate our exposure through active portfolio management. The allocation among various types of securities is adjusted from time to time based on market conditions, credit conditions, tax policy, changes in interest rates and other factors. In addition, we place the majority of our investments in high-quality, liquid securities and limit the amount of credit exposure to any one issuer.
The table on page 50 provides information about our financial instruments for which fair values are subject to changes in interest rates. For fixed maturity investments, which includes held-to-maturity and available for-sale securities, the table presents fair values of investments held and weighted average interest rates on such investments by expected maturity dates. Such investments include corporate bonds, municipal bonds, U.S. Government bonds and mortgage-backed securities. For our debt obligations, the table presents cash flows by expected maturity dates (including interest).
49
| |
|---|
| | Expected Maturity Date
| |
|---|
(Dollars in thousands)
| | 2007
| | 2008
| | 2009
| | 2010
| | 2011
| | Thereafter
| | Total
| |
|---|
| |
|---|
| December 31, 2006 | | | | | | | | | | | | | | | | | | | | | | |
| Fixed Maturity Investments: | | | | | | | | | | | | | | | | | | | | | | |
| | | Fixed rate | | $ | 115,904 | | $ | 147,827 | | $ | 84,666 | | $ | 93,933 | | $ | 197,193 | | $ | 847,566 | | $ | 1,487,089 | |
| | | Weighted average interest rate | | | 5.4 | % | | 5.2 | % | | 5.2 | % | | 5.3 | % | | 6.0 | % | | 5.6 | % | | 5.6 | % |
| Short-term investments | | $ | 679,989 | | | | | | | | | | | | | | | | | $ | 679,989 | |
| Debt and interest obligations of Zenith: | | | | | | | | | | | | | | | | | | | | | | |
| | Convertible notes payable(1) | | | 1,216 | | | | | | | | | | | | | | | | | | 1,216 | |
| | Redeemable securities | | | 5,002 | | | 5,002 | | | 5,002 | | | 5,002 | | | 5,002 | | | 143,529 | | | 168,539 | |
| |
| |
|---|
| | Expected Maturity Date
| |
|---|
| | 2006
| | 2007
| | 2008
| | 2009
| | 2010
| | Thereafter
| | Total
| |
|---|
| |
|---|
| December 31, 2005 | | | | | | | | | | | | | | | | | | | | | | |
| Fixed Maturity Investments: | | | | | | | | | | | | | | | | | | | | | | |
| | | Fixed rate | | $ | 59,111 | | $ | 190,319 | | $ | 70,724 | | $ | 74,823 | | $ | 62,436 | | $ | 724,490 | | $ | 1,181,903 | |
| | | Weighted average interest rate | | | 4.8 | % | | 4.7 | % | | 5.2 | % | | 4.7 | % | | 5.0 | % | | 5.4 | % | | 5.2 | % |
| Short-term investments | | $ | 904,093 | | | | | | | | | | | | | | | | | $ | 904,093 | |
| Debt and interest obligations of Zenith: | | | | | | | | | | | | | | | | | | | | | | |
| | Convertible notes payable(1) | | | 1,216 | | | | | | | | | | | | | | | | | | 1,216 | |
| | Redeemable securities | | | 5,045 | | $ | 5,045 | | $ | 5,045 | | $ | 5,045 | | $ | 5,045 | | $ | 149,799 | | | 175,024 | |
| |
(1) The Convertible notes payable are shown with an expected maturity date in 2007 at December 31, 2006 and in 2006 at December 31, 2005 because the note holders have the right to convert their notes into our common stock in the first quarter of 2007 and had the same right in the first quarter of 2006 (see Note 9 to the Consolidated Financial Statements).
RECENTLY ISSUED ACCOUNTING PRONOUNCEMENTS
In September 2005, the American Institute of Certified Public Accountants ("AICPA") released Statement of Position 05-1, "Accounting by Insurance Enterprises for Deferred Acquisition Costs in Connection With Modifications or Exchanges of Insurance Contracts" ("SOP 05-1"). SOP 05-1 requires identification of transactions that result in a substantial change in an insurance contract. If it is determined that a substantial change to an insurance contract has occurred, the related unamortized deferred policy acquisition costs, unearned premiums and other related balances must be written off. The Company will adopt SOP 05-1 on January 1, 2007, and we expect that it will not have a material effect on our consolidated financial condition or results of operation.
In February 2006, the Financial Accounting Standards Board ("FASB") issued statement No. 155, "Accounting for Certain Hybrid Financial Instruments" ("SFAS No. 155"). Under current generally accepted accounting principles an entity that holds a financial instrument with an embedded derivative must bifurcate the financial instrument, resulting in the host and the embedded derivative being accounted for separately. SFAS No. 155 permits, but does not require, entities to account for financial instruments with an embedded derivative at fair value thus negating the need to bifurcate the instrument between its host and the embedded derivative. We will adopt SFAS No. 155 on January 1, 2007, and we expect that it will not have a material effect on our consolidated financial condition or results of operation.
In July 2006, the FASB issued FASB Interpretation No. 48, "Accounting for Uncertainty in Income Taxes — an interpretation of FASB Statement No. 109" ("FIN 48"), which provides criteria for the recognition, measurement, presentation and disclosure of uncertain tax positions. A tax benefit from an uncertain position may be recognized only if it is "more likely than not" that the position is sustainable based on its technical merits. We will adopt FIN 48 on January 1, 2007, and we expect that it will not have a material effect on our consolidated financial condition or results of operation.
50
In September 2006, the FASB issued Statement No. 157, "Fair Value Measurements" ("SFAS No. 157"), which provides a common definition of fair value and establishes a framework to make the measurement of fair value more consistent and comparable. SFAS No. 157 also requires expanded disclosures about (1) the extent to which companies measure assets and liabilities at fair value, (2) the methods and assumptions used to measure fair value and (3) the effect of fair value measures on earnings. We will adopt SFAS No. 157 on January 1, 2008 and we expect that it will not have a material effect on our consolidated financial condition or results of operations.
In September 2006, the FASB issued Statement No. 158, "Employers' Accounting for Defined Benefit Pension and Other Postretirement Plans—an amendment of FASB Statements No. 87, 88, 106 and 132(R)" ("SFAS No. 158"). The requirements of SFAS No. 158 are effective for fiscal years ending after June 15, 2007. Since the Company does not sponsor any defined benefit pension or other postretirement plans, SFAS No. 158 will not have any effect on our consolidated financial condition or results of operations.
In September 2006, the Securities and Exchange Commission issued Staff Accounting Bulletin No. 108, "Considering the Effects of Prior Year Misstatements when Quantifying Misstatements in Current Year Financial Statements" ("SAB 108"). SAB 108 provides interpretive guidance on how the effects of prior-year uncorrected misstatements should be considered when quantifying misstatements in the current year financial statements. SAB 108 requires registrants to quantify misstatements using both an income statement and balance sheet approach and evaluate whether either approach results in a misstatement that, when all relevant quantitative and qualitative factors are considered, is material. The adoption of SAB 108 as of December 31, 2006 did not have a material effect on our consolidated financial condition or results of operation.
CRITICAL ACCOUNTING POLICIES AND ESTIMATES
The preparation of financial statements in accordance with accounting principles generally accepted in the United States of America ("GAAP") requires both the use of estimates and judgment relative to the application of appropriate accounting policies. Our accounting policies are described in the Notes to Consolidated Financial Statements, but we believe that the following matters are particularly important to an understanding of our financial statements because changes in these estimates or changes in the assumptions used to make them could have a material impact on the results of operations, financial condition and cash flows.
Loss Reserve Estimation. Loss reserve estimates are inherently uncertain because the ultimate amount we pay under many of the claims we have incurred as of the balance sheet date will not be known for many years. The impact of loss reserve developments on the results of operations in each of the three years ended December 31, 2006 is discussed in the preceding "Loss Reserves" section. Also included is a discussion of the key assumptions and inherent uncertainties underlying our loss reserve estimates and the sensitivity of our loss reserve estimates to our important assumptions.
Investment Write-Downs. When, in the opinion of management, a decline in the fair value of an investment below its cost or amortized cost is considered to be other-than-temporary, such investment is written-down to its fair value. The amount written-down is recorded in earnings as a realized loss on investments. The determination of other-than-temporary includes, in addition to other relevant factors, a presumption that if the
51
market value is below cost by a significant amount for a period of time, a write-down is necessary. Notwithstanding this presumption, the determination of other-than-temporary impairment requires judgment about future prospects for an investment and is therefore a matter of inherent uncertainty. We describe investment write-downs in more detail in the preceding "Investments" section.
Deferred Income Taxes. The temporary differences between the tax and book bases of assets and liabilities are recorded as deferred income taxes. At December 31, 2006 and 2005, Zenith recorded net deferred tax assets of $54.8 million and $67.7 million, respectively, including deferred tax assets of $43.7 million and $55.7 million, respectively, attributable to the fact that the Internal Revenue Code requires property and casualty insurance companies to discount the tax deduction for loss reserves. We do not discount loss reserves in our financial statements. We expect that the net deferred tax asset is fully recoverable because all future deductible amounts associated with temporary differences can be offset by taxes previously paid and by anticipated future taxable income, including investment income. If this assumption were to change, any amount of the net deferred tax asset which we could not expect to recover would be provided for as an allowance and would be reflected as an increase in income tax expense in the period in which it was established.
52
5-YEAR SUMMARY OF SELECTED FINANCIAL INFORMATION
ZENITH NATIONAL INSURANCE CORP. AND SUBSIDIARIES
5-YEAR SUMMARY OF SELECTED FINANCIAL INFORMATION
ZENITH NATIONAL INSURANCE CORP. AND SUBSIDIARIES
| |
|---|
Years Ended December 31,
| | Note
| | 2006
| | 2005
| |
|---|
| |
| (Dollars and shares in thousands, except per share data) | | | | | | | | | |
| Revenues: | | | | | | | | | |
| Premiums earned | | 1 | | $ | 944,217 | | $ | 1,178,700 | |
| Net investment income | | | | | 106,294 | | | 79,200 | |
| Realized gains (losses) on investments | | | | | 13,377 | | | 22,224 | |
| |
| Total revenues | | | | | 1,063,888 | | | 1,280,124 | |
| |
| Results of operations by segment: | | | | | | | | | |
| Net investment income | | | | $ | 106,294 | | $ | 79,200 | |
| Realized gains (losses) on investments | | | | | 13,377 | | | 22,224 | |
| |
| Income before tax from investments segment | | | | | 119,671 | | | 101,424 | |
| Income (loss) before tax from: | | | | | | | | | |
| Workers' compensation segment | | | | | 313,576 | | | 213,244 | |
| Reinsurance segment | | 2 | | | (20,508 | ) | | (56,183 | ) |
| Parent segment | | 3,5 | | | (11,927 | ) | | (20,938 | ) |
| |
| Income (loss) from continuing operations before tax and equity in earnings of investee | | | | | 400,812 | | | 237,547 | |
| Income tax expense (benefit) | | | | | 142,112 | | | 81,894 | |
| |
| Income (loss) from continuing operations after tax and before equity in earnings of investee | | | | | 258,700 | | | 155,653 | |
| Equity in earnings of investee after tax | | | | | | | | 794 | |
| |
| Income from continuing operations after tax | | | | | 258,700 | | | 156,447 | |
| Income from discontinued operations after tax | | 4 | | | | | | 1,253 | |
| |
| Net income | | | | $ | 258,700 | | $ | 157,700 | |
| |
| Per common share — diluted: | | | | | | | | | |
| Income from continuing operations after tax | | 5 | | $ | 6.96 | | $ | 4.29 | |
| Net income | | 5 | | | 6.96 | | | 4.32 | |
| |
| Cash dividends declared per common share | | | | | 1.26 | | | 0.94 | |
| |
| Weighted average common shares outstanding — diluted | | 5 | | | 37,174 | | | 37,052 | |
| |
| Financial condition: | | | | | | | | | |
| Total assets | | | | $ | 2,767,553 | | $ | 2,717,456 | |
| Investments | | | | | 2,273,656 | | | 2,167,000 | |
| Unpaid losses and loss adjustment expenses | | | | | 1,522,280 | | | 1,703,445 | |
| Convertible senior notes payable | | 5 | | | 1,129 | | | 1,124 | |
| Redeemable securities payable | | 6 | | | 58,342 | | | 58,833 | |
| Stockholders' equity | | | | | 940,720 | | | 712,795 | |
| Stockholders' equity per share | | | | | 25.41 | | | 19.14 | |
| Return on average equity | | | | | 31.8% | | | 26.3% | |
| |
| Insurance statistics (GAAP): | | | | | | | | | |
| Combined ratio: | | | | | | | | | |
| Workers' compensation segment | | | | | 66.3 | % | | 80.9 | % |
| Reinsurance segment | | 2 | | | 264.4 | % | | 187.1 | % |
| Net premiums earned-to-surplus ratio | | | | | 1.0 | | | 1.6 | |
| Loss and loss adjustment expense reserves-to-surplus ratio (net of reinsurance) | | | | | 1.4 | | | 2.0 | |
| |
(1) |
|
Net premiums earned in 2004, 2003 and 2002 are net of $98.7 million, $78.5 million and $36.8 million, respectively, of workers' compensation ceded premiums earned in connection with a 10% ceded quota share reinsurance agreement. This agreement was terminated effective December 31, 2004. |
(2) |
|
2006, 2005, 2004 and 2002 include catastrophe losses before tax of $19.9 million, $69.2 million, $21.1 million and $0.4 million, respectively. |
(3) |
|
Includes interest expense before tax of $5.3 million, $8.8 million, $13.1 million, $12.4 million and $5.1 million in 2006, 2005, 2004, 2003 and 2002, respectively. |
(4) |
|
In 2002, we sold our home-building business and related real estate assets. Income from discontinued real estate operations in 2002 includes the gain on the sale of $6.3 million after tax. In 2005, 2004 and 2003, we received payments of $1.9 million before tax ($1.3 million after tax), $2.0 million before tax ($1.3 million after tax) and $1.8 million before tax ($1.2 million after tax), respectively, of additional sales proceeds under the earn-out provision of the sale. The last such payment under the earn-out provision was received in 2005.
|
54
Years Ended December 31,
|
| |
|---|
2004
| | 2003
| | 2002
| |
|---|
| |
| (Dollars and shares in thousands, except per share data) | | | | | | | | | |
| Revenues: | | | | | | | | | |
| Premiums earned | $ | 944,425 | | $ | 773,799 | | $ | 557,055 | |
| Net investment income | | 61,876 | | | 56,103 | | | 48,811 | |
| Realized gains (losses) on investments | | 38,579 | | | 19,433 | | | (3,631 | ) |
| |
| Total revenues | | 1,044,880 | | | 849,335 | | | 602,235 | |
| |
| Results of operations by segment: | | | | | | | | | |
| Net investment income | $ | 61,876 | | $ | 56,103 | | $ | 48,811 | |
| Realized gains (losses) on investments | | 38,579 | | | 19,433 | | | (3,631 | ) |
| |
| Income before tax from investments segment | | 100,455 | | | 75,536 | | | 45,180 | |
| Income (loss) before tax from: | | | | | | | | | |
| Workers' compensation segment | | 104,098 | | | 29,260 | | | (43,848 | ) |
| Reinsurance segment | | (11,956 | ) | | 9,562 | | | 7,644 | |
| Parent segment | | (19,051 | ) | | (17,694 | ) | | (10,237 | ) |
| |
| Income (loss) from continuing operations before tax and equity in earnings of investee | | 173,546 | | | 96,664 | | | (1,261 | ) |
| Income tax expense (benefit) | | 57,213 | | | 33,664 | | | (914 | ) |
| |
| Income (loss) from continuing operations after tax and before equity in earnings of investee | | 116,333 | | | 63,000 | | | (347 | ) |
| Equity in earnings of investee after tax | | 1,381 | | | 2,846 | | | 1,363 | |
| |
| Income from continuing operations after tax | | 117,714 | | | 65,846 | | | 1,016 | |
| Income from discontinued operations after tax | | 1,286 | | | 1,154 | | | 9,184 | |
| |
| Net income | $ | 119,000 | | $ | 67,000 | | $ | 10,200 | |
| |
| Per common share — diluted: | | | | | | | | | |
| Income from continuing operations after tax | $ | 3.35 | | $ | 2.04 | | $ | 0.03 | |
| Net income | | 3.38 | | | 2.07 | | | 0.36 | |
| |
| Cash dividends declared per common share | | 0.75 | | | 0.67 | | | 0.67 | |
| |
| Weighted average common shares outstanding — diluted | | 36,696 | | | 34,256 | | | 28,343 | |
| |
| Financial condition: | | | | | | | | | |
| Total assets | $ | 2,414,655 | | $ | 2,023,704 | | $ | 1,615,113 | |
| Investments | | 1,900,014 | | | 1,530,494 | | | 1,098,284 | |
| Unpaid losses and loss adjustment expenses | | 1,482,319 | | | 1,220,749 | | | 1,041,532 | |
| Convertible senior notes payable | | 121,548 | | | 121,019 | | | | |
| Redeemable securities payable | | 58,825 | | | 66,794 | | | 65,719 | |
| Stockholders' equity | | 502,147 | | | 383,246 | | | 317,024 | |
| Stockholders' equity per share | | 17.28 | | | 13.51 | | | 11.26 | |
| Return on average equity | | 27.2% | | | 18.8% | | | 3.3% | |
| |
| Insurance statistics (GAAP): | | | | | | | | | |
| Combined ratio: | | | | | | | | | |
| Workers' compensation segment | | 88.5 | % | | 95.9 | % | | 108.7 | % |
| Reinsurance segment | | 128.2 | % | | 84.3 | % | | 85.6 | % |
| Net premiums earned-to-surplus ratio | | 1.5 | | | 1.5 | | | 1.5 | |
| Loss and loss adjustment expense reserves-to-surplus ratio (net of reinsurance) | | 1.9 | | | 2.0 | | | 2.2 | |
| |
(5) |
|
On March 21, 2003, Zenith issued $125.0 million aggregate principal amount of 5.75% Convertible Senior Notes due March 30, 2023 ("Convertible Notes") and received net proceeds of approximately $120.0 million. Diluted per share amounts for the years ended December 31, 2006, 2005, 2004 and 2003 reflect the impact of the additional shares issued or issuable in connection with the Convertible Notes. In 2005, $123.8 million of the Convertible Notes were converted into shares of our common stock. In connection with certain of these conversions we paid a cash incentive of $4.7 million in 2005 which is included in the parent segment. |
(6) |
|
In 2006 and 2004, we paid $0.5 million to repurchase $0.5 million of aggregate principal amount and paid $7.6 million to repurchase $8.0 million of aggregate principal amount, respectively, of the outstanding 8.55% Capital Securities of Zenith National Insurance Capital Trust I, all voting securities of which are owned by Zenith.
|
55
CONSOLIDATED BALANCE SHEETS
ZENITH NATIONAL INSURANCE CORP. AND SUBSIDIARIES
| |
|
| | December 31,
| |
|---|
(Dollars and shares in thousands)
|
| | 2006
| | 2005
| |
|---|
| |
| Assets: | | | | | | | | |
| Investments: | | | | | | | | |
| | Fixed maturity investments: | | | | | | | | |
| | | At amortized cost (fair value $215,902 in 2006 and $137,237 in 2005) | | | $ | 216,546 | | $ | 137,535 | |
| | | At fair value (amortized cost $1,280,749 in 2006 and $1,048,089 in 2005) | | | | 1,271,187 | | | 1,044,666 | |
| | Equity securities, at fair value (cost $69,014 in 2006 and $68,048 in 2005) | | | | 98,318 | | | 73,304 | |
| | Short-term investments (at cost or amortized cost, which approximates fair value) | | | | 679,989 | | | 904,093 | |
| | Other investments | | | | 7,616 | | | 7,402 | |
| |
| Total investments | | | | 2,273,656 | | | 2,167,000 | |
| Cash | | | | 7,310 | | | 7,469 | |
| Accrued investment income | | | | 19,209 | | | 14,165 | |
| Premiums receivable | | | | 32,413 | | | 64,749 | |
| Receivable from reinsurers for paid and unpaid losses | | | | 235,802 | | | 259,076 | |
| Deferred policy acquisition costs | | | | 12,617 | | | 16,674 | |
| Deferred tax asset | | | | 54,753 | | | 67,674 | |
| Goodwill | | | | 20,985 | | | 20,985 | |
| Other assets | | | | 110,808 | | | 99,664 | |
| |
| Total assets | | | $ | 2,767,553 | | $ | 2,717,456 | |
| |
| Liabilities: | | | | | | | | |
| Policy liabilities: | | | | | | | | |
| | Unpaid losses and loss adjustment expenses | | | $ | 1,522,280 | | $ | 1,703,445 | |
| | Unearned premiums | | | | 82,992 | | | 123,473 | |
| Policyholders' dividends accrued (see Note 2) | | | | 57,072 | | | 30,576 | |
| Convertible senior notes payable | | | | 1,129 | | | 1,124 | |
| Redeemable securities | | | | 58,342 | | | 58,833 | |
| Current income tax payable | | | | 13,936 | | | 2,543 | |
| Other liabilities | | | | 91,082 | | | 84,667 | |
| |
| Total liabilities | | | | 1,826,833 | | | 2,004,661 | |
| |
| Commitments and contingencies (see Note 11) | | | | | | | | |
Stockholders' equity: |
|
|
|
|
|
|
|
|
| Preferred stock, $1 par, 1,000 shares authorized; none issued or outstanding in 2006 and 2005 | | | | | | | | |
| Common stock, $1 par, 100,000 shares authorized in 2006 and 50,000 in 2005; issued 44,722 in 2006 and 44,944 in 2005; outstanding 37,027 in 2006 and 37,249 in 2005 | | | | 44,722 | | | 44,944 | |
| Additional paid-in capital | | | | 459,103 | | | 454,281 | |
| Retained earnings | | | | 590,715 | | | 379,031 | |
| Accumulated other comprehensive income | | | | 12,832 | | | 1,191 | |
| |
| | | | | 1,107,372 | | | 879,447 | |
| Treasury stock, at cost (7,695 shares in 2006 and 2005) | | | | (166,652 | ) | | (166,652 | ) |
| |
| Total stockholders' equity | | | | 940,720 | | | 712,795 | |
| |
| Total liabilities and stockholders' equity | | | $ | 2,767,553 | | $ | 2,717,456 | |
| |
The accompanying notes are an integral part of these financial statements.
56
CONSOLIDATED STATEMENTS OF OPERATIONS
ZENITH NATIONAL INSURANCE CORP. AND SUBSIDIARIES
|
|
| | Year Ended December 31,
|
|---|
(Dollars in thousands, except per share data)
|
| | 2006
| | 2005
| | 2004
|
|---|
|
| Revenues: | | | | | | | | | | |
| Premiums earned | | | $ | 944,217 | | $ | 1,178,700 | | $ | 944,425 |
| Net investment income | | | | 106,294 | | | 79,200 | | | 61,876 |
| Realized gains on investments | | | | 13,377 | | | 22,224 | | | 38,579 |
|
| Total revenues | | | | 1,063,888 | | | 1,280,124 | | | 1,044,880 |
|
| Expenses: | | | | | | | | | | |
| Loss and loss adjustment expenses incurred | | | | 322,784 | | | 703,870 | | | 628,763 |
| Policy acquisition costs | | | | 147,153 | | | 171,135 | | | 117,265 |
| Underwriting and other operating expenses | | | | 136,464 | | | 125,095 | | | 106,513 |
| Policyholders' dividends (see Note 2) | | | | 51,400 | | | 29,010 | | | 5,742 |
| Interest expense | | | | 5,275 | | | 8,757 | | | 13,051 |
| Payment regarding conversion of convertible senior notes (see Note 9) | | | | | | | 4,710 | | | |
|
| Total expenses | | | | 663,076 | | | 1,042,577 | | | 871,334 |
|
| Income from continuing operations before tax and equity in earnings of investee | | | | 400,812 | | | 237,547 | | | 173,546 |
| Income tax expense | | | | 142,112 | | | 81,894 | | | 57,213 |
|
| Income from continuing operations after tax and before equity in earnings of investee | | | | 258,700 | | | 155,653 | | | 116,333 |
| Equity in earnings of investee, net of income tax expense of $428 in 2005 and $743 in 2004 (see Note 4) | | | | | | | 794 | | | 1,381 |
|
| Income from continuing operations after tax | | | | 258,700 | | | 156,447 | | | 117,714 |
|
| Gain on sale of discontinued real estate segment, net of income tax expense of $675 in 2005 and $692 in 2004 (see Note 20) | | | | | | | 1,253 | | | 1,286 |
|
| Net income | | | $ | 258,700 | | $ | 157,700 | | $ | 119,000 |
|
Net income per common share (see Note 14): |
|
|
|
|
|
|
|
|
|
|
| Basic: | | | | | | | | | | |
| Continuing operations | | | $ | 7.00 | | $ | 4.66 | | $ | 4.10 |
| Discontinued operations | | | | | | | 0.04 | | | 0.04 |
|
| Net income | | | $ | 7.00 | | $ | 4.70 | | $ | 4.14 |
|
| Diluted: | | | | | | | | | | |
| Continuing operations | | | $ | 6.96 | | $ | 4.29 | | $ | 3.35 |
| Discontinued operations | | | | | | | 0.03 | | | 0.03 |
|
| Net income | | | $ | 6.96 | | $ | 4.32 | | $ | 3.38 |
|
The accompanying notes are an integral part of these financial statements.
57
CONSOLIDATED STATEMENTS OF CASH FLOWS
ZENITH NATIONAL INSURANCE CORP. AND SUBSIDIARIES
| |
|
| | Year Ended December 31,
| |
|---|
(Dollars in thousands)
|
| | 2006
| | 2005
| | 2004
| |
|---|
| |
| Cash flows from operating activities: | | | | | | | | | | | |
| | Premiums collected | | | $ | 973,416 | | $ | 1,200,424 | | $ | 1,130,188 | |
| | Investment income received | | | | 73,818 | | | 72,066 | | | 62,337 | |
| | Loss and loss adjustment expenses paid | | | | (478,607 | ) | | (455,420 | ) | | (402,432 | ) |
| | Underwriting and other operating expenses paid | | | | (340,399 | ) | | (365,107 | ) | | (362,140 | ) |
| | Interest paid | | | | (5,234 | ) | | (10,101 | ) | | (12,934 | ) |
| | Income taxes paid | | | | (124,004 | ) | | (92,292 | ) | | (69,128 | ) |
| | Cash paid regarding conversion of convertible senior notes (see Note 9) | | | | | | | (4,710 | ) | | | |
| |
| Net cash provided by operating activities | | | | 98,990 | | | 344,860 | | | 345,891 | |
| |
| Cash flows from investing activities: | | | | | | | | | | | |
| | Purchases of investments: | | | | | | | | | | | |
| | | Fixed maturity securities held-to-maturity | | | | (99,760 | ) | | (31,179 | ) | | (45,030 | ) |
| | | Fixed maturity securities available-for-sale | | | | (786,166 | ) | | (1,664,184 | ) | | (965,956 | ) |
| | | Equity securities available-for-sale | | | | (51,364 | ) | | (71,966 | ) | | (69,197 | ) |
| | | Other investments | | | | (2,823 | ) | | (862 | ) | | (10,865 | ) |
| | Proceeds from maturities and redemptions of investments: | | | | | | | | | | | |
| | | Fixed maturity securities held-to-maturity | | | | 20,365 | | | 31,571 | | | 29,357 | |
| | | Fixed maturity securities available-for-sale | | | | 69,289 | | | 53,458 | | | 47,665 | |
| | | Other investments | | | | 5,343 | | | 24,893 | | | 50,897 | |
| | Proceeds from sales of investments: | | | | | | | | | | | |
| | | Fixed maturity securities available-for-sale | | | | 469,474 | | | 1,644,659 | | | 760,370 | |
| | | Equity securities available-for-sale | | | | 59,955 | | | 114,308 | | | 94,571 | |
| | Net decrease (increase) in short-term investments | | | | 265,764 | | | (401,419 | ) | | (205,064 | ) |
| | Net proceeds from sale of discontinued real estate segment | | | | | | | 1,928 | | | 1,978 | |
| | Capital expenditures and other, net | | | | (5,985 | ) | | (12,858 | ) | | (9,747 | ) |
| |
| Net cash used in investing activities | | | | (55,908 | ) | | (311,651 | ) | | (321,021 | ) |
| |
| Cash flows from financing activities: | | | | | | | | | | | |
| | Cash dividends paid to common stockholders | | | | (43,241 | ) | | (29,472 | ) | | (20,849 | ) |
| | Proceeds from exercise of stock options | | | | 227 | | | 4,296 | | | 5,895 | |
| | Purchase of treasury stock | | | | | | | (10,886 | ) | | | |
| | Repurchase of redeemable securities | | | | (500 | ) | | | | | (7,600 | ) |
| | Excess tax benefit on stock-based compensation | | | | 273 | | | | | | | |
| |
| Net cash used in financing activities | | | | (43,241 | ) | | (36,062 | ) | | (22,554 | ) |
| |
| Net (decrease) increase in cash | | | | (159 | ) | | (2,853 | ) | | 2,316 | |
| Cash at beginning of year | | | | 7,469 | | | 10,322 | | | 8,006 | |
| |
| Cash at end of year | | | $ | 7,310 | | $ | 7,469 | | $ | 10,322 | |
| |
The accompanying notes are an integral part of these financial statements.
58
CONSOLIDATED STATEMENTS OF CASH FLOWS (CONTINUED)
ZENITH NATIONAL INSURANCE CORP. AND SUBSIDIARIES
| |
|
| | Year Ended December 31,
| |
|---|
(Dollars in thousands)
|
| | 2006
| | 2005
| | 2004
| |
|---|
| |
| Reconciliation of net income to net cash provided by operating activities: | | | | | | | | | | | |
| Net income | | | $ | 258,700 | | $ | 157,700 | | $ | 119,000 | |
| Adjustments to reconcile net income to net cash provided by operating activities: | | | | | | | | | | | |
| | Gain on sale of discontinued real estate segment | | | | | | | (1,253 | ) | | (1,286 | ) |
| | Depreciation expense | | | | 10,152 | | | 8,887 | | | 7,834 | |
| | Net (accretion) amortization | | | | (28,762 | ) | | (8,028 | ) | | 3,251 | |
| | Realized gains on investments | | | | (13,377 | ) | | (22,224 | ) | | (38,579 | ) |
| | Equity in earnings of investee | | | | | | | (794 | ) | | (1,381 | ) |
| | (Increase) decrease in: | | | | | | | | | | | |
| | | | Accrued investment income | | | | (3,748 | ) | | 1,147 | | | (2,193 | ) |
| | | | Premiums receivable | | | | 31,205 | | | (6,110 | ) | | 10,534 | |
| | | | Receivable from reinsurers for paid and unpaid losses | | | | 23,329 | | | 29,977 | | | (25,445 | ) |
| | | | Deferred policy acquisition costs | | | | 4,057 | | | 1,990 | | | (6,742 | ) |
| | Increase (decrease) in: | | | | | | | | | | | |
| | | | Unpaid losses and loss adjustment expenses | | | | (181,165 | ) | | 221,126 | | | 261,570 | |
| | | | Unearned premiums | | | | (40,481 | ) | | (18,746 | ) | | 30,969 | |
| | | | Policyholders' dividends accrued | | | | 26,496 | | | 24,575 | | | 2,968 | |
| | | | Net income taxes payable | | | | 18,108 | | | (10,398 | ) | | (11,915 | ) |
| | | | Accrued expenses | | | | 4,397 | | | (5,175 | ) | | (5,476 | ) |
| | | | Other | | | | (9,921 | ) | | (27,814 | ) | | 2,782 | |
| |
| Net cash provided by operating activities | | | $ | 98,990 | | $ | 344,860 | | $ | 345,891 | |
| |
The accompanying notes are an integral part of these financial statements.
59
CONSOLIDATED STATEMENTS OF STOCKHOLDERS' EQUITY
ZENITH NATIONAL INSURANCE CORP. AND SUBSIDIARIES
| |
|---|
| | Year Ended December 31,
| |
|---|
(Dollars in thousands, except per share data)
| | 2006
| | 2005
| | 2004
| |
|---|
| |
|---|
| Preferred stock, $1 par: | | | | | | | | | | |
| | Beginning of year | | | none | | | none | | | none | |
| |
| | | End of year | | | none | | | none | | | none | |
| |
| Common stock, $1 par: | | | | | | | | | | |
| | Beginning of year | | $ | 44,944 | | $ | 26,510 | | $ | 25,928 | |
| | Exercise of stock options | | | 11 | | | 985 | | | 462 | |
| | Conversion of convertible senior notes (see Note 9) | | | | | | 5,806 | | | | |
| | 3-for-2 stock split (see Note 1) | | | | | | 11,520 | | | | |
| | Restricted stock awards granted | | | | | | 127 | | | 122 | |
| | Restricted stock awards not yet vested | | | (320 | ) | | | | | | |
| | Restricted stock vested | | | 87 | | | | | | | |
| | Restricted stock awards forfeited | | | | | | (4 | ) | | (2 | ) |
| |
| | | End of year | | $ | 44,722 | | $ | 44,944 | | $ | 26,510 | |
| |
| Additional paid-in capital: | | | | | | | | | | |
| | Beginning of year | | $ | 454,281 | | $ | 314,262 | | $ | 300,448 | |
| | Exercise of stock options | | | 216 | | | 22,186 | | | 10,182 | |
| | Excess tax benefit on stock-based compensation | | | 337 | | | 10,248 | | | 2,778 | |
| | Recognition of stock-based compensation expense | | | 4,269 | | | 2,714 | | | 849 | |
| | Conversion of convertible senior notes (see Note 9) | | | | | | 116,391 | | | 5 | |
| | 3-for-2 stock split (see Note 1) | | | | | | (11,520 | ) | | | |
| |
| | | End of year | | $ | 459,103 | | $ | 454,281 | | $ | 314,262 | |
| |
| Retained earnings: | | | | | | | | | | |
| | Beginning of year | | $ | 379,031 | | $ | 254,682 | | $ | 157,191 | |
| | Net income | | | 258,700 | | | 157,700 | | | 119,000 | |
| | Cash dividends declared to common stockholders | | | (47,016 | ) | | (33,351 | ) | | (21,509 | ) |
| |
| | | End of year | | $ | 590,715 | | $ | 379,031 | | $ | 254,682 | |
| |
| Accumulated other comprehensive income: | | | | | | | | | | |
| | Beginning of year | | $ | 1,191 | | $ | 43,583 | | $ | 31,821 | |
| | Net change in unrealized appreciation on investments, net of deferred tax and reclassification adjustment | | | 11,641 | | | (39,383 | ) | | 11,833 | |
| | Change in foreign currency translation adjustment, net of deferred tax | | | | | | (3,009 | ) | | (71 | ) |
| |
| | | End of year | | $ | 12,832 | | $ | 1,191 | | $ | 43,583 | |
| |
| Treasury stock, at cost: | | | | | | | | | | |
| | Beginning of year | | $ | (166,652 | ) | $ | (136,890 | ) | $ | (132,142 | ) |
| | Acquisition of treasury stock | | | | | | (29,762 | ) | | (4,748 | ) |
| |
| | | End of year | | $ | (166,652 | ) | $ | (166,652 | ) | $ | (136,890 | ) |
| |
| | | | Total stockholders' equity | | $ | 940,720 | | $ | 712,795 | | $ | 502,147 | |
| |
| Cash dividends declared per common share | | $ | 1.26 | | $ | 0.94 | | $ | 0.75 | |
| |
| Stockholders' equity per outstanding common share | | $ | 25.41 | | $ | 19.14 | | $ | 17.28 | |
| |
CONSOLIDATED STATEMENTS OF COMPREHENSIVE INCOME
ZENITH NATIONAL INSURANCE CORP. AND SUBSIDIARIES
| |
|---|
| | Year Ended December 31,
| |
|---|
(Dollars in thousands)
| | 2006
| | 2005
| | 2004
| |
|---|
| |
|---|
| Net income | | $ | 258,700 | | $ | 157,700 | | $ | 119,000 | |
| Other comprehensive (loss) income, net of tax: | | | | | | | | | | |
| | Net change in unrealized appreciation (depreciation) on investments | | | 11,641 | | | (39,383 | ) | | 11,833 | |
| | Net change in foreign currency translation adjustment | | | | | | (3,009 | ) | | (71 | ) |
| |
| | Comprehensive income | | $ | 270,341 | | $ | 115,308 | | $ | 130,762 | |
| |
The accompanying notes are an integral part of these financial statements.
60
NOTES TO CONSOLIDATED FINANCIAL STATEMENTS
ZENITH NATIONAL INSURANCE CORP. AND SUBSIDIARIES
NOTE 1
BASIS OF PRESENTATION AND
SUMMARY OF OPERATIONS
Basis of presentation. The accompanying consolidated financial statements have been prepared in accordance with accounting principles generally accepted in the United States of America ("GAAP") and include Zenith National Insurance Corp. ("Zenith National") and its subsidiaries (collectively, "Zenith"). All intercompany transactions and balances have been eliminated in consolidation.
Organization and operations. Zenith National is engaged through its wholly-owned subsidiaries (primarily Zenith Insurance Company ("Zenith Insurance")) in the workers' compensation insurance business, nationally, and the assumed reinsurance business. In September 2005, we exited the assumed reinsurance business and ceased writing and renewing assumed reinsurance contracts. We received earned premiums and were subject to continuing exposure to losses until our in-force assumed reinsurance contracts expired during 2006. We will be paying our assumed reinsurance claims for several years and the results of the reinsurance segment, principally consisting of any changes to loss reserve estimates and resulting adjustments to contractual premium, will continue to be included in the results of continuing operations. In addition to the workers' compensation insurance and assumed reinsurance segments, our other business segments include investments and parent (see Note 16). Our home-building business and related real estate assets were sold in 2002. The results of the discontinued real estate segment are presented as discontinued operations (see Note 20). Results of operations of our investment in Advent Capital (Holdings) PLC ("Advent Capital") are presented as equity in earnings of investee through the second quarter of 2005 (see Note 4).
Use of Estimates. GAAP requires the use of assumptions and estimates in reporting certain assets and liabilities and related disclosures. Actual results could differ from those estimates.
3-for-2 Stock Split. On September 7, 2005, Zenith National's Board of Directors declared a 3-for-2 stock split which was paid in the form of a 50% stock dividend. The additional shares of Zenith National's common stock were distributed on October 11, 2005 to shareholders of record as of September 19, 2005. The 3-for-2 stock split was recorded in the third quarter of 2005 as an increase to common stock and a decrease to additional paid-in capital. Dividends, earnings per share amounts and common stock shares and prices in the current and prior periods reflect the 3-for-2 stock split.
NOTE 2
SUMMARY OF ACCOUNTING POLICIES
INVESTMENTS
Our investments in debt and equity securities are classified into the following three categories: (1) held-to-maturity—those securities which by their terms must be redeemed by the issuing company and that we have the positive intent and ability to hold to maturity are reported at amortized cost; (2) trading—those securities that are held principally for the purpose of selling in the near term are reported at fair value with unrealized gains and losses included in earnings; and (3) available-for-sale—those securities not classified as either held-to-maturity or trading are reported at fair value with unrealized gains and losses excluded from earnings and reported in a separate component of stockholders' equity, net of deferred tax. There were no investments classified as trading at December 31, 2006 or 2005. The majority of held-to-maturity investments are mortgage-backed securities
61
issued by the Government National Mortgage Association ("GNMA") and we receive periodic returns of principal on these securities in addition to interest income.
Short-term investments include debt securities such as corporate, municipal and U.S. Treasury securities with maturities of less than one year at the date of purchase. For these short-term investments, the cost or amortized cost is a reasonable estimate of fair value.
Other investments are comprised of investments in limited partnerships. If our share of a partnership's capital is greater than 5%, we account for the investment on the equity method, and the carrying value of our investment is adjusted to reflect our share of the underlying equity of the partnership. If our share of the partnership capital is no more than 5%, we account for the investment at cost, which is also a reasonable estimate of fair value.
The investment in Advent Capital was accounted for under the equity method through the second quarter of 2005 (see Note 4).
When, in the opinion of management, a decline in the fair value of an investment below its cost or amortized cost is considered to be "other-than-temporary," such investment is written-down to its fair value and the amount written-down is recorded in earnings as a realized loss on investments. The determination of other-than-temporary includes, in addition to other relevant factors, a presumption that if the market value is below cost by a significant amount for a period of time, a write-down is necessary. The amount of any write-downs are determined by the difference between cost or amortized cost of the investment and its fair value at the time the other-than-temporary decline was identified. There were no such write-downs in 2006. During the years ended December 31, 2005 and 2004, there were $9.5 million and $0.1 million, respectively, of such write-downs.
Investment income is recorded when earned. Realized capital gains and losses are calculated based on the cost of securities sold which is determined by the "identified cost" method.
CASH
Cash includes currency on hand and demand deposits with financial institutions.
RECOGNITION OF PROPERTY-CASUALTY REVENUE AND EXPENSE
Revenue Recognition. The consideration paid for an insurance policy or reinsurance contract is generally known as a "premium." Premiums billed to and paid by our policyholders and reinsured companies are the revenues attributable to our workers' compensation and reinsurance segments. Premiums are billed and collected according to policy terms, predominantly in the form of installments during the policy period. Premiums are earned pro-rata over the terms of the policies. Billed premiums applicable to the unexpired terms of policies in-force are recorded in the accompanying consolidated balance sheets as a liability for unearned premiums.
Workers' Compensation Premiums. Workers' compensation premiums are determined based upon the payroll of the insured, the applicable premium rates and, where applicable, an experience-based modification factor. An audit of the policyholders' records is conducted after policy expiration to make a final determination of applicable premiums. Included with premiums earned is an estimate for earned but unbilled final audit premiums. We can estimate earned but unbilled premiums because we keep track, by policy, of how much additional premium is billed in final audit invoices as a percentage of the original estimated amount that was billed. We use the historical percentage to estimate the probable additional amount that we have
62
earned but not yet billed as of the balance sheet date. Estimated earned but not billed premiums included in premiums receivable were $9.1 million and $11.0 million at December 31, 2006 and 2005, respectively.
Any amounts receivable for billed premiums are charged-off if they are submitted to our in-house legal collections department. An estimate of amounts that are likely to be charged-off is established as an allowance for doubtful accounts as of the balance sheet date. The estimate is comprised of any specific accounts that are past due and are considered probable to be charged-off and a provision against remaining accounts receivable based on historical charge-off data. Premium receivables are reported net of an allowance for estimated uncollectible premium amounts which were $0 and $77,000 at December 31, 2006 and 2005, respectively.
We have written a relatively small number of workers' compensation policies that are retrospectively-rated. Under this type of policy, subsequent to policy expiration, the policyholder may be entitled to a refund or may owe additional premium based on the amount of losses sustained under the policy. These retrospective premium adjustments are limited in the amount by which they increase or decrease the standard amount of premium applicable to the policy. We can estimate these retrospective premium adjustments because we know the underlying loss experience of the policies involved. The estimated liability for return of premiums under retrospectively-rated workers' compensation policies included in unearned premiums was $8.6 million and $8.9 million at December 31, 2006 and 2005, respectively.
Assumed Reinsurance Premiums. Reinsurance contracts covering catastrophe losses are customarily written to provide reinsurance for losses associated with one catastrophic event with a provision to reinstate the contract for the unexpired term of the original contract. An additional premium, called a reinstatement premium, is due in consideration of the reinstatement. If a catastrophe loss is reported and we accrue an estimate for loss, any unearned premium associated with the contract at that time becomes fully earned. The reinstatement premium is then earned over the remaining term of the contract. Additional premiums earned attributable to reinstatement premiums for catastrophe reinsurance contracts were $0, $20.7 million and $3.5 million in 2006, 2005 and 2004, respectively.
Loss and Loss Adjustment Expenses Incurred. Loss and loss adjustment expenses incurred in the accompanying consolidated statements of operations include provisions for the amount we expect to ultimately pay for all reported and unreported claims for the applicable periods. Loss adjustment expenses are the expenses applicable to the process of administering, settling and investigating claims, including legal expenses.
Estimates of losses from environmental and asbestos-related claims are included in overall loss reserves and to date have not been material.
Unpaid Losses and Loss Adjustment Expenses. The liabilities for unpaid losses and loss adjustment expenses in the accompanying consolidated balance sheets ("loss reserves") are estimates of the unpaid amounts that we expect to pay for the ultimate cost of reported and unreported claims as of the balance sheet date. Loss reserves are estimates and are inherently uncertain; they do not and cannot represent an exact measure of ultimate liability. We perform a comprehensive review of our loss reserves at the end of every quarter and, in conjunction with actuarial techniques and methods, we employ judgment to establish the most reasonably accurate estimate of loss reserves based on the most recent, relevant data. Any resulting adjustments to loss reserves are reflected in our
63
Consolidated Statements of Operations in the period the changes are made.
When losses are reported to us, we establish, individually, estimates of the ultimate cost of the claims, known as "case reserves." These case reserves are continually monitored and revised in response to new information and for amounts paid. Our actuaries use this information about reported claims in some of their estimation techniques. In estimating our total loss reserves, we make provision for two types of loss development. At the end of any calendar period, there are a number of claims that have not yet been reported but will arise out of accidents that have already occurred. These are referred to in the insurance industry as incurred but not reported ("IBNR") claims. In addition to this provision for late reported claims, we also have to estimate the extent to which the case reserves on known claims may also develop. These types of reserves are referred to in the insurance industry as "bulk" reserves. Our loss reserves make provision for both IBNR and bulk reserves in total, but not separately.
The principal uncertainty in our workers' compensation loss reserve estimates at this time is caused by the trend of increasing severity (inflation) in the years prior to 2002 compared to the deflation trend in more recent years. Severity is the average cost of a claim as measured by the total cost of claims for a year divided by the number of claims in that year. The annual rate of claim cost inflation (deflation) is the year over year percentage change in claim severity. Inflation or deflation is attributable to factors which include changes in health care costs, legislative reforms to the workers' compensation system and the number of expensive claims relative to the total number of claims in a year. We have observed deflationary trends in the amounts we have paid for claims in recent accident years compared to increasing inflation for claim payments for 2001 and prior, but there is uncertainty as to whether the recent deflationary data will be sustained over the long term. We believe our loss reserve estimates are adequate. However, the actual ultimate inflation (or deflation) rate will not be known with any certainty for several years. We assume that general healthcare inflation trends will continue and will impact our long term claim costs and loss reserves. The extent to which this may be offset by benefits from the reform legislation and recently observed reduction in the number of California expensive claims is uncertain. We will evaluate our best estimate of inflation rates and reserves every quarter to reflect the most current data.
Catastrophes. Insurance and reinsurance coverages expose Zenith to the risk of significant loss in the event of major loss events, known in the insurance industry as catastrophes. Catastrophes may cause significant contemporaneous financial statement losses since catastrophe losses may not be accrued in advance of the event.
Estimates of the impact of the 2005 and 2004 hurricanes and other catastrophes are based on the information that is currently available. Such estimates could change based on any new information that becomes available or based upon reinterpretation of existing information.
Deferred Policy Acquisition Costs. Policy acquisition costs, consisting of commissions, premium taxes and certain other underwriting costs that vary with, and are primarily related to, the production of new or renewal business are deferred and amortized as the related premiums are earned.
A premium deficiency is recognized if the sum of expected claims costs, claims adjustment expenses, expected dividends to policyholders, unamortized acquisition costs and policy maintenance costs exceed the related unearned premiums. A premium deficiency would first be
64
recognized by charging any unamortized acquisition costs to expense to the extent required to eliminate the deficiency. If the premium deficiency were greater than unamortized acquisition costs, a liability would be accrued for the excess deficiency. We do not consider anticipated investment income when determining if a premium deficiency exists. Our estimates indicate that there was no premium deficiency at December 31, 2006 and 2005.
Policyholders' Dividends. Most of our workers' compensation policies are non-participating but we issue certain policies for which the policyholder may participate in favorable claims experience through a dividend. An estimated provision for workers' compensation policyholders' dividends is accrued as the related premiums are earned. Such dividends do not become a fixed liability unless and until declared by the respective Boards of Directors of our insurance subsidiaries. The dividend to which a policyholder may be entitled is set forth in the policy and is related to the amount of losses sustained under the policy. Dividends are calculated after policy expiration (usually at 6 months and at 18 months after such expiration). We are able to estimate any liability we may have because we know the underlying loss experience of the policies we have written with dividend provisions and can estimate future dividend payments from the policy terms.
In addition, Florida statutes require payment of additional policyholders' dividends to Florida policyholders pursuant to a formula based on underwriting results. As of December 31, 2006 and 2005, we accrued $34.1 million and $16.0 million, respectively, for Florida dividends payable for prior accident years. The 2005 amount was paid in 2006.
State Guarantee Fund Assessments. State guarantee funds ("Guarantee Funds") exist to ensure that policyholders (holders of direct insurance policies but not of reinsurance policies) receive payment of their claims if insurance companies become insolvent. The Guarantee Funds are funded primarily by statutorily prescribed assessments they bill to other insurance companies doing business in their states. Various mechanisms exist in some of these states for assessed insurance companies to recover these assessments. Upon the insolvency of an insurance company, the Guarantee Funds become primarily liable for the payment of the insolvent company's liabilities to policyholders. The declaration of an insolvency establishes the presumption that assessments by the Guarantee Funds are probable. We write workers' compensation insurance in many states in which unpaid workers' compensation liabilities are the responsibility of the Guarantee Funds and have received, and expect to continue to receive, Guarantee Fund assessments, some of which may be based on certain of the premiums we have already earned at December 31, 2006.
We recorded an estimate of $7.7 million (net of expected recoveries of $1.9 million recoverable before the end of 2007) for our expected liability at December 31, 2006 for Guarantee Fund assessments. Recoveries are attributable to premium tax credits in various states. The amount of the recovery we have recorded is limited to credits applicable to, and recoverable from, premiums earned at December 31, 2006. The estimated expense for Guarantee Fund assessments was $2.0 million, $5.4 million and $5.4 million in 2006, 2005 and 2004, respectively. We expect that we will continue to accrue and receive Guarantee Fund assessments; and the ultimate impact of such assessments will depend upon the amount and timing of the assessments and of any recoveries to which we are entitled.
65
REINSURANCE CEDED
In the ordinary course of business and in accordance with general insurance industry practices, we purchase excess of loss reinsurance to protect us against the impact of large, irregularly-occurring losses in the workers' compensation segment. Such reinsurance reduces the magnitude of such losses on net income and the capital of Zenith Insurance. Reinsurance makes the assuming reinsurer liable to the ceding company to the extent of the reinsurance. It does not, however, discharge the ceding company from its primary liability to its policyholders in the event the reinsurer is unable to meet its obligations under such reinsurance agreement. We monitor the financial condition of our reinsurers and do not believe that we are currently exposed to any material credit risk through our ceded reinsurance arrangements because most of our reinsurance is recoverable from large, well-capitalized reinsurance companies. Historically, no material amounts due from reinsurers have been written-off as uncollectible other than a total write-off of $6.0 million in connection with Reliance Insurance Company for a reinsurance recoverable we acquired in a 1996 acquisition.
Premiums earned and loss and loss adjustment expenses incurred are stated in the accompanying Consolidated Statements of Operations after deduction of amounts ceded to reinsurers. Balances due from reinsurers on unpaid losses, including an estimate of such recoverables related to reserves for IBNR losses, are reported as assets and are included in receivable from reinsurers even though amounts due on unpaid loss and loss adjustment expenses are not recoverable from the reinsurer until such losses are paid. Receivable from reinsurers on unpaid losses and loss adjustment expenses amounted to $225.8 million and $243.3 million at December 31, 2006 and 2005, respectively.
In 1998, Zenith Insurance acquired substantially all of the assets and certain liabilities of RISCORP, Inc. and certain of its subsidiaries (collectively "RISCORP") related to RISCORP's workers' compensation business. Also, in 1998, Zenith entered into an aggregate excess of loss reinsurance agreement which provides ceded reinsurance for unpaid losses assumed by Zenith Insurance from RISCORP up to $50.0 million in excess of $182.0 million. Receivable from reinsurers on unpaid losses and loss adjustment expenses at December 31, 2006 and 2005 includes $10.5 million and $10.7 million, respectively, recoverable under such reinsurance and is secured by assets held in a trust account. The deferred benefit associated with such reinsurance was $2.9 million and $3.4 million at December 31, 2006 and 2005, respectively.
PROPERTIES AND EQUIPMENT
Properties and equipment are stated at cost less accumulated depreciation. Depreciation is calculated on a straight-line basis using the following useful lives: buildings—10 to 40 years; and furniture, fixtures and equipment—3 to 10 years. Expenditures for maintenance and repairs are charged to operations as incurred. Additions and improvements to buildings and other fixed assets are capitalized and depreciated over the useful lives of the properties and equipment. Upon disposition, the asset cost and related depreciation are removed from the accounts and the resulting gain or loss is included in income.
INTANGIBLE ASSETS
Goodwill from acquisitions was $21.0 million at December 31, 2006 and 2005 net of accumulated amortization of $3.6 million and is included in assets of the workers' compensation segment. We evaluated this goodwill at December 31, 2006 and 2005 and determined that such goodwill was not
66
impaired. Other than goodwill, we had no intangible assets at December 31, 2006 or 2005.
RESTRICTED STOCK AND STOCK OPTIONS
Restricted Stock. Under a restricted stock plan approved by our stockholders in May 2004, as amended in May 2005 ("Restricted Stock Plan"), non-employee Directors and key employees are awarded shares of Zenith National's common stock with restricted ownership rights. Of the shares of stock granted to employees, 50% vest two years after the grant date and the remaining 50% of the shares vest four years after the grant date. Shares granted to non-employee Directors vest in equal amounts of one-third of the amount granted over three years. The fair value of restricted stock awards is measured using the closing price of Zenith National's common stock on the grant date and is recognized as an expense over the vesting period of the awards.
Stock options. Under an employee non-qualified stock option plan adopted by the Board of Directors and stockholders of Zenith National in 1996 ("Stock Option Plan"), options were granted to certain officers and key employees for the purchase of Zenith National's common stock at 100% of the market price at the date of grant. No options have been granted since 2002 and the Stock Option Plan expired according to its terms in May 2006. All options outstanding were exercisable at December 31, 2006 and all of these options will expire during the second quarter of 2007 if not exercised.
Effective January 1, 2006, we adopted Statement of Financial Accounting Standards ("SFAS") No. 123(R),Share-Based Payment ("SFAS No. 123R"), using the modified prospective application transition method. SFAS No. 123R revised SFAS No. 123,Accounting for Stock-Based Compensation ("SFAS No. 123"). We previously adopted the fair value based method of recording stock options consistent with SFAS No. 123 and accounted for the change in accounting principle using the prospective method in accordance with SFAS No. 148,Accounting for Stock-Based Compensation—Transition and Disclosure. Under the prospective method, all employee stock options granted since January 2002 are expensed over the stock option vesting period based on the fair value at the date the options were granted. Because the fair value recognition provisions of SFAS No. 123 and SFAS No. 123R were materially consistent under our stock-based compensation plans, the adoption of SFAS No. 123R did not have a material impact on our consolidated statements of financial condition, results of operations, or cash flows.
SFAS No. 123R requires us to estimate forfeitures in calculating the expense relating to stock-based compensation as opposed to recognizing these forfeitures and the corresponding reduction in expense as they occur. In addition, SFAS No. 123R requires the Company to reflect the tax savings resulting from tax deductions in excess of compensation expense reflected in our financial statements ("excess tax benefits") as a cash inflow from financing activities in our statement of cash flows rather than as an operating cash flow as in prior periods.
RECLASSIFICATIONS
Certain prior year amounts in the Consolidated Financial Statements have been reclassified to conform to the current year presentation.
FOREIGN CURRENCY TRANSLATION
Translation gains or losses, net of applicable tax, associated with foreign currency investments accounted for under the equity method were credited or charged directly to a separate component of other comprehensive income.
67
The fair value of any foreign investments in our investment portfolio includes a component to reflect the fair value in United States dollars.
RECENTLY ISSUED ACCOUNTING PRONOUNCEMENTS
In September 2005, the American Institute of Certified Public Accountants ("AICPA") released Statement of Position 05-1, "Accounting by Insurance Enterprises for Deferred Acquisition Costs in Connection With Modifications or Exchanges of Insurance Contracts" ("SOP 05-1"). SOP 05-1 requires identification of transactions that result in a substantial change in an insurance contract. If it is determined that a substantial change to an insurance contract has occurred, the related unamortized deferred policy acquisition costs, unearned premiums and other related balances must be written off. The Company will adopt SOP 05-1 on January 1, 2007. We expect that SOP 05-1 will not have a material effect on our consolidated financial condition or results of operations.
In February 2006, the Financial Accounting Standards Board ("FASB") issued statement No. 155, "Accounting for Certain Hybrid Financial Instruments" ("SFAS No. 155"). Under current generally accepted accounting principles an entity that holds a financial instrument with an embedded derivative must bifurcate the financial instrument, resulting in the host and the embedded derivative being accounted for separately. SFAS No. 155 permits, but does not require, entities to account for financial instruments with an embedded derivative at fair value thus negating the need to bifurcate the instrument between its host and the embedded derivative. We will adopt SFAS No. 155 on January 1, 2007, and we expect it will not have a material effect on our consolidated financial condition or results of operations.
In July 2006, the FASB issued FASB Interpretation No. 48, "Accounting for Uncertainty in Income Taxes—an interpretation of FASB Statement No. 109" ("FIN 48"), which provides criteria for the recognition, measurement, presentation and disclosure of uncertain tax positions. A tax benefit from an uncertain position may be recognized only if it is "more likely than not" that the position is sustainable based on its technical merits. We will adopt FIN 48 on January 1, 2007 and we expect that it will not have a material effect on our consolidated financial condition or results of operations.
In September 2006, the FASB issued Statement No. 157, "Fair Value Measurements" ("SFAS No. 157"), which provides a common definition of fair value and establishes a framework to make the measurement of fair value more consistent and comparable. SFAS No. 157 also requires expanded disclosures about (1) the extent to which companies measure assets and liabilities at fair value, (2) the methods and assumptions used to measure fair value and (3) the effect of fair value measures on earnings. We will adopt SFAS No. 157 on January 1, 2008 and we expect that it will not have a material effect on our consolidated financial condition or results of operations.
In September 2006, the FASB issued Statement No. 158, "Employers' Accounting for Defined Benefit Pension and Other Postretirement Plans—an amendment of FASB Statements No. 87, 88, 106 and 132(R)" ("SFAS No. 158"). The requirements of SFAS No. 158 are effective for fiscal years ending after June 15, 2007. Since the Company does not sponsor any defined benefit pension or other postretirement plans, SFAS No. 158 will not have any effect on our consolidated financial condition or results of operations.
In September 2006, the Securities and Exchange Commission issued Staff Accounting Bulletin No. 108, "Considering the Effects of Prior Year Misstatements when Quantifying
68
Misstatements in Current Year Financial Statements" ("SAB 108"). SAB 108 provides interpretive guidance on how the effects of prior-year uncorrected misstatements should be considered when quantifying misstatements in the current year financial statements. SAB 108 requires registrants to quantify misstatements using both an income statement and balance sheet approach and evaluate whether either approach results in a misstatement that, when all relevant quantitative and qualitative factors are considered, is material. The adoption of SAB 108 as of December 31, 2006 did not have a material effect on our consolidated financial condition or results of operations.
NOTE 3
INVESTMENTS
The amortized cost, fair value and carrying value of investments were as follows:
|
|---|
| |
| | Gross Unrealized
| |
| |
|
|---|
December 31, 2006
(Dollars in thousands)
| | Cost or Amortized
Cost
| | Fair
Value
| | Carrying
Value
|
|---|
| | Gains
| | (Losses)
|
|---|
|
|---|
| Held-to-maturity: | | | | | | | | | | | | | | | |
| | Corporate debt | | $ | 11,522 | | $ | 210 | | | | | $ | 11,732 | | $ | 11,522 |
| | Mortgage-backed securities | | | 176,713 | | | 759 | | $ | (687 | ) | | 176,785 | | | 176,713 |
| | State and local government debt | | | 23,311 | | | | | | (801 | ) | | 22,510 | | | 23,311 |
| | Foreign government debt | | | 5,000 | | | | | | (125 | ) | | 4,875 | | | 5,000 |
|
| Total held-to-maturity | | $ | 216,546 | | $ | 969 | | $ | (1,613 | ) | $ | 215,902 | | $ | 216,546 |
|
| Available-for-sale: | | | | | | | | | | | | | | | |
| | U.S. government debt | | $ | 90,564 | | | | | $ | (255 | ) | $ | 90,309 | | $ | 90,309 |
| | State and local government debt | | | 110,576 | | $ | 354 | | | (1,026 | ) | | 109,904 | | | 109,904 |
| | Corporate debt | | | 1,033,123 | | | 5,938 | | | (15,253 | ) | | 1,023,808 | | | 1,023,808 |
| | Mortgage-backed securities | | | 19,139 | | | 122 | | | (4 | ) | | 19,257 | | | 19,257 |
| | Redeemable preferred stocks | | | 27,347 | | | 634 | | | (72 | ) | | 27,909 | | | 27,909 |
| | Equity securities | | | 69,014 | | | 29,318 | | | (14 | ) | | 98,318 | | | 98,318 |
| | Short-term investments | | | 679,989 | | | | | | | | | 679,989 | | | 679,989 |
|
| Total available-for-sale | | $ | 2,029,752 | | $ | 36,366 | | $ | (16,624 | ) | $ | 2,049,494 | | $ | 2,049,494 |
|
|
|---|
|
| | Gross Unrealized
| |
| |
|
|---|
December 31, 2005
(Dollars in thousands)
|
Cost or Amortized
Cost
|
|
Fair
Value
|
|
Carrying
Value
|
|---|
| | Gains
| | (Losses)
|
|---|
|
|---|
| Held-to-maturity: | | | | | | | | | | | | | | |
| | Corporate debt | $ | 11,575 | | | | | $ | (12 | ) | $ | 11,563 | | $ | 11,575 |
| | Mortgage-backed securities | | 97,315 | | $ | 994 | | | (177 | ) | | 98,132 | | | 97,315 |
| | State and local government debt | | 23,645 | | | | | | (994 | ) | | 22,651 | | | 23,645 |
| | Foreign government debt | | 5,000 | | | | | | (109 | ) | | 4,891 | | | 5,000 |
|
| Total held-to-maturity | $ | 137,535 | | $ | 994 | | $ | (1,292 | ) | $ | 137,237 | | $ | 137,535 |
|
| Available-for-sale: | | | | | | | | | | | | | | |
| | U.S. government debt | $ | 168,645 | | | | | $ | (1,364 | ) | $ | 167,281 | | $ | 167,281 |
| | State and local government debt | | 102,281 | | $ | 294 | | | (1,225 | ) | | 101,350 | | | 101,350 |
| | Corporate debt | | 732,958 | | | 5,900 | | | (9,085 | ) | | 729,773 | | | 729,773 |
| | Mortgage-backed securities | | 18,769 | | | 808 | | | | | | 19,577 | | | 19,577 |
| | Redeemable preferred stocks | | 25,436 | | | 1,426 | | | (177 | ) | | 26,685 | | | 26,685 |
| | Equity securities | | 68,048 | | | 11,299 | | | (6,043 | ) | | 73,304 | | | 73,304 |
| | Short-term investments | | 904,093 | | | | | | | | | 904,093 | | | 904,093 |
|
| Total available-for-sale | $ | 2,020,230 | | $ | 19,727 | | $ | (17,894 | ) | $ | 2,022,063 | | $ | 2,022,063 |
|
Fixed maturity securities, including short-term investments, by contractual maturity were as follows at December 31, 2006:
|
|---|
(Dollars in thousands)
| | Amortized Cost
| | Fair Value
|
|---|
|
|---|
| Held-to-maturity: | | | | | | |
| | Due after 1 year through 5 years | | $ | 100,355 | | $ | 100,589 |
| | Due after 5 years through 10 years | | | 104,669 | | | 103,581 |
| | Due after 10 years | | | 11,522 | | | 11,732 |
|
| Total held-to-maturity | | $ | 216,546 | | $ | 215,902 |
|
| Available-for-sale: | | | | | | |
| | Due in 1 year or less | | | 796,528 | | | 795,893 |
| | Due after 1 year through 5 years | | | 423,503 | | | 423,030 |
| | Due after 5 years through 10 years | | | 714,925 | | | 705,787 |
| | Due after 10 years | | | 25,782 | | | 26,466 |
|
| Total available-for-sale | | $ | 1,960,738 | | $ | 1,951,176 |
|
Mortgage-backed securities are shown as being due at their average expected maturity dates. Expected maturities may differ from contractual maturities because borrowers may have the right to call or prepay obligations with or without call or prepayment penalties.
69
Fixed maturity securities classified as held-to-maturity with unrealized losses were as follows:
|
|---|
December 31, 2006
(Dollars in thousands)
| | Fair Value
| | Unrealized
Losses
| | Number of
Issues
|
|---|
|
|---|
| Less than 12 months: | | | | | | | | |
| | Mortgage-backed securities | | $ | 90,322 | | $ | (357 | ) | 16 |
|
| Total less than 12 months | | | 90,322 | | | (357 | ) | 16 |
|
| Greater than 12 months: | | | | | | | | |
| | State and local government debt | | | 22,510 | | | (801 | ) | 7 |
| | Mortgage-backed securities | | | 15,721 | | | (330 | ) | 4 |
| | Foreign government debt | | | 4,875 | | | (125 | ) | 1 |
|
| Total greater than 12 months | | | 43,106 | | | (1,256 | ) | 12 |
|
| Total held-to-maturity: | | | | | | | | |
| | State and local government debt | | | 22,510 | | | (801 | ) | 7 |
| | Mortgage-backed securities | | | 106,043 | | | (687 | ) | 20 |
| | Foreign government debt | | | 4,875 | | | (125 | ) | 1 |
|
| Total held-to-maturity | | $ | 133,428 | | $ | (1,613 | ) | 28 |
|
|
|---|
December 31, 2005
(Dollars in thousands)
| | Fair Value
| | Unrealized
Losses
| | Number of
Issues
|
|---|
|
|---|
| Less than 12 months: | | | | | | | | |
| | State and local government debt | | $ | 16,192 | | $ | (665 | ) | 5 |
| | Mortgage-backed securities | | | 23,696 | | | (177 | ) | 6 |
| | Foreign government debt | | | 4,891 | | | (109 | ) | 1 |
| | Corporate debt | | | 11,563 | | | (12 | ) | 1 |
|
| Total less than 12 months | | | 56,342 | | | (963 | ) | 13 |
|
| Greater than 12 months: | | | | | | | | |
| | State and local government debt | | | 6,459 | | | (329 | ) | 2 |
|
| Total greater than 12 months | | | 6,459 | | | (329 | ) | 2 |
|
| Total held-to-maturity: | | | | | | | | |
| | State and local government debt | | | 22,651 | | | (994 | ) | 7 |
| | Mortgage-backed securities | | | 23,696 | | | (177 | ) | 6 |
| | Foreign government debt | | | 4,891 | | | (109 | ) | 1 |
| | Corporate debt | | | 11,563 | | | (12 | ) | 1 |
|
| Total held-to-maturity | | $ | 62,801 | | $ | (1,292 | ) | 15 |
|
Securities classified as available-for-sale with unrealized losses were as follows:
|
|---|
December 31, 2006
(Dollars in thousands)
| | Fair Value
| | Unrealized
Losses
| | Number of
Issues
|
|---|
|
|---|
| Less than 12 months: | | | | | | | | |
| | Corporate debt | | $ | 268,094 | | $ | (3,949 | ) | 59 |
| | State and local government debt | | | 15,927 | | | (118 | ) | 7 |
| | U.S. government debt | | | 74,916 | | | (162 | ) | 2 |
| | Equity securities | | | 3,463 | | | (14 | ) | 3 |
| | Redeemable preferred stocks | | | 400 | | | (1 | ) | 1 |
| | Mortgage-backed securities | | | 4,929 | | | (4 | ) | 1 |
|
| Total less than 12 months | | | 367,729 | | | (4,248 | ) | 73 |
|
| Greater than 12 months: | | | | | | | | |
| | Corporate debt | | | 423,533 | | | (11,304 | ) | 68 |
| | State and local government debt | | | 54,077 | | | (908 | ) | 17 |
| | U.S. government debt | | | 15,393 | | | (93 | ) | 3 |
| | Redeemable preferred stocks | | | 1,182 | | | (71 | ) | 1 |
|
| Total greater than 12 months | | | 494,185 | | | (12,376 | ) | 89 |
|
| Total available-for-sale: | | | | | | | | |
| | Corporate debt | | | 691,627 | | | (15,253 | ) | 127 |
| | State and local government debt | | | 70,004 | | | (1,026 | ) | 24 |
| | U.S. government debt | | | 90,309 | | | (255 | ) | 5 |
| | Equity securities | | | 3,463 | | | (14 | ) | 3 |
| | Redeemable preferred stocks | | | 1,582 | | | (72 | ) | 2 |
| | Mortgage-backed securities | | | 4,929 | | | (4 | ) | 1 |
|
| Total available-for-sale | | $ | 861,914 | | $ | (16,624 | ) | 162 |
|
|
|---|
December 31, 2005
(Dollars in thousands)
| | Fair Value
| | Unrealized
Losses
| | Number of
Issues
|
|---|
|
|---|
| Less than 12 months: | | | | | | | | |
| | Corporate debt | | $ | 428,164 | | $ | (8,546 | ) | 89 |
| | State and local government debt | | | 61,187 | | | (1,225 | ) | 19 |
| | U.S. government debt | | | 167,281 | | | (1,364 | ) | 8 |
| | Equity securities | | | 46,998 | | | (6,043 | ) | 11 |
| | Redeemable preferred stocks | | | 3,170 | | | (177 | ) | 3 |
|
| Total less than 12 months | | | 706,800 | | | (17,355 | ) | 130 |
|
| Greater than 12 months: | | | | | | | | |
| | Corporate debt | | | 17,357 | | | (539 | ) | 5 |
|
| Total greater than 12 months | | | 17,357 | | | (539 | ) | 5 |
|
| Total available-for-sale: | | | | | | | | |
| | Corporate debt | | | 445,521 | | | (9,085 | ) | 94 |
| | State and local government debt | | | 61,187 | | | (1,225 | ) | 19 |
| | U.S. government debt | | | 167,281 | | | (1,364 | ) | 8 |
| | Equity securities | | | 46,998 | | | (6,043 | ) | 11 |
| | Redeemable preferred stocks | | | 3,170 | | | (177 | ) | 3 |
|
| Total available-for-sale | | $ | 724,157 | | $ | (17,894 | ) | 135 |
|
Unrealized losses on fixed maturity securities at December 31, 2006 are principally attributable to increases in short-term interest rates in 2005 and 2006. We continuously assess
70
the prospects for individual securities as part of ongoing portfolio management, including the identification of other-than-temporary declines in fair values. This process includes reviewing the amount and length of time of unrealized losses on investments, historical and projected company financial performance, company-specific news and other developments, the outlook for industry sectors, credit ratings and macro-economic changes, including government policy initiatives. We believe that we have appropriately identified other-than-temporary declines in fair value in the three years ended December 31, 2006 and that our remaining unrealized losses at December 31, 2006 are not other-than-temporary. We base this conclusion on our current understanding of the issuers of these securities, as described above, and because we have also established a presumption that an unrealized loss of a significant amount for a specific period of time is other-than-temporary. We have consistently applied this presumption for fifteen years. We also have the ability and intent to hold securities with unrealized losses for a sufficient amount of time for them to recover their values or reach maturity.
At December 31, 2006 and 2005, 90% and 93%, respectively, of the investments in fixed maturity securities and short-term investments were classified as available-for-sale. The change in fair value of fixed maturity investments classified as available-for-sale resulted in a decrease in stockholders' equity of $4.0 million after deferred tax from December 31, 2005 to December 31, 2006 and a decrease of $14.8 million from December 31, 2004 to December 31, 2005. Fluctuating interest rates will impact stockholders' equity, realized gains and maturities of certain debt securities.
The gross realized gains on sales of investments classified as available-for-sale, including short-term investments, during 2006, 2005 and 2004 were $12.3 million, $34.7 million and $28.0 million, respectively, and the gross realized losses were $3.7 million, $12.3 million and $4.7 million, respectively.
Net realized and unrealized investment gains (losses) were as follows:
| |
|---|
| Year Ended December 31,
| |
|---|
(Dollars in thousands)
| 2006
| | 2005
| | 2004
| |
|---|
| |
|---|
| Net realized gains (losses): | | | | | | | | | |
| | Equity securities | $ | 9,532 | | $ | 30,067 | | $ | 16,909 | |
| | Fixed maturity securities | | (975 | ) | | (7,560 | ) | | 6,258 | |
| | Real estate investments | | 1,664 | | | 8,255 | | | 15,494 | |
| | WorldCom settlement | | 2,076 | | | | | | | |
| | Advent Capital write-down (see Note 4) | | | | | (9,547 | ) | | | |
| | Other | | 1,080 | | | 1,009 | | | (82 | ) |
| |
| Net realized gains | $ | 13,377 | | $ | 22,224 | | $ | 38,579 | |
| |
| Change in fair value over (under) cost: | | | | | | | | | |
| | Equity securities | $ | 24,048 | | $ | (37,844 | ) | $ | 24,591 | |
| | Fixed maturity securities | | (6,485 | ) | | (25,611 | ) | | (5,630 | ) |
| |
Net investment income was as follows:
| |
|---|
| Year Ended December 31,
| |
|---|
(Dollars in thousands)
| 2006
| | 2005
| | 2004
| |
|---|
| |
|---|
| Fixed maturity securities | $ | 71,891 | | $ | 67,037 | | $ | 53,127 | |
| Equity securities | | 1,659 | | | 1,247 | | | 1,113 | |
| Mortgage loans | | | | | 362 | | | 5,652 | |
| Short-term investments | | 37,246 | | | 14,766 | | | 5,353 | |
| Other | | 978 | | | 361 | | | 642 | |
| |
| Subtotal | | 111,774 | | | 83,773 | | | 65,887 | |
| Investment expenses | | (5,480 | ) | | (4,573 | ) | | (4,011 | ) |
| |
| Net investment income | $ | 106,294 | | $ | 79,200 | | $ | 61,876 | |
| |
Investments with a fair value of $1.3 billion and $0.9 billion at December 31, 2006 and 2005, respectively, were on deposit with regulatory authorities in compliance with insurance company regulations.
NOTE 4
EQUITY IN EARNINGS OF INVESTEE
At December 31, 2006 and 2005, we owned 22.1 million shares of Advent Capital common stock. On June 3, 2005, Advent Capital sold 114.3 million shares of its common stock in a public offering at the United States dollar equivalent of $0.64 per share. On the same date,
71
Advent Capital common stock was listed for trading on the Alternative Investments Market of the London Stock Exchange ("AIM"). Prior to Advent Capital's listing on the AIM, there was no public market for such shares. Prior to the public offering, we owned approximately 20.9% of the outstanding shares of Advent Capital and recorded our investment in Advent Capital under the equity method of accounting, recognizing our share of the earnings or losses of Advent Capital. After the sale of additional shares of common stock by Advent Capital in 2005, we owned less than 10.0% of the outstanding shares of Advent Capital and no longer have representation on the board of directors. We therefore account for our investment in Advent Capital under the cost method of accounting and report this investment as an equity security in the Consolidated Balance Sheets at fair value using the quoted price of Advent Capital's common stock from AIM, translated into United States dollars.
To reflect the new, publicly traded price of Advent Capital in June 2005, we reduced the carrying value of this investment to its fair value resulting in a charge of $9.5 million before tax ($6.2 million after tax) in the second quarter of 2005 as a reduction of realized gains on investments. The charge resulted from the difference between the fair value of our investment in Advent Capital, based upon the offering price for Advent Capital's common stock, and the carrying value of the investment under the equity method as of the date of the public offering.
In each of the second quarters of 2005 and 2004, we received a dividend payment from Advent Capital of $1.1 million. No such dividends were received during 2006.
NOTE 5
FAIR VALUES OF FINANCIAL INSTRUMENTS
Financial instruments are contractual obligations that result in the delivery of cash or an ownership interest in an entity. The following summarizes the carrying value and fair value of our financial instruments. For financial instruments not discussed below, the carrying amount is a reasonable estimate of the fair value.
|
|---|
| | 2006
| | 2005
|
|---|
December 31,
| |
| |
Carrying
Value
| |
|
|---|
(Dollars in thousands)
| | Carrying
Value
| | Fair
Value
| | Fair
Value
|
|---|
|
|---|
| Assets: | | | | | | | | | | | | |
| | Investments | | $ | 2,273,656 | | $ | 2,273,012 | | $ | 2,167,000 | | $ | 2,166,702 |
| Liabilities: | | | | | | | | | | | | |
| | Convertible Notes | | | 1,129 | | | 3,215 | | | 1,124 | | | 3,156 |
| | Redeemable Securities | | | 58,342 | | | 61,987 | | | 58,833 | | | 58,632 |
|
Fair values of investments, which are further detailed in Note 3, were determined using market prices obtained from independent pricing services and various broker-dealers, or the fair value is estimated using analytical methods. The fair values of non-traded fixed maturity securities of $20.6 million and $41.0 million at December 31, 2006 and 2005, respectively, were estimated using a quantitative analytical technique, which compares such securities with the prices of traded securities with similar characteristics, to arrive at an estimate of fair value. The fair value of a non-traded common stock investment of $37.3 million and $23.7 million at December 31, 2006 and 2005, respectively, was estimated based on the net asset value of the company translated into United States dollars. The fair values of the 5.75% Convertible Senior Notes due March 30, 2023 (the "Convertible Notes") and 8.55% Capital Securities ("Redeemable Securities") were estimated using quantitative analytical techniques, which compare the Convertible Notes to the price of our common stock, into which they are convertible, and the Redeemable
72
Securities to the price of traded securities with similar characteristics.
NOTE 6
PROPERTIES AND EQUIPMENT
Properties and equipment, included in other assets, consist of the following:
| |
|---|
December 31,
(Dollars in thousands)
| | 2006
| | 2005
| |
|---|
| |
|---|
| Land | | $ | 9,650 | | $ | 9,650 | |
| Buildings | | | 35,550 | | | 34,700 | |
| Furniture, fixtures and equipment | | | 75,119 | | | 70,146 | |
| |
| Subtotal | | | 120,319 | | | 114,496 | |
| Accumulated depreciation | | | (64,874 | ) | | (57,316 | ) |
| |
| Total | | $ | 55,445 | | $ | 57,180 | |
| |
Depreciation expense in the years ended December 31, 2006, 2005 and 2004 was $10.2 million, $8.9 million and $7.8 million, respectively.
NOTE 7
INCOME TAX
Zenith files a consolidated federal income tax return. The insurance subsidiaries pay premium taxes on gross premiums written in lieu of most state income or franchise taxes.
The components of the provision for tax on the income from continuing operations before equity in earnings of investee were:
| |
|---|
| | Year Ended December 31,
| |
|---|
(Dollars in thousands)
| | 2006
| | 2005
| | 2004
| |
|---|
| |
|---|
| Current | | $ | 135,460 | | $ | 96,141 | | $ | 64,677 | |
| Deferred | | | 6,652 | | | (14,247 | ) | | (7,464 | ) |
| |
| Income tax expense | | $ | 142,112 | | $ | 81,894 | | $ | 57,213 | |
| |
The difference between the statutory income tax rate of 35% and our effective tax rate on income from continuing operations before tax and equity in earnings of investee, as reflected in the Consolidated Statements of Operations, was as follows:
| |
|---|
| | Year Ended December 31,
| |
|---|
(Dollars in thousands)
| | 2006
| | 2005
| | 2004
| |
|---|
| |
|---|
| Statutory income tax expense | | $ | 140,284 | | $ | 83,141 | | $ | 60,741 | |
| (Reduction) increase in tax: | | | | | | | | | | |
| | Dividend received deduction and tax-exempt interest | | | (1,839 | ) | | (1,866 | ) | | (2,000 | ) |
| | Reduction in tax estimate for a prior year | | | | | | (1,105 | ) | | (2,596 | ) |
| | Non-deductible expenses and other | | | 3,667 | | | 1,724 | | | 1,068 | |
| |
| Income tax expense | | $ | 142,112 | | $ | 81,894 | | $ | 57,213 | |
| |
Deferred tax is provided based upon temporary differences between the tax and book basis of assets and liabilities. The components of the deferred tax assets and liabilities were as follows:
|
|---|
December 31,
| | 2006
| | 2005
|
|---|
| |
|
|---|
| | Deferred Tax
| | Deferred Tax
|
|---|
| |
|
|---|
(Dollars in thousands)
| | Assets
| | Liabilities
| | Assets
| | Liabilities
|
|---|
|
|---|
| Investments | | | | | $ | 14,141 | | | | | $ | 5,989 |
| Deferred policy acquisition costs | | | | | | 4,416 | | | | | | 5,836 |
| Properties and equipment | | | | | | 3,791 | | | | | | 5,008 |
| Unpaid losses and loss adjustment expenses discount | | $ | 43,723 | | | | | $ | 55,697 | | | |
| Limitation on deduction for unearned premiums | | | 7,711 | | | | | | 11,676 | | | |
| Policyholders' dividends accrued | | | 19,975 | | | | | | 10,702 | | | |
| Other | | | 6,957 | | | 1,265 | | | 7,714 | | | 1,282 |
|
| | | $ | 78,366 | | $ | 23,613 | | $ | 85,789 | | $ | 18,115 |
|
| Net deferred tax asset | | $ | 54,753 | | | | | $ | 67,674 | | | |
|
Property-casualty loss reserves are not discounted in our consolidated financial statements; however, the Tax Reform Act of 1986 requires property and casualty loss reserves to be discounted for tax purposes. Our net deferred tax asset is expected to be fully recoverable because all future deductible amounts associated with deferred tax assets can be offset by recovery of income taxes paid
73
within the statutory carry-back period or anticipated future taxable income, including investment income.
NOTE 8
UNPAID LOSSES AND LOSS ADJUSTMENT EXPENSES
The following table represents a reconciliation of changes in the liability for unpaid losses and loss adjustment expenses:
| |
|---|
| | Year Ended December 31,
| |
|---|
(Dollars in thousands)
| | 2006
| | 2005
| | 2004
| |
|---|
| |
|---|
| Beginning of year, net | | $ | 1,459,797 | | $ | 1,212,032 | | $ | 990,877 | |
| Incurred claims: | | | | | | | | | | |
| | Current accident year | | | 464,106 | | | 730,770 | | | 615,397 | |
| | Prior accident years | | | (141,322 | ) | | (26,900 | ) | | 13,366 | |
| |
| Total incurred claims | | | 322,784 | | | 703,870 | | | 628,763 | |
| |
| Payments: | | | | | | | | | | |
| | Current accident year | | | (131,595 | ) | | (147,926 | ) | | (108,944 | ) |
| | Prior accident years | | | (349,910 | ) | | (308,179 | ) | | (298,664 | ) |
| |
| Total payments | | | (481,505 | ) | | (456,105 | ) | | (407,608 | ) |
| |
| End of year, net | | | 1,301,076 | | | 1,459,797 | | | 1,212,032 | |
| Receivable from reinsurers for unpaid losses | | | 221,204 | | | 243,648 | | | 270,287 | |
| |
| End of year, gross | | $ | 1,522,280 | | $ | 1,703,445 | | $ | 1,482,319 | |
| |
The net $141.3 million favorable development in 2006 principally related to a reduction in estimated workers' compensation losses for the 2005 and 2004 accident years offset, in part, by adverse development of reinsurance reserves for the 2005 hurricanes. The net $26.9 million favorable development in 2005 principally related to a reduction in estimated workers' compensation losses for the 2004 and 2003 accident years, partially offset by a re-allocation of loss reserves to older accident years. The net $13.4 million adverse development in 2004 was due to a net increase in workers' compensation loss reserves for prior years, offset by a decrease in assumed reinsurance loss reserves for prior years.
NOTE 9
DEBT
Convertible Senior Notes Payable. On March 21, 2003, we issued $125.0 million aggregate principal amount of the Convertible Notes in a private placement, from which we received net proceeds of $120.0 million. In 2005, $123.8 million of aggregate principal amount of the Convertible Notes were converted into shares of our common stock. We paid $4.7 million in cash as an incentive for certain of these conversions which is included in the results of the Parent segment.
The remaining $1.2 million aggregate principal amount of Convertible Notes outstanding at December 31, 2006 are general unsecured obligations of Zenith National and rank equally with our other unsecured and unsubordinated obligations. Interest on the Convertible Notes is payable semi-annually on March 30 and September 30. In addition, we will pay contingent interest during any six-month period commencing with the six-month period beginning September 30, 2008 if the average market price of a Convertible Note for the five trading days ending on the second trading day immediately preceding the relevant six-month period equals 120% or more of the principal amount of the Convertible Notes. Each $1,000 principal amount of the Convertible Notes is convertible at each holder's option into 59.988 shares of our common stock, par value $1.00 per share (subject to adjustment as provided in the Indenture) only if: (i) during any fiscal quarter the sale price of the common stock for at least 20 trading days in the 30 trading-day period ending on the last trading day of the immediately preceding fiscal quarter exceeds 120% of the conversion price on that 30th trading day; (ii) after the 30th day following the initial issuance of the Convertible Notes, the credit rating assigned to the Convertible Notes by Standard & Poor's Rating
74
Services falls below BB- or is suspended or withdrawn; (iii) Zenith has called the Convertible Notes for redemption; or (iv) certain corporate events have occurred. The conversion rate of 59.988 shares for each $1,000 principal amount of Convertible Notes is equivalent to a conversion price of $16.67 per share of our common stock. The sale price of our common stock exceeded 120% of the conversion price of $16.67 per share for 20 trading days during the last 30 trading days of the fourth quarter of 2006. As a result of this event, each holder of the remaining $1.2 million aggregate principal amount of the notes has the right to convert their Convertible Notes into Zenith National's common stock at a conversion rate of 59.988 shares per $1,000 principal amount of Convertible Notes during the period beginning on January 1, 2007 and ending on March 31, 2007 (maximum number of shares that could be required to be issued is approximately 69,000). Whether the Convertible Notes will be convertible after March 31, 2007 will depend upon the occurrence of the events specified in the Indenture, including the sale price of our common stock.
We may redeem some or all of the remaining $1.2 million aggregate principal amount of Convertible Notes for cash on or after March 30, 2008 at the prices specified in the Indenture. Each holder may require us to repurchase all or a portion of its Convertible Notes on March 30, 2010, March 30, 2013, March 30, 2018, or, subject to certain exceptions, upon a change of control of Zenith. If any holder requires us to repurchase its Convertible Notes in any of these events, we may choose to pay the repurchase price in cash or shares of our common stock or a combination of cash and shares of our common stock.
Issue costs and discount of $5.0 million are being amortized using the effective interest method over the time from issuance to March 30, 2010. At December 31, 2006 and 2005, the unamortized issue costs and discount was approximately $21,000 and $26,000, respectively. During the years ended December 31, 2006, 2005 and 2004, $0.1 million, $3.5 million and $7.8 million, respectively, of interest, issue costs and discount were expensed.
Redeemable securities. At December 31, 2006 and 2005, Zenith National Insurance Capital Trust I, a Delaware statutory business trust ("Trust"), all of the voting securities of which are owned by Zenith National, had $58.5 million outstanding of the $75.0 million Redeemable Securities originally issued. The Redeemable Securities pay semi-annual cumulative cash distributions at the annual rate of 8.55% of the $1,000 liquidation amount per security.
The Trust had invested $77.3 million in Zenith National's 8.55% Subordinated Deferrable Interest Debentures due 2028 ("Subordinated Debentures") at December 31, 2006 and 2005, which constitute the principal asset of the Trust. The semi-annual interest payments on the Subordinated Debentures may be deferred by Zenith National for up to ten consecutive semi-annual periods. The Subordinated Debentures are redeemable at 100% of the principal amount of the Subordinated Debentures plus a "make-whole premium," if any, together with accrued and unpaid interest. The make-whole premium is the excess of the then present value of the remaining scheduled payments of principal and interest over 100% of the principal amount. Payments on the Redeemable Securities, including distributions and redemptions, follow those of the Subordinated Debentures. Zenith National fully and unconditionally guarantees the distributions on, and the liquidation amount generally of, the Redeemable Securities to the extent the Trust has funds legally available therefor. Zenith National's guarantee of the Redeemable Securities, as well as the Subordinated
75
Debentures, is subordinated to all other indebtedness of Zenith National.
The issue costs and discount on the Subordinated Debentures of $1.7 million are being amortized over the term of the Subordinated Debentures. At December 31, 2006 and 2005, the unamortized issue costs and discount was approximately $158,000 and $167,000, respectively. During each of the years ended December 31, 2006, 2005 and 2004, $5.1 million, $5.1 million and $5.2 million, respectively, of interest, issue costs and discount were expensed.
In the first quarter of 2006, Zenith National paid $0.5 million to repurchase $0.5 million aggregate principal amount of the outstanding Redeemable Securities. In March 2004, Zenith National repurchased $8.0 million aggregate liquidation amount of the outstanding Redeemable Securities which resulted in a gain of $0.3 million before tax ($0.2 million after tax). The gain has been recorded as a reduction of interest expense in the year ended December 31, 2004. Zenith National used its available cash balances to fund these purchases.
Aggregate Maturities. At December 31, 2006, the aggregate maturities for all of our long-term borrowings for each of the five years and thereafter were as follows:
|
|---|
(Dollars in thousands)
| | Convertible Notes
| | Redeemable Securities
| | Total
|
|---|
|
|---|
| Maturing in: | | | | | | | | | |
| 2007 | | $ | 1,150 | | | | | $ | 1,150 |
| 2008 | | | | | | | | | |
| 2009 | | | | | | | | | |
| 2010 | | | | | | | | | |
| 2011 | | | | | | | | | |
| Thereafter | | | | | $ | 58,500 | | | 58,500 |
|
| Total | | $ | 1,150 | | $ | 58,500 | | $ | 59,650 |
|
The maturity of the remaining outstanding Convertible Notes is presented as being due in 2007 because the holders of our Convertible Notes have the right to convert their notes into our common stock during the first quarter of 2007 since the contingent conversion condition relative to our stock price was met as of December 31, 2006. If the remaining Convertible Notes are not converted or redeemed, their scheduled maturity is March 2023.
Bank Line of Credit. At December 31, 2006, we had a $30.0 million revolving credit agreement with a bank which, on February 16, 2007, was renewed with an expiration date of February 16, 2010. Interest is payable on any outstanding loans at either the bank's prime rate or a rate based on Eurodollar deposit rates plus a specified margin depending on our credit rating. This credit agreement contains covenants that require, among other things, we maintain certain financial ratios, including a minimum amount of capital in our insurance subsidiaries, a maximum debt-to-total capitalization ratio and a minimum interest coverage ratio. We were in compliance with all of these covenants at December 31, 2006. There were no outstanding borrowings under the bank line of credit in 2006 and 2005. We currently do not anticipate any need to draw on our bank line of credit because our current cash and available invested assets are sufficient for any foreseeable requirements.
NOTE 10
REINSURANCE CEDED
We maintain excess of loss and catastrophe reinsurance which provides protection for workers' compensation losses in excess of $1.0 million up to $150.0 million with catastrophe losses arising out of a California
76
earthquake up to $200.0 million. We will also retain 50% of any losses between $10.0 million and $20.0 million.
Our reinsurance also provides protection for acts of terrorism. The limit for domestic acts of terrorism is $150.0 million in excess of a $1.0 million retention and we retain 50% of any losses between $10.0 million and $20.0 million. The limit for foreign acts of terrorism is up to $75.0 million in excess of a $1.0 million retention and we retain 50% of any losses between $10.0 million and $20.0 million. Both of these coverages exclude losses from nuclear, biological and chemical attacks for losses in excess of $20.0 million and we retain 15% of any losses between $10.0 million and $20.0 million.
Also, from January 1, 2002 through December 31, 2004, we ceded 10% of our workers' compensation premiums under a quota share reinsurance agreement. We terminated the quota share contract effective December 31, 2004.
Reinsurance transactions reflected in the accompanying Consolidated Statements of Operations were as follows:
| |
|---|
| | Year Ended December 31,
| |
|---|
(Dollars in thousands)
| | 2006
| | 2005
| | 2004
| |
|---|
| |
|---|
| Direct premiums earned | | $ | 964,131 | | $ | 1,148,775 | | $ | 1,034,903 | |
| Assumed premiums earned | | | 18,533 | | | 76,505 | | | 53,782 | |
| Ceded premiums earned (1) | | | (38,447 | ) | | (46,580 | ) | | (144,260 | ) |
| |
| Net premiums earned | | $ | 944,217 | | $ | 1,178,700 | | $ | 944,425 | |
| |
| Ceded loss and loss adjustment expenses incurred (1) | | $ | 4,402 | | $ | 12,294 | | $ | 78,229 | |
| |
(1) Ceded premiums earned and ceded loss and loss adjustment expenses incurred in 2004 reflect the impact of the 10% quota share agreement, which terminated effective December 31, 2004.
NOTE 11
COMMITMENTS AND CONTINGENCIES
Leases. Zenith has office space, equipment and automobile leases expiring through 2011. The minimum lease payments for the next five years on these non-cancelable operating leases at December 31, 2006 were as follows:
|
|---|
(Dollars in thousands)
| | Equipment
and
Auto Fleet
| | Offices
| | Total
|
|---|
|
|---|
| 2007 | | $ | 1,862 | | $ | 6,862 | | $ | 8,724 |
| 2008 | | | 1,280 | | | 5,198 | | | 6,478 |
| 2009 | | | 404 | | | 3,728 | | | 4,132 |
| 2010 | | | 10 | | | 2,542 | | | 2,552 |
| 2011 | | | | | | 675 | | | 675 |
|
| Total | | $ | 3,556 | | $ | 19,005 | | $ | 22,561 |
|
Rent expense for the years ended December 31, 2006, 2005 and 2004 was $10.6 million, $8.7 million and $7.5 million, respectively.
Contingencies Surrounding Recoverability of Special Disability Trust Fund Receivable. The Florida Special Disability Trust Fund ("SDTF") was established to reimburse insurance companies and employers for the cost of certain workers' compensation claims. The SDTF promotes the re-hiring of injured workers by providing a reimbursement for certain qualifying claims made by a previously injured worker subsequent to their re-hiring. These claims are sometimes referred to as "second injuries." We are able to submit such second injury claims to the SDTF and, if the claims are accepted, we are reimbursed for part of the cost of the claim. The SDTF stopped accepting new second injury claims dated after January 1, 1998. At December 31, 2006, approximately 550 of our eligible Florida claims have been accepted, for which we have recorded a recoverable of $3.7 million, net of amounts due to reinsurers. We bill the SDTF and receive reimbursements as we make payments on accepted claims. The SDTF is funded by currently assessing a fee of 4.52% of workers' compensation premiums written in Florida, and we accrue the assessment as a liability when we write Florida business. If the legislature in Florida were to decide to cease or suspend the assessment, and thereby the funding of the SDTF, any recoverable that we
77
may have at that time which is related to un-reimbursed claims might be at risk. However, we have no current information to indicate that the SDTF assessment in Florida will not continue. We continue to collect recoveries for second injury claims from the SDTF and although the SDTF is currently about 36 months behind schedule in reimbursing claims, we expect to fully recover the remaining amount receivable. The ultimate resolution of this matter is not expected to have a material impact on us because the amount recoverable from the SDTF at December 31, 2006 is not material to our consolidated financial position, results of operations or cash flows.
Litigation. We are defendants in various litigation. In the opinion of management, after consultation with legal counsel, such litigation is either without merit or the ultimate liability, if any, is not expected to have a material adverse effect on our consolidated financial condition, results of operations or cash flows.
NOTE 12
STOCK-BASED COMPENSATION PLANS
The total compensation cost recognized for stock-based awards was $2.6 million (net of $1.4 million tax benefit), $1.8 million (net of $1.0 million tax benefit) and $0.6 million (net of $0.3 million tax benefit) for the years ended December 31, 2006, 2005 and 2004, respectively.
Restricted Stock Awards. The following table provides certain information regarding the shares available for future grants under the Restricted Stock Plan at December 31, 2006:
| |
|---|
| Number of shares authorized for grants | | 625,000 | |
| Number of shares outstanding | | (330,000 | ) |
| Number of shares vested | | (87,000 | ) |
| | |
| |
| Number of shares available for future grants | | 208,000 | |
| |
Changes in restricted stock for the three years ended December 31, 2006 were as follows:
|
|---|
| Number
of Shares
| | Weighted
Average
Grant Date
Fair Value
|
|---|
|
|---|
| Outstanding at December 31, 2003 | | | | |
| | Granted | 183,000 | | $ | 30.66 |
| | Forfeited | (4,000 | ) | | 30.17 |
| |
| | | |
| Outstanding at December 31, 2004 | 179,000 | | | 30.67 |
| | Granted | 147,000 | | | 44.74 |
| | Forfeited | (6,000 | ) | | 30.17 |
| |
| | | |
| Outstanding at December 31, 2005 | 320,000 | | | 37.13 |
| | Granted | 137,000 | | | 45.06 |
| | Vested | (87,000 | ) | | 31.55 |
| | Forfeited | (40,000 | ) | | 37.15 |
| |
| | | |
| Outstanding at December 31, 2006 | 330,000 | | | 41.88 |
|
At December 31, 2006, 87,000 shares had vested under the Restricted Stock Plan. Compensation expense recognized for the years ended December 31, 2006, 2005 and 2004 was $2.6 million, $1.8 million and $0.6 million after tax, respectively. Unrecognized compensation expense before tax under the Restricted Stock Plan was $8.9 million and $8.3 million at December 31, 2006 and December 31, 2005, respectively.
Unrecognized compensation expense associated with restricted shares in the prior periods was reclassified to additional paid-in-capital.
Employee Stock Options. At December 31, 2006, all outstanding stock options granted under the Stock Option Plan had previously vested and all compensation expense related to these options had been recognized. Compensation expense after tax was $15,000, $39,000 and $39,000 for the years ended December 31, 2006, 2005 and 2004, respectively.
78
Changes in stock options for the three years ended December 31, 2006 were as follows:
|
|---|
| Number
of Shares
| | Weighted
Average
Exercise
Price
|
|---|
|
|---|
| Outstanding at December 31, 2003 | 2,205,000 | | $ | 15.81 |
| Exercised | (691,000 | ) | | 15.37 |
| Expired | (5,000 | ) | | 15.17 |
| Forfeited | (20,000 | ) | | 15.80 |
| |
| | | |
| Outstanding at December 31, 2004 | 1,489,000 | | | 16.01 |
| Exercised | (1,457,000 | ) | | 18.47 |
| Forfeited | (11,000 | ) | | 20.88 |
| |
| | | |
| Outstanding at December 31, 2005 | 21,000 | | | 20.51 |
| Exercised | (11,500 | ) | | 20.19 |
| |
| | | |
| Outstanding at December 31, 2006 | 9,500 | | | 20.88 |
|
Options exercisable at December 31, 2006, 2005 and 2004 were 9,500, 3,750, and 1,412,000, respectively.
All 9,500 options outstanding and exercisable at December 31, 2006 will expire during the second quarter of 2007 if not exercised. Upon the full exercise of these options, 9,500 shares of Zenith National's common stock would be issued.
NOTE 13
STOCKHOLDERS' EQUITY AND
STATUTORY FINANCIAL INFORMATION
Common Stock. From time to time, Zenith National may make repurchases of its outstanding common shares. At December 31, 2006, Zenith National was authorized to repurchase up to 929,000 shares of its common stock at prevailing market prices pursuant to a share repurchase program authorized by its Board of Directors on February 24, 1998. Any purchases are discretionary and can be adequately funded from Zenith National's existing sources of liquidity. No shares were repurchased under the share repurchase program during the three years ended December 31, 2006.
Dividend Restrictions. The California Insurance Holding Company System Regulatory Act limits the ability of Zenith Insurance to pay dividends to Zenith National, and of the insurance subsidiary of Zenith Insurance to pay dividends to Zenith Insurance, by providing that the appropriate insurance regulatory authorities in the state of California must approve any dividend that, together with all other such dividends paid during the preceding twelve months, exceeds the greater of: (a) 10% of the paying company's statutory surplus as regards policyholders at the preceding December 31; or (b) 100% of the net income for the preceding year. In addition, any such dividend must be paid from policyholders' surplus attributable to accumulated earnings. Such restrictions on dividends are not cumulative. Zenith Insurance paid dividends to Zenith National of $50.0 million, $30.0 million and $20.0 million in 2006, 2005 and 2004, respectively. In 2007, $225.9 million can be paid to Zenith National in dividends without prior approval of the California DOI. The restrictions on the payment of dividends have not had, and under current regulations are not expected to have, a material adverse impact on the ability to pay dividends.
79
Statutory Financial Data. The capital stock and surplus and net income of our insurance subsidiaries, prepared in accordance with the statutory accounting practices of the National Association of Insurance Commissioners ("NAIC") were as follows:
|
|---|
| | Year Ended December 31,
|
|---|
(Dollars in thousands)
| | 2006
| | 2005
| | 2004
|
|---|
|
|---|
| Capital stock and surplus | | $ | 919,835 | | $ | 685,511 | | $ | 573,270 |
| Net income | | | 278,163 | | | 162,158 | | | 112,824 |
|
The California DOI (the domiciliary state of our insurance subsidiaries) requires that in addition to applying the NAIC's statutory accounting practices, insurance companies must record, under certain circumstances, an additional liability, called an "excess statutory reserve." The excess statutory reserve formula establishes a 65% loss and loss adjustment expense ratio for the current and prior two years. Excess statutory reserves reduce statutory surplus but do not impact statutory net income.
Based upon actuarial data submitted to the California DOI in support of our workers' compensation losses and loss adjustment expense reserves, the California DOI has informed us in writing that they do not object to the recording of an excess statutory reserve of $360.3 million as of December 31, 2006, instead of $533.4 million produced under the formula. As a result, we recorded statutory surplus of $559.5 million as of December 31, 2006. At December 31, 2005 we reported statutory surplus of $440.8 million as determined under the formula.
The insurance business is subject to state-by-state regulation and legislation focused on solvency, pricing, market conduct, claims practices, underwriting, accounting, investment criteria and other areas. Such regulation and legislation changes frequently. Compliance is essential and is an inherent risk of the business.
NOTE 14
EARNINGS AND DIVIDENDS PER SHARE
The following table sets forth the computation of basic and diluted net income per common share.
|
|---|
|
|
| | Year Ended December 31,
|
|---|
(Dollars and shares thousands,
except per share data)
|
|---|
| | 2006
| | 2005
| | 2004
|
|---|
|
|---|
| (A) | Income from continuing operations | | $ | 258,700 | | $ | 156,447 | | $ | 117,714 |
| (B) | Gain on sale of discontinued real estate segment | | | | | | 1,253 | | | 1,286 |
|
| (C) | Net income | | $ | 258,700 | | $ | 157,700 | | $ | 119,000 |
|
| (D) | Interest expense on the Convertible Notes, net of tax | | $ | 48 | | $ | 2,254 | | $ | 5,070 |
|
| (E) | Weighted average shares outstanding — basic | | | 36,974 | | | 33,555 | | | 28,737 |
|
Common shares issuable under the Stock Option Plan (treasury stock method) |
|
|
4 |
|
|
124 |
|
|
450 |
| | Common shares issuable under the Restricted Stock Plan (treasury stock method) | | | 127 | | | 92 | | | 9 |
| | Common shares issuable upon conversion of the Convertible Notes | | | 69 | | | 3,281 | | | 7,500 |
|
| (F) | Weighted average shares outstanding — diluted | | | 37,174 | | | 37,052 | | | 36,696 |
|
| Net income per common share: | | | | | | | | | |
| Basic: | | | | | | | | | |
| (A)/(E) | Continuing operations | | $ | 7.00 | | $ | 4.66 | | $ | 4.10 |
| (B)/(E) | Gain on sale of discontinued real estate segment | | | | | | 0.04 | | | 0.04 |
|
| (C)/(E) | Net income | | $ | 7.00 | | $ | 4.70 | | $ | 4.14 |
|
| Diluted: | | | | | | | | | |
| ((A)+(D))/(F) Continuing operations | | $ | 6.96 | | $ | 4.29 | | $ | 3.35 |
| (B)/(F) | Gain on sale of discontinued real estate segment | | | | | | 0.03 | | | 0.03 |
|
| ((C)+(D))/(F) Net income | | $ | 6.96 | | $ | 4.32 | | $ | 3.38 |
|
| Cash dividends declared per common share | | $ | 1.26 | | $ | 0.94 | | $ | 0.75 |
|
80
Basic weighted average shares outstanding for the years ended December 31, 2006 and 2005 include shares issued in 2005 in connection with the conversions of $123.8 million aggregate principal of our Convertible Notes. Diluted weighted average shares outstanding include an additional 69,000, 3.3 million and 7.5 million shares for the years ended December 31, 2006, 2005 and 2004, respectively, that could have been issued in connection with our Convertible Notes during these periods. After-tax interest expense associated with the Convertible Notes of $48,000, $2.3 million and $5.1 million for the years ended December 31, 2006, 2005 and 2004, respectively, was added back to net income in computing net income per diluted share.
NOTE 15
OTHER COMPREHENSIVE INCOME
Other comprehensive income is comprised of changes in unrealized appreciation on investments classified as available-for-sale and changes, for the applicable periods, in foreign currency translation adjustments on investments accounted for under the equity method. The following table summarizes the components of accumulated other comprehensive income:
| |
|---|
| | December 31,
| |
|---|
(Dollars in thousands)
| | 2006
| | 2005
| |
|---|
| |
|---|
| Net unrealized appreciation on investments, before tax | | $ | 19,742 | | $ | 1,833 | |
| Deferred tax expense | | | (6,910 | ) | | (642 | ) |
| |
| Total accumulated other comprehensive income | | $ | 12,832 | | $ | 1,191 | |
| |
The following table summarizes the components of our other comprehensive income (loss), other than net income, for the three years ended December 31, 2006:
| |
|---|
(Dollars in thousands)
| | Pre-Tax
| | Income Tax Effect
| | After-Tax
| |
|---|
| |
|---|
| Year Ended December 31, 2006 | |
| |
| Net unrealized appreciation arising during the year | | $ | 24,190 | | $ | 8,467 | | $ | 15,723 | |
| Less: | reclassification adjustment for realized gains included in net income | | | (6,281 | ) | | (2,199 | ) | | (4,082 | ) |
| |
| Total other comprehensive income | | $ | 17,909 | | $ | 6,268 | | $ | 11,641 | |
| |
| Year Ended December 31, 2005 | |
| |
| Net unrealized depreciation arising during the year | | $ | (34,346 | ) | $ | (12,021 | ) | $ | (22,325 | ) |
| Less: | reclassification adjustment for realized gains included in net income | | | (26,243 | ) | | (9,185 | ) | | (17,058 | ) |
| |
| Net change in unrealized appreciation on investments | | | (60,589 | ) | | (21,206 | ) | | (39,383 | ) |
| |
| Change in foreign currency translation arising during the year | | | | | | | | | | |
| Less: | reclassification adjustment for realized foreign currency gains included in net income | | | (4,629 | ) | | (1,620 | ) | | (3,009 | ) |
| |
| Net change in foreign currency translation | | | (4,629 | ) | | (1,620 | ) | | (3,009 | ) |
| |
| Total other comprehensive (loss) | | $ | (65,218 | ) | $ | (22,826 | ) | $ | (42,392 | ) |
| |
| Year Ended December 31, 2004 | |
| |
| Net unrealized appreciation arising during the year | | $ | 40,973 | | $ | 14,341 | | $ | 26,632 | |
| Less: | reclassification adjustment for realized gains included in net income | | | (22,768 | ) | | (7,969 | ) | | (14,799 | ) |
| |
| Net change in unrealized appreciation on investments | | | 18,205 | | | 6,372 | | | 11,833 | |
| |
| Increase in foreign currency translation arising during the year | | | 3,017 | | | 1,055 | | | 1,962 | |
| Less: | reclassification adjustment for realized foreign currency gains included in net income | | | (3,127 | ) | | (1,094 | ) | | (2,033 | ) |
| |
| Net change in foreign currency translation | | | (110 | ) | | (39 | ) | | (71 | ) |
| |
| Total other comprehensive income | | $ | 18,095 | | $ | 6,333 | | $ | 11,762 | |
| |
81
NOTE 16
SEGMENT INFORMATION
Our business is comprised of the following segments: workers' compensation; reinsurance; investments; and parent. Our real estate segment was discontinued in 2002. Segments are designated based on the types of products and services provided. Workers' compensation represents insurance coverage for the statutorily prescribed benefits that employers are required to provide to their employees who may be injured in the course of employment. Reinsurance principally consisted of assumed reinsurance of property losses from worldwide catastrophes and large property risks. In September 2005, we exited the reinsurance business and we ceased writing and renewing assumed reinsurance contracts. We will service our obligations under our assumed reinsurance contracts and the results of the reinsurance segment will continue to be included in the results of continuing operations. Income from operations of the investments segment includes investment income and realized gains and losses on investments and we do not allocate investment income to the results of our workers' compensation and reinsurance segments. Income from the workers' compensation and reinsurance segments is determined by deducting net loss and loss adjustment expenses incurred and underwriting and other operating expenses incurred from net premiums earned. Loss from operations of the parent segment includes interest expense and the general operating expenses of Zenith National, a holding company which owns, directly or indirectly, all of the capital stock of its insurance subsidiaries and other investment securities.
In 2006, we wrote workers' compensation premiums in 45 states, but the largest concentrations, 62.5% and 22.2%, respectively, of our workers' compensation earned premium, were in California and Florida. The concentration of our business in these states makes the results of our operations dependent upon trends that are characteristic of these states as compared to national trends, for example, state legislation, competition and workers' compensation inflation trends.
The accounting policies of the segments are the same as those described in Note 2.
The combined ratio, expressed as a percentage, is a key measurement of profitability traditionally used in the property-casualty insurance business. The combined ratio is the sum of the loss and loss adjustment expense ratio and the underwriting and other operating expense ratio. The loss and loss adjustment expense ratio is the percentage of net incurred loss and loss adjustment expenses to net premiums earned. The underwriting and other operating expense ratio is the percentage of underwriting and other operating expenses to net premiums earned. The key operating goal for our insurance segments is to achieve a combined ratio of 100% or lower and to achieve a workers' compensation combined ratio that is at least three percentage points lower than the combined ratio of the national workers' compensation industry.
82
Segment information is set forth below:
| |
|---|
(Dollars in thousands)
| | Workers'
Compensation
| | Reinsurance
| |
| | Investments
| | Parent
| | Total
| |
|---|
| |
|---|
| Year Ended December 31, 2006 | |
| |
| Revenues: | | | | | | | | | | | | | | | | | | |
| Premiums earned | | $ | 931,739 | | $ | 12,478 | | | | | | | | | | $ | 944,217 | |
| Net investment income | | | | | | | | | | $ | 106,294 | | | | | | 106,294 | |
| Realized gains on investments | | | | | | | | | | | 13,377 | | | | | | 13,377 | |
| |
| Total revenues | | | 931,739 | | | 12,478 | | | | | 119,671 | | | | | | 1,063,888 | |
| |
| Interest expense | | | | | | | | | | | | | $ | (5,275 | ) | | (5,275 | ) |
| |
| Income (loss) before tax | | | 313,576 | | | (20,508 | ) | | | | 119,671 | | | (11,927 | ) | | 400,812 | |
| Income tax expense (benefit) | | | 113,414 | | | (7,178 | ) | | | | 40,050 | | | (4,174 | ) | | 142,112 | |
| |
| Net income (loss) | | $ | 200,162 | | $ | (13,330 | ) | | | $ | 79,621 | | $ | (7,753 | ) | $ | 258,700 | |
| |
| Combined ratios | | | 66.3 | % | | 264.4 | % | | | | | | | | | | | |
| |
| Total assets | | $ | 447,756 | | $ | 24,144 | | | | $ | 2,293,265 | | $ | 2,388 | | $ | 2,767,553 | |
| |
| |
|---|
(Dollars in thousands)
| | Workers'
Compensation
| | Reinsurance
| | Real Estate(1)
| | Investments
| | Parent
| | Total
| |
|---|
| |
|---|
| Year Ended December 31, 2005 | | | | |
| |
| Revenues: | | | | | | | | | | | | | | | | | | | |
| Premiums earned | | $ | 1,114,194 | | $ | 64,506 | | | | | | | | | | | $ | 1,178,700 | |
| Net investment income | | | | | | | | | | | $ | 79,200 | | | | | | 79,200 | |
| Realized gains on investments | | | | | | | | | | | | 22,224 | | | | | | 22,224 | |
| |
| Total revenues | | | 1,114,194 | | | 64,506 | | | | | | 101,424 | | | | | | 1,280,124 | |
| |
| Interest expense | | | | | | | | | | | | | | $ | (8,757 | ) | | (8,757 | ) |
| |
| Income (loss) from continuing operations before tax and equity in earnings of investee | | | 213,244 | | | (56,183 | ) | | | | | 101,424 | | | (20,938 | ) | | 237,547 | |
| Income tax expense (benefit) | | | 74,990 | | | (19,664 | ) | | | | | 33,620 | | | (7,052 | ) | | 81,894 | |
| |
| Income (loss) from continuing operations after tax and before equity in earnings of investee | | | 138,254 | | | (36,519 | ) | | | | | 67,804 | | | (13,886 | ) | | 155,653 | |
| Equity in earnings of investee, net of income tax expense of $428 (see Note 4) | | | | | | | | | | | | 794 | | | | | | 794 | |
| |
| Income (loss) from continuing operations | | | 138,254 | | | (36,519 | ) | | | | | 68,598 | | | (13,886 | ) | | 156,447 | |
| |
| Gain on sale of discontinued real estate segment, net of income tax expense of $675 | | | | | | | | $ | 1,253 | | | | | | | | | 1,253 | |
| |
| Net income (loss) | | $ | 138,254 | | $ | (36,519 | ) | $ | 1,253 | | $ | 68,598 | | $ | (13,886 | ) | $ | 157,700 | |
| |
| Combined ratios | | | 80.9 | % | | 187.1 | % | | | | | | | | | | | | |
| |
| Total assets | | $ | 464,194 | | $ | 59,398 | | | | | $ | 2,187,993 | | $ | 5,871 | | $ | 2,717,456 | |
| |
(1) Gain on sale of discontinued real estate segment represents a payment received in 2005 of additional sales proceeds under the earn-out provision of the sale of our home-building business and related real estate assets in October 2002 (see Notes 1 and 20). The amount received in 2005 was the last such payment under the earn-out provision.
83
| |
|---|
(Dollars in thousands)
| | Workers'
Compensation
| | Reinsurance
| | Real Estate(1)
| | Investments
| | Parent
| | Total
| |
|---|
| |
|---|
| Year Ended December 31, 2004 | | | | |
| |
| Revenues: | | | | | | | | | | | | | | | | | | | |
| Premiums earned | | $ | 902,047 | | $ | 42,378 | | | | | | | | | | | $ | 944,425 | |
| Net investment income | | | | | | | | | | | $ | 61,876 | | | | | | 61,876 | |
| Realized gains on investments | | | | | | | | | | | | 38,579 | | | | | | 38,579 | |
| |
| Total revenues | | | 902,047 | | | 42,378 | | | | | | 100,455 | | | | | | 1,044,880 | |
| |
| Interest expense | | | | | | | | | | | | | | $ | (13,051 | ) | | (13,051 | ) |
| |
| Income (loss) from continuing operations before tax and equity in earnings of investee | | | 104,098 | | | (11,956 | ) | | | | | 100,455 | | | (19,051 | ) | | 173,546 | |
| Income tax expense (benefit) (2) | | | 37,354 | | | (4,185 | ) | | | | | 33,464 | | | (9,420 | ) | | 57,213 | |
| |
| Income (loss) from continuing operations after tax and before equity in earnings of investee | | | 66,744 | | | (7,771 | ) | | | | | 66,991 | | | (9,631 | ) | | 116,333 | |
| Equity in earnings of investee, net of income tax expense of $743 (see Note 4) | | | | | | | | | | | | 1,381 | | | | | | 1,381 | |
| |
| Income (loss) from continuing operations | | | 66,744 | | | (7,771 | ) | | | | | 68,372 | | | (9,631 | ) | | 117,714 | |
| |
| Gain on sale of discontinued real estate segment, net of income tax expense of $692 | | | | | | | | $ | 1,286 | | | | | | | | | 1,286 | |
| |
| Net income (loss) | | $ | 66,744 | | $ | (7,771 | ) | $ | 1,286 | | $ | 68,372 | | $ | (9,631 | ) | $ | 119,000 | |
| |
| Combined ratios | | | 88.5 | % | | 128.2 | % | | | | | | | | | | | | |
| |
| Investment in Advent Capital | | | | | | | | | | | $ | 28,066 | | | | | $ | 28,066 | |
| |
| Total assets | | $ | 477,028 | | $ | 29,014 | | | | | $ | 1,902,180 | | $ | 6,433 | | $ | 2,414,655 | |
| |
(1) Gain on sale of discontinued real estate segment represents a payment received in 2004 of additional sales proceeds under the earn-out provision of the sale of Zenith's home-building business and related real estate assets in October 2002 (see Notes 1 and 20).
(2) Parent segment includes $2.6 million in reduced income tax expense for a reduction of an estimated tax liability for prior years.
The following table is a reconciliation of our segment results to the accompanying Consolidated Statements of Operations:
| |
|---|
| | Year Ended December 31,
| |
|---|
(Dollars in thousands)
| | 2006
| | 2005
| | 2004
| |
|---|
| |
| Income before tax from investments segment: | | | | | | | | | | |
| Net investment income | | $ | 106,294 | | $ | 79,200 | | $ | 61,876 | |
| Realized gains on investments | | | 13,377 | | | 22,224 | | | 38,579 | |
| |
| Income before tax from investments segment | | | 119,671 | | | 101,424 | | | 100,455 | |
| Income (loss) before tax from: | | | | | | | | | | |
| | Workers' compensation segment | | | 313,576 | | | 213,244 | | | 104,098 | |
| | Reinsurance segment | | | (20,508 | ) | | (56,183 | ) | | (11,956 | ) |
| | Parent segment | | | (11,927 | ) | | (20,938 | ) | | (19,051 | ) |
| |
| Income from continuing operations before tax and equity in earnings of investee | | | 400,812 | | | 237,547 | | | 173,546 | |
| Income tax expense | | | 142,112 | | | 81,894 | | | 57,213 | |
| |
| Income from continuing operations after tax and before equity in earnings of investee | | | 258,700 | | | 155,653 | | | 116,333 | |
| Equity in earnings of investee, net of tax (see Note 4) | | | | | | 794 | | | 1,381 | |
| |
| Income from continuing operations | | | 258,700 | | | 156,447 | | | 117,714 | |
| Gain on sale of discontinued real estate segment, net of tax | | | | | | 1,253 | | | 1,286 | |
| |
| Net income | | $ | 258,700 | | $ | 157,700 | | $ | 119,000 | |
| |
84
NOTE 17
EMPLOYEE BENEFIT AND RETIREMENT PLANS
We offer a tax deferred savings plan organized under Section 401(k) of the Internal Revenue Code for all eligible employees. We match 50% of employee contributions that are 6% or less of salary on a current basis and we are not liable for any future payments under the plan. For the years ended December 31, 2006, 2005 and 2004, we contributed $2.6 million, $2.7 million and $2.3 million, respectively.
We also offer a stock purchase plan, under which we match 25% of employees' contributions to purchase shares of our common stock at market value. For the years ended December 31, 2006, 2005 and 2004, we contributed $1.3 million, $0.9 million and $0.5 million, respectively. In September 2006, we suspended the stock purchase plan in order to comply with certain applicable stock exchange listing standards. An amended and restated stock purchase plan will be presented for stockholder approval in May 2007.
NOTE 18
RELATED PARTIES
The following table shows our investment in related parties, at fair value:
|
|---|
| | December 31,
|
|---|
(Dollars in thousands)
| | 2006
| | 2005
|
|---|
|
|---|
| Wynn Resorts, Limited Common Stock | | $ | 16,424 | | $ | 13,713 |
| Wynn Las Vegas LLC Bonds | | | 9,938 | | | 9,725 |
|
| Total | | $ | 26,362 | | $ | 23,438 |
|
Two of Zenith's Directors are also Directors of Wynn Resorts, Limited.
We sold shares of Wynn Resorts, Limited common stock in 2006 and 2005 and recognized gains of $6.1 million and $25.5 million, respectively.
NOTE 19
EXERCISE OF STOCK OPTIONS USING PREVIOUSLY ACQUIRED SHARES
An employee exercised his option to purchase from Zenith National a total of 1,198,500 shares of Zenith National's common stock in 2005 and 301,500 shares in 2004 at an exercise price of $15.75 per share using previously owned shares to pay the purchase price. In connection with the exercises in 2005, the employee arranged with us to withhold shares from the shares acquired upon exercise of the option as reimbursement of withholding taxes due.
The following table sets forth these transactions:
|
|---|
(Dollars and shares in thousands,
except per share data)
| | Sept.
2005
| | Feb.
2005
| | Mar.
2004
|
|---|
|
|---|
| Shares of common stock purchased | �� | | 268 | | | 931 | | | 301 |
| Exercise price per share | | $ | 15.75 | | $ | 15.75 | | $ | 15.75 |
| Aggregate exercise price | | $ | 4,219 | | $ | 14,657 | | $ | 4,748 |
Number of shares tendered by employee in lieu of cash
payment of aggregate exercise price | | | 99 | | | 432 | | | 182 |
| Number of shares withheld for withholding taxes due | | | 78 | | | 225 | | | |
| Value of shares tendered by employee in lieu of cash payment of aggregate exercise price | | $ | 4,219 | | $ | 14,657 | | $ | 4,748 |
| Value of shares withheld for withholding taxes due | | | 3,341 | | | 7,545 | | | |
|
These exercises of stock options had no net effect on cash or stockholders' equity in 2005 or 2004 because the increase in treasury stock for the shares tendered was offset by an increase in common stock and an increase in additional paid-in capital for the shares issued. The shares withheld by us in lieu of cash payment to reimburse us for withholding taxes decreased stockholders' equity by increasing treasury stock and decreasing cash.
85
NOTE 20
DISCONTINUED OPERATIONS — GAIN ON SALE OF REAL ESTATE SEGMENT
In 2002, we sold our home-building business and related real estate assets in Las Vegas, Nevada to MTH-Homes Nevada, Inc. ("MTH Nevada"), a wholly-owned subsidiary of Meritage Corporation.
In addition to the consideration received in 2002, we were entitled to receive 10% of MTH Nevada's pre-tax net income, subject to certain adjustments, for each of the twelve-month periods ending September 30, 2003, September 30, 2004 and September 30, 2005. We recorded additional gains under the earn-out provision of the sale agreement for all three twelve month periods, including $1.9 million ($1.3 million after tax) and $2.0 million ($1.3 million after tax) in 2005 and 2004, respectively. The amount received in 2005 was the last such payment under the earn-out provision.
NOTE 21
QUARTERLY FINANCIAL DATA AND COMMON STOCK PRICES (UNAUDITED)
Quarterly results for the years ended December 31, 2006 and 2005 were as follows:
|
|---|
| | 2006 Quarter Ended
|
|---|
(Dollars in thousands,
except per share data)
| | March
31
| | June
30
| | September
30
| | December
31
|
|---|
|
|---|
| Premiums earned | | $ | 254,426 | | $ | 239,484 | | $ | 229,636 | | $ | 220,671 |
| Net investment income | | | 24,732 | | | 26,273 | | | 27,494 | | | 27,795 |
| Realized gains on investments | | | 1,610 | | | 1,113 | | | 833 | | | 9,821 |
|
| Net income | | $ | 57,500 | | $ | 54,100 | | $ | 72,200 | | $ | 74,900 |
|
| Net income per common share: | | | | | | | | | | | | |
| | — basic | | $ | 1.56 | | $ | 1.46 | | $ | 1.95 | | $ | 2.02 |
| | — diluted | | | 1.55 | | | 1.46 | | | 1.94 | | | 2.01 |
|
Cash dividends declared
per common share | | $ | 0.28 | | $ | 0.28 | | $ | 0.35 | | $ | 0.35 |
|
|
|---|
| | 2005 Quarter Ended
|
|---|
(Dollars in thousands,
except per share data)
| | March
31
| | June
30
| | September
30
| | December
31
|
|---|
|
|---|
| Premiums earned | | $ | 285,717 | | $ | 296,780 | | $ | 301,302 | | $ | 294,901 |
| Net investment income | | | 17,131 | | | 19,051 | | | 20,550 | | | 22,468 |
| Realized gains on investments | | | 2,870 | | | 16,352 | | | 2,043 | | | 959 |
|
| Income from continuing operations | | | 39,300 | | | 46,400 | | | 21,747 | | | 49,000 |
|
| Gain on sale of discontinued real estate segment | | | | | | | | | 1,253 | | | |
|
| Net income | | $ | 39,300 | | $ | 46,400 | | $ | 23,000 | | $ | 49,000 |
|
| Net income per common share: | | | | | | | | | | | | |
| | — basic | | $ | 1.35 | | $ | 1.36 | | $ | 0.67 | | $ | 1.34 |
| | — diluted | | | 1.10 | | | 1.26 | | | 0.63 | | | 1.32 |
|
| Cash dividends declared per common share | | $ | 0.22 | | $ | 0.22 | | $ | 0.25 | | $ | 0.25 |
|
The following table shows the high and low common stock prices as reported by the New York Stock Exchange during each quarter for the past two years:
|
|---|
| | 2006
| | 2005
|
|---|
Quarter Ended
| | High
| | Low
| | High
| | Low
|
|---|
|
|---|
| March 31 | | $ | 55.30 | | $ | 45.11 | | $ | 34.87 | | $ | 30.65 |
| June 30 | | | 48.90 | | | 37.93 | | | 46.00 | | | 34.17 |
| September 30 | | | 41.73 | | | 36.14 | | | 48.99 | | | 40.90 |
| December 31 | | | 47.91 | | | 39.13 | | | 48.90 | | | 41.00 |
|
As of January 31, 2007, there were 199 registered holders of record of our common stock.
86
REPORT OF INDEPENDENT REGISTERED PUBLIC ACCOUNTING FIRM
To the Stockholders and Board of Directors of
Zenith National Insurance Corp.:
We have completed integrated audits of Zenith National Insurance Corp.'s consolidated financial statements and of its internal control over financial reporting as of December 31, 2006 in accordance with the standards of the Public Company Accounting Oversight Board (United States). Our opinions, based on our audits, are presented below.
Consolidated financial statements
In our opinion, the accompanying consolidated balance sheets and the related consolidated statements of operations, cash flows, stockholders' equity and comprehensive income present fairly, in all material respects, the financial position of Zenith National Insurance Corp. and subsidiaries (the "Company") at December 31, 2006 and 2005, and the results of their operations and their cash flows for each of the three years in the period ended December 31, 2006 in conformity with accounting principles generally accepted in the United States of America. These financial statements are the responsibility of the Company's management. Our responsibility is to express an opinion on these financial statements based on our audits. We conducted our audits of these statements in accordance with the standards of the Public Company Accounting Oversight Board (United States). Those standards require that we plan and perform the audit to obtain reasonable assurance about whether the financial statements are free of material misstatement. An audit of financial statements includes examining, on a test basis, evidence supporting the amounts and disclosures in the financial statements, assessing the accounting principles used and significant estimates made by management, and evaluating the overall financial statement presentation. We believe that our audits provide a reasonable basis for our opinion.
Internal control over financial reporting
Also, in our opinion, management's assessment, included in the accompanying Management's Report on Internal Control Over Financial Reporting, that the Company maintained effective internal control over financial reporting as of December 31, 2006 based on criteria established inInternal Control—Integrated Framework issued by the Committee of Sponsoring Organizations of the Treadway Commission (COSO), is fairly stated, in all material respects, based on those criteria. Furthermore, in our opinion, the Company maintained, in all material respects, effective internal control over financial reporting as of December 31, 2006, based on criteria established inInternal Control—Integrated Framework issued by the COSO. The Company's management is responsible for maintaining effective
87
REPORT OF INDEPENDENT REGISTERED PUBLIC ACCOUNTING FIRM (CONTINUED)
internal control over financial reporting and for its assessment of the effectiveness of internal control over financial reporting. Our responsibility is to express opinions on management's assessment and on the effectiveness of the Company's internal control over financial reporting based on our audit. We conducted our audit of internal control over financial reporting in accordance with the standards of the Public Company Accounting Oversight Board (United States). Those standards require that we plan and perform the audit to obtain reasonable assurance about whether effective internal control over financial reporting was maintained in all material respects. An audit of internal control over financial reporting includes obtaining an understanding of internal control over financial reporting, evaluating management's assessment, testing and evaluating the design and operating effectiveness of internal control, and performing such other procedures as we consider necessary in the circumstances. We believe that our audit provides a reasonable basis for our opinions.
A company's internal control over financial reporting is a process designed to provide reasonable assurance regarding the reliability of financial reporting and the preparation of financial statements for external purposes in accordance with generally accepted accounting principles. A company's internal control over financial reporting includes those policies and procedures that (i) pertain to the maintenance of records that, in reasonable detail, accurately and fairly reflect the transactions and dispositions of the assets of the company; (ii) provide reasonable assurance that transactions are recorded as necessary to permit preparation of financial statements in accordance with generally accepted accounting principles, and that receipts and expenditures of the company are being made only in accordance with authorizations of management and directors of the company; and (iii) provide reasonable assurance regarding prevention or timely detection of unauthorized acquisition, use, or disposition of the company's assets that could have a material effect on the financial statements.
Because of its inherent limitations, internal control over financial reporting may not prevent or detect misstatements. Also, projections of any evaluation of effectiveness to future periods are subject to the risk that controls may become inadequate because of changes in conditions, or that the degree of compliance with the policies or procedures may deteriorate.

Los Angeles, California
February 16, 2007
88
CERTIFICATIONS, EVALUATION OF DISCLOSURE CONTROLS AND PROCEDURES AND
MANAGEMENT'S REPORT ON INTERNAL CONTROL OVER FINANCIAL REPORTING
For readers of this Annual Report we furnish on the following pages the certifications, the Evaluation of Disclosure Controls and Procedures and Management's Report on Internal Control Over Financial Reporting that we include in our Annual Report on Form 10-K. We also include a statement about our Chief Executive Officer's certification to the New York Stock Exchange.
CERTIFICATION OF CHIEF EXECUTIVE OFFICER PURSUANT TO EXCHANGE ACT RULE 13a-14(a) OR RULE 15d-14(a)
I, Stanley R. Zax, certify that:
- 1.
- I have reviewed this Annual Report on Form 10-K of Zenith National Insurance Corp.;
- 2.
- Based on my knowledge, this report does not contain any untrue statement of a material fact or omit to state a material fact necessary to make the statements made, in light of the circumstances under which such statements were made, not misleading with respect to the period covered by this report;
- 3.
- Based on my knowledge, the financial statements, and other financial information included in this report, fairly present in all material respects the financial condition, results of operations and cash flows of the registrant as of, and for, the periods presented in this report;
- 4.
- The registrant's other certifying officer and I are responsible for establishing and maintaining disclosure controls and procedures (as defined in Exchange Act Rules 13a-15(e) and 15d-15(e)) and internal control over financial reporting (as defined in Exchange Act Rules 13a-15(f) and 15d-15(f)) for the registrant and have:
- (a)
- Designed such disclosure controls and procedures, or caused such disclosure controls and procedures to be designed under our supervision, to ensure that material information relating to the registrant, including its consolidated subsidiaries, is made known to us by others within those entities, particularly during the period in which this report is being prepared;
- (b)
- Designed such internal control over financial reporting, or caused such internal control over financial reporting to be designed under our supervision, to provide reasonable assurance regarding the reliability of financial reporting and the preparation of financial statements for external purposes in accordance with generally accepted accounting principles;
- (c)
- Evaluated the effectiveness of the registrant's disclosure controls and procedures and presented in this report our conclusions about the effectiveness of the disclosure controls and procedures, as of the end of the period covered by this report based on such evaluation; and
- (d)
- Disclosed in this report any change in the registrant's internal control over financial reporting that occurred during the registrant's most recent fiscal quarter (the registrant's fourth fiscal quarter in the case of an annual report) that has materially affected, or is reasonably likely to materially affect, the registrant's internal control over financial reporting; and
- 5.
- The registrant's other certifying officer and I have disclosed, based on our most recent evaluation of internal control over financial reporting, to the registrant's auditors and the audit committee of the registrant's board of directors (or persons performing the equivalent functions):
- (a)
- All significant deficiencies and material weaknesses in the design or operation of internal control over financial reporting which are reasonably likely to adversely affect the registrant's ability to record, process, summarize and report financial information; and
- (b)
- Any fraud, whether or not material, that involves management or other employees who have a significant role in the registrant's internal control over financial reporting.
| Date: February 16, 2007 | | |
| | | Chairman of the Board and President (Chief Executive Officer) Zenith National Insurance Corp. |
89
CERTIFICATION OF CHIEF FINANCIAL OFFICER PURSUANT TO EXCHANGE ACT RULE 13a-14a(a)
OR RULE 15d-14(a)
I, Kari L. Van Gundy, certify that:
- 1.
- I have reviewed this Annual Report on Form 10-K of Zenith National Insurance Corp.;
- 2.
- Based on my knowledge, this report does not contain any untrue statement of a material fact or omit to state a material fact necessary to make the statements made, in light of the circumstances under which such statements were made, not misleading with respect to the period covered by this report;
- 3.
- Based on my knowledge, the financial statements, and other financial information included in this report, fairly present in all material respects the financial condition, results of operations and cash flows of the registrant as of, and for, the periods presented in this report;
- 4.
- The registrant's other certifying officer and I are responsible for establishing and maintaining disclosure controls and procedures (as defined in Exchange Act Rules 13a-15(e) and 15d-15(e)) and internal control over financial reporting (as defined in Exchange Act Rules 13a-15(f) and 15d-15(f)) for the registrant and have:
- (a)
- Designed such disclosure controls and procedures, or caused such disclosure controls and procedures to be designed under our supervision, to ensure that material information relating to the registrant, including its consolidated subsidiaries, is made known to us by others within those entities, particularly during the period in which this report is being prepared;
- (b)
- Designed such internal control over financial reporting, or caused such internal control over financial reporting to be designed under our supervision, to provide reasonable assurance regarding the reliability of financial reporting and the preparation of financial statements for external purposes in accordance with generally accepted accounting principles;
- (c)
- Evaluated the effectiveness of the registrant's disclosure controls and procedures and presented in this report our conclusions about the effectiveness of the disclosure controls and procedures, as of the end of the period covered by this report based on such evaluation; and
- (d)
- Disclosed in this report any change in the registrant's internal control over financial reporting that occurred during the registrant's most recent fiscal quarter (the registrant's fourth fiscal quarter in the case of an annual report) that has materially affected, or is reasonably likely to materially affect, the registrant's internal control over financial reporting; and
- 5.
- The registrant's other certifying officer and I have disclosed, based on our most recent evaluation of internal control over financial reporting, to the registrant's auditors and the audit committee of the registrant's board of directors (or persons performing the equivalent functions):
- (a)
- All significant deficiencies and material weaknesses in the design or operation of internal control over financial reporting which are reasonably likely to adversely affect the registrant's ability to record, process, summarize and report financial information; and
- (b)
- Any fraud, whether or not material, that involves management or other employees who have a significant role in the registrant's internal control over financial reporting.
| Date: February 16, 2007 | |  |
| | | Senior Vice President & Chief Financial Officer
Zenith National Insurance Corp. |
90
CERTIFICATION OF CHIEF EXECUTIVE OFFICER AND CHIEF FINANCIAL OFFICER PURSUANT TO 18 U.S.C. SECTION 1350, AS ADOPTED PURSUANT TO SECTION 906 OF THE SARBANES-OXLEY ACT OF 2002
In connection with the Annual Report on Form 10-K of Zenith National Insurance Corp. ("Company") for the year ended December 31, 2006, as filed with the Securities and Exchange Commission on the date hereof ("Report"), Stanley R. Zax, as Chief Executive Officer of the Company, and Kari L. Van Gundy, as Chief Financial Officer of the Company, each hereby certifies, pursuant to 18 U.S.C. §1350, as adopted pursuant to §906 of the Sarbanes-Oxley Act of 2002, that, to the best of his knowledge:
- (1)
- The Report fully complies with the requirements of Section 13(a) or 15(d) of the Securities Exchange Act of 1934; and
- (2)
- The information contained in the Report fairly presents, in all material respects, the financial condition and results of operations of the Company.
Date: February 16, 2007
| | |
Chairman of the Board and President
(Chief Executive Officer) | | Chief Financial Officer |
EVALUATION OF DISCLOSURE CONTROLS AND PROCEDURES
Our management, with the participation of our Chief Executive Officer and Chief Financial Officer, has evaluated the effectiveness of our disclosure controls and procedures (as such term is defined in Rules 13a-15(e) and 15d-15(e) under the Securities Exchange Act of 1934, as amended ("Exchange Act")) as of the end of the period covered by this report. Based on such evaluation, our Chief Executive Officer and Chief Financial Officer have concluded that, as of the end of such period, our disclosure controls and procedures are effective in recording, processing, summarizing and reporting, on a timely basis, information required to be disclosed by us in the reports that we file or submit under the Exchange Act and are effective in ensuring that information required to be disclosed by us in the reports that we file or submit under the Exchange Act is accumulated and communicated to our management, including our Chief Executive Officer and Chief Financial Officer, as appropriate to allow timely decisions regarding required disclosure.
MANAGEMENT'S REPORT ON INTERNAL CONTROL OVER FINANCIAL REPORTING
Our management is responsible for establishing and maintaining adequate internal control over financial reporting, as such term is defined in Exchange Act Rules 13a-15(f) or 15d-15(f). Under the supervision and with the participation of our management, including our principal executive officer and principal financial officer, we conducted an evaluation of the effectiveness of our internal control over financial reporting based on the criteria set forth by the Committee of Sponsoring Organizations of the Treadway Commission inInternal Control—Integrated Framework. Based on our evaluation, our management concluded that our internal control over financial reporting was effective as of December 31, 2006.
Our management's assessment of the effectiveness of our internal control over financial reporting as of December 31, 2006 has been audited by PricewaterhouseCoopers LLP, an independent registered public accounting firm, as stated in their report which is included herein.
91
CHANGES IN INTERNAL CONTROL OVER FINANCIAL REPORTING
There have not been any changes in our internal control over financial reporting (as such term is defined in Rules 13a-15(f) and 15d-15(f) under the Exchange Act) during the fourth quarter that have materially affected, or are reasonably likely to materially affect, our internal control over financial reporting.
NEW YORK STOCK EXCHANGE CORPORATE GOVERNANCE LISTING STANDARDS
Zenith National is listed on the New York Stock Exchange. As required by Section 303A.12(a) of the New York Stock Exchange Listed Company Manual, Mr. Zax, as the Chief Executive Officer of Zenith, certified on May 31, 2006, that he was not aware of any violation by Zenith of NYSE Corporate Governance listing standards as of such date.
92
CORPORATE DIRECTORY
ZENITH NATIONAL INSURANCE CORP.
ZENITH INSURANCE COMPANY
CORPORATE DIRECTORY
ZENITH NATIONAL INSURANCE CORP.
DIRECTORS
Also Directors of
Zenith Insurance Company
Max M. Kampelman
Attorney; Of Counsel,
Fried, Frank, Harris,
Shriver & Jacobson LLP
Robert J. Miller
Attorney; Principal,
Dutko Worldwide
Leon E. Panetta
Founder and Director,
The Leon & Sylvia Panetta
Institute for Public Policy
Catherine B. Reynolds
Chairman and CEO
The Catherine B. Reynolds Foundation
Alan I. Rothenberg
Attorney; Chairman, First
Century Bank N.A.;
Retired Partner,
Latham & Watkins LLP
William S. Sessions
Attorney,
Holland & Knight LLP
and Security Consultant
Gerald Tsai, Jr.
Management of
Private Investments
Michael Wm. Zavis
Attorney; Retired Founding Partner,
Katten Muchin Zavis Rosenman
Stanley R. Zax
Chairman of the Board
and President
EXECUTIVE OFFICERS
Stanley R. Zax
Chairman of the
Board and President
Michael E. Jansen
Executive Vice President
and General Counsel
Jack D. Miller
Executive Vice President
Davidson M. Pattiz
Executive Vice President
Keith E. Trotman
Executive Vice President
Robert E. Meyer
Senior Vice President
Kari L. Van Gundy
Senior Vice President,
Chief Financial Officer,
Treasurer and Assistant Secretary
OFFICER
Hyman J. Lee Jr.
Vice President, Assistant General
Counsel and Secretary
TRANSFER AGENT-
COMMON STOCK
Mellon Investor Services LLC
Newport Office Center VII
480 Washington Blvd.
Jersey City, NJ 07310
www.melloninvestor.com
TRANSFER AGENT-
8.55% CAPITAL SECURITIES
Wells Fargo Corporate Trust Services
Wells Fargo Bank, National Association
Minneapolis, MN
TRANSFER AGENT-
5.75% CONVERTIBLE SENIOR NOTES
Wells Fargo Corporate Trust Services
Wells Fargo Bank, National Association
Minneapolis, MN
CORPORATE
HEADQUARTERS
21255 Califa Street
Woodland Hills, CA 91367
(818) 713-1000
NYSE TRADING SYMBOL
COMMON STOCK — ZNT
INDEPENDENT REGISTERED
PUBLIC ACCOUNTING FIRM
PricewaterhouseCoopers LLP
Los Angeles, CA
THE ANNUAL REPORT
on Form 10-K for the year ended December 31, 2006, quarterly
reports on Form 10-Q, current
reports on Form 8-K and all
amendments to these reports may
be obtained at our website at www.thezenith.com or free of
charge upon written request to:
Chief Financial Officer
Zenith National Insurance Corp.
21255 Califa Street
Woodland Hills, CA 91367
WEBSITE
www.thezenith.com
94
CORPORATE DIRECTORY
ZENITH INSURANCE COMPANY
OFFICERS
Stanley R. Zax
Chairman of the Board
and Chief Executive Officer
Jack D. Miller
President
and Chief Operating Officer
A. Mary Ames
Executive Vice President
Eden M. Feder
Executive Vice President
John C. Hasbrouck
Executive Vice President
Michael E. Jansen
Executive Vice President and
General Counsel
Robert E. Meyer
Executive Vice President
and Chief Actuary
Davidson M. Pattiz
Executive Vice President
Bernyce M. Peplowski
Executive Vice President
Keith E. Trotman
Executive Vice President
Kari L. Van Gundy
Executive Vice President,
Chief Financial Officer and Treasurer
Stephen J. Albers
Senior Vice President
Bryan A. Anderson
Senior Vice President
Linda J. Carmody
Senior Vice President
Jason T. Clarke
Senior Vice President
Anita Devan
Senior Vice President
Robert L. Hernandez
Senior Vice President
Westley M. Heyward
Senior Vice President
Fred A. Hunt
Senior Vice President
Corey A. Ingber
Senior Vice President
Jonathan W. Lindsay
Senior Vice President
James S. Lubman
Senior Vice President
Robert J. Peters
Senior Vice President
Richard B. Riddle
Senior Vice President
Chris L. Uselton
Senior Vice President
John H. Weber
Senior Vice President
Glen R. Zepnick
Senior Vice President
Rhen C. Bass
Vice President
Brian R. Beams
Vice President
Jeffrey J. Beaudoin
Vice President
Kathleen M. Burns
Vice President
Suzanne M. Chapan
Vice President
Duane H. Chernow
Vice President
Douglas A. Claman
Vice President
Gerald D. Curtin
Vice President
Charles J. Davis
Vice President
Bradley C. Eastwood
Vice President
J. Rae Farese
Vice President
Gary P. Fore
Vice President
Stephen T. Frye
Vice President
Antonio Gaitan
Vice President
Michael B. Gillikin
Vice President
Jackie C. Hilston
Vice President
Carolyn N. Hinson
Vice President
Daniel W. Huckemeyer
Vice President
Mark M. Jansen
Vice President
Mark A. Koman
Vice President
Gerald F. Ladner
Vice President
Steven M. Larson
Vice President
Hyman J. Lee Jr.
Vice President, Assistant General
Counsel and Secretary
Jenny S. Lewis
Vice President
Esther Liu
Vice President
Donald C. Marshall
Vice President
Thomas M. McCarthy
Vice President
Michael R. McFadden
Vice President
Timothy I. Mertz
Vice President
Colin S. Mitchell
Vice President
Mahtab Moayedi
Vice President
David J. Oberg
Vice President
David A. O'Connor
Vice President
Charlene C. Ossler
Vice President
David C. Park
Vice President and Assistant
General Counsel
Scott G. Perrotty
Vice President
S. Daniel Petrula
Vice President
Tracy S. Pletcher
Vice President
Steven M. Rothman
Vice President
Scott M. Sandler
Vice President
Jay S. Schwanz
Vice President
Marcia T. Shafer
Vice President
Alan I. Steinhardt
Vice President
95
CORPORATE DIRECTORY
ZENITH OFFICE LOCATIONS
LOS ANGELES, CA
Corporate Headquarters
and Los Angeles Regional Office
21255 Califa Street
Woodland Hills, CA 91367
(818) 713-1000
www.thezenith.com
FRESNO, CA
7440 N. Palm Avenue
Suite 103
Fresno, CA 93711
(800) 508-9910
GLENDALE, CA
700 North Brand Blvd.
7th Floor
Glendale, CA 91203
(818) 502-7500
ORANGE, CA
790 The City Drive South
Suite 300
Orange, CA 92868
(714) 705-2300
PLEASANTON, CA
4309 Hacienda Drive
Suite 200
Pleasanton, CA 94588
(925) 460-0600
SACRAMENTO, CA
1601 Response Road
Suite 200
Sacramento, CA 95815
(916) 614-3140
SAN DIEGO, CA
7676 Hazard Center Drive
Suite 1200
San Diego, CA 92108
(619) 299-6252
SAN FRANCISCO, CA
425 California Street
Suite 1010
San Francisco, CA 94104
(415) 986-0187
SANTA CRUZ, CA
1200 Pacific Avenue
Suite 310
Santa Cruz, CA 95060
(831) 460-7700
SOLANA BEACH, CA
420 Stevens Ave.
Suite 300
Solana Beach, CA 92075
(858) 509-6100
AUSTIN, TX
1101 South Capitol of Texas Hwy.
Bldg. J
Austin, TX 78746
(512) 306-1700
LISLE, IL
701 Warrenville Road
Suite 300
Lisle, IL 60532
(630) 353-7300
SPRINGFIELD, IL
2105 W. White Oaks Drive
Springfield, IL 62704
(217) 726-2900
BLUE BELL, PA
2 Valley Square
Suite 301
Blue Bell, PA 19422
(877) 311-0703
BIRMINGHAM, AL
10 Inverness Center Parkway
Suite 220
Birmingham, AL 35242
(800) 355-0708
HOLLYWOOD, FL
4000 Hollywood Blvd.
Suite 465
South Hollywood, FL 33021
(954) 983-1200
ORLANDO, FL
3504 Lake Lynda Drive
Suite 200
Orlando, FL 32817
(800) 999-3242
SARASOTA, FL
1390 Main Street
Sarasota, FL 34236
(800) 226-2324
CHARLOTTE, NC
900 W. Trade Street
Suite 600
Charlotte, NC 28202
(800) 200-2667
96