Exhibit 99.1
Slide Presentation

Link to searchable text of slide shown above
Link to searchable text of slide shown above
Link to searchable text of slide shown above
Link to searchable text of slide shown above
Link to searchable text of slide shown above
Link to searchable text of slide shown above

Link to searchable text of slide shown above
Link to searchable text of slide shown above

Link to searchable text of slide shown above

Link to searchable text of slide shown above
Link to searchable text of slide shown above
Link to searchable text of slide shown above
Link to searchable text of slide shown above
Link to searchable text of slide shown above

Link to searchable text of slide shown above

Link to searchable text of slide shown above
Link to searchable text of slide shown above
Link to searchable text of slide shown above
Link to searchable text of slide shown above
Link to searchable text of slide shown above
Link to searchable text of slide shown above
Searchable text section of graphics shown above
Cautionary Statement
Private Securities Litigation Reform Act Safe Harbor Statement
The Private Securities Litigation Reform Act of 1995 provides a safe harbor for forward-looking statements if accompanied by meaningful cautionary statements identifying important factors that could cause actual results to differ materially from those discussed. Forward-looking statements include those related to the plans and objectives of management for future operations, future economic performance, or projections of revenues, income, earnings per share, capital expenditures, dividends, capital structure, or other financial items.
Statements containing words such as expect, anticipate, believe, estimate, or similar words that are used in the accompanying materials or oral information conveyed by or on behalf of Zenith are intended to identify forward-looking statements. Such forward-looking statements are subject to a number of risks and uncertainties that could cause actual results to differ materially from those projected. These risks and uncertainties include, but are not limited to, the following:
(1) competition;
(2) adverse state and federal legislation and regulation;
(3) changes in interest rates causing fluctuations of investment income and fair values of investments;
(4) changes in the frequency and severity of claims and catastrophes;
(5) adequacy of loss reserves;
(6) changing environment for controlling medical, legal and rehabilitation costs, as well as fraud and abuse;
(7) losses associated with any terrorist attacks that impact our workers’ compensation business in excess of our reinsurance protection; and
(8) other risks detailed in Zenith’s Annual Report on Form 10-K/A for the year ended December 31, 2003 and other reports and filings with the Securities and Exchange Commission.
Zenith disclaims any obligation or intention to publicly update or revise any of the forward-looking statements contained in these materials.
[LOGO]
2
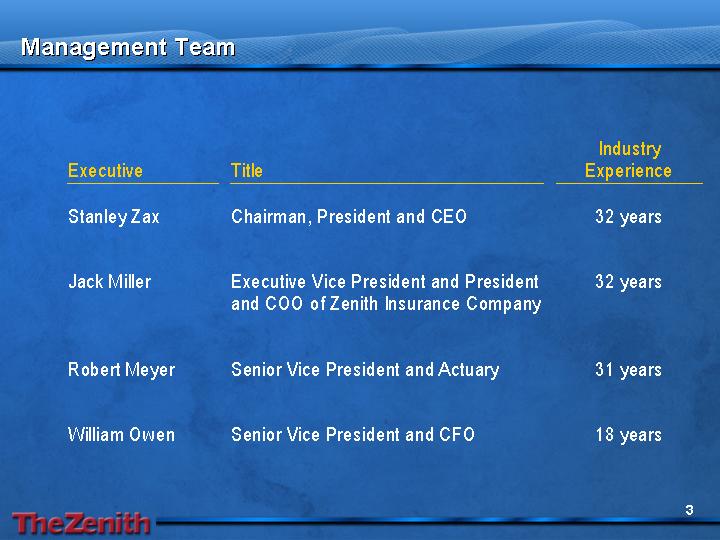
Management Team
Executive |
| Title |
| Industry |
|
|
|
|
|
|
|
Stanley Zax |
| Chairman, President and CEO |
| 32 years |
|
|
|
|
|
|
|
Jack Miller |
| Executive Vice President and President and COO of Zenith Insurance Company |
| 32 years |
|
|
|
|
|
|
|
Robert Meyer |
| Senior Vice President and Actuary |
| 31 years |
|
|
|
|
|
|
|
William Owen |
| Senior Vice President and CFO |
| 18 years |
|
[LOGO]
3
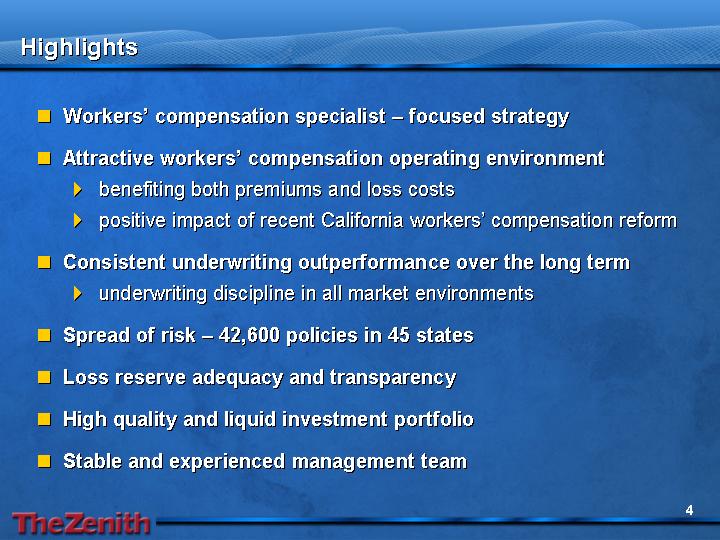
Highlights
• Workers’ compensation specialist – focused strategy
• Attractive workers’ compensation operating environment
• benefiting both premiums and loss costs
• positive impact of recent California workers’ compensation reform
• Consistent underwriting outperformance over the long term
• underwriting discipline in all market environments
• Spread of risk – 42,600 policies in 45 states
• Loss reserve adequacy and transparency
• High quality and liquid investment portfolio
• Stable and experienced management team
[LOGO]
4
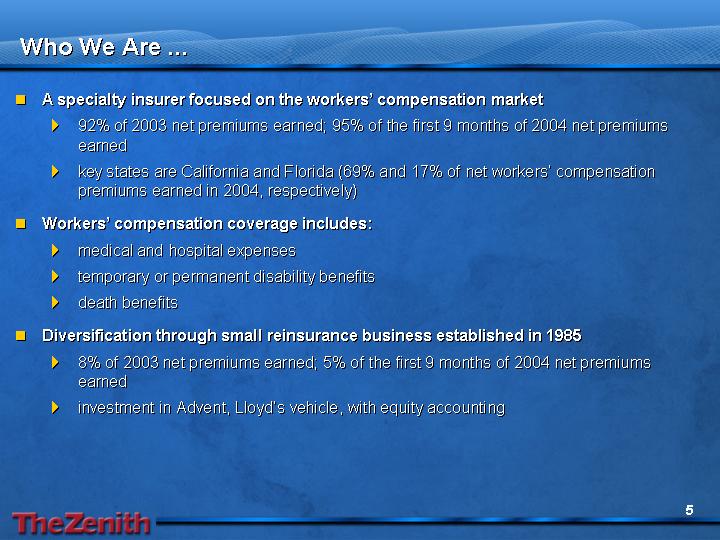
Who We Are ...
• A specialty insurer focused on the workers’ compensation market
• 92% of 2003 net premiums earned; 95% of the first 9 months of 2004 net premiums earned
• key states are California and Florida (69% and 17% of net workers’ compensation premiums earned in 2004, respectively)
• Workers’ compensation coverage includes:
• medical and hospital expenses
• temporary or permanent disability benefits
• death benefits
• Diversification through small reinsurance business established in 1985
• 8% of 2003 net premiums earned; 5% of the first 9 months of 2004 net premiums earned
• investment in Advent, Lloyd’s vehicle, with equity accounting
[LOGO]
5
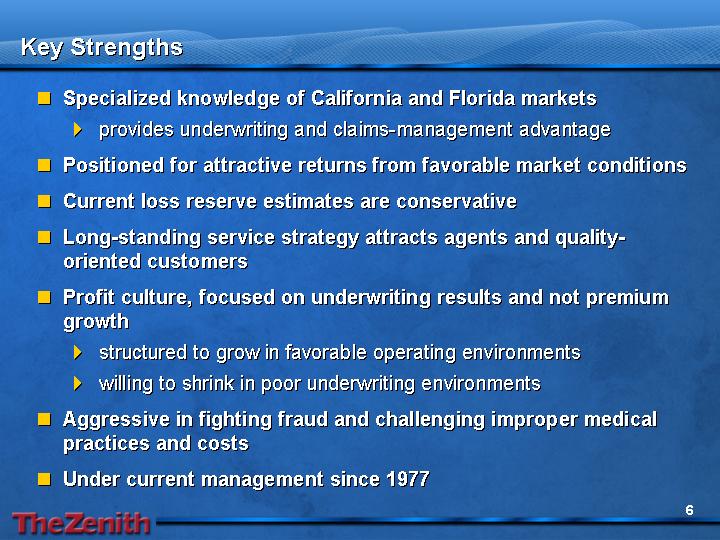
Key Strengths
• Specialized knowledge of California and Florida markets
• provides underwriting and claims-management advantage
• Positioned for attractive returns from favorable market conditions
• Current loss reserve estimates are conservative
• Long-standing service strategy attracts agents and quality-oriented customers
• Profit culture, focused on underwriting results and not premium growth
• structured to grow in favorable operating environments
• willing to shrink in poor underwriting environments
• Aggressive in fighting fraud and challenging improper medical practices and costs
• Under current management since 1977
[LOGO]
6
Overview of Business Mix
Net Premiums Earned
[CHART]
Geographic Profile of Workers’
Compensation (2003 Net Premiums
Earned)
[CHART]
[LOGO]
7
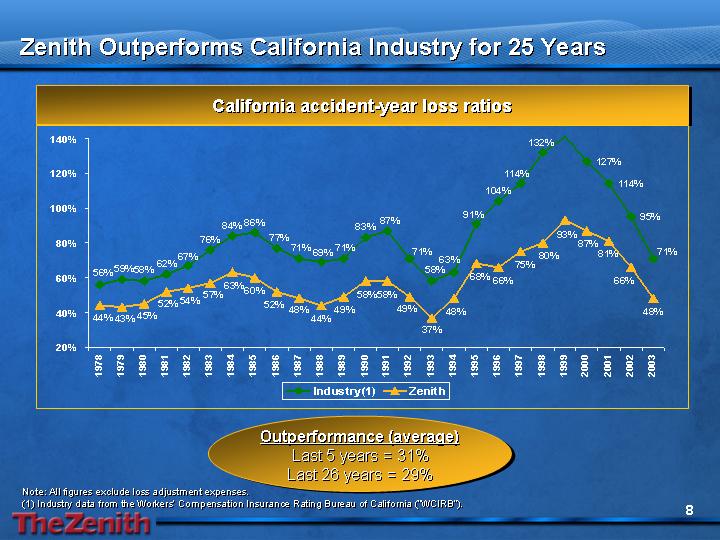
Zenith Outperforms California Industry for 25 Years
California accident-year loss ratios
[CHART]
Outperformance (average)
Last 5 years = 31%
Last 26 years = 29%
Note: All figures exclude loss adjustment expenses.
(1) Industry data from the Workers’ Compensation Insurance Rating Bureau of California (“WCIRB”).
[LOGO]
8
California Workers’ Compensation Reform
Recent legislative changes continue to support an attractive
operating environment
• Ambitious overhaul of California workers’ compensation system
• Major legislative reforms enacted in September 2003 and April 2004
• aimed at reducing costs and improving fairness in the system
• expected to improve trend of cost increases over time
• certain provisions do not become effective until January 2005, the most important of which is medical networks
• full impact expected to occur over several years
• California continues as a non-regulated environment for pricing
[LOGO]
9
Impact of California Workers’ Compensation Reform
Zenith is taking a gradual and measured response to estimating
the impact of legislative reforms
Reform |
| WCIRB Estimated |
|
Elimination of Vocational Rehabilitation |
| (5 | )% |
Outpatient Surgery Center Fees |
| (4 | )% |
Limits on Chiropractors and Physical Therapists |
| (4 | )% |
Limits on Temporary Disability |
| (2 | )% |
Apportionment of Permanent disability |
| (3 | )% |
Medical Treatment Guidelines, Elimination of Treating Physician Presumption |
| (10 | )% |
Total Estimated Savings |
| (28 | )% |
• In contrast, Zenith filed for a 10% reduction in premium rates, effective 7/1/04
• California Insurance Commissioner publicly criticized Zenith rate reduction as too cautious
[LOGO]
10
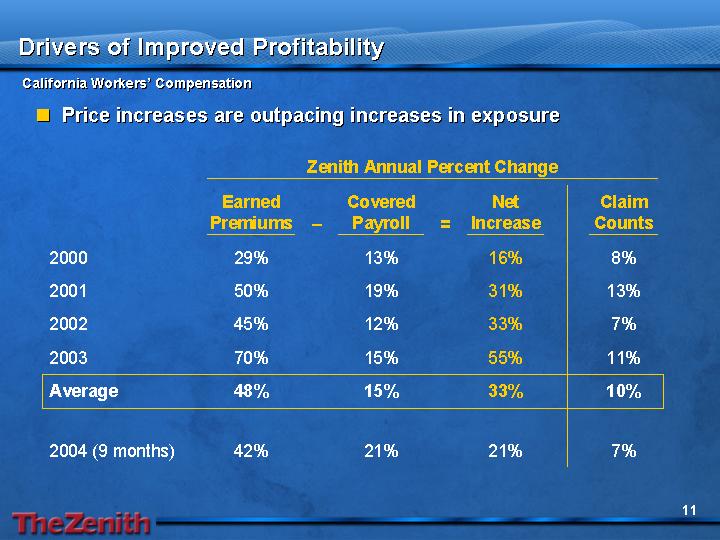
Drivers of Improved Profitability
California Workers’ Compensation
• Price increases are outpacing increases in exposure
|
| Zenith Annual Percent Change |
| ||||||
|
| Earned | - | Covered | = | Net |
| Claim |
|
2000 |
| 29 | % | 13 | % | 16 | % | 8 | % |
2001 |
| 50 | % | 19 | % | 31 | % | 13 | % |
2002 |
| 45 | % | 12 | % | 33 | % | 7 | % |
2003 |
| 70 | % | 15 | % | 55 | % | 11 | % |
Average |
| 48 | % | 15 | % | 33 | % | 10 | % |
|
|
|
|
|
|
|
|
|
|
2004 (9 months) |
| 42 | % | 21 | % | 21 | % | 7 | % |
[LOGO]
11
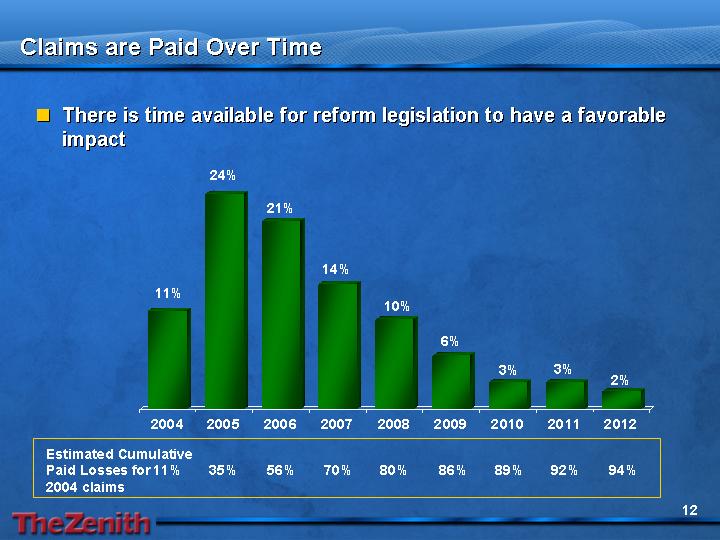
Claims are Paid Over Time
• There is time available for reform legislation to have a favorable impact
[CHART]
[LOGO]
12
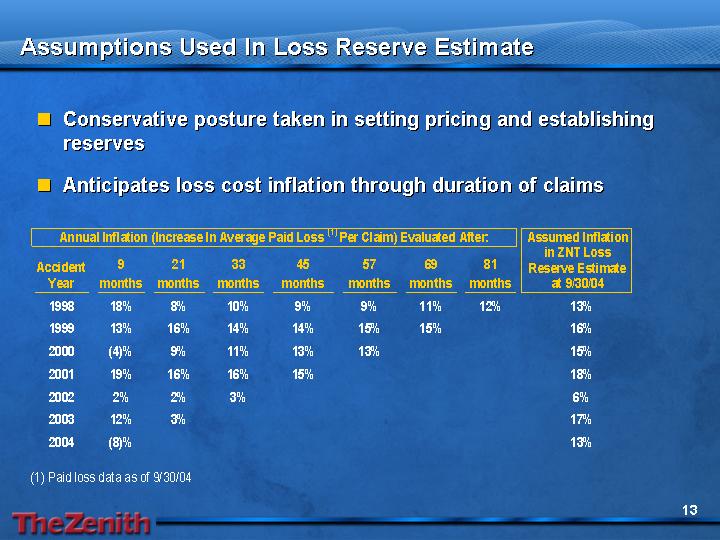
Assumptions Used In Loss Reserve Estimate
• Conservative posture taken in setting pricing and establishing reserves
• Anticipates loss cost inflation through duration of claims
|
| Assumed Inflation |
| ||||||||||||||
Annual Inflation (Increase In Average Paid Loss (1) Per Claim) Evaluated After: |
| in ZNT Loss |
| ||||||||||||||
Accident |
| 9 |
| 21 |
| 33 |
| 45 |
| 57 |
| 69 |
| 81 |
| Reserve Estimate |
|
Year |
| months |
| months |
| months |
| months |
| months |
| months |
| months |
| at 9/30/04 |
|
1998 |
| 18 | % | 8 | % | 10 | % | 9 | % | 9 | % | 11 | % | 12 | % | 13 | % |
1999 |
| 13 | % | 16 | % | 14 | % | 14 | % | 15 | % | 15 | % |
|
| 16 | % |
2000 |
| (4 | )% | 9 | % | 11 | % | 13 | % | 13 | % |
|
|
|
| 15 | % |
2001 |
| 19 | % | 16 | % | 16 | % | 15 | % |
|
|
|
|
|
| 18 | % |
2002 |
| 2 | % | 2 | % | 3 | % |
|
|
|
|
|
|
|
| 6 | % |
2003 |
| 12 | % | 3 | % |
|
|
|
|
|
|
|
|
|
| 17 | % |
2004 |
| (8 | )% |
|
|
|
|
|
|
|
|
|
|
|
| 13 | % |
(1) Paid loss data as of 9/30/04
[LOGO]
13
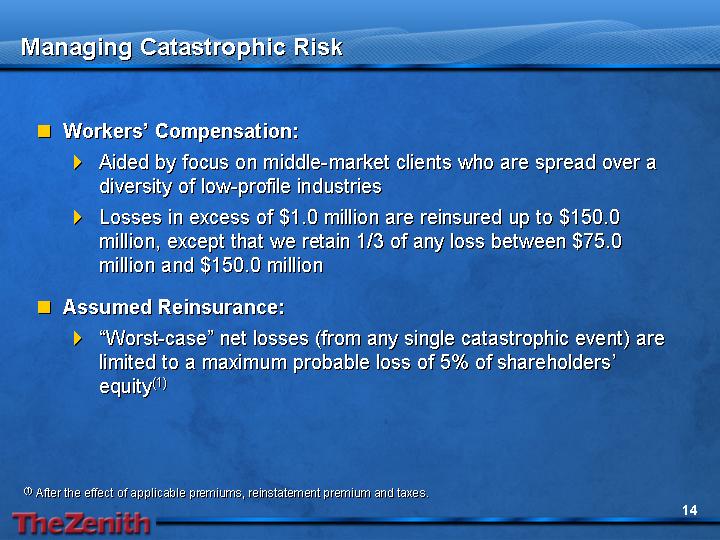
Managing Catastrophic Risk
• Workers’ Compensation:
• Aided by focus on middle-market clients who are spread over a diversity of low-profile industries
• Losses in excess of $1.0 million are reinsured up to $150.0 million, except that we retain 1/3 of any loss between $75.0 million and $150.0 million
• Assumed Reinsurance:
• “Worst-case” net losses (from any single catastrophic event) are limited to a maximum probable loss of 5% of shareholders’ equity(1)
(1) After the effect of applicable premiums, reinstatement premium and taxes.
[LOGO]
14
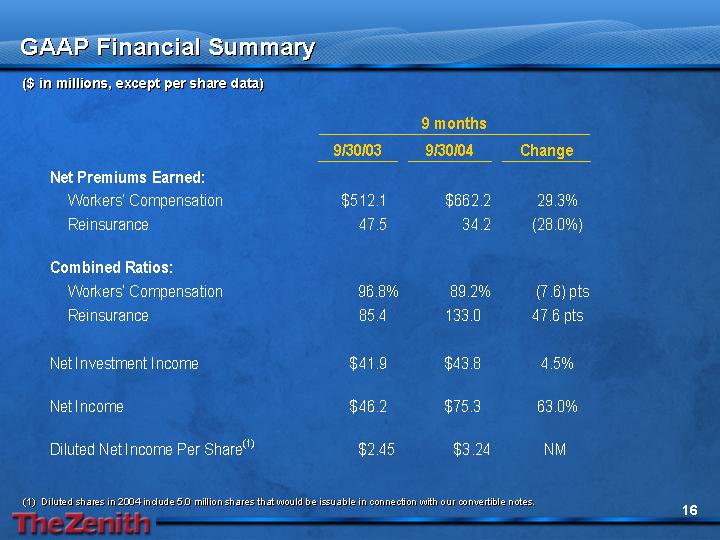
GAAP Financial Summary
($ in millions, except per share data)
|
| 2002 |
| 2003 |
| change |
| ||
Net Premiums Earned: |
|
|
|
|
|
|
| ||
Workers’ Compensation |
| $ | 503.9 |
| $ | 712.8 |
| 41.5 | % |
Reinsurance |
| 53.2 |
| 61.0 |
| 14.7 | % | ||
|
|
|
|
|
|
|
| ||
Combined Ratios: |
|
|
|
|
|
|
| ||
Workers’ Compensation |
| 108.7 | % | 95.9 | % | (12.8 | )pts | ||
Reinsurance |
| 85.6 |
| 84.3 |
| (1.3 | )pts | ||
|
|
|
|
|
|
|
| ||
Net Investment Income |
| $ | 48.8 |
| $ | 56.1 |
| 15.0 | % |
|
|
|
|
|
|
|
| ||
Net Income |
| $ | 10.2 |
| $ | 67.0 |
| NM |
|
|
|
|
|
|
|
|
| ||
Diluted Net Income per Share(1) |
| $ | 0.54 |
| $ | 3.38 |
| NM |
|
(1) Diluted shares in 2003 include an additional 1.25 million for the inclusion of 5.0 million shares during the fourth quarter that would be issuable in connection with our convertible notes.
[LOGO]
15
|
| 9 months |
| ||||||
|
| 9/30/03 |
| 9/30/04 |
| Change |
| ||
Net Premiums Earned: |
|
|
|
|
|
|
| ||
Workers’ Compensation |
| $ | 512.1 |
| $ | 662.2 |
| 29.3 | % |
Reinsurance |
| 47.5 |
| 34.2 |
| (28.0 | )% | ||
|
|
|
|
|
|
|
| ||
Combined Ratios: |
|
|
|
|
|
|
| ||
Workers’ Compensation |
| 96.8 | % | 89.2 | % | (7.6 | )pts | ||
Reinsurance |
| 85.4 |
| 133.0 |
| 47.6 | pts | ||
|
|
|
|
|
|
|
| ||
Net Investment Income |
| $ | 41.9 |
| $ | 43.8 |
| 4.5 | % |
|
|
|
|
|
|
|
| ||
Net Income |
| $ | 46.2 |
| $ | 75.3 |
| 63.0 | % |
|
|
|
|
|
|
|
| ||
Diluted Net Income Per Share(1) |
| $ | 2.45 |
| $ | 3.24 |
| NM |
|
(1) Diluted shares in 2004 include 5.0 million shares that would be issuable in connection with our convertible notes.
[LOGO]
16
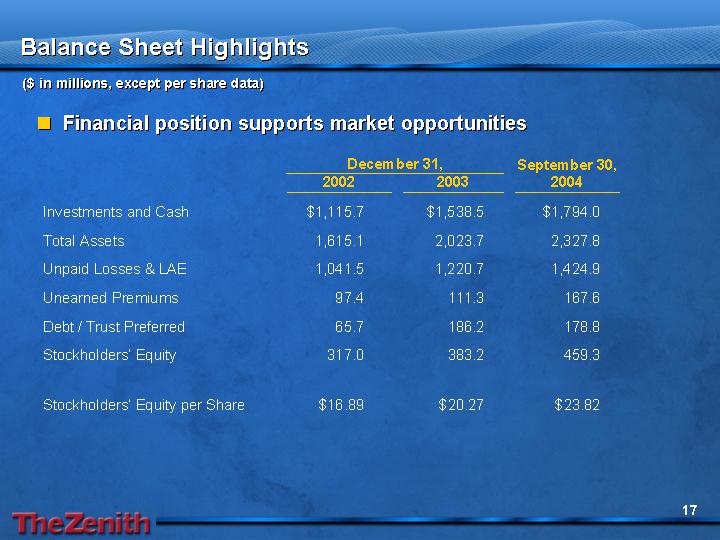
Balance Sheet Highlights
($ in millions, except per share data)
• Financial position supports market opportunities
|
| December 31, |
| September 30, |
| |||||
|
| 2002 |
| 2003 |
| 2004 |
| |||
Investments and Cash |
| $ | 1,115.7 |
| $ | 1,538.5 |
| $ | 1,794.0 |
|
Total Assets |
| 1,615.1 |
| 2,023.7 |
| 2,327.8 |
| |||
Unpaid Losses & LAE |
| 1,041.5 |
| 1,220.7 |
| 1,424.9 |
| |||
Unearned Premiums |
| 97.4 |
| 111.3 |
| 167.6 |
| |||
Debt / Trust Preferred |
| 65.7 |
| 186.2 |
| 178.8 |
| |||
Stockholders’ Equity |
| 317.0 |
| 383.2 |
| 459.3 |
| |||
|
|
|
|
|
|
|
| |||
Stockholders’ Equity per Share |
| $ | 16.89 |
| $ | 20.27 |
| $ | 23.82 |
|
[LOGO]
17
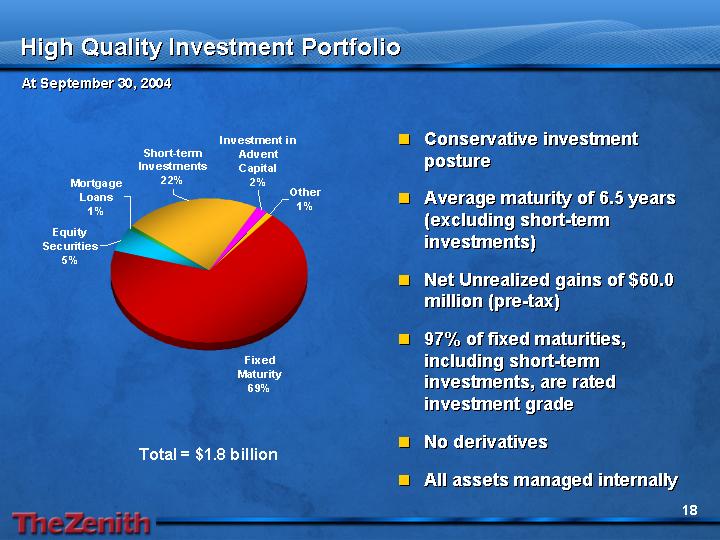
High Quality Investment Portfolio
At September 30, 2004
[CHART]
• Conservative investment posture
• Average maturity of 6.5 years (excluding short-term investments)
• Net Unrealized gains of $60.0 million (pre-tax)
• 97% of fixed maturities, including short-term investments, are rated investment grade
• No derivatives
• All assets managed internally
[LOGO]
18
Highlights
• Workers’ compensation specialist – focused strategy
• Attractive workers’ compensation operating environment
• Consistent underwriting outperformance over the long term
• Spread of risk – 42,600 policies in 45 states
• Loss reserve adequacy and transparency
• High quality and liquid investment portfolio
• Stable and experienced management team
[LOGO]
19
How We Report Our Results
Our business is comprised of the following segments: investments; workers’ compensation; reinsurance; and parent. Our real estate segment was discontinued in 2002. Results of the investments segment include investment income and realized gains and losses on investments and we do not allocate investment income to our workers’ compensation and reinsurance segments. Income (loss) before tax from operations of the workers’ compensation and reinsurance segments is determined solely by deducting losses and loss adjustment expenses incurred and underwriting and other operating expenses incurred from net premiums earned. Loss from operations of the parent segment include interest expense and the general operating expenses of Zenith National Insurance Corp.
Combined Ratios
The combined ratios, expressed as a percentage, are key measurements of underwriting profitability traditionally used in the property-casualty insurance business. The ratios discussed in this document are calculated using GAAP financial results (defined as accounting principles generally accepted in the United States of America) and include the loss and loss adjustment expense ratio as well as the underwriting and other operating expense ratio (“expense ratio”) which together equal the combined ratio. The loss and loss adjustment expense ratio is the percentage of net incurred loss and loss adjustment expenses to net premiums earned. The expense ratio is the percentage of underwriting and other operating expenses to net premiums earned.
[LOGO]
20