UNITED STATES
SECURITIES AND EXCHANGE COMMISSION
Washington, D.C. 20549
FORM N-CSR
CERTIFIED SHAREHOLDER REPORT OF REGISTERED MANAGEMENT
INVESTMENT COMPANIES
Investment Company Act file number 811- 09525
Rydex Dynamic Funds
(Exact name of registrant as specified in charter)
702 King Farm Boulevard, Suite 200
Rockville, Maryland 20850
(Address of principal executive offices) (Zip code)
Amy J. Lee
Rydex Dynamic Funds
702 King Farm Boulevard, Suite 200
Rockville, Maryland 20850
(Name and address of agent for service)
Registrant's telephone number, including area code: 1-301-296-5100
Date of fiscal year end:March 31
Date of reporting period:April 1, 2019 - March 31, 2020
Form N-CSR is to be used by management investment companies to file reports with the Commission not later than 10 days after the transmission to stockholders of any report that is required to be transmitted to stockholders under Rule 30e-1 under the Investment Company Act of 1940 (17 CFR 270.30e-1). The Commission may use the information provided on Form N-CSR in its regulatory, disclosure review, inspection, and policymaking roles.
A registrant is required to disclose the information specified by Form N-CSR, and the Commission will make this information public. A registrant is not required to respond to the collection of information contained in Form N-CSR unless the Form displays a currently valid Office of Management and Budget ("OMB") control number. Please direct comments concerning the accuracy of the information collection burden estimate and any suggestions for reducing the burden to Secretary, Securities and Exchange Commission, 450 Fifth Street, NW, Washington, DC 20549-0609. The OMB has reviewed this collection of information under the clearance requirements of 44 U.S.C. § 3507.
Item 1. Reports to Stockholders.
The registrant’s annual report transmitted to shareholders pursuant to Rule 30e-1 under the Investment Company Act of 1940, as amended (the “Investment Company Act”), is as follows:
3.31.2020
Rydex Funds Annual Report
Domestic Equity Funds |
S&P 500® 2x Strategy Fund | | |
Inverse S&P 500® 2x Strategy Fund | | |
NASDAQ-100® 2x Strategy Fund | | |
Inverse NASDAQ-100® 2x Strategy Fund | | |
Dow 2x Strategy Fund | | |
Inverse Dow 2x Strategy Fund | | |
Russell 2000® 2x Strategy Fund | | |
Inverse Russell 2000® 2x Strategy Fund | | |
Beginning on January 1, 2021, paper copies of the Funds’ annual and semi-annual shareholder reports may no longer be sent by mail, unless you specifically request paper copies of the reports from a fund or from your financial intermediary. Instead, the reports will be made available on a website, and you will be notified by mail each time a report is posted and provided with a website link to access the report.
If you already elected to receive shareholder reports electronically, you will not be affected by this change and you need not take any action. At any time, you may elect to receive reports and other communications from a fund electronically by calling 800.820.0888, going to GuggenheimInvestments.com/myaccount, or by contacting your financial intermediary.
You may elect to receive all future shareholder reports in paper free of charge. If you hold shares of a fund directly, you can inform the Fund that you wish to receive paper copies of reports by calling 800.820.0888. If you hold shares of a fund through a financial intermediary, please contact the financial intermediary to make this election. Your election to receive reports in paper will apply to all Guggenheim Funds in which you are invested and may apply to all funds held with your financial intermediary.
GuggenheimInvestments.com | DYN-ANN-0320x0321 |

| | |
DEAR SHAREHOLDER | 2 |
ECONOMIC AND MARKET OVERVIEW | 4 |
A BRIEF NOTE ON THE COMPOUNDING OF RETURNS | 6 |
ABOUT SHAREHOLDERS’ FUND EXPENSES | 7 |
S&P 500® 2x STRATEGY FUND | 10 |
INVERSE S&P 500® 2x STRATEGY FUND | 23 |
NASDAQ-100® 2x STRATEGY FUND | 31 |
INVERSE NASDAQ-100® 2x STRATEGY FUND | 40 |
DOW 2x STRATEGY FUND | 48 |
INVERSE DOW 2x STRATEGY FUND | 56 |
RUSSELL 2000® 2x STRATEGY FUND | 64 |
INVERSE RUSSELL 2000® 2x STRATEGY FUND | 72 |
NOTES TO FINANCIAL STATEMENTS | 80 |
REPORT OF INDEPENDENT REGISTERED PUBLIC ACCOUNTING FIRM | 96 |
OTHER INFORMATION | 97 |
INFORMATION ON BOARD OF TRUSTEES AND OFFICERS | 99 |
GUGGENHEIM INVESTMENTS PRIVACY NOTICE | 104 |
| | THE RYDEX FUNDS ANNUAL REPORT | 1 |
Dear Shareholder:
The fiscal year ended March 31, 2020, concluded on a somber note. Even though markets performed well for most of the period, the emergence of a novel and highly contagious form of coronavirus in the last weeks of the period adversely impacted global commercial activity and contributed to significant volatility in certain markets, unseen since the great recession of 2008.
As it spread beyond Asia to virtually every country in the world, many governments and businesses instituted quarantines and closures, which has resulted in significant disruption in manufacturing, supply chains, consumer demand and economic activity. The U.S. Federal Reserve responded quickly to provide liquidity in order to ensure that the U.S. markets continued to function efficiently. The fiscal policy included a spending bill worth over $2 trillion to assist consumers, states, small businesses and certain industries. While these actions helped stabilize the market, volatile conditions continued into April.
As discussed in this annual shareholder report, these events have affected performance of many of our funds (the “Fund” or “Funds”). We encourage you to read the Economic and Market Overview section of the report, which follows this letter, and then the Performance Report and Fund Profile for each Fund.
Security Investors, LLC (the “Investment Adviser”), the Investment Adviser for the Funds, is part of Guggenheim Investments, which represents the investment management businesses of Guggenheim Partners, LLC (“Guggenheim”), a global, diversified financial services firm. An affiliate of Guggenheim and the Investment Adviser, Guggenheim Funds Distributors, LLC, is the distributor of the Funds.
Together, we are committed to the safety and prosperity of our clients, our employees, and our shareholders. The resources of the firm are being made fully available not only to support our clients, but also to support our employees and their families.
Please practice the appropriate prudence for the protection not only of your health and that of your friends and loved ones but also for our neighbors and communities. Thank you for the trust you place in us.
Sincerely,
Security Investors, LLC
April 30, 2020
Read a prospectus and summary prospectus (if available) carefully before investing. It contains the investment objectives, risks, charges, expenses and other information, which should be considered carefully before investing. Obtain a prospectus and summary prospectus (if available) at guggenheiminvestments.com or call 800.820.0888.
This material is not intended as a recommendation or as investment advice of any kind, including in connection with rollovers, transfers, and distributions. Such material is not provided in a fiduciary capacity, may not be relied upon for or in connection with the making of investment decisions, and does not constitute a solicitation of an offer to buy or sell securities. All content has been provided for informational or educational purposes only and is not intended to be and should not be construed as legal or tax advice and/or a legal opinion. Always consult a financial, tax and/or legal professional regarding your specific situation.
The global ongoing crisis caused by the outbreak of COVID-19 is causing materially reduced consumer demand and economic output, disrupting supply chains, resulting in market closures, travel restrictions and quarantines, and adversely impacting local and global economies. Investors should be aware that in light of the current uncertainty, volatility and distress in economies, financial markets, and labor and health conditions all over the world, the Funds’ investments and a shareholder’s investment in a Fund are subject to sudden and substantial losses, increased volatility and other adverse events. Firms through which investors invest with the Funds, the Funds, their service providers, the markets in which they invest and market intermediaries are also impacted by quarantines and similar measures intended to contain the ongoing pandemic, which can obstruct their functioning and subject them to heightened operational risks.
2 | THE RYDEX FUNDS ANNUAL REPORT | |
Inverse and leveraged Funds are not suitable for all investors. ● These Funds should be utilized only by investors who (a) understand the risks associated with the use of leverage, (b) understand the consequences of seeking daily leveraged investment results, (c) understand the risk of shorting, and (d) intend to actively monitor and manage their investments. ● The more a Fund invests in leveraged instruments, the more the leverage will magnify any gains or losses on those investments. ● Inverse Funds involve certain risks, which include increased volatility due to the Funds’ possible use of short sales of securities and derivatives, such as options and futures. ● The Funds’ use of derivatives, such as futures, options and swap agreements, may expose the Funds’ shareholders to additional risks that they would not be subject to if they invested directly in the securities underlying those derivatives. ● Short-selling involves increased risks and costs. You risk paying more for a security than you received from its sale. ● Leveraged and inverse Funds seek to provide investment results that match the performance of a specific benchmark, before fees and expenses, on a daily basis. Because the Funds seek to track the performance of their benchmark on a daily basis, mathematical compounding, especially with respect to those Funds that use leverage as part of their investment strategy, may prevent a Fund from correlating with the monthly, quarterly, annual or other period performance of its benchmark. Due to the compounding of daily returns, leveraged and inverse Funds’ returns over periods other than one day will likely differ in amount and possibly direction from the benchmark return for the same period. For those Funds that consistently apply leverage, the value of the Fund’s shares will tend to increase or decrease more than the value of any increase or decrease in its benchmark index. The Funds rebalance their portfolios on a daily basis, increasing exposure in response to that day’s gains or reducing exposure in response to that day’s losses. Daily rebalancing will impair a Fund’s performance if the benchmark experiences volatility. Investors should monitor their leveraged and inverse Funds’ holdings consistent with their strategies, as frequently as daily. ● For more on these and other risks, please read the prospectus.
| | THE RYDEX FUNDS ANNUAL REPORT | 3 |
ECONOMIC AND MARKET OVERVIEW (Unaudited) | March 31, 2020 |
The 12-month period ended March 31, 2020, was a wild ride for markets. While the U.S. economy was generally in good shape in 2019, recessionary fears rose throughout the year, prompting the U.S. Federal Reserve (the “Fed”) to announce a rate cut on July 31, the first since 2008, amid growing downside risks to policymakers’ baseline growth and inflation forecasts. Key among those risks were slowing global growth, the threat of additional U.S.-China tariffs, and the possible ramifications surrounding Brexit. The Fed subsequently cut rates twice more in 2019, which caused markets to rally toward the end of the year and into early 2020. Stocks reached new highs and credit spreads tightened to historic levels. Since then, the global outbreak of the coronavirus, COVID-19, has been at the center of everything. As of this writing, COVID-19 has spread to 210 countries, resulted in over 2.5 million cases, and caused over 170,000 deaths. Thus far, the U.S. makes up more than 30% of global cases, and 25% of global deaths. States have required the labor force to work from home if possible, individuals to practice social distancing, and non-essential businesses to shut down.
Closures, quarantines, and social distancing efforts have impacted the travel, hospitality, restaurants, and retail industries, with activity down 100% in some areas of the country. Further exacerbating the decline in output will be reduced business investment, which was already stalling due to falling profits, trade conflicts, and political uncertainty. The coronavirus shock and collapse in oil prices will likely further depress capital expenditures.
In response to the crisis, the Federal Open Market Committee cut rates by a further 125 basis points in the first quarter of 2020 and passed a series of stimulus programs. Among these were the Primary and Secondary Market Corporate Credit Facilities, which are lending programs primarily targeting investment-grade corporate bond issuers, implemented in concert with the U.S. Treasury. It was only after the announcement of this program that corporate credit found some relief from the selloff, but we expect this relief may be temporary.
With an alphabet soup of monetary programs targeting relief from the coronavirus impact, fiscal policy has also stepped up to the plate with a spending bill worth over $2 trillion that aims to assist consumers, states, small businesses, and certain industries. There is no question that these programs will help ease the economic fallout from virus containment measures, but even $2 trillion may be too small given the magnitude of the economic shock that we are facing. Additionally, it is far from clear that fiscal measures are an adequate solution to the issue at hand: the physical impediment to consumer spending. Fiscal and monetary policy can do their part, but ultimately it is public health policy that will likely be the greatest determinant of the economic outlook.
For the 12 months ended March 31, 2020, the Standard & Poor’s 500® (“S&P 500”) Index* returned -6.98%. The decline, while significant, represents something of a recovery in stocks. The S&P 500 peaked at 3,386.15 on February 19, 2020, before plummeting 33.9% to a low of 2,237.40 on March 23, 2020, then recovering some lost ground by the end of the month.
The consensus estimate for S&P 500 earnings per share in 2020 is still around $150. Our research shows S&P 500 earnings per share could fall below $100. Similarly, economists have no way to calibrate how bad the economic data could be based on history. The March U.S. non-farm payrolls report was evidence of this, as it showed a decline in payrolls of 700,000 jobs versus survey expectations of a decline of only 100,000 jobs. We currently expect that second quarter U.S. real gross domestic product (“GDP”) quarter-over-quarter growth could fall by 40% annualized and the unemployment rate could rise to at least 20%. Beyond that, the severity of the crisis depends on containment of the virus and the effectiveness of social distancing measures put in place, but expectations for a quick and sustained V-shaped recovery appear overly optimistic.
For the 12 months ended March 31, 2020, the MSCI Europe-Australasia-Far East (“EAFE”) Index* returned -13.92%. The return of the MSCI Emerging Markets Index* was -17.36%.
In the bond market, the Bloomberg Barclays U.S. Aggregate Bond Index* posted an 8.93% return for the 12-month period, while the Bloomberg Barclays U.S. Corporate High Yield Index* returned -6.94%. The return of the ICE Bank of America (“BofA”) Merrill Lynch 3-Month U.S. Treasury Bill Index* was 2.25% for the 12-month period.
The opinions and forecasts expressed may not actually come to pass. This information is subject to change at any time, based on market and other conditions, and should not be construed as a recommendation of any specific security or strategy.
4 | THE RYDEX FUNDS ANNUAL REPORT | |
ECONOMIC AND MARKET OVERVIEW (Unaudited)(concluded) | March 31, 2020 |
*Index Definitions:
The following indices are referenced throughout this report. Indices are unmanaged and not available for direct investment. Index performance does not reflect transaction costs, fees, or expenses.
Bloomberg Barclays U.S. Aggregate Bond Index is a broad-based flagship benchmark that measures the investment grade, U.S. dollar-denominated, fixed-rate taxable bond market, including U.S. Treasuries, government-related and corporate securities, mortgage-backed securities or “MBS” (agency fixed-rate and hybrid adjustable-rate mortgage, or “ARM”, pass-throughs), asset-backed securities (“ABS”), and commercial mortgage-backed securities (“CMBS”) (agency and non-agency).
Bloomberg Barclays U.S. Corporate High Yield Index measures the U.S. dollar-denominated, high yield, fixed-rate corporate bond market. Securities are classified as high yield if the middle rating of Moody’s, Fitch, and S&P is Ba1/BB +/BB + or below.
Dow Jones Industrial Average® is a price-weighted average of 30 significant stocks traded on the New York Stock Exchange and the Nasdaq.
ICE BofA Merrill Lynch 3-Month U.S. Treasury Bill Index is an unmanaged market index of U.S. Treasury securities maturing in 90 days that assumes reinvestment of all income.
MSCI EAFE Index is a free float-adjusted market capitalization index that is designed to measure the equity market performance of developed markets, excluding the U.S. & Canada.
MSCI Emerging Markets Index is a free float-adjusted market capitalization weighted index that is designed to measure equity market performance in the global emerging markets.
NASDAQ-100® Index includes 100 of the largest domestic and international non-financial securities listed on the Nasdaq Stock Market based on market capitalization. The Index reflects companies across major industry groups including computer hardware and software, telecommunications, retail/wholesale trade and biotechnology. It does not contain securities of financial companies including investment companies.
Russell 2000® Index measures the performance of the small-cap segment of the U.S. equity universe.
S&P 500® is a broad-based index, the performance of which is based on the performance of 500 widely held common stocks chosen for market size, liquidity, and industry group representation.
| | THE RYDEX FUNDS ANNUAL REPORT | 5 |
A BRIEF NOTE ON THE COMPOUNDING OF RETURNS (Unaudited) | |
The Funds described in this report are benchmarked daily to leveraged and/or inverse leveraged versions of published indices. To properly evaluate the performance of these funds, it is essential to understand the effect of mathematical compounding on their respective returns.
Because of the nonlinear effects of leverage applied over time, it is possible for a fund to perform in-line with its benchmark for several individual periods in a row, yet seem to trail the benchmark over the entire period on a cumulative basis. It is also possible that a fund that performs in-line with its benchmark on a daily basis may seem to outperform its benchmark over longer periods.
An Example of Compounding
For example, consider a hypothetical fund that is designed to produce returns that correspond to 150% of an index. On the first day of a period, the index rises from a level of 100 to a level of 106, producing a 6.0% gain and an expectation that the fund will rise by 9.0%. On the same day, the fund’s net asset value per share (“NAV”) increases from $10.00 to $10.90 for a gain of 9.0% — in line with its benchmark.
On day two, assume the index falls from 106 to 99 for a loss of about 6.6%. The fund, as expected, falls 9.9% to a price of $9.82. On each day, the fund performed exactly in line with its benchmark, but for the two-day period, the fund was down 1.8%, while the index was down only 1.0%. Without taking into account the daily compounding of returns, one would expect the fund to lose 1.5% and would see the fund as trailing by 0.3% when in fact it had performed perfectly. This example is summarized in the table below.
| Index
Level | Index
Performance | Fund
Expectation | Fund
NAV | Fund
Performance | Assessment |
Start | 100 | | | $ 10.00 | | |
Day 1 | 106 | 6.0% | 9.0% | $ 10.90 | 9.0% | In line |
Day 2 | 99 | -6.6% | -9.9% | $ 9.82 | -9.9% | In line |
Cumulative | | -1.0% | -1.5% | | -1.8% | -0.3% |
As illustrated by this simple example, the effect of leverage can make it difficult to form expectations or judgments about fund performance given only the returns of the unleveraged index.
Because certain funds seek to track the performance of their benchmark on a daily basis, mathematical compounding, especially with respect to those funds that use leverage as part of their investment strategy, may prevent a fund from correlating with the monthly, quarterly, annual or other period performance of its benchmark. Due to the compounding of daily returns, leveraged and inverse funds’ returns over periods other than one day will likely differ in amount and possibly direction from the benchmark return for the same period. Investors should monitor their leveraged and inverse funds’ holdings to ensure that they are consistent with their strategies, as frequently as daily. For those funds that consistently apply leverage, the value of the fund’s shares will tend to increase or decrease more than the value of any increase or decrease in its benchmark index. For more on correlation, leverage and other risks, please read the prospectus.
In general, any change in direction in an index will produce compounding that seems to work against an investor. Were the index to move in the same direction (either up or down) for two or more periods in a row, the compounding of those returns would work in an investor’s favor, causing the fund to seemingly beat its benchmark.
As a general rule of thumb, more leverage in a fund will magnify the compounding effect, while less leverage will generally produce results that are more in line with expectations. In addition, periods of high volatility in an underlying index will also cause the effects of compounding to be more pronounced, while lower volatility will produce a more muted effect.
6 | THE RYDEX FUNDS ANNUAL REPORT | |
ABOUT SHAREHOLDERS’ FUND EXPENSES (Unaudited) | |
All mutual funds have operating expenses, and it is important for our shareholders to understand the impact of costs on their investments. Shareholders of a fund incur two types of costs: (i) transaction costs, including sales charges (loads) on purchase payments, reinvested dividends, other distributions, and exchange fees, and (ii) ongoing costs, including management fees, administrative services, and shareholder reports, among others. These ongoing costs, or operating expenses, are deducted from a fund’s gross income and reduce the investment return of the fund.
A fund’s expenses are expressed as a percentage of its average net assets, which is known as the expense ratio. The following examples are intended to help investors understand the ongoing costs (in dollars) of investing in a fund and to compare these costs with the ongoing costs of investing in other mutual funds.
The examples are based on an investment of $1,000 made at the beginning of the period and held for the entire six-month period beginning September 30, 2019 and ending March 31, 2020.
The following tables illustrate the Funds’ costs in two ways:
Table 1. Based on actual Fund return: This section helps investors estimate the actual expenses paid over the period. The “Ending Account Value” shown is derived from the Fund’s actual return, and the fifth column shows the dollar amount that would have been paid by an investor who started with $1,000 in the Fund. Investors may use the information here, together with the amount invested, to estimate the expenses paid over the period. Simply divide the Fund’s account value by $1,000 (for example, an $8,600 account value divided by $1,000 = 8.6), then multiply the result by the number provided under the heading “Expenses Paid During Period.”
Table 2. Based on hypothetical 5% return: This section is intended to help investors compare a fund’s cost with those of other mutual funds. The table provides information about hypothetical account values and hypothetical expenses based on the Fund’s actual expense ratio and an assumed rate of return of 5% per year before expenses, which is not the Fund’s actual return. The hypothetical account values and expenses may not be used to estimate the actual ending account balance or expenses paid during the period. The example is useful in making comparisons because the U.S. Securities and Exchange Commission (the “SEC”) requires all mutual funds to calculate expenses based on the 5% return. Investors can assess a fund’s costs by comparing this hypothetical example with the hypothetical examples that appear in shareholder reports of other funds.
The calculations illustrated above assume no shares were bought or sold during the period. Actual costs may have been higher or lower, depending on the amount of investment and the timing of any purchases or redemptions.
Please note that the expenses shown in the table are meant to highlight your ongoing costs only and do not reflect any transactional costs, such as sales charges (loads) on purchase payments, and contingent deferred sales charges (“CDSC”) on redemptions, if any. Therefore, the second table is useful in comparing ongoing costs only, and will not help you determine the relative total costs of owning different funds. In addition, if these transactional costs were included, your costs would have been higher.
More information about the Funds’ expenses, including annual expense ratios for periods up to five years (subject to the Fund’s inception date), can be found in the Financial Highlights section of this report. For additional information on operating expenses and other shareholder costs, please refer to the appropriate Fund prospectus.
| | THE RYDEX FUNDS ANNUAL REPORT | 7 |
ABOUT SHAREHOLDERS’ FUND EXPENSES (Unaudited)(continued) | |
| Expense
Ratio1 | Fund
Return | Beginning
Account Value
September 30, 2019 | Ending
Account Value
March 31, 2020 | Expenses
Paid During
Period2 |
Table 1. Based on actual Fund return3 | | | | | |
S&P 500® 2x Strategy Fund | | | | | |
A-Class | 1.83% | (30.85%) | $ 1,000.00 | $ 691.50 | $ 7.74 |
C-Class | 2.57% | (31.11%) | 1,000.00 | 688.90 | 10.85 |
H-Class | 1.83% | (30.86%) | 1,000.00 | 691.40 | 7.74 |
Inverse S&P 500® 2x Strategy Fund | | | | | |
A-Class | 1.81% | 3.68% | 1,000.00 | 1,036.80 | 9.22 |
C-Class | 2.57% | 3.35% | 1,000.00 | 1,033.50 | 13.07 |
H-Class | 1.82% | 3.73% | 1,000.00 | 1,037.30 | 9.27 |
NASDAQ-100® 2x Strategy Fund | | | | | |
A-Class | 1.86% | (7.36%) | 1,000.00 | 926.40 | 8.96 |
C-Class | 2.61% | (7.71%) | 1,000.00 | 922.90 | 12.55 |
H-Class | 1.86% | (7.36%) | 1,000.00 | 926.40 | 8.96 |
Inverse NASDAQ-100® 2x Strategy Fund | | | | | |
A-Class | 1.86% | (22.27%) | 1,000.00 | 777.30 | 8.26 |
C-Class | 2.63% | (22.49%) | 1,000.00 | 775.10 | 11.67 |
H-Class | 1.86% | (22.30%) | 1,000.00 | 777.00 | 8.26 |
Dow 2x Strategy Fund | | | | | |
A-Class | 1.87% | (39.70%) | 1,000.00 | 603.00 | 7.49 |
C-Class | 2.61% | (39.92%) | 1,000.00 | 600.80 | 10.45 |
H-Class | 1.86% | (39.68%) | 1,000.00 | 603.20 | 7.45 |
Inverse Dow 2x Strategy Fund | | | | | |
A-Class | 1.86% | 12.85% | 1,000.00 | 1,128.50 | 9.90 |
C-Class | 2.61% | 12.49% | 1,000.00 | 1,124.90 | 13.86 |
H-Class | 1.86% | 12.80% | 1,000.00 | 1,128.00 | 9.90 |
Russell 2000® 2x Strategy Fund | | | | | |
A-Class | 1.87% | (48.81%) | 1,000.00 | 511.90 | 7.07 |
C-Class | 2.62% | (49.00%) | 1,000.00 | 510.00 | 9.89 |
H-Class | 1.88% | (48.84%) | 1,000.00 | 511.60 | 7.10 |
Inverse Russell 2000® 2x Strategy Fund | | | | | |
A-Class | 1.84% | 28.79% | 1,000.00 | 1,287.90 | 10.52 |
C-Class | 2.60% | 28.29% | 1,000.00 | 1,282.90 | 14.84 |
H-Class | 1.88% | 28.68% | 1,000.00 | 1,286.80 | 10.75 |
8 | THE RYDEX FUNDS ANNUAL REPORT | |
ABOUT SHAREHOLDERS’ FUND EXPENSES (Unaudited)(concluded) | |
| Expense
Ratio1 | Fund
Return | Beginning
Account Value
September 30, 2019 | Ending
Account Value
March 31, 2020 | Expenses
Paid During
Period2 |
Table 2. Based on hypothetical 5% return (before expenses) | | | | |
S&P 500® 2x Strategy Fund | | | | | |
A-Class | 1.83% | 5.00% | $ 1,000.00 | $ 1,015.85 | $ 9.22 |
C-Class | 2.57% | 5.00% | 1,000.00 | 1,012.15 | 12.93 |
H-Class | 1.83% | 5.00% | 1,000.00 | 1,015.85 | 9.22 |
Inverse S&P 500® 2x Strategy Fund | | | | | |
A-Class | 1.81% | 5.00% | 1,000.00 | 1,015.95 | 9.12 |
C-Class | 2.57% | 5.00% | 1,000.00 | 1,012.15 | 12.93 |
H-Class | 1.82% | 5.00% | 1,000.00 | 1,015.90 | 9.17 |
NASDAQ-100® 2x Strategy Fund | | | | | |
A-Class | 1.86% | 5.00% | 1,000.00 | 1,015.70 | 9.37 |
C-Class | 2.61% | 5.00% | 1,000.00 | 1,011.95 | 13.13 |
H-Class | 1.86% | 5.00% | 1,000.00 | 1,015.70 | 9.37 |
Inverse NASDAQ-100® 2x Strategy Fund | | | | | |
A-Class | 1.86% | 5.00% | 1,000.00 | 1,015.70 | 9.37 |
C-Class | 2.63% | 5.00% | 1,000.00 | 1,011.85 | 13.23 |
H-Class | 1.86% | 5.00% | 1,000.00 | 1,015.70 | 9.37 |
Dow 2x Strategy Fund | | | | | |
A-Class | 1.87% | 5.00% | 1,000.00 | 1,015.65 | 9.42 |
C-Class | 2.61% | 5.00% | 1,000.00 | 1,011.95 | 13.13 |
H-Class | 1.86% | 5.00% | 1,000.00 | 1,015.70 | 9.37 |
Inverse Dow 2x Strategy Fund | | | | | |
A-Class | 1.86% | 5.00% | 1,000.00 | 1,015.70 | 9.37 |
C-Class | 2.61% | 5.00% | 1,000.00 | 1,011.95 | 13.13 |
H-Class | 1.86% | 5.00% | 1,000.00 | 1,015.70 | 9.37 |
Russell 2000® 2x Strategy Fund | | | | | |
A-Class | 1.87% | 5.00% | 1,000.00 | 1,015.65 | 9.42 |
C-Class | 2.62% | 5.00% | 1,000.00 | 1,011.90 | 13.18 |
H-Class | 1.88% | 5.00% | 1,000.00 | 1,015.60 | 9.47 |
Inverse Russell 2000® 2x Strategy Fund | | | | | |
A-Class | 1.84% | 5.00% | 1,000.00 | 1,015.80 | 9.27 |
C-Class | 2.60% | 5.00% | 1,000.00 | 1,012.00 | 13.08 |
H-Class | 1.88% | 5.00% | 1,000.00 | 1,015.60 | 9.47 |
1 | Annualized. |
2 | Expenses are equal to the Fund’s annualized expense ratio, net of any applicable fee waivers, multiplied by the average account value over the period, multiplied by 183/366 (to reflect the one-half year period). |
3 | Actual cumulative return at net asset value for the period September 30, 2019 to March 31, 2020. |
| | THE RYDEX FUNDS ANNUAL REPORT | 9 |
PERFORMANCE REPORT AND FUND PROFILE (Unaudited) | March 31, 2020 |
S&P 500® 2x STRATEGY FUND
OBJECTIVE: Seeks to provide investment results that match, before fees and expenses, the performance of a specific benchmark on a daily basis. The Fund’s current benchmark is 200% of the performance of the S&P 500® Index (the “underlying index”). The Fund does not seek to achieve its investment objective over a period of time greater than one day.
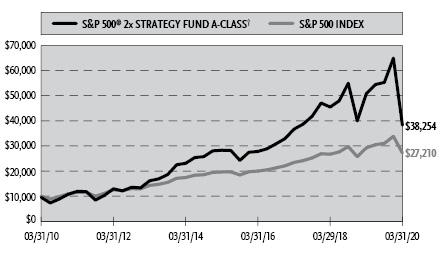
For the one-year period ended March 31, 2020, S&P 500® 2x Strategy Fund maintained a daily correlation of over 99% to its benchmark of 200% of the daily price movement of the S&P 500 Index. S&P 500® 2x Strategy Fund H-Class returned -24.77%, while the S&P 500 Index returned -6.98% over the same time period.
The only sector contributing to the return of the underlying index was Information Technology. The sectors detracting the most were Energy, Financials, and Industrials.
The holdings contributing the most to the return of the underlying index were Microsoft Corp., Apple, Inc., and Amazon.com, Inc. The holdings detracting the most were Exxon Mobil Corp., Boeing Co., and Chevron Corp.
Derivatives in the Fund were used to help provide exposure to the composition of the benchmark in the highest efficient manner and to provide leverage and not for hedging purposes. Derivatives performed as expected.
Due to the compounding of daily returns, leveraged and inverse funds’ returns over periods other than one day will likely differ in amount and possibly direction from the benchmark return for the same period. Investors should monitor their leveraged and inverse funds’ holdings to ensure that they are consistent with their strategies, as frequently as daily.
The effects of compounding may cause the longer-term correlation of the Fund to its benchmark to diminish. The apparent discrepancy between the leveraged and unleveraged indices is the result of compounding, which is described briefly on page 6 of this report.
Performance displayed represents past performance, which is no guarantee of future results.
Holdings Diversification (Market Exposure as % of Net Assets)

“Holdings Diversification (Market Exposure as % of Net Assets)” excludes any temporary cash investments.
Inception Dates: |
A-Class | September 1, 2004 |
C-Class | November 27, 2000 |
H-Class | May 19, 2000 |
Ten Largest Holdings (% of Total Net Assets) |
Microsoft Corp. | 2.7% |
Apple, Inc. | 2.4% |
Amazon.com, Inc. | 1.8% |
Facebook, Inc. — Class A | 0.9% |
Berkshire Hathaway, Inc. — Class B | 0.8% |
Alphabet, Inc. — Class A | 0.8% |
Alphabet, Inc. — Class C | 0.8% |
Johnson & Johnson | 0.8% |
JPMorgan Chase & Co. | 0.6% |
Visa, Inc. — Class A | 0.6% |
Top Ten Total | 12.2% |
| | |
“Ten Largest Holdings” excludes any temporary cash or derivative investments. |
10 | THE RYDEX FUNDS ANNUAL REPORT | |
PERFORMANCE REPORT AND FUND PROFILE (Unaudited)(concluded) | March 31, 2020 |
Cumulative Fund Performance*

Average Annual Returns*
Periods Ended March 31, 2020
| 1 Year | 5 Year | 10 Year |
A-Class Shares | (24.76%) | 6.21% | 14.91% |
A-Class Shares with sales charge† | (28.34%) | 5.18% | 14.36% |
C-Class Shares | (25.33%) | 5.42% | 14.07% |
C-Class Shares with CDSC‡ | (26.06%) | 5.42% | 14.07% |
H-Class Shares | (24.77%) | 6.20% | 14.89% |
S&P 500 Index | (6.98%) | 6.73% | 10.53% |
* | The performance data above represents past performance that is not predictive of future results. The investment return and principal value of an investment in the Fund will fluctuate so that an investor’s shares, when redeemed, may be worth more or less than their original cost. Returns are historical and include changes in principal and reinvested dividends and capital gains and do not reflect the effect of taxes. The S&P 500 Index is an unmanaged index and, unlike the Fund, has no management fees or operating expenses to reduce its reported return. The graphs are based on A-Class shares and H-Class shares only; performance for C-Class shares will vary due to differences in fee structures. |
† | Fund returns are calculated using the maximum sales charge of 4.75%. |
‡ | Fund returns include a CDSC of 1% if redeemed within 12 months of purchase. |
| | THE RYDEX FUNDS ANNUAL REPORT | 11 |
SCHEDULE OF INVESTMENTS | March 31, 2020 |
S&P 500® 2x STRATEGY FUND | |
| | Shares | | | Value | |
COMMON STOCKS† - 48.1% |
| | | | | | | | | |
Consumer, Non-cyclical - 11.3% |
Johnson & Johnson | | | 5,307 | | | $ | 695,907 | |
Procter & Gamble Co. | | | 5,029 | | | | 553,190 | |
UnitedHealth Group, Inc. | | | 1,911 | | | | 476,565 | |
Merck & Company, Inc. | | | 5,134 | | | | 395,010 | |
Pfizer, Inc. | | | 11,160 | | | | 364,262 | |
Coca-Cola Co. | | | 7,776 | | | | 344,088 | |
PepsiCo, Inc. | | | 2,812 | | | | 337,721 | |
Abbott Laboratories | | | 3,564 | | | | 281,235 | |
Bristol-Myers Squibb Co. | | | 4,727 | | | | 263,483 | |
Medtronic plc | | | 2,703 | | | | 243,757 | |
Amgen, Inc. | | | 1,198 | | | | 242,871 | |
Eli Lilly & Co. | | | 1,704 | | | | 236,379 | |
Thermo Fisher Scientific, Inc. | | | 809 | | | | 229,432 | |
Philip Morris International, Inc. | | | 3,138 | | | | 228,948 | |
AbbVie, Inc. | | | 2,982 | | | | 227,199 | |
PayPal Holdings, Inc.* | | | 2,368 | | | | 226,712 | |
Gilead Sciences, Inc. | | | 2,551 | | | | 190,713 | |
Danaher Corp. | | | 1,289 | | | | 178,410 | |
CVS Health Corp. | | | 2,623 | | | | 155,623 | |
Altria Group, Inc. | | | 3,767 | | | | 145,670 | |
Mondelez International, Inc. — Class A | | | 2,904 | | | | 145,432 | |
Cigna Corp. | | | 753 | | | | 133,416 | |
Becton Dickinson and Co. | | | 545 | | | | 125,225 | |
Vertex Pharmaceuticals, Inc.* | | | 519 | | | | 123,496 | |
S&P Global, Inc. | | | 493 | | | | 120,810 | |
Automatic Data Processing, Inc. | | | 873 | | | | 119,322 | |
Allergan plc | | | 662 | | | | 117,240 | |
Anthem, Inc. | | | 511 | | | | 116,017 | |
Intuitive Surgical, Inc.* | | | 233 | | | | 115,384 | |
Biogen, Inc.* | | | 364 | | | | 115,162 | |
Colgate-Palmolive Co. | | | 1,728 | | | | 114,670 | |
Zoetis, Inc. | | | 960 | | | | 112,982 | |
Stryker Corp. | | | 649 | | | | 108,052 | |
Boston Scientific Corp.* | | | 2,811 | | | | 91,723 | |
Kimberly-Clark Corp. | | | 691 | | | | 88,358 | |
Global Payments, Inc. | | | 606 | | | | 87,403 | |
Humana, Inc. | | | 267 | | | | 83,843 | |
Baxter International, Inc. | | | 1,030 | | | | 83,626 | |
Illumina, Inc.* | | | 296 | | | | 80,844 | |
Edwards Lifesciences Corp.* | | | 421 | | | | 79,409 | |
Regeneron Pharmaceuticals, Inc.* | | | 161 | | | | 78,615 | |
Estee Lauder Companies, Inc. — Class A | | | 449 | | | | 71,544 | |
Centene Corp.* | | | 1,177 | | | | 69,926 | |
Moody’s Corp. | | | 327 | | | | 69,160 | |
General Mills, Inc. | | | 1,219 | | | | 64,327 | |
Kroger Co. | | | 1,617 | | | | 48,704 | |
IHS Markit Ltd. | | | 809 | | | | 48,540 | |
Constellation Brands, Inc. — Class A | | | 338 | | | | 48,456 | |
HCA Healthcare, Inc. | | | 534 | | | | 47,980 | |
Sysco Corp. | | | 1,029 | | | | 46,953 | |
Verisk Analytics, Inc. — Class A | | | 330 | | | | 45,995 | |
McKesson Corp. | | | 326 | | | | 44,095 | |
Clorox Co. | | | 253 | | | | 43,833 | |
Monster Beverage Corp.* | | | 770 | | | | 43,320 | |
ResMed, Inc. | | | 290 | | | | 42,714 | |
Zimmer Biomet Holdings, Inc. | | | 415 | | | | 41,948 | |
IDEXX Laboratories, Inc.* | | | 173 | | | | 41,907 | |
Alexion Pharmaceuticals, Inc.* | | | 446 | | | | 40,046 | |
Hershey Co. | | | 299 | | | | 39,617 | |
Archer-Daniels-Midland Co. | | | 1,123 | | | | 39,507 | |
IQVIA Holdings, Inc.* | | | 364 | | | | 39,261 | |
Corteva, Inc. | | | 1,509 | | | | 35,461 | |
McCormick & Company, Inc. | | | 249 | | | | 35,161 | |
Tyson Foods, Inc. — Class A | | | 595 | | | | 34,433 | |
FleetCor Technologies, Inc.* | | | 175 | | | | 32,644 | |
Church & Dwight Company, Inc. | | | 495 | | | | 31,769 | |
Kraft Heinz Co. | | | 1,256 | | | | 31,073 | |
Kellogg Co. | | | 502 | | | | 30,115 | |
Cintas Corp. | | | 169 | | | | 29,274 | |
Equifax, Inc. | | | 244 | | | | 29,146 | |
Conagra Brands, Inc. | | | 981 | | | | 28,783 | |
Cardinal Health, Inc. | | | 590 | | | | 28,285 | |
Cooper Companies, Inc. | | | 100 | | | | 27,567 | |
Teleflex, Inc. | | | 93 | | | | 27,236 | |
AmerisourceBergen Corp. — Class A | | | 303 | | | | 26,815 | |
Incyte Corp.* | | | 361 | | | | 26,436 | |
Hormel Foods Corp. | | | 561 | | | | 26,165 | |
JM Smucker Co. | | | 230 | | | | 25,530 | |
MarketAxess Holdings, Inc. | | | 76 | | | | 25,275 | |
Align Technology, Inc.* | | | 145 | | | | 25,223 | |
Laboratory Corporation of America Holdings* | | | 196 | | | | 24,772 | |
STERIS plc | | | 171 | | | | 23,935 | |
Quest Diagnostics, Inc. | | | 272 | | | | 21,842 | |
Brown-Forman Corp. — Class B | | | 367 | | | | 20,372 | |
Hologic, Inc.* | | | 541 | | | | 18,989 | |
Varian Medical Systems, Inc.* | | | 183 | | | | 18,787 | |
Gartner, Inc.* | | | 180 | | | | 17,923 | |
Dentsply Sirona, Inc. | | | 449 | | | | 17,435 | |
Avery Dennison Corp. | | | 168 | | | | 17,114 | |
Lamb Weston Holdings, Inc. | | | 295 | | | | 16,845 | |
Universal Health Services, Inc. — Class B | | | 162 | | | | 16,051 | |
Campbell Soup Co. | | | 341 | | | | 15,741 | |
United Rentals, Inc.* | | | 152 | | | | 15,641 | |
Mylan N.V.* | | | 1,041 | | | | 15,521 | |
Henry Schein, Inc.* | | | 296 | | | | 14,954 | |
Molson Coors Beverage Co. — Class B | | | 379 | | | | 14,785 | |
DaVita, Inc.* | | | 181 | | | | 13,767 | |
ABIOMED, Inc.* | | | 91 | | | | 13,210 | |
Perrigo Company plc | | | 274 | | | | 13,177 | |
Rollins, Inc. | | | 284 | | | | 10,264 | |
Quanta Services, Inc. | | | 287 | | | | 9,106 | |
Nielsen Holdings plc | | | 718 | | | | 9,004 | |
Robert Half International, Inc. | | | 237 | | | | 8,947 | |
H&R Block, Inc. | | | 394 | | | | 5,548 | |
Coty, Inc. — Class A | | | 596 | | | | 3,075 | |
Total Consumer, Non-cyclical | | | | | | | 10,169,233 | |
| | | | | | | | | |
Technology - 10.2% |
Microsoft Corp. | | | 15,384 | | | | 2,426,211 | |
Apple, Inc. | | | 8,423 | | | | 2,141,885 | |
12 | THE RYDEX FUNDS ANNUAL REPORT | SEE NOTES TO FINANCIAL STATEMENTS. |
SCHEDULE OF INVESTMENTS (continued) | March 31, 2020 |
S&P 500® 2x STRATEGY FUND | |
| | Shares | | | Value | |
Intel Corp. | | | 8,772 | | | $ | 474,741 | |
NVIDIA Corp. | | | 1,234 | | | | 325,282 | |
Adobe, Inc.* | | | 976 | | | | 310,602 | |
salesforce.com, Inc.* | | | 1,789 | | | | 257,580 | |
Oracle Corp. | | | 4,369 | | | | 211,154 | |
Accenture plc — Class A | | | 1,281 | | | | 209,136 | |
International Business Machines Corp. | | | 1,786 | | | | 198,121 | |
Broadcom, Inc. | | | 800 | | | | 189,680 | |
Texas Instruments, Inc. | | | 1,885 | | | | 188,368 | |
QUALCOMM, Inc. | | | 2,303 | | | | 155,798 | |
Fidelity National Information Services, Inc. | | | 1,239 | | | | 150,712 | |
Intuit, Inc. | | | 525 | | | | 120,750 | |
Fiserv, Inc.* | | | 1,152 | | | | 109,428 | |
ServiceNow, Inc.* | | | 380 | | | | 108,900 | |
Advanced Micro Devices, Inc.* | | | 2,359 | | | | 107,287 | |
Micron Technology, Inc.* | | | 2,232 | | | | 93,878 | |
Activision Blizzard, Inc. | | | 1,549 | | | | 92,135 | |
Applied Materials, Inc. | | | 1,863 | | | | 85,363 | |
Lam Research Corp. | | | 293 | | | | 70,320 | |
Autodesk, Inc.* | | | 444 | | | | 69,308 | |
Analog Devices, Inc. | | | 743 | | | | 66,610 | |
Electronic Arts, Inc.* | | | 589 | | | | 59,000 | |
HP, Inc. | | | 2,988 | | | | 51,872 | |
Cognizant Technology Solutions Corp. — Class A | | | 1,104 | | | | 51,303 | |
MSCI, Inc. — Class A | | | 171 | | | | 49,412 | |
KLA Corp. | | | 318 | | | | 45,709 | |
Paychex, Inc. | | | 642 | | | | 40,395 | |
ANSYS, Inc.* | | | 173 | | | | 40,217 | |
Cerner Corp. | | | 633 | | | | 39,873 | |
Xilinx, Inc. | | | 507 | | | | 39,516 | |
Synopsys, Inc.* | | | 303 | | | | 39,023 | |
Cadence Design Systems, Inc.* | | | 566 | | | | 37,379 | |
Citrix Systems, Inc. | | | 232 | | | | 32,840 | |
Microchip Technology, Inc. | | | 482 | | | | 32,680 | |
Skyworks Solutions, Inc. | | | 344 | | | | 30,747 | |
Akamai Technologies, Inc.* | | | 326 | | | | 29,826 | |
Fortinet, Inc.* | | | 286 | | | | 28,934 | |
Take-Two Interactive Software, Inc.* | | | 228 | | | | 27,043 | |
Maxim Integrated Products, Inc. | | | 546 | | | | 26,541 | |
Hewlett Packard Enterprise Co. | | | 2,609 | | | | 25,333 | |
Western Digital Corp. | | | 600 | | | | 24,972 | |
Leidos Holdings, Inc. | | | 268 | | | | 24,562 | |
Jack Henry & Associates, Inc. | | | 155 | | | | 24,062 | |
Seagate Technology plc | | | 466 | | | | 22,741 | |
Broadridge Financial Solutions, Inc. | | | 231 | | | | 21,906 | |
Zebra Technologies Corp. — Class A* | | | 109 | | | | 20,012 | |
Paycom Software, Inc.* | | | 99 | | | | 19,999 | |
NetApp, Inc. | | | 460 | | | | 19,177 | |
Qorvo, Inc.* | | | 234 | | | | 18,867 | |
IPG Photonics Corp.* | | | 72 | | | | 7,940 | |
Xerox Holdings Corp. | | | 375 | | | | 7,103 | |
DXC Technology Co. | | | 516 | | | | 6,734 | |
Total Technology | | | | | | | 9,108,967 | |
| | | | | | | | | |
Communications - 7.6% |
Amazon.com, Inc.* | | | 840 | | | | 1,637,765 | |
Facebook, Inc. — Class A* | | | 4,853 | | | | 809,480 | |
Alphabet, Inc. — Class A* | | | 604 | | | | 701,818 | |
Alphabet, Inc. — Class C* | | | 603 | | | | 701,174 | |
Verizon Communications, Inc. | | | 8,340 | | | | 448,108 | |
AT&T, Inc. | | | 14,731 | | | | 429,409 | |
Walt Disney Co. | | | 3,635 | | | | 351,141 | |
Cisco Systems, Inc. | | | 8,555 | | | | 336,297 | |
Netflix, Inc.* | | | 884 | | | | 331,942 | |
Comcast Corp. — Class A | | | 9,155 | | | | 314,749 | |
Charter Communications, Inc. — Class A* | | | 316 | | | | 137,874 | |
Booking Holdings, Inc.* | | | 84 | | | | 113,007 | |
T-Mobile US, Inc.* | | | 638 | | | | 53,528 | |
eBay, Inc. | | | 1,542 | | | | 46,353 | |
Motorola Solutions, Inc. | | | 346 | | | | 45,990 | |
Twitter, Inc.* | | | 1,566 | | | | 38,461 | |
VeriSign, Inc.* | | | 208 | | | | 37,459 | |
Corning, Inc. | | | 1,551 | | | | 31,858 | |
CDW Corp. | | | 290 | | | | 27,048 | |
Omnicom Group, Inc. | | | 439 | | | | 24,101 | |
Arista Networks, Inc.* | | | 109 | | | | 22,078 | |
NortonLifeLock, Inc. | | | 1,156 | | | | 21,629 | |
CenturyLink, Inc. | | | 1,979 | | | | 18,721 | |
Fox Corp. — Class A | | | 715 | | | | 16,895 | |
Expedia Group, Inc. | | | 282 | | | | 15,868 | |
ViacomCBS, Inc. — Class B | | | 1,090 | | | | 15,271 | |
F5 Networks, Inc.* | | | 123 | | | | 13,115 | |
Juniper Networks, Inc. | | | 675 | | | | 12,920 | |
Interpublic Group of Companies, Inc. | | | 782 | | | | 12,661 | |
Discovery, Inc. — Class C* | | | 676 | | | | 11,857 | |
DISH Network Corp. — Class A* | | | 516 | | | | 10,315 | |
Fox Corp. — Class B | | | 327 | | | | 7,482 | |
News Corp. — Class A | | | 784 | | | | 7,036 | |
Discovery, Inc. — Class A* | | | 319 | | | | 6,201 | |
News Corp. — Class B | | | 246 | | | | 2,212 | |
Total Communications | | | | | | | 6,811,823 | |
| | | | | | | | | |
Financial - 7.5% |
Berkshire Hathaway, Inc. — Class B* | | | 3,944 | | | | 721,082 | |
JPMorgan Chase & Co. | | | 6,325 | | | | 569,440 | |
Visa, Inc. — Class A | | | 3,452 | | | | 556,186 | |
Mastercard, Inc. — Class A | | | 1,790 | | | | 432,392 | |
Bank of America Corp. | | | 16,325 | | | | 346,580 | |
Wells Fargo & Co. | | | 7,761 | | | | 222,741 | |
American Tower Corp. — Class A REIT | | | 893 | | | | 194,451 | |
Citigroup, Inc. | | | 4,403 | | | | 185,454 | |
CME Group, Inc. — Class A | | | 723 | | | | 125,014 | |
Crown Castle International Corp. REIT | | | 838 | | | | 121,007 | |
Prologis, Inc. REIT | | | 1,489 | | | | 119,671 | |
American Express Co. | | | 1,353 | | | | 115,830 | |
Equinix, Inc. REIT | | | 172 | | | | 107,426 | |
BlackRock, Inc. — Class A | | | 238 | | | | 104,713 | |
Chubb Ltd. | | | 914 | | | | 102,085 | |
Goldman Sachs Group, Inc. | | | 643 | | | | 99,401 | |
U.S. Bancorp | | | 2,866 | | | | 98,734 | |
Intercontinental Exchange, Inc. | | | 1,123 | | | | 90,682 | |
SEE NOTES TO FINANCIAL STATEMENTS. | THE RYDEX FUNDS ANNUAL REPORT | 13 |
SCHEDULE OF INVESTMENTS (continued) | March 31, 2020 |
S&P 500® 2x STRATEGY FUND | |
| | Shares | | | Value | |
Marsh & McLennan Companies, Inc. | | | 1,018 | | | $ | 88,016 | |
Progressive Corp. | | | 1,179 | | | | 87,057 | |
PNC Financial Services Group, Inc. | | | 884 | | | | 84,617 | |
Truist Financial Corp. | | | 2,704 | | | | 83,391 | |
Morgan Stanley | | | 2,349 | | | | 79,866 | |
Aon plc | | | 472 | | | | 77,899 | |
Charles Schwab Corp. | | | 2,306 | | | | 77,528 | |
Digital Realty Trust, Inc. REIT | | | 530 | | | | 73,622 | |
SBA Communications Corp. REIT | | | 227 | | | | 61,283 | |
Public Storage REIT | | | 303 | | | | 60,179 | |
Allstate Corp. | | | 653 | | | | 59,900 | |
Bank of New York Mellon Corp. | | | 1,692 | | | | 56,987 | |
Travelers Companies, Inc. | | | 521 | | | | 51,761 | |
Aflac, Inc. | | | 1,480 | | | | 50,675 | |
MetLife, Inc. | | | 1,576 | | | | 48,178 | |
Capital One Financial Corp. | | | 939 | | | | 47,344 | |
T. Rowe Price Group, Inc. | | | 471 | | | | 45,993 | |
Willis Towers Watson plc | | | 259 | | | | 43,991 | |
Equity Residential REIT | | | 704 | | | | 43,444 | |
American International Group, Inc. | | | 1,754 | | | | 42,535 | |
Prudential Financial, Inc. | | | 811 | | | | 42,286 | |
AvalonBay Communities, Inc. REIT | | | 282 | | | | 41,502 | |
State Street Corp. | | | 733 | | | | 39,047 | |
Welltower, Inc. REIT | | | 818 | | | | 37,448 | |
Realty Income Corp. REIT | | | 691 | | | | 34,453 | |
Simon Property Group, Inc. REIT | | | 619 | | | | 33,958 | |
Alexandria Real Estate Equities, Inc. REIT | | | 247 | | | | 33,854 | |
Northern Trust Corp. | | | 427 | | | | 32,221 | |
Arthur J Gallagher & Co. | | | 376 | | | | 30,648 | |
Essex Property Trust, Inc. REIT | | | 133 | | | | 29,292 | |
First Republic Bank | | | 340 | | | | 27,975 | |
M&T Bank Corp. | | | 266 | | | | 27,512 | |
Boston Properties, Inc. REIT | | | 290 | | | | 26,747 | |
Ameriprise Financial, Inc. | | | 255 | | | | 26,132 | |
Hartford Financial Services Group, Inc. | | | 727 | | | | 25,619 | |
Weyerhaeuser Co. REIT | | | 1,503 | | | | 25,476 | |
CBRE Group, Inc. — Class A* | | | 675 | | | | 25,454 | |
Extra Space Storage, Inc. REIT | | | 261 | | | | 24,993 | |
Duke Realty Corp. REIT | | | 741 | | | | 23,994 | |
Healthpeak Properties, Inc. REIT | | | 998 | | | | 23,802 | |
Mid-America Apartment Communities, Inc. REIT | | | 230 | | | | 23,697 | |
Cincinnati Financial Corp. | | | 306 | | | | 23,088 | |
Discover Financial Services | | | 632 | | | | 22,544 | |
Nasdaq, Inc. | | | 231 | | | | 21,934 | |
UDR, Inc. REIT | | | 591 | | | | 21,595 | |
Fifth Third Bancorp | | | 1,431 | | | | 21,250 | |
KeyCorp | | | 1,986 | | | | 20,595 | |
Ventas, Inc. REIT | | | 752 | | | | 20,154 | |
Cboe Global Markets, Inc. | | | 224 | | | | 19,992 | |
Synchrony Financial | | | 1,138 | | | | 18,310 | |
Loews Corp. | | | 516 | | | | 17,972 | |
Regions Financial Corp. | | | 1,945 | | | | 17,447 | |
Huntington Bancshares, Inc. | | | 2,083 | | | | 17,101 | |
Citizens Financial Group, Inc. | | | 877 | | | | 16,496 | |
Principal Financial Group, Inc. | | | 521 | | | | 16,328 | |
Host Hotels & Resorts, Inc. REIT | | | 1,446 | | | | 15,964 | |
Everest Re Group Ltd. | | | 82 | | | | 15,778 | |
Raymond James Financial, Inc. | | | 249 | | | | 15,737 | |
SVB Financial Group* | | | 104 | | | | 15,712 | |
E*TRADE Financial Corp. | | | 456 | | | | 15,650 | |
Western Union Co. | | | 845 | | | | 15,320 | |
WR Berkley Corp. | | | 293 | | | | 15,286 | |
Globe Life, Inc. | | | 201 | | | | 14,466 | |
Iron Mountain, Inc. REIT | | | 579 | | | | 13,780 | |
Regency Centers Corp. REIT | | | 338 | | | | 12,989 | |
Assurant, Inc. | | | 122 | | | | 12,699 | |
Vornado Realty Trust REIT | | | 319 | | | | 11,551 | |
Federal Realty Investment Trust REIT | | | 142 | | | | 10,595 | |
Apartment Investment & Management Co. — Class A REIT | | | 300 | | | | 10,545 | |
Lincoln National Corp. | | | 400 | | | | 10,528 | |
People’s United Financial, Inc. | | | 896 | | | | 9,901 | |
Franklin Resources, Inc. | | | 562 | | | | 9,380 | |
Zions Bancorp North America | | | 344 | | | | 9,206 | |
Comerica, Inc. | | | 291 | | | | 8,538 | |
Kimco Realty Corp. REIT | | | 851 | | | | 8,229 | |
SL Green Realty Corp. REIT | | | 164 | | | | 7,069 | |
Invesco Ltd. | | | 751 | | | | 6,819 | |
Unum Group | | | 416 | | | | 6,244 | |
Alliance Data Systems Corp. | | | 83 | | | | 2,793 | |
Total Financial | | | | | | | 6,762,850 | |
| | | | | | | | | |
Industrial - 3.9% |
Union Pacific Corp. | | | 1,400 | | | | 197,456 | |
Honeywell International, Inc. | | | 1,441 | | | | 192,791 | |
Lockheed Martin Corp. | | | 501 | | | | 169,814 | |
Boeing Co. | | | 1,078 | | | | 160,773 | |
3M Co. | | | 1,160 | | | | 158,352 | |
United Technologies Corp. | | | 1,636 | | | | 154,324 | |
General Electric Co. | | | 17,612 | | | | 139,839 | |
United Parcel Service, Inc. — Class B | | | 1,413 | | | | 132,002 | |
Caterpillar, Inc. | | | 1,114 | | | | 129,269 | |
Northrop Grumman Corp. | | | 316 | | | | 95,606 | |
CSX Corp. | | | 1,568 | | | | 89,846 | |
Deere & Co. | | | 635 | | | | 87,732 | |
Illinois Tool Works, Inc. | | | 590 | | | | 83,851 | |
L3Harris Technologies, Inc. | | | 446 | | | | 80,333 | |
Norfolk Southern Corp. | | | 526 | | | | 76,796 | |
Raytheon Co. | | | 562 | | | | 73,706 | |
Waste Management, Inc. | | | 787 | | | | 72,845 | |
Roper Technologies, Inc. | | | 210 | | | | 65,480 | |
Eaton Corporation plc | | | 834 | | | | 64,793 | |
General Dynamics Corp. | | | 473 | | | | 62,583 | |
FedEx Corp. | | | 484 | | | | 58,690 | |
Emerson Electric Co. | | | 1,228 | | | | 58,514 | |
Agilent Technologies, Inc. | | | 624 | | | | 44,691 | |
Amphenol Corp. — Class A | | | 598 | | | | 43,582 | |
Ball Corp. | | | 660 | | | | 42,676 | |
TE Connectivity Ltd. | | | 674 | | | | 42,449 | |
Johnson Controls International plc | | | 1,556 | | | | 41,950 | |
Trane Technologies plc | | | 483 | | | | 39,891 | |
Rockwell Automation, Inc. | | | 233 | | | | 35,162 | |
14 | THE RYDEX FUNDS ANNUAL REPORT | SEE NOTES TO FINANCIAL STATEMENTS. |
SCHEDULE OF INVESTMENTS (continued) | March 31, 2020 |
S&P 500® 2x STRATEGY FUND | |
| | Shares | | | Value | |
Mettler-Toledo International, Inc.* | | | 49 | | | $ | 33,835 | |
Parker-Hannifin Corp. | | | 259 | | | | 33,600 | |
AMETEK, Inc. | | | 461 | | | | 33,201 | |
Fortive Corp. | | | 596 | | | | 32,893 | |
TransDigm Group, Inc. | | | 100 | | | | 32,019 | |
Republic Services, Inc. — Class A | | | 425 | | | | 31,900 | |
Keysight Technologies, Inc.* | | | 378 | | | | 31,631 | |
Stanley Black & Decker, Inc. | | | 307 | | | | 30,700 | |
Vulcan Materials Co. | | | 267 | | | | 28,855 | |
Amcor plc | | | 3,267 | | | | 26,528 | |
Kansas City Southern | | | 200 | | | | 25,436 | |
Old Dominion Freight Line, Inc. | | | 194 | | | | 25,399 | |
Dover Corp. | | | 293 | | | | 24,594 | |
Martin Marietta Materials, Inc. | | | 126 | | | | 23,843 | |
Waters Corp.* | | | 130 | | | | 23,667 | |
Xylem, Inc. | | | 363 | | | | 23,642 | |
Expeditors International of Washington, Inc. | | | 343 | | | | 22,885 | |
Garmin Ltd. | | | 291 | | | | 21,813 | |
Jacobs Engineering Group, Inc. | | | 273 | | | | 21,641 | |
IDEX Corp. | | | 153 | | | | 21,131 | |
Masco Corp. | | | 573 | | | | 19,808 | |
CH Robinson Worldwide, Inc. | | | 273 | | | | 18,073 | |
Westinghouse Air Brake Technologies Corp. | | | 367 | | | | 17,664 | |
Ingersoll Rand, Inc.* | | | 698 | | | | 17,310 | |
Allegion plc | | | 187 | | | | 17,208 | |
PerkinElmer, Inc. | | | 224 | | | | 16,863 | |
Packaging Corporation of America | | | 191 | | | | 16,585 | |
J.B. Hunt Transport Services, Inc. | | | 172 | | | | 15,864 | |
Huntington Ingalls Industries, Inc. | | | 82 | | | | 14,941 | |
Westrock Co. | | | 520 | | | | 14,695 | |
Arconic, Inc. | | | 781 | | | | 12,543 | |
Textron, Inc. | | | 460 | | | | 12,268 | |
Fortune Brands Home & Security, Inc. | | | 281 | | | | 12,153 | |
Snap-on, Inc. | | | 111 | | | | 12,079 | |
AO Smith Corp. | | | 276 | | | | 10,436 | |
Pentair plc | | | 339 | | | | 10,089 | |
FLIR Systems, Inc. | | | 271 | | | | 8,642 | |
Sealed Air Corp. | | | 312 | | | | 7,709 | |
Flowserve Corp. | | | 264 | | | | 6,307 | |
Total Industrial | | | | | | | 3,506,246 | |
| | | | | | | | | |
Consumer, Cyclical - 3.7% |
Home Depot, Inc. | | | 2,200 | | | | 410,762 | |
Walmart, Inc. | | | 2,861 | | | | 325,067 | |
Costco Wholesale Corp. | | | 891 | | | | 254,051 | |
McDonald’s Corp. | | | 1,519 | | | | 251,167 | |
NIKE, Inc. — Class B | | | 2,513 | | | | 207,926 | |
Starbucks Corp. | | | 2,382 | | | | 156,593 | |
Lowe’s Companies, Inc. | | | 1,546 | | | | 133,033 | |
TJX Companies, Inc. | | | 2,445 | | | | 116,895 | |
Target Corp. | | | 1,022 | | | | 95,015 | |
Dollar General Corp. | | | 513 | | | | 77,468 | |
Walgreens Boots Alliance, Inc. | | | 1,512 | | | | 69,174 | |
Ross Stores, Inc. | | | 729 | | | | 63,401 | |
General Motors Co. | | | 2,536 | | | | 52,698 | |
O’Reilly Automotive, Inc.* | | | 153 | | | | 46,061 | |
PACCAR, Inc. | | | 697 | | | | 42,608 | |
Cummins, Inc. | | | 309 | | | | 41,814 | |
Yum! Brands, Inc. | | | 610 | | | | 41,803 | |
Marriott International, Inc. — Class A | | | 547 | | | | 40,921 | |
AutoZone, Inc.* | | | 48 | | | | 40,608 | |
Hilton Worldwide Holdings, Inc. | | | 569 | | | | 38,829 | |
Ford Motor Co. | | | 7,853 | | | | 37,930 | |
Fastenal Co. | | | 1,157 | | | | 36,156 | |
VF Corp. | | | 660 | | | | 35,693 | |
Dollar Tree, Inc.* | | | 477 | | | | 35,045 | |
Chipotle Mexican Grill, Inc. — Class A* | | | 52 | | | | 34,029 | |
Southwest Airlines Co. | | | 955 | | | | 34,008 | |
Delta Air Lines, Inc. | | | 1,161 | | | | 33,123 | |
Las Vegas Sands Corp. | | | 681 | | | | 28,922 | |
Copart, Inc.* | | | 413 | | | | 28,299 | |
Tiffany & Co. | | | 218 | | | | 28,231 | |
Best Buy Company, Inc. | | | 459 | | | | 26,163 | |
Aptiv plc | | | 515 | | | | 25,358 | |
DR Horton, Inc. | | | 676 | | | | 22,984 | |
WW Grainger, Inc. | | | 88 | | | | 21,868 | |
Lennar Corp. — Class A | | | 564 | | | | 21,545 | |
Tractor Supply Co. | | | 239 | | | | 20,207 | |
Ulta Beauty, Inc.* | | | 115 | | | | 20,206 | |
Genuine Parts Co. | | | 293 | | | | 19,728 | |
Hasbro, Inc. | | | 257 | | | | 18,388 | |
NVR, Inc.* | | | 7 | | | | 17,984 | |
CarMax, Inc.* | | | 332 | | | | 17,872 | |
United Airlines Holdings, Inc.*,1 | | | 439 | | | | 13,850 | |
Darden Restaurants, Inc. | | | 247 | | | | 13,452 | |
Advance Auto Parts, Inc. | | | 140 | | | | 13,065 | |
Live Nation Entertainment, Inc.* | | | 284 | | | | 12,911 | |
LKQ Corp.* | | | 618 | | | | 12,675 | |
MGM Resorts International | | | 1,039 | | | | 12,260 | |
Wynn Resorts Ltd. | | | 195 | | | | 11,737 | |
PulteGroup, Inc. | | | 514 | | | | 11,472 | |
Royal Caribbean Cruises Ltd. | | | 347 | | | | 11,163 | |
Whirlpool Corp. | | | 127 | | | | 10,897 | |
Carnival Corp. | | | 808 | | | | 10,641 | |
Newell Brands, Inc. | | | 768 | | | | 10,199 | |
BorgWarner, Inc. | | | 416 | | | | 10,138 | |
American Airlines Group, Inc.1 | | | 786 | | | | 9,581 | |
Mohawk Industries, Inc.* | | | 120 | | | | 9,149 | |
Tapestry, Inc. | | | 556 | | | | 7,200 | |
Leggett & Platt, Inc. | | | 265 | | | | 7,070 | |
Alaska Air Group, Inc. | | | 248 | | | | 7,061 | |
Ralph Lauren Corp. — Class A | | | 100 | | | | 6,683 | |
Harley-Davidson, Inc. | | | 311 | | | | 5,887 | |
Hanesbrands, Inc. | | | 729 | | | | 5,737 | |
PVH Corp. | | | 150 | | | | 5,646 | |
L Brands, Inc. | | | 468 | | | | 5,410 | |
Norwegian Cruise Line Holdings Ltd.* | | | 429 | | | | 4,702 | |
Kohl’s Corp. | | | 316 | | | | 4,610 | |
Under Armour, Inc. — Class A* | | | 380 | | | | 3,500 | |
Nordstrom, Inc. | | | 216 | | | | 3,313 | |
Capri Holdings Ltd.* | | | 306 | | | | 3,302 | |
Under Armour, Inc. — Class C* | | | 392 | | | | 3,159 | |
SEE NOTES TO FINANCIAL STATEMENTS. | THE RYDEX FUNDS ANNUAL REPORT | 15 |
SCHEDULE OF INVESTMENTS (continued) | March 31, 2020 |
S&P 500® 2x STRATEGY FUND | |
| | Shares | | | Value | |
Macy’s, Inc.1 | | | 623 | | | $ | 3,059 | |
Gap, Inc. | | | 429 | | | | 3,020 | |
Total Consumer, Cyclical | | | | | | | 3,322,182 | |
| | | | | | | | | |
Utilities - 1.7% |
NextEra Energy, Inc. | | | 986 | | | | 237,251 | |
Dominion Energy, Inc. | | | 1,660 | | | | 119,835 | |
Duke Energy Corp. | | | 1,470 | | | | 118,894 | |
Southern Co. | | | 2,115 | | | | 114,506 | |
American Electric Power Company, Inc. | | | 996 | | | | 79,660 | |
Exelon Corp. | | | 1,960 | | | | 72,148 | |
Sempra Energy | | | 568 | | | | 64,178 | |
Xcel Energy, Inc. | | | 1,057 | | | | 63,737 | |
WEC Energy Group, Inc. | | | 636 | | | | 56,051 | |
Consolidated Edison, Inc. | | | 670 | | | | 52,260 | |
Eversource Energy | | | 653 | | | | 51,071 | |
Public Service Enterprise Group, Inc. | | | 1,020 | | | | 45,808 | |
FirstEnergy Corp. | | | 1,090 | | | | 43,676 | |
American Water Works Company, Inc. | | | 365 | | | | 43,639 | |
Edison International | | | 723 | | | | 39,613 | |
PPL Corp. | | | 1,548 | | | | 38,205 | |
Entergy Corp. | | | 402 | | | | 37,776 | |
DTE Energy Co. | | | 387 | | | | 36,753 | |
Ameren Corp. | | | 496 | | | | 36,124 | |
CMS Energy Corp. | | | 572 | | | | 33,605 | |
Evergy, Inc. | | | 460 | | | | 25,323 | |
Atmos Energy Corp. | | | 241 | | | | 23,915 | |
Alliant Energy Corp. | | | 485 | | | | 23,421 | |
NiSource, Inc. | | | 753 | | | | 18,802 | |
AES Corp. | | | 1,339 | | | | 18,211 | |
Pinnacle West Capital Corp. | | | 227 | | | | 17,204 | |
CenterPoint Energy, Inc. | | | 1,013 | | | | 15,651 | |
NRG Energy, Inc. | | | 507 | | | | 13,821 | |
Total Utilities | | | | | | | 1,541,138 | |
| | | | | | | | | |
Energy - 1.3% |
Exxon Mobil Corp. | | | 8,532 | | | | 323,960 | |
Chevron Corp. | | | 3,813 | | | | 276,290 | |
ConocoPhillips | | | 2,213 | | | | 68,160 | |
Kinder Morgan, Inc. | | | 3,928 | | | | 54,678 | |
Phillips 66 | | | 896 | | | | 48,070 | |
EOG Resources, Inc. | | | 1,173 | | | | 42,134 | |
Schlumberger Ltd. | | | 2,792 | | | | 37,664 | |
Valero Energy Corp. | | | 828 | | | | 37,558 | |
Williams Companies, Inc. | | | 2,444 | | | | 34,582 | |
Marathon Petroleum Corp. | | | 1,309 | | | | 30,919 | |
Pioneer Natural Resources Co. | | | 334 | | | | 23,430 | |
Occidental Petroleum Corp. | | | 1,801 | | | | 20,856 | |
ONEOK, Inc. | | | 833 | | | | 18,168 | |
Hess Corp. | | | 522 | | | | 17,383 | |
Concho Resources, Inc. | | | 405 | | | | 17,354 | |
Cabot Oil & Gas Corp. — Class A | | | 823 | | | | 14,147 | |
Baker Hughes Co. | | | 1,311 | | | | 13,765 | |
Halliburton Co. | | | 1,770 | | | | 12,125 | |
Diamondback Energy, Inc. | | | 325 | | | | 8,515 | |
National Oilwell Varco, Inc. | | | 778 | | | | 7,648 | |
HollyFrontier Corp. | | | 299 | | | | 7,329 | |
Noble Energy, Inc. | | | 965 | | | | 5,829 | |
TechnipFMC plc | | | 847 | | | | 5,709 | |
Devon Energy Corp. | | | 780 | | | | 5,390 | |
Marathon Oil Corp. | | | 1,613 | | | | 5,307 | |
Helmerich & Payne, Inc. | | | 219 | | | | 3,427 | |
Apache Corp. | | | 758 | | | | 3,168 | |
Total Energy | | | | | | | 1,143,565 | |
| | | | | | | | | |
Basic Materials - 0.9% |
Linde plc | | | 1,083 | | | | 187,359 | |
Air Products & Chemicals, Inc. | | | 445 | | | | 88,827 | |
Ecolab, Inc. | | | 506 | | | | 78,850 | |
Sherwin-Williams Co. | | | 166 | | | | 76,280 | |
Newmont Corp. | | | 1,653 | | | | 74,848 | |
DuPont de Nemours, Inc. | | | 1,494 | | | | 50,946 | |
Dow, Inc. | | | 1,495 | | | | 43,714 | |
PPG Industries, Inc. | | | 477 | | | | 39,877 | |
LyondellBasell Industries N.V. — Class A | | | 518 | | | | 25,708 | |
International Paper Co. | | | 791 | | | | 24,624 | |
Nucor Corp. | | | 611 | | | | 22,008 | |
International Flavors & Fragrances, Inc.1 | | | 215 | | | | 21,947 | |
FMC Corp. | | | 261 | | | | 21,321 | |
Freeport-McMoRan, Inc. | | | 2,926 | | | | 19,750 | |
Celanese Corp. — Class A | | | 244 | | | | 17,907 | |
Eastman Chemical Co. | | | 274 | | | | 12,763 | |
Albemarle Corp. | | | 214 | | | | 12,063 | |
CF Industries Holdings, Inc. | | | 438 | | | | 11,914 | |
Mosaic Co. | | | 705 | | | | 7,628 | |
Total Basic Materials | | | | | | | 838,334 | |
| | | | | | | | | |
Total Common Stocks | | | | |
(Cost $43,746,918) | | | | | | | 43,204,338 | |
| | | | | | | | | |
| | | Face
Amount | | | | | |
FEDERAL AGENCY DISCOUNT NOTES†† - 5.6% |
Federal Home Loan Bank |
0.05% due 04/08/202 | | $ | 5,000,000 | | | | 4,999,951 | |
Total Federal Agency Discount Notes | | | | |
(Cost $4,999,951) | | | | | | | 4,999,951 | |
| | | | | | | | | |
U.S. TREASURY BILLS†† - 1.9% |
U.S. Treasury Bills |
0.50% due 04/30/202,3 | | | 1,730,000 | | | | 1,729,923 | |
Total U.S. Treasury Bills | | | | |
(Cost $1,729,293) | | | | | | | 1,729,923 | |
| | | | | | | | | |
REPURCHASE AGREEMENTS††,4 - 30.6% |
J.P. Morgan Securities LLC
issued 03/31/20 at 0.01%
due 04/01/205 | | | 19,873,564 | | | | 19,873,564 | |
BofA Securities, Inc.
issued 03/31/20 at 0.00%
due 04/01/205 | | | 7,643,678 | | | | 7,643,678 | |
Total Repurchase Agreements | | | | |
(Cost $27,517,242) | | | | | | | 27,517,242 | |
16 | THE RYDEX FUNDS ANNUAL REPORT | SEE NOTES TO FINANCIAL STATEMENTS. |
SCHEDULE OF INVESTMENTS (continued) | March 31, 2020 |
S&P 500® 2x STRATEGY FUND | |
| | | Shares | | | Value | |
| SECURITIES LENDING COLLATERAL†,6 - 0.0% |
| Money Market Fund | | | | | | | | |
First American Government Obligations Fund — Class Z, 0.39%7 | | | 20,644 | | | $ | 20,644 | |
| Total Securities Lending Collateral | | | | | | | | |
| (Cost $20,644) | | | | | | | 20,644 | |
| | | | | | | | | |
| Total Investments - 86.2% | | | | | | | | |
| (Cost $78,014,048) | | | | | | $ | 77,472,098 | |
| Other Assets & Liabilities, net - 13.8% | | | | | | | 12,362,256 | |
| Total Net Assets - 100.0% | | | | | | $ | 89,834,354 | |
Futures Contracts |
Description | | Number of
Contracts | | | Expiration Date | | | Notional
Amount | | | Value and
Unrealized
Appreciation** | |
Equity Futures Contracts Purchased† |
S&P 500 Index Mini Futures Contracts | | | 37 | | | | Jun 2020 | | | $ | 4,759,125 | | | $ | 372,063 | |
Total Return Swap Agreements |
Counterparty | Index | Financing
Rate Pay | Payment
Frequency | | Maturity Date | | | Units | | | Notional
Amount | | | Value and
Unrealized
Depreciation | |
OTC Equity Index Swap Agreements†† |
BNP Paribas | S&P 500 Index | 1.54% (1 Month USD LIBOR + 0.55%) | At Maturity | | | 04/29/20 | | | | 1,006 | | | $ | 2,598,841 | | | $ | (45,731 | ) |
Barclays Bank plc | S&P 500 Index | 1.04% (1 Week USD LIBOR + 0.45%) | At Maturity | | | 04/30/20 | | | | 14,117 | | | | 36,487,240 | | | | (593,771 | ) |
Goldman Sachs International | S&P 500 Index | 1.04% (1 Week USD LIBOR + 0.45%) | At Maturity | | | 04/28/20 | | | | 36,091 | | | | 93,280,986 | | | | (1,607,886 | ) |
| | | | | | | | | | | | | | $ | 132,367,067 | | | $ | (2,247,388 | ) |
* | Non-income producing security. |
** | Includes cumulative appreciation (depreciation). Variation margin is reported within the Statement of Assets and Liabilities. |
† | Value determined based on Level 1 inputs — See Note 4. |
†† | Value determined based on Level 2 inputs — See Note 4. |
1 | All or a portion of this security is on loan at March 31, 2020 — See Note 7. |
2 | Rate indicated is the effective yield at the time of purchase. |
3 | All or a portion of this security is pledged as futures collateral at March 31, 2020. |
4 | Repurchase Agreements — See Note 6. |
5 | All or a portion of this security is pledged as equity index swap collateral at March 31, 2020. |
6 | Securities lending collateral — See Note 7. |
7 | Rate indicated is the 7-day yield as of March 31, 2020. |
| | LIBOR — London Interbank Offered Rate |
| | plc — Public Limited Company |
| | REIT — Real Estate Investment Trust |
| | |
| | See Sector Classification in Other Information section. |
SEE NOTES TO FINANCIAL STATEMENTS. | THE RYDEX FUNDS ANNUAL REPORT | 17 |
SCHEDULE OF INVESTMENTS (concluded) | March 31, 2020 |
S&P 500® 2x STRATEGY FUND | |
The following table summarizes the inputs used to value the Fund’s investments at March 31, 2020 (See Note 4 in the Notes to Financial Statements):
Investments in Securities (Assets) | | Level 1
Quoted
Prices | | | Level 2
Significant
Observable
Inputs | | | Level 3
Significant
Unobservable
Inputs | | | Total | |
Common Stocks | | $ | 43,204,338 | | | $ | — | | | $ | — | | | $ | 43,204,338 | |
Federal Agency Discount Notes | | | — | | | | 4,999,951 | | | | — | | | | 4,999,951 | |
U.S. Treasury Bills | | | — | | | | 1,729,923 | | | | — | | | | 1,729,923 | |
Repurchase Agreements | | | — | | | | 27,517,242 | | | | — | | | | 27,517,242 | |
Securities Lending Collateral | | | 20,644 | | | | — | | | | — | | | | 20,644 | |
Equity Futures Contracts** | | | 372,063 | | | | — | | | | — | | | | 372,063 | |
Total Assets | | $ | 43,597,045 | | | $ | 34,247,116 | | | $ | — | | | $ | 77,844,161 | |
Investments in Securities (Liabilities) | | Level 1
Quoted
Prices | | | Level 2
Significant
Observable
Inputs | | | Level 3
Significant
Unobservable
Inputs | | | Total | |
Equity Index Swap Agreements** | | $ | — | | | $ | 2,247,388 | | | $ | — | | | $ | 2,247,388 | |
** | This derivative is reported as unrealized appreciation/depreciation at period end. |
18 | THE RYDEX FUNDS ANNUAL REPORT | SEE NOTES TO FINANCIAL STATEMENTS. |
S&P 500® 2x STRATEGY FUND | |
STATEMENT OF ASSETS AND LIABILITIES
March 31, 2020
Assets: |
Investments, at value - including $19,416 of securities loaned (cost $50,496,806) | | $ | 49,954,856 | |
Repurchase agreements, at value (cost $27,517,242) | | | 27,517,242 | |
Cash | | | 9,722,657 | |
Segregated cash with broker | | | 10,279,070 | |
Receivables: |
Fund shares sold | | | 4,354,954 | |
Dividends | | | 57,116 | |
Securities lending income | | | 352 | |
Interest | | | 6 | |
Total assets | | | 101,886,253 | |
| | | | | |
Liabilities: |
Unrealized depreciation on OTC swap agreements | | | 2,247,388 | |
Payable for: |
Securities purchased | | | 7,947,383 | |
Fund shares redeemed | | | 1,400,189 | |
Swap settlement | | | 147,061 | |
Management fees | | | 74,314 | |
Variation margin on futures contracts | | | 71,595 | |
Transfer agent and administrative fees | | | 27,388 | |
Distribution and service fees | | | 23,937 | |
Return of securities lending collateral | | | 20,644 | |
Portfolio accounting fees | | | 12,386 | |
Trustees’ fees* | | | 2,356 | |
Miscellaneous | | | 77,258 | |
Total liabilities | | | 12,051,899 | |
Commitments and contingent liabilities (Note 11) | | | — | |
Net assets | | $ | 89,834,354 | |
| | | | | |
Net assets consist of: |
Paid in capital | | $ | 127,574,547 | |
Total distributable earnings (loss) | | | (37,740,193 | ) |
Net assets | | $ | 89,834,354 | |
| | | | | |
A-Class: |
Net assets | | $ | 10,133,779 | |
Capital shares outstanding | | | 117,068 | |
Net asset value per share | | $ | 86.56 | |
Maximum offering price per share (Net asset value divided by 95.25%) | | $ | 90.88 | |
| | | | | |
C-Class: |
Net assets | | $ | 2,380,712 | |
Capital shares outstanding | | | 32,479 | |
Net asset value per share | | $ | 73.30 | |
| | | | | |
H-Class: |
Net assets | | $ | 77,319,863 | |
Capital shares outstanding | | | 894,548 | |
Net asset value per share | | $ | 86.43 | |
STATEMENT OF OPERATIONS
Year Ended March 31, 2020
Investment Income: |
Dividends (net of foreign withholding tax of $1) | | $ | 2,168,481 | |
Interest | | | 710,982 | |
Income from securities lending, net | | | 880 | |
Total investment income | | | 2,880,343 | |
| | | | | |
Expenses: |
Management fees | | | 1,330,671 | |
Distribution and service fees: |
A-Class | | | 37,239 | |
C-Class | | | 50,073 | |
H-Class | | | 319,878 | |
Transfer agent and administrative fees | | | 376,378 | |
Portfolio accounting fees | | | 221,782 | |
Registration fees | | | 175,114 | |
Professional fees | | | 79,251 | |
Trustees’ fees* | | | 31,560 | |
Custodian fees | | | 20,536 | |
Line of credit fees | | | 103 | |
Miscellaneous | | | 113,275 | |
Total expenses | | | 2,755,860 | |
Net investment income | | | 124,483 | |
| | | | | |
Net Realized and Unrealized Gain (Loss): |
Net realized gain (loss) on: |
Investments | | | 9,632,539 | |
Swap agreements | | | (3,166,270 | ) |
Futures contracts | | | (5,704,663 | ) |
Net realized gain | | | 761,606 | |
Net change in unrealized appreciation (depreciation) on: |
Investments | | | (24,428,699 | ) |
Swap agreements | | | (3,502,295 | ) |
Futures contracts | | | 14,720 | |
Net change in unrealized appreciation (depreciation) | | | (27,916,274 | ) |
Net realized and unrealized loss | | | (27,154,668 | ) |
Net decrease in net assets resulting from operations | | $ | (27,030,185 | ) |
* | Relates to Trustees not deemed “interested persons” within the meaning of Section 2(a)(19) of the 1940 Act. |
SEE NOTES TO FINANCIAL STATEMENTS. | THE RYDEX FUNDS ANNUAL REPORT | 19 |
S&P 500® 2x STRATEGY FUND | |
STATEMENTS OF CHANGES IN NET ASSETS |
| | Year Ended
March 31,
2020 | | | Year Ended
March 31,
2019 | |
Increase (Decrease) in Net Assets from Operations: | | | | | | | | |
Net investment income | | $ | 124,483 | | | $ | 160,677 | |
Net realized gain on investments | | | 761,606 | | | | 5,392,537 | |
Net change in unrealized appreciation (depreciation) on investments | | | (27,916,274 | ) | | | 4,000,171 | |
Net increase (decrease) in net assets resulting from operations | | | (27,030,185 | ) | | | 9,553,385 | |
| | | | | | | | | |
Distributions to shareholders: | | | | | | | | |
A-Class | | | (310,937 | ) | | | — | |
C-Class | | | (82,112 | ) | | | — | |
H-Class | | | (2,614,461 | ) | | | — | |
Total distributions to shareholders | | | (3,007,510 | ) | | | — | |
| | | | | | | | | |
Capital share transactions: | | | | | | | | |
Proceeds from sale of shares | | | | | | | | |
A-Class | | | 9,088,195 | | | | 16,718,124 | |
C-Class | | | 30,438,858 | | | | 38,731,236 | |
H-Class | | | 1,528,970,793 | | | | 1,737,098,212 | |
Distributions reinvested | | | | | | | | |
A-Class | | | 302,139 | | | | — | |
C-Class | | | 66,334 | | | | — | |
H-Class | | | 1,941,885 | | | | — | |
Cost of shares redeemed | | | | | | | | |
A-Class | | | (9,384,683 | ) | | | (14,380,814 | ) |
C-Class | | | (28,833,271 | ) | | | (49,968,745 | ) |
H-Class | | | (1,554,891,260 | ) | | | (1,747,024,905 | ) |
Net decrease from capital share transactions | | | (22,301,010 | ) | | | (18,826,892 | ) |
Net decrease in net assets | | | (52,338,705 | ) | | | (9,273,507 | ) |
| | | | | | | | | |
Net assets: | | | | | | | | |
Beginning of year | | | 142,173,059 | | | | 151,446,566 | |
End of year | | $ | 89,834,354 | | | $ | 142,173,059 | |
| | | | | | | | | |
Capital share activity: | | | | | | | | |
Shares sold | | | | | | | | |
A-Class | | | 72,930 | | | | 149,625 | |
C-Class | | | 290,620 | | | | 414,225 | |
H-Class | | | 11,880,218 | | | | 15,576,422 | |
Shares issued from reinvestment of distributions | | | | | | | | |
A-Class | | | 2,104 | | | | — | |
C-Class | | | 544 | | | | — | |
H-Class | | | 13,541 | | | | — | |
Shares redeemed | | | | | | | | |
A-Class | | | (74,056 | ) | | | (131,337 | ) |
C-Class | | | (300,624 | ) | | | (524,152 | ) |
H-Class | | | (12,061,719 | ) | | | (15,730,485 | ) |
Net decrease in shares | | | (176,442 | ) | | | (245,702 | ) |
20 | THE RYDEX FUNDS ANNUAL REPORT | SEE NOTES TO FINANCIAL STATEMENTS. |
S&P 500® 2x STRATEGY FUND | |
This table is presented to show selected data for a share outstanding throughout each period and to assist shareholders in evaluating a Fund’s performance for the periods presented.
A-Class | | Year Ended
March 31,
2020 | | | Year Ended
March 31,
2019 | | | Year Ended
March 29,
2018 | | | Year Ended
March 31,
2017 | | | Year Ended
March 31,
2016 | |
Per Share Data |
Net asset value, beginning of period | | $ | 117.21 | | | $ | 104.90 | | | $ | 89.56 | | | $ | 67.98 | | | $ | 70.18 | |
Income (loss) from investment operations: |
Net investment income (loss)a | | | .12 | | | | .18 | | | | .07 | | | | (.25 | ) | | | (.16 | ) |
Net gain (loss) on investments (realized and unrealized) | | | (28.08 | ) | | | 12.13 | | | | 21.60 | | | | 21.96 | | | | (1.02 | ) |
Total from investment operations | | | (27.96 | ) | | | 12.31 | | | | 21.67 | | | | 21.71 | | | | (1.18 | ) |
Less distributions from: |
Net realized gains | | | (2.69 | ) | | | — | | | | (6.33 | ) | | | (.13 | ) | | | (1.02 | ) |
Total distributions | | | (2.69 | ) | | | — | | | | (6.33 | ) | | | (.13 | ) | | | (1.02 | ) |
Net asset value, end of period | | $ | 86.56 | | | $ | 117.21 | | | $ | 104.90 | | | $ | 89.56 | | | $ | 67.98 | |
|
Total Returnb | | | (24.76 | %) | | | 11.73 | % | | | 23.92 | % | | | 31.95 | % | | | (1.69 | %) |
Ratios/Supplemental Data |
Net assets, end of period (in thousands) | | $ | 10,134 | | | $ | 13,607 | | | $ | 10,259 | | | $ | 10,772 | | | $ | 12,011 | |
Ratios to average net assets: |
Net investment income (loss) | | | 0.10 | % | | | 0.16 | % | | | 0.07 | % | | | (0.33 | %) | | | (0.23 | %) |
Total expenses | | | 1.84 | % | | | 1.85 | % | | | 1.77 | % | | | 1.79 | % | | | 1.76 | % |
Portfolio turnover rate | | | 328 | % | | | 367 | % | | | 276 | % | | | 411 | % | | | 216 | % |
C-Class | | Year Ended
March 31,
2020 | | | Year Ended
March 31,
2019 | | | Year Ended
March 29,
2018 | | | Year Ended
March 31,
2017 | | | Year Ended
March 31,
2016 | |
Per Share Data |
Net asset value, beginning of period | | $ | 100.33 | | | $ | 90.47 | | | $ | 78.49 | | | $ | 60.04 | | | $ | 62.57 | |
Income (loss) from investment operations: |
Net investment income (loss)a | | | (.60 | ) | | | (.60 | ) | | | (.61 | ) | | | (.72 | ) | | | (.59 | ) |
Net gain (loss) on investments (realized and unrealized) | | | (23.74 | ) | | | 10.46 | | | | 18.92 | | | | 19.30 | | | | (.92 | ) |
Total from investment operations | | | (24.34 | ) | | | 9.86 | | | | 18.31 | | | | 18.58 | | | | (1.51 | ) |
Less distributions from: |
Net realized gains | | | (2.69 | ) | | | — | | | | (6.33 | ) | | | (.13 | ) | | | (1.02 | ) |
Total distributions | | | (2.69 | ) | | | — | | | | (6.33 | ) | | | (.13 | ) | | | (1.02 | ) |
Net asset value, end of period | | $ | 73.30 | | | $ | 100.33 | | | $ | 90.47 | | | $ | 78.49 | | | $ | 60.04 | |
|
Total Returnb | | | (25.33 | %) | | | 10.90 | % | | | 23.00 | % | | | 30.96 | % | | | (2.43 | %) |
Ratios/Supplemental Data |
Net assets, end of period (in thousands) | | $ | 2,381 | | | $ | 4,208 | | | $ | 13,739 | | | $ | 9,475 | | | $ | 9,373 | |
Ratios to average net assets: |
Net investment income (loss) | | | (0.56 | %) | | | (0.63 | %) | | | (0.68 | %) | | | (1.08 | %) | | | (0.99 | %) |
Total expenses | | | 2.58 | % | | | 2.57 | % | | | 2.52 | % | | | 2.54 | % | | | 2.51 | % |
Portfolio turnover rate | | | 328 | % | | | 367 | % | | | 276 | % | | | 411 | % | | | 216 | % |
SEE NOTES TO FINANCIAL STATEMENTS. | THE RYDEX FUNDS ANNUAL REPORT | 21 |
S&P 500® 2x STRATEGY FUND | |
FINANCIAL HIGHLIGHTS (concluded) |
This table is presented to show selected data for a share outstanding throughout each period and to assist shareholders in evaluating a Fund’s performance for the periods presented.
H-Class | | Year Ended
March 31,
2020 | | | Year Ended
March 31,
2019 | | | Year Ended
March 29,
2018 | | | Year Ended
March 31,
2017 | | | Year Ended
March 31,
2016 | |
Per Share Data |
Net asset value, beginning of period | | $ | 117.04 | | | $ | 104.76 | | | $ | 89.45 | | | $ | 67.91 | | | $ | 70.12 | |
Income (loss) from investment operations: |
Net investment income (loss)a | | | .14 | | | | .17 | | | | .03 | | | | (.23 | ) | | | (.16 | ) |
Net gain (loss) on investments (realized and unrealized) | | | (28.06 | ) | | | 12.11 | | | | 21.61 | | | | 21.90 | | | | (1.03 | ) |
Total from investment operations | | | (27.92 | ) | | | 12.28 | | | | 21.64 | | | | 21.67 | | | | (1.19 | ) |
Less distributions from: |
Net realized gains | | | (2.69 | ) | | | — | | | | (6.33 | ) | | | (.13 | ) | | | (1.02 | ) |
Total distributions | | | (2.69 | ) | | | — | | | | (6.33 | ) | | | (.13 | ) | | | (1.02 | ) |
Net asset value, end of period | | $ | 86.43 | | | $ | 117.04 | | | $ | 104.76 | | | $ | 89.45 | | | $ | 67.91 | |
|
Total Return | | | (24.77 | %) | | | 11.72 | % | | | 23.92 | % | | | 31.93 | % | | | (1.71 | %) |
Ratios/Supplemental Data |
Net assets, end of period (in thousands) | | $ | 77,320 | | | $ | 124,359 | | | $ | 127,448 | | | $ | 104,986 | | | $ | 113,954 | |
Ratios to average net assets: |
Net investment income (loss) | | | 0.11 | % | | | 0.15 | % | | | 0.03 | % | | | (0.31 | %) | | | (0.24 | %) |
Total expenses | | | 1.84 | % | | | 1.84 | % | | | 1.75 | % | | | 1.80 | % | | | 1.76 | % |
Portfolio turnover rate | | | 328 | % | | | 367 | % | | | 276 | % | | | 411 | % | | | 216 | % |
a | Net investment income (loss) per share was computed using average shares outstanding throughout the period. |
b | Total return does not reflect the impact of any applicable sales charges. |
22 | THE RYDEX FUNDS ANNUAL REPORT | SEE NOTES TO FINANCIAL STATEMENTS. |
PERFORMANCE REPORT AND FUND PROFILE (Unaudited) | March 31, 2020 |
INVERSE S&P 500® 2x STRATEGY FUND
OBJECTIVE: Seeks to provide investment results that match, before fees and expenses, the performance of a specific benchmark on a daily basis. The Fund’s current benchmark is 200% of the inverse (opposite) of the performance of the S&P 500® Index (the “underlying index”). The Fund does not seek to achieve its investment objective over a period of time greater than one day.
For the one-year period ended March 31, 2020, Inverse S&P 500® 2x Strategy Fund maintained a daily correlation of over 99% to its benchmark of -200% of the daily price movement of the S&P 500 Index. Inverse S&P 500® 2x Strategy Fund H-Class returned -7.62%, while the S&P 500® Index returned -6.98% over the same period.
The only sector contributing to the return of the underlying index was Information Technology. The sectors detracting the most were Energy, Financials, and Industrials.
The holdings contributing the most to the return of the underlying index were Microsoft Corp., Apple, Inc., and Amazon.com, Inc. The holdings detracting the most were ExxonMobil Corp., Boeing Co., and Chevron Corp.
Derivatives in the Fund were used to help provide exposure to the composition of the benchmark in the most efficient manner possible and to provide leverage and not for hedging purposes. Derivatives performed as expected.
Due to the compounding of daily returns, leveraged and inverse funds’ returns over periods other than one day will likely differ in amount and possibly direction from the benchmark return for the same period. Investors should monitor their leveraged and inverse funds’ holdings to ensure that they are consistent with their strategies, as frequently as daily.
The effects of compounding may cause the longer-term correlation of the Fund to its benchmark to diminish. The apparent discrepancy between the leveraged and unleveraged indices is the result of compounding, which is described briefly on page 6 of this report.
Performance displayed represents past performance, which is no guarantee of future results.
Holdings Diversification (Market Exposure as % of Net Assets)

“Holdings Diversification (Market Exposure as % of Net Assets)” excludes any temporary cash investments.
Inception Dates: |
A-Class | September 1, 2004 |
C-Class | March 7, 2001 |
H-Class | May 19, 2000 |
The Fund invests principally in derivative investments such as swap agreements and futures contracts.
| | THE RYDEX FUNDS ANNUAL REPORT | 23 |
PERFORMANCE REPORT AND FUND PROFILE (Unaudited)(concluded) | March 31, 2020 |
Cumulative Fund Performance*

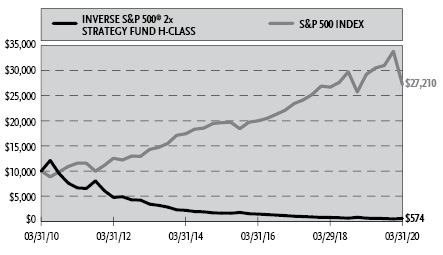
Average Annual Returns*
Periods Ended March 31, 2020
| 1 Year | 5 Year | 10 Year |
A-Class Shares | (7.66%) | (18.81%) | (24.86%) |
A-Class Shares with sales charge† | (12.05%) | (19.60%) | (25.23%) |
C-Class Shares | (8.29%) | (19.43%) | (25.40%) |
C-Class Shares with CDSC‡ | (9.21%) | (19.43%) | (25.40%) |
H-Class Shares | (7.62%) | (18.81%) | (24.85%) |
S&P 500 Index | (6.98%) | 6.73% | 10.53% |
* | The performance data above represents past performance that is not predictive of future results. The investment return and principal value of an investment in the Fund will fluctuate so that an investor’s shares, when redeemed, may be worth more or less than their original cost. Returns are historical and include changes in principal and reinvested dividends and capital gains and do not reflect the effect of taxes. The S&P 500 Index is an unmanaged index and, unlike the Fund, has no management fees or operating expenses to reduce its reported return. The graphs are based on A-Class shares and H-Class shares only; performance for C-Class shares will vary due to differences in fee structures. |
† | Fund returns are calculated using the maximum sales charge of 4.75%. |
‡ | Fund returns include a CDSC of 1% if redeemed within 12 months of purchase. |
24 | THE RYDEX FUNDS ANNUAL REPORT | |
SCHEDULE OF INVESTMENTS | March 31, 2020 |
INVERSE S&P 500® 2x STRATEGY FUND | |
| | Face
Amount | | | Value | |
FEDERAL AGENCY NOTES†† - 22.4% |
Fannie Mae |
0.09% (U.S. Secured Overnight Financing Rate + 0.08%, Rate Floor: 0.00%) due 09/16/201 | | $ | 5,000,000 | | | $ | 4,999,534 | |
0.23% (U.S. Secured Overnight Financing Rate + 0.22%, Rate Floor: 0.00%) due 03/16/221 | | | 2,000,000 | | | | 1,996,038 | |
Freddie Mac | | | | | | | | |
0.01% (U.S. Secured Overnight Financing Rate, Rate Floor: 0.00%) due 04/13/201 | | | 5,000,000 | | | | 4,999,883 | |
Federal Farm Credit Bank |
1.53% (3 Month USD LIBOR - 0.21%, Rate Floor: 0.00%) due 08/10/201 | | | 2,000,000 | | | | 1,999,035 | |
0.45% (U.S. Prime Rate - 2.80%, Rate Floor: 0.00%) due 03/14/221 | | | 1,000,000 | | | | 1,002,205 | |
0.44% (U.S. Prime Rate - 2.81%, Rate Floor: 0.00%) due 05/20/221 | | | 600,000 | | | | 601,303 | |
Federal Home Loan Bank |
0.75% (3 Month USD LIBOR - 0.14%, Rate Floor: 0.00%) due 12/18/201 | | | 2,100,000 | | | | 2,100,443 | |
Total Federal Agency Notes | | | | |
(Cost $17,698,006) | | | | | | | 17,698,441 | |
| | | | | | | | | |
FEDERAL AGENCY DISCOUNT NOTES†† - 10.8% |
Federal Home Loan Bank |
0.05% due 04/03/202 | | | 8,570,000 | | | | 8,569,976 | |
Total Federal Agency Discount Notes | | | | |
(Cost $8,569,976) | | | | | | | 8,569,976 | |
| | | | | | | | | |
U.S. TREASURY BILLS†† - 0.3% |
U.S. Treasury Bills |
0.50% due 04/30/202,3 | | | 227,000 | | | | 226,990 | |
Total U.S. Treasury Bills | | | | |
(Cost $226,907) | | | | | | | 226,990 | |
| | | | | | | | | |
REPURCHASE AGREEMENTS††,4 - 53.1% |
J.P. Morgan Securities LLC
issued 03/31/20 at 0.01%
due 04/01/205 | | | 30,269,064 | | | | 30,269,064 | |
BofA Securities, Inc.
issued 03/31/20 at 0.00%
due 04/01/205 | | | 11,641,948 | | | | 11,641,948 | |
Total Repurchase Agreements | | | | |
(Cost $41,911,012) | | | | | | | 41,911,012 | |
| | | | | | | | | |
Total Investments - 86.6% | | | | |
(Cost $68,405,901) | | $ | 68,406,419 | |
Other Assets & Liabilities, net - 13.4% | | | 10,596,112 | |
Total Net Assets - 100.0% | | $ | 79,002,531 | |
Futures Contracts |
Description | | Number of
Contracts | | | Expiration Date | | | Notional
Amount | | | Value and
Unrealized
Depreciation** | |
Equity Futures Contracts Sold Short† |
S&P 500 Index Mini Futures Contracts | | | 95 | | | | Jun 2020 | | | $ | 12,219,375 | | | $ | (23,158 | ) |
Total Return Swap Agreements |
Counterparty | Index | Financing
Rate Receive | Payment
Frequency | | Maturity Date | | | Units | | | Notional
Amount | | | Value and
Unrealized
Appreciation
(Depreciation) | |
OTC Equity Index Swap Agreements Sold Short†† |
BNP Paribas | S&P 500 Index | (1.04)% (1 Month USD LIBOR + 0.05%) | At Maturity | | | 04/29/20 | | | | 28,958 | | | $ | 74,845,627 | | | $ | 1,159,686 | |
Barclays Bank plc | S&P 500 Index | (0.89)% (1 Week USD LIBOR + 0.30%) | At Maturity | | | 04/30/20 | | | | 9,159 | | | | 23,671,885 | | | | 385,221 | |
Goldman Sachs International | S&P 500 Index | (0.94)% (1 Week USD LIBOR + 0.35%) | At Maturity | | | 04/28/20 | | | | 18,038 | | | | 46,619,969 | | | | (1,536,589 | ) |
| | | | | | | | | | | | | | $ | 145,137,481 | | | $ | 8,318 | |
SEE NOTES TO FINANCIAL STATEMENTS. | THE RYDEX FUNDS ANNUAL REPORT | 25 |
SCHEDULE OF INVESTMENTS (concluded) | March 31, 2020 |
INVERSE S&P 500® 2x STRATEGY FUND | |
** | Includes cumulative appreciation (depreciation). Variation margin is reported within the Statement of Assets and Liabilities. |
† | Value determined based on Level 1 inputs — See Note 4. |
†† | Value determined based on Level 2 inputs — See Note 4. |
1 | Variable rate security. Rate indicated is the rate effective at March 31, 2020. In some instances, the effective rate is limited by a minimum rate floor or a maximum rate cap established by the issuer. The settlement status of a position may also impact the effective rate indicated. In some cases, a position may be unsettled at period end and may not have a stated effective rate. In instances where multiple underlying reference rates and spread amounts are shown, the effective rate is based on a weighted average. |
2 | Rate indicated is the effective yield at the time of purchase. |
3 | All or a portion of this security is pledged as futures collateral at March 31, 2020. |
4 | Repurchase Agreements — See Note 6. |
5 | All or a portion of this security is pledged as equity index swap collateral at March 31, 2020. |
| | LIBOR — London Interbank Offered Rate |
| | plc — Public Limited Company |
| | |
| | See Sector Classification in Other Information section. |
The following table summarizes the inputs used to value the Fund’s investments at March 31, 2020 (See Note 4 in the Notes to Financial Statements):
Investments in Securities (Assets) | | Level 1
Quoted
Prices | | | Level 2
Significant
Observable
Inputs | | | Level 3
Significant
Unobservable
Inputs | | | Total | |
Federal Agency Notes | | $ | — | | | $ | 17,698,441 | | | $ | — | | | $ | 17,698,441 | |
Federal Agency Discount Notes | | | — | | | | 8,569,976 | | | | — | | | | 8,569,976 | |
U.S. Treasury Bills | | | — | | | | 226,990 | | | | — | | | | 226,990 | |
Repurchase Agreements | | | — | | | | 41,911,012 | | | | — | | | | 41,911,012 | |
Equity Index Swap Agreements** | | | — | | | | 1,544,907 | | | | — | | | | 1,544,907 | |
Total Assets | | $ | — | | | $ | 69,951,326 | | | $ | — | | | $ | 69,951,326 | |
Investments in Securities (Liabilities) | | Level 1
Quoted
Prices | | | Level 2
Significant
Observable
Inputs | | | Level 3
Significant
Unobservable
Inputs | | | Total | |
Equity Futures Contracts** | | $ | 23,158 | | | $ | — | | | $ | — | | | $ | 23,158 | |
Equity Index Swap Agreements** | | | — | | | | 1,536,589 | | | | — | | | | 1,536,589 | |
Total Liabilities | | $ | 23,158 | | | $ | 1,536,589 | | | $ | — | | | $ | 1,559,747 | |
** | This derivative is reported as unrealized appreciation/depreciation at period end. |
26 | THE RYDEX FUNDS ANNUAL REPORT | SEE NOTES TO FINANCIAL STATEMENTS. |
INVERSE S&P 500® 2x STRATEGY FUND | |
STATEMENT OF ASSETS AND LIABILITIES
March 31, 2020
Assets: |
Investments, at value (cost $26,494,889) | | $ | 26,495,407 | |
Repurchase agreements, at value (cost $41,911,012) | | | 41,911,012 | |
Cash | | | 18,111,491 | |
Segregated cash with broker | | | 4,954,144 | |
Unrealized appreciation on OTC swap agreements | | | 1,544,907 | |
Receivables: |
Fund shares sold | | | 2,104,668 | |
Variation margin on futures contracts | | | 183,825 | |
Interest | | | 20,423 | |
Total assets | | | 95,325,877 | |
| | | | | |
Liabilities: |
Unrealized depreciation on OTC swap agreements | | | 1,536,589 | |
Payable for: |
Fund shares redeemed | | | 8,156,404 | |
Swap settlement | | | 6,512,923 | |
Management fees | | | 44,465 | |
Transfer agent and administrative fees | | | 13,975 | |
Distribution and service fees | | | 12,654 | |
Portfolio accounting fees | | | 7,411 | |
Trustees’ fees* | | | 1,204 | |
Miscellaneous | | | 37,721 | |
Total liabilities | | | 16,323,346 | |
Commitments and contingent liabilities (Note 11) | | | — | |
Net assets | | $ | 79,002,531 | |
| | | | | |
Net assets consist of: |
Paid in capital | | $ | 271,410,420 | |
Total distributable earnings (loss) | | | (192,407,889 | ) |
Net assets | | $ | 79,002,531 | |
| | | | | |
A-Class: |
Net assets | | $ | 10,142,902 | |
Capital shares outstanding | | | 301,892 | |
Net asset value per share | | $ | 33.60 | |
Maximum offering price per share (Net asset value divided by 95.25%) | | $ | 35.28 | |
| | | | | |
C-Class: |
Net assets | | $ | 361,614 | |
Capital shares outstanding | | | 12,445 | |
Net asset value per share | | $ | 29.06 | |
| | | | | |
H-Class: |
Net assets | | $ | 68,498,015 | |
Capital shares outstanding | | | 2,031,824 | |
Net asset value per share | | $ | 33.71 | |
STATEMENT OF OPERATIONS
Year Ended March 31, 2020
Investment Income: |
Interest | | $ | 442,587 | |
Total investment income | | | 442,587 | |
| | | | | |
Expenses: |
Management fees | | | 220,547 | |
Distribution and service fees: |
A-Class | | | 8,372 | |
C-Class | | | 5,897 | |
H-Class | | | 51,423 | |
Transfer agent and administrative fees | | | 62,889 | |
Portfolio accounting fees | | | 36,760 | |
Registration fees | | | 29,734 | |
Professional fees | | | 15,450 | |
Trustees’ fees* | | | 5,683 | |
Custodian fees | | | 3,453 | |
Prime broker interest expense | | | 186 | |
Line of credit fees | | | 119 | |
Miscellaneous | | | 13,064 | |
Total expenses | | | 453,577 | |
Net investment loss | | | (10,990 | ) |
| | | | | |
Net Realized and Unrealized Gain (Loss): |
Net realized gain (loss) on: |
Investments | | | 8,172 | |
Swap agreements | | | (10,088,750 | ) |
Futures contracts | | | (3,102,978 | ) |
Net realized loss | | | (13,183,556 | ) |
Net change in unrealized appreciation (depreciation) on: |
Investments | | | (3,240 | ) |
Swap agreements | | | 302,542 | |
Futures contracts | | | 193,443 | |
Net change in unrealized appreciation (depreciation) | | | 492,745 | |
Net realized and unrealized loss | | | (12,690,811 | ) |
Net decrease in net assets resulting from operations | | $ | (12,701,801 | ) |
* | Relates to Trustees not deemed “interested persons” within the meaning of Section 2(a)(19) of the 1940 Act. |
SEE NOTES TO FINANCIAL STATEMENTS. | THE RYDEX FUNDS ANNUAL REPORT | 27 |
INVERSE S&P 500® 2x STRATEGY FUND | |
STATEMENTS OF CHANGES IN NET ASSETS |
| | Year Ended
March 31,
2020 | | | Year Ended
March 31,
2019 | |
Increase (Decrease) in Net Assets from Operations: | | | | | | | | |
Net investment income (loss) | | $ | (10,990 | ) | | $ | 70,316 | |
Net realized loss on investments | | | (13,183,556 | ) | | | (6,885,302 | ) |
Net change in unrealized appreciation (depreciation) on investments | | | 492,745 | | | | (384,480 | ) |
Net decrease in net assets resulting from operations | | | (12,701,801 | ) | | | (7,199,466 | ) |
| | | | | | | | | |
Distributions to shareholders: | | | | | | | | |
A-Class | | | (2,837 | ) | | | — | |
C-Class | | | (1,417 | ) | | | — | |
H-Class | | | (66,062 | ) | | | — | |
Total distributions to shareholders | | | (70,316 | ) | | | — | |
| | | | | | | | | |
Capital share transactions: | | | | | | | | |
Proceeds from sale of shares | | | | | | | | |
A-Class | | | 72,056,100 | | | | 15,522,135 | |
C-Class | | | 4,699,264 | | | | 6,844,691 | |
H-Class | | | 723,047,617 | | | | 963,793,190 | |
Distributions reinvested | | | | | | | | |
A-Class | | | 2,770 | | | | — | |
C-Class | | | 1,067 | | | | — | |
H-Class | | | 60,000 | | | | — | |
Cost of shares redeemed | | | | | | | | |
A-Class | | | (61,706,198 | ) | | | (15,162,638 | ) |
C-Class | | | (4,928,315 | ) | | | (6,833,738 | ) |
H-Class | | | (662,540,748 | ) | | | (964,210,949 | ) |
Net increase (decrease) from capital share transactions | | | 70,691,557 | | | | (47,309 | ) |
Net increase (decrease) in net assets | | | 57,919,440 | | | | (7,246,775 | ) |
| | | | | | | | | |
Net assets: | | | | | | | | |
Beginning of year | | | 21,083,091 | | | | 28,329,866 | |
End of year | | $ | 79,002,531 | | | $ | 21,083,091 | |
| | | | | | | | | |
Capital share activity: | | | | | | | | |
Shares sold | | | | | | | | |
A-Class | | | 1,992,332 | | | | 373,904 | |
C-Class | | | 171,213 | | | | 196,072 | |
H-Class | | | 22,444,762 | | | | 23,685,574 | |
Shares issued from reinvestment of distributions | | | | | | | | |
A-Class | | | 99 | | | | — | |
C-Class | | | 44 | | | | — | |
H-Class | | | 2,137 | | | | — | |
Shares redeemed | | | | | | | | |
A-Class | | | (1,736,160 | ) | | | (372,190 | ) |
C-Class | | | (178,663 | ) | | | (196,864 | ) |
H-Class | | | (20,928,860 | ) | | | (23,738,892 | ) |
Net increase (decrease) in shares | | | 1,766,904 | | | | (52,396 | ) |
28 | THE RYDEX FUNDS ANNUAL REPORT | SEE NOTES TO FINANCIAL STATEMENTS. |
INVERSE S&P 500® 2x STRATEGY FUND | |
This table is presented to show selected data for a share outstanding throughout each period and to assist shareholders in evaluating a Fund’s performance for the periods presented.
A-Class | | Year Ended
March 31,
2020 | | | Year Ended
March 31,
2019 | | | Year Ended
March 29,
2018 | | | Year Ended
March 31,
2017d | | | Year Ended
March 31,
2016d | |
Per Share Data |
Net asset value, beginning of period | | $ | 36.47 | | | $ | 44.92 | | | $ | 59.26 | | | $ | 84.22 | | | $ | 95.49 | |
Income (loss) from investment operations: |
Net investment income (loss)a | | | (.10 | ) | | | .09 | | | | (.39 | ) | | | (1.01 | ) | | | (1.52 | ) |
Net gain (loss) on investments (realized and unrealized) | | | (2.71 | ) | | | (8.54 | ) | | | (13.95 | ) | | | (23.95 | ) | | | (9.75 | ) |
Total from investment operations | | | (2.81 | ) | | | (8.45 | ) | | | (14.34 | ) | | | (24.96 | ) | | | (11.27 | ) |
Less distributions from: |
Net investment income | | | (.06 | ) | | | — | | | | — | | | | — | | | | — | |
Total distributions | | | (.06 | ) | | | — | | | | — | | | | — | | | | — | |
Net asset value, end of period | | $ | 33.60 | | | $ | 36.47 | | | $ | 44.92 | | | $ | 59.26 | | | $ | 84.22 | |
|
Total Returnb | | | (7.66 | %) | | | (18.81 | %) | | | (24.20 | %) | | | (29.63 | %) | | | (11.81 | %) |
Ratios/Supplemental Data |
Net assets, end of period (in thousands) | | $ | 10,143 | | | $ | 1,664 | | | $ | 1,972 | | | $ | 5,953 | | | $ | 7,393 | |
Ratios to average net assets: |
Net investment income (loss) | | | (0.28 | %) | | | 0.23 | % | | | (0.74 | %) | | | (1.39 | %) | | | (1.60 | %) |
Total expenses | | | 1.82 | % | | | 1.85 | % | | | 1.76 | % | | | 1.80 | % | | | 1.76 | % |
Portfolio turnover rate | | | — | | | | — | | | | 53 | % | | | 78 | % | | | — | |
C-Class | | Year Ended
March 31,
2020 | | | Year Ended
March 31,
2019 | | | Year Ended
March 29,
2018 | | | Year Ended
March 31,
2017d | | | Year Ended
March 31,
2016d | |
Per Share Data |
Net asset value, beginning of period | | $ | 31.77 | | | $ | 39.41 | | | $ | 52.40 | | | $ | 75.05 | | | $ | 85.79 | |
Income (loss) from investment operations: |
Net investment income (loss)a | | | (.15 | ) | | | (.17 | ) | | | (.61 | ) | | | (1.42 | ) | | | (2.00 | ) |
Net gain (loss) on investments (realized and unrealized) | | | (2.50 | ) | | | (7.47 | ) | | | (12.38 | ) | | | (21.23 | ) | | | (8.74 | ) |
Total from investment operations | | | (2.65 | ) | | | (7.64 | ) | | | (12.99 | ) | | | (22.65 | ) | | | (10.74 | ) |
Less distributions from: |
Net investment income | | | (.06 | ) | | | — | | | | — | | | | — | | | | — | |
Total distributions | | | (.06 | ) | | | — | | | | — | | | | — | | | | — | |
Net asset value, end of period | | $ | 29.06 | | | $ | 31.77 | | | $ | 39.41 | | | $ | 52.40 | | | $ | 75.05 | |
|
Total Returnb | | | (8.29 | %) | | | (19.39 | %) | | | (24.79 | %) | | | (30.21 | %) | | | (12.49 | %) |
Ratios/Supplemental Data |
Net assets, end of period (in thousands) | | $ | 362 | | | $ | 631 | | | $ | 814 | | | $ | 1,567 | | | $ | 1,675 | |
Ratios to average net assets: |
Net investment income (loss) | | | (0.55 | %) | | | (0.48 | %) | | | (1.40 | %) | | | (2.14 | %) | | | (2.35 | %) |
Total expenses | | | 2.58 | % | | | 2.56 | % | | | 2.52 | % | | | 2.54 | % | | | 2.47 | % |
Portfolio turnover rate | | | — | | | | — | | | | 53 | % | | | 78 | % | | | — | |
SEE NOTES TO FINANCIAL STATEMENTS. | THE RYDEX FUNDS ANNUAL REPORT | 29 |
INVERSE S&P 500® 2x STRATEGY FUND | |
FINANCIAL HIGHLIGHTS (concluded) |
This table is presented to show selected data for a share outstanding throughout each period and to assist shareholders in evaluating a Fund’s performance for the periods presented.
H-Class | | Year Ended
March 31,
2020 | | | Year Ended
March 31,
2019 | | | Year Ended
March 29,
2018 | | | Year Ended
March 31,
2017d | | | Year Ended
March 31,
2016d | |
Per Share Data |
Net asset value, beginning of period | | $ | 36.57 | | | $ | 45.04 | | | $ | 59.44 | | | $ | 84.51 | | | $ | 95.77 | |
Income (loss) from investment operations: |
Net investment income (loss)a | | | — | c | | | .10 | | | | (.34 | ) | | | (1.01 | ) | | | (1.52 | ) |
Net gain (loss) on investments (realized and unrealized) | | | (2.80 | ) | | | (8.57 | ) | | | (14.06 | ) | | | (24.06 | ) | | | (9.74 | ) |
Total from investment operations | | | (2.80 | ) | | | (8.47 | ) | | | (14.40 | ) | | | (25.07 | ) | | | (11.26 | ) |
Less distributions from: |
Net investment income | | | (.06 | ) | | | — | | | | — | | | | — | | | | — | |
Total distributions | | | (.06 | ) | | | — | | | | — | | | | — | | | | — | |
Net asset value, end of period | | $ | 33.71 | | | $ | 36.57 | | | $ | 45.04 | | | $ | 59.44 | | | $ | 84.51 | |
|
Total Return | | | (7.62 | %) | | | (18.81 | %) | | | (24.23 | %) | | | (29.67 | %) | | | (11.74 | %) |
Ratios/Supplemental Data |
Net assets, end of period (in thousands) | | $ | 68,498 | | | $ | 18,789 | | | $ | 25,544 | | | $ | 27,516 | | | $ | 43,763 | |
Ratios to average net assets: |
Net investment income (loss) | | | 0.01 | % | | | 0.25 | % | | | (0.67 | %) | | | (1.40 | %) | | | (1.63 | %) |
Total expenses | | | 1.84 | % | | | 1.84 | % | | | 1.76 | % | | | 1.80 | % | | | 1.76 | % |
Portfolio turnover rate | | | — | | | | — | | | | 53 | % | | | 78 | % | | | — | |
a | Net investment income (loss) per share was computed using average shares outstanding throughout the period. |
b | Total return does not reflect the impact of any applicable sales charges. |
c | Net investment income is less than $0.01 per share. |
d | Reverse Share split — Per share amounts for the years presented through March 31, 2017 have been restated to reflect a 1:4 reverse share split effective November 7, 2016. |
30 | THE RYDEX FUNDS ANNUAL REPORT | SEE NOTES TO FINANCIAL STATEMENTS. |
PERFORMANCE REPORT AND FUND PROFILE (Unaudited) | March 31, 2020 |
NASDAQ-100® 2x STRATEGY FUND
OBJECTIVE: Seeks to provide investment results that match, before fees and expenses, the performance of a specific benchmark on a daily basis. The Fund’s current benchmark is 200% of the performance of the NASDAQ-100® Index (the “underlying index”). The Fund does not seek to achieve its investment objective over a period of time greater than one day.
For the one-year period ended March 31, 2020, NASDAQ-100® 2x Strategy Fund maintained a daily correlation of over 99% to its benchmark of 200% of the daily price movement of the NASDAQ-100 Index. NASDAQ-100® 2x Strategy Fund H-Class returned -0.76%, while the NASDAQ-100 Index returned 7.03% over the same time period.
The sectors contributing the most to the return of the underlying index were Information Technology, Consumer Discretionary, and Health Care. The sectors detracting the most were Industrials, Utilities, and Consumer Staples.
The holdings contributing the most to the return of the underlying index were Microsoft Corp., Apple, Inc., and Amazon.com, Inc. The holdings detracting the most were Cisco Systems, Inc., Comcast Corp. - Class A, and Baidu, Inc. ADR - Class A.
Derivatives in the Fund were used to help provide exposure to the composition of the benchmark in the highest efficient manner and to provide leverage and not for hedging purposes. Derivatives performed as expected.
Due to the compounding of daily returns, leveraged and inverse funds’ returns over periods other than one day will likely differ in amount and possibly direction from the benchmark return for the same period. Investors should monitor their leveraged and inverse funds’ holdings to ensure that they are consistent with their strategies, as frequently as daily.
The effects of compounding may cause the longer-term correlation of the Fund to its benchmark to diminish. The apparent discrepancy between the leveraged and unleveraged indices is the result of compounding, which is described briefly on page 6 of this report.
Performance displayed represents past performance, which is no guarantee of future results.
Holdings Diversification (Market Exposure as % of Net Assets)
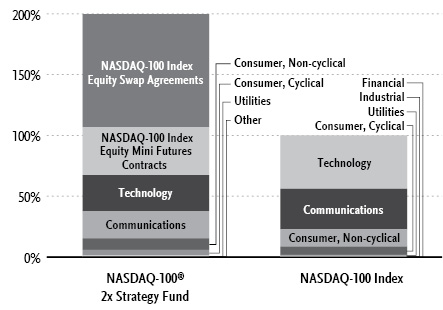
“Holdings Diversification (Market Exposure as % of Net Assets)” excludes any temporary cash investments.
Inception Dates: |
A-Class | September 1, 2004 |
C-Class | November 20, 2000 |
H-Class | May 24, 2000 |
Ten Largest Holdings (% of Total Net Assets) |
Microsoft Corp. | 8.1% |
Apple, Inc. | 7.6% |
Amazon.com, Inc. | 6.5% |
Facebook, Inc. — Class A | 2.7% |
Alphabet, Inc. — Class C | 2.7% |
Alphabet, Inc. — Class A | 2.7% |
Intel Corp. | 2.0% |
PepsiCo, Inc. | 1.4% |
Cisco Systems, Inc. | 1.4% |
Netflix, Inc. | 1.4% |
Top Ten Total | 36.5% |
| | |
“Ten Largest Holdings” excludes any temporary cash or derivative investments. |
| | THE RYDEX FUNDS ANNUAL REPORT | 31 |
PERFORMANCE REPORT AND FUND PROFILE (Unaudited)(concluded) | March 31, 2020 |
Cumulative Fund Performance*
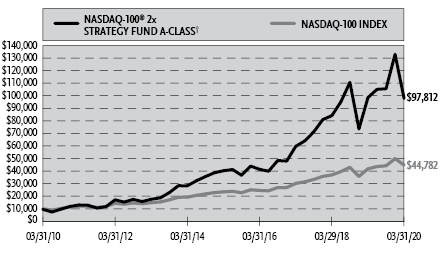
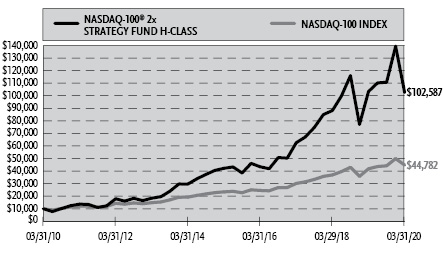
Average Annual Returns*
Periods Ended March 31, 2020
| 1 Year | 5 Year | 10 Year |
A-Class Shares | (0.76%) | 19.43% | 26.23% |
A-Class Shares with sales charge† | (5.47%) | 18.27% | 25.61% |
C-Class Shares | (1.50%) | 18.53% | 25.26% |
C-Class Shares with CDSC‡ | (2.42%) | 18.53% | 25.26% |
H-Class Shares | (0.76%) | 19.42% | 26.21% |
NASDAQ-100 Index | 7.03% | 13.81% | 16.17% |
* | The performance data above represents past performance that is not predictive of future results. The investment return and principal value of an investment in the Fund will fluctuate so that an investor’s shares, when redeemed, may be worth more or less than their original cost. Returns are historical and include changes in principal and reinvested dividends and capital gains and do not reflect the effect of taxes. The NASDAQ-100 Index is an unmanaged index and, unlike the Fund, has no management fees or operating expenses to reduce its reported return. The graphs are based on A-Class shares and H-Class shares only; performance for C-Class shares will vary due to differences in fee structures. |
† | Fund returns are calculated using the maximum sales charge of 4.75%. |
‡ | Fund returns include a CDSC of 1% if redeemed within 12 months of purchase. |
32 | THE RYDEX FUNDS ANNUAL REPORT | |
SCHEDULE OF INVESTMENTS | March 31, 2020 |
NASDAQ-100® 2x STRATEGY FUND | |
| | Shares | | | Value | |
COMMON STOCKS† - 67.3% |
| | | | | | | | | |
Technology - 29.6% |
Microsoft Corp. | | | 161,734 | | | $ | 25,507,069 | |
Apple, Inc. | | | 94,198 | | | | 23,953,609 | |
Intel Corp. | | | 117,639 | | | | 6,366,623 | |
NVIDIA Corp. | | | 16,550 | | | | 4,362,580 | |
Adobe, Inc.* | | | 13,091 | | | | 4,166,080 | |
Broadcom, Inc. | | | 10,727 | | | | 2,543,372 | |
Texas Instruments, Inc. | | | 25,279 | | | | 2,526,130 | |
QUALCOMM, Inc. | | | 30,880 | | | | 2,089,032 | |
Fiserv, Inc.* | | | 18,387 | | | | 1,746,581 | |
Intuit, Inc. | | | 7,039 | | | | 1,618,970 | |
Advanced Micro Devices, Inc.* | | | 30,116 | | | | 1,369,676 | |
Micron Technology, Inc.* | | | 29,938 | | | | 1,259,192 | |
Activision Blizzard, Inc. | | | 20,777 | | | | 1,235,816 | |
Applied Materials, Inc. | | | 24,982 | | | | 1,144,675 | |
Lam Research Corp. | | | 3,923 | | | | 941,520 | |
Autodesk, Inc.* | | | 5,938 | | | | 926,922 | |
Analog Devices, Inc. | | | 9,960 | | | | 892,914 | |
Electronic Arts, Inc.* | | | 7,896 | | | | 790,942 | |
Cognizant Technology Solutions Corp. — Class A | | | 14,808 | | | | 688,128 | |
NetEase, Inc. ADR | | | 1,973 | | | | 633,254 | |
NXP Semiconductor N.V. | | | 7,559 | | | | 626,868 | |
KLA Corp. | | | 4,267 | | | | 613,338 | |
Paychex, Inc. | | | 9,680 | | | | 609,066 | |
Workday, Inc. — Class A* | | | 4,435 | | | | 577,526 | |
Cerner Corp. | | | 8,494 | | | | 535,037 | |
Xilinx, Inc. | | | 6,800 | | | | 529,992 | |
ANSYS, Inc.* | | | 2,277 | | | | 529,334 | |
ASML Holding N.V. — Class G | | | 2,003 | | | | 524,065 | |
Synopsys, Inc.* | | | 4,064 | | | | 523,403 | |
Splunk, Inc.* | | | 4,093 | | | | 516,659 | |
Cadence Design Systems, Inc.* | | | 7,588 | | | | 501,111 | |
Citrix Systems, Inc. | | | 3,522 | | | | 498,539 | |
Microchip Technology, Inc. | | | 6,462 | | | | 438,123 | |
Check Point Software Technologies Ltd.* | | | 4,117 | | | | 413,923 | |
Skyworks Solutions, Inc. | | | 4,607 | | | | 411,774 | |
Take-Two Interactive Software, Inc.* | | | 3,065 | | | | 363,540 | |
Maxim Integrated Products, Inc. | | | 7,318 | | | | 355,728 | |
Western Digital Corp. | | | 8,043 | | | | 334,750 | |
NetApp, Inc. | | | 6,172 | | | | 257,311 | |
Total Technology | | | | | | | 93,923,172 | |
| | | | | | | | | |
Communications - 22.4% |
Amazon.com, Inc.* | | | 10,511 | | | | 20,493,507 | |
Facebook, Inc. — Class A* | | | 51,018 | | | | 8,509,802 | |
Alphabet, Inc. — Class C* | | | 7,283 | | | | 8,468,745 | |
Alphabet, Inc. — Class A* | | | 7,288 | | | | 8,468,292 | |
Cisco Systems, Inc. | | | 114,725 | | | | 4,509,840 | |
Netflix, Inc.* | | | 11,852 | | | | 4,450,426 | |
Comcast Corp. — Class A | | | 122,773 | | | | 4,220,936 | |
Charter Communications, Inc. — Class A* | | | 5,808 | | | | 2,534,088 | |
T-Mobile US, Inc.* | | | 23,138 | | | | 1,941,278 | |
Booking Holdings, Inc.* | | | 1,132 | | | | 1,522,902 | |
JD.com, Inc. ADR* | | | 25,067 | | | | 1,015,213 | |
Baidu, Inc. ADR* | | | 7,477 | | | | 753,607 | |
eBay, Inc. | | | 22,000 | | | | 661,320 | |
MercadoLibre, Inc.* | | | 1,344 | | | | 656,652 | |
Sirius XM Holdings, Inc. | | | 119,634 | | | | 590,992 | |
VeriSign, Inc.* | | | 3,175 | | | | 571,786 | |
CDW Corp. | | | 3,886 | | | | 362,447 | |
Trip.com Group Ltd. ADR* | | | 14,143 | | | | 331,653 | |
Fox Corp. — Class A | | | 9,587 | | | | 226,541 | |
Expedia Group, Inc. | | | 3,769 | | | | 212,082 | |
Liberty Global plc — Class C* | | | 11,866 | | | | 186,415 | |
Fox Corp. — Class B | | | 7,198 | | | | 164,690 | |
Liberty Global plc — Class A* | | | 4,909 | | | | 81,048 | |
Total Communications | | | | | | | 70,934,262 | |
| | | | | | | | | |
Consumer, Non-cyclical - 9.5% |
PepsiCo, Inc. | | | 37,711 | | | | 4,529,091 | |
Amgen, Inc. | | | 16,068 | | | | 3,257,466 | |
PayPal Holdings, Inc.* | | | 31,755 | | | | 3,040,224 | |
Gilead Sciences, Inc. | | | 34,214 | | | | 2,557,839 | |
Mondelez International, Inc. — Class A | | | 38,938 | | | | 1,950,015 | |
Vertex Pharmaceuticals, Inc.* | | | 6,954 | | | | 1,654,704 | |
Automatic Data Processing, Inc. | | | 11,701 | | | | 1,599,292 | |
Intuitive Surgical, Inc.* | | | 3,126 | | | | 1,548,027 | |
Biogen, Inc.* | | | 4,880 | | | | 1,543,934 | |
Regeneron Pharmaceuticals, Inc.* | | | 2,919 | | | | 1,425,319 | |
Illumina, Inc.* | | | 3,975 | | | | 1,085,652 | |
Monster Beverage Corp.* | | | 14,540 | | | | 818,020 | |
Kraft Heinz Co. | | | 33,025 | | | | 817,039 | |
Verisk Analytics, Inc. — Class A | | | 4,432 | | | | 617,732 | |
CoStar Group, Inc.* | | | 990 | | | | 581,338 | |
IDEXX Laboratories, Inc.* | | | 2,320 | | | | 561,997 | |
Alexion Pharmaceuticals, Inc.* | | | 5,985 | | | | 537,393 | |
Seattle Genetics, Inc.* | | | 4,635 | | | | 534,786 | |
Cintas Corp. | | | 2,799 | | | | 484,843 | |
Incyte Corp.* | | | 5,825 | | | | 426,565 | |
BioMarin Pharmaceutical, Inc.* | | | 4,857 | | | | 410,416 | |
Align Technology, Inc.* | | | 2,131 | | | | 370,687 | |
Total Consumer, Non-cyclical | | | | | | | 30,352,379 | |
| | | | | | | | | |
Consumer, Cyclical - 4.6% |
Costco Wholesale Corp. | | | 11,947 | | | | 3,406,448 | |
Tesla, Inc.* | | | 4,874 | | | | 2,553,976 | |
Starbucks Corp. | | | 31,939 | | | | 2,099,670 | |
Walgreens Boots Alliance, Inc. | | | 24,137 | | | | 1,104,268 | |
Ross Stores, Inc. | | | 9,783 | | | | 850,828 | |
Marriott International, Inc. — Class A | | | 8,841 | | | | 661,395 | |
Lululemon Athletica, Inc.* | | | 3,330 | | | | 631,201 | |
O’Reilly Automotive, Inc.* | | | 2,046 | | | | 615,948 | |
PACCAR, Inc. | | | 9,354 | | | | 571,810 | |
Fastenal Co. | | | 15,510 | | | | 484,687 | |
Dollar Tree, Inc.* | | | 6,400 | | | | 470,208 | |
Copart, Inc.* | | | 6,286 | | | | 430,717 | |
Ulta Beauty, Inc.* | | | 1,591 | | | | 279,539 | |
United Airlines Holdings, Inc.*,1 | | | 6,843 | | | | 215,897 | |
American Airlines Group, Inc.1 | | | 11,847 | | | | 144,415 | |
Total Consumer, Cyclical | | | | | | | 14,521,007 | |
| | | | | | | | | |
SEE NOTES TO FINANCIAL STATEMENTS. | THE RYDEX FUNDS ANNUAL REPORT | 33 |
SCHEDULE OF INVESTMENTS (continued) | March 31, 2020 |
NASDAQ-100® 2x STRATEGY FUND | |
| | Shares | | | Value | |
Utilities - 0.6% |
Exelon Corp. | | | 26,290 | | | $ | 967,735 | |
Xcel Energy, Inc. | | | 14,502 | | | | 874,471 | |
Total Utilities | | | | | | | 1,842,206 | |
| | | | | | | | | |
Industrial - 0.4% |
CSX Corp. | | | 21,157 | | | | 1,212,296 | |
| | | | | | | | | |
Financial - 0.2% |
Willis Towers Watson plc | | | 3,477 | | | | 590,568 | |
| | | | | | | | | |
Total Common Stocks | | | | |
(Cost $134,414,088) | | | | | | | 213,375,890 | |
| | | | | | | | | |
| | | Face
Amount | | | | | |
FEDERAL AGENCY DISCOUNT NOTES†† - 3.2% |
Federal Home Loan Bank |
0.05% due 04/03/202 | | $ | 10,000,000 | | | | 9,999,972 | |
Total Federal Agency Discount Notes | | | | |
(Cost $9,999,972) | | | | | | | 9,999,972 | |
| | | | | | | | | |
U.S. TREASURY BILLS†† - 2.3% |
U.S. Treasury Bills |
0.50% due 04/30/202,3 | | | 7,244,000 | | | | 7,243,678 | |
Total U.S. Treasury Bills | | | | |
(Cost $7,241,039) | | | | | | | 7,243,678 | |
| REPURCHASE AGREEMENTS††,4 - 10.9% |
J.P. Morgan Securities LLC
issued 03/31/20 at 0.01%
due 04/01/205 | | | 25,038,849 | | | | 25,038,849 | |
BofA Securities, Inc.
issued 03/31/20 at 0.00%
due 04/01/205 | | | 9,630,327 | | | | 9,630,327 | |
| Total Repurchase Agreements | | | | | | | | |
| (Cost $34,669,176) | | | | | | | 34,669,176 | |
| | | | | | | | | |
| | | | Shares | | | | | |
| SECURITIES LENDING COLLATERAL†,6 - 0.1% |
| Money Market Fund | | | | | | | | |
First American Government Obligations Fund — Class Z, 0.39%7 | | | 248,781 | | | | 248,781 | |
| Total Securities Lending Collateral | | | | | | | | |
| (Cost $248,781) | | | | | | | 248,781 | |
| | | | | | | | | |
| Total Investments - 83.8% | | | | | | | | |
| (Cost $186,573,056) | | | | | | $ | 265,537,497 | |
| Other Assets & Liabilities, net - 16.2% | | | | | | | 51,338,509 | |
| Total Net Assets - 100.0% | | | | | | $ | 316,876,006 | |
Futures Contracts |
Description | | Number of
Contracts | | | Expiration Date | | | Notional
Amount | | | Value and
Unrealized
Appreciation** | |
Equity Futures Contracts Purchased† |
NASDAQ-100 Index Mini Futures Contracts | | | 804 | | | | Jun 2020 | | | $ | 125,383,800 | | | $ | 8,817,085 | |
Total Return Swap Agreements |
Counterparty | Index | Financing
Rate Pay | Payment
Frequency | | Maturity Date | | | Units | | | Notional
Amount | | | Value and
Unrealized
Depreciation | |
OTC Equity Index Swap Agreements†† |
BNP Paribas | NASDAQ-100 Index | 1.64% (1 Month USD LIBOR + 0.65%) | At Maturity | | | 04/29/20 | | | | 655 | | | $ | 5,115,208 | | | $ | (54,745 | ) |
Goldman Sachs International | NASDAQ-100 Index | 1.14% (1 Week USD LIBOR + 0.55%) | At Maturity | | | 04/28/20 | | | | 12,808 | | | | 100,079,129 | | | | (1,055,412 | ) |
Barclays Bank plc | NASDAQ-100 Index | 1.09% (1 Week USD LIBOR + 0.50%) | At Maturity | | | 04/30/20 | | | | 24,196 | | | | 189,057,448 | | | | (1,780,599 | ) |
| | | | | | | | | | | | | | $ | 294,251,785 | | | $ | (2,890,756 | ) |
34 | THE RYDEX FUNDS ANNUAL REPORT | SEE NOTES TO FINANCIAL STATEMENTS. |
SCHEDULE OF INVESTMENTS (concluded) | March 31, 2020 |
NASDAQ-100® 2x STRATEGY FUND | |
* | Non-income producing security. |
** | Includes cumulative appreciation (depreciation). Variation margin is reported within the Statement of Assets and Liabilities. |
† | Value determined based on Level 1 inputs — See Note 4. |
†† | Value determined based on Level 2 inputs — See Note 4. |
1 | All or a portion of this security is on loan at March 31, 2020 — See Note 7. |
2 | Rate indicated is the effective yield at the time of purchase. |
3 | All or a portion of this security is pledged as futures collateral at March 31, 2020. |
4 | Repurchase Agreements — See Note 6. |
5 | All or a portion of this security is pledged as equity index swap collateral at March 31, 2020. |
6 | Securities lending collateral — See Note 7. |
7 | Rate indicated is the 7-day yield as of March 31, 2020. |
| | ADR — American Depositary Receipt |
| | LIBOR — London Interbank Offered Rate |
| | plc — Public Limited Company |
| | |
| | See Sector Classification in Other Information section. |
The following table summarizes the inputs used to value the Fund’s investments at March 31, 2020 (See Note 4 in the Notes to Financial Statements):
Investments in Securities (Assets) | | Level 1
Quoted
Prices | | | Level 2
Significant
Observable
Inputs | | | Level 3
Significant
Unobservable
Inputs | | | Total | |
Common Stocks | | $ | 213,375,890 | | | $ | — | | | $ | — | | | $ | 213,375,890 | |
Federal Agency Discount Notes | | | — | | | | 9,999,972 | | | | — | | | | 9,999,972 | |
U.S. Treasury Bills | | | — | | | | 7,243,678 | | | | — | | | | 7,243,678 | |
Repurchase Agreements | | | — | | | | 34,669,176 | | | | — | | | | 34,669,176 | |
Securities Lending Collateral | | | 248,781 | | | | — | | | | — | | | | 248,781 | |
Equity Futures Contracts** | | | 8,817,085 | | | | — | | | | — | | | | 8,817,085 | |
Total Assets | | $ | 222,441,756 | | | $ | 51,912,826 | | | $ | — | | | $ | 274,354,582 | |
Investments in Securities (Liabilities) | | Level 1
Quoted
Prices | | | Level 2
Significant
Observable
Inputs | | | Level 3
Significant
Unobservable
Inputs | | | Total | |
Equity Index Swap Agreements** | | $ | — | | | $ | 2,890,756 | | | $ | — | | | $ | 2,890,756 | |
** | This derivative is reported as unrealized appreciation/depreciation at period end. |
SEE NOTES TO FINANCIAL STATEMENTS. | THE RYDEX FUNDS ANNUAL REPORT | 35 |
NASDAQ-100® 2x STRATEGY FUND | |
STATEMENT OF ASSETS AND LIABILITIES
March 31, 2020
Assets: |
Investments, at value - including $248,844 of securities loaned (cost $151,903,880) | | $ | 230,868,321 | |
Repurchase agreements, at value (cost $34,669,176) | | | 34,669,176 | |
Cash | | | 12,722,977 | |
Segregated cash with broker | | | 52,110,327 | |
Receivables: |
Fund shares sold | | | 6,393,511 | |
Dividends | | | 75,686 | |
Securities lending income | | | 147 | |
Interest | | | 7 | |
Total assets | | | 336,840,152 | |
| | | | | |
Liabilities: |
Unrealized depreciation on OTC swap agreements | | | 2,890,756 | |
Payable for: |
Securities purchased | | | 6,947,272 | |
Fund shares redeemed | | | 6,734,972 | |
Swap settlement | | | 1,375,551 | |
Variation margin on futures contracts | | | 990,712 | |
Management fees | | | 257,350 | |
Return of securities lending collateral | | | 248,781 | |
Transfer agent and administrative fees | | | 93,398 | |
Distribution and service fees | | | 77,380 | |
Portfolio accounting fees | | | 42,892 | |
Trustees’ fees* | | | 8,125 | |
Miscellaneous | | | 296,957 | |
Total liabilities | | | 19,964,146 | |
Commitments and contingent liabilities (Note 11) | | | — | |
Net assets | | $ | 316,876,006 | |
| | | | | |
Net assets consist of: |
Paid in capital | | $ | 278,322,084 | |
Total distributable earnings (loss) | | | 38,553,922 | |
Net assets | | $ | 316,876,006 | |
| | | | | |
A-Class: |
Net assets | | $ | 31,546,807 | |
Capital shares outstanding | | | 222,916 | |
Net asset value per share | | $ | 141.52 | |
Maximum offering price per share (Net asset value divided by 95.25%) | | $ | 148.58 | |
| | | | | |
C-Class: |
Net assets | | $ | 9,030,489 | |
Capital shares outstanding | | | 81,727 | |
Net asset value per share | | $ | 110.50 | |
| | | | | |
H-Class: |
Net assets | | $ | 276,298,710 | |
Capital shares outstanding | | | 1,953,094 | |
Net asset value per share | | $ | 141.47 | |
STATEMENT OF OPERATIONS
Year Ended March 31, 2020
Investment Income: |
Dividends (net of foreign withholding tax of $4,014) | | $ | 3,926,919 | |
Interest | | | 1,534,563 | |
Income from securities lending, net | | | 2,097 | |
Total investment income | | | 5,463,579 | |
| | | | | |
Expenses: |
Management fees | | | 4,061,383 | |
Distribution and service fees: |
A-Class | | | 98,941 | |
C-Class | | | 125,694 | |
H-Class | | | 997,801 | |
Transfer agent and administrative fees | | | 1,150,075 | |
Portfolio accounting fees | | | 676,903 | |
Registration fees | | | 518,020 | |
Professional fees | | | 237,128 | |
Trustees’ fees* | | | 93,932 | |
Custodian fees | | | 62,247 | |
Line of credit fees | | | 705 | |
Miscellaneous | | | 529,779 | |
Total expenses | | | 8,552,608 | |
Net investment loss | | | (3,089,029 | ) |
| | | | | |
Net Realized and Unrealized Gain (Loss): |
Net realized gain (loss) on: |
Investments | | | 24,894,266 | |
Swap agreements | | | 18,196,159 | |
Futures contracts | | | (8,679,303 | ) |
Net realized gain | | | 34,411,122 | |
Net change in unrealized appreciation (depreciation) on: |
Investments | | | (23,056,277 | ) |
Swap agreements | | | (6,617,259 | ) |
Futures contracts | | | 5,114,899 | |
Net change in unrealized appreciation (depreciation) | | | (24,558,637 | ) |
Net realized and unrealized gain | | | 9,852,485 | |
Net increase in net assets resulting from operations | | $ | 6,763,456 | |
* | Relates to Trustees not deemed “interested persons” within the meaning of Section 2(a)(19) of the 1940 Act. |
36 | THE RYDEX FUNDS ANNUAL REPORT | SEE NOTES TO FINANCIAL STATEMENTS. |
NASDAQ-100® 2x STRATEGY FUND | |
STATEMENTS OF CHANGES IN NET ASSETS |
| | Year Ended
March 31,
2020 | | | Year Ended
March 31,
2019 | |
Increase (Decrease) in Net Assets from Operations: | | | | | | | | |
Net investment loss | | $ | (3,089,029 | ) | | $ | (2,669,041 | ) |
Net realized gain on investments | | | 34,411,122 | | | | 50,977,875 | |
Net change in unrealized appreciation (depreciation) on investments | | | (24,558,637 | ) | | | 24,229,573 | |
Net increase in net assets resulting from operations | | | 6,763,456 | | | | 72,538,407 | |
| | | | | | | | | |
Distributions to shareholders: | | | | | | | | |
A-Class | | | (2,201,145 | ) | | | — | |
C-Class | | | (821,195 | ) | | | — | |
H-Class | | | (20,505,323 | ) | | | — | |
Total distributions to shareholders | | | (23,527,663 | ) | | | — | |
| | | | | | | | | |
Capital share transactions: | | | | | | | | |
Proceeds from sale of shares | | | | | | | | |
A-Class | | | 26,258,981 | | | | 31,147,376 | |
C-Class | | | 7,641,251 | | | | 8,528,884 | |
H-Class | | | 2,637,017,862 | | | | 2,271,751,167 | |
Distributions reinvested | | | | | | | | |
A-Class | | | 2,066,797 | | | | — | |
C-Class | | | 760,684 | | | | — | |
H-Class | | | 19,146,375 | | | | — | |
Cost of shares redeemed | | | | | | | | |
A-Class | | | (31,462,970 | ) | | | (20,341,827 | ) |
C-Class | | | (12,827,695 | ) | | | (22,269,655 | ) |
H-Class | | | (2,750,310,237 | ) | | | (2,363,670,330 | ) |
Net decrease from capital share transactions | | | (101,708,952 | ) | | | (94,854,385 | ) |
Net decrease in net assets | | | (118,473,159 | ) | | | (22,315,978 | ) |
| | | | | | | | | |
Net assets: | | | | | | | | |
Beginning of year | | | 435,349,165 | | | | 457,665,143 | |
End of year | | $ | 316,876,006 | | | $ | 435,349,165 | |
| | | | | | | | | |
Capital share activity: | | | | | | | | |
Shares sold | | | | | | | | |
A-Class | | | 158,471 | | | | 216,808 | |
C-Class | | | 56,236 | | | | 77,684 | |
H-Class | | | 15,668,999 | | | | 16,057,203 | |
Shares issued from reinvestment of distributions | | | | | | | | |
A-Class | | | 11,125 | | | | — | |
C-Class | | | 5,233 | | | | — | |
H-Class | | | 103,098 | | | | — | |
Shares redeemed | | | | | | | | |
A-Class | | | (187,939 | ) | | | (150,002 | ) |
C-Class | | | (96,339 | ) | | | (185,235 | ) |
H-Class | | | (16,382,838 | ) | | | (16,708,138 | ) |
Net decrease in shares | | | (663,954 | ) | | | (691,680 | ) |
SEE NOTES TO FINANCIAL STATEMENTS. | THE RYDEX FUNDS ANNUAL REPORT | 37 |
NASDAQ-100® 2x STRATEGY FUND | |
This table is presented to show selected data for a share outstanding throughout each period and to assist shareholders in evaluating a Fund’s performance for the periods presented.
A-Class | | Year Ended
March 31,
2020 | | | Year Ended
March 31,
2019 | | | Year Ended
March 29,
2018 | | | Year Ended
March 31,
2017c | | | Year Ended
March 31,
2016c | |
Per Share Data |
Net asset value, beginning of period | | $ | 150.26 | | | $ | 128.26 | | | $ | 103.59 | | | $ | 73.03 | | | $ | 73.90 | |
Income (loss) from investment operations: |
Net investment income (loss)a | | | (1.16 | ) | | | (.83 | ) | | | (.92 | ) | | | (.73 | ) | | | (.64 | ) |
Net gain (loss) on investments (realized and unrealized) | | | 2.39 | | | | 22.83 | | | | 43.11 | | | | 32.64 | | | | 3.07 | |
Total from investment operations | | | 1.23 | | | | 22.00 | | | | 42.19 | | | | 31.91 | | | | 2.43 | |
Less distributions from: |
Net realized gains | | | (9.97 | ) | | | — | | | | (17.52 | ) | | | (1.35 | ) | | | (3.30 | ) |
Total distributions | | | (9.97 | ) | | | — | | | | (17.52 | ) | | | (1.35 | ) | | | (3.30 | ) |
Net asset value, end of period | | $ | 141.52 | | | $ | 150.26 | | | $ | 128.26 | | | $ | 103.59 | | | $ | 73.03 | |
|
Total Returnb | | | (0.76 | %) | | | 17.15 | % | | | 40.91 | % | | | 44.21 | % | | | 2.83 | % |
Ratios/Supplemental Data |
Net assets, end of period (in thousands) | | $ | 31,547 | | | $ | 36,252 | | | $ | 22,376 | | | $ | 15,489 | | | $ | 15,217 | |
Ratios to average net assets: |
Net investment income (loss) | | | (0.67 | %) | | | (0.59 | %) | | | (0.73 | %) | | | (0.89 | %) | | | (0.86 | %) |
Total expenses | | | 1.87 | % | | | 1.89 | % | | | 1.79 | % | | | 1.83 | % | | | 1.80 | % |
Portfolio turnover rate | | | 237 | % | | | 113 | % | | | 217 | % | | | 167 | % | | | 114 | % |
C-Class | | Year Ended
March 31,
2020 | | | Year Ended
March 31,
2019 | | | Year Ended
March 29,
2018 | | | Year Ended
March 31,
2017c | | | Year Ended
March 31,
2016c | |
Per Share Data |
Net asset value, beginning of period | | $ | 119.88 | | | $ | 103.10 | | | $ | 86.38 | | | $ | 61.55 | | | $ | 63.21 | |
Income (loss) from investment operations: |
Net investment income (loss)a | | | (1.92 | ) | | | (1.55 | ) | | | (1.52 | ) | | | (1.12 | ) | | | (1.02 | ) |
Net gain (loss) on investments (realized and unrealized) | | | 2.51 | | | | 18.33 | | | | 35.76 | | | | 27.30 | | | | 2.66 | |
Total from investment operations | | | .59 | | | | 16.78 | | | | 34.24 | | | | 26.18 | | | | 1.64 | |
Less distributions from: |
Net realized gains | | | (9.97 | ) | | | — | | | | (17.52 | ) | | | (1.35 | ) | | | (3.30 | ) |
Total distributions | | | (9.97 | ) | | | — | | | | (17.52 | ) | | | (1.35 | ) | | | (3.30 | ) |
Net asset value, end of period | | $ | 110.50 | | | $ | 119.88 | | | $ | 103.10 | | | $ | 86.38 | | | $ | 61.55 | |
|
Total Returnb | | | (1.50 | %) | | | 16.28 | % | | | 39.81 | % | | | 43.13 | % | | | 2.05 | % |
Ratios/Supplemental Data |
Net assets, end of period (in thousands) | | $ | 9,030 | | | $ | 13,978 | | | $ | 23,110 | | | $ | 21,656 | | | $ | 23,705 | |
Ratios to average net assets: |
Net investment income (loss) | | | (1.42 | %) | | | (1.36 | %) | | | (1.48 | %) | | | (1.64 | %) | | | (1.60 | %) |
Total expenses | | | 2.63 | % | | | 2.60 | % | | | 2.54 | % | | | 2.58 | % | | | 2.55 | % |
Portfolio turnover rate | | | 237 | % | | | 113 | % | | | 217 | % | | | 167 | % | | | 114 | % |
38 | THE RYDEX FUNDS ANNUAL REPORT | SEE NOTES TO FINANCIAL STATEMENTS. |
NASDAQ-100® 2x STRATEGY FUND | |
FINANCIAL HIGHLIGHTS (concluded) |
This table is presented to show selected data for a share outstanding throughout each period and to assist shareholders in evaluating a Fund’s performance for the periods presented.
H-Class | | Year Ended
March 31,
2020 | | | Year Ended
March 31,
2019 | | | Year Ended
March 29,
2018 | | | Year Ended
March 31,
2017c | | | Year Ended
March 31,
2016c | |
Per Share Data |
Net asset value, beginning of period | | $ | 150.21 | | | $ | 128.21 | | | $ | 103.59 | | | $ | 73.02 | | | $ | 73.90 | |
Income (loss) from investment operations: |
Net investment income (loss)a | | | (1.14 | ) | | | (.85 | ) | | | (.90 | ) | | | (.72 | ) | | | (.64 | ) |
Net gain (loss) on investments (realized and unrealized) | | | 2.37 | | | | 22.85 | | | | 43.04 | | | | 32.64 | | | | 3.06 | |
Total from investment operations | | | 1.23 | | | | 22.00 | | | | 42.14 | | | | 31.92 | | | | 2.42 | |
Less distributions from: |
Net realized gains | | | (9.97 | ) | | | — | | | | (17.52 | ) | | | (1.35 | ) | | | (3.30 | ) |
Total distributions | | | (9.97 | ) | | | — | | | | (17.52 | ) | | | (1.35 | ) | | | (3.30 | ) |
Net asset value, end of period | | $ | 141.47 | | | $ | 150.21 | | | $ | 128.21 | | | $ | 103.59 | | | $ | 73.02 | |
|
Total Return | | | (0.76 | %) | | | 17.16 | % | | | 40.86 | % | | | 44.22 | % | | | 2.83 | % |
Ratios/Supplemental Data |
Net assets, end of period (in thousands) | | $ | 276,299 | | | $ | 385,119 | | | $ | 412,179 | | | $ | 257,154 | | | $ | 229,436 | |
Ratios to average net assets: |
Net investment income (loss) | | | (0.66 | %) | | | (0.59 | %) | | | (0.72 | %) | | | (0.87 | %) | | | (0.85 | %) |
Total expenses | | | 1.87 | % | | | 1.87 | % | | | 1.79 | % | | | 1.83 | % | | | 1.80 | % |
Portfolio turnover rate | | | 237 | % | | | 113 | % | | | 217 | % | | | 167 | % | | | 114 | % |
a | Net investment income (loss) per share was computed using average shares outstanding throughout the period. |
b | Total return does not reflect the impact of any applicable sales charges. |
c | Share split — Per share amounts for the years presented through March 31, 2017 have been restated to reflect a 5:1 share split effective October 31, 2016. |
SEE NOTES TO FINANCIAL STATEMENTS. | THE RYDEX FUNDS ANNUAL REPORT | 39 |
PERFORMANCE REPORT AND FUND PROFILE (Unaudited) | March 31, 2020 |
INVERSE NASDAQ-100® 2x STRATEGY FUND
OBJECTIVE: Seeks to provide investment results that match, before fees and expenses, the performance of a specific benchmark on a daily basis. The Fund’s current benchmark is 200% the inverse (opposite) of the performance of the NASDAQ-100® Index (the “underlying index”). The Fund does not seek to achieve its investment objective over a period of time greater than one day.
For the one-year period ended March 31, 2020, Inverse NASDAQ-100® 2x Strategy Fund maintained a daily correlation of over 99% to its benchmark of -200% of the daily price movement of the NASDAQ-100 Index. Inverse NASDAQ-100® 2x Strategy Fund H-Class returned -31.50%, while the NASDAQ-100 Index returned 7.03% over the same time period.
The sectors contributing the most to the return of the underlying index were Information Technology, Consumer Discretionary, and Health Care. The sectors detracting the most were Industrials, Utilities, and Consumer Staples.
The holdings contributing the most to the return of the underlying index were Microsoft Corp., Apple, Inc., and Amazon.com, Inc. The holdings detracting the most were Cisco Systems, Inc., Comcast Corp. - Class A, and Baidu, Inc. ADR - Class A.
Derivatives in the Fund were used to help provide exposure to the composition of the benchmark in the most efficient manner possible and to provide leverage and not for hedging purposes. Derivatives performed as expected.
Due to the compounding of daily returns, leveraged and inverse funds’ returns over periods other than one day will likely differ in amount and possibly direction from the benchmark return for the same period. Investors should monitor their leveraged and inverse funds’ holdings to ensure that they are consistent with their strategies, as frequently as daily.
The effects of compounding may cause the longer-term correlation of the Fund to its benchmark to diminish. The apparent discrepancy between the leveraged and unleveraged indices is the result of compounding, which is described briefly on page 6 of this report.
Performance displayed represents past performance, which is no guarantee of future results.
Holdings Diversification (Market Exposure as % of Net Assets)

“Holdings Diversification (Market Exposure as % of Net Assets)” excludes any temporary cash investments.
Inception Dates: |
A-Class | September 1, 2004 |
C-Class | March 8, 2001 |
H-Class | May 23, 2000 |
The Fund invests principally in derivative investments such as swap agreements and futures contracts.
40 | THE RYDEX FUNDS ANNUAL REPORT | |
PERFORMANCE REPORT AND FUND PROFILE (Unaudited)(concluded) | March 31, 2020 |
Cumulative Fund Performance*
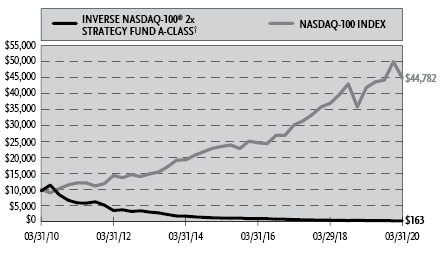

Average Annual Returns*
Periods Ended March 31, 2020
| 1 Year | 5 Year | 10 Year |
A-Class Shares | (31.48%) | (30.74%) | (33.42%) |
A-Class Shares with sales charge† | (34.74%) | (31.41%) | (33.74%) |
C-Class Shares | (31.89%) | (31.10%) | (33.87%) |
C-Class Shares with CDSC‡ | (32.57%) | (31.10%) | (33.87%) |
H-Class Shares | (31.50%) | (30.72%) | (33.40%) |
NASDAQ-100 Index | 7.03% | 13.81% | 16.17% |
* | The performance data above represents past performance that is not predictive of future results. The investment return and principal value of an investment in the Fund will fluctuate so that an investor’s shares, when redeemed, may be worth more or less than their original cost. Returns are historical and include changes in principal and reinvested dividends and capital gains and do not reflect the effect of taxes. The NASDAQ-100 Index is an unmanaged index and, unlike the Fund, has no management fees or operating expenses to reduce its reported return. The graphs are based on A-Class shares and H-Class shares only; performance for C-Class shares will vary due to differences in fee structures. |
† | Fund returns are calculated using the maximum sales charge of 4.75%. |
‡ | Fund returns include a CDSC of 1% if redeemed within 12 months of purchase. |
| | THE RYDEX FUNDS ANNUAL REPORT | 41 |
SCHEDULE OF INVESTMENTS | March 31, 2020 |
INVERSE NASDAQ-100® 2x STRATEGY FUND | |
| | Face
Amount | | | Value | |
FEDERAL AGENCY NOTES†† - 26.4% |
Federal Farm Credit Bank |
0.32% (U.S. Prime Rate - 2.93%, Rate Floor: 0.00%) due 09/24/201 | | $ | 1,000,000 | | | $ | 999,953 | |
0.38% (3 Month U.S. Treasury Bill Rate + 0.29%, Rate Floor: 0.00%) due 04/11/221 | | | 500,000 | | | | 499,182 | |
0.44% (U.S. Prime Rate - 2.81%, Rate Floor: 0.00%) due 05/20/221 | | | 300,000 | | | | 300,652 | |
Federal Home Loan Bank |
0.75% (3 Month USD LIBOR - 0.14%, Rate Floor: 0.00%) due 12/18/201 | | | 1,000,000 | | | | 1,000,211 | |
Fannie Mae |
0.23% (U.S. Secured Overnight Financing Rate + 0.22%, Rate Floor: 0.00%) due 03/16/221 | | | 500,000 | | | | 499,009 | |
Total Federal Agency Notes | | | | |
(Cost $3,300,245) | | | | | | | 3,299,007 | |
| | | | | | | | | |
U.S. TREASURY BILLS†† - 0.6% |
U.S. Treasury Bills |
0.50% due 04/30/202,3 | | | 79,000 | | | | 78,996 | |
Total U.S. Treasury Bills | | | | |
(Cost $78,967) | | | | | | | 78,996 | |
| | | | | | | | | |
REPURCHASE AGREEMENTS††,4 - 56.7% |
J.P. Morgan Securities LLC
issued 03/31/20 at 0.01%
due 04/01/205 | | | 5,128,532 | | | | 5,128,532 | |
BofA Securities, Inc.
issued 03/31/20 at 0.00%
due 04/01/205 | | | 1,972,513 | | | | 1,972,513 | |
Total Repurchase Agreements | | | | |
(Cost $7,101,045) | | | | | | | 7,101,045 | |
| | | | | | | | | |
Total Investments - 83.7% | | | | |
(Cost $10,480,257) | | $ | 10,479,048 | |
Other Assets & Liabilities, net - 16.3% | | | 2,042,069 | |
Total Net Assets - 100.0% | | $ | 12,521,117 | |
Futures Contracts |
Description | | Number of
Contracts | | | Expiration Date | | | Notional
Amount | | | Value and
Unrealized
Depreciation** | |
Equity Futures Contracts Sold Short† |
NASDAQ-100 Index Mini Futures Contracts | | | 8 | | | | Jun 2020 | | | $ | 1,247,600 | | | $ | (69,869 | ) |
Total Return Swap Agreements |
Counterparty | Index | Financing
Rate Receive | Payment
Frequency | | Maturity Date | | | Units | | | Notional
Amount | | | Value and
Unrealized
Appreciation | |
OTC Equity Index Swap Agreements Sold Short†† |
Barclays Bank plc | NASDAQ-100 Index | (0.94)% (1 Week USD LIBOR + 0.35%) | At Maturity | | | 04/30/20 | | | | 1,835 | | | $ | 14,339,231 | | | $ | 138,566 | |
BNP Paribas | NASDAQ-100 Index | (1.14)% (1 Month USD LIBOR + 0.15%) | At Maturity | | | 04/29/20 | | | | 703 | | | | 5,494,209 | | | | 58,805 | |
Goldman Sachs International | NASDAQ-100 Index | (0.84)% (1 Week USD LIBOR + 0.25%) | At Maturity | | | 04/28/20 | | | | 523 | | | | 4,087,584 | | | | 43,751 | |
| | | | | | | | | | | | | | $ | 23,921,024 | | | $ | 241,122 | |
42 | THE RYDEX FUNDS ANNUAL REPORT | SEE NOTES TO FINANCIAL STATEMENTS. |
SCHEDULE OF INVESTMENTS (concluded) | March 31, 2020 |
INVERSE NASDAQ-100® 2x STRATEGY FUND | |
** | Includes cumulative appreciation (depreciation). Variation margin is reported within the Statement of Assets and Liabilities. |
† | Value determined based on Level 1 inputs — See Note 4. |
†† | Value determined based on Level 2 inputs — See Note 4. |
1 | Variable rate security. Rate indicated is the rate effective at March 31, 2020. In some instances, the effective rate is limited by a minimum rate floor or a maximum rate cap established by the issuer. The settlement status of a position may also impact the effective rate indicated. In some cases, a position may be unsettled at period end and may not have a stated effective rate. In instances where multiple underlying reference rates and spread amounts are shown, the effective rate is based on a weighted average. |
2 | All or a portion of this security is pledged as futures collateral at March 31, 2020. |
3 | Rate indicated is the effective yield at the time of purchase. |
4 | Repurchase Agreements — See Note 6. |
5 | All or a portion of this security is pledged as equity index swap collateral at March 31, 2020. |
| | LIBOR — London Interbank Offered Rate |
| | plc — Public Limited Company |
| | |
| | See Sector Classification in Other Information section. |
The following table summarizes the inputs used to value the Fund’s investments at March 31, 2020 (See Note 4 in the Notes to Financial Statements):
Investments in Securities (Assets) | | Level 1
Quoted
Prices | | | Level 2
Significant
Observable
Inputs | | | Level 3
Significant
Unobservable
Inputs | | | Total | |
Federal Agency Notes | | $ | — | | | $ | 3,299,007 | | | $ | — | | | $ | 3,299,007 | |
U.S. Treasury Bills | | | — | | | | 78,996 | | | | — | | | | 78,996 | |
Repurchase Agreements | | | — | | | | 7,101,045 | | | | — | | | | 7,101,045 | |
Equity Index Swap Agreements** | | | — | | | | 241,122 | | | | — | | | | 241,122 | |
Total Assets | | $ | — | | | $ | 10,720,170 | | | $ | — | | | $ | 10,720,170 | |
Investments in Securities (Liabilities) | | Level 1
Quoted
Prices | | | Level 2
Significant
Observable
Inputs | | | Level 3
Significant
Unobservable
Inputs | | | Total | |
Equity Futures Contracts** | | $ | 69,869 | | | $ | — | | | $ | — | | | $ | 69,869 | |
** | This derivative is reported as unrealized appreciation/depreciation at period end. |
SEE NOTES TO FINANCIAL STATEMENTS. | THE RYDEX FUNDS ANNUAL REPORT | 43 |
INVERSE NASDAQ-100® 2x STRATEGY FUND | |
STATEMENT OF ASSETS AND LIABILITIES
March 31, 2020
Assets: |
Investments, at value (cost $3,379,212) | | $ | 3,378,003 | |
Repurchase agreements, at value (cost $7,101,045) | | | 7,101,045 | |
Cash | | | 4,089,570 | |
Segregated cash with broker | | | 1,461,398 | |
Unrealized appreciation on OTC swap agreements | | | 241,122 | |
Receivables: |
Fund shares sold | | | 852,093 | |
Variation margin on futures contracts | | | 6,742 | |
Interest | | | 2,516 | |
Total assets | | | 17,132,489 | |
| | | | | |
Liabilities: |
Payable for: |
Fund shares redeemed | | | 4,402,590 | |
Swap settlement | | | 172,930 | |
Management fees | | | 11,573 | |
Transfer agent and administrative fees | | | 3,891 | |
Distribution and service fees | | | 3,262 | |
Portfolio accounting fees | | | 1,929 | |
Trustees’ fees* | | | 355 | |
Miscellaneous | | | 14,842 | |
Total liabilities | | | 4,611,372 | |
Commitments and contingent liabilities (Note 11) | | | — | |
Net assets | | $ | 12,521,117 | |
| | | | | |
Net assets consist of: |
Paid in capital | | $ | 125,768,574 | |
Total distributable earnings (loss) | | | (113,247,457 | ) |
Net assets | | $ | 12,521,117 | |
| | | | | |
A-Class: |
Net assets | | $ | 320,102 | |
Capital shares outstanding | | | 17,297 | |
Net asset value per share | | $ | 18.51 | |
Maximum offering price per share (Net asset value divided by 95.25%) | | $ | 19.43 | |
| | | | | |
C-Class: |
Net assets | | $ | 64,122 | |
Capital shares outstanding | | | 3,980 | |
Net asset value per share | | $ | 16.11 | |
| | | | | |
H-Class: |
Net assets | | $ | 12,136,893 | |
Capital shares outstanding | | | 655,601 | |
Net asset value per share | | $ | 18.51 | |
STATEMENT OF OPERATIONS
Year Ended March 31, 2020
Investment Income: |
Interest | | $ | 371,279 | |
Total investment income | | | 371,279 | |
| | | | | |
Expenses: |
Management fees | | | 169,345 | |
Distribution and service fees: |
A-Class | | | 1,280 | |
C-Class | | | 1,521 | |
H-Class | | | 45,385 | |
Transfer agent and administrative fees | | | 47,719 | |
Portfolio accounting fees | | | 28,227 | |
Registration fees | | | 24,432 | |
Professional fees | | | 11,871 | |
Trustees’ fees* | | | 4,497 | |
Custodian fees | | | 2,581 | |
Prime broker interest expense | | | 272 | |
Miscellaneous | | | 15,710 | |
Total expenses | | | 352,840 | |
Net investment income | | | 18,439 | |
| | | | | |
Net Realized and Unrealized Gain (Loss): |
Net realized gain (loss) on: |
Investments | | | 4,560 | |
Swap agreements | | | (6,388,763 | ) |
Futures contracts | | | (1,049,308 | ) |
Net realized loss | | | (7,433,511 | ) |
Net change in unrealized appreciation (depreciation) on: |
Investments | | | (1,942 | ) |
Swap agreements | | | 461,913 | |
Futures contracts | | | (27,986 | ) |
Net change in unrealized appreciation (depreciation) | | | 431,985 | |
Net realized and unrealized loss | | | (7,001,526 | ) |
Net decrease in net assets resulting from operations | | $ | (6,983,087 | ) |
* | Relates to Trustees not deemed “interested persons” within the meaning of Section 2(a)(19) of the 1940 Act. |
44 | THE RYDEX FUNDS ANNUAL REPORT | SEE NOTES TO FINANCIAL STATEMENTS. |
INVERSE NASDAQ-100® 2x STRATEGY FUND | |
STATEMENTS OF CHANGES IN NET ASSETS |
| | Year Ended
March 31,
2020 | | | Year Ended
March 31,
2019 | |
Increase (Decrease) in Net Assets from Operations: | | | | | | | | |
Net investment income | | $ | 18,439 | | | $ | 42,363 | |
Net realized gain (loss) on investments | | | (7,433,511 | ) | | | 1,830,793 | |
Net change in unrealized appreciation (depreciation) on investments | | | 431,985 | | | | (466,239 | ) |
Net increase (decrease) in net assets resulting from operations | | | (6,983,087 | ) | | | 1,406,917 | |
| | | | | | | | | |
Distributions to shareholders: | | | | | | | | |
A-Class | | | (81 | ) | | | — | |
C-Class | | | (78 | ) | | | — | |
H-Class | | | (4,217 | ) | | | — | |
Total distributions to shareholders | | | (4,376 | ) | | | — | |
| | | | | | | | | |
Capital share transactions: | | | | | | | | |
Proceeds from sale of shares | | | | | | | | |
A-Class | | | 6,609,438 | | | | 9,167,634 | |
C-Class | | | 3,015,156 | | | | 2,911,468 | |
H-Class | | | 775,853,576 | | | | 920,744,328 | |
Distributions reinvested | | | | | | | | |
A-Class | | | 81 | | | | — | |
C-Class | | | 70 | | | | — | |
H-Class | | | 3,900 | | | | — | |
Cost of shares redeemed | | | | | | | | |
A-Class | | | (7,465,719 | ) | | | (7,493,186 | ) |
C-Class | | | (3,117,434 | ) | | | (2,809,212 | ) |
H-Class | | | (768,601,584 | ) | | | (924,265,230 | ) |
Net increase (decrease) from capital share transactions | | | 6,297,484 | | | | (1,744,198 | ) |
Net decrease in net assets | | | (689,979 | ) | | | (337,281 | ) |
| | | | | | | | | |
Net assets: | | | | | | | | |
Beginning of year | | | 13,211,096 | | | | 13,548,377 | |
End of year | | $ | 12,521,117 | | | $ | 13,211,096 | |
| | | | | | | | | |
Capital share activity: | | | | | | | | |
Shares sold | | | | | | | | |
A-Class | | | 311,926 | | | | 292,919 | |
C-Class | | | 159,481 | | | | 105,363 | |
H-Class | | | 35,047,860 | | | | 28,779,239 | |
Shares issued from reinvestment of distributions | | | | | | | | |
A-Class | | | 4 | | | | — | |
C-Class | | | 4 | | | | — | |
H-Class | | | 202 | | | | — | |
Shares redeemed | | | | | | | | |
A-Class | | | (344,321 | ) | | | (250,058 | ) |
C-Class | | | (165,334 | ) | | | (102,141 | ) |
H-Class | | | (34,822,936 | ) | | | (28,696,211 | ) |
Net increase in shares | | | 186,886 | | | | 129,111 | |
SEE NOTES TO FINANCIAL STATEMENTS. | THE RYDEX FUNDS ANNUAL REPORT | 45 |
INVERSE NASDAQ-100® 2x STRATEGY FUND | |
This table is presented to show selected data for a share outstanding throughout each period and to assist shareholders in evaluating a Fund’s performance for the periods presented.
A-Class | | Year Ended
March 31,
2020 | | | Year Ended
March 31,
2019 | | | Year Ended
March 29,
2018 | | | Year Ended
March 31,
2017c | | | Year Ended
March 31,
2016c | |
Per Share Data |
Net asset value, beginning of period | | $ | 27.02 | | | $ | 37.57 | | | $ | 58.85 | | | $ | 92.92 | | | $ | 116.18 | |
Income (loss) from investment operations: |
Net investment income (loss)a | | | .04 | | | | .09 | | | | (.30 | ) | | | (1.03 | ) | | | (1.74 | ) |
Net gain (loss) on investments (realized and unrealized) | | | (8.54 | ) | | | (10.64 | )d | | | (20.98 | ) | | | (33.04 | ) | | | (21.52 | ) |
Total from investment operations | | | (8.50 | ) | | | (10.55 | ) | | | (21.28 | ) | | | (34.07 | ) | | | (23.26 | ) |
Less distributions from: |
Net investment income | | | (.01 | ) | | | — | | | | — | | | | — | | | | — | |
Total distributions | | | (.01 | ) | | | — | | | | — | | | | — | | | | — | |
Net asset value, end of period | | $ | 18.51 | | | $ | 27.02 | | | $ | 37.57 | | | $ | 58.85 | | | $ | 92.92 | |
|
Total Returnb | | | (31.48 | %) | | | (28.08 | %) | | | (36.16 | %) | | | (36.67 | %) | | | (19.99 | %) |
Ratios/Supplemental Data |
Net assets, end of period (in thousands) | | $ | 320 | | | $ | 1,342 | | | $ | 256 | | | $ | 155 | | | $ | 832 | |
Ratios to average net assets: |
Net investment income (loss) | | | 0.17 | % | | | 0.29 | % | | | (0.66 | %) | | | (1.31 | %) | | | (1.67 | %) |
Total expenses | | | 1.87 | % | | | 1.90 | % | | | 1.81 | % | | | 1.93 | % | | | 1.79 | % |
Portfolio turnover rate | | | — | | | | — | | | | — | | | | — | | | | — | |
C-Class | | Year Ended
March 31,
2020 | | | Year Ended
March 31,
2019 | | | Year Ended
March 29,
2018 | | | Year Ended
March 31,
2017c | | | Year Ended
March 31,
2016c | |
Per Share Data |
Net asset value, beginning of period | | $ | 23.66 | | | $ | 33.13 | | | $ | 52.26 | | | $ | 82.75 | | | $ | 103.83 | |
Income (loss) from investment operations: |
Net investment income (loss)a | | | (.10 | ) | | | (.13 | ) | | | (.63 | ) | | | (1.48 | ) | | | (2.28 | ) |
Net gain (loss) on investments (realized and unrealized) | | | (7.44 | ) | | | (9.34 | )d | | | (18.50 | ) | | | (29.01 | ) | | | (18.80 | ) |
Total from investment operations | | | (7.54 | ) | | | (9.47 | ) | | | (19.13 | ) | | | (30.49 | ) | | | (21.08 | ) |
Less distributions from: |
Net investment income | | | (.01 | ) | | | — | | | | — | | | | — | | | | — | |
Total distributions | | | (.01 | ) | | | — | | | | — | | | | — | | | | — | |
Net asset value, end of period | | $ | 16.11 | | | $ | 23.66 | | | $ | 33.13 | | | $ | 52.26 | | | $ | 82.75 | |
|
Total Returnb | | | (31.89 | %) | | | (28.58 | %) | | | (36.61 | %) | | | (36.84 | %) | | | (20.29 | %) |
Ratios/Supplemental Data |
Net assets, end of period (in thousands) | | $ | 64 | | | $ | 233 | | | $ | 219 | | | $ | 285 | | | $ | 1,104 | |
Ratios to average net assets: |
Net investment income (loss) | | | (0.54 | %) | | | (0.49 | %) | | | (1.44 | %) | | | (2.09 | %) | | | (2.42 | %) |
Total expenses | | | 2.63 | % | | | 2.58 | % | | | 2.49 | % | | | 2.56 | % | | | 2.53 | % |
Portfolio turnover rate | | | — | | | | — | | | | — | | | | — | | | | — | |
46 | THE RYDEX FUNDS ANNUAL REPORT | SEE NOTES TO FINANCIAL STATEMENTS. |
INVERSE NASDAQ-100® 2x STRATEGY FUND | |
FINANCIAL HIGHLIGHTS (concluded) |
This table is presented to show selected data for a share outstanding throughout each period and to assist shareholders in evaluating a Fund’s performance for the periods presented.
H-Class | | Year Ended
March 31,
2020 | | | Year Ended
March 31,
2019 | | | Year Ended
March 29,
2018 | | | Year Ended
March 31,
2017c | | | Year Ended
March 31,
2016c | |
Per Share Data |
Net asset value, beginning of period | | $ | 27.03 | | | $ | 37.63 | | | $ | 58.95 | | | $ | 92.86 | | | $ | 116.02 | |
Income (loss) from investment operations: |
Net investment income (loss)a | | | .02 | | | | .08 | | | | (.30 | ) | | | (1.02 | ) | | | (1.74 | ) |
Net gain (loss) on investments (realized and unrealized) | | | (8.53 | ) | | | (10.68 | )d | | | (21.02 | ) | | | (32.89 | ) | | | (21.42 | ) |
Total from investment operations | | | (8.51 | ) | | | (10.60 | ) | | | (21.32 | ) | | | (33.91 | ) | | | (23.16 | ) |
Less distributions from: |
Net investment income | | | (.01 | ) | | | — | | | | — | | | | — | | | | — | |
Total distributions | | | (.01 | ) | | | — | | | | — | | | | — | | | | — | |
Net asset value, end of period | | $ | 18.51 | | | $ | 27.03 | | | $ | 37.63 | | | $ | 58.95 | | | $ | 92.86 | |
|
Total Return | | | (31.50 | %) | | | (28.17 | %) | | | (36.17 | %) | | | (36.53 | %) | | | (19.96 | %) |
Ratios/Supplemental Data |
Net assets, end of period (in thousands) | | $ | 12,137 | | | $ | 11,636 | | | $ | 13,073 | | | $ | 20,270 | | | $ | 42,995 | |
Ratios to average net assets: |
Net investment income (loss) | | | 0.10 | % | | | 0.25 | % | | | (0.67 | %) | | | (1.32 | %) | | | (1.68 | %) |
Total expenses | | | 1.87 | % | | | 1.88 | % | | | 1.80 | % | | | 1.83 | % | | | 1.80 | % |
Portfolio turnover rate | | | — | | | | — | | | | — | | | | — | | | | — | |
a | Net investment income (loss) per share was computed using average shares outstanding throughout the period. |
b | Total return does not reflect the impact of any applicable sales charges. |
c | Reverse Share split — Per share amounts for the years presented through March 31, 2017 have been restated to reflect a 1:6 reverse share split effective October 31, 2016. |
d | The amount shown for a share outstanding throughout the period does not accord with the aggregate net gain on investments for the year because of the sales and repurchases of fund shares in relation to fluctuating market value of the investments of the Fund. |
SEE NOTES TO FINANCIAL STATEMENTS. | THE RYDEX FUNDS ANNUAL REPORT | 47 |
PERFORMANCE REPORT AND FUND PROFILE (Unaudited) | March 31, 2020 |
DOW 2x STRATEGY FUND
OBJECTIVE: Seeks to provide investment results that match, before fees and expenses, the performance of a specific benchmark on a daily basis. The Fund’s current benchmark is 200% of the performance of the Dow Jones Industrial Average® Index (the “underlying index”). The Fund does not seek to achieve its investment objective over a period of time greater than one day.
For the one-year period ended March 31, 2020, Dow 2x Strategy Fund maintained a daily correlation of over 99% to its benchmark of 200% of the daily price movement of the Dow Jones Industrial Average Index. Dow 2x Strategy Fund H-Class returned -35.58%, while the Dow Jones Industrial Average Index returned -13.38% over the same time period.
The only sector contributing to the return of the underlying index was Information Technology. The sectors detracting the most were Industrials, Financials, and Energy.
The holdings contributing the most to the return of the underlying index were Apple, Inc., Microsoft Corp., and Walmart, Inc. The holdings detracting the most were Boeing Co., 3M Co., and Chevron Corp.
Derivatives in the Fund were used to help provide exposure to the composition of the benchmark in the highest efficient manner and to provide leverage and not for hedging purposes. Derivatives performed as expected.
Due to the compounding of daily returns, leveraged and inverse funds’ returns over periods other than one day will likely differ in amount and possibly direction from the benchmark return for the same period. Investors should monitor their leveraged and inverse funds’ holdings to ensure that they are consistent with their strategies, as frequently as daily.
The effects of compounding may cause the longer-term correlation of the Fund to its benchmark to diminish. The apparent discrepancy between the leveraged and unleveraged indices is the result of compounding, which is described briefly on page 6 of this report.
Performance displayed represents past performance, which is no guarantee of future result.
Holdings Diversification (Market Exposure as % of Net Assets)
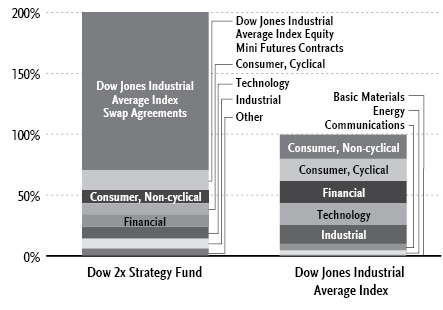
“Holdings Diversification (Market Exposure as % of Net Assets)” excludes any temporary cash investments.
Inception Dates: |
A-Class | September 1, 2004 |
C-Class | February 20, 2004 |
H-Class | February 20, 2004 |
Ten Largest Holdings (% of Total Net Assets) |
Apple, Inc. | 4.2% |
UnitedHealth Group, Inc. | 4.2% |
Home Depot, Inc. | 3.1% |
McDonald’s Corp. | 2.8% |
Visa, Inc. — Class A | 2.7% |
Microsoft Corp. | 2.6% |
Goldman Sachs Group, Inc. | 2.6% |
Boeing Co. | 2.5% |
3M Co. | 2.3% |
Johnson & Johnson | 2.2% |
Top Ten Total | 29.2% |
| | |
“Ten Largest Holdings” excludes any temporary cash or derivative investments. |
48 | THE RYDEX FUNDS ANNUAL REPORT | |
PERFORMANCE REPORT AND FUND PROFILE (Unaudited)(concluded) | March 31, 2020 |
Cumulative Fund Performance*
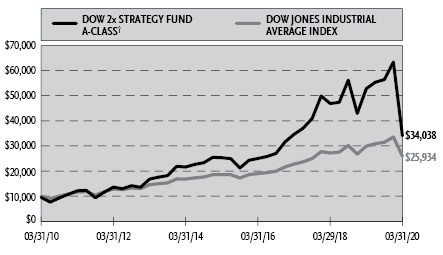

Average Annual Returns*
Periods Ended March 31, 2020
| 1 Year | 5 Year | 10 Year |
A-Class Shares | (35.58%) | 6.09% | 13.58% |
A-Class Shares with sales charge† | (38.64%) | 5.06% | 13.03% |
C-Class Shares | (36.06%) | 5.31% | 12.74% |
C-Class Shares with CDSC‡ | (36.67%) | 5.31% | 12.74% |
H-Class Shares | (35.58%) | 6.09% | 13.56% |
Dow Jones Industrial Average Index | (13.38%) | 6.86% | 10.00% |
* | The performance data above represents past performance that is not predictive of future results. The investment return and principal value of an investment in the Fund will fluctuate so that an investor’s shares, when redeemed, may be worth more or less than their original cost. Returns are historical and include changes in principal and reinvested dividends and capital gains and do not reflect the effect of taxes. The Dow Jones Industrial Average Index is an unmanaged index and, unlike the Fund, has no management fees or operating expenses to reduce its reported return. The graphs are based on A-Class shares and H-Class shares only; performance for C-Class shares will vary due to differences in fee structures. |
† | Fund returns are calculated using the maximum sales charge of 4.75%. |
‡ | Fund returns include a CDSC of 1% if redeemed within 12 months of purchase. |
| | THE RYDEX FUNDS ANNUAL REPORT | 49 |
SCHEDULE OF INVESTMENTS | March 31, 2020 |
DOW 2x STRATEGY FUND | |
| | Shares | | | Value | |
COMMON STOCKS† - 53.9% |
| | | | | | | | | |
Consumer, Non-cyclical - 10.7% |
UnitedHealth Group, Inc. | | | 3,981 | | | $ | 992,782 | |
Johnson & Johnson | | | 3,981 | | | | 522,028 | |
Procter & Gamble Co. | | | 3,981 | | | | 437,910 | |
Merck & Company, Inc. | | | 3,981 | | | | 306,298 | |
Coca-Cola Co. | | | 3,981 | | | | 176,159 | |
Pfizer, Inc. | | | 3,981 | | | | 129,940 | |
Total Consumer, Non-cyclical | | | | | | | 2,565,117 | |
| | | | | | | | | |
Consumer, Cyclical - 9.9% |
Home Depot, Inc. | | | 3,981 | | | | 743,293 | |
McDonald’s Corp. | | | 3,981 | | | | 658,258 | |
Walmart, Inc. | | | 3,981 | | | | 452,321 | |
NIKE, Inc. — Class B | | | 3,981 | | | | 329,388 | |
Walgreens Boots Alliance, Inc. | | | 3,981 | | | | 182,131 | |
Total Consumer, Cyclical | | | | | | | 2,365,391 | |
| | | | | | | | | |
Financial - 9.9% |
Visa, Inc. — Class A | | | 3,981 | | | | 641,419 | |
Goldman Sachs Group, Inc. | | | 3,981 | | | | 615,423 | |
Travelers Companies, Inc. | | | 3,981 | | | | 395,513 | |
JPMorgan Chase & Co. | | | 3,981 | | | | 358,409 | |
American Express Co. | | | 3,981 | | | | 340,813 | |
Total Financial | | | | | | | 2,351,577 | |
| | | | | | | | | |
Technology - 9.6% |
Apple, Inc. | | | 3,981 | | | | 1,012,329 | |
Microsoft Corp. | | | 3,981 | | | | 627,843 | |
International Business Machines Corp. | | | 3,981 | | | | 441,612 | |
Intel Corp. | | | 3,981 | | | | 215,452 | |
Total Technology | | | | | | | 2,297,236 | |
| | | | | | | | | |
Industrial - 8.3% |
Boeing Co. | | | 3,981 | | | | 593,726 | |
3M Co. | | | 3,981 | | | | 543,447 | |
Caterpillar, Inc. | | | 3,981 | | | | 461,955 | |
United Technologies Corp. | | | 3,981 | | | | 375,528 | |
Total Industrial | | | | | | | 1,974,656 | |
| | | | | | | | | |
Communications - 3.2% |
Walt Disney Co. | | | 3,981 | | | | 384,565 | |
Verizon Communications, Inc. | | | 3,981 | | | | 213,899 | |
Cisco Systems, Inc. | | | 3,981 | | | | 156,493 | |
Total Communications | | | | | | | 754,957 | |
| | | | | | | | | |
Energy - 1.8% |
Chevron Corp. | | | 3,981 | | | | 288,463 | |
Exxon Mobil Corp. | | | 3,981 | | | | 151,159 | |
Total Energy | | | | | | | 439,622 | |
| | | | | | | | | |
Basic Materials - 0.5% |
Dow, Inc. | | | 3,981 | | | | 116,404 | |
| | | | | | | | | |
Total Common Stocks | | | | |
(Cost $10,700,886) | | | | | | | 12,864,960 | |
| | | | | | | | | |
| | | Face
Amount | | | | | |
U.S. TREASURY BILLS†† - 2.9% |
U.S. Treasury Bills |
0.50% due 04/30/201,2 | | $ | 679,000 | | | | 678,970 | |
Total U.S. Treasury Bills | | | | |
(Cost $678,722) | | | | | | | 678,970 | |
| | | | | | | | | |
REPURCHASE AGREEMENTS††,3 - 11.7% |
J.P. Morgan Securities LLC
issued 03/31/20 at 0.01%
due 04/01/204 | | | 2,024,781 | | | | 2,024,781 | |
BofA Securities, Inc.
issued 03/31/20 at 0.00%
due 04/01/204 | | | 778,762 | | | | 778,762 | |
Total Repurchase Agreements | | | | |
(Cost $2,803,543) | | | | | | | 2,803,543 | |
| | | | | | | | | |
Total Investments - 68.5% | | | | |
(Cost $14,183,151) | | $ | 16,347,473 | |
Other Assets & Liabilities, net - 31.5% | | | 7,531,924 | |
Total Net Assets - 100.0% | | $ | 23,879,397 | |
Futures Contracts |
Description | | Number of
Contracts | | | Expiration Date | | | Notional
Amount | | | Value and
Unrealized
Appreciation** | |
Equity Futures Contracts Purchased† |
Dow Jones Industrial Average Index Mini Futures Contracts | | | 36 | | | | Jun 2020 | | | $ | 3,920,220 | | | $ | 291,359 | |
50 | THE RYDEX FUNDS ANNUAL REPORT | SEE NOTES TO FINANCIAL STATEMENTS. |
SCHEDULE OF INVESTMENTS (concluded) | March 31, 2020 |
DOW 2x STRATEGY FUND | |
Total Return Swap Agreements |
Counterparty | Index | Financing
Rate Pay | Payment
Frequency | | Maturity Date | | | Units | | | Notional
Amount | | | Value and
Unrealized
Depreciation | |
OTC Equity Index Swap Agreements†† |
Barclays Bank plc | Dow Jones Industrial Average Index | 1.09% (1 Week USD LIBOR + 0.50%) | At Maturity | | | 04/30/20 | | | | 759 | | | $ | 16,633,176 | | | $ | (311,401 | ) |
BNP Paribas | Dow Jones Industrial Average Index | 1.49% (1 Month USD LIBOR + 0.50%) | At Maturity | | | 04/29/20 | | | | 657 | | | | 14,396,431 | | | | (398,947 | ) |
| | | | | | | | | | | | | | $ | 31,029,607 | | | $ | (710,348 | ) |
** | Includes cumulative appreciation (depreciation). Variation margin is reported within the Statement of Assets and Liabilities. |
† | Value determined based on Level 1 inputs — See Note 4. |
†† | Value determined based on Level 2 inputs — See Note 4. |
1 | All or a portion of this security is pledged as futures collateral at March 31, 2020. |
2 | Rate indicated is the effective yield at the time of purchase. |
3 | Repurchase Agreements — See Note 6. |
4 | All or a portion of this security is pledged as equity index swap collateral at March 31, 2020. |
| | LIBOR — London Interbank Offered Rate |
| | plc — Public Limited Company |
| | |
| | See Sector Classification in Other Information section. |
The following table summarizes the inputs used to value the Fund’s investments at March 31, 2020 (See Note 4 in the Notes to Financial Statements):
Investments in Securities (Assets) | | Level 1
Quoted
Prices | | | Level 2
Significant
Observable
Inputs | | | Level 3
Significant
Unobservable
Inputs | | | Total | |
Common Stocks | | $ | 12,864,960 | | | $ | — | | | $ | — | | | $ | 12,864,960 | |
U.S. Treasury Bills | | | — | | | | 678,970 | | | | — | | | | 678,970 | |
Repurchase Agreements | | | — | | | | 2,803,543 | | | | — | | | | 2,803,543 | |
Equity Futures Contracts** | | | 291,359 | | | | — | | | | — | | | | 291,359 | |
Total Assets | | $ | 13,156,319 | | | $ | 3,482,513 | | | $ | — | | | $ | 16,638,832 | |
Investments in Securities (Liabilities) | | Level 1
Quoted
Prices | | | Level 2
Significant
Observable
Inputs | | | Level 3
Significant
Unobservable
Inputs | | | Total | |
Equity Index Swap Agreements** | | $ | — | | | $ | 710,348 | | | $ | — | | | $ | 710,348 | |
** | This derivative is reported as unrealized appreciation/depreciation at period end. |
SEE NOTES TO FINANCIAL STATEMENTS. | THE RYDEX FUNDS ANNUAL REPORT | 51 |
STATEMENT OF ASSETS AND LIABILITIES
March 31, 2020
Assets: |
Investments, at value (cost $11,379,608) | | $ | 13,543,930 | |
Repurchase agreements, at value (cost $2,803,543) | | | 2,803,543 | |
Cash | | | 1,616,356 | |
Segregated cash with broker | | | 6,392,019 | |
Receivables: |
Fund shares sold | | | 1,692,655 | |
Dividends | | | 9,485 | |
Investment Adviser | | | 170 | |
Total assets | | | 26,058,158 | |
| | | | | |
Liabilities: |
Unrealized depreciation on OTC swap agreements | | | 710,348 | |
Payable for: |
Fund shares redeemed | | | 1,269,705 | |
Swap settlement | | | 78,744 | |
Variation margin on futures contracts | | | 59,049 | |
Management fees | | | 20,077 | |
Transfer agent and administrative fees | | | 7,411 | |
Distribution and service fees | | | 6,464 | |
Portfolio accounting fees | | | 3,346 | |
Trustees’ fees | | | 632 | |
Miscellaneous | | | 22,985 | |
Total liabilities | | | 2,178,761 | |
Commitments and contingent liabilities (Note 11) | | | — | |
Net assets | | $ | 23,879,397 | |
| | | | | |
Net assets consist of: |
Paid in capital | | $ | 33,520,230 | |
Total distributable earnings (loss) | | | (9,640,833 | ) |
Net assets | | $ | 23,879,397 | |
| | | | | |
A-Class: |
Net assets | | $ | 5,751,567 | |
Capital shares outstanding | | | 98,512 | |
Net asset value per share | | $ | 58.38 | |
Maximum offering price per share (Net asset value divided by 95.25%) | | $ | 61.29 | |
| | | | | |
C-Class: |
Net assets | | $ | 1,413,057 | |
Capital shares outstanding | | | 27,792 | |
Net asset value per share | | $ | 50.84 | |
| | | | | |
H-Class: |
Net assets | | $ | 16,714,773 | |
Capital shares outstanding | | | 287,264 | |
Net asset value per share | | $ | 58.19 | |
STATEMENT OF OPERATIONS
Year Ended March 31, 2020
Investment Income: |
Dividends | | $ | 826,670 | |
Interest | | | 127,900 | |
Total investment income | | | 954,570 | |
| | | | | |
Expenses: |
Management fees | | | 371,470 | |
Distribution and service fees: |
A-Class | | | 25,733 | |
C-Class | | | 20,566 | |
H-Class | | | 72,317 | |
Transfer agent and administrative fees | | | 105,022 | |
Portfolio accounting fees | | | 61,914 | |
Registration fees | | | 52,429 | |
Professional fees | | | 24,584 | |
Trustees’ fees* | | | 9,534 | |
Custodian fees | | | 5,644 | |
Line of credit fees | | | 79 | |
Miscellaneous | | | 40,004 | |
Total expenses | | | 789,296 | |
Net investment income | | | 165,274 | |
| | | | | |
Net Realized and Unrealized Gain (Loss): |
Net realized gain (loss) on: |
Investments | | | 1,741,333 | |
Swap agreements | | | (3,560,852 | ) |
Futures contracts | | | (2,999,461 | ) |
Net realized loss | | | (4,818,980 | ) |
Net change in unrealized appreciation (depreciation) on: |
Investments | | | (6,572,135 | ) |
Swap agreements | | | (1,234,438 | ) |
Futures contracts | | | 273,836 | |
Net change in unrealized appreciation (depreciation) | | | (7,532,737 | ) |
Net realized and unrealized loss | | | (12,351,717 | ) |
Net decrease in net assets resulting from operations | | $ | (12,186,443 | ) |
* | Relates to Trustees not deemed “interested persons” within the meaning of Section 2(a)(19) of the 1940 Act. |
52 | THE RYDEX FUNDS ANNUAL REPORT | SEE NOTES TO FINANCIAL STATEMENTS. |
STATEMENTS OF CHANGES IN NET ASSETS |
| | Year Ended
March 31,
2020 | | | Year Ended
March 31,
2019 | |
Increase (Decrease) in Net Assets from Operations: | | | | | | | | |
Net investment income | | $ | 165,274 | | | $ | 158,669 | |
Net realized gain (loss) on investments | | | (4,818,980 | ) | | | 3,984,952 | |
Net change in unrealized appreciation (depreciation) on investments | | | (7,532,737 | ) | | | 1,410,114 | |
Net increase (decrease) in net assets resulting from operations | | | (12,186,443 | ) | | | 5,553,735 | |
| | | | | | | | | |
Distributions to shareholders: | | | | | | | | |
A-Class | | | (368,691 | ) | | | — | |
C-Class | | | (81,482 | ) | | | — | |
H-Class | | | (1,002,324 | ) | | | — | |
Total distributions to shareholders | | | (1,452,497 | ) | | | — | |
| | | | | | | | | |
Capital share transactions: | | | | | | | | |
Proceeds from sale of shares | | | | | | | | |
A-Class | | | 6,985,394 | | | | 6,721,007 | |
C-Class | | | 4,247,839 | | | | 2,923,086 | |
H-Class | | | 318,868,616 | | | | 455,051,730 | |
Distributions reinvested | | | | | | | | |
A-Class | | | 352,465 | | | | — | |
C-Class | | | 78,884 | | | | — | |
H-Class | | | 839,961 | | | | — | |
Cost of shares redeemed | | | | | | | | |
A-Class | | | (8,896,442 | ) | | | (8,246,025 | ) |
C-Class | | | (4,486,340 | ) | | | (4,446,593 | ) |
H-Class | | | (326,894,461 | ) | | | (471,676,263 | ) |
Net decrease from capital share transactions | | | (8,904,084 | ) | | | (19,673,058 | ) |
Net decrease in net assets | | | (22,543,024 | ) | | | (14,119,323 | ) |
| | | | | | | | | |
Net assets: | | | | | | | | |
Beginning of year | | | 46,422,421 | | | | 60,541,744 | |
End of year | | $ | 23,879,397 | | | $ | 46,422,421 | |
| | | | | | | | | |
Capital share activity: | | | | | | | | |
Shares sold | | | | | | | | |
A-Class | | | 81,965 | | | | 76,544 | |
C-Class | | | 52,016 | | | | 37,855 | |
H-Class | | | 3,403,218 | | | | 5,183,132 | |
Shares issued from reinvestment of distributions | | | | | | | | |
A-Class | | | 3,299 | | | | — | |
C-Class | | | 846 | | | | — | |
H-Class | | | 7,888 | | | | — | |
Shares redeemed | | | | | | | | |
A-Class | | | (102,007 | ) | | | (94,181 | ) |
C-Class | | | (52,722 | ) | | | (57,107 | ) |
H-Class | | | (3,480,852 | ) | | | (5,381,115 | ) |
Net decrease in shares | | | (86,349 | ) | | | (234,872 | ) |
SEE NOTES TO FINANCIAL STATEMENTS. | THE RYDEX FUNDS ANNUAL REPORT | 53 |
This table is presented to show selected data for a share outstanding throughout each period and to assist shareholders in evaluating a Fund’s performance for the periods presented.
A-Class | | Year Ended
March 31,
2020 | | | Year Ended
March 31,
2019 | | | Year Ended
March 29,
2018 | | | Year Ended
March 31,
2017 | | | Year Ended
March 31,
2016 | |
Per Share Data |
Net asset value, beginning of period | | $ | 93.69 | | | $ | 83.19 | | | $ | 64.70 | | | $ | 47.00 | | | $ | 50.69 | |
Income (loss) from investment operations: |
Net investment income (loss)a | | | .44 | | | | .34 | | | | .26 | | | | .02 | | | | (.21 | ) |
Net gain (loss) on investments (realized and unrealized) | | | (32.14 | ) | | | 10.16 | | | | 22.94 | | | | 18.03 | | | | (.43 | ) |
Total from investment operations | | | (31.70 | ) | | | 10.50 | | | | 23.20 | | | | 18.05 | | | | (.64 | ) |
Less distributions from: |
Net investment income | | | (.39 | ) | | | — | | | | (.13 | ) | | | — | | | | — | |
Net realized gains | | | (3.22 | ) | | | — | | | | (4.58 | ) | | | (.35 | ) | | | (3.05 | ) |
Total distributions | | | (3.61 | ) | | | — | | | | (4.71 | ) | | | (.35 | ) | | | (3.05 | ) |
Net asset value, end of period | | $ | 58.38 | | | $ | 93.69 | | | $ | 83.19 | | | $ | 64.70 | | | $ | 47.00 | |
|
Total Returnb | | | (35.58 | %) | | | 12.62 | % | | | 35.39 | % | | | 38.49 | % | | | (1.21 | %) |
Ratios/Supplemental Data |
Net assets, end of period (in thousands) | | $ | 5,752 | | | $ | 10,799 | | | $ | 11,055 | | | $ | 8,686 | | | $ | 8,280 | |
Ratios to average net assets: |
Net investment income (loss) | | | 0.45 | % | | | 0.39 | % | | | 0.34 | % | | | 0.04 | % | | | (0.45 | %) |
Total expenses | | | 1.87 | % | | | 1.87 | % | | | 1.80 | % | | | 1.86 | % | | | 1.82 | % |
Portfolio turnover rate | | | 126 | % | | | 239 | % | | | 223 | % | | | 350 | % | | | 1,023 | % |
C-Class | | Year Ended
March 31,
2020 | | | Year Ended
March 31,
2019 | | | Year Ended
March 29,
2018 | | | Year Ended
March 31,
2017 | | | Year Ended
March 31,
2016 | |
Per Share Data |
Net asset value, beginning of period | | $ | 82.59 | | | $ | 73.88 | | | $ | 58.24 | | | $ | 42.64 | | | $ | 46.62 | |
Income (loss) from investment operations: |
Net investment income (loss)a | | | (.28 | ) | | | (.26 | ) | | | (.35 | ) | | | (.32 | ) | | | (.51 | ) |
Net gain (loss) on investments (realized and unrealized) | | | (27.86 | ) | | | 8.97 | | | | 20.70 | | | | 16.27 | | | | (.42 | ) |
Total from investment operations | | | (28.14 | ) | | | 8.71 | | | | 20.35 | | | | 15.95 | | | | (.93 | ) |
Less distributions from: |
Net investment income | | | (.39 | ) | | | — | | | | (.13 | ) | | | — | | | | — | |
Net realized gains | | | (3.22 | ) | | | — | | | | (4.58 | ) | | | (.35 | ) | | | (3.05 | ) |
Total distributions | | | (3.61 | ) | | | — | | | | (4.71 | ) | | | (.35 | ) | | | (3.05 | ) |
Net asset value, end of period | | $ | 50.84 | | | $ | 82.59 | | | $ | 73.88 | | | $ | 58.24 | | | $ | 42.64 | |
|
Total Returnb | | | (36.06 | %) | | | 11.79 | % | | | 34.41 | % | | | 37.49 | % | | | (1.96 | %) |
Ratios/Supplemental Data |
Net assets, end of period (in thousands) | | $ | 1,413 | | | $ | 2,284 | | | $ | 3,465 | | | $ | 2,593 | | | $ | 3,459 | |
Ratios to average net assets: |
Net investment income (loss) | | | (0.32 | %) | | | (0.34 | %) | | | (0.49 | %) | | | (0.68 | %) | | | (1.18 | %) |
Total expenses | | | 2.62 | % | | | 2.61 | % | | | 2.54 | % | | | 2.60 | % | | | 2.56 | % |
Portfolio turnover rate | | | 126 | % | | | 239 | % | | | 223 | % | | | 350 | % | | | 1,023 | % |
54 | THE RYDEX FUNDS ANNUAL REPORT | SEE NOTES TO FINANCIAL STATEMENTS. |
FINANCIAL HIGHLIGHTS (concluded) |
This table is presented to show selected data for a share outstanding throughout each period and to assist shareholders in evaluating a Fund’s performance for the periods presented.
H-Class | | Year Ended
March 31,
2020 | | | Year Ended
March 31,
2019 | | | Year Ended
March 29,
2018 | | | Year Ended
March 31,
2017 | | | Year Ended
March 31,
2016 | |
Per Share Data |
Net asset value, beginning of period | | $ | 93.39 | | | $ | 82.92 | | | $ | 64.50 | | | $ | 46.86 | | | $ | 50.54 | |
Income (loss) from investment operations: |
Net investment income (loss)a | | | .43 | | | | .32 | | | | .14 | | | | — | | | | (.18 | ) |
Net gain (loss) on investments (realized and unrealized) | | | (32.02 | ) | | | 10.15 | | | | 22.99 | | | | 17.99 | | | | (.45 | ) |
Total from investment operations | | | (31.59 | ) | | | 10.47 | | | | 23.13 | | | | 17.99 | | | | (.63 | ) |
Less distributions from: |
Net investment income | | | (.39 | ) | | | — | | | | (.13 | ) | | | — | | | | — | |
Net realized gains | | | (3.22 | ) | | | — | | | | (4.58 | ) | | | (.35 | ) | | | (3.05 | ) |
Total distributions | | | (3.61 | ) | | | — | | | | (4.71 | ) | | | (.35 | ) | | | (3.05 | ) |
Net asset value, end of period | | $ | 58.19 | | | $ | 93.39 | | | $ | 82.92 | | | $ | 64.50 | | | $ | 46.86 | |
|
Total Return | | | (35.58 | %) | | | 12.63 | % | | | 35.37 | % | | | 38.50 | % | | | (1.20 | %) |
Ratios/Supplemental Data |
Net assets, end of period (in thousands) | | $ | 16,715 | | | $ | 33,340 | | | $ | 46,021 | | | $ | 23,055 | | | $ | 21,389 | |
Ratios to average net assets: |
Net investment income (loss) | | | 0.43 | % | | | 0.36 | % | | | 0.18 | % | | | — | | | | (0.40 | %) |
Total expenses | | | 1.88 | % | | | 1.87 | % | | | 1.80 | % | | | 1.86 | % | | | 1.82 | % |
Portfolio turnover rate | | | 126 | % | | | 239 | % | | | 223 | % | | | 350 | % | | | 1,023 | % |
a | Net investment income (loss) per share was computed using average shares outstanding throughout the period. |
b | Total return does not reflect the impact of any applicable sales charges. |
SEE NOTES TO FINANCIAL STATEMENTS. | THE RYDEX FUNDS ANNUAL REPORT | 55 |
PERFORMANCE REPORT AND FUND PROFILE (Unaudited) | March 31, 2020 |
INVERSE DOW 2x STRATEGY FUND
OBJECTIVE: Seeks to provide investment results that match, before fees and expenses, the performance of a specific benchmark on a daily basis. The Fund’s current benchmark is 200% of the inverse (opposite) of the performance of the Dow Jones Industrial Average® Index (the “underlying index”). The Fund does not seek to achieve its investment objective over a period of time greater than one day.
For the one-year period ended March 31, 2020, Inverse Dow 2x Strategy Fund maintained a daily correlation of over 99% to its benchmark of -200% of the daily price movement of the Dow Jones Industrial Average Index. Inverse Dow 2x Strategy Fund H-Class returned 2.37%, while the Dow Jones Industrial Average Index returned -13.38% over the same time period.
The only sector contributing to the return of the underlying index was Information Technology. The sectors detracting the most were Industrials, Financials, and Energy.
The holdings contributing the most to the return of the underlying index were Apple, Inc., Microsoft Corp., and Wal-Mart, Inc. The holdings detracting the most were Boeing Co., 3M Co., and Chevron Corp.
Derivatives in the Fund were used to help provide exposure to the composition of the benchmark in the most efficient manner possible and to provide leverage and not for hedging purposes. Derivatives performed as expected.
Due to the compounding of daily returns, leveraged and inverse funds’ returns over periods other than one day will likely differ in amount and possibly direction from the benchmark return for the same period. Investors should monitor their leveraged and inverse funds’ holdings to ensure that they are consistent with their strategies, as frequently as daily.
The effects of compounding may cause the longer-term correlation of the Fund to its benchmark to diminish. The apparent discrepancy between the leveraged and unleveraged indices is the result of compounding, which is described briefly on page 6 of this report.
Performance displayed represents past performance, which is no guarantee of future results.
Holdings Diversification (Market Exposure as % of Net Assets)

“Holdings Diversification (Market Exposure as % of Net Assets)” excludes any temporary cash investments.
Inception Dates: |
A-Class | September 1, 2004 |
C-Class | February 20, 2004 |
H-Class | February 20, 2004 |
The Fund invests principally in derivative investments such as swap agreements and futures contracts.
56 | THE RYDEX FUNDS ANNUAL REPORT | |
PERFORMANCE REPORT AND FUND PROFILE (Unaudited)(concluded) | March 31, 2020 |
Cumulative Fund Performance*
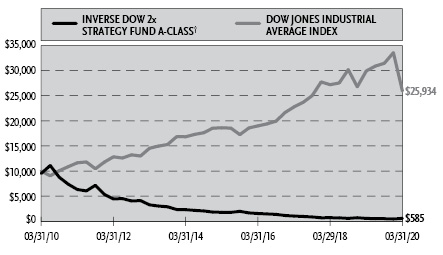

Average Annual Returns*
Periods Ended March 31, 2020
| 1 Year | 5 Year | 10 Year |
A-Class Shares | 2.27% | (20.03%) | (24.34%) |
A-Class Shares with sales charge† | (2.55%) | (20.80%) | (24.71%) |
C-Class Shares | 1.63% | (20.62%) | (24.93%) |
C-Class Shares with CDSC‡ | 0.63% | (20.62%) | (24.93%) |
H-Class Shares | 2.37% | (20.02%) | (24.32%) |
Dow Jones Industrial Average Index | (13.38%) | 6.86% | 10.00% |
* | The performance data above represents past performance that is not predictive of future results. The investment return and principal value of an investment in the Fund will fluctuate so that an investor’s shares, when redeemed, may be worth more or less than their original cost. Returns are historical and include changes in principal and reinvested dividends and capital gains and do not reflect the effect of taxes. The Dow Jones Industrial Average Index is an unmanaged index and, unlike the Fund, has no management fees or operating expenses to reduce its reported return. The graphs are based on A-Class shares and H-Class shares only; performance for C-Class shares will vary due to differences in fee structures. |
† | Fund returns are calculated using the maximum sales charge of 4.75%. |
‡ | Fund returns include a CDSC of 1% if redeemed within 12 months of purchase. |
| | THE RYDEX FUNDS ANNUAL REPORT | 57 |
SCHEDULE OF INVESTMENTS | March 31, 2020 |
INVERSE DOW 2x STRATEGY FUND | |
| | Face
Amount | | | Value | |
FEDERAL AGENCY NOTES†† - 27.9% |
Federal Farm Credit Bank |
1.53% (3 Month USD LIBOR - 0.21%, Rate Floor: 0.00%) due 08/10/201 | | $ | 1,000,000 | | | $ | 999,518 | |
0.38% (3 Month U.S. Treasury Bill Rate + 0.29%, Rate Floor: 0.00%) due 04/11/221 | | | 1,000,000 | | | | 998,364 | |
0.45% (U.S. Prime Rate - 2.80%, Rate Floor: 0.00%) due 03/14/221 | | | 500,000 | | | | 501,102 | |
0.44% (U.S. Prime Rate - 2.81%, Rate Floor: 0.00%) due 05/20/221 | | | 180,000 | | | | 180,391 | |
Total Federal Agency Notes | | | | |
(Cost $2,679,610) | | | | | | | 2,679,375 | |
| | | | | | | | | |
U.S. TREASURY BILLS†† - 0.2% |
U.S. Treasury Bills |
0.50% due 04/30/202,3 | | | 16,000 | | | | 15,999 | |
Total U.S. Treasury Bills | | | | |
(Cost $15,994) | | | | | | | 15,999 | |
| | | | | | | | | |
REPURCHASE AGREEMENTS††,4 - 51.7% |
J.P. Morgan Securities LLC
issued 03/31/20 at 0.01%
due 04/01/205 | | | 3,581,177 | | | | 3,581,177 | |
BofA Securities, Inc.
issued 03/31/20 at 0.00%
due 04/01/205 | | | 1,377,376 | | | | 1,377,376 | |
Total Repurchase Agreements | | | | |
(Cost $4,958,553) | | | | | | | 4,958,553 | |
| | | | | | | | | |
Total Investments - 79.8% | | | | |
(Cost $7,654,157) | | $ | 7,653,927 | |
Other Assets & Liabilities, net - 20.2% | | | 1,933,927 | |
Total Net Assets - 100.0% | | $ | 9,587,854 | |
Futures Contracts |
Description | | Number of
Contracts | | | Expiration Date | | | Notional
Amount | | | Value and
Unrealized
Depreciation** | |
Equity Futures Contracts Sold Short† |
Dow Jones Industrial Average Index Mini Futures Contracts | | | 10 | | | | Jun 2020 | | | $ | 1,088,950 | | | $ | (37,512 | ) |
Total Return Swap Agreements |
Counterparty | Index | Financing
Rate Receive | Payment
Frequency | | Maturity Date | | | Units | | | Notional
Amount | | | Value and
Unrealized
Appreciation
(Depreciation) | |
OTC Equity Index Swap Agreements Sold Short†† |
Barclays Bank plc | Dow Jones Industrial Average Index | (0.84)% (1 Week USD LIBOR + 0.25%) | At Maturity | | | 04/30/20 | | | | 342 | | | $ | 7,485,269 | | | $ | 117,513 | |
BNP Paribas | Dow Jones Industrial Average Index | (0.77)% (1 Month USD LIBOR) | At Maturity | | | 04/29/20 | | | | 484 | | | | 10,604,936 | | | | (312,760 | ) |
| | | | | | | | | | | | | | $ | 18,090,205 | | | $ | (195,247 | ) |
58 | THE RYDEX FUNDS ANNUAL REPORT | SEE NOTES TO FINANCIAL STATEMENTS. |
SCHEDULE OF INVESTMENTS (concluded) | March 31, 2020 |
INVERSE DOW 2x STRATEGY FUND | |
** | Includes cumulative appreciation (depreciation). Variation margin is reported within the Statement of Assets and Liabilities. |
† | Value determined based on Level 1 inputs — See Note 4. |
†† | Value determined based on Level 2 inputs — See Note 4. |
1 | Variable rate security. Rate indicated is the rate effective at March 31, 2020. In some instances, the effective rate is limited by a minimum rate floor or a maximum rate cap established by the issuer. The settlement status of a position may also impact the effective rate indicated. In some cases, a position may be unsettled at period end and may not have a stated effective rate. In instances where multiple underlying reference rates and spread amounts are shown, the effective rate is based on a weighted average. |
2 | All or a portion of this security is pledged as futures collateral at March 31, 2020. |
3 | Rate indicated is the effective yield at the time of purchase. |
4 | Repurchase Agreements — See Note 6. |
5 | All or a portion of this security is pledged as equity index swap collateral at March 31, 2020. |
| | LIBOR — London Interbank Offered Rate |
| | plc — Public Limited Company |
| | |
| | See Sector Classification in Other Information section. |
The following table summarizes the inputs used to value the Fund’s investments at March 31, 2020 (See Note 4 in the Notes to Financial Statements):
Investments in Securities (Assets) | | Level 1
Quoted
Prices | | | Level 2
Significant
Observable
Inputs | | | Level 3
Significant
Unobservable
Inputs | | | Total | |
Federal Agency Notes | | $ | — | | | $ | 2,679,375 | | | $ | — | | | $ | 2,679,375 | |
U.S. Treasury Bills | | | — | | | | 15,999 | | | | — | | | | 15,999 | |
Repurchase Agreements | | | — | | | | 4,958,553 | | | | — | | | | 4,958,553 | |
Equity Index Swap Agreements** | | | — | | | | 117,513 | | | | — | | | | 117,513 | |
Total Assets | | $ | — | | | $ | 7,771,440 | | | $ | — | | | $ | 7,771,440 | |
Investments in Securities (Liabilities) | | Level 1
Quoted
Prices | | | Level 2
Significant
Observable
Inputs | | | Level 3
Significant
Unobservable
Inputs | | | Total | |
Equity Futures Contracts** | | $ | 37,512 | | | $ | — | | | $ | — | | | $ | 37,512 | |
Equity Index Swap Agreements** | | | — | | | | 312,760 | | | | — | | | | 312,760 | |
Total Liabilities | | $ | 37,512 | | | $ | 312,760 | | | $ | — | | | $ | 350,272 | |
** | This derivative is reported as unrealized appreciation/depreciation at period end. |
SEE NOTES TO FINANCIAL STATEMENTS. | THE RYDEX FUNDS ANNUAL REPORT | 59 |
INVERSE DOW 2x STRATEGY FUND | |
STATEMENT OF ASSETS AND LIABILITIES
March 31, 2020
Assets: |
Investments, at value (cost $2,695,604) | | $ | 2,695,374 | |
Repurchase agreements, at value (cost $4,958,553) | | | 4,958,553 | |
Cash | | | 2,836,902 | |
Segregated cash with broker | | | 1,768,081 | |
Unrealized appreciation on OTC swap agreements | | | 117,513 | |
Receivables: |
Fund shares sold | | | 1,398,960 | |
Variation margin on futures contracts | | | 19,400 | |
Interest | | | 5,812 | |
Total assets | | | 13,800,595 | |
| | | | | |
Liabilities: |
Unrealized depreciation on OTC swap agreements | | | 312,760 | |
Payable for: |
Fund shares redeemed | | | 3,700,105 | |
Swap settlement | | | 179,121 | |
Management fees | | | 7,335 | |
Transfer agent and administrative fees | | | 2,392 | |
Distribution and service fees | | | 2,242 | |
Portfolio accounting fees | | | 1,223 | |
Trustees’ fees* | | | 215 | |
Miscellaneous | | | 7,348 | |
Total liabilities | | | 4,212,741 | |
Commitments and contingent liabilities (Note 11) | | | — | |
Net assets | | $ | 9,587,854 | |
| | | | | |
Net assets consist of: |
Paid in capital | | $ | 48,656,309 | |
Total distributable earnings (loss) | | | (39,068,455 | ) |
Net assets | | $ | 9,587,854 | |
| | | | | |
A-Class: |
Net assets | | $ | 1,952,459 | |
Capital shares outstanding | | | 196,960 | |
Net asset value per share | | $ | 9.91 | |
Maximum offering price per share (Net asset value divided by 95.25%) | | $ | 10.40 | |
| | | | | |
C-Class: |
Net assets | | $ | 389,419 | |
Capital shares outstanding | | | 44,679 | |
Net asset value per share | | $ | 8.72 | |
| | | | | |
H-Class: |
Net assets | | $ | 7,245,976 | |
Capital shares outstanding | | | 728,843 | |
Net asset value per share | | $ | 9.94 | |
STATEMENT OF OPERATIONS
Year Ended March 31, 2020
Investment Income: |
Interest | | $ | 123,810 | |
Total investment income | | | 123,810 | |
| | | | | |
Expenses: |
Management fees | | | 57,510 | |
Distribution and service fees: |
A-Class | | | 2,795 | |
C-Class | | | 2,303 | |
H-Class | | | 12,610 | |
Transfer agent and administrative fees | | | 16,332 | |
Portfolio accounting fees | | | 9,587 | |
Registration fees | | | 8,719 | |
Professional fees | | | 4,666 | |
Trustees’ fees* | | | 1,694 | |
Custodian fees | | | 954 | |
Miscellaneous | | | 4,018 | |
Total expenses | | | 121,188 | |
Net investment income | | | 2,622 | |
| | | | | |
Net Realized and Unrealized Gain (Loss): |
Net realized gain (loss) on: |
Investments | | | 3,217 | |
Swap agreements | | | 1,344,043 | |
Futures contracts | | | (262,461 | ) |
Net realized gain | | | 1,084,799 | |
Net change in unrealized appreciation (depreciation) on: |
Investments | | | 24 | |
Swap agreements | | | (70,928 | ) |
Futures contracts | | | (37,512 | ) |
Net change in unrealized appreciation (depreciation) | | | (108,416 | ) |
Net realized and unrealized gain | | | 976,383 | |
Net increase in net assets resulting from operations | | $ | 979,005 | |
* | Relates to Trustees not deemed “interested persons” within the meaning of Section 2(a)(19) of the 1940 Act. |
60 | THE RYDEX FUNDS ANNUAL REPORT | SEE NOTES TO FINANCIAL STATEMENTS. |
INVERSE DOW 2x STRATEGY FUND | |
STATEMENTS OF CHANGES IN NET ASSETS |
| | Year Ended
March 31,
2020 | | | Year Ended
March 31,
2019 | |
Increase (Decrease) in Net Assets from Operations: | | | | | | | | |
Net investment income | | $ | 2,622 | | | $ | 12,506 | |
Net realized gain (loss) on investments | | | 1,084,799 | | | | (2,362,586 | ) |
Net change in unrealized appreciation (depreciation) on investments | | | (108,416 | ) | | | (17,457 | ) |
Net increase (decrease) in net assets resulting from operations | | | 979,005 | | | | (2,367,537 | ) |
| | | | | | | | | |
Distributions to shareholders: | | | | | | | | |
A-Class | | | (2,076 | ) | | | — | |
C-Class | | | (520 | ) | | | — | |
H-Class | | | (9,291 | ) | | | — | |
Total distributions to shareholders | | | (11,887 | ) | | | — | |
| | | | | | | | | |
Capital share transactions: | | | | | | | | |
Proceeds from sale of shares | | | | | | | | |
A-Class | | | 4,547,186 | | | | 3,588,036 | |
C-Class | | | 3,355,746 | | | | 4,339,177 | |
H-Class | | | 137,332,064 | | | | 251,119,640 | |
Distributions reinvested | | | | | | | | |
A-Class | | | 1,245 | | | | — | |
C-Class | | | 175 | | | | — | |
H-Class | | | 9,078 | | | | — | |
Cost of shares redeemed | | | | | | | | |
A-Class | | | (3,440,791 | ) | | | (3,107,775 | ) |
C-Class | | | (3,181,875 | ) | | | (5,016,290 | ) |
H-Class | | | (135,357,138 | ) | | | (250,758,074 | ) |
Net increase from capital share transactions | | | 3,265,690 | | | | 164,714 | |
Net increase (decrease) in net assets | | | 4,232,808 | | | | (2,202,823 | ) |
| | | | | | | | | |
Net assets: | | | | | | | | |
Beginning of year | | | 5,355,046 | | | | 7,557,869 | |
End of year | | $ | 9,587,854 | | | $ | 5,355,046 | |
| | | | | | | | | |
Capital share activity: | | | | | | | | |
Shares sold | | | | | | | | |
A-Class | | | 460,468 | | | | 334,342 | |
C-Class | | | 431,616 | | | | 449,270 | |
H-Class | | | 14,963,589 | | | | 22,931,618 | |
Shares issued from reinvestment of distributions | | | | | | | | |
A-Class | | | 158 | | | | — | |
C-Class | | | 25 | | | | — | |
H-Class | | | 1,148 | | | | — | |
Shares redeemed | | | | | | | | |
A-Class | | | (362,996 | ) | | | (282,300 | ) |
C-Class | | | (411,560 | ) | | | (519,629 | ) |
H-Class | | | (14,665,371 | ) | | | (22,991,918 | ) |
Net increase (decrease) in shares | | | 417,077 | | | | (78,617 | ) |
SEE NOTES TO FINANCIAL STATEMENTS. | THE RYDEX FUNDS ANNUAL REPORT | 61 |
INVERSE DOW 2x STRATEGY FUND | |
This table is presented to show selected data for a share outstanding throughout each period and to assist shareholders in evaluating a Fund’s performance for the periods presented.
A-Class | | Year Ended
March 31,
2020 | | | Year Ended
March 31,
2019 | | | Year Ended
March 29,
2018 | | | Year Ended
March 31,
2017 | | | Year Ended
March 31,
2016 | |
Per Share Data |
Net asset value, beginning of period | | $ | 9.71 | | | $ | 12.12 | | | $ | 17.71 | | | $ | 26.34 | | | $ | 30.36 | |
Income (loss) from investment operations: |
Net investment income (loss)a | | | .01 | | | | .03 | | | | (.11 | ) | | | (.33 | ) | | | (.51 | ) |
Net gain (loss) on investments (realized and unrealized) | | | .21 | | | | (2.44 | ) | | | (5.48 | ) | | | (8.30 | ) | | | (3.51 | ) |
Total from investment operations | | | .22 | | | | (2.41 | ) | | | (5.59 | ) | | | (8.63 | ) | | | (4.02 | ) |
Less distributions from: |
Net investment income | | | (.02 | ) | | | — | | | | — | | | | — | | | | — | |
Total distributions | | | (.02 | ) | | | — | | | | — | | | | — | | | | — | |
Net asset value, end of period | | $ | 9.91 | | | $ | 9.71 | | | $ | 12.12 | | | $ | 17.71 | | | $ | 26.34 | |
|
Total Returnb | | | 2.27 | % | | | (19.88 | %) | | | (31.56 | %) | | | (32.76 | %) | | | (13.24 | %) |
Ratios/Supplemental Data |
Net assets, end of period (in thousands) | | $ | 1,952 | | | $ | 964 | | | $ | 573 | | | $ | 1,110 | | | $ | 2,240 | |
Ratios to average net assets: |
Net investment income (loss) | | | 0.12 | % | | | 0.25 | % | | | (0.78 | %) | | | (1.47 | %) | | | (1.72 | %) |
Total expenses | | | 1.86 | % | | | 1.88 | % | | | 1.80 | % | | | 1.85 | % | | | 1.82 | % |
Portfolio turnover rate | | | — | | | | — | | | | — | | | | — | | | | — | |
C-Class | | Year Ended
March 31,
2020 | | | Year Ended
March 31,
2019 | | | Year Ended
March 29,
2018 | | | Year Ended
March 31,
2017 | | | Year Ended
March 31,
2016 | |
Per Share Data |
Net asset value, beginning of period | | $ | 8.60 | | | $ | 10.83 | | | $ | 15.97 | | | $ | 23.90 | | | $ | 27.74 | |
Income (loss) from investment operations: |
Net investment income (loss)a | | | (.05 | ) | | | (.06 | ) | | | (.16 | ) | | | (.45 | ) | | | (.68 | ) |
Net gain (loss) on investments (realized and unrealized) | | | .19 | | | | (2.17 | ) | | | (4.98 | ) | | | (7.48 | ) | | | (3.16 | ) |
Total from investment operations | | | .14 | | | | (2.23 | ) | | | (5.14 | ) | | | (7.93 | ) | | | (3.84 | ) |
Less distributions from: |
Net investment income | | | (.02 | ) | | | — | | | | — | | | | — | | | | — | |
Total distributions | | | (.02 | ) | | | — | | | | — | | | | — | | | | — | |
Net asset value, end of period | | $ | 8.72 | | | $ | 8.60 | | | $ | 10.83 | | | $ | 15.97 | | | $ | 23.90 | |
|
Total Returnb | | | 1.63 | % | | | (20.59 | %) | | | (32.19 | %) | | | (33.22 | %) | | | (13.84 | %) |
Ratios/Supplemental Data |
Net assets, end of period (in thousands) | | $ | 389 | | | $ | 212 | | | $ | 1,028 | | | $ | 393 | | | $ | 766 | |
Ratios to average net assets: |
Net investment income (loss) | | | (0.66 | %) | | | (0.59 | %) | | | (1.39 | %) | | | (2.22 | %) | | | (2.46 | %) |
Total expenses | | | 2.62 | % | | | 2.56 | % | | | 2.55 | % | | | 2.62 | % | | | 2.53 | % |
Portfolio turnover rate | | | — | | | | — | | | | — | | | | — | | | | — | |
62 | THE RYDEX FUNDS ANNUAL REPORT | SEE NOTES TO FINANCIAL STATEMENTS. |
INVERSE DOW 2x STRATEGY FUND | |
FINANCIAL HIGHLIGHTS (concluded) |
This table is presented to show selected data for a share outstanding throughout each period and to assist shareholders in evaluating a Fund’s performance for the periods presented.
H-Class | | Year Ended
March 31,
2020 | | | Year Ended
March 31,
2019 | | | Year Ended
March 29,
2018 | | | Year Ended
March 31,
2017 | | | Year Ended
March 31,
2016 | |
Per Share Data |
Net asset value, beginning of period | | $ | 9.73 | | | $ | 12.16 | | | $ | 17.77 | | | $ | 26.41 | | | $ | 30.44 | |
Income (loss) from investment operations: |
Net investment income (loss)a | | | — | c | | | .02 | | | | (.10 | ) | | | (.33 | ) | | | (.51 | ) |
Net gain (loss) on investments (realized and unrealized) | | | .23 | | | | (2.45 | ) | | | (5.51 | ) | | | (8.31 | ) | | | (3.52 | ) |
Total from investment operations | | | .23 | | | | (2.43 | ) | | | (5.61 | ) | | | (8.64 | ) | | | (4.03 | ) |
Less distributions from: |
Net investment income | | | (.02 | ) | | | — | | | | — | | | | — | | | | — | |
Total distributions | | | (.02 | ) | | | — | | | | — | | | | — | | | | — | |
Net asset value, end of period | | $ | 9.94 | | | $ | 9.73 | | | $ | 12.16 | | | $ | 17.77 | | | $ | 26.41 | |
|
Total Return | | | 2.37 | % | | | (19.98 | %) | | | (31.57 | %) | | | (32.71 | %) | | | (13.24 | %) |
Ratios/Supplemental Data |
Net assets, end of period (in thousands) | | $ | 7,246 | | | $ | 4,179 | | | $ | 5,957 | | | $ | 8,442 | | | $ | 8,690 | |
Ratios to average net assets: |
Net investment income (loss) | | | 0.06 | % | | | 0.20 | % | | | (0.74 | %) | | | (1.46 | %) | | | (1.72 | %) |
Total expenses | | | 1.87 | % | | | 1.89 | % | | | 1.80 | % | | | 1.85 | % | | | 1.82 | % |
Portfolio turnover rate | | | — | | | | — | | | | — | | | | — | | | | — | |
a | Net investment income (loss) per share was computed using average shares outstanding throughout the period. |
b | Total return does not reflect the impact of any applicable sales charges. |
c | Net investment income is less than $0.01 per share. |
SEE NOTES TO FINANCIAL STATEMENTS. | THE RYDEX FUNDS ANNUAL REPORT | 63 |
PERFORMANCE REPORT AND FUND PROFILE (Unaudited) | March 31, 2020 |
RUSSELL 2000® 2x STRATEGY FUND
OBJECTIVE: Seeks to provide investment results that match, before fees and expenses, the performance of a specific benchmark on a daily basis. The Fund’s current benchmark is 200% of the performance of the Russell 2000® Index (the “underlying index”). The Fund does not seek to achieve its investment objective over a period of time greater than one day.
For the one-year period ended March 31, 2020, Russell 2000® 2x Strategy Fund maintained a daily correlation of over 99% to its benchmark of 200% of the daily price movement of the Russell 2000 Index. Russell 2000® 2x Strategy Fund H-Class returned -51.05%, while the Russell 2000 Index returned -23.99% over the same time period.
No sector contributed to the return of the underlying index for the period. The sectors detracting the most were Financials, Consumer Discretionary, and Industrials.
The holdings in the Fund contributing the most to return of the underlying index were Teladoc Health, Inc., Array BioPharma, Inc., and Medicines Co. The holdings detracting the most were Green Dot Corp. - Class A, Investor Mortgage Capital, Inc., and Blackstone Mortgage Trust, Inc. - Class A.
Derivatives in the Fund were used to help provide exposure to the composition of the benchmark in the highest efficient manner and to provide leverage and not for hedging purposes. Derivatives performed as expected.
Due to the compounding of daily returns, leveraged and inverse funds’ returns over periods other than one day will likely differ in amount and possibly direction from the benchmark return for the same period. Investors should monitor their leveraged and inverse funds’ holdings to ensure that they are consistent with their strategies, as frequently as daily.
The effects of compounding may cause the longer-term correlation of the Fund to its benchmark to diminish. The apparent discrepancy between the leveraged and unleveraged indices is the result of compounding, which is described briefly on page 6 of this report.
Performance displayed represents past performance, which is no guarantee of future results.
Holdings Diversification (Market Exposure as % of Net Assets)
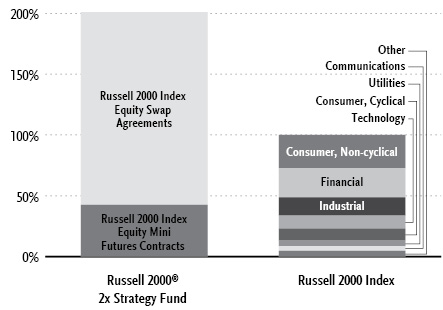
“Holdings Diversification (Market Exposure as % of Net Assets)” excludes any temporary cash investments.
Inception Dates: |
A-Class | May 31, 2006 |
C-Class | May 31, 2006 |
H-Class | May 31, 2006 |
The Fund invests principally in derivative investments such as swap agreements and futures contracts.
64 | THE RYDEX FUNDS ANNUAL REPORT | |
PERFORMANCE REPORT AND FUND PROFILE (Unaudited)(concluded) | March 31, 2020 |
Cumulative Fund Performance*


Average Annual Returns*
Periods Ended March 31, 2020
| 1 Year | 5 Year | 10 Year |
A-Class Shares | (50.97%) | (8.19%) | 5.87% |
A-Class Shares with sales charge† | (53.30%) | (9.08%) | 5.35% |
C-Class Shares | (51.33%) | (8.87%) | 5.11% |
C-Class Shares with CDSC‡ | (51.82%) | (8.87%) | 5.11% |
H-Class Shares | (51.05%) | (8.27%) | 5.80% |
Russell 2000 Index | (23.99%) | 1.55% | 8.55% |
* | The performance data above represents past performance that is not predictive of future results. The investment return and principal value of an investment in the Fund will fluctuate so that an investor’s shares, when redeemed, may be worth more or less than their original cost. Returns are historical and include changes in principal and reinvested dividends and capital gains and do not reflect the effect of taxes. The Russell 2000 Index is an unmanaged index and, unlike the Fund, has no management fees or operating expenses to reduce its reported return. The graphs are based on A-Class shares and H-Class shares only; performance for C-Class shares will vary due to differences in fee structures. |
† | Fund returns are calculated using the maximum sales charge of 4.75%. |
‡ | Fund returns include a CDSC of 1% if redeemed within 12 months of purchase. |
| | THE RYDEX FUNDS ANNUAL REPORT | 65 |
SCHEDULE OF INVESTMENTS | March 31, 2020 |
RUSSELL 2000® 2x STRATEGY FUND | |
| | Shares | | | Value | |
RIGHTS†††,1 - 0.0% |
Consumer, Non-cyclical – 0.0% |
Elanco Animal Health, Inc.* | | | 232 | | | $ | — | |
Omthera Pharmaceuticals, Inc.* | | | 110 | | | | — | |
Tobira Therapeutics, Inc.* | | | 80 | | | | — | |
Oncternal Therapeutics, Inc.* | | | 2 | | | | — | |
Total Consumer, Non-cyclical | | | | | | | — | |
Communications – 0.0% | | | | | | | | |
Nexstar Media Group, Inc.* | | | 852 | | | | — | |
Basic Materials – 0.0% | | | | | | | | |
A Schulman, Inc.* | | | 179 | | | | — | |
Total Rights | | | | |
(Cost $4) | | | | | | | — | |
| | | | | | | | | |
| | | Face
Amount | | | | | |
FEDERAL AGENCY NOTES†† - 41.5% |
Federal Farm Credit Bank |
0.40% (U.S. Prime Rate - 2.85%, Rate Floor: 0.00%) due 08/30/222 | | $ | 2,000,000 | | | | 2,006,838 | |
0.45% (U.S. Prime Rate - 2.80%, Rate Floor: 0.00%) due 03/14/222 | | | 2,000,000 | | | | 2,004,409 | |
Freddie Mac |
0.14% (U.S. Secured Overnight Financing Rate + 0.13%, Rate Floor: 0.00%) due 08/05/222 | | | 2,000,000 | | | | 1,987,230 | |
Total Federal Agency Notes | | | | |
(Cost $5,999,995) | | | | | | | 5,998,477 | |
| U.S. TREASURY BILLS†† - 2.5% |
| U.S. Treasury Bills |
0.50% due 04/30/203,4 | | | 372,000 | | | | 371,983 | |
| Total U.S. Treasury Bills | | | | | | | | |
| (Cost $371,848) | | | | | | | 371,983 | |
| | | | | | | | | |
| REPURCHASE AGREEMENTS††,5 - 28.0% |
J.P. Morgan Securities LLC
issued 03/31/20 at 0.01%
due 04/01/206 | | | 2,921,017 | | | | 2,921,017 | |
BofA Securities, Inc.
issued 03/31/20 at 0.00%
due 04/01/206 | | | 1,123,468 | | | | 1,123,468 | |
| Total Repurchase Agreements | | | | | | | | |
| (Cost $4,044,485) | | | | | | | 4,044,485 | |
| | | | | | | | | |
| Total Investments - 72.0% | | | | | | | | |
| (Cost $10,416,332) | | | | | | $ | 10,414,945 | |
| Other Assets & Liabilities, net - 28.0% | | | | | | | 4,047,531 | |
| Total Net Assets - 100.0% | | | | | | $ | 14,462,476 | |
Futures Contracts |
Description | | Number of
Contracts | | | Expiration Date | | | Notional
Amount | | | Value and
Unrealized
Appreciation** | |
Equity Futures Contracts Purchased† |
Russell 2000 Index Mini Futures Contracts | | | 107 | | | | Jun 2020 | | | $ | 6,148,220 | | | $ | 144,098 | |
Total Return Swap Agreements |
Counterparty | Index | Financing
Rate Pay | Payment
Frequency | | Maturity Date | | | Units | | | Notional
Amount | | | Value and
Unrealized
Appreciation
(Depreciation) | |
OTC Equity Index Swap Agreements†† |
Barclays Bank plc | Russell 2000 Index | 0.59% (1 Week USD LIBOR) | At Maturity | | | 04/30/20 | | | | 11,754 | | | $ | 13,553,296 | | | $ | 330,129 | |
BNP Paribas | Russell 2000 Index | 1.09% (1 Month USD LIBOR + 0.10%) | At Maturity | | | 04/29/20 | | | | 713 | | | | 821,668 | | | | (19,393 | ) |
Goldman Sachs International | Russell 2000 Index | 0.84% (1 Week USD LIBOR + 0.25%) | At Maturity | | | 04/28/20 | | | | 7,411 | | | | 8,545,267 | | | | (48,270 | ) |
| | | | | | | | | | | | | | $ | 22,920,231 | | | $ | 262,466 | |
66 | THE RYDEX FUNDS ANNUAL REPORT | SEE NOTES TO FINANCIAL STATEMENTS. |
SCHEDULE OF INVESTMENTS (concluded) | March 31, 2020 |
RUSSELL 2000® 2x STRATEGY FUND | |
* | Non-income producing security. |
** | Includes cumulative appreciation (depreciation). Variation margin is reported within the Statement of Assets and Liabilities. |
† | Value determined based on Level 1 inputs — See Note 4. |
†† | Value determined based on Level 2 inputs — See Note 4. |
††† | Value determined based on Level 3 inputs — See Note 4. |
1 | Security was fair valued by the Valuation Committee at March 31, 2020. The total market value of fair valued securities amounts to $0, (cost $4) or 0.0% of total net assets. |
2 | Variable rate security. Rate indicated is the rate effective at March 31, 2020. In some instances, the effective rate is limited by a minimum rate floor or a maximum rate cap established by the issuer. The settlement status of a position may also impact the effective rate indicated. In some cases, a position may be unsettled at period end and may not have a stated effective rate. In instances where multiple underlying reference rates and spread amounts are shown, the effective rate is based on a weighted average. |
3 | All or a portion of this security is pledged as futures collateral at March 31, 2020. |
4 | Rate indicated is the effective yield at the time of purchase. |
5 | Repurchase Agreements — See Note 6. |
6 | All or a portion of this security is pledged as equity index swap collateral at March 31, 2020. |
| | LIBOR — London Interbank Offered Rate |
| | plc — Public Limited Company |
| | |
| | See Sector Classification in Other Information section. |
The following table summarizes the inputs used to value the Fund’s investments at March 31, 2020 (See Note 4 in the Notes to Financial Statements):
Investments in Securities (Assets) | | Level 1
Quoted
Prices | | | Level 2
Significant
Observable
Inputs | | | Level 3
Significant
Unobservable
Inputs | | | Total | |
Rights | | $ | — | | | $ | — | | | $ | — | * | | $ | — | |
Federal Agency Notes | | | — | | | | 5,998,477 | | | | — | | | | 5,998,477 | |
U.S. Treasury Bills | | | — | | | | 371,983 | | | | — | | | | 371,983 | |
Repurchase Agreements | | | — | | | | 4,044,485 | | | | — | | | | 4,044,485 | |
Equity Futures Contracts** | | | 144,098 | | | | — | | | | — | | | | 144,098 | |
Equity Index Swap Agreements** | | | — | | | | 330,129 | | | | — | | | | 330,129 | |
Total Assets | | $ | 144,098 | | | $ | 10,745,074 | | | $ | — | | | $ | 10,889,172 | |
Investments in Securities (Liabilities) | | Level 1
Quoted
Prices | | | Level 2
Significant
Observable
Inputs | | | Level 3
Significant
Unobservable
Inputs | | | Total | |
Equity Index Swap Agreements** | | $ | — | | | $ | 67,663 | | | $ | — | | | $ | 67,663 | |
* | Includes securities with a market value of $0. |
** | This derivative is reported as unrealized appreciation/depreciation at period end. |
SEE NOTES TO FINANCIAL STATEMENTS. | THE RYDEX FUNDS ANNUAL REPORT | 67 |
RUSSELL 2000® 2x STRATEGY FUND | |
STATEMENT OF ASSETS AND LIABILITIES
March 31, 2020
Assets: |
Investments, at value (cost $6,371,847) | | $ | 6,370,460 | |
Repurchase agreements, at value (cost $4,044,485) | | | 4,044,485 | |
Cash | | | 1,891,778 | |
Segregated cash with broker | | | 1,287,285 | |
Unrealized appreciation on OTC swap agreements | | | 330,129 | |
Receivables: |
Fund shares sold | | | 3,860,870 | |
Interest | | | 6,189 | |
Total assets | | | 17,791,196 | |
| | | | | |
Liabilities: |
Unrealized depreciation on OTC swap agreements | | | 67,663 | |
Payable for: |
Fund shares redeemed | | | 2,808,344 | |
Swap settlement | | | 406,417 | |
Management fees | | | 11,566 | |
Variation margin on futures contracts | | | 8,402 | |
Transfer agent and administrative fees | | | 4,621 | |
Distribution and service fees | | | 3,344 | |
Portfolio accounting fees | | | 1,928 | |
Trustees’ fees* | | | 380 | |
Miscellaneous | | | 16,055 | |
Total liabilities | | | 3,328,720 | |
Commitments and contingent liabilities (Note 11) | | | — | |
Net assets | | $ | 14,462,476 | |
| | | | | |
Net assets consist of: |
Paid in capital | | $ | 23,833,250 | |
Total distributable earnings (loss) | | | (9,370,774 | ) |
Net assets | | $ | 14,462,476 | |
| | | | | |
A-Class: |
Net assets | | $ | 1,559,162 | |
Capital shares outstanding | | | 23,054 | |
Net asset value per share | | $ | 67.63 | |
Maximum offering price per share (Net asset value divided by 95.25%) | | $ | 71.00 | |
| | | | | |
C-Class: |
Net assets | | $ | 171,086 | |
Capital shares outstanding | | | 2,838 | |
Net asset value per share | | $ | 60.28 | |
| | | | | |
H-Class: |
Net assets | | $ | 12,732,228 | |
Capital shares outstanding | | | 189,440 | |
Net asset value per share | | $ | 67.21 | |
STATEMENT OF OPERATIONS
Year Ended March 31, 2020
Investment Income: |
Dividends (net of foreign withholding tax of $7) | | $ | 37,264 | |
Interest | | | 532,295 | |
Income from securities lending, net | | | 968 | |
Total investment income | | | 570,527 | |
| | | | | |
Expenses: |
Management fees | | | 276,541 | |
Distribution and service fees: |
A-Class | | | 7,851 | |
C-Class | | | 4,003 | |
H-Class | | | 67,970 | |
Transfer agent and administrative fees | | | 78,227 | |
Portfolio accounting fees | | | 46,093 | |
Registration fees | | | 39,190 | |
Professional fees | | | 17,465 | |
Trustees’ fees* | | | 6,764 | |
Custodian fees | | | 4,375 | |
Line of credit fees | | | 659 | |
Prime broker interest expense | | | 58 | |
Miscellaneous | | | 34,355 | |
Total expenses | | | 583,551 | |
Net investment loss | | | (13,024 | ) |
| | | | | |
Net Realized and Unrealized Gain (Loss): |
Net realized gain (loss) on: |
Investments | | | 46,009 | |
Swap agreements | | | (5,793,195 | ) |
Futures contracts | | | (3,247,188 | ) |
Net realized loss | | | (8,994,374 | ) |
Net change in unrealized appreciation (depreciation) on: |
Investments | | | (440,564 | ) |
Swap agreements | | | (71,588 | ) |
Futures contracts | | | 117,199 | |
Net change in unrealized appreciation (depreciation) | | | (394,953 | ) |
Net realized and unrealized loss | | | (9,389,327 | ) |
Net decrease in net assets resulting from operations | | $ | (9,402,351 | ) |
* | Relates to Trustees not deemed “interested persons” within the meaning of Section 2(a)(19) of the 1940 Act. |
68 | THE RYDEX FUNDS ANNUAL REPORT | SEE NOTES TO FINANCIAL STATEMENTS. |
RUSSELL 2000® 2x STRATEGY FUND | |
STATEMENTS OF CHANGES IN NET ASSETS |
| | Year Ended
March 31,
2020 | | | Year Ended
March 31,
2019 | |
Increase (Decrease) in Net Assets from Operations: | | | | | | | | |
Net investment loss | | $ | (13,024 | ) | | $ | (19,661 | ) |
Net realized gain (loss) on investments | | | (8,994,374 | ) | | | 948,288 | |
Net change in unrealized appreciation (depreciation) on investments | | | (394,953 | ) | | | 27,292 | |
Net increase (decrease) in net assets resulting from operations | | | (9,402,351 | ) | | | 955,919 | |
| | | | | | | | | |
Distributions to shareholders: | | | | | | | | |
A-Class | | | (8,881 | ) | | | — | |
C-Class | | | (1,441 | ) | | | — | |
H-Class | | | (123,889 | ) | | | — | |
Total distributions to shareholders | | | (134,211 | ) | | | — | |
| | | | | | | | | |
Capital share transactions: | | | | | | | | |
Proceeds from sale of shares | | | | | | | | |
A-Class | | | 4,797,024 | | | | 5,826,555 | |
C-Class | | | 3,250,949 | | | | 3,205,730 | |
H-Class | | | 1,182,450,539 | | | | 1,469,808,111 | |
Distributions reinvested | | | | | | | | |
A-Class | | | 8,558 | | | | — | |
C-Class | | | 1,338 | | | | — | |
H-Class | | | 122,887 | | | | — | |
Cost of shares redeemed | | | | | | | | |
A-Class | | | (5,296,856 | ) | | | (6,206,303 | ) |
C-Class | | | (3,361,608 | ) | | | (3,428,845 | ) |
H-Class | | | (1,187,113,903 | ) | | | (1,478,603,869 | ) |
Net decrease from capital share transactions | | | (5,141,072 | ) | | | (9,398,621 | ) |
Net decrease in net assets | | | (14,677,634 | ) | | | (8,442,702 | ) |
| | | | | | | | | |
Net assets: | | | | | | | | |
Beginning of year | | | 29,140,110 | | | | 37,582,812 | |
End of year | | $ | 14,462,476 | | | $ | 29,140,110 | |
| | | | | | | | | |
Capital share activity: | | | | | | | | |
Shares sold | | | | | | | | |
A-Class | | | 39,323 | | | | 41,985 | |
C-Class | | | 25,815 | | | | 24,729 | |
H-Class | | | 8,837,934 | | | | 9,836,233 | |
Shares issued from reinvestment of distributions | | | | | | | | |
A-Class | | | 55 | | | | — | |
C-Class | | | 10 | | | | — | |
H-Class | | | 796 | | | | — | |
Shares redeemed | | | | | | | | |
A-Class | | | (40,741 | ) | | | (44,494 | ) |
C-Class | | | (26,746 | ) | | | (26,240 | ) |
H-Class | | | (8,833,003 | ) | | | (9,883,835 | ) |
Net increase (decrease) in shares | | | 3,443 | | | | (51,622 | ) |
SEE NOTES TO FINANCIAL STATEMENTS. | THE RYDEX FUNDS ANNUAL REPORT | 69 |
RUSSELL 2000® 2x STRATEGY FUND | |
This table is presented to show selected data for a share outstanding throughout each period and to assist shareholders in evaluating a Fund’s performance for the periods presented.
A-Class | | Year Ended
March 31,
2020 | | | Year Ended
March 31,
2019 | | | Year Ended
March 29,
2018 | | | Year Ended
March 31,
2017c | | | Year Ended
March 31,
2016c | |
Per Share Data |
Net asset value, beginning of period | | $ | 138.32 | | | $ | 143.22 | | | $ | 123.80 | | | $ | 82.01 | | | $ | 116.47 | |
Income (loss) from investment operations: |
Net investment income (loss)a | | | .08 | | | | .04 | | | | (.80 | ) | | | (1.18 | ) | | | (.99 | ) |
Net gain (loss) on investments (realized and unrealized) | | | (70.34 | ) | | | (4.94 | )d | | | 23.97 | | | | 42.97 | | | | (25.20 | ) |
Total from investment operations | | | (70.26 | ) | | | (4.90 | ) | | | 23.17 | | | | 41.79 | | | | (26.19 | ) |
Less distributions from: |
Net realized gains | | | (.43 | ) | | | — | | | | (3.75 | ) | | | — | | | | (8.27 | ) |
Total distributions | | | (.43 | ) | | | — | | | | (3.75 | ) | | | — | | | | (8.27 | ) |
Net asset value, end of period | | $ | 67.63 | | | $ | 138.32 | | | $ | 143.22 | | | $ | 123.80 | | | $ | 82.01 | |
|
Total Returnb | | | (50.97 | %) | | | (3.42 | %) | | | 18.66 | % | | | 50.95 | % | | | (23.11 | %) |
Ratios/Supplemental Data |
Net assets, end of period (in thousands) | | $ | 1,559 | | | $ | 3,377 | | | $ | 3,856 | | | $ | 3,325 | | | $ | 3,125 | |
Ratios to average net assets: |
Net investment income (loss) | | | 0.06 | % | | | 0.03 | % | | | (0.59 | %) | | | (1.14 | %) | | | (1.00 | %) |
Total expenses | | | 1.87 | % | | | 1.85 | % | | | 1.78 | % | | | 1.82 | % | | | 1.78 | % |
Portfolio turnover rate | | | 360 | % | | | 507 | % | | | 526 | % | | | 810 | % | | | 296 | % |
C-Class | | Year Ended
March 31,
2020 | | | Year Ended
March 31,
2019 | | | Year Ended
March 29,
2018 | | | Year Ended
March 31,
2017c | | | Year Ended
March 31,
2016c | |
Per Share Data |
Net asset value, beginning of period | | $ | 124.27 | | | $ | 129.63 | | | $ | 113.17 | | | $ | 75.52 | | | $ | 108.82 | |
Income (loss) from investment operations: |
Net investment income (loss)a | | | (.87 | ) | | | (1.01 | ) | | | (1.71 | ) | | | (1.70 | ) | | | (1.62 | ) |
Net gain (loss) on investments (realized and unrealized) | | | (62.69 | ) | | | (4.35 | )d | | | 21.92 | | | | 39.35 | | | | (23.41 | ) |
Total from investment operations | | | (63.56 | ) | | | (5.36 | ) | | | 20.21 | | | | 37.65 | | | | (25.03 | ) |
Less distributions from: |
Net realized gains | | | (.43 | ) | | | — | | | | (3.75 | ) | | | — | | | | (8.27 | ) |
Total distributions | | | (.43 | ) | | | — | | | | (3.75 | ) | | | — | | | | (8.27 | ) |
Net asset value, end of period | | $ | 60.28 | | | $ | 124.27 | | | $ | 129.63 | | | $ | 113.17 | | | $ | 75.52 | |
|
Total Returnb | | | (51.33 | %) | | | (4.13 | %) | | | 17.78 | % | | | 49.83 | % | | | (23.68 | %) |
Ratios/Supplemental Data |
Net assets, end of period (in thousands) | | $ | 171 | | | $ | 467 | | | $ | 683 | | | $ | 835 | | | $ | 987 | |
Ratios to average net assets: |
Net investment income (loss) | | | (0.70 | %) | | | (0.74 | %) | | | (1.37 | %) | | | (1.85 | %) | | | (1.74 | %) |
Total expenses | | | 2.62 | % | | | 2.59 | % | | | 2.52 | % | | | 2.58 | % | | | 2.52 | % |
Portfolio turnover rate | | | 360 | % | | | 507 | % | | | 526 | % | | | 810 | % | | | 296 | % |
70 | THE RYDEX FUNDS ANNUAL REPORT | SEE NOTES TO FINANCIAL STATEMENTS. |
RUSSELL 2000® 2x STRATEGY FUND | |
FINANCIAL HIGHLIGHTS (concluded) |
This table is presented to show selected data for a share outstanding throughout each period and to assist shareholders in evaluating a Fund’s performance for the periods presented.
H-Class | | Year Ended
March 31,
2020 | | | Year Ended
March 31,
2019 | | | Year Ended
March 29,
2018 | | | Year Ended
March 31,
2017c | | | Year Ended
March 31,
2016c | |
Per Share Data |
Net asset value, beginning of period | | $ | 137.69 | | | $ | 142.85 | | | $ | 123.54 | | | $ | 81.88 | | | $ | 116.28 | |
Income (loss) from investment operations: |
Net investment income (loss)a | | | (.06 | ) | | | (.08 | ) | | | (.83 | ) | | | (1.05 | ) | | | (1.10 | ) |
Net gain (loss) on investments (realized and unrealized) | | | (69.99 | ) | | | (5.08 | )d | | | 23.89 | | | | 42.71 | | | | (25.03 | ) |
Total from investment operations | | | (70.05 | ) | | | (5.16 | ) | | | 23.06 | | | | 41.66 | | | | (26.13 | ) |
Less distributions from: |
Net realized gains | | | (.43 | ) | | | — | | | | (3.75 | ) | | | — | | | | (8.27 | ) |
Total distributions | | | (.43 | ) | | | — | | | | (3.75 | ) | | | — | | | | (8.27 | ) |
Net asset value, end of period | | $ | 67.21 | | | $ | 137.69 | | | $ | 142.85 | | | $ | 123.54 | | | $ | 81.88 | |
|
Total Return | | | (51.05 | %) | | | (3.61 | %) | | | 18.59 | % | | | 50.87 | % | | | (23.10 | %) |
Ratios/Supplemental Data |
Net assets, end of period (in thousands) | | $ | 12,732 | | | $ | 25,296 | | | $ | 33,043 | | | $ | 34,001 | | | $ | 16,793 | |
Ratios to average net assets: |
Net investment income (loss) | | | (0.04 | %) | | | (0.05 | %) | | | (0.66 | %) | | | (1.09 | %) | | | (1.12 | %) |
Total expenses | | | 1.89 | % | | | 1.88 | % | | | 1.81 | % | | | 1.85 | % | | | 1.81 | % |
Portfolio turnover rate | | | 360 | % | | | 507 | % | | | 526 | % | | | 810 | % | | | 296 | % |
a | Net investment income (loss) per share was computed using average shares outstanding throughout the period. |
b | Total return does not reflect the impact of any applicable sales charges. |
c | Share split — Per share amounts for the periods presented through March 31, 2017 have been restated to reflect a 3:1 share split effective October 31, 2016. |
d | The amount shown for a share outstanding throughout the period does not accord with the aggregate net gains on investments for the year because of the sales and repurchases of fund shares in relation to fluctuating market value of the investments of the Fund. |
SEE NOTES TO FINANCIAL STATEMENTS. | THE RYDEX FUNDS ANNUAL REPORT | 71 |
PERFORMANCE REPORT AND FUND PROFILE (Unaudited) | March 31, 2020 |
INVERSE RUSSELL 2000® 2x STRATEGY FUND
OBJECTIVE: Seeks to provide investment results that match, before fees and expenses, the performance of a specific benchmark on a daily basis. The Fund’s current benchmark is 200% of the inverse (opposite) of the performance of the Russell 2000® Index (the “underlying index”). The Fund does not seek to achieve its investment objective over a period of time greater than one day.
For the one-year period ended March 31, 2020, Inverse Russell 2000® 2x Strategy Fund maintained a daily correlation of over 99% to its benchmark of -200% of the daily price movement of the Russell 2000 Index. Inverse Russell 2000® 2x Strategy Fund H-Class returned 26.59%, while the Russell 2000 Index returned -23.99% over the same period.
No sector contributed to the return of the underlying index for the period. The sectors detracting the most were Financials, Consumer Discretionary, and Industrials.
The holdings in the Fund contributing the most to return of the underlying index were Teladoc Health, Inc., Array BioPharma, Inc., and Medicines Co. The holdings detracting the most were Green Dot Corp. - Class A, Investor Mortgage Capital, Inc., and Blackstone Mortgage Trust, Inc. - Class A.
Derivatives in the Fund were used to help provide exposure to the composition of the benchmark in the most efficient manner possible and to provide leverage and not for hedging purposes. Derivatives performed as expected.
Due to the compounding of daily returns, leveraged and inverse funds’ returns over periods other than one day will likely differ in amount and possibly direction from the benchmark return for the same period. Investors should monitor their leveraged and inverse funds’ holdings to ensure that they are consistent with their strategies, as frequently as daily.
The effects of compounding may cause the longer-term correlation of the Fund to its benchmark to diminish. The apparent discrepancy between the leveraged and unleveraged indices is the result of compounding, which is described briefly on page 6 of this report.
Performance displayed represents past performance, which is no guarantee of future result.
Holdings Diversification (Market Exposure as % of Net Assets)

“Holdings Diversification (Market Exposure as % of Net Assets)” excludes any temporary cash investments.
Inception Dates: |
A-Class | May 31, 2006 |
C-Class | May 31, 2006 |
H-Class | May 31, 2006 |
The Fund invests principally in derivative investments such as swap agreements and futures contracts.
72 | THE RYDEX FUNDS ANNUAL REPORT | |
PERFORMANCE REPORT AND FUND PROFILE (Unaudited)(concluded) | March 31, 2020 |
Cumulative Fund Performance*
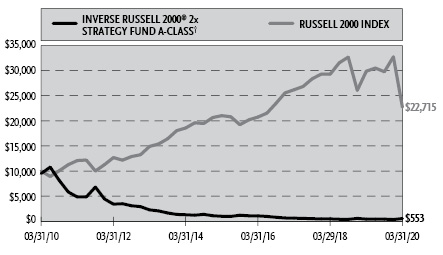
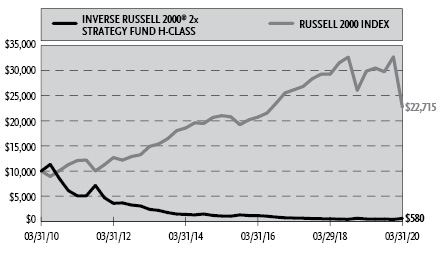
Average Annual Returns*
Periods Ended March 31, 2020
| 1 Year | 5 Year | 10 Year |
A-Class Shares | 26.82% | (11.13%) | (24.76%) |
A-Class Shares with sales charge† | 20.80% | (11.99%) | (25.13%) |
C-Class Shares | 25.86% | (11.78%) | (25.27%) |
C-Class Shares with CDSC‡ | 24.86% | (11.78%) | (25.27%) |
H-Class Shares | 26.59% | (11.17%) | (24.78%) |
Russell 2000 Index | (23.99%) | 1.55% | 8.55% |
* | The performance data above represents past performance that is not predictive of future results. The investment return and principal value of an investment in the Fund will fluctuate so that an investor’s shares, when redeemed, may be worth more or less than their original cost. Returns are historical and include changes in principal and reinvested dividends and capital gains and do not reflect the effect of taxes. The Russell 2000 Index is an unmanaged index and, unlike the Fund, has no management fees or operating expenses to reduce its reported return. The graphs are based on A-Class shares and H-Class shares only; performance for C-Class shares will vary due to differences in fee structures. |
† | Fund returns are calculated using the maximum sales charge of 4.75%. |
‡ | Fund returns include a CDSC of 1% if redeemed within 12 months of purchase. |
| | THE RYDEX FUNDS ANNUAL REPORT | 73 |
SCHEDULE OF INVESTMENTS | March 31, 2020 |
INVERSE RUSSELL 2000® 2x STRATEGY FUND | |
| | Face
Amount | | | Value | |
FEDERAL AGENCY NOTES†† - 33.3% |
Federal Farm Credit Bank |
0.40% (U.S. Prime Rate - 2.85%, Rate Floor: 0.00%) due 08/30/221 | | $ | 1,500,000 | | | $ | 1,505,128 | |
0.45% (U.S. Prime Rate - 2.80%, Rate Floor: 0.00%) due 03/14/221 | | | 1,250,000 | | | | 1,252,756 | |
0.30% (U.S. Prime Rate - 2.95%, Rate Floor: 0.00%) due 07/20/201 | | | 1,000,000 | | | | 1,000,339 | |
0.38% (3 Month U.S. Treasury Bill Rate + 0.29%, Rate Floor: 0.00%) due 04/11/221 | | | 1,000,000 | | | | 998,364 | |
0.44% (U.S. Prime Rate - 2.81%, Rate Floor: 0.00%) due 05/20/221 | | | 360,000 | | | | 360,782 | |
Federal Home Loan Bank |
0.75% (3 Month USD LIBOR - 0.14%, Rate Floor: 0.00%) due 12/18/201 | | | 1,200,000 | | | | 1,200,253 | |
Freddie Mac |
0.14% (U.S. Secured Overnight Financing Rate + 0.13%, Rate Floor: 0.00%) due 08/05/221 | | | 1,000,000 | | | | 993,615 | |
Total Federal Agency Notes | | | | |
(Cost $7,309,422) | | | | | | | 7,311,237 | |
| | | | | | | | | |
FEDERAL AGENCY DISCOUNT NOTES†† - 22.8% |
Federal Home Loan Bank |
0.05% due 04/03/202 | | | 5,000,000 | | | | 4,999,986 | |
Total Federal Agency Discount Notes | | | | |
(Cost $4,999,986) | | | | | | | 4,999,986 | |
| | | | | | | | | |
U.S. TREASURY BILLS†† - 0.0% |
U.S. Treasury Bills |
0.50% due 04/30/202 | | | 18,000 | | | | 17,999 | |
Total U.S. Treasury Bills | | | | |
(Cost $17,993) | | | | | | | 17,999 | |
| | | | | | | | | |
REPURCHASE AGREEMENTS††,3 - 34.1% |
J.P. Morgan Securities LLC
issued 03/31/20 at 0.01%
due 04/01/204 | | | 5,402,991 | | | | 5,402,991 | |
BofA Securities, Inc.
issued 03/31/20 at 0.00%
due 04/01/204 | | | 2,078,074 | | | | 2,078,074 | |
Total Repurchase Agreements | | | | |
(Cost $7,481,065) | | | | | | | 7,481,065 | |
| | | | | | | | | |
Total Investments - 90.2% | | | | |
(Cost $19,808,466) | | $ | 19,810,287 | |
Other Assets & Liabilities, net - 9.8% | | | 2,151,866 | |
Total Net Assets - 100.0% | | $ | 21,962,153 | |
Total Return Swap Agreements |
Counterparty | Index | Financing
Rate Receive | Payment
Frequency | | Maturity Date | | | Units | | | Notional
Amount | | | Value and
Unrealized
Appreciation
(Depreciation) | |
OTC Equity Index Swap Agreements Sold Short†† |
BNP Paribas | Russell 2000 Index | (0.59)% (1 Month USD LIBOR - 0.40%) | At Maturity | | | 04/29/20 | | | | 20,542 | | | $ | 23,686,724 | | | $ | 487,977 | |
Barclays Bank plc | Russell 2000 Index | (0.09)% (1 Week USD LIBOR - 0.50%) | At Maturity | | | 04/30/20 | | | | 13,861 | | | | 15,982,886 | | | | 72,274 | |
Goldman Sachs International | Russell 2000 Index | (0.54)% (1 Week USD LIBOR - 0.05%) | At Maturity | | | 04/28/20 | | | | 3,664 | | | | 4,225,315 | | | | (154,408 | ) |
| | | | | | | | | | | | | | $ | 43,894,925 | | | $ | 405,843 | |
74 | THE RYDEX FUNDS ANNUAL REPORT | SEE NOTES TO FINANCIAL STATEMENTS. |
SCHEDULE OF INVESTMENTS (concluded) | March 31, 2020 |
INVERSE RUSSELL 2000® 2x STRATEGY FUND | |
†† | Value determined based on Level 2 inputs — See Note 4. |
1 | Variable rate security. Rate indicated is the rate effective at March 31, 2020. In some instances, the effective rate is limited by a minimum rate floor or a maximum rate cap established by the issuer. The settlement status of a position may also impact the effective rate indicated. In some cases, a position may be unsettled at period end and may not have a stated effective rate. In instances where multiple underlying reference rates and spread amounts are shown, the effective rate is based on a weighted average. |
2 | Rate indicated is the effective yield at the time of purchase. |
3 | Repurchase Agreements — See Note 6. |
4 | All or a portion of this security is pledged as equity index swap collateral at March 31, 2020. |
| | LIBOR — London Interbank Offered Rate |
| | plc — Public Limited Company |
| | |
| | See Sector Classification in Other Information section. |
The following table summarizes the inputs used to value the Fund’s investments at March 31, 2020 (See Note 4 in the Notes to Financial Statements):
Investments in Securities (Assets) | | Level 1
Quoted
Prices | | | Level 2
Significant
Observable
Inputs | | | Level 3
Significant
Unobservable
Inputs | | | Total | |
Federal Agency Notes | | $ | — | | | $ | 7,311,237 | | | $ | — | | | $ | 7,311,237 | |
Federal Agency Discount Notes | | | — | | | | 4,999,986 | | | | — | | | | 4,999,986 | |
U.S. Treasury Bills | | | — | | | | 17,999 | | | | — | | | | 17,999 | |
Repurchase Agreements | | | — | | | | 7,481,065 | | | | — | | | | 7,481,065 | |
Equity Index Swap Agreements** | | | — | | | | 560,251 | | | | — | | | | 560,251 | |
Total Assets | | $ | — | | | $ | 20,370,538 | | | $ | — | | | $ | 20,370,538 | |
Investments in Securities (Liabilities) | | Level 1
Quoted
Prices | | | Level 2
Significant
Observable
Inputs | | | Level 3
Significant
Unobservable
Inputs | | | Total | |
Equity Index Swap Agreements** | | $ | — | | | $ | 154,408 | | | $ | — | | | $ | 154,408 | |
** | This derivative is reported as unrealized appreciation/depreciation at period end. |
SEE NOTES TO FINANCIAL STATEMENTS. | THE RYDEX FUNDS ANNUAL REPORT | 75 |
INVERSE RUSSELL 2000® 2x STRATEGY FUND | |
STATEMENT OF ASSETS AND LIABILITIES
March 31, 2020
Assets: |
Investments, at value (cost $12,327,401) | | $ | 12,329,222 | |
Repurchase agreements, at value (cost $7,481,065) | | | 7,481,065 | |
Cash | | | 3,584,508 | |
Segregated cash with broker | | | 2,240,000 | |
Unrealized appreciation on OTC swap agreements | | | 560,251 | |
Receivables: |
Fund shares sold | | | 2,882,360 | |
Interest | | | 10,528 | |
Total assets | | | 29,087,934 | |
| | | | | |
Liabilities: |
Unrealized depreciation on OTC swap agreements | | | 154,408 | |
Payable for: |
Fund shares redeemed | | | 6,623,160 | |
Swap settlement | | | 299,501 | |
Management fees | | | 16,947 | |
Transfer agent and administrative fees | | | 5,554 | |
Distribution and service fees | | | 4,957 | |
Portfolio accounting fees | | | 2,825 | |
Trustees’ fees* | | | 499 | |
Miscellaneous | | | 17,930 | |
Total liabilities | | | 7,125,781 | |
Commitments and contingent liabilities (Note 11) | | | — | |
Net assets | | $ | 21,962,153 | |
| | | | | |
Net assets consist of: |
Paid in capital | | $ | 78,891,642 | |
Total distributable earnings (loss) | | | (56,929,489 | ) |
Net assets | | $ | 21,962,153 | |
| | | | | |
A-Class: |
Net assets | | $ | 11,581,409 | |
Capital shares outstanding | | | 209,451 | |
Net asset value per share | | $ | 55.29 | |
Maximum offering price per share (Net asset value divided by 95.25%) | | $ | 58.05 | |
| | | | | |
C-Class: |
Net assets | | $ | 347,941 | |
Capital shares outstanding | | | 7,013 | |
Net asset value per share | | $ | 49.61 | |
| | | | | |
H-Class: |
Net assets | | $ | 10,032,803 | |
Capital shares outstanding | | | 182,566 | |
Net asset value per share | | $ | 54.95 | |
STATEMENT OF OPERATIONS
Year Ended March 31, 2020
Investment Income: |
Interest | | $ | 314,051 | |
Total investment income | | | 314,051 | |
| | | | | |
Expenses: |
Management fees | | | 143,449 | |
Distribution and service fees: | | | | |
A-Class | | | 22,181 | |
C-Class | | | 3,433 | |
H-Class | | | 16,813 | |
Transfer agent and administrative fees | | | 40,695 | |
Portfolio accounting fees | | | 23,911 | |
Registration fees | | | 19,994 | |
Professional fees | | | 10,055 | |
Trustees’ fees* | | | 3,771 | |
Custodian fees | | | 2,472 | |
Prime broker interest expense | | | 161 | |
Miscellaneous | | | 15,842 | |
Total expenses | | | 302,777 | |
Net investment income | | | 11,274 | |
| | | | | |
Net Realized and Unrealized Gain (Loss): |
Net realized gain (loss) on: |
Investments | | | 1,536 | |
Swap agreements | | | 4,120,083 | |
Futures contracts | | | (203,337 | ) |
Net realized gain | | | 3,918,282 | |
Net change in unrealized appreciation (depreciation) on: |
Investments | | | 2,481 | |
Swap agreements | | | 764,908 | |
Net change in unrealized appreciation (depreciation) | | | 767,389 | |
Net realized and unrealized gain | | | 4,685,671 | |
Net increase in net assets resulting from operations | | $ | 4,696,945 | |
* | Relates to Trustees not deemed “interested persons” within the meaning of Section 2(a)(19) of the 1940 Act. |
76 | THE RYDEX FUNDS ANNUAL REPORT | SEE NOTES TO FINANCIAL STATEMENTS. |
INVERSE RUSSELL 2000® 2x STRATEGY FUND | |
STATEMENTS OF CHANGES IN NET ASSETS |
| | Year Ended
March 31,
2020 | | | Year Ended
March 31,
2019 | |
Increase (Decrease) in Net Assets from Operations: | | | | | | | | |
Net investment income | | $ | 11,274 | | | $ | 38,430 | |
Net realized gain (loss) on investments | | | 3,918,282 | | | | (2,229,376 | ) |
Net change in unrealized appreciation (depreciation) on investments | | | 767,389 | | | | (302,067 | ) |
Net increase (decrease) in net assets resulting from operations | | | 4,696,945 | | | | (2,493,013 | ) |
| | | | | | | | | |
Distributions to shareholders: | | | | | | | | |
A-Class | | | (36,816 | ) | | | — | |
C-Class | | | (1,754 | ) | | | — | |
H-Class | | | (30,950 | ) | | | — | |
Total distributions to shareholders | | | (69,520 | ) | | | — | |
| | | | | | | | | |
Capital share transactions: | | | | | | | | |
Proceeds from sale of shares | | | | | | | | |
A-Class | | | 3,126,898 | | | | 7,325,063 | |
C-Class | | | 3,392,506 | | | | 2,674,682 | |
H-Class | | | 412,034,745 | | | | 548,592,441 | |
Distributions reinvested | | | | | | | | |
A-Class | | | 36,816 | | | | — | |
C-Class | | | 882 | | | | — | |
H-Class | | | 28,747 | | | | — | |
Cost of shares redeemed | | | | | | | | |
A-Class | | | (3,409,658 | ) | | | (3,203,459 | ) |
C-Class | | | (3,528,705 | ) | | | (2,569,800 | ) |
H-Class | | | (410,270,470 | ) | | | (547,409,393 | ) |
Net increase from capital share transactions | | | 1,411,761 | | | | 5,409,534 | |
Net increase in net assets | | | 6,039,186 | | | | 2,916,521 | |
| | | | | | | | | |
Net assets: | | | | | | | | |
Beginning of year | | | 15,922,967 | | | | 13,006,446 | |
End of year | | $ | 21,962,153 | | | $ | 15,922,967 | |
| | | | | | | | | |
Capital share activity: | | | | | | | | |
Shares sold | | | | | | | | |
A-Class | | | 68,619 | | | | 150,272 | |
C-Class | | | 92,186 | | | | 67,545 | |
H-Class | | | 9,739,225 | | | | 12,623,441 | |
Shares issued from reinvestment of distributions | | | | | | | | |
A-Class | | | 1,024 | | | | — | |
C-Class | | | 27 | | | | — | |
H-Class | | | 804 | | | | — | |
Shares redeemed | | | | | | | | |
A-Class | | | (71,212 | ) | | | (65,881 | ) |
C-Class | | | (95,423 | ) | | | (65,278 | ) |
H-Class | | | (9,701,276 | ) | | | (12,617,331 | ) |
Net increase in shares | | | 33,974 | | | | 92,768 | |
SEE NOTES TO FINANCIAL STATEMENTS. | THE RYDEX FUNDS ANNUAL REPORT | 77 |
INVERSE RUSSELL 2000® 2x STRATEGY FUND | |
This table is presented to show selected data for a share outstanding throughout each period and to assist shareholders in evaluating a Fund’s performance for the periods presented.
A-Class | | Year Ended
March 31,
2020 | | | Year Ended
March 31,
2019 | | | Year Ended
March 29,
2018 | | | Year Ended
March 31,
2017c | | | Year Ended
March 31,
2016c | |
Per Share Data |
Net asset value, beginning of period | | $ | 43.81 | | | $ | 47.99 | | | $ | 62.44 | | | $ | 108.34 | | | $ | 100.19 | |
Income (loss) from investment operations: |
Net investment income (loss)a | | | .08 | | | | .15 | | | | (.27 | ) | | | (1.15 | ) | | | (1.88 | ) |
Net gain (loss) on investments (realized and unrealized) | | | 11.57 | | | | (4.33 | ) | | | (14.18 | ) | | | (44.75 | ) | | | 10.03 | |
Total from investment operations | | | 11.65 | | | | (4.18 | ) | | | (14.45 | ) | | | (45.90 | ) | | | 8.15 | |
Less distributions from: |
Net investment income | | | (.17 | ) | | | — | | | | — | | | | — | | | | — | |
Total distributions | | | (.17 | ) | | | — | | | | — | | | | — | | | | — | |
Net asset value, end of period | | $ | 55.29 | | | $ | 43.81 | | | $ | 47.99 | | | $ | 62.44 | | | $ | 108.34 | |
|
Total Returnb | | | 26.82 | % | | | (8.71 | %) | | | (23.14 | %) | | | (42.36 | %) | | | 8.10 | % |
Ratios/Supplemental Data |
Net assets, end of period (in thousands) | | $ | 11,581 | | | $ | 9,245 | | | $ | 6,076 | | | $ | 1,636 | | | $ | 1,364 | |
Ratios to average net assets: |
Net investment income (loss) | | | 0.19 | % | | | 0.34 | % | | | (0.54 | %) | | | (1.44 | %) | | | (1.67 | %) |
Total expenses | | | 1.86 | % | | | 1.89 | % | | | 1.78 | % | | | 1.73 | % | | | 1.80 | % |
Portfolio turnover rate | | | — | | | | — | | | | — | | | | — | | | | — | |
C-Class | | Year Ended
March 31,
2020 | | | Year Ended
March 31,
2019 | | | Year Ended
March 29,
2018 | | | Year Ended
March 31,
2017c | | | Year Ended
March 31,
2016c | |
Per Share Data |
Net asset value, beginning of period | | $ | 39.63 | | | $ | 43.74 | | | $ | 57.33 | | | $ | 100.17 | | | $ | 93.32 | |
Income (loss) from investment operations: |
Net investment income (loss)a | | | (.21 | ) | | | (.18 | ) | | | (.71 | ) | | | (1.63 | ) | | | (2.48 | ) |
Net gain (loss) on investments (realized and unrealized) | | | 10.36 | | | | (3.93 | ) | | | (12.88 | ) | | | (41.21 | ) | | | 9.33 | |
Total from investment operations | | | 10.15 | | | | (4.11 | ) | | | (13.59 | ) | | | (42.84 | ) | | | 6.85 | |
Less distributions from: |
Net investment income | | | (.17 | ) | | | — | | | | — | | | | — | | | | — | |
Total distributions | | | (.17 | ) | | | — | | | | — | | | | — | | | | — | |
Net asset value, end of period | | $ | 49.61 | | | $ | 39.63 | | | $ | 43.74 | | | $ | 57.33 | | | $ | 100.17 | |
|
Total Returnb | | | 25.86 | % | | | (9.40 | %) | | | (23.70 | %) | | | (42.77 | %) | | | 7.33 | % |
Ratios/Supplemental Data |
Net assets, end of period (in thousands) | | $ | 348 | | | $ | 405 | | | $ | 348 | | | $ | 743 | | | $ | 820 | |
Ratios to average net assets: |
Net investment income (loss) | | | (0.55 | %) | | | (0.45 | %) | | | (1.44 | %) | | | (2.23 | %) | | | (2.44 | %) |
Total expenses | | | 2.62 | % | | | 2.63 | % | | | 2.55 | % | | | 2.76 | % | | | 2.56 | % |
Portfolio turnover rate | | | — | | | | — | | | | — | | | | — | | | | — | |
78 | THE RYDEX FUNDS ANNUAL REPORT | SEE NOTES TO FINANCIAL STATEMENTS. |
INVERSE RUSSELL 2000® 2x STRATEGY FUND | |
FINANCIAL HIGHLIGHTS (concluded) |
This table is presented to show selected data for a share outstanding throughout each period and to assist shareholders in evaluating a Fund’s performance for the periods presented.
H-Class | | Year Ended
March 31,
2020 | | | Year Ended
March 31,
2019 | | | Year Ended
March 29,
2018 | | | Year Ended
March 31,
2017c | | | Year Ended
March 31,
2016c | |
Per Share Data |
Net asset value, beginning of period | | $ | 43.62 | | | $ | 47.80 | | | $ | 62.18 | | | $ | 107.91 | | | $ | 99.84 | |
Income (loss) from investment operations: |
Net investment income (loss)a | | | (.02 | ) | | | .09 | | | | (.36 | ) | | | (1.19 | ) | | | (1.84 | ) |
Net gain (loss) on investments (realized and unrealized) | | | 11.52 | | | | (4.27 | ) | | | (14.02 | ) | | | (44.54 | ) | | | 9.91 | |
Total from investment operations | | | 11.50 | | | | (4.18 | ) | | | (14.38 | ) | | | (45.73 | ) | | | 8.07 | |
Less distributions from: |
Net investment income | | | (.17 | ) | | | — | | | | — | | | | — | | | | — | |
Total distributions | | | (.17 | ) | | | — | | | | — | | | | — | | | | — | |
Net asset value, end of period | | $ | 54.95 | | | $ | 43.62 | | | $ | 47.80 | | | $ | 62.18 | | | $ | 107.91 | |
|
Total Return | | | 26.59 | % | | | (8.74 | %) | | | (23.11 | %) | | | (42.39 | %) | | | 8.09 | % |
Ratios/Supplemental Data |
Net assets, end of period (in thousands) | | $ | 10,033 | | | $ | 6,273 | | | $ | 6,582 | | | $ | 16,531 | | | $ | 46,803 | |
Ratios to average net assets: |
Net investment income (loss) | | | (0.05 | %) | | | 0.22 | % | | | (0.68 | %) | | | (1.46 | %) | | | (1.69 | %) |
Total expenses | | | 1.91 | % | | | 1.89 | % | | | 1.80 | % | | | 1.84 | % | | | 1.81 | % |
Portfolio turnover rate | | | — | | | | — | | | | — | | | | — | | | | — | |
a | Net investment income (loss) per share was computed using average shares outstanding throughout the period. |
b | Total return does not reflect the impact of any applicable sales charges. |
c | Reverse Share split — Per share amounts for the periods presented through March 31, 2017 have been restated to reflect a 1:4 reverse share split effective November 7, 2016. |
SEE NOTES TO FINANCIAL STATEMENTS. | THE RYDEX FUNDS ANNUAL REPORT | 79 |
NOTES TO FINANCIAL STATEMENTS |
Note 1 – Organization and Significant Accounting Policies
Organization
The Rydex Dynamic Funds (the “Trust”), a Delaware statutory trust, is registered with the SEC under the Investment Company Act of 1940 (“1940 Act”), as an open-ended investment company, of the series type. Each series, in effect, is representing a separate fund (each, a “Fund”). The Trust is authorized to issue an unlimited number of no par value shares. The Trust accounts for the assets of each Fund separately.
The Trust offers a combination of three separate classes of shares: A-Class shares, C-Class shares, and H-Class shares. Sales of shares of each Class are made without a front-end sales charge at the net asset value per share (“NAV”), with the exception of A-Class shares. A-Class shares are sold at the NAV, plus the applicable front-end sales charge. The sales charge varies depending on the amount purchased, but will not exceed 4.75%. A-Class share purchases of $1 million or more are exempt from the front-end sales charge but have a 1% contingent deferred sales charge (“CDSC”) if shares are redeemed within 12 months of purchase. C-Class shares have a 1% CDSC if shares are redeemed within 12 months of purchase. C-Class shares of each Fund automatically convert to A-Class shares of the same Fund on or about the 10th day of the month following the 10-year anniversary of the purchase of the C-Class shares. This conversion will be executed without any sales charge, fee or other charge. After the conversion is completed, the shares will be subject to all features and expenses of A-Class shares. At March 31, 2020, the Trust consisted of eight funds.
This report covers the following funds (collectively, the “Funds”):
Fund Name | Investment
Company Type |
S&P 500® 2x Strategy Fund | Non-diversified |
Inverse S&P 500® 2x Strategy Fund | Non-diversified |
NASDAQ-100® 2x Strategy Fund | Non-diversified |
Inverse NASDAQ-100® 2x Strategy Fund | Non-diversified |
Dow 2x Strategy Fund | Non-diversified |
Inverse Dow 2x Strategy Fund | Non-diversified |
Russell 2000® 2x Strategy Fund | Non-diversified |
Inverse Russell 2000® 2x Strategy Fund | Non-diversified |
The Funds are designed and operated to accommodate frequent trading by shareholders and, unlike most mutual funds, offer unlimited exchange privileges with no minimum holding periods or transactions fees, which may cause the Funds to experience high portfolio turnover.
Security Investors, LLC, which operates under the name Guggenheim Investments (“GI”), provides advisory services. Guggenheim Funds Distributors, LLC (“GFD”) acts as principal underwriter for the Trust. GI and GFD are affiliated entities.
Significant Accounting Policies
The Funds operate as investment companies and, accordingly, follow the investment company accounting and reporting guidance of the Financial Accounting Standards Board (“FASB”) Accounting Standards Codification Topic 946 Financial Services – Investment Companies.
The following significant accounting policies are in conformity with U.S. generally accepted accounting principles (“U.S. GAAP”) and are consistently followed by the Trust. This requires management to make estimates and assumptions that affect the reported amount of assets and liabilities, contingent assets and liabilities at the date of the financial statements, and the reported amounts of revenues and expenses during the reporting period. Actual results could differ from these estimates. All time references are based on Eastern Time.
The NAV of each Class of a fund is calculated by dividing the market value of a fund’s securities and other assets, less all liabilities, attributable to the Class by the number of outstanding shares of the Class.
The Trust calculates a NAV twice each business day; at 10:45 a.m. and at the close of the New York Stock Exchange (“NYSE”), usually 4:00 p.m. The NAV is calculated using the current market value of each Fund’s total assets, as of the respective time of calculation. These financial statements are based on the March 31, 2020, afternoon NAV.
(a) Valuation of Investments
The Board of Trustees of the Funds (the “Board”) has adopted policies and procedures for the valuation of the Funds’ investments (the “Valuation Procedures”). Pursuant to the Valuation Procedures, the Board has delegated to a valuation committee, consisting of representatives from Guggenheim’s investment management, fund administration, legal and compliance departments (the “Valuation Committee”), the day-to-day responsibility for implementing the Valuation Procedures, including, under most circumstances, the responsibility for determining the fair value of the Funds’ securities and/or other assets.
Valuations of the Funds’ securities and other assets are supplied primarily by pricing services appointed pursuant to the processes set forth in the Valuation Procedures. The Valuation Committee convenes monthly, or more frequently as needed, to review the valuation of all assets which have been fair valued for reasonableness. The Funds’ officers, through the Valuation Committee and consistent with the monitoring and review responsibilities set forth in the Valuation Procedures, regularly review procedures used and valuations provided by the pricing services.
80 | THE RYDEX FUNDS ANNUAL REPORT | |
NOTES TO FINANCIAL STATEMENTS (continued) |
If the pricing service cannot or does not provide a valuation for a particular investment or such valuation is deemed unreliable, such investment is fair valued by the Valuation Committee.
Equity securities listed or traded on a recognized U.S. securities exchange or the National Association of Securities Dealers Automated Quotations (“NASDAQ”) National Market System shall generally be valued on the basis of the last sale price on the primary U.S. exchange or market on which the security is listed or traded; provided, however, that securities listed on NASDAQ will be valued at the NASDAQ Official Closing Price, which may not necessarily represent the last sale price. If there is no sale on the valuation date, exchange-traded U.S. equity securities will be valued on the basis of the last bid price.
Money market funds are valued at their net asset value.
U.S. Government securities are valued by independent pricing services, the last traded fill price, or at the reported bid price at the close of business.
Debt securities with a maturity of greater than 60 days at acquisition are valued at prices that reflect broker-dealer supplied valuations or are obtained from independent pricing services, which may consider the trade activity, treasury spreads, yields or price of bonds of comparable quality, coupon, maturity, and type, as well as prices quoted by dealers who make markets in such securities. Short-term debt securities with a maturity of 60 days or less at acquisition are valued at amortized cost, provided such amount approximates market value.
Repurchase agreements are generally valued at amortized cost, provided such amounts approximate market value.
The value of futures contracts is accounted for using the unrealized appreciation or depreciation on the contracts that is determined by marking the contracts to their current realized settlement prices. Financial futures contracts are valued at the 4:00 p.m. price on the valuation date. In the event that the exchange for a specific futures contract closes earlier than 4:00 p.m., the futures contract is valued at the official settlement price of the exchange. However, the underlying securities from which the futures contract value is derived are monitored until 4:00 p.m. to determine if fair valuation would provide a more accurate valuation.
The values of swap agreements entered into by a fund are accounted for using the unrealized appreciation or depreciation on the agreements that are determined by marking the agreements to the last quoted value of the index or other underlying position that the swaps pertain to at the close of the NYSE.
Investments for which market quotations are not readily available are fair-valued as determined in good faith by GI subject to review and approval by the Valuation Committee, pursuant to methods established or ratified by the Board. Valuations in accordance with these methods are intended to reflect each security’s (or asset’s or liability’s) “fair value”. Each such determination is based on a consideration of all relevant factors, which are likely to vary from one pricing context to another. Examples of such factors may include, but are not limited to market prices; sale prices; broker quotes; and models which derive prices based on inputs such as prices of securities with comparable maturities and characteristics, or based on inputs such as anticipated cash flows or collateral, spread over U.S. Treasury securities, and other information analysis. In connection with futures contracts and other derivative investments, such factors may include obtaining information as to how (a) these contracts and other derivative investments trade in the futures or other derivative markets, respectively, and (b) the securities underlying these contracts and other derivative investments trade in the cash market.
(b) U.S. Government and Agency Obligations
Certain U.S. Government and Agency Obligations are traded on a discount basis; the interest rates shown on the Schedules of Investments reflect the effective rates paid at the time of purchase by the Funds. Other securities bear interest at the rates shown, payable at fixed dates through maturity.
(c) Futures Contracts
Upon entering into a futures contract, a Fund deposits and maintains as collateral such initial margin as required by the exchange on which the transaction is affected. Pursuant to the contract, the Fund agrees to receive from or pay to the broker an amount of cash equal to the daily fluctuation in value of the contract. Such receipts or payments are known as variation margin and are recorded by the Fund as unrealized appreciation or depreciation. When the contract is closed, the Fund records a realized gain or loss equal to the difference between the value of the contract at the time it was opened and the value at the time it was closed.
(d) Swap Agreements
Swap agreements are marked-to-market daily and the change, if any, is recorded as unrealized appreciation or depreciation. Payments received or made as a result of an agreement or termination of an agreement are recognized as realized gains or losses.
(e) Foreign Taxes
The Funds may be subject to foreign taxes (a portion of which may be reclaimable) on income, stock dividends, capital gains on investments or certain foreign currency transactions. All foreign
| | THE RYDEX FUNDS ANNUAL REPORT | 81 |
NOTES TO FINANCIAL STATEMENTS (continued) |
taxes are recorded in accordance with the applicable foreign tax regulations and rates that exist in the foreign jurisdictions in which the Funds invest. These foreign taxes, if any, are paid by the Funds and reflected in their Statements of Operations as follows: foreign taxes withheld at source are presented as a reduction of income and foreign taxes on capital gains from sales of investments are included with the net realized gain (loss) on investments. Foreign taxes payable or deferred as of March 31, 2020, if any, are disclosed in the Funds’ Statements of Assets and Liabilities.
(f) Security Transactions
Security transactions are recorded on the trade date for financial reporting purposes. Realized gains and losses from securities transactions are recorded using the identified cost basis. Proceeds from lawsuits related to investment holdings are recorded as a reduction to cost if the securities are still held and as realized gains if no longer held in the respective Fund. Dividend income is recorded on the ex-dividend date, net of applicable taxes withheld by foreign countries, if any. Taxable non-cash dividends are recorded as dividend income. Interest income, including amortization of premiums and accretion of discounts, is accrued on a daily basis. Dividend income from Real Estate Investment Trusts (“REITs”) is recorded based on the income included in the distributions received from the REIT investments using published REIT classifications, including some management estimates when actual amounts are not available. Distributions received in excess of this estimated amount are recorded as a reduction of the cost of investments or reclassified to realized gains. The actual amounts of income, return of capital, and realized gains are only determined by each REIT after its fiscal year-end, and may differ from the estimated amounts.
(g) Distributions
Distributions of net investment income and net realized gains, if any, are declared and paid at least annually. Dividends are reinvested in additional shares, unless shareholders request payment in cash. Distributions are recorded on the ex-dividend date and are determined in accordance with U.S. federal income tax regulations which may differ from U.S. GAAP.
(h) Class Allocations
Interest and dividend income, most expenses, all realized gains and losses, and all unrealized appreciation and depreciation are allocated to the classes based upon the value of the outstanding shares in each Class. Certain costs, such as distribution and service fees are charged directly to specific classes. In addition, certain expenses have been allocated to the individual Funds in the Trust based on the respective net assets of each Fund included in the Trust.
(i) Cash
The Funds may leave cash overnight in their cash account with the custodian. Periodically, a Fund may have cash due to the custodian bank as an overdraft balance. A fee is incurred on this overdraft, calculated by multiplying the overdraft by a rate based on the federal funds rate, which was 0.08% at March 31, 2020.
(j) Indemnifications
Under the Funds’ organizational documents, the Trustees and Officers are indemnified against certain liabilities arising out of the performance of their duties to the Trust. In addition, throughout the normal course of business, the Funds enter into contracts that contain a variety of representations and warranties which provide general indemnifications. The Funds’ maximum exposure under these arrangements is unknown, as this would involve future claims that may be made against the Funds and/or their affiliates that have not yet occurred. However, based on experience, the Funds expect the risk of loss to be remote.
Note 2 – Derivatives
As part of their investment strategy, the Funds utilize a variety of derivative instruments. These investments involve, to varying degrees, elements of market risk and risks in excess of amounts recognized in the Statements of Assets and Liabilities. Valuation and accounting treatment of these instruments can be found under Significant Accounting Policies in Note 1 of these Notes to Financial Statements.
Derivatives are instruments whose values depend on, or are derived from, in whole or in part, the value of one or more other assets, such as securities, currencies, commodities or indices. Derivative instruments may be used to increase investment flexibility (including to maintain cash reserves while maintaining exposure to certain other assets), for risk management (hedging) purposes, to facilitate trading, to reduce transaction costs and to pursue higher investment returns. Derivative instruments may also be used to mitigate certain investment risks, such as foreign currency exchange rate risk, interest rate risk and credit risk. U.S. GAAP requires disclosures to enable investors to better understand how and why a Fund uses derivative instruments, how these derivative instruments are accounted for and their effects on the Fund’s financial position and results of operations.
The Funds may utilize derivatives for the following purposes:
Index Exposure: the use of an instrument to obtain exposure to a listed or other type of index.
Leverage: gaining total exposure to equities or other assets on the long and short sides at greater than 100% of invested capital.
82 | THE RYDEX FUNDS ANNUAL REPORT | |
NOTES TO FINANCIAL STATEMENTS (continued) |
Liquidity: the ability to buy or sell exposure with little price/market impact.
For any Fund whose investment strategy consistently involves applying leverage, the value of the Fund’s shares will tend to increase or decrease more than the value of any increase or decrease in the underlying index or other asset. In addition, because an investment in derivative instruments generally requires a small investment relative to the amount of investment exposure assumed, an opportunity for increased net income is created; but, at the same time, leverage risk will increase. The Fund’s use of leverage, through borrowings or instruments such as derivatives, may cause the Fund to be more volatile and riskier than if they had not been leveraged.
Futures Contracts
A futures contract is an agreement to purchase (long) or sell (short) an agreed amount of securities or other instruments at a set price for delivery at a future date. There are significant risks associated with a Fund’s use of futures contracts, including (i) there may be an imperfect or no correlation between the changes in market value of the underlying asset and the prices of futures contracts; (ii) there may not be a liquid secondary market for a futures contract; (iii) trading restrictions or limitations may be imposed by an exchange; and (iv) government regulations may restrict trading in futures contracts. When investing in futures, there is minimal counterparty credit risk to a Fund because futures are exchange-traded and the exchange’s clearinghouse, as counterparty to all exchange-traded futures, guarantees against default. Cash deposits are shown as segregated cash with broker on the Statements of Assets and Liabilities; securities held as collateral are noted on the Schedules of Investments.
The following table represents the Funds’ use and volume of futures on a monthly basis:
| | | | Average Notional Amount | |
Fund | Use | | Long | | | Short | |
S&P 500® 2x Strategy Fund | Index exposure, Leverage, Liquidity | | $ | 25,057,916 | | | $ | 85,940 | |
Inverse S&P 500® 2x Strategy Fund | Index exposure, Leverage, Liquidity | | | — | | | | 5,553,462 | |
NASDAQ-100® 2x Strategy Fund | Index exposure, Leverage, Liquidity | | | 90,431,097 | | | | — | |
Inverse NASDAQ-100® 2x Strategy Fund | Index exposure, Leverage, Liquidity | | | — | | | | 2,221,688 | |
Dow 2x Strategy Fund | Index exposure,Leverage, Liquidity | | | 4,815,406 | | | | — | |
Inverse Dow 2x Strategy Fund | Index exposure, Leverage, Liquidity | | | — | | | | 1,450,482 | |
Russell 2000® 2x Strategy Fund | Index exposure, Leverage, Liquidity | | | 4,253,467 | | | | 217,992 | |
Inverse Russell 2000® 2x Strategy Fund | Index exposure, Leverage, Liquidity | | | — | | | | 1,159,704 | |
Swap Agreements
A swap is an agreement that obligates two parties to exchange a series of cash flows at specified intervals based upon or calculated by reference to changes in specified prices or rates for a specified amount of an underlying asset. When utilizing over-the-counter (“OTC”) swaps, a fund bears the risk of loss of the amount expected to be received under a swap agreement in the event of the default or bankruptcy of a swap agreement counterparty or if the underlying asset declines in value. Certain standardized swaps are subject to mandatory central clearing and are executed on a multi-lateral or other trade facility platform, such as a registered exchange. There is limited counterparty credit risk with respect to centrally-cleared swaps as the transaction is facilitated through a central clearinghouse, much like exchange-traded futures contracts. For a fund utilizing centrally cleared swaps, the exchange bears the risk of loss resulting from a counterparty not being able to pay. There is no guarantee that a fund or an underlying fund could eliminate its exposure under an outstanding swap agreement by entering into an offsetting swap agreement with the same or another party.
Total return swaps involve commitments where single or multiple cash flows are exchanged based on the price of an underlying reference asset (such as an index) for a fixed or variable interest rate. Total return swaps will usually be computed based on the current value of the reference asset as of the close of regular trading on the NYSE or other exchange, with the swap value being adjusted to include dividends accrued, financing charges and/or interest associated with the swap agreement. A fund utilizing a total return swap bears the risk of loss of the amount expected to be received under a swap agreement in the event of the default or bankruptcy of a swap agreement counterparty or if the underlying reference asset declines in value.
| | THE RYDEX FUNDS ANNUAL REPORT | 83 |
NOTES TO FINANCIAL STATEMENTS (continued) |
The following table represents the Funds’ use and volume of total return swaps on a monthly basis:
| | | | Average Notional Amount | |
Fund | Use | | Long | | | Short | |
S&P 500® 2x Strategy Fund | Index exposure, Leverage, Liquidity | | $ | 156,874,523 | | | $ | — | |
Inverse S&P 500® 2x Strategy Fund | Index exposure, Leverage, Liquidity | | | — | | | | 44,162,129 | |
NASDAQ-100® 2x Strategy Fund | Index exposure, Leverage, Liquidity | | | 448,588,857 | | | | — | |
Inverse NASDAQ-100® 2x Strategy Fund | Index exposure, Leverage, Liquidity | | | — | | | | 27,417,386 | |
Dow 2x Strategy Fund | Index exposure, Leverage, Liquidity | | | 43,376,251 | | | | — | |
Inverse Dow 2x Strategy Fund | Index exposure, Leverage, Liquidity | | | — | | | | 11,630,870 | |
Russell 2000® 2x Strategy Fund | Index exposure, Leverage, Liquidity | | | 56,009,569 | | | | — | |
Inverse Russell 2000® 2x Strategy Fund | Index exposure, Leverage, Liquidity | | | — | | | | 30,767,776 | |
Derivative Investment Holdings Categorized by Risk Exposure
The following is a summary of the location of derivative investments on the Funds’ Statements of Assets and Liabilities as of March 31, 2020:
Derivative Investment Type | Asset Derivatives | Liability Derivatives |
Equity contracts | Variation margin on futures contracts | Variation margin on futures contracts |
| Unrealized appreciation on OTC swap agreements | Unrealized depreciation on OTC swap agreements |
The following table sets forth the fair value of the Funds’ derivative investments categorized by primary risk exposure at March 31, 2020:
Asset Derivative Investments Value |
Fund | | Futures
Equity
Risk* | | | Swaps
Equity
Risk | | | Total Value at
March 31,
2020 | |
S&P 500® 2x Strategy Fund | | $ | 372,063 | | | $ | — | | | $ | 372,063 | |
Inverse S&P 500® 2x Strategy Fund | | | — | | | | 1,544,907 | | | | 1,544,907 | |
NASDAQ-100® 2x Strategy Fund | | | 8,817,085 | | | | — | | | | 8,817,085 | |
Inverse NASDAQ-100® 2x Strategy Fund | | | — | | | | 241,122 | | | | 241,122 | |
Dow 2x Strategy Fund | | | 291,359 | | | | — | | | | 291,359 | |
Inverse Dow 2x Strategy Fund | | | — | | | | 117,513 | | | | 117,513 | |
Russell 2000® 2x Strategy Fund | | | 144,098 | | | | 330,129 | | | | 474,227 | |
Inverse Russell 2000® 2x Strategy Fund | | | — | | | | 560,251 | | | | 560,251 | |
Liability Derivative Investments Value |
Fund | | Futures
Equity
Risk* | | | Swaps
Equity
Risk | | | Total Value at
March 31,
2020 | |
S&P 500® 2x Strategy Fund | | $ | — | | | $ | 2,247,388 | | | $ | 2,247,388 | |
Inverse S&P 500® 2x Strategy Fund | | | 23,158 | | | | 1,536,589 | | | | 1,559,747 | |
NASDAQ-100® 2x Strategy Fund | | | — | | | | 2,890,756 | | | | 2,890,756 | |
Inverse NASDAQ-100® 2x Strategy Fund | | | 69,869 | | | | — | | | | 69,869 | |
Dow 2x Strategy Fund | | | — | | | | 710,348 | | | | 710,348 | |
Inverse Dow 2x Strategy Fund | | | 37,512 | | | | 312,760 | | | | 350,272 | |
Russell 2000® 2x Strategy Fund | | | — | | | | 67,663 | | | | 67,663 | |
Inverse Russell 2000® 2x Strategy Fund | | | — | | | | 154,408 | | | | 154,408 | |
* | Includes cumulative appreciation (depreciation) of futures contracts as reported on the Schedules of Investments. Variation margin is reported within the Statements of Assets and Liabilities. |
84 | THE RYDEX FUNDS ANNUAL REPORT | |
NOTES TO FINANCIAL STATEMENTS (continued) |
The following is a summary of the location of derivative investments on the Funds’ Statements of Operations for the year ended March 31, 2020:
Derivative Investment Type | Location of Gain (Loss) on Derivatives |
Equity contracts | Net realized gain (loss) on futures contracts |
| Net change in unrealized appreciation (depreciation) on futures contracts |
| Net realized gain (loss) on swap agreements |
| Net change in unrealized appreciation (depreciation) on swap agreements |
The following is a summary of the Funds’ realized gain (loss) and change in unrealized appreciation (depreciation) on derivative investments recognized on the Statements of Operations categorized by primary risk exposure for the year ended March 31, 2020:
Realized Gain (Loss) on Derivative Investments Recognized on the Statements of Operations |
Fund | | Futures
Equity
Risk | | | Swaps
Equity
Risk | | | Total | |
S&P 500® 2x Strategy Fund | | $ | (5,704,663 | ) | | $ | (3,166,270 | ) | | $ | (8,870,933 | ) |
Inverse S&P 500® 2x Strategy Fund | | | (3,102,978 | ) | | | (10,088,750 | ) | | | (13,191,728 | ) |
NASDAQ-100® 2x Strategy Fund | | | (8,679,303 | ) | | | 18,196,159 | | | | 9,516,856 | |
Inverse NASDAQ-100® 2x Strategy Fund | | | (1,049,308 | ) | | | (6,388,763 | ) | | | (7,438,071 | ) |
Dow 2x Strategy Fund | | | (2,999,461 | ) | | | (3,560,852 | ) | | | (6,560,313 | ) |
Inverse Dow 2x Strategy Fund | | | (262,461 | ) | | | 1,344,043 | | | | 1,081,582 | |
Russell 2000® 2x Strategy Fund | | | (3,247,188 | ) | | | (5,793,195 | ) | | | (9,040,383 | ) |
Inverse Russell 2000® 2x Strategy Fund | | | (203,337 | ) | | | 4,120,083 | | | | 3,916,746 | |
Change in Unrealized Appreciation (Depreciation) on Derivative Investments Recognized on the Statements of Operations |
Fund | | Futures
Equity
Risk | | | Swaps
Equity
Risk | | | Total | |
S&P 500® 2x Strategy Fund | | $ | 14,720 | | | $ | (3,502,295 | ) | | $ | (3,487,575 | ) |
Inverse S&P 500® 2x Strategy Fund | | | 193,443 | | | | 302,542 | | | | 495,985 | |
NASDAQ-100® 2x Strategy Fund | | | 5,114,899 | | | | (6,617,259 | ) | | | (1,502,360 | ) |
Inverse NASDAQ-100® 2x Strategy Fund | | | (27,986 | ) | | | 461,913 | | | | 433,927 | |
Dow 2x Strategy Fund | | | 273,836 | | | | (1,234,438 | ) | | | (960,602 | ) |
Inverse Dow 2x Strategy Fund | | | (37,512 | ) | | | (70,928 | ) | | | (108,440 | ) |
Russell 2000® 2x Strategy Fund | | | 117,199 | | | | (71,588 | ) | | | 45,611 | |
Inverse Russell 2000® 2x Strategy Fund | | | — | | | | 764,908 | | | | 764,908 | |
In conjunction with the use of derivative instruments, the Funds are required to maintain collateral in various forms. Depending on the financial instrument utilized and the broker involved, the Funds use margin deposits at the broker, cash and/or securities segregated at the custodian bank, discount notes or repurchase agreements allocated to the Funds as collateral.
The Trust has established counterparty credit guidelines and enters into transactions only with financial institutions of investment grade or better. The Trust monitors the counterparty credit risk.
Note 3 – Offsetting
In the normal course of business, the Funds enter into transactions subject to enforceable master netting arrangements or other similar arrangements. Generally, the right to offset in those agreements allows the Funds to counteract the exposure to a specific counterparty with collateral received from or delivered to that counterparty based on the terms of the arrangements. These arrangements provide for the right to liquidate upon the occurrence of an event of default, credit event upon merger or additional termination event.
| | THE RYDEX FUNDS ANNUAL REPORT | 85 |
NOTES TO FINANCIAL STATEMENTS (continued) |
In order to better define their contractual rights and to secure rights that will help the Funds mitigate their counterparty risk, the Funds may enter into an International Swaps and Derivatives Association, Inc. Master Agreement (“ISDA Master Agreement”) or similar agreement with their derivative contract counterparties. An ISDA Master Agreement is a bilateral agreement between a fund and a counterparty that governs OTC derivatives, including foreign exchange contracts, and typically contains, among other things, collateral posting terms and netting provisions in the event of a default and/or termination event. The provisions of the ISDA Master Agreement typically permit a single net payment in the event of a default (close-out netting) or similar event, including the bankruptcy or insolvency of the counterparty.
For derivatives traded under an ISDA Master Agreement, the collateral requirements are typically calculated by netting the mark-to-market amount for each transaction under such agreement and comparing that amount to the value of any collateral currently pledged by the Funds and the counterparty. For financial reporting purposes, cash collateral that has been pledged to cover obligations of the Funds and cash collateral received from the counterparty, if any, are reported separately on the Statements of Assets and Liabilities as segregated cash with broker/receivable for variation margin, or payable for swap settlement/variation margin. Cash and/or securities pledged or received as collateral by the Funds in connection with an OTC derivative subject to an ISDA Master Agreement generally may not be invested, sold or rehypothecated by the counterparty or the Funds, as applicable, absent an event of default under such agreement, in which case such collateral generally may be applied towards obligations due to and payable by such counterparty or the Funds, as applicable. Generally, the amount of collateral due from or to a counterparty must exceed a minimum transfer amount threshold (e.g., $300,000) before a transfer is required to be made. To the extent amounts due to the Funds from their counterparties are not fully collateralized, contractually or otherwise, the Funds bear the risk of loss from counterparty nonperformance. The Funds attempt to mitigate counterparty risk by only entering into agreements with counterparties that they believe to be of good standing and by monitoring the financial stability of those counterparties.
For financial reporting purposes, the Funds do not offset derivative assets and derivative liabilities that are subject to netting arrangements in the Statements of Assets and Liabilities.
The following tables present derivative financial instruments and secured financing transactions that are subject to enforceable netting arrangements:
| | | | | | | | | | | | | | | | Gross Amounts Not Offset
in the Statements of
Assets and Liabilities | | | | | |
Fund | Instrument | | Gross
Amounts of
Recognized
Assets1 | | | Gross
Amounts
Offset in the
Statements
of Assets and
Liabilities | | | Net Amount
of Assets
Presented on
the Statements
of Assets and
Liabilities | | | Financial
Instruments | | | Cash
Collateral
Received | | | Net
Amount | |
Inverse S&P 500® 2x Strategy Fund | Swap equity contracts | | $ | 1,544,907 | | | $ | — | | | $ | 1,544,907 | | | $ | — | | | $ | — | | | $ | 1,544,907 | |
Inverse NASDAQ-100® 2x Strategy Fund | Swap equity contracts | | | 241,122 | | | | — | | | | 241,122 | | | | — | | | | — | | | | 241,122 | |
Inverse Dow 2x Strategy Fund | Swap equity contracts | | | 117,513 | | | | — | | | | 117,513 | | | | — | | | | — | | | | 117,513 | |
Russell 2000® 2x Strategy Fund | Swap equity contracts | | | 330,129 | | | | — | | | | 330,129 | | | | — | | | | — | | | | 330,129 | |
Inverse Russell 2000® 2x Strategy Fund | Swap equity contracts | | | 560,251 | | | | — | | | | 560,251 | | | | — | | | | — | | | | 560,251 | |
86 | THE RYDEX FUNDS ANNUAL REPORT | |
NOTES TO FINANCIAL STATEMENTS (continued) |
| | | | | | | | | | | | | | | | Gross Amounts Not Offset
in the Statements of
Assets and Liabilities | | | | | |
Fund | Instrument | | Gross
Amounts of
Recognized
Liabilities1 | | | Gross
Amounts
Offset in the
Statements
of Assets and
Liabilities | | | Net Amount
of Liabilities
Presented on
the Statements
of Assets and
Liabilities | | | Financial
Instruments | | | Cash
Collateral
Pledged | | | Net
Amount | |
S&P 500® 2x Strategy Fund | Swap equity contracts | | $ | 2,247,388 | | | $ | — | | | $ | 2,247,388 | | | $ | (1,653,617 | ) | | $ | (593,771 | ) | | $ | — | |
Inverse S&P 500® 2x Strategy Fund | Swap equity contracts | | | 1,536,589 | | | | — | | | | 1,536,589 | | | | (1,536,589 | ) | | | — | | | | — | |
NASDAQ-100® 2x Strategy Fund | Swap equity contracts | | | 2,890,756 | | | | — | | | | 2,890,756 | | | | (1,110,157 | ) | | | (1,780,599 | ) | | | — | |
Dow 2x Strategy Fund | Swap equity contracts | | | 710,348 | | | | — | | | | 710,348 | | | | (398,947 | ) | | | (311,401 | ) | | | — | |
Inverse Dow 2x Strategy Fund | Swap equity contracts | | | 312,760 | | | | — | | | | 312,760 | | | | (312,760 | ) | | | — | | | | — | |
Russell 2000® 2x Strategy Fund | Swap equity contracts | | | 67,663 | | | | — | | | | 67,663 | | | | (67,663 | ) | | | — | | | | — | |
Inverse Russell 2000® 2x Strategy Fund | Swap equity contracts | | | 154,408 | | | | — | | | | 154,408 | | | | (154,408 | ) | | | — | | | | — | |
1 | Exchange-traded or centrally-cleared derivatives are excluded from these reported amounts. |
The Funds have the right to offset deposits against any related derivative liabilities outstanding with each counterparty with the exception of exchange-traded or centrally-cleared derivatives. The following table presents deposits held by others in connection with derivative investments as of March 31, 2020.
Fund | Counterparty | Asset Type | | Cash Pledged | | | Cash Received | |
S&P 500® 2x Strategy Fund | Barclays Bank plc | Total return swap agreements | | $ | 10,279,070 | | | $ | — | |
Inverse S&P 500® 2x Strategy Fund | Barclays Bank plc | Total return swap agreements | | | 4,040,000 | | | | — | |
| Goldman Sachs Group | Futures contracts | | | 914,144 | | | | — | |
| | | | | 4,954,144 | | | | — | |
NASDAQ-100® 2x Strategy Fund | Barclays Bank plc | Total return swap agreements | | | 46,387,819 | | | | — | |
| Goldman Sachs Group | Futures contracts | | | 5,722,508 | | | | — | |
| | | | | 52,110,327 | | | | — | |
Inverse NASDAQ-100® 2x Strategy Fund | Barclays Bank plc | Total return swap agreements | | | 1,450,000 | | | | — | |
| Goldman Sachs Group | Futures contracts | | | 11,398 | | | | — | |
| | | | | 1,461,398 | | | | — | |
Dow 2x Strategy Fund | Barclays Bank plc | Total return swap agreements | | | 6,392,019 | | | | — | |
Inverse Dow 2x Strategy Fund | Barclays Bank plc | Total return swap agreements | | | 1,664,000 | | | | — | |
| Goldman Sachs Group | Futures contracts | | | 104,081 | | | | — | |
| | | | | 1,768,081 | | | | — | |
Russell 2000® 2x Strategy Fund | Barclays Bank plc | Total return swap agreements | | | 1,203,010 | | | | — | |
| Goldman Sachs Group | Futures contracts | | | 84,275 | | | | — | |
| | | | | 1,287,285 | | | | — | |
Inverse Russell 2000® 2x Strategy Fund | Barclays Bank plc | Total return swap agreements | | | 2,240,000 | | | | — | |
| | THE RYDEX FUNDS ANNUAL REPORT | 87 |
NOTES TO FINANCIAL STATEMENTS (continued) |
Note 4 – Fair Value Measurement
In accordance with U.S. GAAP, fair value is defined as the price that the Funds would receive to sell an investment or pay to transfer a liability in an orderly transaction with an independent buyer in the principal market, or in the absence of a principal market, the most advantageous market for the investment or liability. U.S. GAAP establishes a three-tier fair value hierarchy based on the types of inputs used to value assets and liabilities and requires corresponding disclosure. The hierarchy and the corresponding inputs are summarized below:
Level 1 — | quoted prices in active markets for identical assets or liabilities. |
Level 2 — | significant other observable inputs (for example quoted prices for securities that are similar based on characteristics such as interest rates, prepayment speeds, credit risk, etc.). |
Level 3 — | significant unobservable inputs based on the best information available under the circumstances, to the extent observable inputs are not available, which may include assumptions. |
The types of inputs available depend on a variety of factors, such as the type of security and the characteristics of the markets in which it trades, if any. Fair valuation determinations that rely on fewer or no observable inputs require greater judgment. Accordingly, fair value determinations for Level 3 securities require the greatest amount of judgment.
The inputs or methodologies used for valuing securities are not necessarily an indication of the risk associated with investing in those securities. The suitability of the techniques and sources employed to determine fair valuation are regularly monitored and subject to change.
Note 5 – Investment Advisory Agreement and Other Agreements
Under the terms of an investment advisory contract, the Funds pay GI investment advisory fees calculated at the annualized rates below, based on the average daily net assets of the Funds:
Fund | | Management Fees
(as a % of Net Assets) | |
S&P 500® 2x Strategy Fund | | | 0.90 | % |
Inverse S&P 500® 2x Strategy Fund | | | 0.90 | % |
NASDAQ-100® 2x Strategy Fund | | | 0.90 | % |
Inverse NASDAQ-100® 2x Strategy Fund | | | 0.90 | % |
Dow 2x Strategy Fund | | | 0.90 | % |
Inverse Dow 2x Strategy Fund | | | 0.90 | % |
Russell 2000® 2x Strategy Fund | | | 0.90 | % |
Inverse Russell 2000® 2x Strategy Fund | | | 0.90 | % |
When the aggregate assets of each series of the Trust and each series of Rydex Series Funds (excluding the Long Short Equity Fund, Managed Futures Strategy Fund and Multi-Hedge Strategies Fund) equal or exceed $10 billion, the advisory fee rate paid by each individual Fund will be reduced in accordance with the asset level and breakpoint schedule set forth below.
Fund Assets Under Management | | Fund Asset-Based
Breakpoint Reductions | |
$500 million - $1 billion | | | 0.025 | % |
> $1 billion - $2 billion | | | 0.05 | % |
> $2 billion | | | 0.075 | % |
GI pays operating expenses on behalf of the Trust, such as audit and accounting related services, legal services, custody, printing and mailing, among others, on a pass-through basis. Such expenses are allocated to various Funds within the complex based on relative net assets.
88 | THE RYDEX FUNDS ANNUAL REPORT | |
NOTES TO FINANCIAL STATEMENTS (continued) |
The Board has adopted a Distribution Plan applicable to A-Class shares and H-Class shares for which GFD and other firms that provide distribution and/or shareholder services (“Service Providers”) may receive compensation. If a Service Provider provides distribution services, the Funds will pay distribution fees to GFD at an annual rate not to exceed 0.25% of average daily net assets, pursuant to Rule 12b-1 of the 1940 Act. GFD, in turn, will pay the Service Provider out of its fees. GFD may, at its discretion, retain a portion of such payments to compensate itself for distribution services.
The Board has adopted a separate Distribution and Shareholder Services Plan applicable to its C-Class shares that allows the Funds to pay annual distribution and service fees of 1.00% of the Funds’ C-Class shares average daily net assets. The annual 0.25% service fee compensates a shareholder’s financial adviser for providing ongoing services to the shareholder. The annual distribution fee of 0.75% reimburses GFD for paying the shareholder’s financial adviser an ongoing sales commission. GFD advances the first year’s service and distribution fees to the financial adviser. GFD retains the service and distribution fees on accounts with no authorized dealer of record.
For the year ended March 31, 2020, GFD retained sales charges of $68,549 relating to sales of A-Class shares of the Trust.
Certain trustees and officers of the Trust are also officers of GI and/or GFD. The Trust does not compensate its officers or trustees who are officers, directors and/or employees of GI or GFD.
MUFG Investor Services (US), LLC (“MUIS”) acts as the Funds’ administrator, transfer agent and accounting agent. As administrator, transfer agent and accounting agent, MUIS maintains the books and records of the Funds’ securities and cash. U.S. Bank, N.A. (“U.S. Bank”) acts as the Funds’ custodian. As custodian, U.S. Bank is responsible for the custody of the Funds’ assets. For providing the aforementioned services, MUIS and U.S. Bank are entitled to receive a monthly fee equal to an annual percentage of each Fund’s average daily net assets and out of pocket expenses.
Note 6 – Repurchase Agreements
The Funds transfer uninvested cash balances into a single joint account, the daily aggregate balance of which is invested in one or more repurchase agreements collateralized by obligations of the U.S. Treasury and U.S. government agencies. The collateral is in the possession of the Funds’ custodian and is evaluated to ensure that its market value exceeds, at a minimum, 102% of the original face amount of the repurchase agreements. Each Fund holds a pro rata share of the collateral based on the dollar amount of the repurchase agreement entered into by each Fund.
At March 31, 2020, the repurchase agreements in the joint account were as follows:
Counterparty and
Terms of Agreement | | Face Value | | | Repurchase Price | | | Collateral | | Par Value | | | Fair Value | |
J.P. Morgan Securities LLC | | | | | | | | | | U.S. Treasury Inflation Indexed Bond | | | | | | | | |
0.01% | | | | | | | | | | 0.13% | | | | | | | | |
Due 04/01/20 | | $ | 94,239,975 | | | $ | 94,240,002 | | | 04/15/21 | | $ | 96,183,110 | | | $ | 94,401,558 | |
| | | | | | | | | | | U.S. Treasury Notes | | | | | | | | |
| | | | | | | | | | | 0.63% - 2.13% | | | | | | | | |
| | | | | | | | | | | 04/30/20 - 03/31/27 | | | 1,710,800 | | | | 1,720,514 | |
| | | | | | | | | | | U.S. Treasury Floating Rate Note | | | | | | | | |
| | | | | | | | | | | 0.03% | | | | | | | | |
| | | | | | | | | | | 04/30/20 | | | 1,400 | | | | 1,402 | |
| | | | | | | | | | | U.S. Treasury Bond | | | | | | | | |
| | | | | | | | | | | 2.50% | | | | | | | | |
| | | | | | | | | | | 02/15/45 | | | 800 | | | | 1,003 | |
| | | | | | | | | | | U.S. Treasury Bills | | | | | | | | |
| | | | | | | | | | | 0.00% | | | | | | | | |
| | | | | | | | | | | 04/21/20 - 03/25/21 | | | 300 | | | | 300 | |
| | | | | | | | | | | | | | 97,896,410 | | | | 96,124,777 | |
| | | | | | | | | | | | | | | | | | | |
BofA Securities, Inc. | | | | | | | | | | U.S. Treasury Notes | | | | | | | | |
0.00% | | | | | | | | | | 1.50% - 1.63% | | | | | | | | |
Due 04/01/20 | | | 36,246,146 | | | | 36,246,145 | | | 08/15/22 - 02/28/23 | | | 35,704,800 | | | | 36,971,156 | |
| | THE RYDEX FUNDS ANNUAL REPORT | 89 |
NOTES TO FINANCIAL STATEMENTS (continued) |
In the event of counterparty default, the Funds have the right to collect the collateral to offset losses incurred. There is potential loss to the Funds in the event the Funds are delayed or prevented from exercising their rights to dispose of the collateral securities, including the risk of a possible decline in the value of the underlying securities during the period while the Funds seek to assert their rights. GI, acting under the supervision of the Board, reviews the value of the collateral and the creditworthiness of those banks and dealers with which the Funds enter into repurchase agreements to evaluate potential risks.
Note 7– Portfolio Securities Loaned
The Funds may lend their securities to approved brokers to earn additional income. Security lending income shown on the Statements of Operations is shown net of rebates paid to the borrowers and earnings on cash collateral investments shared with the lending agent. Within this arrangement, the Funds act as the lender, U.S. Bank acts as the lending agent, and other approved registered broker dealers act as the borrowers. The Funds receive cash collateral, valued at 102% of the value of the securities on loan. Under the terms of the Funds’ securities lending agreement with U.S. Bank, cash collateral and proceeds are invested in the First American Government Obligations Fund — Class Z. The Funds bear the risk of loss on cash collateral investments. Collateral is maintained over the life of the loan in an amount not less than the value of loaned securities, as determined at the close of fund business each day; any additional collateral required due to changes in security values is delivered to the Funds the next business day. Although the collateral mitigates the risk, the Funds could experience a delay in recovering their securities and a possible loss of income or value if the borrower fails to return the securities. The Funds have the right under the securities lending agreement to recover the securities from the borrower on demand. Securities lending transactions are accounted for as secured borrowings. The remaining contractual maturity of the securities lending agreement is overnight and continuous.
At March 31, 2020, the Funds participated in securities lending transactions, which are subject to enforceable netting arrangements, as follows:
| | | Gross Amounts Not Offset in the
Statements of Assets and Liabilities | | | | Securities Lending Collateral | |
Fund | | Value of
Securities
Loaned | | | Collateral
Received(a) | | | Net
Amount | | | | Cash
Collateral
Invested | | | Cash
Collateral
Uninvested | | | Total
Collateral | |
S&P 500® 2x Strategy Fund | | $ | 19,416 | | | $ | (19,416 | ) | | $ | — | | | | $ | 20,644 | | | $ | — | | | $ | 20,644 | |
NASDAQ-100® 2x Strategy Fund | | | 248,844 | | | | (248,781 | ) | | | 63 | | | | | 248,781 | * | | | — | | | | 248,781 | |
(a) | Actual collateral received by the Fund is generally greater than the amount shown due to overcollateralization. |
* | Subsequent to March 31, 2020, additional collateral was received. |
In the event of counterparty default, the Funds have the right to collect the collateral to offset losses incurred. There is potential loss to the Funds in the event the Funds are delayed or prevented from exercising their rights to dispose of the collateral securities, including the risk of a possible decline in the value of the underlying securities during the period while the Funds seek to assert their rights. GI, acting under the supervision of the Board, reviews the value of the collateral and the creditworthiness of those banks and dealers to evaluate potential risks.
Note 8 – Federal Income Tax Information
The Funds intend to comply with the provisions of Subchapter M of the Internal Revenue Code applicable to regulated investment companies and will distribute substantially all taxable net investment income and capital gains sufficient to relieve the Funds from all, or substantially all, federal income, excise and state income taxes. Therefore, no provision for federal or state income tax or federal excise tax is required.
Tax positions taken or expected to be taken in the course of preparing the Funds’ tax returns are evaluated to determine whether the tax positions are “more-likely-than-not” of being sustained by the applicable tax authority. Tax positions not deemed to meet the more-likely-than-not threshold would be recorded as a tax benefit or expense in the current year. Management has analyzed the Funds’ tax positions taken, or to be taken, on U.S. federal income tax returns for all open tax years, and has concluded that no provision for income tax is required in the Funds’ financial statements. The Funds’ U.S. federal income tax returns are subject to examination by the Internal Revenue Service (“IRS”) for a period of three years after they are filed.
90 | THE RYDEX FUNDS ANNUAL REPORT | |
NOTES TO FINANCIAL STATEMENTS (continued) |
The tax character of distributions paid during the year ended March 31, 2020 was as follows:
Fund | | Ordinary
Income | | | Long-Term
Capital Gain | | | Total
Distributions | |
S&P 500® 2x Strategy Fund | | $ | 3,007,510 | | | $ | — | | | $ | 3,007,510 | |
Inverse S&P 500® 2x Strategy Fund | | | 70,316 | | | | — | | | | 70,316 | |
NASDAQ-100® 2x Strategy Fund | | | 23,527,663 | | | | — | | | | 23,527,663 | |
Inverse NASDAQ-100® 2x Strategy Fund | | | 4,376 | | | | — | | | | 4,376 | |
Dow 2x Strategy Fund | | | 1,033,100 | | | | 419,397 | | | | 1,452,497 | |
Inverse Dow 2x Strategy Fund | | | 11,887 | | | | — | | | | 11,887 | |
Russell 2000® 2x Strategy Fund | | | 134,211 | | | | — | | | | 134,211 | |
Inverse Russell 2000® 2x Strategy Fund | | | 69,520 | | | | — | | | | 69,520 | |
There were no distributions paid by the Funds during the year ended March 31, 2019.
Note: For U.S. federal income tax purposes, short-term capital gain distributions are treated as ordinary income distributions.
The tax components of distributable earnings/(loss) as of March 31, 2020 were as follows:
Fund | | Undistributed
Ordinary
Income | | | Undistributed
Long-Term
Capital Gain | | | Net Unrealized
Appreciation
(Depreciation) | | | Accumulated
Capital and
Other Losses | | | Total | |
S&P 500® 2x Strategy Fund | | $ | — | | | $ | — | | | $ | (23,102,965 | ) | | $ | (14,637,228 | ) | | $ | (37,740,193 | ) |
Inverse S&P 500® 2x Strategy Fund | | | — | | | | — | | | | 8,836 | | | | (192,416,725 | ) | | | (192,407,889 | ) |
NASDAQ-100® 2x Strategy Fund | | | — | | | | — | | | | 42,496,472 | | | | (3,942,550 | ) | | | 38,553,922 | |
Inverse NASDAQ-100® 2x Strategy Fund | | | 18,439 | | | | — | | | | 239,913 | | | | (113,505,809 | ) | | | (113,247,457 | ) |
Dow 2x Strategy Fund | | | — | | | | — | | | | (875,778 | ) | | | (8,765,055 | ) | | | (9,640,833 | ) |
Inverse Dow 2x Strategy Fund | | | 2,622 | | | | — | | | | (195,477 | ) | | | (38,875,600 | ) | | | (39,068,455 | ) |
Russell 2000® 2x Strategy Fund | | | — | | | | — | | | | 261,064 | | | | (9,631,838 | ) | | | (9,370,774 | ) |
Inverse Russell 2000® 2x Strategy Fund | | | — | | | | — | | | | 407,664 | | | | (57,337,153 | ) | | | (56,929,489 | ) |
For U.S. federal income tax purposes, capital loss carryforwards represent realized losses of the Funds that may be carried forward and applied against future capital gains. Under the RIC Modernization Act of 2010, the Funds are permitted to carry forward capital losses incurred in taxable years beginning after December 22, 2010 for an unlimited period and such capital loss carryforwards will retain their character as either short-term or long-term capital losses. As of March 31, 2020, capital loss carryforwards for the Funds were as follows:
| | | Unlimited | | | | | |
Fund | | Short-Term | | | Long-Term | | | Total
Capital Loss
Carryforward | |
Inverse S&P 500® 2x Strategy Fund | | $ | (169,534,010 | ) | | $ | (22,871,725 | ) | | $ | (192,405,735 | ) |
Inverse NASDAQ-100® 2x Strategy Fund | | | (107,377,235 | ) | | | (6,128,574 | ) | | | (113,505,809 | ) |
Inverse Dow 2x Strategy Fund | | | (34,665,871 | ) | | | (4,209,729 | ) | | | (38,875,600 | ) |
Inverse Russell 2000® 2x Strategy Fund | | | (50,970,598 | ) | | | (6,346,739 | ) | | | (57,317,337 | ) |
For the year ended March 31, 2020, the following capital loss carryforward amounts were utilized:
Fund | | Utilized | |
Inverse Dow 2x Strategy Fund | | $ | 1,047,287 | |
Inverse Russell 2000® 2x Strategy Fund | | | 3,918,282 | |
| | THE RYDEX FUNDS ANNUAL REPORT | 91 |
NOTES TO FINANCIAL STATEMENTS (continued) |
Net investment income and net realized gains (losses) may differ for financial statement and tax purposes because of temporary or permanent book/tax differences. These differences are primarily due to losses deferred due to wash sales, distributions in connection with redemption of fund shares, investments in real estate investment trusts, and the “mark-to-market,” recharacterization, or disposition of certain Passive Foreign Investment Companies (PFICs). Additional differences may result from the tax treatment of net operating losses, the “mark-to-market” of certain derivatives, and the tax treatment of bond premium/discount amortization. To the extent these differences are permanent and would require a reclassification between Paid in Capital and Total Distributable Earnings (Loss), such reclassifications are made in the period that the differences arise. These reclassifications have no effect on net assets or NAV per share.
The following adjustments were made on the Statements of Assets and Liabilities as of March 31, 2020 for permanent book/tax differences:
Fund | | Paid In
Capital | | | Total
Distributable
Earnings/(Loss) | |
S&P 500® 2x Strategy Fund | | $ | 20,832,843 | | | $ | (20,832,843 | ) |
NASDAQ-100® 2x Strategy Fund | | | 36,238,817 | | | | (36,238,817 | ) |
Dow 2x Strategy Fund | | | 3,621,783 | | | | (3,621,783 | ) |
Russell 2000® 2x Strategy Fund | | | (95 | ) | | | 95 | |
At March 31, 2020, the cost of investments for U.S. federal income tax purposes, the aggregate gross unrealized appreciation for all investments for which there was an excess of value over tax cost and the aggregate gross unrealized depreciation for all investments for which there was an excess of tax cost over value, were as follows:
Fund | | Tax
Cost | | | Tax
Unrealized
Appreciation | | | Tax
Unrealized
Depreciation | | | Net
Unrealized
Appreciation/
(Depreciation) | |
S&P 500® 2x Strategy Fund | | $ | 98,327,675 | | | $ | — | | | $ | (23,102,965 | ) | | $ | (23,102,965 | ) |
Inverse S&P 500® 2x Strategy Fund | | | 68,405,901 | | | | 1,561,563 | | | | (1,552,727 | ) | | | 8,836 | |
NASDAQ-100® 2x Strategy Fund | | | 220,150,269 | | | | 49,355,564 | | | | (6,859,092 | ) | | | 42,496,472 | |
Inverse NASDAQ-100® 2x Strategy Fund | | | 10,480,257 | | | | 296,565 | | | | (56,652 | ) | | | 239,913 | |
Dow 2x Strategy Fund | | | 16,512,903 | | | | 971,667 | | | | (1,847,445 | ) | | | (875,778 | ) |
Inverse Dow 2x Strategy Fund | | | 7,654,157 | | | | 128,435 | | | | (323,912 | ) | | | (195,477 | ) |
Russell 2000® 2x Strategy Fund | | | 10,416,347 | | | | 359,502 | | | | (98,438 | ) | | | 261,064 | |
Inverse Russell 2000® 2x Strategy Fund | | | 19,808,466 | | | | 570,093 | | | | (162,429 | ) | | | 407,664 | |
Pursuant to U.S. federal income tax regulations applicable to regulated investment companies, the Funds have elected to treat net capital losses and certain ordinary losses realized between November 1 and March 31 of each year as occurring on the first day of the following tax year. The Funds have also elected to treat certain ordinary losses realized between January 1 and March 31 of each year as occurring on the first day of the following tax year. For the year ended March 31, 2020, the following losses reflected in the accompanying financial statements were deferred for U.S. federal income tax purposes until April 1, 2020:
Fund | | Ordinary | | | Capital | |
S&P 500® 2x Strategy Fund | | $ | — | | | $ | (14,637,228 | ) |
Inverse S&P 500® 2x Strategy Fund | | | (10,990 | ) | | | — | |
NASDAQ-100® 2x Strategy Fund | | | — | | | | (3,942,550 | ) |
Dow 2x Strategy Fund | | | — | | | | (8,765,055 | ) |
Russell 2000® 2x Strategy Fund | | | — | | | | (9,631,838 | ) |
Inverse Russell 2000® 2x Strategy Fund | | | (19,816 | ) | | | — | |
92 | THE RYDEX FUNDS ANNUAL REPORT | |
NOTES TO FINANCIAL STATEMENTS (continued) |
Note 9 – Securities Transactions
For the year ended March 31, 2020, the cost of purchases and proceeds from sales of investment securities, excluding government securities, short-term investments and derivatives, were as follows:
Fund | | Purchases | | | Sales | |
S&P 500® 2x Strategy Fund | | $ | 360,573,072 | | | $ | 412,076,778 | |
NASDAQ-100® 2x Strategy Fund | | | 865,244,793 | | | | 1,004,353,908 | |
Dow 2x Strategy Fund | | | 42,727,250 | | | | 63,869,497 | |
Russell 2000® 2x Strategy Fund | | | 10,881,440 | | | | 16,623,745 | |
The Funds are permitted to purchase or sell securities from or to certain affiliated funds under specified conditions outlined in procedures adopted by the Board. The procedures have been designed to ensure that any purchase or sale of securities by a Fund from or to another fund or portfolio that is or could be considered an affiliate by virtue of having a common investment adviser (or affiliated investment advisers), common trustees and/or common officers complies with Rule 17a-7 of the 1940 Act. Further, as defined under these procedures, each transaction is effected at the current market price to save costs, where permissible. For the year ended March 31, 2020, the Funds engaged in purchases and sales of securities, pursuant to Rule 17a-7 of the 1940 Act, as follows:
Fund | | Purchases | | | Sales | | | Realized
Gain (Loss) | |
S&P 500® 2x Strategy Fund | | $ | 173,893,992 | | | $ | 149,119,079 | | | $ | 3,665,358 | |
Inverse S&P 500® 2x Strategy Fund | | | 4,999,125 | | | | — | | | | — | |
NASDAQ-100® 2x Strategy Fund | | | 293,258,874 | | | | 189,223,746 | | | | (2,431,805 | ) |
Dow 2x Strategy Fund | | | 21,560,075 | | | | 16,448,907 | | | | (113,873 | ) |
Russell 2000® 2x Strategy Fund | | | 10,960,460 | | | | 5,252,077 | | | | (105,253 | ) |
Inverse Russell 2000® 2x Strategy Fund | | | — | | | | 500,078 | | | | 161 | |
Note 10 – Line of Credit
The Trust, along with other affiliated trusts, secured an uncommitted $75,000,000 line of credit from U.S. Bank, N.A., which expires June 8, 2020. On March 30, 2020, the Board approved increasing the line of credit from $75,000,000 to $150,000,000. This line of credit is reserved for emergency or temporary purposes. Borrowings, if any, under this arrangement bear interest equal to the Prime Rate, minus 2%, which shall be paid monthly, averaging 3.02% for the year ended March 31, 2020. The Funds did not have any borrowings outstanding under this agreement at March 31, 2020.
The average daily balances borrowed for the year ended March 31, 2020, were as follows:
Fund | | Average Balance | |
S&P 500® 2x Strategy Fund | | $ | 3,309 | |
Inverse S&P 500® 2x Strategy Fund | | | 3,615 | |
NASDAQ-100® 2x Strategy Fund | | | 24,210 | |
Dow 2x Strategy Fund | | | 2,699 | |
Russell 2000® 2x Strategy Fund | | | 50,265 | |
Note 11 – Legal Proceedings
Tribune Company
Rydex Dynamic Funds has been named as a defendant and a putative member of the proposed defendant class of shareholders in the case entitled Kirschner v. FitzSimons, No. 12-2652 (S.D.N.Y.) (formerly Official Committee of Unsecured Creditors of Tribune Co. v. FitzSimons, Adv. Pro. No. 10-54010 (Bankr. D. Del.)) (the “FitzSimons action”), as a result of ownership by certain series of the Rydex Dynamic Funds of shares in the Tribune Company (“Tribune”) in 2007, when Tribune effected a leveraged buyout transaction (“LBO”) by which Tribune converted to a privately-held company. In his complaint, the plaintiff has alleged that, in connection with the LBO, Tribune insiders and shareholders were overpaid for their Tribune stock using financing that the insiders knew would, and ultimately did, leave Tribune insolvent. The
| | THE RYDEX FUNDS ANNUAL REPORT | 93 |
NOTES TO FINANCIAL STATEMENTS (continued) |
plaintiff has asserted claims against certain insiders, major shareholders, professional advisers, and others involved in the LBO. The plaintiff is also attempting to obtain from former Tribune shareholders, including the Rydex Dynamic Funds, the proceeds they received in connection with the LBO.
In June 2011, a group of Tribune creditors filed multiple actions against former Tribune shareholders involving state law constructive fraudulent conveyance claims arising out of the 2007 LBO (the “SLCFC actions”). Rydex Dynamic Funds has been named as a defendant in one or more of these suits. In those actions, the creditors seek to recover from Tribune’s former shareholders the proceeds received in connection with the 2007 LBO.
The FitzSimons action and the SLCFC actions have been consolidated with the majority of the other Tribune LBO-related lawsuits in a multidistrict litigation proceeding captioned In re Tribune Company Fraudulent Conveyance Litig., No. 11-md-2296 (S.D.N.Y.) (the “MDL Proceeding”).
On September 23, 2013, the District Court granted the defendants’ omnibus motion to dismiss the SLCFC actions, on the basis that the creditors lacked standing. On September 30, 2013, the creditors filed a notice of appeal of the September 23 order. On October 28, 2013, the defendants filed a joint notice of cross-appeal of that same order.
On March 29, 2016, the U.S. Court of Appeals for the Second Circuit issued its opinion on the appeal of the SLCFC actions. The appeals court affirmed the district court’s dismissal of those lawsuits, but on different grounds than the district court. The appeals court held that while the plaintiffs have standing under the U.S. Bankruptcy Code, their claims were preempted by Section 546(e) of the Bankruptcy Code—the statutory safe harbor for settlement payments.
On April 12, 2016, the Plaintiffs in the SLCFC actions filed a petition seeking rehearing en banc before the appeals court. On July 22, 2016, the appeals court denied the petition. On September 9, 2016, the plaintiffs filed a petition for writ of certiorari in the U.S. Supreme Court challenging the Second Circuit’s decision that the safe harbor of Section 546(e) applied to their claims. The shareholder defendants, including the Funds, filed a joint brief in opposition to the petition for certiorari on October 24, 2016. On April 3, 2018, Justice Kennedy and Justice Thomas issued a “Statement” related to the petition for certiorari suggesting that the Second Circuit and/or District Court may want to take steps to reexamine the application of the Section 546(e) safe harbor to the previously dismissed state law constructive fraudulent transfer claims based on the Supreme Court’s decision in Merit Management Group LP v. FTI Consulting, Inc. On April 10, 2018, Plaintiffs filed in the Second Circuit a motion for that court to recall its mandate, vacate its prior decision, and remand to the district court for further proceedings consistent with Merit Management. On April 20, 2018, the shareholder defendants filed an opposition to Plaintiffs’ motion to recall the mandate. On May 15, 2018, the Second Circuit issued an order recalling the mandate “in anticipation of further panel review.” On December 19, 2019, the Second Circuit issued an amended opinion that again affirmed the district court’s ruling on the basis that plaintiffs’ claims were preempted by Section 546(e) of the Bankruptcy Code. Plaintiffs filed a motion for rehearing and rehearing en banc on January 2, 2020. The Second Circuit denied the petition on February 6, 2020.
On May 23, 2014, the defendants filed motions to dismiss the FitzSimons action, including a global motion to dismiss Count I, which is the claim brought against former Tribune shareholders for intentional fraudulent conveyance under U.S. federal law. On January 6, 2017, the United States District Court for the Southern District of New York granted the shareholder defendants’ motion to dismiss the intentional fraudulent conveyance claim in the FitzSimons action. In dismissing the intentional fraudulent conveyance claim, the Court denied the plaintiff’s request to amend the complaint. The plaintiff requested that the Court direct entry of a final judgment in order to make the order immediately appealable. On February 23, 2017, the Court issued an order stating that it intends to permit an interlocutory appeal of the dismissal order, but would wait to do so until it has resolved outstanding motions to dismiss filed by other defendants.
On July 18, 2017, the plaintiff submitted a letter to the District Court seeking leave to amend its complaint to add a constructive fraudulent transfer claim. The shareholder defendants opposed that request. On August 24, 2017, the Court denied the plaintiff’s request without prejudice to renewal of the request in the event of an intervening change in the law. On March 8, 2018, the plaintiff renewed his request for leave to file a motion to amend the complaint to assert a constructive fraudulent transfer claim based on the Supreme Court’s ruling in Merit Management Group LP v. FTI Consulting, Inc. The shareholder defendants opposed that request. On June 18, 2018, the District Court ordered that the request would be stayed pending further action by the Second Circuit in the SLCFC actions.
94 | THE RYDEX FUNDS ANNUAL REPORT | |
NOTES TO FINANCIAL STATEMENTS (concluded) |
On December 18, 2018, plaintiff filed a letter with the District Court requesting that the stay be dissolved in order to permit briefing on the motion to amend the complaint and indicating plaintiff’s intention to file another motion to amend the complaint to reinstate claims for intentional fraudulent transfer. The shareholder defendants opposed that request. On January 14, 2019, the court held a case management conference, during which the court stated that it would not lift the stay prior to further action from the Second Circuit in the SLCFC actions. The court further stated that it would allow the plaintiff to file a motion to amend to try to reinstate its intentional fraudulent transfer claim. On January 23, 2019, the court ordered the parties still facing pending claims to participate in a mediation, to commence on January 28, 2019. The mediation did not result in a settlement of the claims against the shareholder defendants.
On April 4, 2019, plaintiff filed a motion to amend the Fifth Amended Complaint to assert a federal constructive fraudulent transfer claim against certain shareholder defendants. On April 10, 2019, the shareholder defendants filed a brief in opposition to plaintiff’s motion to amend. On April 12, 2019, the plaintiff filed a reply brief. On April 23, 2019, the court denied the plaintiff’s motion to amend. On June 13, 2019, the court entered judgment pursuant to Rule 54(b). On July 12, 2019, the Plaintiff filed a notice of appeal with respect to the dismissal of his claims and the District Court’s denial of his motion for leave to amend. Plaintiff filed an appellate brief on January 7, 2020. The shareholder defendants’ brief was filed on April 27, 2020.
None of these lawsuits alleges any wrongdoing on the part of Rydex Dynamic Funds. The following series of Rydex Dynamic Funds held shares of Tribune and tendered these shares as part of Tribune’s LBO: S&P 500 2x Strategy Fund (the “Fund”). The value of the proceeds received by the foregoing Fund was $52,020. At this stage of the proceedings, Rydex Dynamic Funds is not able to make a reliable predication as to the outcome of these lawsuits or the effect, if any, on a Fund’s net asset value.
Note 12 – Recent Accounting Pronouncements
In March 2017, the Financial Accounting Standards Board issued an Accounting Standards Update, ASU 2017-08, Receivables – Nonrefundable Fees and Other Costs (Subtopic 310-20), Premium Amortization on Purchased Callable Debt Securities (the “2017 ASU”) which amends the amortization period for certain purchased callable debt securities held at a premium, shortening such period to the earliest call date. The 2017 ASU does not require any accounting change for debt securities held at a discount; the discount continues to be amortized to maturity.
As of April 1, 2019, the Funds have fully adopted the provisions of the 2017 ASU which were applied on a modified retrospective basis, as prescribed. The adoption did not result in a cumulative-effect adjustment as of the beginning of the period and had no impact on total distributable earnings, net assets, the current period results from operations, or any prior period information presented in the financial statements.
Note 13 – COVID-19 and Recent Developments
The global ongoing crisis caused by the outbreak of COVID-19 is causing materially reduced consumer demand and economic output, disrupting supply chains, resulting in market closures, travel restrictions and quarantines, and adversely impacting local and global economies. Investors should be aware that in light of the current uncertainty, volatility and distress in economies, financial markets, and labor and health conditions all over the world, the Funds’ investments and a shareholder’s investment in a Fund are subject to sudden and substantial losses, increased volatility and other adverse events. Firms through which investors invest with the Funds, the Funds, their service providers, the markets in which they invest and market intermediaries are also impacted by quarantines and similar measures intended to contain the ongoing pandemic, which can obstruct their functioning and subject them to heightened operational risks.
Note 14 – Subsequent Events
Share Splits
On May 18, 2020, the Board approved reverse share splits as follows:
Fund | Effective Date | Split Type |
Inverse S&P 500® 2x Strategy Fund | August 14, 2020 | One-for-Five Reverse Split |
Inverse NADSAQ-100® 2x Strategy Fund | August 7, 2020 | One-for-Ten Reverse Split |
Inverse Dow 2x Strategy Fund | August 7, 2020 | One-for-Fifteen Reverse Split |
The Funds evaluated subsequent events through the date the financial statements were available for issue and determined there were no material events other than the one disclosed above, that would require adjustment to or disclosure in the Funds’ financial statements.
| | THE RYDEX FUNDS ANNUAL REPORT | 95 |
REPORT OF INDEPENDENT REGISTERED PUBLIC ACCOUNTING FIRM |
To the Shareholders and the Board of Trustees of Rydex Dynamic Funds
Opinion on the Financial Statements
We have audited the accompanying statements of assets and liabilities of Rydex Dynamic Funds (the “Trust”) (comprising the S&P 500® 2x Strategy Fund, Inverse S&P 500® 2x Strategy Fund, NASDAQ-100® 2x Strategy Fund, Inverse NASDAQ-100® 2x Strategy Fund, Dow 2x Strategy Fund, Inverse Dow 2x Strategy Fund, Russell 2000® 2x Strategy Fund and Inverse Russell 2000® 2x Strategy Fund (collectively referred to as the “Funds”)), including the schedules of investments, as of March 31, 2020, and the related statements of operations for the year then ended, the statements of changes in net assets for each of the two years in the period then ended, the financial highlights for each of the five years in the period then ended and the related notes (collectively referred to as the “financial statements”). In our opinion, the financial statements present fairly, in all material respects, the financial position of each of the Funds comprising Rydex Dynamic Funds at March 31, 2020, the results of their operations for the year then ended, the changes in their net assets for each of the two years in the period then ended and their financial highlights for each of the five years in the period then ended, in conformity with U.S. generally accepted accounting principles.
Basis for Opinion
These financial statements are the responsibility of the Trust’s management. Our responsibility is to express an opinion on each of the Funds’ financial statements based on our audits. We are a public accounting firm registered with the Public Company Accounting Oversight Board (United States) (“PCAOB”) and are required to be independent with respect to the Trust in accordance with the U.S. federal securities laws and the applicable rules and regulations of the Securities and Exchange Commission and the PCAOB.
We conducted our audits in accordance with the standards of the PCAOB. Those standards require that we plan and perform the audit to obtain reasonable assurance about whether the financial statements are free of material misstatement, whether due to error or fraud. The Trust is not required to have, nor were we engaged to perform, an audit of the Trust’s internal control over financial reporting. As part of our audits, we are required to obtain an understanding of internal control over financial reporting but not for the purpose of expressing an opinion on the effectiveness of the Trust’s internal control over financial reporting. Accordingly, we express no such opinion.
Our audits included performing procedures to assess the risks of material misstatement of the financial statements, whether due to error or fraud, and performing procedures that respond to those risks. Such procedures included examining, on a test basis, evidence regarding the amounts and disclosures in the financial statements. Our procedures included confirmation of securities owned as of March 31, 2020, by correspondence with the custodian and brokers or by other appropriate auditing procedures where replies from brokers were not received. Our audits also included evaluating the accounting principles used and significant estimates made by management, as well as evaluating the overall presentation of the financial statements. We believe that our audits provide a reasonable basis for our opinion.

We have served as the auditor of one or more Guggenheim investment companies since 1979.
Tysons, Virginia
May 28, 2020
96 | THE RYDEX FUNDS ANNUAL REPORT | |
OTHER INFORMATION (Unaudited) |
Federal Income Tax Information
This information is being provided as required by the Internal Revenue Code. Amounts shown may differ from those elsewhere in the report because of differences in tax and financial reporting practice.
In January 2021, shareholders will be advised on IRS Form 1099 DIV or substitute 1099 DIV as to the federal tax status of the distributions received by shareholders in the calendar year 2020.
Of the taxable ordinary income distributions paid during the fiscal year ending March 31, 2020, the following funds had the corresponding percentages qualify for the reduced tax rate pursuant to the Jobs and Growth Tax Relief and Reconciliation Act of 2003 or for the dividends received deduction for corporations. See the qualified dividend income and dividend received deduction columns, respectively, in the table below.
Additionally, of the taxable ordinary income distributions paid during the fiscal year ended March 31, 2020, the following funds had the corresponding percentages qualify as interest related dividends and qualified short-term capital gains as permitted by IRC Section 871(k)(1) and IRC Section 871(k)(2), respectively. See qualified interest income and qualified short-term capital gain columns, respectively, in the table below.
Fund | | Qualified
Dividend
Income | | | Dividend
Received
Deduction | | | Qualified
Interest
Income | | | Qualified
Short-Term
Capital Gain | |
S&P 500® 2x Strategy Fund | | | 17.08 | % | | | 16.76 | % | | | 0.00 | % | | | 100.00 | % |
NASDAQ-100® 2x Strategy Fund | | | 12.51 | % | | | 11.16 | % | | | 0.00 | % | | | 100.00 | % |
Dow 2x Strategy Fund | | | 32.82 | % | | | 24.94 | % | | | 5.22 | % | | | 100.00 | % |
Russell 2000® 2x Strategy Fund | | | 20.55 | % | | | 18.73 | % | | | 0.00 | % | | | 100.00 | % |
Inverse Russell 2000® 2x Strategy Fund | | | 0.00 | % | | | 0.00 | % | | | 100.00 | % | | | 0.00 | % |
With respect to the taxable year ended March 31, 2020, the Funds hereby designate as capital gain dividends the amounts listed below, or, if subsequently determined to be different, the net capital gain of such year:
Fund | | From long-term
capital gain: | | | From long-term capital
gain, using proceeds
from shareholder
redemptions: | |
S&P 500® 2x Strategy Fund | | $ | — | | | $ | 12,754,671 | |
NASDAQ-100® 2x Strategy Fund | | | — | | | | 29,279,177 | |
Dow 2x Strategy Fund | | | 419,397 | | | | 2,186,159 | |
Proxy Voting Information
A description of the policies and procedures that the Trust uses to determine how to vote proxies relating to securities held in the Funds’ portfolios is available, without charge and upon request, by calling 800.820.0888. This information is also available from the EDGAR database on the SEC’s website at https://www.sec.gov.
Information regarding how the Funds’ voted proxies relating to portfolio securities during the most recent 12-month period ended June 30 is available without charge, upon request, by calling 800.820.0888. This information is also available from the EDGAR database on the SEC’s website at https://www.sec.gov.
Sector Classification
Information in the Schedule of Investments is categorized by sectors using sector-level Classifications defined by the Bloomberg Industry Classification System, a widely recognized industry classification system provider. Each Fund’s registration statement has investment policies relating to concentration in specific sectors/industries. For purposes of these investment policies, the Funds usually classify sectors/industries based on industry-level Classifications used by widely recognized industry classification system providers such as Bloomberg Industry Classification System, Global Industry Classification Standards and Barclays Global Classification Scheme.
| | THE RYDEX FUNDS ANNUAL REPORT | 97 |
OTHER INFORMATION (Unaudited)(concluded) |
Quarterly Portfolio Schedules Information
The Trust files its complete schedule of portfolio holdings with the SEC for the first and third quarters of each fiscal year as an exhibit to its reports on Form N-PORT, and for reporting periods ended prior to March 31, 2019, filed such information on Form N-Q. The Funds’ Forms N-PORT and N-Q are available on the SEC’s website at https://www.sec.gov. The Funds’ Forms N-PORT and N-Q may be reviewed and copied at the SEC’s Public Reference Room in Washington, DC, and that information on the operation of the Public Reference Room may be obtained by calling 800-SEC-0330. Copies of the portfolio holdings are also available to shareholders, without charge and upon request, by calling 800.820.0888.
98 | THE RYDEX FUNDS ANNUAL REPORT | |
INFORMATION ON BOARD OF TRUSTEES AND OFFICERS (Unaudited) |
A Board of Trustees oversees the Trust, as well as other trusts of GI, in which its members have no stated term of service, and continue to serve after election until resignation. The Statement of Additional Information includes further information about Fund Trustees and Officers, and can be obtained without charge by visiting guggenheiminvestments.com or by calling 800.820.0888.
Name, Address*
and Year of Birth | Position(s)
Held with
Trust | Term of Office
and Length of
Time Served** | Principal Occupation(s)
During Past Five Years | Number of
Portfolios
in Fund
Complex
Overseen | Other
Directorships Held
by Trustees*** |
INDEPENDENT TRUSTEES | | | |
Randall C. Barnes (1951) | Trustee | Since 2019 | Current: Private Investor (2001-present). Former: Senior Vice President and Treasurer, PepsiCo, Inc. (1993-1997); President, Pizza Hut International (1991-1993); Senior Vice President, Strategic Planning and New Business Development, PepsiCo, Inc. (1987-1990). | 157 | Current: Purpose Investments Funds (2013-present). Former: Managed Duration Investment Grade Municipal Fund (2006-2016). |
Angela Brock-Kyle (1959) | Trustee | Since 2016 | Current: Founder and Chief Executive Officer, B.O.A.R.D.S. (2013-present). Former: Senior Leader, TIAA (1987-2012). | 156 | Current: Hunt Companies, Inc. (2019-present). Former: Infinity Property & Casualty Corp. (2014-2018). |
Donald A. Chubb, Jr. (1946) | Trustee and Chair of the Valuation Oversight Committee | Since 2019 | Current: Retired Former: Business broker and manager of commercial real estate, Griffith & Blair, Inc. (1997-2017). | 156 | Former: Midland Care, Inc. (2011-2016). |
Jerry B. Farley (1946) | Trustee | Since 2019 | Current: President, Washburn University (1997-present). | 156 | Current: CoreFirst Bank & Trust (2000-present). Former: Westar Energy, Inc. (2004-2018). |
Roman Friedrich III (1946) | Trustee and Chair of the Contracts Review Committee | Since 2019 | Current: Founder and Managing Partner, Roman Friedrich & Company (1998-present). | 156 | Former: Zincore Metals, Inc. (2009-2019). |
Thomas F. Lydon, Jr. (1960) | Trustee and Vice Chair of the Contracts Review Committee | Since 2005 (Trustee) Since 2019
(Vice Chair of the Contracts Review Committee) | Current: President, Global Trends Investments (1996-present); Co-Chief Executive Officer, ETF Flows, LLC (2019-present); Chief Executive Officer, Lydon Media (2016-present). | 156 | Current: US Global Investors (GROW) (1995-present). Former: Harvest Volatility Edge Trust (3) (2017-2019). |
| | THE RYDEX FUNDS ANNUAL REPORT | 99 |
INFORMATION ON BOARD OF TRUSTEES AND OFFICERS (Unaudited)(continued) |
Name, Address*
and Year of Birth | Position(s)
Held with
Trust | Term of Office
and Length of
Time Served** | Principal Occupation(s)
During Past Five Years | Number of
Portfolios
in Fund
Complex
Overseen | Other
Directorships Held
by Trustees*** |
INDEPENDENT TRUSTEES - concluded | | |
Ronald A. Nyberg (1953) | Trustee and Chair of the Nominating and Governance Committee | Since 2019 | Current: Partner, Momkus LLC (2016-present). Former: Partner, Nyberg & Cassioppi, LLC (2000-2016); Executive Vice President, General Counsel, and Corporate Secretary, Van Kampen Investments (1982-1999). | 157 | Current: PPM Funds (9) (2018-present); Edward-Elmhurst Healthcare System (2012-present). Former: Western Asset Inflation-Linked Opportunities & Income Fund (2004-April 2020); Western Asset Inflation-Linked Income Fund (2003-April 2020); Managed Duration Investment Grade Municipal Fund (2003-2016). |
Sandra G. Sponem (1958) | Trustee and Chair of the Audit Committee | Since 2016 (Trustee) Since 2019 (Chair of the Audit Committee) | Current: Retired. Former: Senior Vice President and Chief Financial Officer, M.A. Mortenson-Companies, Inc. (2007-2017). | 156 | Current: SPDR Series Trust (78) (2018-present); SPDR Index Shares Funds (31) (2018-present); SSGA Active Trust (12) (2018-present); and SSGA Master Trust (1) (2018-present). |
Ronald E. Toupin, Jr. (1958) | Trustee, Chair of the Board and Chair of the Executive Committee | Since 2019 | Current: Portfolio Consultant (2010-present); Member, Governing Council, Independent Directors Council (2013-present); Governor, Board of Governors, Investment Company Institute (2018-present). Former: Member, Executive Committee, Independent Directors Council (2016-2018); Vice President, Manager and Portfolio Manager, Nuveen Asset Management (1998-1999); Vice President, Nuveen Investment Advisory Corp. (1992-1999); Vice President and Manager, Nuveen Unit Investment Trusts (1991-1999); and Assistant Vice President and Portfolio Manager, Nuveen Unit Investment Trusts (1988-1999), each of John Nuveen & Co., Inc. (1982-1999). | 156 | Former: Western Asset Inflation-Linked Opportunities & Income Fund (2004-April 2020); Western Asset Inflation-Linked Income Fund (2003-April 2020); Managed Duration Investment Grade Municipal Fund (2003-2016). |
100 | THE RYDEX FUNDS ANNUAL REPORT | |
INFORMATION ON BOARD OF TRUSTEES AND OFFICERS (Unaudited)(continued) |
Name, Address*
and Year of Birth | Position(s)
Held with
Trust | Term of Office
and Length of
Time Served** | Principal Occupation(s)
During Past Five Years | Number of
Portfolios
in Fund
Complex
Overseen | Other
Directorships Held
by Trustees*** |
INTERESTED TRUSTEE | | | | |
Amy J. Lee**** (1961) | Trustee, Vice President and Chief Legal Officer | Since 2018 (Trustee) Since 2019
(Vice President and Chief Legal Officer) | Current: Interested Trustee, certain other funds in the Fund Complex (2018-present); Chief Legal Officer, certain other funds in the Fund Complex (2014-present); Vice President, certain other funds in the Fund Complex (2007-present); Senior Managing Director, Guggenheim Investments (2012-present). Former: President and Chief Executive Officer, certain other funds in the Fund Complex (2017-2019); Vice President, Associate General Counsel and Assistant Secretary, Security Benefit Life Insurance Company and Security Benefit Corporation (2004-2012). | 156 | None. |
* | The business address of each Trustee is c/o Guggenheim Investments, 227 West Monroe Street, Chicago, Illinois 60606. |
** | Each Trustee serves an indefinite term, until his or her successor is elected and qualified. Time served includes time served in the respective position for the Predecessor Corporation. |
*** | Each Trustee also serves on the boards of trustees of Guggenheim Funds Trust, Guggenheim Variable Funds Trust, Guggenheim Strategy Funds Trust, Fiduciary/Claymore Energy Infrastructure Fund, Guggenheim Taxable Municipal Managed Duration Trust, Guggenheim Strategic Opportunities Fund, Guggenheim Enhanced Equity Income Fund, Guggenheim Energy & Income Fund, Guggenheim Credit Allocation Fund, Rydex Series Funds, Rydex Dynamic Funds, Rydex Variable Funds and Transparent Value Trust. Messrs. Barnes and Nyberg also serve on the board of trustees of Advent Convertible & Income Fund. |
**** | This Trustee is deemed to be an “interested person” of the Funds under the 1940 Act by reason of her position with the Funds’ Investment Manager and/or the parent of the Investment Manager. |
| | THE RYDEX FUNDS ANNUAL REPORT | 101 |
INFORMATION ON BOARD OF TRUSTEES AND OFFICERS (Unaudited)(continued) |
Name, Address*
and Year of Birth | Position(s)
Held with
Trust | Term of Office
and Length of
Time Served** | Principal Occupation(s)
During Past Five Years |
OFFICERS | | | |
Brian E. Binder (1972) | President and Chief Executive Officer | Since 2019 | Current: President and Chief Executive Officer, certain other funds in the Fund Complex (2018-present); President, Chief Executive Officer and Chairman of the Board of Managers, Guggenheim Funds Investment Advisors, LLC (2018-present); President and Chief Executive Officer, Security Investors, LLC (2018-present); Board Member of Guggenheim Partners Fund Management (Europe) Limited (2018-present); Senior Managing Director and Chief Administrative Officer, Guggenheim Investments (2018-present). Former: Managing Director and President, Deutsche Funds, and Head of US Product, Trading and Fund Administration, Deutsche Asset Management (2013-2018); Managing Director, Head of Business Management and Consulting, Invesco Ltd. (2010-2012). |
James M. Howley (1972) | Assistant Treasurer | Since 2016 | Current: Managing Director, Guggenheim Investments (2004-present); Assistant Treasurer, certain other funds in the Fund Complex (2006-present). Former: Manager, Mutual Fund Administration of Van Kampen Investments, Inc. (1996-2004). |
Mark E. Mathiasen (1978) | Secretary | Since 2017 | Current: Secretary, certain other funds in the Fund Complex (2007-present); Managing Director, Guggenheim Investments (2007-present). |
Glenn McWhinnie (1969) | Assistant Treasurer | Since 2016 | Current: Vice President, Guggenheim Investments (2009-present); Assistant Treasurer, certain other funds in the Fund Complex (2016-present). |
Michael P. Megaris (1984) | Assistant Secretary | Since 2018 | Current: Assistant Secretary, certain other funds in the Fund Complex (2014-present); Director, Guggenheim Investments (2012-present). |
Elisabeth Miller (1968) | Chief Compliance Officer | Since 2012 | Current: Chief Compliance Officer, certain other funds in the Fund Complex (2012-present); Senior Managing Director, Guggenheim Investments (2012-present). Vice President, Guggenheim Funds Distributors, LLC (2014-present). Former: Chief Compliance Officer, Security Investors, LLC and Guggenheim Funds Investment Advisors, LLC (2012-2018); Chief Compliance Officer, Guggenheim Distributors, LLC (2009-2014); Senior Manager, Security Investors, LLC (2004-2014); Senior Manager, Guggenheim Distributors, LLC (2004-2014). |
Margaux Misantone (1978) | AML Officer | Since 2017 | Current: Chief Compliance Officer, Security Investors, LLC and Guggenheim Funds Investment Advisors, LLC (2018-present); AML Officer, Security Investors, LLC and certain other funds in the Fund Complex (2017-present); Managing Director, Guggenheim Investments (2015-present). Former: Assistant Chief Compliance Officer, Security Investors, LLC and Guggenheim Funds Investments Advisors, LLC (2015-2018). |
William Rehder (1967) | Assistant Vice President | Since 2018 | Current: Managing Director, Guggenheim Investments (2002-present). |
102 | THE RYDEX FUNDS ANNUAL REPORT | |
INFORMATION ON BOARD OF TRUSTEES AND OFFICERS (Unaudited)(concluded) |
Name, Address*
and Year of Birth | Position(s)
Held with
Trust | Term of Office
and Length of
Time Served** | Principal Occupation(s)
During Past Five Years |
OFFICERS - concluded | |
Kimberly J. Scott (1974) | Assistant Treasurer | Since 2016 | Current: Director, Guggenheim Investments (2012-present); Assistant Treasurer, certain other funds in the Fund Complex (2012-present). Former: Financial Reporting Manager, Invesco, Ltd. (2010-2011); Vice President/Assistant Treasurer, Mutual Fund Administration for Van Kampen Investments, Inc./Morgan Stanley Investment Management (2009-2010); Manager of Mutual Fund Administration, Van Kampen Investments, Inc./Morgan Stanley Investment Management (2005-2009). |
Bryan Stone (1979) | Vice President | Since 2019 | Current: Vice President, certain other funds in the Fund Complex (2014-present); Managing Director, Guggenheim Investments (2013-present). Former: Senior Vice President, Neuberger Berman Group LLC (2009-2013); Vice President, Morgan Stanley (2002-2009). |
John L. Sullivan (1955) | Chief Financial Officer, Chief Accounting Officer and Treasurer | Since 2016 | Current: Chief Financial Officer, Chief Accounting Officer and Treasurer, certain other funds in the Fund Complex (2010-present); Senior Managing Director, Guggenheim Investments (2010-present). Former: Managing Director and Chief Compliance Officer, each of the funds in the Van Kampen Investments fund complex (2004-2010); Managing Director and Head of Fund Accounting and Administration, Morgan Stanley Investment Management (2002-2004); Chief Financial Officer and Treasurer, Van Kampen Funds (1996-2004). |
Jon Szafran (1989) | Assistant Treasurer | Since 2017 | Current: Vice President, Guggenheim Investments (2017-present); Assistant Treasurer, certain other funds in the Fund Complex (2017-present). Former: Assistant Treasurer of Henderson Global Funds and Manager of US Fund Administration, Henderson Global Investors (North America) Inc. (“HGINA”), (2017); Senior Analyst of US Fund Administration, HGINA (2014–2017); Senior Associate of Fund Administration, Cortland Capital Market Services, LLC (2013-2014); Experienced Associate, PricewaterhouseCoopers LLP (2012-2013). |
* | The business address of each officer is c/o Guggenheim Investments, 227 West Monroe Street, Chicago, Illinois 60606. |
** | Each officer serves an indefinite term, until his or her successor is duly elected and qualified. |
| | THE RYDEX FUNDS ANNUAL REPORT | 103 |
GUGGENHEIM INVESTMENTS PRIVACY NOTICE (Unaudited) |
Who We Are
This Privacy Notice describes the data protection practices of Guggenheim Investments. Guggenheim Investments as used herein refers to the affiliated investment management businesses of Guggenheim Partners, LLC: Guggenheim Funds Investment Advisors, LLC, Guggenheim Partners Investment Management, LLC, Guggenheim Funds Distributors, LLC, Security Investors, LLC, Guggenheim Investment Advisors (Europe) Limited, Guggenheim Real Estate, LLC, GS Gamma Advisors, LLC, Guggenheim Partners India Management, LLC, Guggenheim Partners Europe Limited, as well as the funds in the Guggenheim Funds complex (the “Funds”) (“Guggenheim Investments,” “we,” “us,” or “our”).
Guggenheim Partners Investment Management Holdings, LLC, located at 330 Madison Avenue, New York, New York 10017 is the data controller for your information. The affiliates who are also controllers of certain of your information are: Guggenheim Investment Advisors (Europe) Limited, Guggenheim Partners Europe Limited, Guggenheim Partners, LLC, Guggenheim Funds Investment Advisors, LLC, Guggenheim Partners Investment Management, LLC, Guggenheim Funds Distributors, LLC and Security Investors, LLC, as well as the Funds.
Our Commitment to You
Guggenheim Investments considers your privacy our utmost concern. When you become our client or investor, you entrust us with not only your hard-earned money but also with your personal and financial information. Because we have access to your private information, we hold ourselves to the highest standards in its safekeeping and use. We strictly limit how we share your information with others, whether you are a current or former Guggenheim Investments client or investor.
The Information We Collect About You
We collect certain nonpublic personal information about you from information you provide on applications, other forms, our website, and/or from third parties including investment advisors. This information includes Social Security or other tax identification number, assets, income, tax information, retirement and estate plan information, transaction history, account balance, payment history, bank account information, marital status, family relationships, information that we collect on our website through the use of “cookies,” and other personal information that you or others provide to us. We may also collect such information through your inquiries by mail, e-mail or telephone. We may also collect customer due diligence information, as required by applicable law and regulation, through third party service providers.
How We Handle Your Personal Information
The legal basis for using your information as set out in this Privacy Notice is as follows: (a) use of your personal data is necessary to perform our obligations under any contract with you (such as a contract for us to provide financial services to you); or (b) where use of your personal data is not necessary for performance of a contract, use of your personal data is necessary for our legitimate interests or the legitimate interests of others (for example, to enforce the legal terms governing our services, operate and market our website and other services we offer, ensure safe environments for our personnel and others, make and receive payments, prevent fraud and to know the customer to whom we are providing the services). Some processing is done to comply with applicable law.
In addition to the specific uses described above, we also use your information in the following manner:
| | ● | We use your information in connection with servicing your accounts. |
| | ● | We use information to respond to your requests or questions. For example, we might use your information to respond to your customer feedback. |
| | ● | We use information to improve our products and services. We may use your information to make our website and products better. We may use your information to customize your experience with us. |
| | ● | We use information for security purposes. We may use your information to protect our company and our customers. |
| | ● | We use information to communicate with you. For example, we will communicate with you about your account or our relationship. We may contact you about your feedback. We might also contact you about this Privacy Notice. We may also enroll you in our email newsletter. |
104 | THE RYDEX FUNDS ANNUAL REPORT | |
GUGGENHEIM INVESTMENTS PRIVACY NOTICE (Unaudited)(continued) |
| | ● | We use information as otherwise permitted by law, as we may notify you. |
| | ● | Aggregate/Anonymous Data. We may aggregate and/or anonymize any information collected through the website so that such information can no longer be linked to you or your device (“Aggregate/Anonymous Information”). We may use Aggregate/Anonymous Information for any purpose, including without limitation for research and marketing purposes, and may also share such data with any third parties, including advertisers, promotional partners, and sponsors. |
We do not sell information about current or former clients or their accounts to third parties. Nor do we share this information, except when necessary to complete transactions at your request, to make you aware of investment products and services that we or our affiliates offer, or as permitted or required by law.
We provide information about you to companies and individuals not affiliated with Guggenheim Investments to complete certain transactions or account changes, or to perform services for us related to your account. For example, if you ask to transfer assets from another financial institution to Guggenheim Investments, we must provide certain information about you to that company to complete the transaction. We provide the third party with only the information necessary to carry out its responsibilities and only for that purpose. And we require these third parties to treat your private information with the same high degree of confidentiality that we do. To alert you to other Guggenheim Investments products and services, we share your information within our family of affiliated companies. You may limit our sharing with affiliated companies as set out below. We may also share information with any successor to all or part of our business, or in connection with steps leading up to a merger or acquisition. For example, if part of our business was sold we may give customer information as part of that transaction. We may also share information about you with your consent.
We will release information about you if you direct us to do so, if we are compelled by law to do so, or in other circumstances as permitted by law (for example, to protect your account from fraud).
If you close your account(s) or become an inactive client or investor, we will continue to adhere to the privacy policies and practices described in this notice.
Opt-Out Provisions and Your Data Choices
The law allows you to “opt out” of certain kinds of information sharing with third parties. We do not share personal information about you with any third parties that triggers this opt-out right. This means YOU ARE ALREADY OPTED OUT.
When you are no longer our client or investor, we continue to share your information as described in this notice, and you may contact us at any time to limit our sharing by sending an email to CorporateDataPrivacy@GuggenheimPartners.com.
European Union Data Subjects and certain others: In addition to the choices set forth above, residents of the European Union and certain other jurisdictions have certain rights to (1) request access to or rectification or deletion of information we collect about them, (2) request a restriction on the processing of their information, (3) object to the processing of their information, or (4) request the portability of certain information. To exercise these or other rights, please contact us using the contact information below. We will consider all requests and provide our response within the time period stated by applicable law. Please note, however, that certain information may be exempt from such requests in some circumstances, which may include if we need to keep processing your information for our legitimate interests or to comply with a legal obligation. We may request you provide us with information necessary to confirm your identity before responding to your request.
Residents of France and certain other jurisdictions may also provide us with instructions regarding the manner in which we may continue to store, erase and share your information after your death, and where applicable, the person you have designated to exercise these rights after your death.
How We Protect Privacy Online
We take steps to protect your privacy when you use our web site – www.guggenheiminvestments.com – by using secure forms of online communication, including encryption technology, Secure Socket Layer (SSL) protocol, firewalls and user names and passwords. These safeguards vary based on the sensitivity of the information that we collect and store. However, we cannot and do not guarantee that these measures will prevent every unauthorized attempt to access, use, or disclose your information since despite our efforts, no Internet and/or other
| | THE RYDEX FUNDS ANNUAL REPORT | 105 |
GUGGENHEIM INVESTMENTS PRIVACY NOTICE (Unaudited)(concluded) |
electronic transmissions can be completely secure. Our web site uses “http cookies”—tiny pieces of information that we ask your browser to store. We use cookies for session management and security features on the Guggenheim Investments web site. We do not use them to pull data from your hard drive, to learn your e-mail address, or to view data in cookies created by other web sites. We will not share the information in our cookies or give others access to it. See the legal information area on our web site for more details about web site security and privacy features.
How We Safeguard Your Personal Information and Data Retention
We restrict access to nonpublic personal information about you to our employees and in some cases to third parties (for example, the service providers described above) as permitted by law. We maintain strict physical, electronic and procedural safeguards that comply with federal standards to guard your nonpublic personal information.
We keep your information for no longer than necessary for the purposes for which it is processed. The length of time for which we retain information depends on the purposes for which we collected and use it and/or as required to comply with applicable laws. Information may persist in copies made for backup and business continuity purposes for additional time.
International Visitors
If you are not a resident of the United States, please be aware that your information may be transferred to, stored and processed in the United States where our servers are located and our databases are operated. The data protection and other laws of the United States and other countries might not be as comprehensive as those in your country.
In such cases, we ensure that a legal basis for such a transfer exists and that adequate protection is provided as required by applicable law, for example, by using standard contractual clauses or by transferring your data to a jurisdiction that has obtained an adequacy finding. Individuals whose data may be transferred on the basis of standard contractual clauses may contact us as described below.
We’ll Keep You Informed
If you have any questions or concerns about how we treat your personal data, we encourage you to consult with us first. You may also contact the relevant supervisory authority.
We reserve the right to modify this policy at any time and will inform you promptly of material changes. You may access our privacy policy from our web site at www.guggenheiminvestments.com. Should you have any questions regarding our privacy policy, contact us by email at CorporateDataPrivacy@GuggenheimPartners.com.
106 | THE RYDEX FUNDS ANNUAL REPORT | |
This page intentionally left blank.
This page intentionally left blank.
This page intentionally left blank.
Item 2. Code of Ethics.
The registrant’s Board of Trustees has adopted a code of ethics that applies to the registrant’s principal executive officer and principal financial officer. No substantive amendments were approved or waivers were granted to the Code during the period covered by this report. The Code is filed as an exhibit to this Form N-CSR.
Item 3. Audit Committee Financial Expert.
The registrant's Board of Trustees has determined that it has at least one audit committee financial expert serving on its audit committee (the “Audit Committee”), Sandra G. Sponem. Ms. Sponem is “independent,” meaning that she is not an “interested person” of the Registrant (as that term is defined in Section 2(a)(19) of the Investment Company Act of 1940, as amended) and she does not accept any consulting, advisory, or other compensatory fee from the Registrant (except in her capacity as a Board or committee member).
Under applicable securities laws, a person who is determined to be an audit committee financial expert will not be deemed an "expert" for any purpose, including without limitation for the purposes of Section 11 of the Securities Act of 1933, as a result of being designated or identified as an audit committee financial expert. The designation or identification of a person as an audit committee financial expert does not impose on such person any duties, obligations, or liabilities that are greater than the duties, obligations, and liabilities imposed on such person as a member of the audit committee and Board of Trustees in the absence of such designation or identification.
Item 4. Principal Accountant Fees and Services.
(a) Audit Fees. The aggregate Audit Fees billed by the registrant’s principal accountant for professional services rendered for the audit of the annual financial statements or services that are normally provided by the accountant in connection with statutory and regulatory filings or engagements for the fiscal years ended March 31, 2020 and March 31, 2019 were $149,657 and $146,006, respectively.
(b) Audit Related Fees. The aggregate Audit-Related Fees billed by the registrant’s principal accountant for assurance and related services that are reasonably related to the performance of the audit of the registrant’s financial statements and are not reported under paragraph (a) of this Item for the fiscal years ended March 31, 2020 and March 31, 2019 were $0 and $0, respectively.
(c) Tax Fees: The aggregate Tax Fees billed by the registrant’s principal accountant for professional services rendered for tax compliance, tax advice, and tax planning, including preparation of tax returns and distribution assistance, for the fiscal years ended March 31, 2020 and March 31, 2019 were $68,894 and $74,464, respectively. These services consisted of (i) preparation of U.S. federal, state and excise tax returns; (ii) U.S. federal and state tax planning, advice and assistance regarding statutory, regulatory or administrative developments, (iii) tax advice regarding tax qualification matters and/or treatment of various financial instruments held or proposed to be acquired and (iv) review of U.S. federal excise distribution calculations.
(d) All Other Fees. The aggregate All Other Fees billed by the registrant’s principal accountant for products and services provided by the principal accountant, other than the services reported in paragraphs (a) through (c) of this Item, for the fiscal years ended March 31, 2020 and March 31, 2019 were $0 and $0, respectively.
(e) Audit Committee Pre-Approval Policies and Procedures.
(1) The registrant’s audit committee reviews, and in its sole discretion, pre-approves, pursuant to written pre-approval procedures (A) all engagements for audit and non-audit services to be provided by the principal accountant to the registrant and (B) all engagements for non-audit services to be provided by the principal accountant (1) to the registrant’s investment adviser (not including a sub-adviser whose role is primarily portfolio management and is subcontracted or overseen by another investment adviser) and (2) to any entity controlling, controlled by or under common control with the registrant’s investment adviser that provides ongoing services to the registrant; but in the case of the services described in subsection (B)(1) or (2), only if the engagement relates directly to the operations and financial reporting of the registrant; provided that such pre-approval need not be obtained in circumstances in which the preapproval requirement is waived under rules promulgated by the Securities and Exchange Commission or New York Stock Exchange listing standards. Sections V.B.2 and V.B.3 of the registrant’s audit committee’s Audit Committee Charter contain the Audit Committee’s Pre-Approval Policies and Procedures and such sections are included below.
V.B.2.Pre-approve any engagement of the independent auditors to provide any non-prohibited services to the Fund, including the fees and other compensation to be paid to the independent auditors (unless an exception is available under Rule 2-01 of Regulation S-X).
(a) The categories of services to be reviewed and considered for pre-approval include the following (collectively, “Identified Services”):
Audit Services
• Annual financial statement audits
• Seed audits (related to new product filings, as required)
• SEC and regulatory filings and consents
Audit-Related Services
• Accounting consultations
• Fund merger/reorganization support services
• Other accounting related matters
• Agreed upon procedures reports
• Attestation reports
• Other internal control reports
Tax Services
• Recurring tax services:
o Preparation of Federal and state income tax returns, including extensions
o Preparation of calculations of taxable income, including fiscal year tax designations
o Preparation of annual Federal excise tax returns (if applicable)
o Preparation of calendar year excise distribution calculations
o Calculation of tax equalization on an as-needed basis
o Preparation of the estimated excise distribution calculations on an as-needed basis
o Preparation of quarterly Federal, state and local and franchise tax estimated tax payments on an as-needed basis
o Preparation of state apportionment calculations to properly allocate Fund taxable income among the states for state tax filing
purposes
o Provision of tax compliance services in India for Funds with direct investments in India
o Assistance with management’s identification of passive foreign investment companies (PFICs) for tax purposes
• Permissible non-recurring tax services upon request:
o Assistance with determining ownership changes which impact a Fund’s utilization of loss carryforwards
o Assistance with calendar year shareholder reporting designations on Form 1099
o Assistance with corporate actions and tax treatment of complex securities and structured products
o Assistance with IRS ruling requests and calculation of deficiency dividends
o Conduct training sessions for the Adviser’s internal tax resources
o Assistance with Federal, state, local and international tax planning and advice regarding the tax consequences of proposed or actual transactions
o Tax services related to amendments to Federal, state and local returns and sales and use tax compliance
o RIC qualification reviews
o Tax distribution analysis and planning
o Tax authority examination services
o Tax appeals support services
o Tax accounting methods studies
o Fund merger, reorganization and liquidation support services
o Tax compliance, planning and advice services and related projects
(b) The Committee has pre-approved Identified Services for which the estimated fees are less than $25,000.
(c) For Identified Services with estimated fees of $25,000 or more, but less than $50,000, the Chair or any member of the Committee designated by the Chair is hereby authorized to pre-approve such services on behalf of the Committee.
(d) For Identified Services with estimated fees of $50,000 or more, such services require pre-approval by the Committee.
(e) All requests for Identified Services to be provided by the independent auditor that were pre-approved by the Committee shall be submitted to the Chief Accounting Officer (“CAO”) of the Trust by the independent auditor using the pre-approval request form attached as Appendix C to the Audit Committee Charter. The Trust’s CAO will determine whether such services are included within the list of services that have received the general preapproval of the Committee.
(f) The independent auditors or the CAO of the Trust (or an officer of the Trust who reports to the CAO) shall report to the Committee at each of its regular quarterly meetings all audit, audit-related and permissible non-audit services initiated since the last such report (unless the services were contained in the initial audit plan, as previously presented to, and approved by, the Committee). The report shall include a general description of the services and projected fees, and the means by which such services were approved by the Committee (including the particular category of Identified Services under which pre-approval was obtained).
V.B.3. Pre-approve any engagement of the independent auditors, including the fees and other compensation to be paid to the independent auditors, to provide any non-audit services to the Adviser (or any “control affiliate” of the Adviser providing ongoing services to the Trust), if the engagement relates directly to the operations and financial reporting of the Trust (unless an exception is available under Rule 2-01 of Regulation S-X).
(a) The Chair or any member of the Committee designated by the Chair may grant the pre-approval for non-audit services to the Adviser (or any “control affiliate” of the Adviser providing ongoing services to the Trust) relating directly to the operations and financial reporting of the Trust for which the estimated fees are less than $25,000. All such delegated pre-approvals shall be presented to the Committee no later than the next Committee meeting.
(b) For non-audit services to the Adviser (or any “control affiliate” of the Adviser providing ongoing services to the Trust) relating directly to the operations and financial reporting of the Trust for which the estimated fees are $25,000 or more, such services require pre-approval by the Committee.
(2) None of the services described in each of Items 4(b) through (d) were approved by the Audit Committee pursuant to paragraph (c)(7)(i)(C) of Rule 2-01 of Regulation S-X.
(f) Not applicable.
(g) Non-Audit Fees. The aggregate non-audit fees billed by the registrant’s accountant for the most recent fiscal year and the preceding fiscal year for services rendered to the registrant, the investment advisor, and any entity controlling, controlled by, or under common control with the advisor that provides ongoing services to the registrant were $68,894 and $74,464, respectively. These aggregate fees were less than the aggregate fees billed for the same periods by the registrant’s principal accountant for audit services rendered to the registrant, the investment advisor, and any entity controlling, controlled by, or under common control with the advisor that provides ongoing services to the registrant.
(h) Not applicable.
Item 5. Audit Committee of Listed Registrants.
Not applicable.
Item 6. Investments.
Schedule of Investments is included as part of the report to shareholders filed under Item 1 of this form.
Item 7. Disclosure of Proxy Voting Policies and Procedures for Closed-End Management Investment Companies.
Not applicable.
Item 8. Portfolio Managers of Closed-End Management Investment Companies.
Not applicable.
Item 9. Purchases of Equity Securities by Closed-End Management Investment Company and Affiliated Purchasers.
Not applicable.
Item 10. Submission of Matters to a Vote of Security Holders.
Not applicable.
Item 11. Controls and Procedures.
| (a) | The registrant’s President (principal executive officer) and Treasurer (principal financial officer) have evaluated the registrant’s disclosure controls and procedures within 90 days of this filing and have concluded that the registrant’s disclosure controls and procedures were effective as of that date in ensuring that information required to be disclosed by the registrant in this Form N-CSR was recorded, processed, summarized, and reported timely. |
| (b) | The registrant’s principal executive officer and principal financial officer are aware of no change in the registrant’s internal control over financial reporting that occurred during the period covered by this report that has materially affected, or is reasonably likely to materially affect, the registrant’s internal control over financial reporting. |
Item 12. Disclosure of Securities Lending Activities for Closed-End Management Investment Companies.
Not Applicable.
Item 13. Exhibits.
(a)(1) The registrant’s code of ethics pursuant to Item 2 of Form N-CSR is attached.
(a)(2) Separate certifications by the President (principal executive officer) and Treasurer (principal financial officer) of the registrant as required by Rule 30a-2(a) under the Act (17 CFR 270.30a-2(a)) are attached.
(b) A certification by the registrant’s President (principal executive officer) and Treasurer (principal financial officer) as required by Rule 30a-2(b) under the Act (17 CFR 270.30a-2(b)) is attached.
SIGNATURES
Pursuant to the requirements of the Securities Exchange Act of 1934 and the Investment Company Act of 1940, the registrant has duly caused this report to be signed on its behalf by the undersigned, thereunto duly authorized.
| (Registrant) | Rydex Dynamic Funds | |
| | | |
| By (Signature and Title)* | /s/ Brian E. Binder | |
| | Brian E. Binder, President and Chief Executive Officer | |
| | | |
| Date | June 9, 2020 | |
Pursuant to the requirements of the Securities Exchange Act of 1934 and the Investment Company Act of 1940, this report has been signed below by the following persons on behalf of the registrant and in the capacities and on the dates indicated.
| By (Signature and Title)* | /s/ Brian E. Binder | |
| | Brian E. Binder, President and Chief Executive Officer | |
| | | |
| Date | June 9, 2020 | |
| | | |
| By (Signature and Title)* | /s/ John L. Sullivan | |
| | John L. Sullivan, Chief Financial Officer, Chief Accounting Officer and Treasurer | |
| | | |
| Date | June 9, 2020 | |
| * | Print the name and title of each signing officer under his or her signature. |
