Table of Contents
UNITED STATES
SECURITIES AND EXCHANGE COMMISSION
Washington, D.C. 20549
FORMN-CSR
CERTIFIED SHAREHOLDER REPORT OF
REGISTERED MANAGEMENT INVESTMENT COMPANIES
Investment Company Act file number811-09537
MFS CALIFORNIA MUNICIPAL FUND
(Exact name of registrant as specified in charter)
111 Huntington Avenue, Boston, Massachusetts 02199
(Address of principal executive offices) (Zip code)
Christopher R. Bohane
Massachusetts Financial Services Company
111 Huntington Avenue
Boston, Massachusetts 02199
(Name and address of agents for service)
Registrant’s telephone number, including area code: (617)954-5000
Date of fiscal year end: November 30
Date of reporting period: May 31, 2019
Table of Contents
| ITEM 1. | REPORTS TO STOCKHOLDERS. |
Table of Contents
Semiannual Report
May 31, 2019

MFS® California Municipal Fund

Beginning on January 1, 2021, as permitted by regulations adopted by the U.S. Securities and Exchange Commission, paper copies of the fund’s annual and semiannual shareholder reports will no longer be sent by mail, unless you specifically request paper copies of the reports. Instead, the complete reports will be made available on the fund’s Web site, and you will be notified by mail each time a report is posted and provided with a Web site link to access the report.
If you are already signed up to receive shareholder reports by email, you will not be affected by this change and you need not take any action. You may sign up to receive shareholder reports and other communications from the fund by email by contacting your financial intermediary (such as a broker-dealer or bank) or, if you hold your shares directly with the fund, by calling 1-800-637-2304 or by logging into your Investor Center account at www.computershare.com/investor.
Beginning on January 1, 2019, you may elect to receive all future reports in paper free of charge. Contact your financial intermediary to request that you continue to receive paper copies of your shareholder reports. If you invest directly with the fund, you can call 1-800-637-2304 to let the fund know that you wish to continue receiving paper copies of your shareholder reports. Your election to receive reports in paper will apply to all funds held in your account if you invest through your financial intermediary or all funds held with the MFS fund complex if you invest directly.
CCA-SEM
Table of Contents
MFS® California Municipal Fund
NYSE American Symbol:CCA
NOT FDIC INSURED• MAY LOSE VALUE• NO BANK GUARANTEE
Table of Contents

LETTER FROM THE EXECUTIVE CHAIRMAN
Dear Shareholders:
Markets experienced a bout of volatility in late 2018 as a result of higher interest rates, international trade friction, and geopolitical uncertainty surrounding issues such as
Brexit. Those concerns dissipated in the early months of 2019 due to the more dovish posture of the U.S. Federal Reserve and other global central banks, reported progress toward a trade pact between the United States and China, and action against ano-deal Brexit by the British Parliament. However, a last-minute breakdown in negotiations between the U.S. and China derailed the market’s momentum and increased concerns over the future pace of global growth. Compounding Brexit uncertainty was the resignation of British Prime Minister Theresa May, potentially ushering in a harder form of Brexit than she had advocated. U.S. equities have continued to outperform their global peers due in
part to fiscal stimulus undertaken in late 2017 and early 2018, which contributed to the continuation of relatively healthy levels of U.S. economic output against a backdrop of slower global growth. Inflation remains largely subdued globally, which is encouraging for asset markets. Rising incomes in many developed and emerging markets are supportive of gains in consumption, though a challenging environment for global trade has hindered manufacturing in most regions. Interest rates have fallen as a result of these challenges, and easier central bank policies are anticipated by markets.
Since launching the first U.S.open-end mutual fund in 1924, MFS® has been committed to a single purpose: to create value by allocating capital responsibly for clients. Through our powerful global investment platform, we combine collective expertise, thoughtful risk management, and long-term discipline to uncover what we believe are the best investment opportunities in the market.
Respectfully,

Robert J. Manning
Executive Chairman
MFS Investment Management
July 17, 2019
The opinions expressed in this letter are subject to change and may not be relied upon for investment advice. No forecasts can be guaranteed.
1
Table of Contents
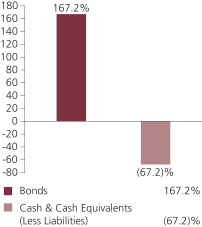
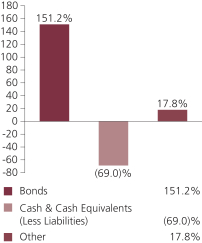
Portfolio structure at value
| Top five industries reflecting equivalent exposure of derivative positions (i) |
| |||
| General Obligations – Schools | 42.2% | |||
| Healthcare Revenue – Hospitals | 24.9% | |||
| Airports | 12.5% | |||
| Water & Sewer Utility Revenue | 12.3% | |||
| U.S. Treasury Securities (j) | (17.8)% | |||
| Composition including fixed income credit quality (a)(i) |
| |||
| AAA | 3.7% | |||
| AA | 75.8% | |||
| A | 43.9% | |||
| BBB | 31.9% | |||
| BB | 2.4% | |||
| CC | 0.3% | |||
| C | 2.7% | |||
| D | 2.1% | |||
| Not Rated (j) | (11.6)% | |||
| Cash & Cash Equivalents (Less Liabilities) | (69.0)% | |||
| Other | 17.8% | |||
Portfolio structure reflecting equivalent exposure of derivative positions (i)(j)
| Portfolio facts (i) |
| |||
| Average Duration (d) | 9.8 | |||
| Average Effective Maturity (m) | 17.1 yrs. | |||
| Jurisdiction (i) |
| |||
| California | 159.5% | |||
| Puerto Rico | 6.3% | |||
| New York | 1.8% | |||
| Guam | 1.4% | |||
| U.S. Treasury Securities (j) | (17.8)% | |||
2
Table of Contents
Portfolio Composition – continued
| (a) | For all securities other than those specifically described below, ratings are assigned to underlying securities utilizing ratings from Moody’s, Fitch, and Standard & Poor’s rating agencies and applying the following hierarchy: If all three agencies provide a rating, the middle rating (after dropping the highest and lowest ratings) is assigned; if two of the three agencies rate a security, the lower of the two is assigned. Ratings are shown in the S&P and Fitch scale (e.g., AAA). Securities rated BBB or higher are considered investment grade. All ratings are subject to change. Not Rated includes fixed income securities and fixed income derivatives, which have not been rated by any rating agency. The fund may or may not have held all of these instruments on this date. The fund is not rated by these agencies. |
| (d) | Duration is a measure of how much a bond’s price is likely to fluctuate with general changes in interest rates, e.g., if rates rise 1.00%, a bond with a5-year duration is likely to lose about 5.00% of its value due to the interest rate move. This calculation is based on net assets applicable to common shares as of May 31, 2019. |
| (i) | For purposes of this presentation, the components include the value of securities, and reflect the impact of the equivalent exposure of derivative positions, if any. These amounts may be negative from time to time. Equivalent exposure is a calculated amount that translates the derivative position into a reasonable approximation of the amount of the underlying asset that the portfolio would have to hold at a given point in time to have the same price sensitivity that results from the portfolio’s ownership of the derivative contract. When dealing with derivatives, equivalent exposure is a more representative measure of the potential impact of a position on portfolio performance than value. The bond component will include any accrued interest amounts. |
| (j) | For the purpose of managing the fund’s duration, the fund holds short treasury futures with a bond equivalent exposure of (17.8)%, which reduce the fund’s interest rate exposure but not its credit exposure. |
| (m) | In determining each instrument’s effective maturity for purposes of calculating the fund’s dollar-weighted average effective maturity, MFS uses the instrument’s stated maturity or, if applicable, an earlier date on which MFS believes it is probable that a maturity-shortening device (such as a put,pre-refunding or prepayment) will cause the instrument to be repaid. Such an earlier date can be substantially shorter than the instrument’s stated maturity. This calculation is based on gross assets, which consists of net assets applicable to common shares plus the value of preferred shares, as of May 31, 2019. |
Cash & Cash Equivalents includes any cash, investments in money market funds, short-term securities, and other assets less liabilities. Please see the Statement of Assets and Liabilities for additional information related to the fund’s cash position and other assets and liabilities.
Cash & Cash Equivalents is negative due to the aggregate liquidation value of variable rate municipal term preferred shares.
Other includes equivalent exposure from currency derivatives and/or any offsets to derivative positions.
Percentages are based on net assets applicable to common shares as of May 31, 2019.
The portfolio is actively managed and current holdings may be different.
3
Table of Contents
| Portfolio Manager | Primary Role | Since | Title and Five Year History | |||
| Michael Dawson | Portfolio Manager | 2007 | Investment Officer of MFS; employed in the investment management area of MFS since 1998. | |||
| Geoffrey Schechter | Portfolio Manager | 2007 | Investment Officer of MFS; employed in the investment management area of MFS since 1993. | |||
The fund’s shares may trade at a discount or premium to net asset value. When fund shares trade at a premium, buyers pay more than the net asset value underlying fund shares, and shares purchased at a premium would receive less than the amount paid for them in the event of the fund’s concurrent liquidation.
The fund’s monthly distributions may include a return of capital to shareholders to the extent that distributions are in excess of the fund’s net investment income and net capital gains, determined in accordance with federal income tax regulations. Distributions that are treated for federal income tax purposes as a return of capital will reduce each shareholder’s basis in his or her shares and, to the extent the return of capital exceeds such basis, will be treated as gain to the shareholder from a sale of shares. Returns of shareholder capital may have the effect of reducing the fund’s assets and increasing the fund’s expense ratio.
In accordance with Section 23(c) of the Investment Company Act of 1940, the fund hereby gives notice that it may from time to time repurchase common and/or preferred shares of the fund in the open market at the option of the Board of Trustees and on such terms as the Trustees shall determine.
4
Table of Contents
5/31/19 (unaudited)
The Portfolio of Investments is a complete list of all securities owned by your fund. It is categorized by broad-based asset classes.
| Municipal Bonds - 167.0% | ||||||||
| Issuer | Shares/Par | Value ($) | ||||||
| Airport Revenue - 12.4% | ||||||||
| California Municipal Finance Authority Rev. (LINXS APM Project), “A”, 5%, 12/31/2043 | $ | 340,000 | $ | 394,645 | ||||
| Los Angeles, CA, Department of Airports Rev. (Los Angeles International), “D”, 5%, 5/15/2037 | 195,000 | 239,015 | ||||||
| Los Angeles, CA, Department of Airports Rev. (Los Angeles International), “D”, 5%, 5/15/2038 | 195,000 | 238,331 | ||||||
| Orange County, CA, Airport Rev., “A”, 5%, 7/01/2031 | 190,000 | 190,528 | ||||||
| San Diego County, CA, Regional Airport Authority Rev., “A”, 5%, 7/01/2021 | 500,000 | 521,105 | ||||||
| San Diego County, CA, Regional Airport Authority Rev., “A”, 5%, 7/01/2043 | 500,000 | 558,000 | ||||||
| San Diego County, CA, Regional Airport Authority Rev., “B”, 5%, 7/01/2042 | 335,000 | 395,277 | ||||||
| San Diego County, CA, Regional Airport Authority Rev., “B”, 5%, 7/01/2047 | 335,000 | 393,565 | ||||||
| San Francisco, CA, City & County Airports Commission, International Airport Rev., “A”, 5%, 5/01/2030 | 285,000 | 310,388 | ||||||
| San Francisco, CA, City & County Airports Commission, International Airport Rev., “A”, 5%, 5/01/2031 | 150,000 | 163,051 | ||||||
| San Francisco, CA, City & County Airports Commission, International Airport Rev., “A”, 5%, 5/01/2044 | 395,000 | 476,599 | ||||||
| San Jose, CA, Airport Rev.,“A-2”, 5.25%, 3/01/2034 | 440,000 | 466,004 | ||||||
|
| |||||||
| $ | 4,346,508 | |||||||
| General Obligations - General Purpose - 5.2% | ||||||||
| Commonwealth of Puerto Rico, Public Improvement, “A”, NATL, 5.5%, 7/01/2020 | $ | 165,000 | $ | 168,745 | ||||
| Commonwealth of Puerto Rico, Public Improvement,“A-4”, AGM, 5%, 7/01/2031 | 40,000 | 40,656 | ||||||
| Puerto Rico Public Buildings Authority Rev.,“M-2”, AAC, 10%, 7/01/2035 | 30,000 | 31,520 | ||||||
| State of California, 5.25%, 4/01/2035 | 455,000 | 500,568 | ||||||
| State of California, 5.5%, 3/01/2040 | 630,000 | 648,503 | ||||||
| State of California, 5.25%, 11/01/2040 | 415,000 | 436,518 | ||||||
|
| |||||||
| $ | 1,826,510 | |||||||
| General Obligations - Schools - 41.7% | ||||||||
| Alhambra, CA, Unified School District, “B”, ASSD GTY, 5.25%, 8/01/2028 (Prerefunded 8/01/2019) | $ | 500,000 | $ | 503,175 | ||||
5
Table of Contents
Portfolio of Investments (unaudited) – continued
| Issuer | Shares/Par | Value ($) | ||||||
| Municipal Bonds - continued | ||||||||
| General Obligations - Schools - continued | ||||||||
| Beaumont, CA, Unified School District (Election of 2008), Capital Appreciation, “C”, AGM, 0%, 8/01/2044 | $ | 1,000,000 | $ | 424,050 | ||||
| Downey, CA, Unified School District (Election of 2014), “B”, 4%, 8/01/2040 | 415,000 | 456,172 | ||||||
| Folsom Cordova, CA, Unified School District (Election of 2012), “A”, 5%, 10/01/2038 | 535,000 | 607,599 | ||||||
| Imperial County, CA, Community College District Rev., BAM, 4%, 8/01/2040 | 1,000,000 | 1,094,900 | ||||||
| Imperial County, CA, Community College District Rev., “C”, 3.375%, 8/01/2037 | 500,000 | 515,260 | ||||||
| Imperial County, CA, Community College District Rev., Capital Appreciation, “C”, BAM, 0%, 8/01/2034 | 750,000 | 438,712 | ||||||
| Imperial County, CA, Community College District Rev., Capital Appreciation, “C”, BAM, 0.01%, 8/01/2035 | 1,250,000 | 693,975 | ||||||
| Lake Tahoe, CA, Unified School District (Election of 2008), Convertible Capital Appreciation, AGM, 0% to 8/01/2032, 6.375% to 8/01/2045 | 515,000 | 427,295 | ||||||
| Los Angeles County, CA, Mt. San Antonio Community College District (Election of 2018), “A”, 4%, 8/01/2049 | 125,000 | 137,934 | ||||||
| Los Angeles, CA, Community College District, 3%, 8/01/2039 | 455,000 | 457,716 | ||||||
| Marin County, CA, San Rafael City Elementary School District Rev., “B”, 4%, 8/01/2047 | 405,000 | 443,382 | ||||||
| Mendocino Lake, CA, Community College District Rev. (Election of 2006), Capital Appreciation, “B”, AGM, 0%, 8/01/2032 | 330,000 | 227,043 | ||||||
| Montebello, CA, Unified School District (Election of 2004),“A-1”, ASSD GTY, 5.25%, 8/01/2034 (Prerefunded 8/01/2019) | 355,000 | 357,226 | ||||||
| Montebello, CA, Unified School District (Election of 2016), “A”, 4%, 8/01/2046 | 255,000 | 270,749 | ||||||
| Mount San Antonio, CA, Community College District Rev. (Election of 2008), Convertible Capital Appreciation, “A”, 0% to 8/01/2028, 6.25% to 8/01/2043 | 855,000 | 805,726 | ||||||
| Napa Valley, CA, Unified School District, 5%, 8/01/2020 | 225,000 | 234,749 | ||||||
| Oakland, CA, Unified School District Rev., AGM, 5%, 8/01/2028 | 170,000 | 202,113 | ||||||
| Oakland, CA, Unified School District Rev., AGM, 5%, 8/01/2030 | 170,000 | 199,519 | ||||||
| Oxnard, CA, School District (Ventura County), “A”, BAM, 5%, 8/01/2045 | 410,000 | 487,523 | ||||||
| Pomona, CA, Unified School District, “A”, NATL, 6.55%, 8/01/2029 | 1,000,000 | 1,286,940 | ||||||
| San Diego, CA, Community College (Election of 2002), 5.25%, 8/01/2033 (Prerefunded 8/01/2019) | 125,000 | 125,794 | ||||||
| San Diego, CA, Unified School District (Election of 2008), Capital Appreciation, “G”, 0%, 7/01/2034 | 265,000 | 137,053 | ||||||
| San Diego, CA, Unified School District (Election of 2012), “I”, 4%, 7/01/2047 | 355,000 | 386,748 | ||||||
| San Jose, CA, Evergreen Community College District (Election of 2010), “A”, 5%, 8/01/2041 | 265,000 | 291,638 | ||||||
6
Table of Contents
Portfolio of Investments (unaudited) – continued
| Issuer | Shares/Par | Value ($) | ||||||
| Municipal Bonds - continued | ||||||||
| General Obligations - Schools - continued | ||||||||
| San Mateo County, CA, Union High School District, “E”, 3%, 9/01/2041 | $ | 560,000 | $ | 564,441 | ||||
| Santee, CA, School District (Election of 2006), Capital Appreciation, “D”, ASSD GTY, 0%, 8/01/2043 | 765,000 | 321,966 | ||||||
| South Monterey County, CA, Joint Union High School District (Election of 2018),“A-1”, AGM, 4%, 8/01/2049 | 350,000 | 377,804 | ||||||
| Vallejo City, CA, Unified School District, “A”, NATL, 5.9%, 8/01/2025 | 500,000 | 583,285 | ||||||
| Victor, CA, Elementary School District (Election of 2008), “A”, ASSD GTY, 5.125%, 8/01/2034 (Prerefunded 8/01/2019) | 500,000 | 503,035 | ||||||
| West Contra Costa, CA, Unified School District, “A”, NATL, 5.7%, 2/01/2023 | 500,000 | 578,285 | ||||||
| West Covina, CA, Unified School District, “A”, NATL, 5.8%, 2/01/2021 | 500,000 | 536,100 | ||||||
|
| |||||||
| $ | 14,677,907 | |||||||
| Healthcare Revenue - Hospitals - 24.6% | ||||||||
| ABAG Finance Authority forNon-Profit Corps., CA, Rev. (Sharp Healthcare), “A”, 5%, 8/01/2026 | $ | 110,000 | $ | 119,884 | ||||
| ABAG Finance Authority forNon-Profit Corps., CA, Rev. (Sharp Healthcare), “B”, 6.25%, 8/01/2039 (Prerefunded 8/01/2019) | 505,000 | 508,919 | ||||||
| California Health Facilities Financing Authority Rev. (Children’s Hospital Los Angeles), “A”, 5%, 8/15/2042 | 450,000 | 520,834 | ||||||
| California Health Facilities Financing Authority Rev. (Memorial Health Services), “A”, 5%, 10/01/2033 | 295,000 | 325,963 | ||||||
| California Health Facilities Financing Authority Rev. (Scripps Health), “A”, 5%, 11/15/2032 | 525,000 | 566,296 | ||||||
| California Health Facilities Financing Authority Rev. (Scripps Health), “A”, 5%, 11/15/2040 | 255,000 | 273,850 | ||||||
| California Health Facilities Financing Authority Rev. (Sutter Health), “B”, 5.875%, 8/15/2031 (Prerefunded 8/15/2020) | 500,000 | 527,015 | ||||||
| California Health Facilities Financing Authority Rev. (Sutter Health), “B”, 5%, 11/15/2046 | 535,000 | 623,093 | ||||||
| California Municipal Finance Authority Rev. (Community Medical Centers), “A”, 5%, 2/01/2036 | 225,000 | 259,706 | ||||||
| California Municipal Finance Authority Rev. (Community Medical Centers), “A”, 5%, 2/01/2037 | 150,000 | 172,626 | ||||||
| California Municipal Finance Authority Rev. (Community Medical Centers), “A”, 5%, 2/01/2042 | 75,000 | 85,879 | ||||||
| California Municipal Finance Authority Rev. (Eisenhower Medical Center), “B”, 4%, 7/01/2047 | 230,000 | 242,882 | ||||||
| California Municipal Finance Authority Rev. (NorthBay Healthcare Group), 5%, 11/01/2028 | 45,000 | 50,875 | ||||||
| California Municipal Finance Authority Rev. (NorthBay Healthcare Group), 5%, 11/01/2029 | 35,000 | 39,430 | ||||||
7
Table of Contents
Portfolio of Investments (unaudited) – continued
| Issuer | Shares/Par | Value ($) | ||||||
| Municipal Bonds - continued | ||||||||
| Healthcare Revenue - Hospitals - continued | ||||||||
| California Municipal Finance Authority Rev. (NorthBay Healthcare Group), 5%, 11/01/2030 | $ | 15,000 | $ | 16,813 | ||||
| California Municipal Finance Authority Rev. (NorthBay Healthcare Group), 5%, 11/01/2035 | 65,000 | 71,542 | ||||||
| California Municipal Finance Authority Rev. (NorthBay Healthcare Group), 5%, 11/01/2044 | 85,000 | 92,526 | ||||||
| California Public Finance Authority Rev. (Henry Mayo Newhall Hospital), 5%, 10/15/2047 | 455,000 | 504,185 | ||||||
| California Statewide Communities Development Authority Rev. (Enloe Medical Center), “A”, CALHF, 5.5%, 8/15/2023 | 500,000 | 501,565 | ||||||
| California Statewide Communities Development Authority Rev. (Kaiser Permanente), “A”, 5%, 4/01/2042 | 455,000 | 496,646 | ||||||
| California Statewide Communities Development Authority Rev. (Loma Linda University Medical Center), “A”, 5.5%, 12/01/2054 | 350,000 | 388,119 | ||||||
| California Statewide Communities Development Authority Rev. (Marin General Hospital), “A”, 5%, 8/01/2036 | 65,000 | 78,571 | ||||||
| California Statewide Communities Development Authority Rev. (Marin General Hospital), “A”, 5%, 8/01/2037 | 45,000 | 54,216 | ||||||
| California Statewide Communities Development Authority Rev. (Marin General Hospital), “A”, 5%, 8/01/2038 | 40,000 | 47,934 | ||||||
| California Statewide Communities Development Authority Rev. (Redlands Community Hospital), 5%, 10/01/2046 | 350,000 | 401,019 | ||||||
| California Statewide Communities Development Authority Rev. (Santa Ynez Valley Cottage Hospital), 5.25%, 11/01/2030 | 260,000 | 273,146 | ||||||
| California Statewide Communities Development Authority Rev. (Sutter Health), “A”, 5%, 8/15/2032 | 610,000 | 668,682 | ||||||
| California Statewide Communities Development Authority Rev. (Trinity Health Corp.), 5%, 12/01/2041 | 450,000 | 483,511 | ||||||
| Upland, CA, (San Antonio Community Hospital), COP, 6.375%, 1/01/2032 (Prerefunded 1/01/2021) | 250,000 | 269,630 | ||||||
|
| |||||||
| $ | 8,665,357 | |||||||
| Healthcare Revenue - Long Term Care - 6.5% | ||||||||
| ABAG Finance Authority forNon-Profit Corps., CA, Rev. (Episcopal Senior Communities), 6.125%, 7/01/2041 | $ | 150,000 | $ | 161,766 | ||||
| ABAG Finance Authority forNon-Profit Corps., CA, Rev. (Eskaton Properties, Inc.), 5%, 11/15/2035 | 230,000 | 251,287 | ||||||
| California Statewide Communities Development Authority Insured Rev. (Viamonte Senior Living 1 Project), “A”, 4%, 7/01/2038 | 65,000 | 71,753 | ||||||
| California Statewide Communities Development Authority Insured Rev. (Viamonte Senior Living 1 Project), “A”, 4%, 7/01/2039 | 70,000 | 77,078 | ||||||
| California Statewide Communities Development Authority Insured Rev. (Viamonte Senior Living 1 Project), “A”, 4%, 7/01/2040 | 65,000 | 70,699 | ||||||
8
Table of Contents
Portfolio of Investments (unaudited) – continued
| Issuer | Shares/Par | Value ($) | ||||||
| Municipal Bonds - continued | ||||||||
| Healthcare Revenue - Long Term Care - continued | ||||||||
| California Statewide Communities Development Authority Insured Rev. (Viamonte Senior Living 1 Project), “A”, 4%, 7/01/2043 | $ | 150,000 | $ | 162,560 | ||||
| California Statewide Communities Development Authority Rev. (899 Charleston Project), “A”, 5.25%, 11/01/2044 | 295,000 | 322,813 | ||||||
| California Statewide Communities Development Authority Rev. (Episcopal Communities & Services for Seniors Obligated Group), 5%, 5/15/2047 | 315,000 | 336,451 | ||||||
| California Statewide Communities Development Authority Rev. (Front Port Communities and Services), “A”, 4%, 4/01/2042 | 115,000 | 121,656 | ||||||
| California Statewide Communities Development Authority Rev. (Front Port Communities and Services), “A”, 5%, 4/01/2047 | 315,000 | 364,272 | ||||||
| Los Angeles County, CA, Regional Financing Authority Rev. (Montecedro, Inc. Project), “A”, CALHF, 5%, 11/15/2044 | 300,000 | 332,010 | ||||||
|
| |||||||
| $ | 2,272,345 | |||||||
| Industrial Revenue - Other - 1.8% | ||||||||
| New York Liberty Development Corp. Rev. (Goldman Sachs Headquarters), 5.25%, 10/01/2035 | $ | 485,000 | $ | 638,478 | ||||
| Miscellaneous Revenue - Other - 4.3% | ||||||||
| ABAG Finance Authority forNon-Profit Corps., CA, Rev. (Jackson Lab), 5%, 7/01/2037 | $ | 400,000 | $ | 436,028 | ||||
| California Infrastructure & Economic Development Bank Rev. (Academy of Motion Picture Arts and Sciences Obligated Group), “A”, 5%, 11/01/2030 | 235,000 | 268,086 | ||||||
| California Infrastructure & Economic Development Bank Rev. (Academy of Motion Picture Arts and Sciences Obligated Group), “A”, 5%, 11/01/2034 | 170,000 | 192,821 | ||||||
| California Infrastructure & Economic Development Bank Rev. (Academy of Motion Picture Arts and Sciences Obligated Group), “A”, 5%, 11/01/2035 | 170,000 | 192,324 | ||||||
| California Statewide Communities Development Authority Rev. (Buck Institute for Research on Aging), AGM, 5%, 11/15/2044 | 385,000 | 438,061 | ||||||
|
| |||||||
| $ | 1,527,320 | |||||||
| Port Revenue - 4.1% | ||||||||
| Alameda, CA, Corridor Transportation Authority Second Subordinate Lien Rev., “B”, AGM, 5%, 10/01/2036 | $ | 300,000 | $ | 352,062 | ||||
| Port of Oakland, CA, Rev., “P”, 5%, 5/01/2033 | 1,000,000 | 1,084,570 | ||||||
|
| |||||||
| $ | 1,436,632 | |||||||
| Sales & Excise Tax Revenue - 0.7% | ||||||||
| California Economic Recovery, “A”, 5%, 7/01/2020 (Prerefunded 7/01/2019) | $ | 250,000 | $ | 250,705 | ||||
9
Table of Contents
Portfolio of Investments (unaudited) – continued
| Issuer | Shares/Par | Value ($) | ||||||
| Municipal Bonds - continued | ||||||||
| Secondary Schools - 4.0% | ||||||||
| California Municipal Finance Authority, Charter School Lease Rev. (Palmdale Aerospace Academy Project), “A”, 5%, 7/01/2038 | $ | 130,000 | $ | 145,391 | ||||
| California School Finance Authority, Charter School Rev. (Aspire Public Schools - Obligated Group), 5%, 8/01/2040 | 85,000 | 93,957 | ||||||
| California School Finance Authority, Charter School Rev. (Aspire Public Schools - Obligated Group), 5%, 8/01/2045 | 85,000 | 93,784 | ||||||
| California School Finance Authority, School Facility Rev. (Alliance for College-Ready Public Schools Projects), “A”, 5%, 7/01/2030 | 255,000 | 290,521 | ||||||
| California School Finance Authority, School Facility Rev. (Green Dot Public Schools California Projects), “A”, 5%, 8/01/2038 | 130,000 | 151,246 | ||||||
| California School Finance Authority, School Facility Rev. (Green Dot Public Schools California Projects), “A”, 5%, 8/01/2048 | 130,000 | 149,241 | ||||||
| California School Finance Authority, School Facility Rev. (Kipp LA Projects), “A”, 5%, 7/01/2037 | 85,000 | 98,636 | ||||||
| California School Finance Authority, School Facility Rev. (Kipp LA Projects), “A”, 5%, 7/01/2047 | 130,000 | 148,532 | ||||||
| California Statewide Communities Development Authority, School Facility Rev. (Alliance for College-Ready Public Schools), “A”, 6.375%, 7/01/2047 | 230,000 | 247,100 | ||||||
|
| |||||||
| $ | 1,418,408 | |||||||
| State & Local Agencies - 10.4% | ||||||||
| California Public Works Board Lease Rev. (Judicial Council Projects), “A”, 5%, 3/01/2028 | $ | 380,000 | $ | 427,701 | ||||
| California Public Works Board Lease Rev. (New Stockton Courthouse), “B”, 5%, 10/01/2033 | 275,000 | 316,726 | ||||||
| Los Angeles County, CA, Facilities Lease Rev. (Vermont Corridor County Administration Building), “A”, 5%, 12/01/2043 | 1,000,000 | 1,213,340 | ||||||
| Los Angeles County, CA, Schools Regionalized Business Service Corp., Pooled Financing, Capital Appreciation, “A”, AAC, 0%, 8/01/2023 | 1,220,000 | 1,117,532 | ||||||
| Ontario Public Finance Authority Lease Rev., AGM, 5%, 11/01/2042 | 160,000 | 190,083 | ||||||
| Santa Clara and Santa Cruz Counties, CA, West Valley-Mission Community College District (Election of 2018), “A”, 4%, 8/01/2044 | 350,000 | 392,452 | ||||||
|
| |||||||
| $ | 3,657,834 | |||||||
| Tax - Other - 1.5% | ||||||||
| Puerto Rico Convention Center District Authority, Hotel Occupancy Tax Rev., “A”, AAC, 5%, 7/01/2031 | $ | 90,000 | $ | 90,817 | ||||
| Puerto Rico Infrastructure Financing Authority Special Tax Rev., “C”, AAC, 5.5%, 7/01/2024 | 120,000 | 130,053 | ||||||
| Puerto Rico Infrastructure Financing Authority Special Tax Rev., “C”, AAC, 5.5%, 7/01/2026 | 80,000 | 88,198 | ||||||
10
Table of Contents
Portfolio of Investments (unaudited) – continued
| Issuer | Shares/Par | Value ($) | ||||||
| Municipal Bonds - continued | ||||||||
| Tax - Other - continued | ||||||||
| Puerto Rico Infrastructure Financing Authority Special Tax Rev., “C”, AAC, 5.5%, 7/01/2027 | $ | 210,000 | $ | 232,749 | ||||
|
| |||||||
| $ | 541,817 | |||||||
| Tax Assessment - 5.5% | ||||||||
| Huntington Park, CA, Public Financing Authority Rev., “A”, AGM, 5.25%, 9/01/2019 | $ | 500,000 | $ | 501,375 | ||||
| North Natomas, CA, Community Facilities District Special Tax,“4-E”, 5.25%, 9/01/2033 | 160,000 | 179,803 | ||||||
| Riverside County, CA, Jurupa Valley Redevelopment Project Rev., “B”, AGM, 5%, 10/01/2030 | 190,000 | 226,273 | ||||||
| Riverside County, CA, Jurupa Valley Redevelopment Project Rev., “B”, AGM, 5%, 10/01/2031 | 225,000 | 267,649 | ||||||
| Riverside County, CA, Redevelopment Agency, Tax Allocation, “A”, AGM, 5%, 10/01/2034 | 295,000 | 340,400 | ||||||
| San Francisco, CA, City & County Redevelopment Successor Agency, Community Facilities District No. 6 (Mission Bay South Public Improvements), “A”, 5%, 8/01/2033 | 130,000 | 140,344 | ||||||
| San Francisco, CA, City & County Redevelopment Successor Agency, Tax Allocation (Mission Bay South Redevelopment Project), “A”, 5%, 8/01/2043 | 250,000 | 282,098 | ||||||
|
| |||||||
| $ | 1,937,942 | |||||||
| Toll Roads - 3.1% | ||||||||
| Bay Area Toll Authority, California Toll Bridge Rev.,“S-7”, 4%, 4/01/2033 | $ | 515,000 | $ | 582,527 | ||||
| Bay Area Toll Authority, California Toll Bridge Rev.,“S-7”, 4%, 4/01/2034 | 145,000 | 162,899 | ||||||
| Riverside County, CA, Transportation Commission, Toll Rev., “A”, 5.75%, 6/01/2044 | 320,000 | 354,272 | ||||||
|
| |||||||
| $ | 1,099,698 | |||||||
| Transportation - Special Tax - 2.6% | ||||||||
| Commonwealth of Puerto Rico Highway & Transportation Authority Rev., “D”, AGM, 5%, 7/01/2032 | $ | 55,000 | $ | 55,688 | ||||
| Commonwealth of Puerto Rico Highway & Transportation Authority Rev., “J”, NATL, 5%, 7/01/2029 | 10,000 | 10,083 | ||||||
| Commonwealth of Puerto Rico Highway & Transportation Authority Rev., “L”, AAC, 5.25%, 7/01/2038 | 345,000 | 372,407 | ||||||
| Commonwealth of Puerto Rico Highway & Transportation Authority Rev., “L”, NATL, 5.25%, 7/01/2035 | 30,000 | 32,249 | ||||||
| Commonwealth of Puerto Rico Highway & Transportation Authority Rev., “N”, NATL, 5.25%, 7/01/2032 | 40,000 | 43,352 | ||||||
11
Table of Contents
Portfolio of Investments (unaudited) – continued
| Issuer | Shares/Par | Value ($) | ||||||
| Municipal Bonds - continued | ||||||||
| Transportation - Special Tax - continued | ||||||||
| Commonwealth of Puerto Rico Highway & Transportation Authority Rev., “N”, NATL, 5.25%, 7/01/2033 | $ | 25,000 | $ | 27,075 | ||||
| Commonwealth of Puerto Rico Highway & Transportation Authority Rev., Unrefunded Balance, “A”, NATL, 5%, 7/01/2038 | 10,000 | 10,012 | ||||||
| San Francisco, CA, Municipal Transportation Agency Rev., “B”, 5%, 3/01/2037 | 335,000 | 365,220 | ||||||
|
| |||||||
| $ | 916,086 | |||||||
| Universities - Colleges - 11.2% | ||||||||
| California Educational Facilities Authority Rev. (Art Center College of Design), “A”, 5%, 12/01/2036 | $ | 285,000 | $ | 340,626 | ||||
| California Educational Facilities Authority Rev. (Loma Linda University), “A”, 5%, 4/01/2036 | 75,000 | 88,783 | ||||||
| California Educational Facilities Authority Rev. (Loma Linda University), “A”, 5%, 4/01/2037 | 235,000 | 277,326 | ||||||
| California Educational Facilities Authority Rev. (Loyola Marymount University), “B”, 5%, 10/01/2038 | 95,000 | 114,735 | ||||||
| California Educational Facilities Authority Rev. (Stanford University),“U-7”, 5%, 6/01/2046 | 235,000 | 340,381 | ||||||
| California Educational Facilities Authority Rev. (University of San Francisco), 6.125%, 10/01/2030 (Prerefunded 10/01/2021) | 140,000 | 155,487 | ||||||
| California Educational Facilities Authority Rev. (University of San Francisco), 6.125%, 10/01/2030 (Prerefunded 10/01/2021) | 145,000 | 161,217 | ||||||
| California Municipal Finance Authority Rev. (Emerson College), “B”, 5%, 1/01/2042 | 640,000 | 743,802 | ||||||
| California Public Works Board Lease Rev. (Regents of the University of California), 5%, 12/01/2028 (Prerefunded 12/01/2021) | 375,000 | 409,586 | ||||||
| California State University Rev., “A”, 5%, 11/01/2024 | 370,000 | 403,148 | ||||||
| Puerto Rico Industrial, Tourist, Educational, Medical & Environmental Control Facilities Financing Authority, Educational Facilities Rev. (University Plaza Project), NATL, 5%, 7/01/2033 | 75,000 | 75,102 | ||||||
| Regents of the University of California, Limited Project Rev., “O”, 4%, 5/15/2048 | 750,000 | 816,937 | ||||||
|
| |||||||
| $ | 3,927,130 | |||||||
| Universities - Dormitories - 4.5% | ||||||||
| California Municipal Finance Authority, Student Housing Rev. (Bowles Hall Foundation), “A”, 5%, 6/01/2035 | $ | 25,000 | $ | 27,796 | ||||
| California Municipal Finance Authority, Student Housing Rev.(CHF-Davis I LLC - West Village Student Housing Project), 5%, 5/15/2037 | 395,000 | 468,079 | ||||||
| California Municipal Finance Authority, Student Housing Rev.(CHF-Davis I LLC - West Village Student Housing Project), BAM, 5%, 5/15/2051 | 440,000 | 517,902 | ||||||
12
Table of Contents
Portfolio of Investments (unaudited) – continued
| Issuer | Shares/Par | Value ($) | ||||||
| Municipal Bonds - continued | ||||||||
| Universities - Dormitories - continued | ||||||||
| California Statewide Communities Development Authority Rev. (Lancer Plaza Project), 5.875%, 11/01/2043 | $ | 230,000 | $ | 258,929 | ||||
| California Statewide Communities Development Authority, College Housing Rev. (NCCD-Hooper Street LLC College of the Arts Project), 5.25%, 7/01/2039 | 260,000 | 298,821 | ||||||
|
| |||||||
| $ | 1,571,527 | |||||||
| Utilities - Cogeneration - 1.8% | ||||||||
| California Pollution Control Financing Authority, Water Furnishing Refunding Rev. (San Diego County Water Authority Desalination Project Pipeline), 5%, 11/21/2045 | $ | 390,000 | $ | 456,616 | ||||
| California Pollution Control Financing Authority, Water Furnishing Rev. (Poseidon Resources Desalination Project), 5%, 11/21/2045 | 150,000 | 159,700 | ||||||
|
| |||||||
| $ | 616,316 | |||||||
| Utilities - Municipal Owned - 5.7% | ||||||||
| Guam Power Authority Rev., “A”, AGM, 5%, 10/01/2039 | $ | 50,000 | $ | 56,137 | ||||
| Guam Power Authority Rev., “A”, AGM, 5%, 10/01/2044 | 55,000 | 61,515 | ||||||
| Northern California Power Agency, Capital Facilities Rev., “A”, 5.25%, 8/01/2024 | 390,000 | 399,563 | ||||||
| Puerto Rico Electric Power Authority Rev., “DDD”, AGM, 3.625%, 7/01/2023 | 10,000 | 9,998 | ||||||
| Puerto Rico Electric Power Authority Rev., “DDD”, AGM, 3.65%, 7/01/2024 | 55,000 | 54,898 | ||||||
| Puerto Rico Electric Power Authority Rev., “SS”, ASSD GTY, 4.375%, 7/01/2030 | 5,000 | 5,001 | ||||||
| Puerto Rico Electric Power Authority Rev., “TT”, 5%, 7/01/2032 (a)(d) | 275,000 | 219,312 | ||||||
| Puerto Rico Electric Power Authority Rev., “UU”, ASSD GTY, 4.25%, 7/01/2027 | 40,000 | 40,002 | ||||||
| Puerto Rico Electric Power Authority Rev., “V”, NATL, 5.25%, 7/01/2033 | 35,000 | 37,905 | ||||||
| Puerto Rico Electric Power Authority Rev., “VV”, NATL, 5.25%, 7/01/2032 | 125,000 | 135,476 | ||||||
| Puerto Rico Electric Power Authority Rev., “WW”, 5%, 7/01/2028 (a)(d) | 235,000 | 187,412 | ||||||
| Sacramento, CA, Municipal Utility District Electric Rev., “X”, 5%, 8/15/2025 (Prerefunded 8/15/2021) | 95,000 | 102,631 | ||||||
| Sacramento, CA, Municipal Utility District Electric Rev., Unrefunded Balance, “X”, 5%, 8/15/2025 | 275,000 | 297,476 | ||||||
| Vernon, CA, Electric System Rev., “A”, 5.5%, 8/01/2041 | 370,000 | 396,584 | ||||||
|
| |||||||
| $ | 2,003,910 | |||||||
13
Table of Contents
Portfolio of Investments (unaudited) – continued
| Issuer | Shares/Par | Value ($) | ||||||
| Municipal Bonds - continued | ||||||||
| Utilities - Other - 3.2% | ||||||||
| CaliforniaM-S-R Energy Authority Gas Rev., “A”, 6.5%, 11/01/2039 | $ | 245,000 | $ | 367,650 | ||||
| Southern California Public Power Authority (Natural Gas Project No. 1), “A”, 5%, 11/01/2033 | 585,000 | 738,527 | ||||||
|
| |||||||
| $ | 1,106,177 | |||||||
| Water & Sewer Utility Revenue - 12.2% | ||||||||
| El Monte, CA, Water Authority Rev., “A”, BAM, 5%, 9/01/2048 | $ | 750,000 | $ | 903,360 | ||||
| Escondido, CA, Joint Powers Financing Authority Rev. (Water System Financing), 5%, 9/01/2041 | 460,000 | 497,168 | ||||||
| Guam Waterworks Authority Rev. (Water and Wastewater System), 5%, 7/01/2036 | 20,000 | 22,357 | ||||||
| Guam Waterworks Authority Rev. (Water and Wastewater System), 5%, 1/01/2046 | 105,000 | 116,069 | ||||||
| Guam Waterworks Authority Rev. (Water and Wastewater System), “A”, 5%, 7/01/2029 | 105,000 | 116,411 | ||||||
| Guam Waterworks Authority Rev. (Water and Wastewater System), “A”, 5%, 7/01/2035 | 105,000 | 114,364 | ||||||
| Madera, CA, Financing Authority, Irrigation Rev., 6.5%, 1/01/2040 (Prerefunded 1/01/2020) | 440,000 | 453,059 | ||||||
| Norco, CA, Financing Authority, Enterprise Rev., AGM, 5.625%, 10/01/2039 | 215,000 | 217,737 | ||||||
| Oxnard, CA, Financing Authority, Wastewater Rev., AGM, 5%, 6/01/2030 | 340,000 | 391,262 | ||||||
| Oxnard, CA, Financing Authority, Wastewater Rev., AGM, 5%, 6/01/2031 | 85,000 | 97,587 | ||||||
| San Mateo-Foster City, CA, Public Financing Authority, Wastewater Rev. (Clean Water Program), 4%, 8/01/2044 | 295,000 | 327,721 | ||||||
| Soquel Creek, CA, Water District, COP, 5%, 3/01/2043 | 370,000 | 410,819 | ||||||
| Tulare, CA, Sewer Rev., AGM, 5%, 11/15/2031 | 350,000 | 417,694 | ||||||
| Tulare, CA, Sewer Rev., AGM, 5%, 11/15/2035 | 170,000 | 201,232 | ||||||
|
| |||||||
| $ | 4,286,840 | |||||||
| Total Municipal Bonds (Identified Cost, $54,873,838) | $ | 58,725,447 | ||||||
| Trust Units - 0.2% | ||||||||
| Sales & Excise Tax Revenue - 0.2% | ||||||||
| COFINA Series 2007A Senior Bonds Due 2042 National Custodial Trust (taxable), 8/01/2042 | 16,361 | $ | 13,437 | |||||
| COFINA Series 2007A Senior Bonds Due 2042 National Custodial Trust(tax-exempt), 8/01/2042 | 49,686 | 43,475 | ||||||
| Total Trust Units (Identified Cost, $56,469) | $ | 56,912 | ||||||
14
Table of Contents
Portfolio of Investments (unaudited) – continued
| Investment Companies (h) - 1.5% | ||||||||
| Issuer | Shares/Par | Value ($) | ||||||
| Money Market Funds - 1.5% | ||||||||
| MFS Institutional Money Market Portfolio, 2.46% (v) (Identified Cost, $541,070) | 541,124 | $ | 541,124 | |||||
| Other Assets, Less Liabilities - 0.8% | 268,299 | |||||||
| Variable Rate Municipal Term Preferred Shares (VMTPS), at liquidation value (issued by the fund) - (69.5)% |
| (24,425,000 | ) | |||||
| Net assets applicable to common shares - 100.0% | $ | 35,166,782 | ||||||
| (a) | Non-income producing security. |
| (d) | In default. |
| (h) | An affiliated issuer, which may be considered one in which the fund owns 5% or more of the outstanding voting securities, or a company which is under common control. At period end, the aggregate values of the fund’s investments in affiliated issuers and in unaffiliated issuers were $541,124 and $58,782,359, respectively. |
| (v) | Affiliated issuer that is available only to investment companies managed by MFS. The rate quoted for the MFS Institutional Money Market Portfolio is the annualizedseven-day yield of the fund at period end. |
The following abbreviations are used in this report and are defined:
| AAC | Ambac Assurance Corp. |
| AGM | Assured Guaranty Municipal |
| ASSD GTY | Assured Guaranty Insurance Co. |
| BAM | Build America Mutual |
| CALHF | California Health Facility Construction Loan Insurance Program |
| COP | Certificate of Participation |
| NATL | National Public Finance Guarantee Corp. |
Derivative Contracts at 5/31/19
Futures Contracts
| Description | Long/ Short | Currency | Contracts | Notional Amount | Expiration Date | Value/ Unrealized Appreciation (Depreciation) | ||||||||||||||||
| Liability Derivatives | ||||||||||||||||||||||
| Interest Rate Futures |
| |||||||||||||||||||||
| U.S. Treasury Bond | Short | USD | 25 | $3,842,969 | September - 2019 | $(30,854 | ) | |||||||||||||||
| U.S. Treasury Note 10 yr | Short | USD | 19 | 2,408,250 | September - 2019 | (13,280 | ) | |||||||||||||||
|
| |||||||||||||||||||||
| $(44,134 | ) | |||||||||||||||||||||
|
| |||||||||||||||||||||
At May 31, 2019, the fund had cash collateral of $79,950 to cover any collateral or margin obligations for certain derivative contracts. Restricted cash and/or deposits with brokers in the Statement of Assets and Liabilities are comprised of cash collateral.
See Notes to Financial Statements
15
Table of Contents
Financial Statements
STATEMENT OF ASSETS AND LIABILITIES
At 5/31/19 (unaudited)
This statement represents your fund’s balance sheet, which details the assets and liabilities comprising the total value of the fund.
| Assets | ||||
Investments in unaffiliated issuers, at value (identified cost, $54,930,307) | $58,782,359 | |||
Investments in affiliated issuers, at value (identified cost, $541,070) | 541,124 | |||
Deposits with brokers for | ||||
Futures contracts | 79,950 | |||
Receivables for | ||||
Interest | 642,289 | |||
Receivable from investment adviser | 24,153 | |||
Other assets | 9,041 | |||
Total assets | $60,078,916 | |||
| Liabilities | ||||
Payables for | ||||
Distributions on common shares | $168 | |||
Net daily variation margin on open futures contracts | 45,982 | |||
Investments purchased | 326,376 | |||
Interest expense | 57,181 | |||
Payable to affiliates | ||||
Transfer agent and dividend disbursing costs | 8 | |||
Payable for independent Trustees’ compensation | 10 | |||
Accrued expenses and other liabilities | 57,409 | |||
VMTPS, at liquidation value | 24,425,000 | |||
Total liabilities | $24,912,134 | |||
Net assets applicable to common shares | $35,166,782 | |||
| Net assets consist of | ||||
Paid-in capital - common shares | $31,686,463 | |||
Total distributable earnings (loss) | 3,480,319 | |||
Net assets applicable to common shares | $35,166,782 | |||
VMTPS, at liquidation value (977 shares issued and outstanding at $25,000 per share) | 24,425,000 | |||
Net assets including preferred shares | $59,591,782 | |||
Common shares of beneficial interest issued and outstanding | 2,786,275 | |||
Net asset value per common share (net assets of $35,166,782 / 2,786,275 shares of beneficial interest outstanding) | $12.62 | |||
See Notes to Financial Statements
16
Table of Contents
Financial Statements
Six months ended 5/31/19 (unaudited)
This statement describes how much your fund earned in investment income and accrued in expenses. It also describes any gains and/or losses generated by fund operations.
| Net investment income (loss) | ||||
Income | ||||
Interest | $1,229,116 | |||
Dividends from affiliated issuers | 9,547 | |||
Other | 17 | |||
Total investment income | $1,238,680 | |||
Expenses | ||||
Management fee | $189,262 | |||
Transfer agent and dividend disbursing costs | 3,092 | |||
Administrative services fee | 9,296 | |||
Independent Trustees’ compensation | 6,143 | |||
Stock exchange fee | 7,477 | |||
Custodian fee | 2,831 | |||
Shareholder communications | 9,136 | |||
Audit and tax fees | 41,896 | |||
Legal fees | 12,178 | |||
Interest expense and fees | 351,952 | |||
Miscellaneous | 39,910 | |||
Total expenses | $673,173 | |||
Reduction of expenses by investment adviser | (88,231 | ) | ||
Net expenses | $584,942 | |||
Net investment income (loss) | $653,738 | |||
| Realized and unrealized gain (loss) | ||||
Realized gain (loss) (identified cost basis) | ||||
Unaffiliated issuers | $133,449 | |||
Affiliated issuers | 111 | |||
Futures contracts | (389,225 | ) | ||
Net realized gain (loss) | $(255,665 | ) | ||
Change in unrealized appreciation or depreciation | ||||
Unaffiliated issuers | $2,283,700 | |||
Affiliated issuers | (65 | ) | ||
Futures contracts | (29,927 | ) | ||
Net unrealized gain (loss) | $2,253,708 | |||
Net realized and unrealized gain (loss) | $1,998,043 | |||
Change in net assets from operations | $2,651,781 | |||
See Notes to Financial Statements
17
Table of Contents
Financial Statements
STATEMENTS OF CHANGES IN NET ASSETS
These statements describe the increases and/or decreases in net assets resulting from operations, any distributions, and any shareholder transactions.
| Change in net assets | Six months ended 5/31/19 (unaudited) | Year ended 11/30/18 | ||||||
| From operations | ||||||||
Net investment income (loss) | $653,738 | $1,411,154 | ||||||
Net realized gain (loss) | (255,665 | ) | 295,269 | |||||
Net unrealized gain (loss) | 2,253,708 | (1,965,825 | ) | |||||
Change in net assets from operations | $2,651,781 | $(259,402 | ) | |||||
Distributions to common shareholders | $(575,366 | ) | $(1,315,122 | ) | ||||
Total change in net assets | $2,076,415 | $(1,574,524 | ) | |||||
| Net assets applicable to common shares | ||||||||
At beginning of period | 33,090,367 | 34,664,891 | ||||||
At end of period | $35,166,782 | $33,090,367 | ||||||
See Notes to Financial Statements
18
Table of Contents
Financial Statements
Six months ended 5/31/19 (unaudited)
This statement provides a summary of cash flows from investment activity for the fund.
| Cash flows from operating activities: | ||||
Change in net assets from operations | $2,651,781 | |||
| Adjustments to reconcile change in net assets from operations to net cash provided by operating activities: | ||||
Purchase of investment securities | (4,806,919 | ) | ||
Proceeds from disposition of investment securities | 4,677,261 | |||
Proceeds from disposition of short-term investments, net | 564,817 | |||
Realized gain/loss on investments | (133,449 | ) | ||
Unrealized appreciation/depreciation on investments | (2,283,635 | ) | ||
Net amortization/accretion of income | (18,574 | ) | ||
Increase in interest receivable | (22,766 | ) | ||
Decrease in accrued expenses and other liabilities | (34,636 | ) | ||
Increase in receivable from investment adviser | (10,166 | ) | ||
Increase in payable for net daily variation margin on open futures contracts | 40,063 | |||
Increase in other assets | (7,816 | ) | ||
Increase in payable for interest expense and fees | 1,010 | |||
Net cash provided by operating activities | $616,971 | |||
| Cash flows from financing activities: | ||||
Cash distributions paid on common shares | (575,371 | ) | ||
Net increase in cash and restricted cash (a) | $41,600 | |||
| Cash and restricted cash: | ||||
Beginning of period | $38,350 | |||
End of period | $79,950 | |||
| (a) | See Note 2 for more information on presentational changes to the Statement of Cash Flows that were effective with the beginning of the current reporting period. |
Supplemental disclosure of cash flow information:
Cash paid during the six months ended May 31, 2019 for interest was $350,942
See Notes to Financial Statements
19
Table of Contents
Financial Statements
The financial highlights table is intended to help you understand the fund’s financial performance for the semiannual period and the past 5 fiscal years. Certain information reflects financial results for a single fund share. The total returns in the table represent the rate that an investor would have earned (or lost) on an investment in the fund share class (assuming reinvestment of all distributions) held for the entire period.
Six months 5/31/19 | Year ended | |||||||||||||||||||||||
| Common Shares | 11/30/18 | 11/30/17 | 11/30/16 | 11/30/15 | 11/30/14 | |||||||||||||||||||
| (unaudited) | ||||||||||||||||||||||||
Net asset value, beginning of period | $11.88 | $12.44 | $12.04 | $12.63 | $12.55 | $11.32 | ||||||||||||||||||
| Income (loss) from investment operations |
| |||||||||||||||||||||||
Net investment income (loss) (d) | $0.23 | $0.51 | (c) | $0.56 | $0.62 | $0.67 | $0.64 | |||||||||||||||||
Net realized and unrealized | 0.72 | (0.60 | ) | 0.39 | (0.62 | ) | 0.03 | 1.22 | ||||||||||||||||
Total from investment operations | $0.95 | $(0.09 | ) | $0.95 | $(0.00 | ) | $0.70 | $1.86 | ||||||||||||||||
| Less distributions declared to common shareholders |
| |||||||||||||||||||||||
From net investment income | $(0.21 | ) | $(0.47 | ) | $(0.55 | ) | $(0.59 | ) | $(0.62 | ) | $(0.63 | ) | ||||||||||||
Net asset value, end of period (x) | $12.62 | $11.88 | $12.44 | $12.04 | $12.63 | $12.55 | ||||||||||||||||||
Market value, end of period | $11.65 | $9.95 | $11.82 | $11.36 | $11.72 | $10.91 | ||||||||||||||||||
Total return at market value (%) | 19.27 | (n) | (11.94 | ) | 9.02 | 1.57 | 13.45 | 18.45 | ||||||||||||||||
Total return at net asset | 8.21 | (n) | (0.10 | )(c) | 8.26 | (0.10 | ) | 6.28 | 17.48 | |||||||||||||||
| Ratios (%) (to average net assets applicable to common shares) and Supplemental data: |
| |||||||||||||||||||||||
Expenses before expense | 3.97 | (a) | 3.74 | (c) | 3.21 | 2.82 | 2.67 | 2.75 | ||||||||||||||||
Expenses after expense reductions (f) | 3.45 | (a) | 3.30 | (c) | 2.80 | 2.46 | 2.30 | 2.38 | ||||||||||||||||
Net investment income (loss) | 3.86 | (a) | 4.16 | (c) | 4.53 | 4.75 | 5.34 | 5.32 | ||||||||||||||||
Portfolio turnover | 8 | (n) | 18 | 11 | 6 | 11 | 17 | |||||||||||||||||
Net assets at end of period | $35,167 | $33,090 | $34,665 | $33,543 | $35,201 | $34,969 | ||||||||||||||||||
| Supplemental Ratios (%): |
| |||||||||||||||||||||||
Ratio of expenses to average net | 1.37 | (a) | 1.37 | (c) | 1.36 | 1.34 | 1.41 | 1.43 | ||||||||||||||||
Ratio of expenses to average net | 0.80 | (a) | 0.80 | (c) | 0.80 | 0.80 | 0.83 | 0.83 | ||||||||||||||||
Net investment income available to | 3.86 | (a) | 4.16 | (c) | 4.53 | 4.75 | 5.34 | 5.32 | ||||||||||||||||
20
Table of Contents
Financial Highlights – continued
Six months 5/31/19 | Year ended | |||||||||||||||||||||||
| 11/30/18 | 11/30/17 | 11/30/16 | 11/30/15 | 11/30/14 | ||||||||||||||||||||
| (unaudited) | ||||||||||||||||||||||||
| Senior Securities: | ||||||||||||||||||||||||
VMTPS | 977 | 977 | 977 | 977 | 977 | 977 | ||||||||||||||||||
Asset coverage per preferred | $60,995 | $58,869 | $60,451 | $59,279 | $61,030 | $60,792 | ||||||||||||||||||
Involuntary liquidation preference per preferred share (m) | $25,000 | $25,000 | $25,000 | $25,000 | $25,000 | $25,000 | ||||||||||||||||||
Average market value per preferred share (m)(u) | $25,000 | $25,000 | $25,000 | $25,000 | $25,000 | $25,000 | ||||||||||||||||||
| (a) | Annualized. |
| (c) | Amount reflects aone-time reimbursement of expenses by the custodian (or former custodian) without which net investment income and performance would be lower and expenses would be higher. |
| (d) | Per share data is based on average shares outstanding. |
| (f) | Ratios do not reflect reductions from fees paid indirectly, if applicable. |
| (j) | Total return at net asset value is calculated using the net asset value of the fund, not the publicly traded price and therefore may be different than the total return at market value. |
| (k) | Calculated by subtracting the fund’s total liabilities (not including liquidation preference of preferred shares) from the fund’s total assets and dividing this number by the total number of preferred shares outstanding. |
| (l) | Interest expense and fees include payments made to the holders of the floating rate certificates, interest expense paid to shareholders of VMTPS, and amortization of VMTPS debt issuance costs, as applicable. For periods prior to November 30, 2016, the expense ratio includes amortization of VMTPS debt issuance costs. |
| (m) | Amount excludes accrued unpaid distributions on preferred shares. |
| (n) | Not annualized. |
| (r) | Certain expenses have been reduced without which performance would have been lower. |
| (s) | From time to time the fund may receive proceeds from litigation settlements, without which performance would be lower. |
| (u) | Average market value represents the approximate fair value of each of the fund’s preferred shares. |
| (x) | The net asset values and total returns at net asset value have been calculated on net assets which include adjustments made in accordance with U.S. generally accepted accounting principles required at period end for financial reporting purposes. |
See Notes to Financial Statements
21
Table of Contents
(unaudited)
(1) Business and Organization
MFS California Municipal Fund (the fund) is organized as a Massachusetts business trust and is registered under the Investment Company Act of 1940, as amended, as a diversifiedclosed-end management investment company.
The fund is an investment company and accordingly follows the investment company accounting and reporting guidance of the Financial Accounting Standards Board (FASB) Accounting Standards Codification Topic 946 Financial Services – Investment Companies.
(2) Significant Accounting Policies
General– The preparation of financial statements in conformity with U.S. generally accepted accounting principles requires management to make estimates and assumptions that affect the reported amounts of assets and liabilities, and disclosure of contingent assets and liabilities at the date of the financial statements and the reported amounts of increases and decreases in net assets from operations during the reporting period. Actual results could differ from those estimates. In the preparation of these financial statements, management has evaluated subsequent events occurring after the date of the fund’s Statement of Assets and Liabilities through the date that the financial statements were issued. The fund invests primarily in municipal instruments, which generally trade in theover-the-counter market. The value of municipal instruments can be affected by changes in their actual or perceived credit quality. The credit quality of, and the ability to pay principal and interest when due by, an issuer of a municipal instrument depends on the credit quality of the entity supporting the municipal instrument, how essential any services supported by the municipal instrument are, the sufficiency of any revenues or taxes that support the municipal instrument, and/or the willingness or ability of the appropriate government entity to approve any appropriations necessary to support the municipal instrument. Municipal instruments may be supported by insurance which typically guarantees the timely payment of all principal and interest due on the underlying municipal instrument. The value of a municipal instrument can be volatile and significantly affected by adverse tax changes or court rulings, legislative or political changes, changes in specific or general market and economic conditions in the region or state where the instrument is issued, and the financial condition of municipal issuers and of municipal instrument insurers of which there are a limited number. Also, because many municipal instruments are issued to finance similar projects, conditions in certain industries can significantly affect the fund and the overall municipal market. If the Internal Revenue Service determines an issuer of a municipal instrument has not complied with the applicable tax requirements, interest from the security could become taxable, the security could decline in value, and distributions made by the fund could be taxable to shareholders. The fund invests in high-yield securities rated below investment grade. Investments in below investment grade quality securities can involve a substantially greater risk of default or can already be in default, and their values can decline significantly. Below investment grade quality securities tend to be more sensitive to adverse news about the issuer, or the market or economy in general, than higher quality debt instruments.
22
Table of Contents
Notes to Financial Statements (unaudited) – continued
In November 2016, the FASB issued Accounting Standards Update2016-18, Statement of Cash Flows (Topic 230) – Restricted Cash (“ASU2016-18”), which is effective for fiscal years beginning after December 15, 2017 and interim periods within those fiscal years. The fund adopted ASU2016-18 effective with the beginning of the current reporting period, which resulted in changes to the presentation of restricted cash in the fund’s Statement of Cash Flows and additional disclosures regarding the nature of the restrictions on cash and restricted cash.
In March 2017, the FASB issued Accounting Standards Update2017-08, Receivables – Nonrefundable Fees and Other Costs (Subtopic310-20) – Premium Amortization on Purchased Callable Debt Securities (“ASU2017-08”). For entities that purchased callable debt securities at a premium, ASU2017-08 requires that the premium be amortized to the earliest call date. ASU2017-08 will be effective for fiscal years beginning after December 15, 2018, and interim periods within those fiscal years. Management has evaluated the potential impacts of ASU2017-08 and believes that adoption of ASU2017-08 will not have a material effect on the fund’s overall financial position or its overall results of operations.
Balance Sheet Offsetting– The fund’s accounting policy with respect to balance sheet offsetting is that, absent an event of default by the counterparty or a termination of the agreement, the International Swaps and Derivatives Association (ISDA) Master Agreement, or similar agreement, does not result in an offset of reported amounts of financial assets and financial liabilities in the Statement of Assets and Liabilities across transactions between the fund and the applicable counterparty. The fund’s right to setoff may be restricted or prohibited by the bankruptcy or insolvency laws of the particular jurisdiction to which a specific master netting agreement counterparty is subject. Balance sheet offsetting disclosures, to the extent applicable to the fund, have been included in the fund’s Significant Accounting Policies note under the captions for each of the fund’sin-scope financial instruments and transactions.
Investment Valuations– Debt instruments and floating rate loans, including restricted debt instruments, are generally valued at an evaluated or composite bid as provided by a third-party pricing service. Short-term instruments with a maturity at issuance of 60 days or less may be valued at amortized cost, which approximates market value. Futures contracts are generally valued at last posted settlement price on their primary exchange as provided by a third-party pricing service. Futures contracts for which there were no trades that day for a particular position are generally valued at the closing bid quotation on their primary exchange as provided by a third-party pricing service.Open-end investment companies are generally valued at net asset value per share. Securities and other assets generally valued on the basis of information from a third-party pricing service may also be valued at a broker/dealer bid quotation. In determining values, third-party pricing services can utilize both transaction data and market information such as yield, quality, coupon rate, maturity, type of issue, trading characteristics, and other market data.
The Board of Trustees has delegated primary responsibility for determining or causing to be determined the value of the fund’s investments (including any fair valuation) to the adviser pursuant to valuation policies and procedures approved by the Board. If the adviser determines that reliable market quotations are not readily available, investments are valued at fair value as determined in good faith by the adviser in accordance with
23
Table of Contents
Notes to Financial Statements (unaudited) – continued
such procedures under the oversight of the Board of Trustees. Under the fund’s valuation policies and procedures, market quotations are not considered to be readily available for most types of debt instruments and floating rate loans and many types of derivatives. These investments are generally valued at fair value based on information from third-party pricing services. In addition, investments may be valued at fair value if the adviser determines that an investment’s value has been materially affected by events occurring after the close of the exchange or market on which the investment is principally traded (such as foreign exchange or market) and prior to the determination of the fund’s net asset value, or after the halt of trading of a specific security where trading does not resume prior to the close of the exchange or market on which the security is principally traded. The adviser generally relies on third-party pricing services or other information (such as the correlation with price movements of similar securities in the same or other markets; the type, cost and investment characteristics of the security; the business and financial condition of the issuer; and trading and other market data) to assist in determining whether to fair value and at what value to fair value an investment. The value of an investment for purposes of calculating the fund’s net asset value can differ depending on the source and method used to determine value. When fair valuation is used, the value of an investment used to determine the fund’s net asset value may differ from quoted or published prices for the same investment. There can be no assurance that the fund could obtain the fair value assigned to an investment if it were to sell the investment at the same time at which the fund determines its net asset value per share.
Various inputs are used in determining the value of the fund’s assets or liabilities. These inputs are categorized into three broad levels. In certain cases, the inputs used to measure fair value may fall into different levels of the fair value hierarchy. In such cases, an investment’s level within the fair value hierarchy is based on the lowest level of input that is significant to the fair value measurement. The fund’s assessment of the significance of a particular input to the fair value measurement in its entirety requires judgment, and considers factors specific to the investment. Level 1 includes unadjusted quoted prices in active markets for identical assets or liabilities. Level 2 includes other significant observable market-based inputs (including quoted prices for similar securities, interest rates, prepayment speed, and credit risk). Level 3 includes unobservable inputs, which may include the adviser’s own assumptions in determining the fair value of investments. Other financial instruments are derivative instruments, such as futures contracts. The following is a summary of the levels used as of May 31, 2019 in valuing the fund’s assets or liabilities:
| Financial Instruments | Level 1 | Level 2 | Level 3 | Total | ||||||||||||
| Municipal Bonds | $— | $58,782,359 | $— | $58,782,359 | ||||||||||||
| Mutual Funds | 541,124 | — | — | 541,124 | ||||||||||||
| Total | $541,124 | $58,782,359 | $— | $59,323,483 | ||||||||||||
| Other Financial Instruments | ||||||||||||||||
| Futures Contracts – Liabilities | $(44,134 | ) | $— | $— | $(44,134 | ) | ||||||||||
For further information regarding security characteristics, see the Portfolio of Investments.
24
Table of Contents
Notes to Financial Statements (unaudited) – continued
Derivatives– The fund uses derivatives primarily to increase or decrease exposure to a particular market or segment of the market, or security, to increase or decrease interest rate exposure, or as alternatives to direct investments. Derivatives are used for hedging ornon-hedging purposes. While hedging can reduce or eliminate losses, it can also reduce or eliminate gains. When the fund uses derivatives as an investment to increase market exposure, or for hedging purposes, gains and losses from derivative instruments may be substantially greater than the derivative’s original cost.
The derivative instruments used by the fund during the period were futures contracts. Depending on the type of derivative, the fund may exit a derivative position by entering into an offsetting transaction with a counterparty or exchange, negotiating an agreement with the derivative counterparty, or novating the position to a third party. The fund may be unable to promptly close out a futures position in instances where the daily fluctuation in the price for that type of future exceeds the daily limit set by the exchange. The fund’s period end derivatives, as presented in the Portfolio of Investments and the associated Derivative Contract tables, generally are indicative of the volume of its derivative activity during the period.
The following table presents, by major type of derivative contract, the fair value, on a gross basis, of the asset and liability components of derivatives held by the fund at May 31, 2019 as reported in the Statement of Assets and Liabilities:
| Fair Value (a) | ||||||
| Risk | Derivative Contracts | Liability Derivatives | ||||
| Interest Rate | Interest Rate Futures | $(44,134) | ||||
| (a) | Values presented in this table for futures contracts correspond to the values reported in the fund’s Portfolio of Investments. Only the current day net variation margin for futures contracts is separately reported within the fund’s Statement of Assets and Liabilities. |
The following table presents, by major type of derivative contract, the realized gain (loss) on derivatives held by the fund for the six months ended May 31, 2019 as reported in the Statement of Operations:
| Risk | Futures Contracts | |||
| Interest Rate | $(389,225 | ) | ||
The following table presents, by major type of derivative contract, the change in unrealized appreciation or depreciation on derivatives held by the fund for the six months ended May 31, 2019 as reported in the Statement of Operations:
| Risk | Futures Contracts | |||
| Interest Rate | $(29,927 | ) | ||
Derivative counterparty credit risk is managed through formal evaluation of the creditworthiness of all potential counterparties. On certain, but not all, uncleared derivatives, the fund attempts to reduce its exposure to counterparty credit risk whenever possible by entering into an ISDA Master Agreement on a bilateral basis. The ISDA Master Agreement gives each party to the agreement the right to terminate all transactions traded under such agreement if there is a specified deterioration in the credit quality of the other party. Upon an event of default or a termination of the ISDA Master Agreement, thenon-defaulting party has the right to close out all transactions
25
Table of Contents
Notes to Financial Statements (unaudited) – continued
traded under such agreement and to net amounts owed under each agreement to one net amount payable by one party to the other. This right to close out and net payments across all transactions traded under the ISDA Master Agreement could result in a reduction of the fund’s credit risk to such counterparty equal to any amounts payable by the fund under the applicable transactions, if any.
Collateral and margin requirements differ by type of derivative. For cleared derivatives (e.g., futures contracts, cleared swaps, and exchange-traded options), margin requirements are set by the clearing broker and the clearing house and collateral, in the form of cash or securities, is posted by the fund directly with the clearing broker. Collateral terms are counterparty agreement specific for uncleared derivatives (e.g., forward foreign currency exchange contracts, uncleared swap agreements, and uncleared options) and collateral, in the form of cash and securities, is held in segregated accounts with the fund’s custodian in connection with these agreements. For derivatives traded under an ISDA Master Agreement, which contains a collateral support annex, the collateral requirements are netted across all transactions traded under such counterparty-specific agreement and an amount is posted from one party to the other to collateralize such obligations. Cash that has been segregated or delivered to cover the fund’s collateral or margin obligations under derivative contracts, if any, will be reported separately in the Statement of Assets and Liabilities as restricted cash for uncleared derivatives and/or deposits with brokers for cleared derivatives. Securities pledged as collateral or margin for the same purpose, if any, are noted in the Portfolio of Investments. The fund may be required to make payments of interest on uncovered collateral or margin obligations with the broker. Any such payments are included in “Interest expense and fees” in the Statement of Operations.
Futures Contracts– The fund entered into futures contracts which may be used to hedge against or obtain broad market exposure, interest rate exposure, or to manage duration. A futures contract represents a commitment for the future purchase or sale of an asset at a specified price on a specified date.
Upon entering into a futures contract, the fund is required to deposit with the broker, either in cash or securities, an initial margin in an amount equal to a specified percentage of the notional amount of the contract. Subsequent payments (variation margin) are made or received by the fund each day, depending on the daily fluctuations in the value of the contract, and are recorded for financial statement purposes as unrealized gain or loss by the fund until the contract is closed or expires at which point the gain or loss on futures contracts is realized.
The fund bears the risk of interest rates or securities prices moving unexpectedly, in which case, the fund may not achieve the anticipated benefits of the futures contracts and may realize a loss. While futures contracts may present less counterparty risk to the fund since the contracts are exchange traded and the exchange’s clearinghouse guarantees payments to the broker, there is still counterparty credit risk due to the insolvency of the broker. The fund’s maximum risk of loss due to counterparty credit risk is equal to the margin posted by the fund to the broker plus any gains or minus any losses on the outstanding futures contracts.
Statement of Cash Flows– Information on financial transactions which have been settled through the receipt or disbursement of cash or restricted cash is presented in
26
Table of Contents
Notes to Financial Statements (unaudited) – continued
the Statement of Cash Flows. Cash as presented in the fund’s Statement of Assets and Liabilities includes cash on hand at the fund’s custodian bank and does not include any short-term investments. Restricted cash is presented in the fund’s Statement of Assets and Liabilities as restricted cash for uncleared derivatives and/or deposits with brokers for cleared derivatives and represents cash that has been segregated or delivered to cover the fund’s collateral or margin obligations under derivative contracts.
The following table provides a reconciliation of cash and restricted cash reported within the Statement of Assets and Liabilities with that shown in the Statement of Cash Flows:
| 5/31/19 | ||||
Cash | $— | |||
Restricted cash | — | |||
Restricted cash included in deposits with brokers | 79,950 | |||
| Total cash and restricted cash in the Statement of Cash Flows | $79,950 | |||
The beginning of period cash and restricted cash balance in the Statement of Cash Flows is comprised of cash of $0, restricted cash of $0, and restricted cash included in deposits with brokers of $38,350.
Indemnifications– Under the fund’s organizational documents, its officers and Trustees may be indemnified against certain liabilities and expenses arising out of the performance of their duties to the fund. Additionally, in the normal course of business, the fund enters into agreements with service providers that may contain indemnification clauses. The fund’s maximum exposure under these agreements is unknown as this would involve future claims that may be made against the fund that have not yet occurred.
Investment Transactions and Income– Investment transactions are recorded on the trade date. Interest income is recorded on the accrual basis. All premium and discount is amortized or accreted for financial statement purposes in accordance with U.S. generally accepted accounting principles. Interest payments received in additional securities are recorded on theex-interest date in an amount equal to the value of the security on such date. Debt obligations may be placed on non-accrual status or set to accrue at a rate of interest less than the contractual coupon when the collection of all or a portion of interest has become doubtful. Interest income for those debt obligations may be further reduced by the write-off of the related interest receivables when deemed uncollectible.
The fund may receive proceeds from litigation settlements. Any proceeds received from litigation involving portfolio holdings are reflected in the Statement of Operations in realized gain/loss if the security has been disposed of by the fund or in unrealized gain/loss if the security is still held by the fund. Any other proceeds from litigation not related to portfolio holdings are reflected as other income in the Statement of Operations.
Tax Matters and Distributions– The fund intends to qualify as a regulated investment company, as defined under Subchapter M of the Internal Revenue Code, and to distribute all of its taxable andtax-exempt income, including realized capital gains. As a result, no provision for federal income tax is required. The fund’s federal tax returns, when filed, will remain subject to examination by the Internal Revenue Service
27
Table of Contents
Notes to Financial Statements (unaudited) – continued
for a three year period. Management has analyzed the fund’s tax positions taken on federal and state tax returns for all open tax years and does not believe that there are any uncertain tax positions that require recognition of a tax liability.
Distributions to shareholders are recorded on theex-dividend date. Income and capital gain distributions are determined in accordance with income tax regulations, which may differ from U.S. generally accepted accounting principles. Certain capital accounts in the financial statements are periodically adjusted for permanent differences in order to reflect their tax character. These adjustments have no impact on net assets or net asset value per share. Temporary differences which arise from recognizing certain items of income, expense, gain or loss in different periods for financial statement and tax purposes will reverse at some time in the future. Distributions in excess of net investment income or net realized gains are temporary overdistributions for financial statement purposes resulting from differences in the recognition or classification of income or distributions for financial statement and tax purposes.
Book/tax differences primarily relate to expiration of capital loss carryforwards, amortization and accretion of debt securities, derivative transactions andnon-deductible expenses that result from the treatment of VMTPS as equity for tax purposes.
The tax character of distributions made during the current period will be determined at fiscal year end. The tax character of distributions declared to shareholders for the last fiscal year is as follows:
| Year ended | ||||
| 11/30/18 | ||||
| Ordinary income (including any short-term capital gains) | $17,734 | |||
| Tax-exempt income | 1,920,444 | |||
| Total distributions | $1,938,178 | |||
The federal tax cost and the tax basis components of distributable earnings were as follows:
| As of 5/31/19 | ||||
| Cost of investments | $54,897,499 | |||
| Gross appreciation | 4,429,499 | |||
| Gross depreciation | (3,515 | ) | ||
| Net unrealized appreciation (depreciation) | $4,425,984 | |||
| As of 11/30/18 | ||||
| Undistributed ordinary income | 27,777 | |||
| Undistributedtax-exempt income | 88,302 | |||
| Capital loss carryforwards | (725,457 | ) | ||
| Post-October capital loss deferral | (41,640 | ) | ||
| Other temporary differences | (56,343 | ) | ||
| Net unrealized appreciation (depreciation) | 2,111,265 | |||
The aggregate cost above includes prior fiscal year end tax adjustments, if applicable.
28
Table of Contents
Notes to Financial Statements (unaudited) – continued
Under the Regulated Investment Company Modernization Act of 2010 (the “Act”), net capital losses recognized for fund fiscal years beginning after November 30, 2011 may be carried forward indefinitely, and their character is retained as short-term and/or long-term losses (“post-enactment losses”). Previously, net capital losses were carried forward for eight years and treated as short-term losses(“pre-enactment losses”). As a transition rule, the Act requires that all post-enactment net capital losses be used beforepre-enactment net capital losses.
As of November 30, 2018, the fund had capital loss carryforwards available to offset future realized gains. Suchpre-enactment losses expire as follows:
| 11/30/19 | $(725,457 | ) |
(3) Transactions with Affiliates
Investment Adviser– The fund has an investment advisory agreement with MFS to provide overall investment management and related administrative services and facilities to the fund. The management fee is computed daily and paid monthly at an annual rate of 0.65% of the fund’s average daily net assets (including the value of preferred shares).
The investment adviser has agreed in writing to pay a portion of the fund’s total annual operating expenses, excluding interest expense on VMTPS, amortization of debt issuance costs on VMTPS, taxes, extraordinary expenses, brokerage and transaction costs, other interest expense, and investment-related expenses, such that total fund operating expenses do not exceed 0.80% annually of the fund’s average daily net assets (including the value of preferred shares). This written agreement will continue until modified by the fund’s Board of Trustees, but such agreement will continue at least until November 30, 2019. For the six months ended May 31, 2019, this reduction amounted to $88,231, which is included in the reduction of total expenses in the Statement of Operations.
Transfer Agent– The fund engages Computershare Trust Company, N.A. (“Computershare”) as the sole transfer agent for the fund’s common shares. MFS Service Center, Inc. (MFSC) monitors and supervises the activities of
Computershare for an agreed upon fee approved by the Board of Trustees. For the six months ended May 31, 2019, these fees paid to MFSC amounted to $58.
Administrator– MFS provides certain financial, legal, shareholder communications, compliance, and other administrative services to the fund. Under an administrative services agreement, the fund reimburses MFS the costs incurred to provide these services. The fund is charged an annual fixed amount of $17,500 plus a fee based on average daily net assets (including the value of preferred shares). The administrative services fee incurred for the six months ended May 31, 2019 was equivalent to an annual effective rate of 0.0319% of the fund’s average daily net assets (including the value of preferred shares).
Trustees’ and Officers’ Compensation– The fund pays compensation to independent Trustees in the form of a retainer, attendance fees, and additional compensation to Board and Committee chairpersons. The fund does not pay compensation directly to Trustees or officers of the fund who are also officers of the
29
Table of Contents
Notes to Financial Statements (unaudited) – continued
investment adviser, all of whom receive remuneration from MFS for their services to the fund. Certain officers and Trustees of the fund are officers or directors of MFS and MFSC.
Other– This fund and certain other funds managed by MFS (the funds) have entered into a service agreement (the ISO Agreement) which provides for payment of fees solely by the funds to Tarantino LLC in return for the provision of services of an Independent Senior Officer (ISO) for the funds. Frank L. Tarantino serves as the ISO and is an officer of the funds and the sole member of Tarantino LLC. The funds can terminate the ISO Agreement with Tarantino LLC at any time under the terms of the ISO Agreement. For the six months ended May 31, 2019, the fee paid by the fund under this agreement was $29 and is included in “Miscellaneous” expense in the Statement of Operations. MFS has agreed to bear all expenses associated with office space, other administrative support, and supplies provided to the ISO.
The fund invests in the MFS Institutional Money Market Portfolio which is managed by MFS and seeks current income consistent with preservation of capital and liquidity. This money market fund does not pay a management fee to MFS.
(4) Portfolio Securities
For the six months ended May 31, 2019, purchases and sales of investments, other than short-term obligations, aggregated $5,069,225 and $4,605,574, respectively.
(5) Shares of Beneficial Interest
The fund’s Declaration of Trust permits the Trustees to issue an unlimited number of full and fractional shares of beneficial interest. The fund reserves the right to repurchase shares of beneficial interest of the fund subject to Trustee approval. During the six months ended May 31, 2019 and the year ended November 30, 2018, there were no transactions in fund shares.
(6) Line of Credit
The fund and certain other funds managed by MFS participate in a $1.25 billion unsecured committed line of credit, subject to a $1 billion sublimit, provided by a syndicate of banks under a credit agreement. Borrowings may be made for temporary financing needs. Interest is charged to each fund, based on its borrowings, generally at a rate equal to the highest of one month LIBOR, the Federal Funds Effective Rate and the Overnight Bank Funding Rate, plus an agreed upon spread. A commitment fee, based on the average daily, unused portion of the committed line of credit, is allocated among the participating funds. In addition, the fund and other funds managed by MFS have established unsecured uncommitted borrowing arrangements with certain banks for temporary financing needs. Interest is charged to each fund, based on its borrowings, at rates equal to customary reference rates plus an agreed upon spread. For the six months ended May 31, 2019, the fund’s commitment fee and interest expense were $100 and $0, respectively, and are included in “Interest expense and fees” in the Statement of Operations.
30
Table of Contents
Notes to Financial Statements (unaudited) – continued
(7) Investments in Affiliated Issuers
An affiliated issuer may be considered one in which the fund owns 5% or more of the outstanding voting securities, or a company which is under common control. For the purposes of this report, the following were affiliated issuers:
| Affiliated Issuers | Beginning Value | Purchases | Sales Proceeds | Realized Gain (Loss) | Change in Unrealized Appreciation or Depreciation | Ending Value | ||||||||||||||||||
| MFS Institutional Money Market Portfolio | $1,106,006 | $5,235,074 | $5,800,002 | $111 | $(65 | ) | $541,124 | |||||||||||||||||
| Affiliated Issuers | Dividend Income | Capital Gain Distributions | ||||||||||||||||||||||
| MFS Institutional Money Market Portfolio |
| $9,547 | $— | |||||||||||||||||||||
(8) Preferred Shares
The fund has 977 shares issued and outstanding of VMTPS. The outstanding VMTPS are redeemable at the option of the fund in whole or in part at the liquidation preference of $25,000 per share, plus accumulated and unpaid dividends, but generally solely for the purpose of decreasing the leverage of the fund. The VMTPS are subject to a mandatory term redemption date of October 31, 2021, as extended, unless further extended through negotiation with the private holders of the VMTPS. There is no assurance that the term of the VMTPS will be extended or that the VMTPS will be replaced with any other preferred shares or other form of leverage upon the redemption of the VMTPS. Two months prior to the term redemption date of the VMTPS, the fund is required to begin to segregate liquid assets with the fund’s custodian to fund the redemption. Dividends on the VMTPS are cumulative and are reset weekly to a fixed spread against the Securities Industry and Financial Markets Association (SIFMA) Municipal Swap Index. During the six months ended May 31, 2019, the VMTPS dividend rates ranged from 2.43% to 3.45%. For the six months ended May 31, 2019, the average dividend rate was 2.77%.
In the fund’s Statement of Assets and Liabilities, the VMTPS aggregate liquidation preference is shown as a liability since they have a stated mandatory redemption date. Dividends paid to the VMTPS are treated as interest expense and recorded as incurred. For the six months ended May 31, 2019, interest expense related to the dividends paid to VMTPS amounted to $351,704 and is included in “Interest expense and fees” in the Statement of Operations. Costs directly related to the issuance of the VMTPS are considered debt issuance costs. Debt issuance costs are presented as a direct deduction from the carrying amount of the related debt liability and are being amortized into interest expense over the life of the VMTPS. Theperiod-end carrying value for the VMTPS in the fund’s Statement of Assets and Liabilities is its liquidation value less any unamortized debt issuance costs, which approximates its fair value. Its fair value would be considered level 2 under the fair value hierarchy.
Under the terms of a purchase agreement between the fund and the investor in the VMTPS, the fund is subject to various investment restrictions. These investment-related requirements are in various respects more restrictive than those to which the fund is otherwise subject in accordance with its investment objectives and policies. In addition,
31
Table of Contents
Notes to Financial Statements (unaudited) – continued
the fund is subject to certain restrictions on its investments imposed by guidelines of the rating agencies that rate the VMTPS, which guidelines may be changed by the applicable rating agency, in its sole discretion, from time to time. These guidelines may impose asset coverage or portfolio composition requirements that are more stringent than those imposed on the fund by the Investment Company Act of 1940 (the “1940 Act”).
The fund is required to maintain certain asset coverage with respect to the VMTPS as defined in the fund’s governing documents and the 1940 Act. One of a number of asset coverage-related requirements is that the fund is not permitted to declare or pay common share dividends unless immediately thereafter the fund has a minimum asset coverage ratio of 200% with respect to the VMTPS after deducting the amount of such common share dividends.
The 1940 Act requires that the preferred shareholders of the fund, voting as a separate class, have the right to elect at least two trustees at all times, and elect a majority of the trustees at any time when dividends on the preferred shares are unpaid for two full years. Unless otherwise required by law or under the terms of the preferred shares, each preferred share is entitled to one vote and preferred shareholders will vote together with common shareholders as a single class.
Leverage involves risks and special considerations for the fund’s common shareholders. To the extent that investments are purchased by the fund with proceeds from the issuance of preferred shares, the fund’s net asset value will increase or decrease at a greater rate than a comparable unleveraged fund. Changes in the value of the fund’s portfolio will be borne entirely by the common shareholders. It is possible that the fund will be required to sell assets at a time when it may be disadvantageous to do so in order to redeem preferred shares to comply with asset coverage or other restrictions including those imposed by the 1940 Act and the rating agencies that rate the preferred shares. There is no assurance that the fund’s leveraging strategy will be successful.
32
Table of Contents
REPORT OF INDEPENDENT REGISTERED PUBLIC ACCOUNTING FIRM
To the Board of Trustees and Shareholders of MFS California Municipal Fund:
We have reviewed the accompanying statement of assets and liabilities of MFS California Municipal Fund (the Fund), including the portfolio of investments, as of May 31, 2019, and the related statements of operations, changes in net assets, cash flows and financial highlights for thesix-month period ended May 31, 2019. These interim financial statements and financial highlights are the responsibility of the Fund’s management.
We conducted our review in accordance with the standards of the Public Company Accounting Oversight Board (United States). A review of interim financial information consists principally of applying analytical procedures and making inquiries of persons responsible for financial and accounting matters. It is substantially less in scope than an audit conducted in accordance with the standards of the Public Company Accounting Oversight Board (United States), the objective of which is the expression of an opinion regarding the financial statements taken as a whole. Accordingly, we do not express such an opinion.
Based on our review, we are not aware of any material modifications that should be made to the accompanying interim financial statements and financial highlights for them to be in conformity with U.S. generally accepted accounting principles.
We have previously audited, in accordance with the standards of the Public Company Accounting Oversight Board (United States), the statement of changes in net assets for the year ended November 30, 2018 and the financial highlights for each of the five years in the period ended November 30, 2018, and in our report dated January 15, 2019, we expressed an unqualified opinion on such statement of changes in net assets and financial highlights.

Boston, Massachusetts
July 17, 2019
33
Table of Contents
PROXY VOTING POLICIES AND INFORMATION
MFS votes proxies on behalf of the fund pursuant to proxy voting policies and procedures that are available without charge, upon request, by calling1-800-225-2606, by visitingmfs.com/proxyvoting,or by visiting the SEC Web site athttp://www.sec.gov.
Information regarding how the fund voted proxies relating to portfolio securities during the most recent twelve-month period ended June 30 is available by August 31 of each year without charge by visitingmfs.com/proxyvoting,or by visiting the SEC’s Web site athttp://www.sec.gov.
QUARTERLY PORTFOLIO DISCLOSURE
The fund files a complete schedule of portfolio holdings with the SEC for the first and third quarters of each fiscal year on Form N-Q or as an exhibit to its reports onForm N-PORT (for first and third fiscal quarters ending March 31, 2019 or after). The fund’s Form N-Q or Form N-PORT reports are available on the SEC’s website athttp://www.sec.gov. A shareholder can obtain the portfolio holdings report for the first and third quarters of the fund’s fiscal year atmfs.com/closedendfunds by choosing the fund’s name and then selecting the “Resources” tab and clicking on “Prospectus and Reports”.
From time to time, MFS may post important information about the fund or the MFS funds on the MFS web site (mfs.com). This information is available at
https://www.mfs.com/en-us/what-we-do/announcements.html or atmfs.com/closedendfunds by choosing the fund’s name.
Additional information about the fund (e.g., performance, dividends and the fund’s price history) is also available by clicking on the fund’s name under “Closed-End Funds” in the “Products” section ofmfs.com.
INFORMATION ABOUT FUND CONTRACTS AND LEGAL CLAIMS
The fund has entered into contractual arrangements with an investment adviser, administrator, transfer agent, and custodian who each provide services to the fund. Unless expressly stated otherwise, shareholders are not parties to, or intended beneficiaries of these contractual arrangements, and these contractual arrangements are not intended to create any shareholder right to enforce them against the service providers or to seek any remedy under them against the service providers, either directly or on behalf of the fund.
Under the Trust’s By-Laws, any claims asserted against or on behalf of the MFS Funds, including claims against Trustees and Officers, must be brought in state and federal courts located within the Commonwealth of Massachusetts.
34
Table of Contents
TRANSFER AGENT, REGISTRAR, AND
DIVIDEND DISBURSING AGENT
CALL
1-800-637-2304
9 a.m. to 5 p.m. Eastern time
WRITE
Computershare Trust Company, N.A.
P.O. Box 43078
Providence, RI 02940-3078
NYSE American Symbol:CCA
Table of Contents
| ITEM 2. | CODE OF ETHICS. |
During the period covered by this report, the Registrant has not amended any provision in its Code of Ethics (the “Code”) that relates to an element of the Code’s definition enumerated in paragraph (b) of Item 2 of this FormN-CSR. During the period covered by this report, the Registrant did not grant a waiver, including an implicit waiver, from any provision of the Code.
| ITEM 3. | AUDIT COMMITTEE FINANCIAL EXPERT. |
Not applicable for semi-annual reports.
| ITEM 4. | PRINCIPAL ACCOUNTANT FEES AND SERVICES. |
Not applicable for semi-annual reports.
| ITEM 5. | AUDIT COMMITTEE OF LISTED REGISTRANTS. |
Not applicable for semi-annual reports.
| ITEM 6. | SCHEDULE OF INVESTMENTS. |
A schedule of investments for MFS California Municipal Fund is included as part of the report to shareholders under Item 1 of this FormN-CSR.
| ITEM 7. | DISCLOSURE OF PROXY VOTING POLICIES AND PROCEDURES FORCLOSED-END MANAGEMENT INVESTMENT COMPANIES. |
Not applicable for semi-annual reports.
| ITEM 8. | PORTFOLIO MANAGERS OFCLOSED-END MANAGEMENT INVESTMENT COMPANIES. |
There were no changes during this period.
Table of Contents
| ITEM 9. | PURCHASES OF EQUITY SECURITIES BYCLOSED-END MANAGEMENT INVESTMENT COMPANY AND AFFILIATED PURCHASERS. |
| MFS California Municipal Fund | ||||||||||||||||
Period | (a) Total number of Shares Purchased | (b) Average Price Paid per Share | (c) Total Number of Shares Purchased as Part of Publicly Announced Plans or Programs | (d) Maximum Number (or Approximate Dollar Value) of Shares that May Yet Be Purchased under the Plans or Programs | ||||||||||||
12/01/18-12/31/18 | 0 | N/A | 0 | 278,627 | ||||||||||||
1/01/19-1/31/19 | 0 | N/A | 0 | 278,627 | ||||||||||||
2/01/19-2/28/19 | 0 | N/A | 0 | 278,627 | ||||||||||||
3/01/19-3/31/19 | 0 | N/A | 0 | 278,627 | ||||||||||||
4/01/19-4/30/19 | 0 | N/A | 0 | 278,627 | ||||||||||||
5/01/19-5/31/19 | 0 | N/A | 0 | 278,627 | ||||||||||||
|
|
|
| |||||||||||||
Total | 0 | 0 | ||||||||||||||
|
|
|
| |||||||||||||
Note: The Board approved procedures to repurchase shares and reviews the results periodically. The notification to shareholders of the program is part of the semi-annual and annual reports sent to shareholders. These annual programs begin on October 1st of each year. The programs conform to the conditions of Rule10b-18 of the Securities Exchange Act of 1934 and limit the aggregate number of shares that may be purchased in each annual period (October 1 through the following September 30) to 10% of the Registrant’s outstanding shares as of the first day of the plan year (October 1). The aggregate number of shares available for purchase for the October 1, 2018 plan year is 278,627.
| ITEM 10. | SUBMISSION OF MATTERS TO A VOTE OF SECURITY HOLDERS. |
There were no material changes to the procedures by which shareholders may send recommendations to the Board for nominees to the Registrant’s Board since the Registrant last provided disclosure as to such procedures in response to the requirements of Item 407 (c)(2)(iv) of RegulationS-K or this Item.
| ITEM 11. | CONTROLS AND PROCEDURES. |
| (a) | Based upon their evaluation of the registrant’s disclosure controls and procedures (as defined in Rule30a-3(c) under the Investment Company Act of 1940 (the “Act”)) as conducted within 90 days of the filing date of this FormN-CSR, the registrant’s principal financial officer and principal executive officer have concluded that those disclosure controls and procedures provide reasonable assurance that the material information required to be disclosed by the registrant on this report is recorded, processed, summarized and reported within the time periods specified in the Securities and Exchange Commission’s rules and forms. |
Table of Contents
| (b) | There were no changes in the registrant’s internal controls over financial reporting (as defined in Rule30a-3(d) under the Act) that occurred during the second fiscal quarter covered by the report that has materially affected, or is reasonably likely to materially affect, the registrant’s internal control over financial reporting. |
| ITEM 12. | DISCLOSURE OF SECURITIES LENDING ACTIVITIES FORCLOSED-END MANAGEMENT INVESTMENT COMPANIES. |
Not applicable for semi-annual reports.
| ITEM 13. | EXHIBITS. |
| (a) | (1) | Any code of ethics, or amendment thereto, that is the subject of the disclosure required by Item 2, to the extent that the registrant intends to satisfy the Item 2 requirements through filing of an exhibit. Not applicable. |
| (2) | A separate certification for each principal executive officer and principal financial officer of the registrant as required by Rule30a-2(a) under the Act (17 CFR270.30a-2): Attached hereto asEX-99.302CERT. |
| (3) | Any written solicitation to purchase securities under Rule23c-1 under the Act (17 CFR270.23c-1) sent or given during the period covered by the report by or on behalf of the registrant to 10 or more persons. Not applicable. |
| (4) | Change in the registrant’s independent public accountant. Not applicable. |
| (b) | If the report is filed under Section 13(a) or 15(d) of the Exchange Act, provide the certifications required by Rule30a-2(b) under the Act (17 CFR270.30a-2(b)), Rule13a-14(b) or Rule15d-14(b) under the Exchange Act (17 CFR240.13a-14(b) or240.15d-14(b)) and Section 1350 of Chapter 63 of Title 18 of the United States Code (18 U.S.C. 1350) as an exhibit. A certification furnished pursuant to this paragraph will not be deemed “filed” for the purposes of Section 18 of the Exchange Act (15 U.S.C. 78r), or otherwise subject to the liability of that section. Such certification will not be deemed to be incorporated by reference into any filing under the Securities Act of 1933 or the Exchange Act, except to the extent that the registrant specifically incorporates it by reference: Attached hereto asEX-99.906CERT. |
Table of Contents
Notice
A copy of the Agreement and Declaration of Trust, as amended, of the Registrant is on file with the Secretary of State of the Commonwealth of Massachusetts and notice is hereby given that this instrument is executed on behalf of the Registrant by an officer of the Registrant as an officer and not individually and the obligations of or arising out of this instrument are not binding upon any of the Trustees or shareholders individually, but are binding only upon the assets and property of the respective constituent series of the Registrant.
Table of Contents
SIGNATURES
Pursuant to the requirements of the Securities Exchange Act of 1934 and the Investment Company Act of 1940, the registrant has duly caused this report to be signed on its behalf by the undersigned, thereunto duly authorized.
Registrant MFS CALIFORNIA MUNICIPAL FUND
| By (Signature and Title)* | DAVID L. DILORENZO | |
| David L. DiLorenzo, President |
Date: July 17, 2019
Pursuant to the requirements of the Securities Exchange Act of 1934 and the Investment Company Act of 1940, this report has been signed below by the following persons on behalf of the registrant and in the capacities and on the dates indicated.
| By (Signature and Title)* | DAVID L. DILORENZO | |
David L. DiLorenzo, President (Principal Executive Officer) |
Date: July 17, 2019
| By (Signature and Title)* | JAMES O. YOST | |
James O. Yost, Treasurer (Principal Financial Officer and Accounting Officer) |
Date: July 17, 2019
| * | Print name and title of each signing officer under his or her signature. |