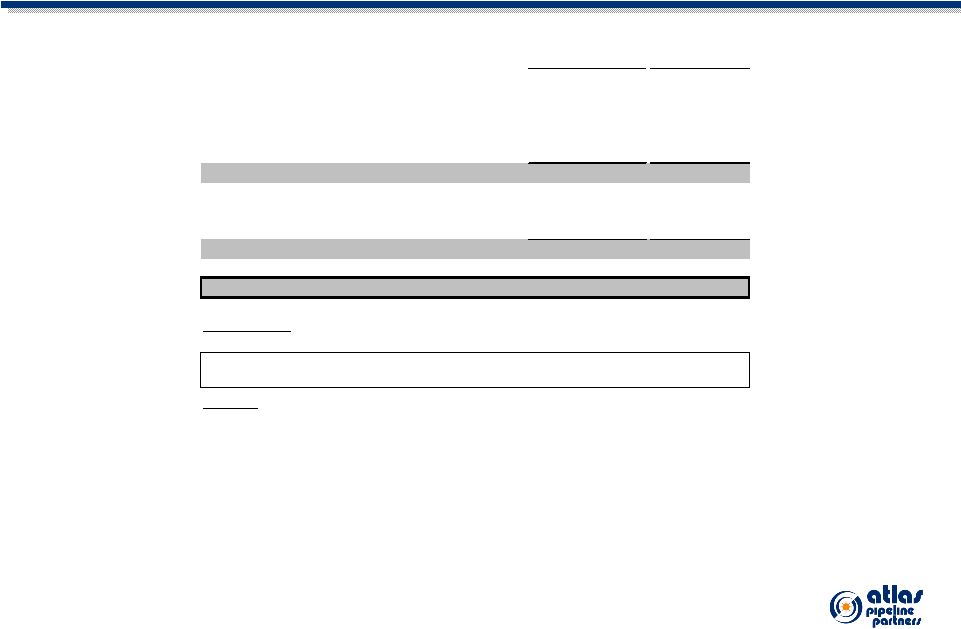
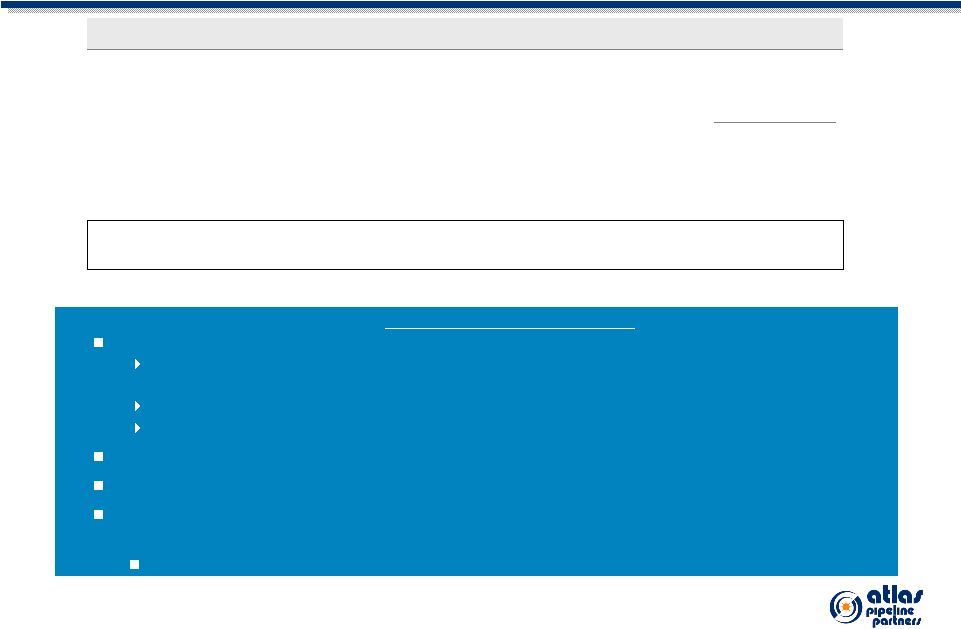
32 Current APL Hedge Positions (cont.) Crude Oil Sales Options (associated with NGL volume) Production Period Associated Average Ended Crude NGL Crude December 31, Volume (barrels) Volume (gallons) Strike Price (per barrel) Option Type 2008 (2 nd half) 812,400 46,513,740 $ 66.71 Puts purchased 2008 (2 nd half) (126,000) 11,219,040 $ 127.55 Puts sold (1) 2008 (2 nd half) (126,000) (11,219,040) $ 140.00 Calls purchased (1) 2008 (2 nd half) 946,800 51,529,968 $ 80.13 Calls sold 2009 1,584,000 85,038,534 $ 80.00 Puts purchased 2009 (304,200) 27,085,968 $ 126.05 Puts sold (1) 2009 (304,200) (27,085,968) $ 143.00 Calls purchased (1) 2009 2,121,593 114,071,990 $ 81.01 Calls sold 2010 3,127,500 202,370,490 $ 81.09 Calls sold 2010 (360,000) (24,116,400) $ 120.00 Calls purchased (1) 2011 606,000 32,578,560 $ 95.56 Calls sold 2011 (132,000) (7,595,280) $ 120.00 Calls purchased (1) 2012 450,000 24,192,000 $ 97.10 Calls sold 2012 (96,000) (5,523,840) $ 120.00 Calls purchased (1) Natural Gas Sales – Fixed Price Swaps Natural Gas Basis Sales Production Period Average Ended December 31, Volumes Fixed Price (mmbtu) (2) (per mmbtu) (2) 2008 (2nd half) 2,742,000 $ (0.744) 2009 5,724,000 $ (0.558) 2010 4,560,000 $ (0.622) 2011 2,160,000 $ (0.664) 2012 1,560,000 $ (0.601) Production Period Average Ended December 31, Volumes Fixed Price (mmbtu) (2) (per mmbtu) (2) 2008 (2 nd half) 2,742,000 $ 8.823 2009 5,724,000 $ 8.611 2010 4,560,000 $ 8.526 2011 2,160,000 $ 8.270 2012 1,560,000 $ 8.250 |


