 One Truck. Many Brands. One Solution. One Truck. Many Brands. One Solution. Huttig Huttig Conference Presentation Conference Presentation November 2007 November 2007 Exhibit 99.1 |
 2 2 Forward-Looking Statements Forward-Looking Statements • With the exception of historical information, the matters disclosed in this presentation are forward-looking statements. • Such statements involve certain risks and uncertainties that could cause actual results to differ materially from those in the forward- looking statements. Potential risks and uncertainties are described in the Company’s filings with the Securities and Exchange Commission, including its 2006 Form 10-K. • These forward-looking statements represent the Company’s judgment as of the date of this presentation. The Company disclaims any intent or obligation to update these forward-looking statements. |
 One Truck. Many Brands. One Solution. One Truck. Many Brands. One Solution. Overview Overview |
 4 4 Who We Are Who We Are • One of the largest national distributors of millwork, and the only national distributor that sells millwork, specialty building products and wood products • Products offered used for new residential construction and home improvement, remodeling and repair • Sell to pro dealers who service pro builders, remodeling contractors and DIY customers • Over 100,000 SKUs • Cover over 80% of the nation’s 2006 housing starts • 122 years old • Publicly traded company -21 million shares outstanding • FY06 sales $1.1 billion • Strong balance sheet |
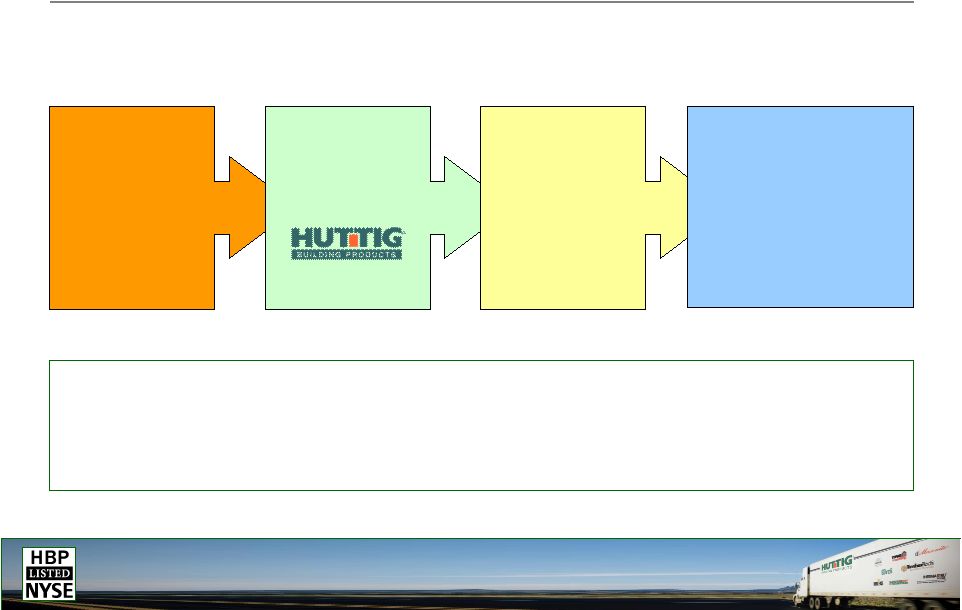 5 5 Where We Fit In Where We Fit In Two-Step Advantage • Many products don’t lend themselves to direct distribution • Two-step provides value-added services, economies of scale, reduced logistics costs for many products Building Products Manufacturers Two-Step Distributors One-Step Pro Dealers Professional Home Builders / Remodelers Huttig plays a key role in moving products on just in time basis |
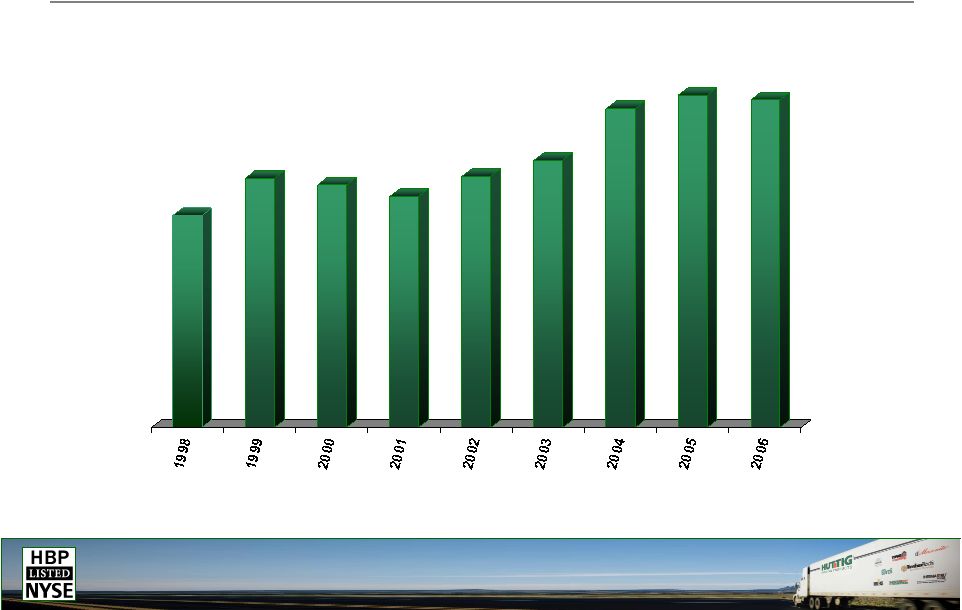 6 6 Industry Growth Trends – Industry Growth Trends – Top 150 Top 150 $39.4 $46.4 $45.2 $43.0 $46.7 $49.8 $59.4 $61.8 $60.9 Two-Step Distribution Sales ( Two-Step Distribution Sales ($ in Billions) $ in Billions) * Source: Home Channel News – July 2007 |
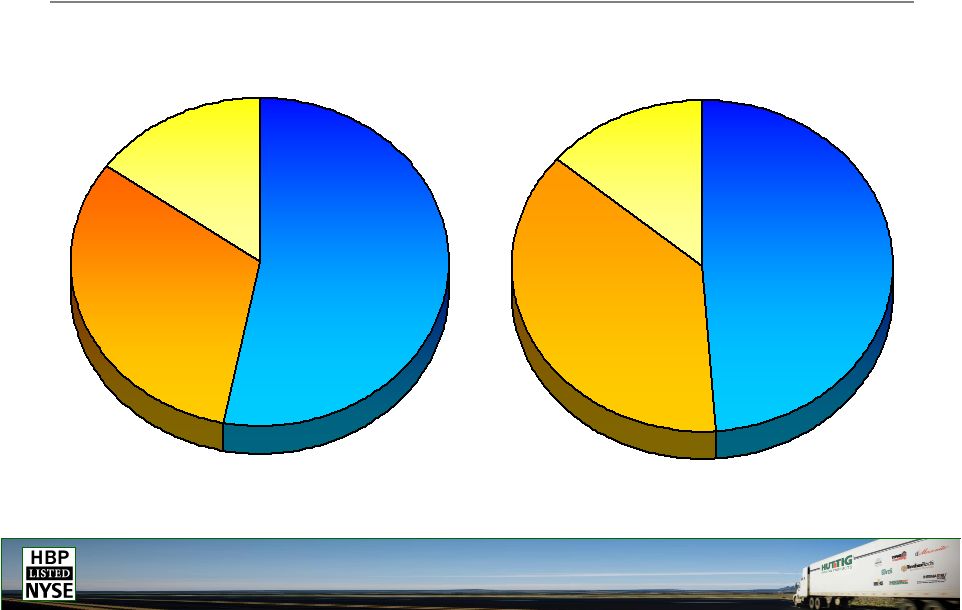 7 7 Huttig Sales by Product Lines – Huttig Sales by Product Lines – Nine Months Ending Nine Months Ending Sept. '06 General Building Products 32% Millwork 53% Wood Products 15% Sept. '07 Wood Products 14% Millwork 49% General Building Products 37% |
 8 8 Product Category – Product Category – Millwork Millwork 49% or $345 million YTD Sept. 2007 •Doors •Windows •Columns •Moulding •Stair Parts Millwork Doors • Pre-hanging of doors. • Largest US wholesaler of pre-hung doors Value-Added Services |
  9 9 Product Category – Product Category – Building Materials Building Materials 37% or $256 million YTD Sept. 2007 • Composite Decking • Housewrap/Weatherization • Connectors • Fasteners • Roofing Products • Insulation • Siding Building Materials Job packaging opportunities • Ability to bundle building materials with millwork and wood products to provide a broader portfolio of products Value-Added Services |
 10 10 Product Category – Product Category – Wood Products Wood Products 14% or $94 million in YTD Sept. 2007 • Engineered Wood • Panels • Lumber Wood Products Engineered Wood • Code compliance and pre-cut services • Pre-packaged floor systems Value-Added Services |
 11 11 Primary Huttig Competition Primary Huttig Competition Company Market Company Market Company Market National National National Northeast National National Reeb Millwork Northeast National National Northwest Northwest National National BMD West National Regional and local Midwest Regional and local Midwest Midwest Local * Primarily Andersen Windows and Therma Tru Doors Millwork Building Materials Wood Products PrimeSource Building Products Andersen Logistics* Brockway Smith BlueLinx Weyerhaeuser Boise Universal Forest Products Milliken Millwork Local competitors Wausau Supply Regional and local competitors BlueLinx Weyerhaeuser Boise Universal Forest Products Regional and local competitors Parkside Plunkett- Webster OrePac Building Products |
 One Truck. Many Brands. One Solution. One Truck. Many Brands. One Solution. Our Strategies Our Strategies |
 13 13 The Challenge Today The Challenge Today • Starts have fallen dramatically – New housing starts 2005 – 2.1 million – New housing starts 2006 – 1.8 million – Current outlook YE 2007 – 1.1 million – Housing inventory overhang expected to continue well into 2008 • Diminished credit availability – Sub-prime loans – Interest only/adjustable mortgage loan resets – Home foreclosures – Mortgage lender liquidity – Housing prices |
 14 14 The Opportunity Tomorrow The Opportunity Tomorrow • Demand for 19.5 million new housing units expected during period of 2005 – 2014 – Immigration – Acceleration of household formation – Baby boomer 2nd homes – Aging housing stock • Continued consolidation among manufacturers, distributors, pro dealers, pro builders |
 15 15 Our Value Proposition Our Value Proposition • National Footprint, National Brands, National Accounts, Consistently High Service Levels • National Footprint – Touch 80% of the national housing starts • National Accounts / Vendor Strategy – The only national wholesaler of millwork and building products – Strategy to service a growing number of national pro dealers serving national builders – Best brands in the industry • Service Proposition – Largest producer of pre-hung doors to the pro-channel – Transaction cost reductions – Breadth and depth of SKUs |
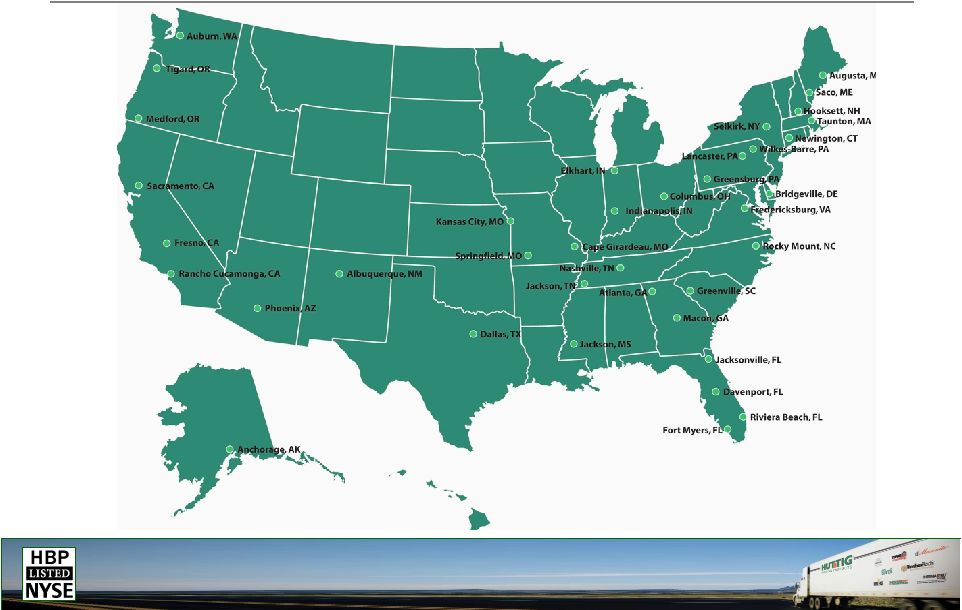 16 16 Huttig National Branch Network – Huttig National Branch Network – National Footprint National Footprint |
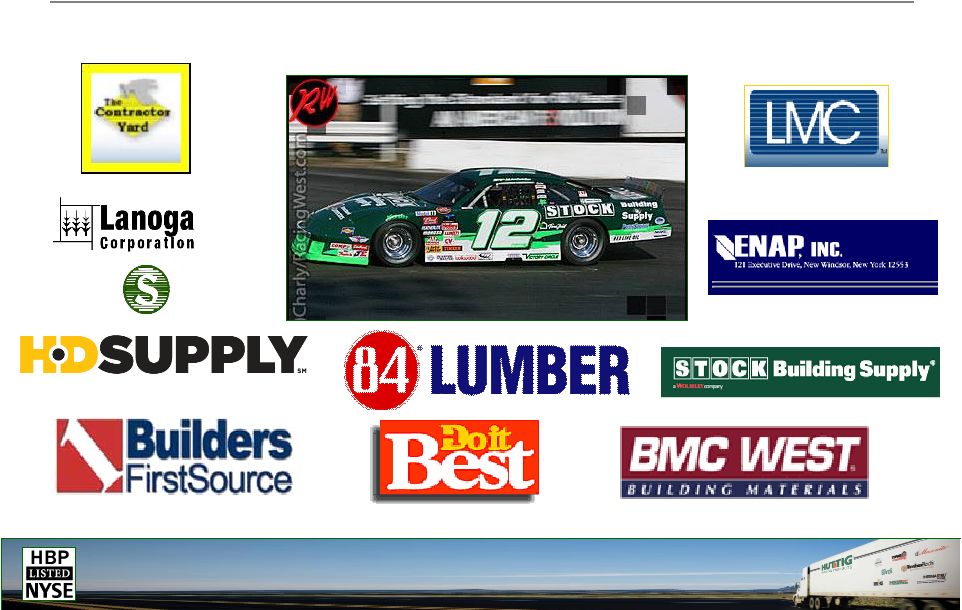
 17 17 Huttig Has Brands Pro Dealers Want Huttig Has Brands Pro Dealers Want |
 18 18 National Vendor Strategy National Vendor Strategy • National footprint and access to the largest dealers in the space provides a real value to manufacturers • National distribution rights to most popular brands in key categories • Provides benefits to both manufacturers and customers • Enables Huttig to increase sales to national, regional and local accounts |
 19 19 National Accounts Strategy National Accounts Strategy • Consolidation continues to drive this important customer base • Leverage national footprint and national brands to continue penetration • Our national pre-hung door capabilities provides unique opportunity • Consistent service levels and pricing adds value • Accounts for 37% of total revenue today |
 20 20 Key National Account Customers Key National Account Customers Huttig’s National Account Sales 12% CAGR 2002-2006 Huttig’s National Account Sales 12% CAGR 2002-2006 |
 21 21 Acquisitions Acquisitions • Objectives – New geographic locations – Expand share and leverage in existing markets – 12-15% ROI • Smaller Firms – Excellent acquisition opportunities – 44% market share – Mostly family-owned Two-Step Building Products Two-Step Building Products Distribution Market* Distribution Market* 129 Smaller Firms $20 Billion Top 10 Distributors (includes Huttig) $25 Billion * Source: HCN Top 150 Distributor Scorecard July 2007. Excludes retailers and buying groups such as LMC, Do It Best, True Value, ACE Hardware and ENAP |
 One Truck. Many Brands. One Solution. One Truck. Many Brands. One Solution. Financial Overview Financial Overview |
 23 23 Financial Objectives Financial Objectives • Goal of generating 5% operating margin • P&L managers in every branch • Significantly reduced cost structure • Decentralized organizational structure/culture to drive performance at the local trading area • Focus on generating cash, and working capital management • Pay off debt |
 24 24 Pro-Active Steps Already Taken Pro-Active Steps Already Taken • 2006 / 2007 restructuring program expected to generate $30+ million in annual expense savings – Closed, consolidated or sold 9 underperforming locations – Reduced workforce by nearly 25% – Eliminated costly Oracle ERP project – Entered into a new $160 million credit facility – Streamlined management structure – Reduced inventory $27 million or 22%, from September 30, 2006 • Continue to examine and position the company to survive the downturn and thrive once the market begins to rebound |
 25 25 Nine Months 2007 Results – Nine Months 2007 Results – Compared to Prior Year Compared to Prior Year Key Points (excluding charges) • Sales off 21% (National accounts off 17%) • Housing starts off 24% • Gross profit margin maintained at same level as prior year • Operating expenses down $20.6 million • Generated $3.6 million in cash from operating activities, compared to cash used of $27.3 million last year As Reported Adjusted As Reported Adjusted Net sales 694.9 $ 694.9 $ 871.6 $ 871.6 $ Gross margin 130.9 1.0 131.9 161.0 4.9 165.9 Operating expenses 132.3 (2.7) 129.6 162.5 (12.3) 150.2 Gain on disposal of capital asset (1.5) 1.5 - - - - Operating profit (loss) 0.1 2.2 2.3 (1.5) 17.2 15.7 Gross margin 18.8% 19.0% 18.5% 19.0% Operating expenses margin 19.0% 18.7% 18.6% 17.2% Operating profit (loss) margin 0.0% 0.3% -0.2% 1.8% Charges/Gain Nine Months Ended September 30, 2007 Nine Months Ended September 30, 2006 Charges |
       26 26 Strong Balance Sheet to Pursue Growth Strong Balance Sheet to Pursue Growth • Strong current ratio • $160 million credit facility provides increased availability and flexibility – $71 million of excess availability at September 30, 2007 • $5.24 per share in book value • Debt to cap (net of cash) of 24% At 09/30/07 ($ in Millions) $258.0 Total Liabilities & Shareholders’ Equity $109.8 Total Shareholders’ Equity $50.1 Long-Term Liabilities $98.1 Current Liabilities $258.0 Total Assets $26.9 Other $27.5 PPE $203.6 Current Assets |
 27 27 Outlook Outlook • FY07 – FY08 Goals – Continue to examine all areas of cost structure – Expand market share – Increase sales to national accounts – Expand national vendor programs – Improve operational discipline – Focus on cash and working capital management – Continue to strengthen balance sheet – Position the company to capture growth Long Term Objective • 5% operating margin |
 28 28 Conclusion Conclusion • Mid- to long-term housing forecast is strong – demand for almost 2 million units/year • No significant national competition in millwork – accounts for almost 50% of sales, requires value added services • National footprint along with national vendor strategy uniquely positions Huttig to capitalize on continued consolidation of national pro dealers and pro builders • Financial flexibility from strong balance sheet and $160 million credit facility enables Huttig to capitalize on value added growth and acquisition opportunities |
 29 29 Investor Contacts Investor Contacts Steven Anreder (Steven.Anreder@Anreder.com) Gary Fishman (Gary.Fishman@Anreder.com) Anreder & Company Phone: 212.532.3232 Investor Relations Agency Ken Young, Treasurer Huttig Building Products, Inc. 555 Maryville University Drive St. Louis, MO 63141 Phone: 314.216.2648 Email: kyoung@huttig.com Huttig |
 One Truck. Many Brands. One Solution. One Truck. Many Brands. One Solution. Huttig Huttig Conference Presentation Conference Presentation November 2007 November 2007 |