UNITED STATES
SECURITIES AND EXCHANGE COMMISSION
Washington, D.C. 20549
SCHEDULE 14A
(Rule 14a-101)
Proxy Statement Pursuant to Section 14(a)
of the Securities Exchange Act of 1934
Filed by the Registrant [ ]
Filed by a Party other than the Registrant [ ]
Check the appropriate box:
| [ ] | Preliminary Proxy Statement | [ ] | Confidential, for Use of the Commission | ||||
| [X] | Definitive Proxy Statement | Only (as permitted by Rule 14a-6(e)(2)) | |||||
| [ ] | Definitive Additional Materials | ||||||
| [ ] | Soliciting Material Pursuant to | ||||||
| §240.14a-12 |
Peoples Bancorp of North Carolina, Inc.
(Name of Registrant as Specified In Its Charter)
(Name of Person(s) Filing Proxy Statement, if other than the Registrant)
| Payment of Filing Fee (Check the appropriate box): | |||
| [X] | No fee required. | ||
| [ ] | Fee computed on table below per Exchange Act Rules 14a-6(i)(1) and 0-11. | ||
| (1) | Title of each class of securities to which transaction applies: | ||
| (2) | Aggregate number of securities to which transaction applies: | ||
| (3) | Per unit price or other underlying value of transaction computed pursuant to Exchange Act Rule 0-11 (set forth the amount on which the filing fee is calculated and state how it was determined): | ||
| (4) | Proposed maximum aggregate value of transaction: | ||
| (5) | Total fee paid: | ||
| [ ] | Fee paid previously with preliminary materials: | ||
| [ ] | Check box if any part of the fee is offset as provided by Exchange Act Rule 0-11(a)(2) and identify the filing for which the offsetting fee was paid previously. Identify the previous filing by registration statement number, or the Form or Schedule and the date of its filing. | ||
| (1) | Amount Previously Paid: | ||
| (2) | Form, Schedule or Registration Statement No.: | ||
| (3) | Filing Party: | ||
| (4) | Date Filed: | ||
__________________________
PEOPLES BANCORP
OF NORTH CAROLINA, INC.
__________________________
Notice of 2004 Annual Meeting,
Proxy Statement and
Annual Report
PEOPLES BANCORP OF NORTH CAROLINA, INC.
PROXY STATEMENT
Table of Contents
Page
Notice of 2004 Annual Meeting of Shareholders........................................................................................................................ ii
Proxy Statement...................................................................................................................................................................................1
Solicitation, Voting and Revocability of Proxies.............................................................................................................1
Security Ownership of Certain Beneficial Owners......................................................................................................... 2
Section 16(a) Beneficial Ownership Reporting Compliance..........................................................................................5
Proposal 1 - Election of Directors.....................................................................................................................................6
Report of Compensation Committee............................................................................................................................... 21
Compensation Committee Interlocks and Insider Participation ..................................................................................21
Report of Audit Committee............................................................................................................................................... 21
Performance Graph .............................................................................................................................................................22
Proposal 2 - Ratification of Selection of Independent Auditor................................................................................... 23
Date for Receipt of Shareholder Proposals.................................................................................................................... 23
Other Matters .....................................................................................................................................................................24
Miscellaneous.................................................................................................................................................................... 24
Appendix A: Annual Report ................................................................................................................................................................
General Description of the Business.............................................................................................................................A-1
Selected Financial Data....................................................................................................................................................A-2
Management’s Discussion and Analysis of Financial Condition and Results of Operations.............................A-3
Quantitative and Qualitative Disclosures About Market Risk.................................................................................A-21
Market For the Company’s Common Equity and Related Shareholder Matters...................................................A-23
Directors and Officers of the Company.......................................................................................................................A-24
Report of Independent Certified Public Accountants...............................................................................................A-25
Consolidated Balance Sheets - December 31, 2003 and 2002...................................................................................A-26
Consolidated Statements of Earnings - For the Years Ended December 31, 2003, 2002
and 2001...........................................................................................................................................................A-27
Consolidated Statements of Changes in Shareholders’ Equity - For the Years Ended
December 31, 2003, 2002 and 2001................................................................................................................A-28
Consolidated Statements of Comprehensive Income - For the Years Ended
December 31, 2003, 2002 and 2001................................................................................................................A-29
Consolidated Statements of Cash Flows - For the Years Ended December 31, 2003,
2002 and 2001..................................................................................................................................................A-30
Notes to Consolidated Financial Statements.............................................................................................................A-32
Appendix B: Governance Committee Charter............................................................................................................................B-1
Appendix C: Audit Committee Charter........................................................................................................................................C-1
PEOPLES BANCORP OF NORTH CAROLINA, INC.
Post Office Box 467
518 West C Street
Newton, North Carolina 28658-0467
(828) 464-5620
NOTICE OF 2004 ANNUAL MEETING OF SHAREHOLDERS
To Be Held on May 6, 2004
NOTICE IS HEREBY GIVEN that the 2004 Annual Meeting of Shareholders (the “Meeting”) of Peoples Bancorp of North Carolina, Inc. (the “Company”) will be held on Thursday, May 6, 2004, at 11:00 a.m., Eastern Time, at the Catawba Country Club, 1154 Country Club Road, Newton, North Carolina.
The Meeting is for the purpose of considering and voting upon the following matters:
1. To elect four persons who will serve as directors of the Company for a three-year term expiring in 2007, or until their successors are duly elected and qualified;
2. To ratify the appointment of Porter Keadle Moore, LLP (“PKM”) as the independent auditor for the Company for the fiscal year ending December 31, 2004; and
3. To transact such other business as may properly come before the Meeting or any adjournments thereof. The board of directors of the Company (the “Board of Directors”) is not aware of any other business to be considered at the Meeting.
The Board of Directors has established March 12, 2004 as the record date for the determination of shareholders entitled to notice of and to vote at the Meeting and at any adjournments thereof. In the event there are not sufficient shares present in person or by proxy to constitute a quorum at the time of the Meeting, the Meeting may be adjourned in order to permit further solicitation of proxies by the Company.
By Order of the Board of Directors,
/s/ Tony Wolfe
Tony W. Wolfe
President and Chief Executive Officer
Newton, North Carolina
April 2, 2004
A form of proxy is enclosed to enable you to vote your shares at the Meeting. You are urged, regardless of the number of shares you hold, to complete, sign, date and return the proxy promptly. A return envelope, which requires no postage if mailed in the United States, is enclosed for your convenience.
PEOPLES BANCORP OF NORTH CAROLINA, INC.
PROXY STATEMENT
2004 ANNUAL MEETING OF SHAREHOLDERS
May 6, 2004
SOLICITATION, VOTING AND REVOCABILITY OF PROXIES
General
This Proxy Statement is being furnished to shareholders of the Company in connection with the solicitation by the Board of Directors of the Company of proxies to be used at the Meeting to be held on Thursday, May 6, 2004, at 11:00 a.m., Eastern Time, at the Catawba Country Club, 1154 Country Club Road, Newton, North Carolina, and at any adjournments thereof. This Proxy Statement and the accompanying form of proxy were first mailed to shareholders on April 2, 2004.
The Company’s principal executive offices are located at 518 West C Street, Newton, North Carolina 28658, and its telephone number is (828) 464-5620.
Other than the matters listed on the attached Notice of 2004 Annual Meeting of Shareholders, the Board of Directors knows of no matters that will be presented for consideration at the Meeting. Execution of a proxy, however, confers on the designated proxyholders discretionary authority to vote the shares represented thereby in accordance with their best judgment on such other business, if any, that may properly come before the Meeting or any adjournments thereof.
Revocability of Proxy
A proxy may be revoked at any time prior to its exercise by the filing of a written notice of revocation with the Secretary of the Company, by delivering to the Company a duly executed proxy bearing a later date, or by attending the Meeting and voting in person. However, if you are a shareholder whose shares are not registered in your own name, you will need appropriate documentation from your recordholder to vote personally at the Meeting.
Solicitation
The cost of solicitation of proxies on behalf of the Board of Directors will be borne by the Company. Proxies may be solicited personally or by telephone by directors, officers and regular employees of the Company, without additional compensation therefor. The Company will also request persons, firms and corporations holding shares in their names, or in the name of their nominees, which are beneficially owned by others to send proxy material to, and obtain proxies from, such beneficial owners and will reimburse such holders, upon request, for their reasonable out-of-pocket expenses in doing so.
Voting Securities and Vote Required for Approval
Regardless of the number of shares of the Company’s common stock (the “Common Stock”) owned, it is important that shareholders be represented by proxy or be present in person at the Meeting. Shareholders are requested to vote by completing the enclosed form of proxy and returning it signed and dated in the enclosed postage-paid envelope. Any shareholder may vote for, against, or withhold authority to vote on any matter to come before the Meeting. If the enclosed proxy is properly completed, signed, dated and returned, and not revoked, it will be voted in accordance with the instructions therein. If no instructions are given, the proxy will be voted “FOR” the nominees for election to the Board of Directors named in this Proxy Statement and “FOR” the ratification of PKM as the Company’s independent auditor for the fiscal year ending December 31, 2004. If instructions are given with respect to one but not
both proposals, (i) such instructions as are given will be followed, and (ii) the proxy will be voted “FOR” the proposal on which no instructions are given.
The securities which may be voted at the Meeting consist of shares of Common Stock. The close of business on March 12, 2004 has been fixed by the Board of Directors as the record date (the “Record Date”) for the determination of shareholders of record entitled to notice of and to vote at the Meeting and any adjournments thereof. The total number of shares of Common Stock outstanding on the Record Date was 3,140,987.
The presence, in person or by proxy, of the holders of at least a majority of the total number of shares of Common Stock entitled to vote at the Meeting is necessary to constitute a quorum at the Meeting. Since many of our shareholders cannot attend the Meeting, it is necessary that a large number be represented by proxy. Accordingly, the Board of Directors has designated proxies to represent those shareholders who cannot be present in person and who desire to be so represented. In the event there are not sufficient votes for a quorum or to approve or ratify any proposal at the time of the Meeting, the Meeting may be adjourned in order to permit the further solicitation of proxies.
In the election of directors, persons must be nominated and elected for a term to expire at the 2007 Annual Meeting of Shareholders. A nominee need only receive a plurality of the votes cast in the election of directors in order to be elected. As a result, those persons nominated who receive the largest number of votes will be elected as directors. No shareholder has the right to cumulatively vote his or her shares in the election of directors.
As to the ratification of the independent auditor, each share of Common Stock shall entitle its owner to one vote and the affirmative vote of the holders of a majority of the shares of Common Stock present at the Meeting, in person or by proxy and entitled to vote, is required to constitute shareholder approval of the proposal.
Proxies solicited hereby will be returned to the Board of Directors, and will be tabulated by one or more inspectors of election designated by the Board of Directors. Abstentions will be counted for purposes of determining whether a quorum is present at the Meeting. Abstentions will not be counted in tabulating the votes cast on any proposal submitted to the shareholders. Broker non-votes will not be counted either for determining the existence of a quorum or for tabulating votes cast on any proposal.
SECURITY OWNERSHIP OF CERTAIN BENEFICIAL OWNERS
AND MANAGEMENT
The Securities Exchange Act of 1934, as amended (the “Exchange Act”), requires that any person who acquires the beneficial ownership of more than five percent of the Common Stock notify the Securities and Exchange Commission (the “SEC”) and the Company. Following is certain information, as of the Record Date, regarding those persons or groups who held of record or who are known to the Company to own beneficially, more than five percent of the outstanding Common Stock.
Name and Address of Amount and Nature of Percent
Beneficial Owner Beneficial Ownership1 of Class2
Christine S. Abernethy 338,5123 10.78%
P.O. Box 820
Newton, NC 28658
Banc Funds Company, LLC 241,857 7.70%
208 South LaSalle St.
Suite 1680
Chicago, IL 60604
Tontine Partners, LP 218,449 6.95%
55 Railroad Ave., 3rd Floor
Greenwich, CT 06830-6378
1 Unless otherwise noted, all shares are owned directly of record by the named individuals, by their spouses and minor children, or by other entities
controlled by the named individuals. Voting and investment power is not shared unless otherwise indicated.
2 Based upon a total of 3,140,987 shares of Common Stock outstanding as of the Record Date.
3 Carolina Glove Company, Inc. owns 56,378 shares of Common Stock. These shares are included in the calculation of Ms. Abernethy’s total beneficial ownership interest. Ms.
Abernethy owns approximately 50% of the stock of Carolina Glove Company, Inc. The business is operated by a family committee. Ms. Abernethy has no active day-to-day
participation in the business affairs of Carolina Glove Company, Inc.
Set forth below is certain information, as of the Record Date, regarding those shares of Common Stock owned beneficially by each of the persons who currently serves as a member of the Board of Directors or who served as one during fiscal year 2003 and each of the named executive officers of the Company, nominees for election at the Meeting, and the directors and executive officers of the Company as a group.
Amount and
Nature of Percentage
Beneficial of
Name and Address Ownership1 Class2
James S. Abernethy 99,6103 3.11%
Post Office Box 327
Newton, NC 28658
Robert C. Abernethy 110,3954 3.44%
Post Office Box 366
Newton, NC 28658
Joseph F. Beaman, Jr. 16,0815 *
Post Office Box 467
Newton, NC 28658
William D. Cable 9,6836 *
Post Office Box 467
Newton, NC 28658
Bruce R. Eckard7 19,700 *
Post Office Box 563
Conover, NC 28613
John H. Elmore, Jr.7 0 *
Post Office Box 445
Catawba, NC 28609
Douglas S. Howard8 300 *
Post Office Box 587
Denver, NC 28037
A. Joseph Lampron 4,8979
Post Office Box 467
Newton, NC 28658
John W. Lineberger, Jr.8 330 *
207 Mockingbird Lane
Lincolnton, NC 28092
Gary E. Matthews 4,369 *
210 First Avenue South
Conover, NC 28613
Charles F. Murray 56,81110 1.77%
Post Office Box 1118
Claremont, NC 28610
Amount and
Nature of Percentage
Beneficial of
Name and Address Ownership1 Class2
Billy L. Price, Jr., M.D.8 250 *
540 11th Ave. Place NW
Hickory, NC 28601
Larry E. Robinson 22,95211 *
Post Office Box 723
Newton, NC 28658
Lance A. Sellers 12,24112 *
Post Office Box 467
Newton, NC 28658
Fred L. Sherrill, Jr. 14,05813 *
Post Office Box 816
Conover, NC 28613
William Gregory Terry8 507 *
706 South College Ave.
Newton, NC 28658
Dan Ray Timmerman, Sr. 24,853 *
Post Office Box 1148
Conover, NC 28613
Tony W. Wolfe 28,08414 *
Post Office Box 467
Newton, NC 28658
Benjamin I. Zachary 40,93315 1.28%
Post Office Box 277
Taylorsville, NC 28681
All current directors and nominees and
executive officers as a group (17 people) 430,77016,17 13.44%
*Does not exceed one percent of the Common Stock outstanding.
______________________________________________
1 Unless otherwise noted, all shares are owned directly of record by the named individuals, by their spouses and minor children, or
by other entities controlled by the named individuals. Voting and investment power is not shared unless otherwise indicated.
2 Based upon a total of 3,140,987 shares of Common Stock outstanding as of the Record Date and 63,677 stock options exercisable
within 60 days with respect to the designated recipient(s).
3 Includes 35,283 shares of Common Stock owned by Alexander Railroad Company. Mr. J. Abernethy is Vice President, Secretary
and Chairman of the Board of Directors of Alexander Railroad Company.
4 Includes 2,583 shares of Common Stock owned by Mr. R. Abernethy’s spouse, for which Mr. R. Abernethy disclaims beneficial
ownership.
5 Includes 13,853 shares of Common Stock in which Mr. Beaman has the right to acquire beneficial interest within 60 days by the
exercise of stock options granted under the Omnibus Stock Ownership and Long Term Incentive Plan.
6 Includes 7,583 shares of Common Stock in which Mr. Cable has the right to acquire beneficial interest within 60 days by the
exercise of stock options granted under the Omnibus Stock Ownership and Long Term Incentive Plan.
7 Messrs. Eckard and Elmore resigned from service on the Board of Directors in order to devote more time to their business
interests in February 2004 and September 2003, respectively.
8 Messrs. Howard, Lineberger, Price and Terry were appointed to the Board of Directors in March, 2004.
9 Includes 4,758 shares of Common Stock in which Mr. Lampron has the right to acquire beneficial interest within 60 days by the
exercise of stock options granted under the Omnibus Stock Ownership and Long Term Incentive Plan.
10 Includes 882 shares of Common Stock owned by Mr. Murray’s spouse, for which Mr. Murray disclaims beneficial ownership.
Also includes 1,650 shares owned by Murray’s Hatchery, Inc. Mr. Murray is President of Murray’s Hatchery, Inc.
11 Includes 3,177 shares of Common Stock owned by Mr. Robinson’s spouse, for which Mr. Robinson disclaims beneficial
ownership.
12 Includes 12,141 shares of Common Stock in which Mr. Sellers has the right to acquire beneficial interest within 60 days by the exercise of stock options granted under the
Omnibus Stock Ownership and Long Term Incentive Plan.
13 Includes 5,690 shares of Common Stock owned by Mr. Sherrill’s spouse, for which Mr. Sherrill disclaims beneficial ownership.
14 Includes 25,342 shares of Common Stock in which Mr. Wolfe has the right to acquire beneficial interest within 60 days by the exercise of stock options granted under the
Omnibus Stock Ownership and Long Term Incentive Plan.
15 Includes 35,283 shares of Common Stock owned by Alexander Railroad Company. Mr. Zachary is President, Treasurer, and a Director of Alexander Railroad Company.
16 The 35,283 shares owned by Alexander Railroad Company and attributed to Mr. J. Abernethy and Mr. Zachary are only included once in calculating this total.
17 Includes 63,677 shares of Common Stock in which the executive officers, as a group, have the right to acquire beneficial interest within 60 days by the exercise of stock
options granted under the Omnibus Stock Ownership and Long Term Incentive Plan.
Directors James S. Abernethy and Robert C. Abernethy are brothers and sons of Christine S. Abernethy, who owns in excess of 10% of the Common Stock. Director Fred L. Sherrill, Jr. and former Director Bruce R. Eckard are first cousins by marriage.
SECTION 16(a) BENEFICIAL OWNERSHIP REPORTING COMPLIANCE
Section 16(a) of the Exchange Act requires the Company’s executive officers and directors, and persons who own more than ten percent of the Common Stock, to file reports of ownership and changes in ownership with the SEC. Executive officers, directors and greater than ten percent beneficial owners are required by SEC regulations to furnish the Company with copies of all Section 16(a) forms they file.
Based solely on a review of the copies of such forms furnished to the Company and written representations from the Company’s executive officers and directors, the Company believes, except as disclosed in this paragraph, that during the fiscal year ended December 31, 2003, its executive officers and directors and greater than ten percent beneficial owners complied with all applicable Section 16(a) filing requirements.
PROPOSAL 1
ELECTION OF DIRECTORS
Nominees
The Bylaws of the Company provide that the number of directors of the Company shall not be less than five nor more than fifteen. The exact number of directors is fixed by the Board of Directors. The Board of Directors has fixed the size of the Board at twelve members.
The Board of Directors has nominated the four persons named below for election as directors to serve for a three-year term to expire at the 2007 Annual Meeting of Shareholders or until their earlier death, resignation, retirement, removal or disqualification or until their successors shall be elected and shall qualify.
The persons named in the accompanying form of proxy intend to vote any shares of Common Stock represented by valid proxies received by them to elect the four nominees listed below as directors for the term specified, unless authority to vote is withheld or such proxies are duly revoked. All of the nominees for election are currently members of the Board of Directors whose terms expire in 2004. In the event that any of the nominees should become unavailable to accept nomination or election, it is intended that the proxyholders will vote to elect in his stead such other person as the present Board of Directors may recommend. The Board of Directors has no reason to believe that any of the nominees named herein will be unable to serve if elected to office.
The Company’s Bylaws provide that, in order to be eligible for consideration at the Annual Meeting of Shareholders, all nominations of directors, other than those made by the Board of Directors, must be made in writing and must be delivered to the Secretary of the Company not less than 50 days nor more than 90 days prior to the meeting at which such nominations will be made; provided, however, if less than 60 days notice of the meeting is given to shareholders, such nominations must be delivered to the Secretary of the Company not later than the close of business on the tenth day following the day on which the notice of meeting was mailed.
The following table sets forth as to each nominee, his name, age, principal occupation during the last five years, and the year he was first elected as a director.
Age on Principal Occupation ;Director
Name December 31, 2003 During Last Five Years Since
John W. Lineberger, Jr. * 53 President, Lincoln Bonded Warehouse 2004
Company (commercial warehousing facility)
Gary E. Matthews 48 President and Director, Matthews 2001
Construction Company, Inc.
Dan Ray Timmerman, Sr. 56 President, Timmerman Manufacturing, Inc. 1995
(wrought iron furniture manufacturer)
Benjamin I. Zachary 47 President, Treasurer, and member of the 1995
Board of Directors, Alexander Railroad
Company
*Mr. Lineberger had not previously served on the Board prior to his appointment in March 2004. He was recommended to the Governance Committee by the executive management of the Company.
THE BOARD OF DIRECTORS RECOMMENDS A VOTEFOR ALL OF THE ABOVE-LISTED NOMINEES FOR ELECTION AS DIRECTORS. THE FOUR NOMINEES RECEIVING THE HIGHEST NUMBER OF VOTES SHALL BE DEEMED TO HAVE BEEN ELECTED.
The following table sets forth as to each continuing director of the Bank, his name, age, principal occupation during the last five years, the year he was first elected as a director, and the year his current term expires.
Age on Principal Occupation Director&nb sp; Term
Name December 31, 2003 During Last Five Years Since Expires
Charles F. Murray 60 President, Murray's Hatchery 2004 2005
Fred L. Sherrill, Jr. 69 President and Chairman of the Board, 1989 2005
Conover Chair Company, Inc., President
and Chairman of the Board, Sherrill
Properties (furniture manufacturer)
Douglas S. Howard* 44 Vice President, Howard Ventures, Inc.; 2004 2005
Secretary/Treasurer, Denver Equipment
of Charlotte, Inc.
Billy L. Price, Jr., M.D.* 47 Practicing Internist and Partner in 2004 2005
Catawba Valley Internal Medicine, P.A.;
Clinical Instructor, Wake Forest
University School of Medicine
Robert C. Abernethy 53 President, Secretary and Treasurer, 1976 2006
Carolina Glove Company, Inc. (glove
manufacturer); Secretary and Assistant
Treasurer, Midstate Contractors, Inc.
(paving company)
James S. Abernethy 49 Vice President, Carolina Glove 1992 2006
Company, Inc. (glove manufacturer);
President and Assistant Secretary,
Midstate Contractors, Inc. (paving
company); Vice President, Secretary and
Chairman of the Board of Directors,
Alexander Railroad Company
Larry E. Robinson 58 President and Chief Executive Officer, 1993 2006
Blue Ridge Distributing Co., inc. (beer
and wine distributor); President and
Chief Executive Officer, Associated
Brands, Inc. (beer and wine distributor)
William Gregory Terry* 36 Executive Vice President, Drum & Willis 2004 2006
Funeral Homes and Crematory
* Messrs. Howard, Price and Terry had not served on the Board of Directors prior to their appointment by the Board in March 2004. Dr. Price was recommended to the Governance Committee by current members of the Board. Mr. Terry was recommended by the Board and by the Company’s executive management. Mr. Howard was recommended by executive management.
Board of Directors of the Bank
Peoples Bank (the “Bank”) also has twelve directors currently serving on its board of directors, comprised of all the same people who are currently directors of the Company.
Meetings of the Board
The Board of Directors and the Bank’s board of directors met a total of eight times during the fiscal year ended December 31, 2003. During the year ended December 31, 2003, all members of the Board of Directors attended at least 75% of the aggregate number of meetings of the Board of Directors, the Bank’s board of directors and committees of both boards on which they served.
Committees of the Board
The Board of Directors of the Company restructured its standing committees in 2003 in order to comply with changes brought about by the securities laws and regulations as well as NASD’s listing standards. Prior to the restructuring, the Company’s Board had one standing committee, the Auditing and Examining Committee. In reconfigured the committee structure, the Board established three standing committees – the Governance Committee, the Executive Committee, and the Audit Committee. These committees are described below.
Governance Committee. The Governance Committee is comprised entirely of independent Directors, as defined in Rule 4200(a)(15) of the NASD’s listing standards. It currently consists of Directors R. Abernethy, J. Abernethy, L. Robinson, D. Timmerman and B. Zachary. The Governance Committee is responsible for developing and maintaining the corporate governance policy, as well as acting as the nominating committee for the Board.
The Governance Committee interviews candidates for membership to the Board of Directors, recommends candidates to the full Board, slates candidates for Director and shareholder votes, and fills any vacancies on the Board of Directors which occur between shareholder meetings. The Governance Committee’s identification of candidates for Director typically results from the business interactions of the members of the Governance Committee or from recommendations received by the committee from other Directors or from Company management. The Governance Committee currently has no written policy with regard to the consideration of director candidates recommended by security holders. If a security holder recommends a director candidate to the Governance Committee, however, the Governance Committee will consider the candidate and apply the same considerations that it would to its own cand idates. The recommendation of a candidate by a security holder should be made in writing, addressed to the attention of the Governance Committee at the Company’s corporate headquarters. The recommendation should include a description of the candidate’s background, his or her contact information, and any other information the security holder considers useful and appropriate for the Governance Committee’s consideration of the candidate. The criteria which have been established by the Governance Committee as bearing on the consideration of a candidate’s qualification to serve as a Director include the following: the candidate’s ethics, integrity, involvement in the community, success in business, relationship with the Bank, investment in the Company, place of residence (i.e., proximity to the Bank’s market area), and financial expertise.
The Governance Committee met seven times during fiscal year 2003. The Governance Committee Charter, which sets forth its duties with regard to the nomination of candidates for Director, is attached as Appendix B to this Proxy Statement.
Executive Committee. The Executive Committee performs duties as assigned by the full Board of Directors. Actions taken by the Executive Committee must be approved by the full Board. The Executive Committee consists of Directors R. Abernethy, J. Abernethy, and Timmerman, as well as Mr. Wolfe, the President and Chief Executive Officer of the Company. It meets on an “as needed” basis.
Audit Committee. The Audit Committee consists of Directors R. Abernethy, Murray, Robinson, Sherrill, Timmerman and Zachary. The Board of Directors has determined that these members are independent as that term is defined in Rule 4200(a)(15) of the NASD’s listing standards.
The Audit Committee meets as needed and, among other responsibilities, oversees (i) the internal independent auditing of the Company; (ii) the system of internal controls that management has established; and (iii) the quarterly and annual financial information to be provided to shareholders and the Securities and Exchange Commission. The Audit Committee met six times during the fiscal year ended December 31, 2003. The Company’s Board of Directors has adopted an Audit Committee Charter, which is attached as Attachment C to this Proxy Statement.
Communications Between Shareholders and Members of the Board of Directors
The Company does not have a formal procedure for stockholder communication with the Board of Directors. In general, however, the directors and executive officers of the Company are easily accessible by telephone, postal mail or electronic mail. Any matter intended for the Board of Directors, or for any individual member or members of the Board, can be directed to the Company’s Chief Executive Officer, Mr. Wolfe, or Chief Financial Officer, Mr. Lampron, with a request to forward the same to the intended recipient. Alternatively, shareholders can direct correspondence to the Board, or any of its members, in care of the Company at the Company’s address. All such communications will be forwarded to the intended recipient unopened.
Director Attendance at Annual Meetings
Although it is customary for all members of the Board of Directors to attend, the Company has no formal policy in place with regard to Directors’ attendance at the Annual Meeting of Shareholders. Eight members of the Company’s Board of Directors attended the 2003 Annual Meeting of Shareholders.
Bank Board Committees
The Bank’s board of directors has the same three committees as the Company’s Board of Directors, the Governance Committee, the Audit Committee and the Executive Committee. Prior to and during fiscal year 2003, the bank’s board also had a Strategic Planning Committee and Compensation Committee, but those are no longer standing committees going forward, and their responsibilities have largely been assumed by the Company’s Governance Committee. The membership of the Bank’s standing committees and the committees’ responsibilities are identical to those performed by their counterpart committees on the Company level.
The Bank’s Executive Committee currently has four members, Directors J. Abernethy, R. Abernethy, Wolfe, and Timmerman. The Committee performs duties as assigned by the full board of directors of the Bank. Any action taken by the Executive Committee must be ratified by the full board. The Committee met ten times during the fiscal year ended December 31, 2003.
The Governance Committee has five members, Directors J. Abernethy, R. Abernethy, Robinson, Timmerman and Zachary. Prior to the restructuring of the Bank’s committees in 2003, the Strategic Planning Committee and the Compensation Committee performed many of the responsibilities which are now performed by the Governance Committee. With regard to the Strategic Planning Committee, those duties included the investigation of and recommendations for future branching sites, discussion of matters of general, strategic corporate direction, discussion of capital expenses associated with technology, and recommending director nominations to the full Board of Directors. Prior to establishment of the Governance Committee, the Strategic Planning Committee met two times during the fiscal year ended December 31, 2003.
Duties previously performed by the Compensation Committee which are now performed by the Governance Committee include reviewing for approval the recommendation of the President and Chief Executive Officer for the compensation of the executive officers and making recommendations to the Board of Directors for the compensation of the President and Chief Executive Officer. The Governance Committee also makes recommendations to the Board of Directors regarding the adoption of and amendments to employee benefit plans and amendments to the salary administration plan. Prior to establishment of the Governance Committee, the Compensation Committee met one time during fiscal year ended December 31, 2003. In addition, the Governance Committee met seven times during that period.
The Bank’s Audit Committee performs the same duties as the Company’s Audit Committee. It consists of Directors Zachary, Robinson, Murray, Sherrill, Timmerman and R. Abernethy. The Bank’s Audit Committee met six times during fiscal year ended December 31, 2003.
Director Compensation
Directors’ Fees. Members of the Board of Directors receive no fees or compensation for their service. However, all members of the Board of Directors are also directors of the Bank and are compensated for that service. Directors receive a fee of $600 for each Bank board of directors meeting attended. An additional fee of $300 is paid to committee
members for each committee meeting attended. In addition to these meeting fees, each director also received an annual retainer of $7,200.
The Bank maintains a Service Recognition Program, under which directors, officers and employees are eligible for awards. Under this Program, directors, officers and employees are awarded a combination of Common Stock of the Company and cash, with the amount of the award based upon the length of service to the Bank. Any Common Stock awarded under the Program is purchased by the Bank on the open market, and no new shares are issued by the Company under the Service Recognition Program.
Directors’ Stock Benefits Plan. Members of the Board of Directors are eligible to participate in the Company’s Omnibus Stock Ownership and Long Term Incentive Plan (the “Stock Benefits Plan”). Each director has been awarded 5,365 book value shares under the Stock Benefits Plan. All directors other than Mr. G. Matthews were awarded book value shares on September 28, 1999. Mr. G. Matthews was not a director at that time. The book value of the Common Stock on September 28, 1999, was $11.45 (adjusted to reflect a 10% stock dividend on April 24, 2000). The book value shares then awarded vest 20% annually, with the first 20% vesting on September 28, 2000, and the final 20% vesting on September 28, 2004. Mr. G. Matthews was awarded 5,365 book value shares upon his election to the Board of Directors on May 3, 2001. The book value of the Common Stock on May 3, 2001, was $13.95. Mr. G. Matthew’s book value shares vest at a rate of 25% annually with the first 25% having vested on May 3, 2002, and the final 25% vesting on May 3, 2005. See “-- Management Compensation - Stock Benefits Plan” for a description of the plan.
Directors’ Deferred Compensation Plan. In January 2002, the Bank established a non-qualified deferred compensation plan for all of its directors. The Bank’s directors are also directors of the Company. Under this plan, each director may defer all or a portion of his fees to the plan each year. The director may elect to invest the deferred compensation in a restricted list of eleven investment funds. The Bank may make matching contributions to the plan for the benefit of the director from time to time at the discretion of the Bank. Directors are fully vested in all amounts they contribute to the plan and in any amounts contributed by the Bank.
Benefits under the plan are payable in the event of the director’s death, resignation, removal, failure to be re-elected, retirement or in cases of hardship. Directors may elect to receive deferred compensation payments in one lump sum or in installments.
Effective December 6, 2001, the Bank established a Rabbi Trust to hold the directors’ accrued benefits under the plan. The Directors’ Deferred Compensation Plan was made effective January 1, 2002.
Directors’ Supplemental Retirement Plan. Effective January 1, 2002, the Bank implemented a non-qualified supplemental retirement benefits plan for all its directors. The plan is designed to provide a retirement benefit to the directors while at the same time minimizing the financial impact on the Bank’s earnings. The plan provides retirement benefits based on an index formula. This formula consists of the earnings on a specific life insurance policy, reduced by an amount equal to the Bank’s opportunity cost. Following a director’s retirement, the Bank pays the earnings in excess of the opportunity cost to the director annually. These payments continue for fifteen years following the director’s retirement. The Bank has purchased life insurance policies on each insurable director that are actuarially designed to offset the annual ex pense associated with the indexed formula benefit. The Bank is the sole owner of all the policies.
Executive Officers
The following table sets forth certain information with respect to the persons who are executive officers of either the Company or the Bank, or both.
Age on &nbs p; Employed By the
December 31, Positions and Occupations Company of the
Name 2003 During Last Five Years Bank Since
Tony W. Wolfe 57 President and Chief Executive Officer of the 1990
Company and the Bank
Joseph F. Beaman, Jr. 54 Executive Vice President and Corporate 1977
Secretary of the Company; Executive Vice
President, Chief Administrative Officer and
Secretary of the Bank; Prior to 2001, Chief
Financial Officer of the Company and the
Bank
William D. Cable 35 Executive Vice President and Assistant 1998
Corporate Treasurer of the Company;
Executive Vice President and Chief
Operations Officer of the Bank; Prior to
2002, Bank Senior Vice President -
Information Services
Lance A. Sellers 41 Executive Vice President and Assistant 1998
Corporate Secretary of the Company;
Executive Vice President and Chief Banking
Officer of the Bank; Prior to 2001, Bank
Executive Vice President - Credit
Administration, Mortgage Lending and
Commercial Banking. Prior to 1999, Bank
Senior Vice President - Credit
Administration
A. Joseph Lampron 49 Executive Vice President, Chief Financial 2001
Officer and Corporate Treasurer of the
Company; Executive Vice President and
Chief Financial Officer of the Bank. Prior to
December 2001, Vice President/Senior
Change Manager at a large North Carolina
bank.
Management Compensation
The executive officers of the Company are not paid any cash compensation by the Company. However, the executive officers of the Company also are executive officers of the Bank and receive compensation from the Bank.
The table on the following page shows, for the fiscal years ended December 31, 2003, 2002 and 2001, the cash compensation received by, as well as certain other compensation paid or accrued for those years, the Bank’s Chief Executive Officer and the Bank’s executive officers whose total annual salary and bonus exceeded $100,000.
| Annual Compensation | Long Term Compensation Awards | All Other | |||||
| Compensation2,3,4,5,6 | |||||||
|
|
|
|
|
| Securities Underlying |
|
|
|
|
|
| Restricted | Options/Stock |
|
Name and |
|
|
| Other Annual | Stock | Appreciation Rights |
|
Principal Position | Year | Salary | Bonus | Compensation1 | Awards | ("SARS") (in shares) | |
| Tony W. Wolfe | 2003 | $206,828 | $0 | $-- | -- | $0/0 | $12,237 |
| President and Chief Executive Officer of | 2002 | 207,840 | 0 | -- | -- | 10,000/07 | 11,827 |
| the Company and the Bank | 2001 | 205,260 | 0 | -- | -- | 9,393/08 | 11,488 |
| Joseph F. Beaman, Jr. | 2003 | $152,214 | $0 | $-- | -- | $0/0 | $7,963 |
| Executive Vice President and Corporate | 2002 | 148,509 | 3,750 | -- | -- | 4,000/07 | 7,963 |
| Secretary of the Company; Executive Vice | 2001 | 144,465 | 0 | -- | -- | 4,981/08 | 7,791 |
| President, Chief Administrative Officer and | |||||||
| Secretary of the Bank | |||||||
| Lance A. Sellers | |||||||
| Executive Vice President and Assistant | 2003 | $150,031 | $0 | $-- | -- | $0/0 | $7,648 |
| Corporate Secretary of the Company; | 2002 | 140,994 | 0 | -- | -- | 7,000/07 | 7,164 |
| Executive Vice President and Chief | 2001 | 130,595 | 0 | -- | -- | 4,821/08 | 6,601 |
| Banking Officer of the Bank | |||||||
| A. Joseph Lampron | |||||||
Excecutive Vice President, Chief Financial | 2003 | $111,593 | $0 | $-- | -- | $0/0 | $5,871 |
| Officer and Corporate Treasurer of the | 2002 | 101,751 | 10,000 | -- | -- | 6,000/07 | 5,283 |
| Company; Executive Vice President and | 2001 | 7,692 | 5,000 | -- | -- | 4,138/09 | 385 |
| Chief Financial Officer of the Bank | |||||||
| William D. Cable | |||||||
| Executive Vice President and Assistant | 2003 | $118,135 | $0 | $-- | -- | $0/0 | $5,977 |
| Corporate Treasurer of the Company; | 2002 | 110,814 | 0 | -- | -- | 6,000/07 | 5,572 |
| Executive Vice President and Chief | 2001 | 103,131 | 0 | -- | -- | 3,519/08 | 5,189 |
| Operations Officer of the Bank | |||||||
___________________________________________________________________________
Footnotes on the following page
1 Perquisites for the fiscal year did not exceed the lesser of $50,000, or 10% of salary and bonus as reported for the named employee.
2 For Mr. Wolfe, includes for 2003: $10,410 under the 401(k) plan and a $1,827 premium paid for group term life insurance in excess of $50,000; 2002: $10,000 under the 401(k) plan
and a $1,827 premium paid for group term life insurance in excess of $50,000; 2001: $9,661 under the 401(k) plan and a $1,827 premium paid for group term life insurance in excess of
$50,000
3 For Mr. Beaman, includes for 2003: $7,296 under the 401(k) plan and a $667 premium paid for group term life insurance in excess of $50,000; 2002: $7,296 under the 401(k) plan and
a $667 premium paid for group term life insurance in excess of $50,000; 2001: $7,140 under the 401(k) plan and a $651 premium paid for group term life insurance in excess of $50,000
4 For Mr. Sellers, includes for 2003: $7,355 under the 401(k) plan and a $293 premium paid for group term life insurance in excess of $50,000; 2002: $6,893 under the 401(k) plan and a
$271 premium paid for group term life insurance in excess of $50,000; 2001: $6,379 under the 401(k) plan and a $222 premium paid for group term life insurance in excess of $50,000;
5 For Mr. Lampron, includes for 2003: $5,561 under the 401(k) and a $310 premium paid for group term life insurance in excess of $50,000; 2002: $5,013 under the 401(k) and a $270
premium paid for group term life insurance in excess of $50,000; 2001: $385 under the 401(k) and a $0 premium paid for group term life insurance in excess of $50,000;
6 For Mr. Cable, includes for 2003: $5,780 under the 401(k) plan and a $197 premium paid for group term life insurance in excess of $50,000; for 2002: $5,411 under the 401(k) plan and
a $161 premium paid for group term life insurance in excess of $50,000; 2001: $5,043 under the 401(k) plan and a $146 premium paid for group term life insurance in excess of $50,000;
7 Includes 10,000; 4,000; 7,000; 6,000 and 6,000 shares subject to option granted on December 17, 2002, to Mr. Wolfe, Mr. Beaman, Mr. Sellers, Mr. Lampron, and Mr. Cable
respectively. These options, granted pursuant to the Omnibus Plan, entitle Messrs. Wolfe, Beaman, Sellers, Lampron and Cable to purchase at any time after vesting and before
December 17, 2012, shares of Common Stock in exchange for an exercise price of $14.10 per share, which was the fair market per share value of the Common Stock on the date of grant.
Of these options granted to Messrs. Wolfe, Beaman, Sellers, Lampron and Cable, one-third of the options vested on December 17, 2003, one-third will vest on December 17, 2004, and
the final third will vest on December 17, 2005. All options become 100% vested upon death, disability or a change in control of the Bank.
8 Includes 9,393; 4,981; 4,821 and 3,519 shares subject to option granted on October 30, 2001, to Mr. Wolfe, Mr. Beaman, Mr. Sellers, and Mr. Cable respectively. These options,
granted pursuant to the Omnibus Plan, entitle Messrs. Wolfe, Beaman, Sellers, and Cable to purchase at any time after vesting and before October 30, 2011, shares of Common Stock in
exchange for an exercise price of $15.94 per share, which was the fair market per share value of the Common Stock on the date of grant. Of these options granted to Messrs. Wolfe,
Beaman, Sellers, and Cable, one-third of the options vested on October 30, 2002, one-third vested on October 30, 2003, and the final third will vest on October 30, 2004. All options
become 100% vested upon death, disability or a change in control of the Bank.
9 Includes 4,138 shares subject to option granted on December 18, 2001 to Mr. Lampron. These options, granted pursuant to the Omnibus Plan, entitle Mr. Lampron to purchase at any
time after vesting and before December 18, 2011, shares of Common Stock in exchange for an exercise price of $14.70 per share, which was the fair market per share value of the
Common Stock on the date of grant. Of these options granted to Mr. Lampron, one-third of the options vested on December 18, 2002, one-third vested on December 18, 2003, and the
final third will vest on December 18, 2004. All options become 100% vested upon death, disability or a change in control of the Bank.
Employment Agreements
The Bank has entered into employment agreements with Tony W. Wolfe, President and Chief Executive Officer; Joseph F. Beaman, Jr., Executive Vice President, Chief Administrative Officer and Corporate Secretary; Lance A. Sellers, Executive Vice President, Chief Banking Officer and Assistant Corporate Secretary; A. Joseph Lampron, Executive Vice President, Chief Financial Officer and Corporate Treasurer; and William D. Cable, Executive Vice President, Chief Operations Officer and Assistant Corporate Treasurer, in order to establish their duties and compensation and to provide for their continued employment with the Bank. The agreements provide for an initial term of employment of three years. Commencing on the first anniversary date and continuing on each anniversary date thereafter, unless notice of a non-extension is given by either party, each agreement is automatically extended fo r an additional year so that the remaining term shall always be no less than two and no more than three years. The agreements also provide that the base salary shall be reviewed by the Board of Directors not less often than annually. In addition, the employment agreements provide for discretionary bonuses and participation in other management incentive, pension, profit-sharing, medical or retirement plans maintained by the Bank, as well as fringe benefits normally associated with such employee’s office. Mr. Wolfe’s agreement provides for a company automobile and Mr. Beaman’s agreement provides for a monthly automobile allowance. The employment agreements provide that they may be terminated by the Bank for cause, as defined in the agreements, and that they may otherwise be terminated by the Bank (subject to vested rights) or by the employee.
In the event of a change in control, the term of the employment agreements shall be automatically extended for three years from the date of the change of control. For purposes of the employment agreement, a change in control generally will occur if (i) any “person” (as such term is used in Section 13(d) and 14(d) of the Exchange Act), other than a person who beneficially owned as of January 1, 1998, more than 5% of the Bank’s securities, acquires beneficial ownership of voting stock and
irrevocable proxies representing 20% or more of any class of voting securities of either the Company or the Bank, (ii) the election of directors constituting more than one-half of the Board of Directors of the Company or the Bank who, prior to their election, were not nominated for election or approved by at least three-fourths of the Board of Directors of the Company as then constituted; (iii) either the Company or the Bank consolidates or merges with or into another corporation, association or entity or is otherwise reorganized, where neither the Company nor the Bank, respectively, is the surviving corporation in the transaction; or (iv) all or substantially all of the assets of either the Company or the Bank are sold or otherwise transferred to or acquired by any other entity or group.
In addition, the employee may voluntarily terminate his employment at any time following a change in control and continue to receive his base salary for the remainder of the term of the employment agreement, if, after the change in control, (i) the employee is assigned duties and/or responsibilities that are inconsistent with his position prior to the change in control or that are inconsistent with his reporting responsibilities at that time, (ii) the employee’s compensation or benefits are reduced, or (iii) the employee is transferred, without his consent, to a location which is an unreasonable distance from his current principal work location.
An additional fourteen middle management officers had employment agreements during 2003. The term of these agreements was until December 1, 2005, and the agreements contain provisions similar to those discussed above.
Equity Compensation Plan Information
The following table presents the number of shares of Company stock to be issued upon the exercise of outstanding options; the weighted-average price of the outstanding options and the number of options remaining that may be issued under the Company’s stock option plans described above.
Plan Category | Number of securities to be issued upon exercise of outstanding options, warrants and rights | Weighted-average exercise price of outstanding options, warrants and rights | Number of securities remaining available for future issuance under equity compensation plans (excluding securities reflected in column (a)) |
(a) | (b) | (c) | |
Equity compensation plans approved by security holders | 198,6791 | $14.582 | 55,592 |
Equity compensation plans not approved by security holders | 0 | 0 | 0 |
Total | 198,679 | $14.58 | 55,592 |
1Of the198,679stock options issued under the Omnibus Plan, a total of128,983 of those stock options have vested or are exercisable within 60 days. Of the outstanding stock options, options to purchase a total of 26,726 shares of the Common Stock were granted on September 28, 1999; 46,551 options were granted on September 25, 2000; 53,714 options were granted on October 30, 2001; 4,138 options were granted on December 18, 2001; and 67,550 options were granted on December 17, 2002.
2The exercise prices for the grants of stock options under the Omnibus Plan on September 28, 1999; September 25, 2000; October 30, 2001; December 18, 2001; and December 17, 2002 are $16.36 (as adjusted due to a 10% stock dividend granted on April 24, 2000); $12.69; $15.94; $14.70; and $14.10, respectively.
Stock Benefits Plan
General. The Board of Directors has implemented the Omnibus Stock Ownership and Long Term Incentive Plan (the “Omnibus Plan”) which was approved by the Company’s shareholders on May 13, 1999. The purpose of the Omnibus Plan is to promote the interests of the Company by attracting and retaining directors and employees of outstanding ability and to provide executive and other key employees of the Company and its subsidiaries greater incentive to make material contributions to the
success of the Company by providing them with stock-based compensation which will increase in value based upon the market performance of the Common Stock and/or the corporate achievement of financial and other performance objectives.
The Omnibus Plan is administered by the Compensation Committee of Board of Directors (the "Committee"). Subject to the terms of the Omnibus Plan, the Committee and the board of directors have authority to construe and interpret, for eligible employees and eligible directors, respectively, the Omnibus Plan, to determine the terms and provisions of Rights (as defined below) to be granted under the Omnibus Plan, to define the terms used in the Omnibus Plan and in the Rights granted thereunder, to prescribe, amend and rescind rules and regulations relating to the Omnibus Plan, to determine the individuals to whom and the times at which Rights shall be granted and the number of shares to be subject to, or to underlie, each Right awarded, and to make all other determinations necessary or advisable for the administration of the Omnibus Plan.
Rights Which May Be Granted.Under the Omnibus Plan, the Committee may grant or award eligible participants Options, rights to receive restricted shares of Common Stock, long term incentive units (each equivalent to one share of Common Stock), SARs, and/or Book Value Shares. These grants and awards are referred to herein as the "Rights." All Rights must be granted or awarded by March 30, 2009, the tenth anniversary of the date the Board of Directors adopted the Omnibus Plan. As of December 31, 2003, Rights representing 55,592 shares of Common Stock (adjusted to reflect the April 24, 2000 10% stock dividend) were eligible to be awarded under the Omnibus Plan.
Options. Options granted under the Omnibus Plan to eligible directors and employees may be either incentive stock options ("ISOs") or non-qualified options ("NSOs"). The exercise price of an Option may not be less than 100% of the last-transaction price for the Common Stock quoted by the Nasdaq National Market on the date of grant.
The Committee shall determine the expiration date of each Option granted, up to a maximum of ten years from the date of grant. In the Committee's discretion, it may specify the period or periods of time within which each Option will first become exercisable, which period or periods may be accelerated or shortened by the Committee.
Each Option granted will terminate upon the expiration date established by the Committee or upon the earlier of (i) twelve months after the holder ceases to be an eligible employee or director by reason of death or disability, and (ii) immediately as of the date the holder is no longer an eligible employee or director for any reason other than death or disability. In the event of a change in control (as that term is defined in the Omnibus Plan), any unvested options granted under the Omnibus Plan will immediately and automatically vest.
Restricted Stock. The Committee may award Rights to acquire shares of Common Stock subject to certain transfer restrictions (“Restricted Stock”) to eligible participants under the Omnibus Plan for such purchase price per share, if any, as the Committee, in its discretion, may determine appropriate. The Committee shall determine the expiration date for each Restricted Stock award, up to a maximum of ten years from the date of grant. In the Committee’s discretion, it may specify the period or periods of time within which each Restricted Stock award will first become exercisable, which period or periods may be accelerated or shortened by the Committee.
Awards of Restricted Stock shall terminate in the same manner as described above in connection with the termination of Options.
Units. Under the Omnibus Plan, the Committee may grant to eligible directors and employees awards of long term incentive units, each equivalent in value to one share of Common Stock (“Units”). Except as otherwise provided, Units awarded may be distributed only after the end of a performance period of two or more years, as determined by the Committee, beginning with the year in which the awards are granted.
The percentage of the Units awarded that are to be distributed will depend on the level of financial and other performance goals achieved by the Company during the performance period. The Committee may adopt one or more performance categories in addition to, or in substitution for, a performance category or may eliminate all performance categories other than financial performance. All performance categories other than financial performance may not be applied in the aggregate as a factor of more than one against financial performance.
As soon as practicable after each performance period, the percentage of Units awarded that are to be distributed, based on the levels of performance achieved, will be determined and distributed to the recipients of such awards in the form of a
combination of shares of Common Stock and cash. Units awarded, but which the recipients are not entitled to receive, will be cancelled.
In the event of the death or disability of a Unit recipient prior to the end of any performance period, the number of Units awarded for such performance period will be reduced in proportion to the number of months remaining in the performance period after the date of death or disability; and the remaining portion of the award, if any, may, in the discretion of the Committee, be adjusted based upon the levels of performance achieved prior to the date of death or disability, and distributed within a reasonable time after death or disability. In the event a recipient of Units ceases to be an eligible director or employee for any reason other than death or disability, all Units awarded, but not yet distributed, will be cancelled.
In the event of a change in control (as that term is defined in the Omnibus Plan), any outstanding Units will immediately and automatically be reduced as appropriate to reflect a shorter performance period.
An amount equal to the dividend payable on one share of Common Stock (a “dividend equivalent credit”) will be determined and credited on the payment date to each Unit recipient’s account for each Unit awarded and not yet distributed or cancelled. Such amount will be converted within the account to an additional number of Units equal to the number of shares of Common Stock which could be purchased at the last-transaction price of the Common Stock on the Nasdaq National Market on the dividend payment date.
No dividend equivalent credits or distribution of Units may be credited or made if, at the time of crediting or distribution, (i) the regular quarterly dividend on the Common Stock has been omitted and not subsequently paid or there exists any default in payment of dividends on any such outstanding shares of Common Stock; (ii) the rate of dividends on the Common Stock is lower than at the time the Units to which the dividend equivalent credit relates were awarded, adjusted for certain changes; (iii) estimated consolidated net income of the Company for the twelve-month period preceding the month the dividend equivalent credit or distribution would otherwise have been made is less than the sum of the amount of the dividend equivalent credits and Units eligible for distribution under the Omnibus Plan in that month plus all dividends applicable to such period on an accrual basis, eithe r paid, declared or accrued at the most recently paid rate, on all outstanding shares of Common Stock; or (iv) the dividend equivalent credit or distribution would result in a default in any agreement by which the Company is bound.
If an extraordinary event occurs during a performance period which significantly alters the basis upon which the performance levels were established, the Committee may make adjustments which it deems appropriate in the performance levels. Such events may include changes in accounting practices, tax, financial institution laws or regulations or other laws or regulations, economic changes not in the ordinary course of business cycles, or compliance with judicial decrees or other legal requirements.
Stock Appreciation Rights. The Omnibus Plan provides that the Committee may award to eligible directors and employees Rights to receive cash based upon increases in the market price of Common Stock over the last transaction price of the Common Stock on the Nasdaq National Market (the "Base Price") on the date of the award. The Committee may adjust the Base Price of a SAR based upon the market value performance of the Common Stock in comparison with the aggregate market value performance of a selected index or at a stated annual percentage rate. The expiration date of a SAR may be no more than ten years from the date of award.
Each SAR awarded by the Committee may be exercisable immediately or may become vested over such period or periods as the Committee may establish, which periods may be accelerated or shortened in the Committee's discretion.
Each SAR awarded will terminate upon the expiration date established by the Committee, termination of the employment or directorship of the SAR recipient, or in the event of a change in control, as described above in connection with the termination of Options.
Book Value Shares. The Omnibus Plan provides that the Committee may award to eligible directors and eligible employees long term incentive units, each equivalent in value to the book value of one share of Common Stock on the date of award (“Book Value Shares”). The Committee shall specify the period or periods of time within which each Book Value Share will vest, which period or periods may be accelerated or shortened by the Committee. Upon redemption, the holder of a Book Value Share will receive an amount equal to the difference between the book value of the Common Stock at the time the Book Value Share is awarded and the book value of the Common Stock at the time the Book Value Share is redeemed, adjusted for the
effects of dividends, new share issuances, and mark-to-market valuations of the Company’s investment securities portfolio in accordance with FASB 115.
The expiration date of each Book Value Share awarded shall be established by the Committee, up to a maximum of ten years from the date of award. However, awards of Book Value Shares shall earlier terminate in the same manner as described above in connection with the termination of Options.
Adjustments.In the event the outstanding shares of the Common Stock are increased, decreased, changed into or exchanged for a different number or kind of securities as a result of a stock split, reverse stock split, stock dividend, recapitalization, merger, share exchange acquisition, or reclassification, appropriate proportionate adjustments will be made in (i) the aggregate number or kind of shares which may be issued pursuant to exercise of, or which underlie, Rights; (ii) the exercise or other purchase price, or Base Price, and the number and/or kind of shares acquirable under, or underlying, Rights; (iii) and rights and matters determined on a per share basis under the Omnibus Plan. Any such adjustment will be made by the Committee, subject to ratification by the Board of Directors. As described above, the Base Price of a SAR may also be adjusted by the Committee to reflect changes in a selected index. Except with regard to Units and Book Value Shares awarded under the Omnibus Plan, no adjustment in the Rights will be required by reason of the issuance of Common Stock, or securities convertible into Common Stock, by the Company for cash or the issuance of shares of Common Stock by the Company in exchange for shares of the capital stock of any corporation, financial institution or other organization acquired by the Company or a subsidiary thereof in connection therewith.
Any shares of Common Stock allocated to Rights granted under the Omnibus Plan, which Rights are subsequently cancelled or forfeited, will be available for further allocation upon such cancellation or forfeiture.
Federal Income Tax Consequences.
Options. Under current provisions of the Code, the federal income tax treatment of ISOs and NSOs is different. Options granted to employees under the Omnibus Plan may be ISOs which are designed to result in beneficial tax treatment to the employee but not a tax deduction to the Company.
The holder of an ISO generally is not taxed for federal income tax purposes on either the grant or the exercise of the option. However, the optionee must include in his or her federal alternative minimum tax income any excess (the “Bargain Element”) of the acquired common stock’s fair market value at the time of exercise over the exercise price paid by the optionee. Furthermore, if the optionee sells, exchanges, gives or otherwise disposes of such common stock (other than in certain types of transactions) either within two years after the option was granted or within one year after the option was exercised (an “Early Disposition”), the optionee generally must recognize the Bargain Element as compensation income for regular federal income tax purposes. Any gain realized on the disposition in excess of the Bargain Element is subject to recognition under the u sual rules applying to dispositions of property. If a taxable sale or exchange is made after such holding periods are satisfied, the difference between the exercise price and the amount realized upon the disposition of the common stock generally will constitute a capital gain or loss for tax purposes.
Options granted to directors under the Omnibus Plan would be “NSOs.” In general, the holder of an NSO will recognize at the time of exercise of the NSO, compensation income equal to the amount by which the fair market value of the common stock received on the date of exercise exceeds the sum of the exercise price and any amount paid for the NSO.
If an optionee exercises an ISO or NSO and delivers shares of common stock as payment for part or all of the exercise price of the stock purchased (the “Payment Stock”), no gain or loss generally will be recognized with respect to the Payment Stock; provided, however, if the Payment Stock was acquired pursuant to the exercise of an ISO, the optionee will be subject to recognizing as compensation income the Bargain Element on the Payment Stock as an Early Disposition if the exchange for the new shares occurs prior to the expiration of the holding periods for the Payment Stock.
The Company generally would not recognize gain or loss or be entitled to a deduction upon either the grant of an ISO or NSO or the optionee’s exercise of an ISO. The Company generally will recognize gain or loss or be entitled to a deduction upon the exercise of an NSO. If there is an Early Disposition, the Company generally would be entitled to deduct the Bargain Element as compensation paid to the optionee.
Restricted Stock. Pursuant to Section 83 of the Code, recipients of Restricted Stock awards under the Omnibus Plan will recognize ordinary income in an amount equal to the fair market value of the shares of Common Stock granted to them at the time that
the shares vest and become transferable. The Company will be entitled to deduct as a compensation expense for tax purposes the same amounts recognized as income by recipients of Restricted Stock awards in the year in which such amounts are included in income.
Units. The Company expects that participants generally will not be taxed on the award of Units. Instead, any cash and the then fair market value of any Common Stock received by the participants upon the distribution of a Unit generally will be taxable to the participants as compensation income upon such distribution. At that time, the Company generally will be entitled to claim a deduction in an amount equal to the compensation income.
SARs. Pursuant to Section 83 of the code, recipients of SARs under the Omnibus Plan will recognize, at the time a SAR award is exercised, ordinary income in an amount equal to the difference between the fair market value of the Common Stock at the time of award of the SAR and the fair market value of the Common Stock at the time that the SAR is exercised. The Company will be entitled to deduct as a compensation expense for tax purposes the same amounts recognized as income by recipients of SAR awards in the year in which such amounts are included in income.
Book Value Shares.The Company expects that participants generally will not be taxed on the award of Book Value Shares. Instead, any cash received by the participants upon redemption of the Book Value Shares generally will be taxable to the participant as compensation income upon distribution. At that time, the Company generally will be entitled to claim a deduction in an amount equal to the compensation income.
The above description of tax consequences under federal law is necessarily general in nature and does not purport to be complete. Moreover, statutory provisions are subject to change, as are their interpretations, and their application may vary in individual circumstances. Finally, the consequences under applicable state and local income tax laws may not be the same as under the federal income tax laws.
Grants and Awards Made During the Fiscal Year Ended December 31, 2003. No grants of options to purchase shares of Common Stock were awarded to officers or employees of the Bank in the fiscal year ended December 31, 2003. In addition, no options were exercised by Mr. Wolfe, Mr. Beaman, Mr. Sellers, Mr. Lampron or Mr. Cable during the fiscal year ended December 31, 2003. The table below shows the number and value of options of the Company’s named executive officers at the end of fiscal year 2003.
Aggregated Option/SAR Exercises in Last Fiscal Year
and Fiscal Year-End Option/SAR Values
Name | Shares Acquired on Exercise (#) | Value Realized ($) | Number of Securities Underlying Unexercised Options/SARs at Fiscal Year End1, 2 | Value of Unexercised In-the-Money Options/SARs at Fiscal Year End3 | ||
Exercisable | Unexercisable | Exercisable | Unexercisable | |||
Tony W. Wolfe | 0 | $0 | 25,342/0 | 11,230/0 | $414,376/$0 | $183,619/$0 |
Joseph F. Beaman Jr. | 0 | $0 | 13,853/0 | 5,187/0 | $226,515/$0 | $84,821/$0 |
Lance A. Sellers | 0 | $0 | 12,141/0 | 6,812/0 | $198,522/$0 | $111,392/$0 |
A. Joseph Lampron | 0 | $0 | 4,758/0 | 5,380/0 | $42,441/$0 | $47,990/$0 |
William D. Cable | 0 | $0 | 7,583/0 | 5,369/0 | $123,992/$0 | $87,789/$0 |
_______________________
1 Options to purchase 15,117 shares of Common Stock (adjusted to reflect the April 24, 2000 10% stock dividend) were granted to Messr. Wolfe, Beaman, Sellers and Cable as of September 28, 1999. Pursuant to an amendment to the Stock Option Grant Agreements dated September 25, 2000 these options vest 20% each year over a five-year period beginning on September 28, 2000, with the last 20% vesting on September 28, 2004. Options to purchase 22,686 shares of Common Stock were granted to the Messr. Wolfe, Beaman, Sellers and Cable as of September 25, 2000. One-third of these options vested on September 25, 2001, one-third vested on September 25, 2002 and one-third vested on September 25, 2003. Options to purchase 22,714 shares of Common Stock were granted to Messr. Wolfe, Beaman, Sellers and Cable as of October 30, 2001. One-third vested on October 30, 2002, one-third vested on October 30, 2003, and one-third will vest on October 30, 2004. Options to purchase 33,000 share s of Common Stock were granted to all the named persons (including Mr. Lampron) as of December 17, 2002. One-third vested on December 17, 2003, one-third will vest on December 17, 2004, and one-third will vest on December 17, 2005. No options to purchase shares of Common Stock were granted in the fiscal year ended December 31, 2003.
2 Options to purchase 4,138 shares of Common Stock were granted to Mr. Lampron as of December 18, 2001. One-third vested on December 18, 2002, one-third vested on December 18, 2003 and one-third will vest on December 18, 2004.
3 The exercise price of the stock options granted to Messr. Wolfe, Beaman, Sellers and Cable on September 28, 1999 is $16.36 (adjusted to reflect the April 24, 2000 10% stock dividend). The exercise price of the stock options granted to them on September 25, 2000 is $12.69. The exercise price of the stock options granted to them on October 30, 2001 is $15.94. The exercise price of stock options granted to Mr. Lampron on December 18, 2001 is $14.70. The exercise price of stock options granted to all named persons on December 17, 2002 is $14.10. On December 31, 2003, the closing market price for the Common Stock as reported on the Nasdaq National Market was $18.86.
Incentive Compensation Plans
The Bank also has a Management Incentive Plan for officers and an Employee Incentive Plan for employees of the Bank. Eligibility under the Employee Incentive Plan is granted to all employees upon ninety (90) days of service with the Bank. Participants in the Employee Incentive Plan are entitled to receive quarterly cash incentives based upon a graduated schedule indexed to attainment of corporate budget. Participants in the Management Incentive Plan are recommended annually by the President and Chief Executive Officer to the Bank’s Board of Directors. Each individual’s incentive pool is determined by a formula which links attainment of corporate budget with attainment of individual goals and objectives. Incentives under the Management Incentive Plan are paid annually.
Profit Sharing Plan and 401(k) Plan
The Bank has a Profit Sharing Plan and 401(k) Plan for all eligible employees. The Bank made no contribution to the Profit Sharing Plan for the year ended December 31, 2003. No investments in Bank stock have been made by the plan.
Under the Bank’s 401(k) plan, the Bank matches employee contributions to a maximum of five percent of annual compensation. The Bank’s 2003 contribution to the 401(k) Plan pursuant to this formula was approximately $306,000. All contributions to the 401(k) Plan are tax deferred.
The Profit Sharing Plan and 401(k) Plan permit participants to choose from ten investment funds which are selected by a committee comprised of selected directors and senior management. Both the 401(k) Plan and Profit Sharing Plan were amended in 2000 to permit participation in the plans beginning in the second month of employment. As of December 31, 2003, both plans provide for vesting of 20% of the benefit after two years employment and 20% each year thereafter until participants are 100% vested after six years employment.
Deferred Compensation Plan
In January 2002, the Bank established a non-qualified deferred compensation plan for directors and certain officers. Eligible officers selected by the Bank’s board of directors may elect to contribute a percentage of their compensation to the plan. The Bank may make matching or other contributions to the plan as well, in amounts determined at the discretion of the Bank. Participants are fully vested in all amounts contributed to the plan by them or on their behalf.
Benefits under the plan are payable in the event of the participant’s retirement, death, termination, or as a result of hardship. Benefit payments may be made in a lump sum or in installments, as selected by the participant.
Effective December 6, 2001, the Bank established a Rabbi Trust to hold the accrued benefits of the participants under the plan.
Supplemental Retirement Plan
Effective January 1, 2002, the Bank implemented a non-qualified supplemental retirement benefits plan for certain officers. The plan is designed to provide a retirement benefit to the officers while at the same time minimizing the financial impact on the
Bank’s earnings. The plan provides retirement benefits based on an index formula. The index formula consists of the earnings on a specific life insurance policy, reduced by an amount equal to the Bank’s opportunity cost. Following an officer’s retirement, the Bank pays the earnings in excess of the opportunity cost to the officer annually. These payments continue for a period between ten years and the life of the officer. The Bank has purchased life insurance policies on the participating officers that are actuarially designed to offset the annual expenses associated with the index formula benefit. The Bank is the sole owner of all of the policies.
Discretionary Bonuses and Service Awards
In the past, the Bank has paid bonuses to its employees in amounts determined in the discretion of the Bank’s board of directors. The Bank anticipates that discretionary bonuses will continue to be paid to its employees in the future.
Indebtedness of and Transactions with Managementand Directors
Certain directors and executive officers of the Bank and their immediate families and associates were customers of and had transactions with the Bank in the ordinary course of business during 2003. All outstanding loans, extensions of credit or overdrafts, endorsements and guarantees outstanding at any time during 2003 (i) were made in the ordinary course of business, (ii) were made on substantially the same terms, including interest rates and collateral, as those prevailing at the time for comparable transactions with other persons, and (iii) were transactions which in the opinion of management of the Bank did not involve more than the normal risk of collectibility or present other unfavorable features.
Loans made to Eckard Vending Company, Inc., totaling approximately $3.7 million have been classified on “low substandard” status. These loans continue to accrue interest. The President of Eckard Vending Company, Inc. is former Director Bruce R. Eckard. In addition, loans of approximately $2.164 million made to Elmore Construction Company, Inc. and John H. Elmore, Jr, a former director of the Bank and Company, were placed on non-accrual status during 2003. The remaining balance at December 31, 2003 was $1.561 million. On November 4, 2003, the Bank filed an action against Mr. Elmore in Catawba County Superior Court seeking to recover the full amount of the loans.
REPORT OF COMPENSATION COMMITTEE
The Company does not have a Compensation Committee. The Bank’s board of directors had a Compensation Committee, however, prior to restructuring of the Bank’s board committees in 2003. The Bank’s Compensation Committee was composed of Directors R. Abernethy, Robinson, Sherrill, and Timmerman. The Committee met on an as needed basis to review the Bank’s salary program and to make recommendations to the Bank’s board of directors regarding compensation of the executive officers. The Bank’s board of directors ultimately determined, and still determines, such compensation. The duties previously performed by the Bank’s Compensation Committee are now performed by its Governance Committee. The salary of each of the executive officers is determined based upon the executive officer’s contributions to the Bank’s overall profitability, maintenance of regulatory compliance standards, professional leadership, and management effectiveness in meeting the needs of day-to-day operations. The Compensation Committee would also compare the compensation of the executive officers with compensation paid to executives of other businesses in the Bank’s market area, as well as to appropriate state and national salary data. These factors were considered in establishing the compensation of Tony W. Wolfe, President and Chief Executive Officer; Joseph F. Beaman, Jr., Executive Vice President, Chief Administrative Officer and Corporate Secretary; Lance A. Sellers, Executive Vice President, Chief Banking Officer and Assistant Corporate Secretary; A. Joseph Lampron, Executive Vice President, Chief Financial Officer and Corporate Treasurer; and William D. Cable, Executive Vice President, Chief Operations Officer and Assistant Corporate Treasurer, during the 2003 fiscal year. In addition, all of the executive officers of the Bank are eligible to receive discretionary bonu ses declared by the Bank’s board of directors. The amount of such bonuses and incentive payments is based upon the net income of the Bank in comparison to attainment of corporate budget and attainment of corporate goals and objectives.
Robert C. Abernethy Larry E. Robinson
Fred L. Sherrill, Jr. Dan Ray Timmerman, Sr.
COMPENSATION COMMITTEE INTERLOCKS
AND INSIDER PARTICIPATION
As previously stated, the Company does not have a Compensation Committee. However, the Bank’s board of directors has a Compensation Committee which is composed of Directors R. Abernethy, Robinson, Sherrill, and Timmerman. No member of the Compensation Committee is now, or formerly was, an officer or employee of the Company or the Bank. Tony W. Wolfe, President and Chief Executive Officer of the Bank, makes recommendations to the Committee regarding compensation of the executive officers. Mr. Wolfe participates in the deliberations, but not the decisions, of the Committee regarding compensation of executive officers other than himself. He does not participate in the Committee’s discussions or decisions regarding his own compensation.
REPORT OF AUDIT COMMITTEE
The Company has adopted a written charter for the Audit Committee which is reviewed annually, and amended as needed, by the Committee. The Audit Committee has reviewed and discussed the audited financial statements with management of the Company and has discussed with the independent auditors the matters required to be discussed by SAS 61. In addition, the Committee has received the written disclosures and the letter from the independent accountants required by Independence Standards Board Standard No. 1, and has discussed with the independent accountant the independent accountant’s independence. Based upon these reviews and discussions, the Committee recommended to the Board of Directors that the audited financial statements be included in the Company’s Annual Report on Form 10-K for the fiscal year ended December 31, 2003.
Robert C. Abernethy Larry E. Robinson
Dan R. Timmerman,Sr. Fred L. Sherrill, Jr.
Benjamin I. Zachary Charles F. Murray
PERFORMANCE GRAPH
The following graph compares the Company’s cumulative shareholder return on its Common Stock with a NASDAQ index and with a southeastern bank index. The graph was prepared by SNL Securities, L.C., Charlottesville, Virginia, using data as of December 31, 2003.
COMPARISON OF SIX-YEAR CUMULATIVE TOTAL RETURNS
Performance Report for
Peoples Bancorp of North Carolina, Inc.
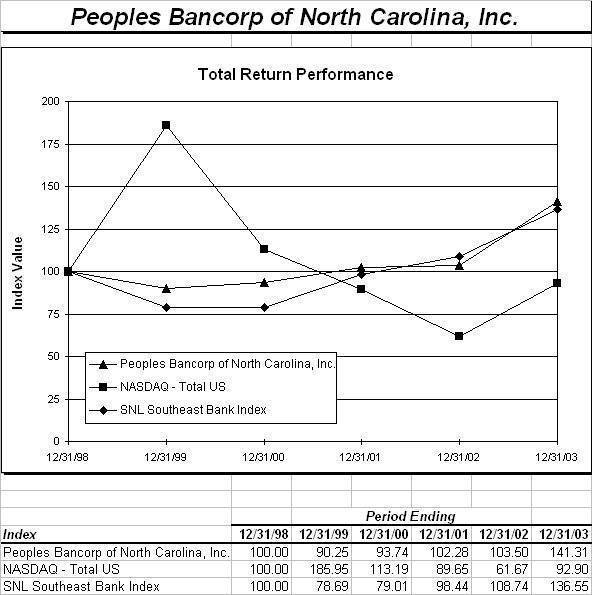
*Source: CRSP, Center for Research in Security Prices, Graduate School of Business, The University of Chicago 2004.
Used with permission. All rights reserved. crsp.com.
SNL Financial LC ; (434) 977-1600
© 2004
PROPOSAL 2
RATIFICATION OF SELECTION OF INDEPENDENT AUDITOR
Porter Keadle Moore, LLP, of Atlanta, Georgia (“PKM”), has been selected by the Auditing and Examining Committee as the Company’s and the Bank’s independent auditor for the year ending December 31, 2004. Such selection is being submitted to the Company’s shareholders for ratification. Representatives of PKM are expected to attend the Meeting and will be afforded an opportunity to make a statement, if they so desire, and to respond to appropriate questions from shareholders.
Audit Fees
The aggregate fees billed by PKM for professional services rendered in connection with the (i) audit of the Company’s annual financial statements for 2003 and 2002, and (ii) review of the financial statements included in the Company’s quarterly filings on Form 10-Q during those fiscal years were approximately $120,000 and $110,000, respectively.
Audit Related Fees
The aggregate fees billed by PKM in 2003 and 2002 for professional services rendered for assurance and related
services that are reasonably related to the performance of the audit or review of the Company’s financial statements and not included in “Audit Fees” above were approximately $19,000 and $16,000, respectively. These fees were primarily related to the audit of the Company’s profit sharing and 401(k) plan and the testing of management’s assertions regarding internal controls in accordance with the Federal Deposit Insurance Corporation Improvement Act.
Tax Fees
The aggregate fees billed in each of the last two fiscal years for professional services rendered by PKM for tax
compliance, tax advice, and tax planning were approximately $15,000 and $22,000 in 2003 and 2002, respectively. These fees were primarily related to the preparation of the Company’s income tax returns and Forms 5500 for various benefit plans.
All Other Fees
In addition to the fees outlined above, PKM billed fees in the amounts of approximately $4,000 and $13,000 in fiscal
years 2003 and 2002, respectively, for additional services rendered during each of those years. These fees were primarily related to collateral verification testing and consultation on various accounting matters.
The fees billed by PKM are pre-approved by the Audit and Examining Committee of the Company in accordance with the policies and procedures for the Audit and Examining Committee set forth in the committee’s charter. The Audit and Examining Committee typically pre-approves all audit and non-audit services provided by the Company’s independent auditors and may not engage the independent auditors to perform any prohibited non-audit services. For 2003, 100% of the audit related fees incurred were pre-approved. Ninety percent (90%) of the non-audit services were pre-approved. The Audit and Examining Committee has determined that the rendering of non-audit professional services by PKM, as identified above, is compatible with maintaining PKM’s independence.
THE BOARD OF DIRECTORS RECOMMENDS THAT THE SHAREHOLDERS VOTEFOR RATIFICATION OF THE APPOINTMENT OF PKM AS INDEPENDENT AUDITOR FOR THE COMPANY AND THE BANK FOR THE FISCAL YEAR ENDING DECEMBER 31, 2004.
DATE FOR RECEIPT OF SHAREHOLDER PROPOSALS
It is presently anticipated that the 2005 Annual Meeting of Shareholders of the Company will be held on May 5, 2005. In order for shareholder proposals to be included in the Company’s proxy materials for that meeting, such proposals must be received by the Secretary of the Company at the Company’s principal executive office no later than December 3, 2004 and meet all other applicable requirements for inclusion in the proxy statement.
In the alternative, a shareholder may commence his or her own proxy solicitation and present a proposal from the floor at the 2005 Annual Meeting of Shareholders of the Company. In order to do so, the shareholder must notify the Secretary of the
Company in writing,at the Company’s principal executive office no later than February 17, 2005, of his or her proposal. If the Secretary of the Company is not notified of the shareholder’s proposal by February 17, 2005, the Board of Directors may vote on the proposal pursuant to the discretionary authority granted by the proxies solicited by the Board of Directors for the 2005 Annual Meeting.
OTHER MATTERS
Management knows of no other matters to be presented for consideration at the Meeting or any adjournments thereof. If any other matters shall properly come before the Meeting, it is intended that the proxyholders named in the enclosed form of proxy will vote the shares represented thereby in accordance with their judgment, pursuant to the discretionary authority granted therein.
MISCELLANEOUS
The Annual Report of the Company for the year ended December 31, 2003, which includes financial statements audited and reported upon by the Company’s independent auditor, is being mailed as Appendix A to this Proxy Statement; however, it is not intended that the Annual Report be deemed a part of this Proxy Statement or a solicitation of proxies.
THE FORM 10-K FILED BY THE COMPANY WITH THE SEC, INCLUDING THE FINANCIAL STATEMENTS AND SCHEDULES THERETO, WILL BE PROVIDED FREE OF CHARGE UPON WRITTEN REQUEST DIRECTED TO: PEOPLES BANCORP OF NORTH CAROLINA, INC., POST OFFICE BOX 467, 518 WEST C STREET, NEWTON, NORTH CAROLINA 28658-0467, ATTENTION: A. JOSEPH LAMPRON.
By Order of the Board of Directors,
/s/ Tony Wolfe
Tony W. Wolfe
President and Chief Executive Officer
Newton, North Carolina
April 2, 2004
APPENDIX A
PEOPLES BANCORP OF NORTH CAROLINA, INC.
General Description of Business
Peoples Bancorp of North Carolina, Inc. (the “Company”), was formed in 1999 to serve as the holding company for Peoples Bank (the “Bank”). The Company is a bank holding company registered with the Board of Governors of the Federal Reserve System (the “Federal Reserve”) under the Bank Holding Company Act of 1956, as amended (the “BHCA”). The Company’s sole activity consists of owning the Bank. The Company’s principal source of income is any dividends which are declared and paid by the Bank on its capital stock. The Company has no operations and conducts no business of its own other than owning the Bank. Accordingly, the discussion of the business which follows concerns the business conducted by the Bank, unless otherwise indicated.
The Bank, founded in 1912, is a state-chartered commercial bank serving the citizens and business interests of the Catawba Valley and surrounding communities through 15 offices located in Lincolnton, Newton, Denver, Catawba, Conover, Maiden, Claremont, Hiddenite, and Hickory, North Carolina. At December 31, 2003, the Company had total assets of $674.0 million, net loans of $542.4 million, deposits of $549.8 million, investment securities of $79.5 million, and shareholders’ equity of $48.6 million.
The Bank has a diversified loan portfolio, with no foreign loans and few agricultural loans. Real estate loans are predominately variable rate commercial property loans. Commercial loans are spread throughout a variety of industries with no one particular industry or group of related industries accounting for a significant portion of the commercial loan portfolio. The majority of the Bank's deposit and loan customers are individuals and small to medium-sized businesses located in the Bank's market area.
The operations of the Bank and depository institutions in general are significantly influenced by general economic conditions and by related monetary and fiscal policies of depository institution regulatory agencies, including the Federal Reserve, the Federal Deposit Insurance Corporation (the “FDIC”) and the North Carolina Commissioner of Banks (the "Commissioner").
At December 31, 2003, the Bank employed 203 full-time equivalent employees.
The Bank is a subsidiary of the Company. The Bank has two subsidiaries, Peoples Investment Services, Inc. and Real Estate Advisory Services, Inc.Through a relationship with Raymond James Financial Services, Inc., Peoples Investment Services, Inc. provides the Bank's customers access to investment counseling and non-deposit investment products such as stocks, bonds, mutual funds, tax deferred annuities, and related brokerage services. Real Estate Advisory Services, Inc., provides real estate appraisal and real estate brokerage services.
In December 2001 the Company formed a wholly owned Delaware statutory trust, PEBK Capital Trust I (“PEBK Trust”), which issued $14.0 million of guaranteed preferred beneficial interests in the Company’s junior subordinated deferrable interest debentures that qualify as Tier I capital under Federal Reserve Board guidelines. All of the common securities of PEBK Trust are owned by the Company.The proceeds from the issuance of the common securities and the trust preferred securities were used by PEBK Trust to purchase $14.4 million of junior subordinated debentures of the Company, which pay interest at a floating rate equal to prime plus 50 basis points. The proceeds received by the Company from the sale of the junior subordinated debentures were used for general purposes,primarily to provide capital to the Ba nk. The debentures represent the sole asset of PEBK Trust. As discussed under the heading entitled “Recent Accounting Pronouncements” in note 1 to the consolidated financial statements, PEBK Trust was deconsolidated by the Company under FIN 46 as of December 31, 2003.
This report contains certain forward-looking statements with respect to the financial condition, results of operations and business of Peoples Bancorp of North Carolina, Inc. (the “Company”). These forward-looking statements involve risks and uncertainties and are based on the beliefs and assumptions of management of the Company and on the information available to management at the time that these disclosures were prepared. These statements can be identified by the use of words like “expect,” “anticipate,” “estimate” and “believe,” variations of these words and other similar expressions. Readers should not place undue reliance on forward-looking statements as a number of important factors could cause actual results to differ materially from those in the forward-looking statements. Factors that could cause actual results t o differ materially include, but are not limited to, (1) competition in the markets served by Peoples Bank (the “Bank”), (2) changes in the interest rate environment, (3) general national, regional or local economic conditions may be less favorable than expected, resulting in, among other things, a deterioration in credit quality and the possible impairment of collectibility of loans, (4) legislative or regulatory changes, including changes in accounting standards, (5) significant changes in the federal and state legal and regulatory environment and tax laws, (6) the impact of changes in monetary and fiscal policies, laws, rules and regulations and (7) other risks and factors identified in the Company’s other filings with the Securities and Exchange Commission. The Company undertakes no obligation to update any forward-looking statements.
| A-1 | ||
| SELECTED FINANCIAL DATA | ||||||||||||||||
Dollars in Thousands Except Per Share Amounts | ||||||||||||||||
| 2003 | 2002 | 2001 | 2000 | 1999 | ||||||||||||
Summary of Operations | ||||||||||||||||
| Interest income | $ | 34,854 | 36,624 | 41,898 | 40,859 | 32,302 | ||||||||||
| Interest expense | 12,749 | 15,777 | 23,027 | 19,432 | 14,790 | |||||||||||
| Provision for loan losses | 6,744 | 5,432 | 3,545 | 1,879 | 425 | |||||||||||
| Net interest income after provision for loan losses | 15,361 | 15,415 | 15,326 | 19,548 | 17,087 | |||||||||||
| Non-interest income | 5,926 | 6,491 | 8,263 | 3,915 | 3,380 | |||||||||||
| Non-interest expense | 18,228 | 16,758 | 16,752 | 15,509 | 13,832 | |||||||||||
| Income before taxes | 3,059 | 5,148 | 6,837 | 7,954 | 6,635 | |||||||||||
| Income taxes | 1,055 | 1,712 | 2,262 | 2,576 | 2,093 | |||||||||||
| Net income | $ | 2,004 | 3,436 | 4,575 | 5,378 | 4,542 | ||||||||||
Selected Year-End Balances | ||||||||||||||||
| Assets | $ | 674,032 | 645,638 | 619,505 | 519,002 | 432,435 | ||||||||||
| Available for sale securities | 79,460 | 71,736 | 84,286 | 71,565 | 62,498 | |||||||||||
| Loans, net | 542,404 | 519,122 | 484,517 | 406,226 | 335,274 | |||||||||||
| Mortgage loans held for sale | 587 | 5,065 | 5,339 | 1,564 | 1,685 | |||||||||||
| Interest-earning assets | 639,501 | 608,619 | 586,496 | 490,449 | 411,734 | |||||||||||
| Deposits | 549,802 | 515,739 | 490,223 | 450,073 | 376,634 | |||||||||||
| Interest-bearing liabilities | 550,357 | 527,192 | 515,989 | 420,594 | 339,243 | |||||||||||
| Shareholders' equity | $ | 48,554 | 48,605 | 45,401 | 43,039 | 37,998 | ||||||||||
| Shares outstanding* | 3,135,202 | 3,133,547 | 3,218,714 | 3,218,714 | 3,218,950 | |||||||||||
Selected Average Balances | ||||||||||||||||
| Assets | $ | 660,644 | 624,796 | 575,142 | 469,536 | 417,387 | ||||||||||
| Available for sale securities | 72,072 | 77,414 | 84,549 | 66,218 | 60,642 | |||||||||||
| Loans | 539,559 | 507,879 | 454,371 | 374,226 | 324,651 | |||||||||||
| Interest-earning assets | 625,764 | 592,947 | 545,945 | 447,645 | 396,606 | |||||||||||
| Deposits | 533,704 | 499,224 | 481,289 | 408,210 | 363,637 | |||||||||||
| Interest-bearing liabilities | 540,243 | 516,314 | 472,435 | 373,167 | 326,164 | |||||||||||
| Shareholders' equity | $ | 49,914 | 48,257 | 47,432 | 42,852 | 39,348 | ||||||||||
| Shares outstanding* | 3,133,687 | 3,151,975 | 3,218,714 | 3,218,714 | 3,218,950 | |||||||||||
Profitability Ratios | ||||||||||||||||
| Return on average total assets | 0.30 | % | 0.55 | % | 0.80 | % | 1.15 | % | 1.09 | % | ||||||
| Return on average shareholders' equity | 4.01 | % | 7.12 | % | 9.65 | % | 12.55 | % | 11.54 | % | ||||||
| Dividend payout ratio | 62.56 | % | 36.58 | % | 28.14 | % | 23.39 | % | 23.84 | % | ||||||
Liquidity and Capital Ratios (averages) | ||||||||||||||||
| Loan to deposit | 101.10 | % | 101.73 | % | 94.41 | % | 91.67 | % | 89.28 | % | ||||||
| Shareholders' equity to total assets | 7.56 | % | 7.72 | % | 8.25 | % | 9.13 | % | 9.43 | % | ||||||
Per share of common stock* | ||||||||||||||||
| Basic net income | $ | 0.64 | 1.09 | 1.42 | 1.67 | 1.41 | ||||||||||
| Diluted net income | $ | 0.63 | 1.09 | 1.42 | 1.67 | 1.41 | ||||||||||
| Cash dividends | $ | 0.40 | 0.40 | 0.40 | 0.39 | 0.34 | ||||||||||
| Book value | $ | 15.49 | 15.51 | 14.11 | 13.37 | 11.81 | ||||||||||
| *Shares outstanding and per share computations have been restated to reflect a 10% stock dividend during second quarter | ||||||||||||||||
| 2000 and the 3 for 2 stock split during first quarter 1999. | ||||||||||||||||
| A-2 | ||
MANAGEMENT’S DISCUSSION AND ANALYSIS OF FINANCIAL CONDITION
AND RESULTS OF OPERATIONS
Introduction
Management's discussion and analysis of earnings and related data are presented to assist in understanding the consolidated financial condition and results of operations of Peoples Bancorp of North Carolina, Inc. (the "Company"), for the years ended December 31, 2003, 2002 and 2001. The Company is a registered bank holding company operating under the supervision of the Federal Reserve Board and the parent company of Peoples Bank (the "Bank"). The Bank is a North Carolina-chartered bank, with offices in Catawba, Lincoln and Alexander Counties, operating under the banking laws of North Carolina and the Rules and Regulations of the Federal Deposit Insurance Corporation (the "FDIC").
Overview
Our business consists principally of attracting deposits from the general public and investing these funds in loans secured by commercial real estate, secured and unsecured commercial loans and consumer loans. Our profitability depends primarily on our net interest income, which is the difference between the income we receive on our loan and investment securities portfolios and our cost of funds, which consists of interest paid on deposits and borrowed funds. Net interest income also is affected by the relative amounts of interest-earning assets and interest-bearing liabilities. When interest-earning assets approximate or exceed interest-bearing liabilities, any positive interest rate spread will generate net interest income. Our profitability is also affected by the level of other income a nd operating expenses. Other income consists of miscellaneous fees related to our loans and deposits, mortgage banking income and commissions from sales of annuities and mutual funds. Operating expenses consist of compensation and benefits, occupancy related expenses, federal deposit and other insurance premiums, data processing, advertising and other expenses.
Our operations are influenced significantly by local economic conditions and by policies of financial institution regulatory authorities. The earnings on our assets are influenced by the effects of, and changes in, trade, monetary and fiscal policies and laws, including interest rate policies of the Board of Governors of the Federal Reserve System, inflation, interest rates, market and monetary fluctuations. Lending activities are affected by the demand for financing of commercial and other types of loans, which in turn is affected by the interest rates at which such financing may be offered. Our cost of funds is influenced by interest rates on competing investments and by rates offered on similar investments by competing financial institutions in our market area, as well as general market interest rates. These factors can cause fluctuations in our net interest income and other income. In addition, local economic conditions can impact the credit risk of our loan portfolio, in that local employers may be required to eliminate employment positions of many of our borrowers, and small businesses and other commercial borrowers may experience a downturn in their operating performance and become unable to make timely payments on their loans. Management evaluates these factors in estimating its allowance for loan losses, and changes in these economic conditions could result in increases or decreases to the provision for loan losses.
Our business emphasis has been to operate as a well-capitalized, profitable and independent community-oriented financial institution dedicated to providing quality customer service. We are committed to meeting the financial needs of the communities in which we operate. We believe that we can be more effective in servicing our customers than many of our non-local competitors because of our ability to quickly and effectively provide senior management responses to customer needs and inquiries. Our ability to provide these services is enhanced by the stability of our senior management team.
Due to a general slowdown in the economy beginning in 2000, the Federal Reserve acted to provide a stimulus through a series of interest rate reductions that lowered the prime rate from 9.50% in January 2001 to 4.00% in June 2003. These reductions in prime rate have negatively impacted the Company's net interest margin and net interest spread which has resulted in lower net interest income for the Company. The Company's asset growth has been slower as a result of heavy refinancing as customers have taken advantage of these attractive interest rates. The fee income associated with the heavy refinancing volume has replaced some of the lost net interest income. The Company has also utilized interest rate swaps to convert some variable rate loans to fixed rate in order to offset some of the red uced earnings because of the decreases in the prime rate.
Summary of Significant Accounting Policies
The consolidated financial statements include the financial statements of Peoples Bancorp of North Carolina, Inc. and its wholly owned subsidiary, Peoples Bank, along with its wholly owned subsidiaries, Peoples Investment Services, Inc. and Real Estate Advisory Services, Inc. (collectively called the "Company"). All significant intercompany balances and transactions have been eliminated in consolidation.
| A-3 | ||
The Company’s accounting policies are fundamental to understanding management’s discussion and analysis of results of operations and financial condition. Many of the Company’s accounting policies require significant judgment regarding valuation of assets and liabilities and/or significant interpretation of specific accounting guidance. A description of the Company’s significant accounting policies can be found in Note 1 of the Notes to Consolidated Financial Statements in the Company’s 2004 Annual Report to Shareholders which is Appendix A to the Proxy Statement for the May 6, 2004 Annual Meeting of Shareholders. The following is a summary of the more subjective and complex accounting policies of the Company.
Many of the Company’s assets and liabilities are recorded using various techniques that require significant judgment as to recoverability. The collectability of loans is reflected through the Company’s estimate of the allowance for loan losses. The Company performs periodic and systematic detailed reviews of its lending portfolio to assess overall collectability. In addition, certain assets and liabilities are reflected at their estimated fair value in the consolidated financial statements. Such amounts are based on either quoted market prices or estimated values derived by the Company utilizing dealer quotes, market comparisons or internally generated modeling techniques. The Company’s internal models generally involve present value of cash flow techniques. The various techn iques are discussed in greater detail elsewhere in management’s discussion and analysis and the Notes to the Consolidated Financial Statements.
There are other complex accounting standards that require the Company to employ significant judgment in interpreting and applying certain of the principles prescribed by those standards. These judgments include, but are not limited to, the determination of whether a financial instrument or other contract meets the definition of a derivative in accordance with Statement of Financial Accounting Standards No. 133, "Accounting for Derivative Instruments and Hedging Activities" (SFAS 133), and the applicable hedge deferral criteria, the accounting for the transfer of financial assets and extinguishments of liabilities in accordance with Statement of Financial Accounting Standards No. 140, "Accounting for Transfers and Servicing of Financial Assets and Extinguishments of Liabilities" (SFAS 140). For a more complete discussion of these policies, see the Notes to the Consolidated Financial Statements.
In January 2003, the Financial Accounting Standards Board ("FASB") issued FASB Interpretation No. 46, "Consolidation of Variable Interest Entities – An Interpretation of ARB No. 51" ("FIN 46"). In December 2003, the FASB issued a revised version of FIN 46 to resolve certain questions and confusion related to the application of the original FIN 46. The Company adopted FIN 46 (Revised) as of December 31, 2003, and as a result, the Company’s wholly owned subsidiary, PEBK Capital Trust I, is no longer included in these consolidated financial statements. The consolidated financial statements have been restated for all periods presented to reflect this change in accounting, and the adoption of FIN 46 (Revised) had no impact on the Company’s reported results of operations or shareho lders’ equity.
In January 2004, the FASB issued as tentative guidance, Derivatives Implementation Group ("DIG") Issue G25, "Cash Flow Hedges: Hedging the Variable Interest Payments on a Group of Prime-Rate-Based Interest-Bearing Loans." This issue provides guidance for entities wishing to hedge the variability in loan interest receipts that are tied to the prime rate and other issues associated with cash flow hedges. Comments on this proposed DIG Issue were due February 25, 2004. This guidance, which is subject to revision, is intended to become effective on the first day of the first quarter after final issuance of the guidance. The Company cannot estimate when that date may occur. However, if the guidance is ultimately adopted in a manner similar to its current drafting, the Company will have to "de-des ignate" the interest rate swaps hedging certain prime-rate-based loans discussed in note 11 to the consolidated financial statements. If this were to happen, management has not concluded whether they will leave the swaps in place and record changes in value as a component of current earnings, terminate the swaps, or take some other action in response. Accordingly, management cannot determine the effect, if any, of this tentative guidance on its future results of operations.
Management of the Company has made a number of estimates and assumptions relating to reporting of assets and liabilities and the disclosure of contingent assets and liabilities to prepare these consolidated financial statements in conformity with generally accepted accounting principles. Actual results could differ from those estimates.
The remainder of management’s discussion and analysis of the Company’s results of operations and financialposition should be read in conjunction with the Consolidated Financial Statements and related notes presented on pages A-20 through A-50.
| A-4 | ||
Results of Operations
Summary
The Company reported earnings of $2.0 million in 2003, or $0.64 basic net earnings per share and $0.63 diluted net earnings per share, a 42% decrease as compared to $3.4 million, or $1.09 basic and diluted net earnings per share, for 2002. Net earnings from recurring operations for 2003 were $2.2 million, or $0.71 basic and diluted net earnings per share, representing a 26% decrease from net earnings from recurring operations of $3.0 million, or $0.96 basic net earnings per share and $0.95 diluted net earnings per share in 2002. Net non-recurring losses on disposition of assets in 2003 amounted to $355,000. Net losses on disposition of assets included a $747,000 net loss on repossessed assets, which was partially offset by a $479,000 gain associated with the sale of the Bank’s $3.7 mil lion credit card portfolio during 2003. In 2002, the Company had non-recurring gains on the sale of securities of $626,000. The decline in 2003 year-to-date recurring earnings was primarily attributable to an increase in the provision for loan losses and an increase in non-interest expense.
Net earnings for 2002 represented a decrease of 25% as compared to 2001 net earnings of $4.6 million. Net earnings from recurring operations for 2002 decreased 15% when compared to $3.5 million, or $1.10 basic and diluted net earnings per share for 2001. Net non-recurring gains on disposition of assets in 2001 amounted to $1.6 million. Net gains on disposition of assets in 2001 included a $1.6 million gain on the sale of securities partially offset by a $66,000 net loss on repossessed assets. The decline in recurring earnings in 2002 was primarily attributable to an increase in the provision for loan losses and decreased non-interest income.
The annualized return on average assets in 2003 was 0.30%, compared to 0.55% in 2002 and 0.80% in 2001. Excluding non-recurring gains and losses on disposition of assets, the annualized return on average assets was 0.34%, 0.48% and 0.62% in 2003, 2002 and 2001, respectively. Annualized return on average shareholders’ equity was 4.01% in 2003 compared to 7.12% in 2002 and 9.65% in 2001. Excluding non-recurring gains and losses on disposition of assets, the annualized return on average shareholders’ equity was 4.46%, 6.30% and 7.62% in 2003, 2002 and 2001, respectively.
Net Interest Income
Net interest income, a major component of the Company’s income, is the amount by which interest and fees generated by interest-earning assets exceed the total cost of funds used to carry them. Net interest income is affected by changes in the volume and mix of interest-earning assets and interest-bearing liabilities, as well as changes in the yields earned and rates paid. Net interest margin is calculated by dividing tax-equivalent net interest income by average interest-earning assets, and represents the Company’s net yield on its interest-earning assets.
Net interest income was $22.1 million for 2003, or 6% over net interest income of $20.8 million in 2002. The increase was primarily attributable to a decrease in interest expense resulting from a reduction in the cost of funds, which was partially offset by a decrease in interest income resulting from a reduction in the Bank’s prime commercial lending rate in 2003 combined with a decrease in the yield in investments. Net interest income increased 10% in 2002 from $18.9 million in 2001.
Table 1 sets forth for each category of interest-earning assets and interest-bearing liabilities, the average amounts outstanding, the interest incurred on such amounts and the average rate earned or incurred for the years ended December 31, 2003, 2002 and 2001. The table also sets forth the average rate earned on total interest-earning assets, the average rate paid on total interest-bearing liabilities, and the net yield on average total interest-earning assets for the same periods. Yield information does not give effect to changes in fair value that are reflected as a component of shareholders’ equity. Yields and interest income on tax-exempt investments have been adjusted to tax equivalent basis using an effective tax rate 34% for securities that are both federal and state tax exemp t and an effective tax rate of 6.90% for state tax exempt securities. Non-accrual loans and the interest income that was recorded on these loans, if any, are included in the yield calculations for loans in all periods reported.
| A-5 | ||
Table 1- Average Balance Table | ||||||||||||||||||||||||||||
December 31, 2003 | December 31, 2002 | December 31, 2001 | ||||||||||||||||||||||||||
(Dollars in Thousands) | Average Balance | Interest | Yield / Rate | Average Balance | Interest | Yield / Rate | Average Balance | Interest | Yield / Rate | |||||||||||||||||||
Interest-earning Assets: | ||||||||||||||||||||||||||||
| Loans | $ | 539,559 | 28,700 | 5.32 | % | $ | 507,879 | 30,256 | 5.96 | % | $ | 454,371 | 35,210 | 7.75 | % | |||||||||||||
| Interest rate swap agreements | - | 1,522 | 3.22 | % | - | 509 | 1.16 | % | - | - | - | |||||||||||||||||
| Loan fees | - | 1,310 | 0.28 | % | - | 1,274 | 0.29 | % | - | 1,302 | 0.33 | % | ||||||||||||||||
Total Loans | 539,559 | 31,532 | 5.84 | % | 507,879 | 32,039 | 6.31 | % | 454,371 | 36,512 | 8.04 | % | ||||||||||||||||
| Investments - taxable | 49,082 | 2,186 | 4.45 | % | 63,792 | 3,726 | 5.84 | % | 64,469 | 4,160 | 6.45 | % | ||||||||||||||||
| Investments - nontaxable* | 22,990 | 1,228 | 5.34 | % | 13,622 | 929 | 6.82 | % | 20,080 | 1,381 | 6.88 | % | ||||||||||||||||
| Federal funds sold | 5,981 | 58 | 0.98 | % | 3,356 | 45 | 1.34 | % | 3,776 | 127 | 3.36 | % | ||||||||||||||||
| Other | 8,152 | 174 | 2.14 | % | 4,298 | 201 | 4.68 | % | 3,249 | 187 | 5.74 | % | ||||||||||||||||
Total interest-earning assets | 625,764 | 35,178 | 5.62 | % | 592,947 | 36,940 | 6.23 | % | 545,945 | 42,367 | 7.76 | % | ||||||||||||||||
| Cash and due from banks | 12,587 | 11,351 | 12,273 | |||||||||||||||||||||||||
| Other assets | 30,575 | 27,103 | 22,266 | |||||||||||||||||||||||||
| Allowance for loan losses | (8,282 | ) | (6,607 | ) | (5,342 | ) | ||||||||||||||||||||||
Total assets | $ | 660,644 | 624,795 | 575,142 | ||||||||||||||||||||||||
Interest-bearing liabilities: | ||||||||||||||||||||||||||||
| NOW accounts | $ | 75,757 | 688 | 0.91 | % | 60,757 | 628 | 1.03 | % | 38,584 | 413 | 1.07 | % | |||||||||||||||
| Regular savings accounts | 21,131 | 75 | 0.35 | % | 21,908 | 95 | 0.44 | % | 22,670 | 178 | 0.78 | % | ||||||||||||||||
| Money market accounts | 58,134 | 556 | 0.96 | % | 72,170 | 1,282 | 1.78 | % | 65,846 | 2,373 | 3.60 | % | ||||||||||||||||
| Time deposits | 310,991 | 8,157 | 2.62 | % | 285,133 | 10,358 | 3.63 | % | 299,815 | 17,827 | 5.95 | % | ||||||||||||||||
| FHLB borrowings | 59,305 | 2,597 | 4.38 | % | 60,956 | 2,659 | 4.36 | % | 42,533 | 2,118 | 4.98 | % | ||||||||||||||||
| Demand notes payable to U.S. Treasury | 710 | 7 | 0.99 | % | 811 | 12 | 1.46 | % | 897 | 33 | 3.64 | % | ||||||||||||||||
| Trust preferred securities | 14,000 | 668 | 4.77 | % | 14,000 | 735 | 5.25 | % | 499 | 30 | 6.08 | % | ||||||||||||||||
| Other | 215 | 1 | 0.47 | % | 579 | 8 | 1.38 | % | 1,592 | 54 | 3.39 | % | ||||||||||||||||
Total interest-bearing liabilities | 540,243 | 12,749 | 2.36 | % | 516,314 | 15,777 | 3.06 | % | 472,435 | 23,026 | 4.87 | % | ||||||||||||||||
| Demand deposits | 67,690 | 59,256 | 54,374 | |||||||||||||||||||||||||
| Other liabilities | 2,800 | 2,326 | 3,486 | |||||||||||||||||||||||||
| Shareholders' equity | 49,971 | 48,257 | 47,432 | |||||||||||||||||||||||||
Total liabilities and shareholder's equity | $ | 660,704 | 626,153 | 577,727 | ||||||||||||||||||||||||
Net interest spread | $ | 22,429 | 3.26 | % | 21,163 | 3.17 | % | 19,341 | 2.89 | % | ||||||||||||||||||
Net yield on interest-earning assets | 3.58 | % | 3.57 | % | 3.54 | % | ||||||||||||||||||||||
Taxable equivalent adjustment | ||||||||||||||||||||||||||||
Investment securities | $ | 324 | 316 | 470 | ||||||||||||||||||||||||
Net interest income | $ | 22,105 | 20,847 | 18,871 | ||||||||||||||||||||||||
*Includes $9.4 million of U.S. government agency securities that are non-taxable for state income tax purposes. An effective tax rate of 6.90% was used to calculate the tax equivalent yield on these securities. | ||||||||||||||||||||||||||||
Changes in interest income and interest expense can result from variances in both volume and rates. Table 2 describes the impact on the Company’s tax equivalent net interest income resulting from changes in average balances and average rates for the periods indicated. The changes in interest due to both volume and rate have been allocated to volume and rate changes in proportion to the relationship of the absolute dollar amounts of the changes in each.
| A-6 | ||
Table 2 - Rate/Volume Variance Analysis-Tax Equivalent Basis | |||||||||||||||||||
December 31, 2003 | December 31, 2002 | ||||||||||||||||||
(Dollars in Thousands) | Changes in average volume | Changes in average rates | Total Increase (Decrease) | Changes in average volume | Changes in average rates | Total Increase (Decrease) | |||||||||||||
Interest Income: | |||||||||||||||||||
| Loans: Net of unearned income | $ | 1,925 | (2,432 | ) | (507 | ) | 3,838 | (8,312 | ) | (4,474 | ) | ||||||||
| Investments - taxable | (271 | ) | (916 | ) | (1,187 | ) | (42 | ) | (393 | ) | (435 | ) | |||||||
| Investments - nontaxable | (1 | ) | (53 | ) | (54 | ) | (442 | ) | (10 | ) | (452 | ) | |||||||
| Federal funds sold | 30 | (17 | ) | 13 | (10 | ) | (72 | ) | (82 | ) | |||||||||
| Other | 34 | (61 | ) | (27 | ) | 67 | (52 | ) | 15 | ||||||||||
Total interest income | $ | 1,717 | (3,479 | ) | (1,762 | ) | 3,411 | (8,839 | ) | (5,428 | ) | ||||||||
Interest expense: | |||||||||||||||||||
| NOW accounts | $ | 146 | (86 | ) | 60 | 233 | (17 | ) | 216 | ||||||||||
| Regular savings accounts | (3 | ) | (17 | ) | (20 | ) | (5 | ) | (78 | ) | (83 | ) | |||||||
| Money market accounts | (192 | ) | (534 | ) | (726 | ) | 170 | (1,261 | ) | (1,091 | ) | ||||||||
| Time deposits | 809 | (3,010 | ) | (2,201 | ) | (703 | ) | (6,766 | ) | (7,469 | ) | ||||||||
| FHLB Borrowings | (72 | ) | 10 | (62 | ) | 861 | (320 | ) | 541 | ||||||||||
| Demand notes payable to U.S. Treasury | (1 | ) | (4 | ) | (5 | ) | (2 | ) | (19 | ) | (21 | ) | |||||||
| Junior subordinated debentures | 0 | (67 | ) | (67 | ) | 765 | (60 | ) | 705 | ||||||||||
| Other | (3 | ) | (4 | ) | (7 | ) | (24 | ) | (23 | ) | (47 | ) | |||||||
Total interest expense | $ | 684 | (3,712 | ) | (3,028 | ) | 1,295 | (8,544 | ) | (7,249 | ) | ||||||||
Net interest income | $ | 1,034 | 233 | 1,266 | 2,116 | (295 | ) | 1,821 | |||||||||||
Net interest income on a tax equivalent basis totaled $22.4 million in 2003, increasing 6% or $1.3 million from 2002. This increase was primarily attributable to a decrease in the cost of funds to 2.36% in 2003 from 3.06% in 2002. The interest rate spread, which represents the rate earned on interest-earning assets less the rate paid on interest-bearing liabilities, was 3.26% in 2003, an increase from the 2002 net interest spread of 3.17%. The net yield on interest-earning assets in 2003 increased to 3.58% from the 2002 net interest margin of 3.57%.
Tax equivalent interest income decreased $1.8 million or 5% in 2003 primarily due to a decrease in the Bank’s prime lending rate from an average rate of 4.67% in 2002 to 4.12% in 2003. The decrease in rates resulted in a decrease in the yield on interest-earning assets to 5.62% in 2003 as compared to 6.23% in 2002, but was partially offset by an increase in average interest-earning assets of $32.9 million. The $32.9 million increase in average interest-earning assets was attributable primarily to a $31.7 million increase in average loans. Average investment securities in 2003 decreased 7% to $72.1 million when compared to 2002. All other interest-earning assets including federal funds sold increased to $14.1 million in 2003 from $7.7 million in 2002.
Interest expense decreased $3.0 million or 19% in 2003 as the Bank was able to reprice or replace maturing deposits at lower rates. The decrease in the cost of funds was primarily attributable to a decrease in the average rate paid on time deposits, which fell to 2.62% in 2003 from 3.63% in 2002. This decrease in cost was offset by growth in average interest-bearing liabilities, which increased by $23.9 million to $540.2 million in 2003 from $516.3 million in 2002. This growth in average interest-bearing liabilities was attributable to an increase in average interest-bearing deposits, which increased by $26.0 million, to $466.0 million in 2003 from $440.0 million in 2002.
Net interest income on a tax equivalent basis increased $1.9 million or 9% to $21.2 million in 2002 from $19.3 million in 2001. The interest rate spread was 3.17% in 2002, an increase from the 2001 net interest spread of 2.89%. The net yield on interest-earning assets in 2002 increased to 3.57% from the 2001 net interest margin of 3.54%.
Provision for Loan Losses
Provisions for loan losses are charged to income in order to bring the total allowance for loan losses to a level deemed appropriate by management of the Company based on factors such as management’s judgment as to losses within the Company’s loan portfolio, including the valuation of impaired loans in accordance with Statement of Financial Accounting Standards ("SFAS") No. 114 and No. 118, loan growth, net charge-offs, changes in the composition of the loan portfolio, delinquencies and management’s assessment of the quality of the loan portfolio and general economic climate.
| A-7 | ||
The provision for loan losses was $6.7 million, $5.4 million, and $3.5 million for the years ended December 31, 2003, 2002 and 2001, respectively. The provision for loan losses remains at historically high levels due to the weak economic conditions in the Bank’s local market, which continues to have a negative impact on the performance of customers of the Bank. Please see the section below entitled "Allowance for Loan Losses" for a more complete discussion of the Bank’s policy for addressing possible loan losses.
Non-Interest Income
Non-interest income for 2003 totaled $5.9 million, a decrease of $565,000 or 9% from non-interest income of $6.5 million for 2002. The decrease in non-interest income for 2003 reflected reductions in gains on sales of securities and increased losses on repossessed assets. These decreases were partially offset by an increase in service charges. Non-interest income for 2002 decreased $1.8 million or 21% from non-interest income of $8.3 million for 2001. The decrease in non-interest income for 2002 resulted from reductions in gains on sales of securities, miscellaneous income and mortgage banking income. Excluding non-recurring gains or losses on the disposition of assets, non-interest income for 2003 increased 7% as compared to 2002. Non-interest income, excluding non-recurring gains or losse s on the disposition of assets, decreased 13% for 2002 when compared to 2001.
Service charges on deposit accounts totaled $3.3 million during 2003, an increase of $206,000, or 7% over 2002. Service charge income increased $255,000, or 9% in 2002 compared to 2001. These increases are primarily attributable to growth in the deposit base coupled with normal pricing changes, which resulted in an increase in account maintenance fees.
The Company reported a net loss on sale of securities of $53,000 in 2003, compared to a net gain on sale of securities of $626,000 during 2002. During 2001 a net gain on sale of securities of approximately $1.6 million was recognized.
Mortgage banking income decreased to $685,000 in 2003 from $702,000 in 2002. The reduction in mortgage banking income was primarily attributable a reduction in net gains recognized on the sale of mortgage loans. In 2003 the Company recognized no gains on sale of mortgage loans as compared to a $29,000 gain on sale of mortgage loans recognized during 2002. During 2002 mortgage banking income decreased $312,000 from the $1.0 million reported in 2001. The decrease in mortgage banking income for 2002 was primarily due to an increase in the amortization of mortgage servicing rights, resulting from an increase in refinancing during 2002 and related payoffs of mortgage loans serviced.
Net losses on repossessed assets were $747,000 for 2003 compared to net losses on repossessed assets of $600 for 2002. During 2001 a net loss on repossessed assets of $66,000 was recognized.
The Company recognized a $479,000 gain on the sale of loans during 2003 as a result of the sale of the Bank’s $3.7 million credit card portfolio in 2003. There were no gains on the sale of loans recognized in 2002 and 2001.
Miscellaneous income for 2003 totaled $1.3 million, an increase of 13% from $1.1 million for 2002. The increase in miscellaneous income was primarily attributable to an increase in vendor commissions. During 2002, miscellaneous income decreased 46% due to a reduction in merchant processing income, resulting from the sale of merchant credit card processing services during first quarter 2002. Miscellaneous income in 2001 included an increase in the value of an interest rate floor contract of $158,000.
Table 3 presents a summary of non-interest income for the years ended December 31, 2003, 2002 and 2001.
Table 3 - Non-Interest Income | ||||||||||
(Dollars in Thousands) | 2003 | 2002 | 2001 | |||||||
| Service charges | $ | 3,267 | 3,061 | 2,805 | ||||||
| Other service charges and fees | 611 | 503 | 472 | |||||||
| Gain (loss) on sale of securities | (53 | ) | 626 | 1,614 | ||||||
| Mortgage banking income | 685 | 702 | 1,014 | |||||||
| Insurance and brokerage commissions | 421 | 478 | 349 | |||||||
| Loss on foreclosed and repossessed assets | (747 | ) | (1 | ) | (66 | ) | ||||
| Gain on sale of loans | 479 | - | - | |||||||
| Miscellaneous | 1,263 | 1,122 | 2,075 | |||||||
Total non-interest income | $ | 5,926 | 6,491 | 8,263 | ||||||
| A-8 | ||
Non-Interest Expense
Total non-interest expense amounted to $18.2 million for 2003, an increase of 9% from 2002. Non-interest expense for 2002 and 2001 totaled $16.8 million.
Salary and employee benefit expense was $10.1 million in 2003, compared to $9.6 million during 2002, an increase of $531,000 or 6%, following a $454,000 or 5% increase in salary and employee benefit expense in 2002 over 2001. The 2003 increase in salary and employee benefits is due to normal salary increases and increased employee insurance costs. The increase during 2002 is attributable to normal salary increases coupled with expense associated with the supplemental retirement plan offered to key employees.
The Company recorded occupancy expenses of $3.4 million in 2003, compared to $3.1 million during 2002, an increase of $247,000 or 8%, following an increase of $159,000 or 5% in occupancy expenses in 2002 over 2001. Increases in 2003 and 2002 are primarily attributable to an increase in overhead expenses associated with the Bank’s growth and expansion of its branch network. During 2003, the Company sold two branch locations with net book values of approximately $3.1 million and is currently leasing the facilities from the buyer. As a result of the sales, the Company deferred a gain of approximately $633,000 and is recognizing the gain over the lease term. During 2003, the Company recognized approximately $18,000 of the deferred gain. Annual rent expense related to these two locations is $237,000.
The total of all other operating expenses increased $692,000 or 17% during 2003. The increase in other expense for 2003 included an increase of $440,000 in consulting and advertising expense due to an aggressive marketing campaign started by the Bank in 2003 and an increase of $403,000 in non-income taxes primarily due to state franchise taxes. Other operating expense decreased $606,000 or 13% in 2002 from 2001. The decrease in other expense for 2002 is primarily attributable to a reduction in merchant processing expense resulting from the sale of the merchant credit card processing service during first quarter 2002.
Table 4 presents a summary of non-interest expense for the years ended December 31, 2003, 2002 and 2001.
Table 4 - Non-Interest Expense | ||||||||||
(Dollars in Thousands) | 2003 | 2002 | 2001 | |||||||
| Salaries and wages | $ | 7,733 | 7,376 | 7,230 | ||||||
| Employee benefits | 2,367 | 2,193 | 1,885 | |||||||
Total personnel expense | 10,100 | 9,569 | 9,115 | |||||||
| Occupancy expense | 3,390 | 3,143 | 2,984 | |||||||
| Office supplies | 270 | 283 | 362 | |||||||
| FDIC deposit insurance | 82 | 157 | 85 | |||||||
| Professional services | 333 | 264 | 314 | |||||||
| Postage | 217 | 221 | 231 | |||||||
| Telephone | 333 | 315 | 333 | |||||||
| Director fees and expense | 234 | 352 | 219 | |||||||
| Marketing and public relations | 541 | 219 | 243 | |||||||
| Merchant processing expense | - | 78 | 552 | |||||||
| Consulting fees | 280 | 160 | 143 | |||||||
| Taxes and licenses | 443 | 40 | 100 | |||||||
| Other operating expense | 2,005 | 1,957 | 2,071 | |||||||
Total non-interest expense | $ | 18,228 | 16,758 | 16,752 | ||||||
Income Taxes
Total income tax expense was $1.1 million in 2003 compared with $1.7 million in 2002 and $2.3 million in 2001. The primary reason for the decrease in taxes was the decrease in pretax income during 2003 and 2002. The Company’s effective tax rates were 34.50%, 33.26% and 33.08% in 2003, 2002 and 2001, respectively.
Liquidity
The objectives of the Company’s liquidity policy are to provide for the availability of adequate funds to meet the needs of loan demand, deposit withdrawals, maturing liabilities and to satisfy regulatory requirements. Both deposit and loan
| A-9 | ||
customer cash needs can fluctuate significantly depending upon business cycles, economic conditions and yields and returns available from alternative investment opportunities. In addition, the Company’s liquidity is affected by off-balance sheet commitments to lend in the form of unfunded commitments to extend credit and standby letters of credit. As of December 31, 2003 such unfunded commitments to extend credit were $104.7 million, while commitments in the form of standby letters of credit totaled $3.9 million.
The Company uses several sources to meet its liquidity requirements. The primary source is core deposits, which includes demand deposits, savings accounts and certificates of deposits of denominations less than $100,000. The Company considers these to be a stable portion of the Company’s liability mix and the result of on-going consumer and commercial banking relationships. As of December 31, 2003, the Company’s core deposits totaled $378.2 million, or 69% of total deposits.
The other sources of funding for the Company are through large denomination certificates of deposit, including brokered deposits, federal funds purchased and Federal Home Loan Bank advances. The Bank is also able to borrow from the Federal Reserve System on a short-term basis.
At December 31, 2003, the Bank had a significant amount of deposits in amounts greater than $100,000, including brokered deposits of $55.5 million, which mature over the next two years. The balance and cost of these deposits may be more susceptible to changes in the interest rate environment than other deposits. For additional information, please see the section below entitled "Deposits".
The Bank has a line of credit with the FHLB for up to 20% of the Bank’s total assets, with an outstanding balance of $58.0 million at December 31, 2003. The remaining availability at the FHLB was $22.0 million at December 31, 2003. The Bank also had the ability to borrow up to $26.5 million for the purchase of overnight federal funds from three correspondent financial institutions as of December 31, 2003.
The liquidity ratio for the Bank, which is defined as net cash, interest bearing deposits with banks, Federal Funds sold, certain investment securities and certain FHLB advances available under the line of credit, as a percentage of net deposits (adjusted for deposit runoff projections) and short-term liabilities was 26.83% at December 31, 2003, 17.85% at December 31, 2002, and 25.82% at December 31, 2001. The December 31, 2002 and 2001 ratios have been restated to reflect changes in the FHLB borrowing availability calculation, which the Bank recognizes as a factor of its liquidity. The minimum required liquidity ratio as defined in the Bank’s Asset/Liability and Interest Rate Risk Management Policy is 20%.
As disclosed in the Company’s Consolidated Statements of Cash Flows included elsewhere herein, net cash provided by operating activities was approximately $13.4 million during 2003. Net cash used in investing activities of $34.8 million consisted primarily of a net change in loans of $31.5 million and securities purchased of $55.4 million funded by sales, maturities and paydowns of investment securities of $47.1 million. Net cash provided by financing activities amounted to $26.6 million, consisting of a $34.1 million net increase in deposits and a $5.1 million net decrease in FHLB borrowings.
Asset Liability and Interest Rate Risk Management
The objective of the Company’s Asset Liability and Interest Rate Risk strategies is to identify and manage the sensitivity of net interest income to changing interest rates and to minimize the interest rate risk between interest-earning assets and interest-bearing liabilities at various maturities. This is to be done in conjunction with the need to maintain adequate liquidity and the overall goal of maximizing net interest income. Table 5 presents an interest rate sensitivity analysis for the interest-earning assets and interest-bearing liabilities for the year ended December 31, 2003.
| A-10 | ||
Table 5 - Interest Sensitivity Analysis | |||||||||||||||||||
Total Within | Over One year | ||||||||||||||||||
(Dollars in Thousands) | Immediate | 1-3 months | 4-12 months | One year | & non-sensitive | Total | |||||||||||||
| Interest-earning assets: | |||||||||||||||||||
| Loans | $ | 443,885 | 3,006 | 12,164 | 459,055 | 93,071 | $ | 552,126 | |||||||||||
| Mortgage loans available for sale | 587 | - | - | 587 | - | 587 | |||||||||||||
| Investment securities | 3,000 | 1,267 | 1,069 | 5,336 | 74,124 | 79,460 | |||||||||||||
| Federal funds sold | 2,369 | - | - | 2,369 | - | 2,369 | |||||||||||||
| Interest-bearing deposit account -FHLB | 1,457 | - | - | 1,457 | - | 1,457 | |||||||||||||
| Other interest-earning assets | - | - | - | - | 3,502 | 3,502 | |||||||||||||
| Total interest-earning assets | $ | 451,298 | 4,273 | 13,233 | 468,804 | 170,697 | $ | 639,501 | |||||||||||
| Interest-bearing liabilities: | |||||||||||||||||||
| NOW, savings, and money market deposits | $ | 158,677 | - | - | 158,677 | - | $ | 158,677 | |||||||||||
| Time deposits | 28,714 | 62,314 | 156,154 | 247,182 | 71,522 | 318,704 | |||||||||||||
| Other short term borrowings | 543 | - | - | 543 | - | 543 | |||||||||||||
| FHLB borrowings | - | 6,000 | - | 6,000 | 52,000 | 58,000 | |||||||||||||
| Junior subordinated debentures | - | 14,433 | - | 14,433 | - | 14,433 | |||||||||||||
| Total interest-bearing liabilities | $ | 187,934 | 82,747 | 156,154 | 426,835 | 123,522 | $ | 550,357 | |||||||||||
| Interest-sensitive gap | $ | 263,364 | (78,474 | ) | (142,921 | ) | 41,969 | 47,175 | $ | 89,144 | |||||||||
| Cumulative interest-sensitive gap | $ | 263,364 | 184,890 | 41,969 | 41,969 | 89,144 | |||||||||||||
| Interest-earning assets as a percentage of interest-bearing liabilities | 240.14 | % | 5.16 | % | 8.47 | % | 109.83 | % | |||||||||||
The Company manages its exposure to fluctuations in interest rates through policies established by the Asset/Liability Committee ("ALCO") of the Bank. The ALCO meets monthly and has the responsibility for approving asset/liability management policies, formulating and implementing strategies to improve balance sheet positioning and/or earnings and reviewing the interest rate sensitivity of the Company. ALCO tries to minimize interest rate risk between interest-earning assets and interest bearing liabilities by attempting to minimize wide fluctuations in net interest income due tointerest rate movements. Theability to control these fluctuations has a direct impact on the profitability of the Company. Management monitors this activity on a regular basis through analysis of its portfolios to determine the difference between rate sensitive assets and rate sensitive liabilities.
The Company’s rate sensitive assets are those earning interest at variable rates and those with contractual maturities within one year. Rate sensitive assets therefore include both loans and available-for-sale securities. Rate sensitive liabilities include interest-bearing checking accounts, money market deposit accounts, savings accounts, time deposits and borrowed funds. As shown in Table 5, the Company’s balance sheet is asset-sensitive, meaning that in a given period there will be more assets than liabilities subject to immediate repricing as interest rates change in the market. Because most of the Company’s loans are tied to the prime rate, they reprice more rapidly than rate sensitive interest-bearing deposits. During periods of rising rates, this results in increased n et interest income. The opposite occurs during periods of declining rates. Rate sensitive assets at December 31, 2003 totaled $639.5 million,exceeding rate sensitive liabilities of $550.4 million by $89.1 million.
In order to assist in achieving a desired level of interest rate sensitivity, the Company entered into off-balance sheet contracts that are considered derivative financial instruments. These contracts consist of interest rate swap agreements under which the Company converted $55.0 million of variable rate loans to a fixed rate. At December 31, 2003, the Company had two interest rate swap contracts outstanding, which are accounted for as cash flow hedges. Under the first swap agreement, the Company receives a fixed rate of 5.22% and pays a variable rate based on the current prime rate (4.00% at December 31, 2003) on a notional amount of $25.0 million. The swap agreement matures in April 2006. Under the second swap agreement, the Company receives a fixed rate of 5.41% and pays a variable rate based on the current prime rate (4.00% at December 31, 2003) on a notional amount of $30.0 million. The swap agreement matures in September 2006. Management believes that the risk associated with using this type of derivative financial instrument to mitigate interest rate risk should not have any material unintended impact on the Company’s financial condition or results of operations.
| A-11 | ||
During 2003, the Company settled two previously outstanding interest rate swap agreements. The first swap, with a notional amount of $40.0 million and scheduled to mature in June 2004 was sold for a gain of $860,000. The second swap with a notional amount of $20.0 million and scheduled to mature in July 2004 was sold for a gain of $394,000. The gains realized upon settlement are being recognized over the original term of the agreements and during the year ended December 31, 2003, net gains of approximately $428,000 had been realized. The remaining net gain of approximately $338,000 is carried as a component of other comprehensive income.
During first quarter 2001, the Company entered into an interest rate floor contract as a means of managing its interest rate risk. Interest rate floors are used to protect certain designated variable rate financial instruments from the downward effects of their repricing in the event of a decreasing rate environment. The total cost of the interest rate floor was $417,500 and it was not management’s intention to use the floor as a fair value or cash flow hedge, as defined in SFAS No. 133. The Company sold the interest rate floor contract during the quarter ended June 30, 2001. For the year ended December 31, 2001 the Company recognized no interest expense related to derivative financial instruments.
The Bank also utilized interest rate floors on certain variable rate loans to protect against further downward movements in the prime rate. At December 31, 2003, there were $111.2 million in loans that are tied to the prime rate and had interest rate floors in effect pursuant to the terms of the promissory notes on these loans. These loans have a weighted average difference of 0.48% between the floor rate and the contract rate without the interest rate floor.
An analysis of the Company’s financial condition and growth can be made by examining the changes and trends in interest-earning assets and interest-bearing liabilities, and a discussion of these changes and trends follows.
Analysis of Financial Condition
Investment Securities
All of the Company’s investment securities are held in the available-for-sale ("AFS") category.At December 31, 2003 the market value of AFS securities totaled $79.5 million, compared to $71.7 million and $84.3 million at December 31, 2002 and 2001, respectively. The increase in 2003 investment securities is attributable to additional securities purchases, which were partially offset by paydowns on mortgage-backed securities and maturities during 2003. Table 6 presents the market value of the presently held AFS securities for the years ended December 31, 2003, 2002 and 2001.
Table 6 - Summary of Investment Portfolio | ||||||||||
(Dollars in Thousands) | 2003 | 2002 | 2001 | |||||||
| Obligations of United States government | ||||||||||
| agencies and corporations | $ | 34,517 | - | - | ||||||
| Obligations of states and political subdivisions | 14,950 | 14,350 | 16,404 | |||||||
| Mortgage backed securities | 24,920 | 52,386 | 63,382 | |||||||
| Junior subordinated debentures | 5,000 | 5,000 | 4,500 | |||||||
| Equity securities | 73 | - | - | |||||||
Total securities | $ | 79,460 | 71,736 | 84,286 | ||||||
The composition of the investment securities portfolio reflects the Company’s investment strategy of maintaining an appropriate level of liquidity while providing a relatively stable source of income. The investment portfolio also provides a balance to interest rate risk and credit risk in other categories of the balance sheet while providing a vehicle for the investment of available funds, furnishing liquidity, and supplying securities to pledge as required collateral for certain deposits.
| A-12 | ||
The Company’s investment portfolio consists of U.S. government agency securities, municipal securities, U.S. government agency sponsored mortgage-backed securities, trust preferred securities and equity securities. AFS securities averaged $72.1 million in 2003, $77.4 million in 2002 and $84.5 million in 2001. Table 7 presents the amortized cost of AFS securities held by the Company by maturity category at December 31, 2003. Yield information does not give effect to changes in fair value that are reflected as a component of shareholders’ equity and yields are calculated on a tax equivalent basis.Yields and interest income on tax-exempt investments have been adjusted to tax equivalent basis using an effective tax rate 34% for securities that are both federal and state tax exempt and an effective tax rate of 6.90% for state tax exempt securities.
Table 7 - Maturity Distribution and Weighted Average Yield on Investments | |||||||||||||||||||||||||||||||
After One Year | After 5 Years | ||||||||||||||||||||||||||||||
| One Year or Less | Through 5 Years | Through 10 Years | After 10 Years | Totals | ||||||||||||||||||||||||||
(Dollars in Thousands) |
| Amount | Yield | Amount | Yield | Amount | Yield | Amount | Yield | Amount | Yield | ||||||||||||||||||||
Book value: | |||||||||||||||||||||||||||||||
| United States Government agencies | $ | - | - | 9,993 | 3.10 | % | 24,553 | 4.42 | % | - | - | $ | 34,546 | 4.04 | % | ||||||||||||||||
| States and political subdivisions | 1,301 | 7.29 | % | 4,646 | 6.32 | % | 4,367 | 4.76 | % | 4,140 | 7.13 | % | 14,454 | 6.17 | % | ||||||||||||||||
| Mortgage backed securities | - | - | - | - | 7,231 | 3.54 | % | 17,680 | 4.28 | % | 24,911 | 4.07 | % | ||||||||||||||||||
| Junior subordinated debentures | - | - | - | - | - | - | 5,000 | 5.40 | % | 5,000 | 5.40 | % | |||||||||||||||||||
| Equity securities | - | - | - | - | - | - | 100 | 0.37 | % | 100 | 0.37 | % | |||||||||||||||||||
Total securities | $ | 1,301 | 7.29 | % | 14,639 | 4.12 | % | 36,151 | 4.29 | % | 26,920 | 4.91 | % | $ | 79,011 | 4.52 | % | ||||||||||||||
Loans
The loan portfolio is the largest category of the Company’s earning assets and is comprised of commercial loans, real estate mortgage loans, real estate construction loans and consumer loans. The Company restricts its primary lending market to within the Catawba Valley region of North Carolina, which encompasses Catawba, Alexander, Iredell and Lincoln counties. The mix of the loan portfolio consists primarily of loans secured by real estate and commercial loans. In management’s opinion, there are no significant concentrations of credit with particular borrowers engaged in similar activities.
The composition of the Company’s loan portfolio is presented in Table 8.
Table 8 - Loan Portfolio | |||||||||||||||||||||||||||||||
2003 | 2002 | 2001 | 2000 | 1999 | |||||||||||||||||||||||||||
(Dollars in Thousands) | Amount | % of Loans | Amount | % of Loans | Amount | % of Loans | Amount | % of Loans | Amount | % of Loans | |||||||||||||||||||||
Breakdown of loan receivables: | |||||||||||||||||||||||||||||||
| Commercial | $ | 90,558 | 16.41 | % | 92,141 | 17.51 | % | 102,409 | 20.87 | % | 96,882 | 23.58 | % | 83,644 | 24.66 | % | |||||||||||||||
| Real estate - mortgage | 332,730 | 60.26 | % | 322,987 | 61.36 | % | 277,737 | 56.61 | % | 229,260 | 55.79 | % | 190,921 | 56.29 | % | ||||||||||||||||
| Real estate - construction | 110,392 | 19.99 | % | 80,552 | 15.30 | % | 82,791 | 16.88 | % | 58,939 | 14.34 | % | 39,340 | 11.60 | % | ||||||||||||||||
| Consumer | 18,446 | 3.34 | % | 30,690 | 5.83 | % | 27,671 | 5.64 | % | 25,858 | 6.29 | % | 25,293 | 7.46 | % | ||||||||||||||||
Total loans | $ | 552,126 | 100.00 | % | 526,370 | 100.00 | % | 490,608 | 100.00 | % | 410,939 | 100.00 | % | 339,198 | 100.00 | % | |||||||||||||||
| Less: Allowance for loan losses | $ | 9,722 | 7,248 | 6,091 | 4,713 | 3,924 | |||||||||||||||||||||||||
Net loans | $ | 542,404 | 519,122 | 484,517 | 406,226 | 335,274 | |||||||||||||||||||||||||
| A-13 | ||
As of December 31, 2003, gross loans outstanding were $552.1 million, an increase of $25.7 million or 5% over the December 31, 2002 balance of $526.4 million. Most of this growth was attributable to an increase of $29.8 million in real estate construction loans in 2003, the result of an increase in real estate development loans. Real estate mortgage loans grew $9.7 million in 2003 due to increases in home equity and conforming fixed rate mortgage loans. Consumer loans decreased $12.2 million in 2003 partially due to the sale of the Bank’s credit card portfolio, which had outstanding balances of $4.4 million at December 31, 2002. The Company experienced a minimal decrease in the commercial loan portfolio. As a percentage of the Company’s total loan portfolio, real estate mortgage l oans represented 60.26% in 2003, 61.36% in 2002 and 56.61% in 2001. Over the same period commercial loans represented 16.41%, 17.51% and 20.87% of the Company’s total loan portfolio, respectively. Real estate construction loans made up 19.99%, 15.30% and 16.88% of the Company’s total loan portfolio at December 31, 2003, 2002 and 2001, respectively. Consumer loans represented 3.34%, 5.83% and 5.64% of the Company’s total loan portfolio at December 31, 2003, 2002 and 2001, respectively.
Mortgage loans held for sale were $587,000 at December 31, 2003, a decrease of $4.5 million from the December 31, 2002 balance of $5.1 million which represented a decrease of $274,000 from the December 31, 2001 balance of $5.3 million.
Table 9 identifies the maturities of all loans as of December 31, 2003 and addresses the sensitivity of these loans to changes in interest rates.
Table 9 - Maturity and Repricing Data for Loans | ||||||||||||||||
(Dollars in Thousands) | Within one year or less | After one year through five years | After five years | Total Loans | ||||||||||||
| Commercial | $ | 84,013 | 5,758 | 787 | $ | 90,558 | ||||||||||
| Real estate - mortgage | 261,849 | 39,983 | 30,898 | 332,730 | ||||||||||||
| Real estate - construction | 106,447 | 3,693 | 252 | 110,392 | ||||||||||||
| Consumer | 6,746 | 9,790 | 1,910 | 18,446 | ||||||||||||
Total loans | $ | 459,055 | 59,224 | 33,847 | $ | 552,126 | ||||||||||
| Total fixed rate loans | $ | 14,071 | 58,887 | 33,847 | $ | 106,805 | ||||||||||
| Total floating rate loans | 444,984 | 337 | - | 445,321 | ||||||||||||
Total loans | $ | 459,055 | 59,224 | 33,847 | $ | 552,126 | ||||||||||
In the normal course of business, there are various commitments outstanding to extend credit that are not reflected in the financial statements. At December 31, 2003, outstanding loan commitments totaled $104.7 million. Commitments to extend credit are agreements to lend to a customer as long as there is no violation of any condition established in the contract. Commitments generally have fixed expiration dates or other termination clauses and may require payment of a fee. Since many of the commitments may expire without being drawn upon, the total commitment amounts do not necessarily represent future cash requirements. Additional information regarding commitments is provided below in the section entitled "Contractual Obligations" and in note 10 to the consolidated financial statements.
Allowance for Loan Losses
The allowance for loan losses reflects management's assessment and estimate of the risks associated with extending credit and its evaluation of the quality of the loan portfolio. The Bank periodically analyzes the loan portfolio in an effort to review asset quality and to establish an allowance for loan losses that management believes will be adequate in light of anticipated risks and loan losses. In assessing the adequacy of the allowance, size, quality and risk of loans in the portfolio are reviewed. Other factors considered are:
- the Bank’s loan loss experience;
- the amount of past due and non-performing loans;
- specific known risks;
| A-14 | ||
- the status and amount of other past due and non-performing assets;
- underlying estimated values of collateral securing loans;
- current and anticipated economic conditions; and
- other factors which management believes affect the allowance for potential credit losses.
An analysis of the credit quality of the loan portfolio and the adequacy of the allowance for loan losses is prepared by the Bank’s credit administration personnel and presented to the Bank’s Board of Directors on a regular basis. The allowance is the total of specific reserves allocated to significant individual credits plus a general reserve. After individual loans with specific allocations have been deducted, the general reserve is calculated by applying general reserve percentages to the nine risk grades within the portfolio. Loans are categorized as one of nine risk grades based on management’s assessment of the overall credit quality of the loan, including payment history, financial position of the borrower, underlying collateral and internal credit review. The general reserve percentages are determined by management based on its evaluation of losses inherent in the various risk grades of loans. The allowance for loan losses is established through charges to expense in the form of a provision for loan losses. Loan losses and recoveries are charged and credited directly to the allowance.
An allowance for loan losses is also established, as necessary, for individual loans considered to be impaired in accordance with SFAS No. 114. A loan is considered impaired when, based on current information and events, it is probable that all amounts due according to the contractual terms of the loan will not be collected. Impaired loans are measured based on the present value of expected future cash flows, discounted at the loan’s effective interest rate, or at the loan’s observable market price, or the fair value of collateral if the loan is collateral dependent. At December 31, 2003 and 2002, the recorded investment in loans that were considered to be impaired under SFAS No. 114 was approximately $4.6 million and $4.8 million, respectively, with related allowance for loan los ses of approximately $1.5 million and $676,000, respectively.
The Bank’s allowance for loan losses is also subject to regulatory examinations and determinations as to adequacy, which may take into account such factors as the methodology used to calculate the allowance for loan losses and the size of the allowance for loan losses compared to a group of peer banks identified by the regulators. During their routine examinations of banks, the FDIC and the North Carolina Commissioner of Banks may require the Company to recognize additions to the allowance based on their judgments about information available to them at the time of their examination.
While it is the Bank's policy to charge off in the current period loans for which a loss is considered probable, there are additional risks of future losses which cannot be quantified precisely or attributed to particular loans or classes of loans. Because these risks include the state of the economy, management’s judgment as to the adequacy of the allowance is necessarily approximate and imprecise. After review of all relevant matters affecting loan collectability, management believes that the allowance for loan losses is appropriate given their analysis.
The Company grants loans and extensions of credit primarily within the Catawba Valley region of North Carolina, which encompasses Catawba, Alexander, Iredell and Lincoln counties. Although the Bank has a diversified loan portfolio, a substantial portion of the loan portfolio is collateralized by real estate, which is dependent upon the real estate market. Non-real estate loans also can be affected by local economic conditions. At December 31, 2003, approximately 6% of the Company’s portfolio was not secured by any type of collateral. Unsecured loans generally involve higher credit risk than secured loans and, in the event of customer default, the Company has a higher exposure to potential loan losses.
Net charge-offs for 2003 were $4.3 million. The ratio of net charge-offs to average total loans was 0.79%in 2003, 0.84% in 2002 and 0.48% in 2001. Charge-offs in 2003 included $1.4 million due to losses on a large commercial relationship, a local business which was effected by terrorist activities in 2001 and the Washington, DC sniper attacks in 2002. The allowance for loan losses increased to $9.7 million or 1.76% of total loans outstanding at December 31, 2003. For December 31, 2002 and 2001, the allowance for loan losses amounted to $7.2 million, or 1.38% of total loans outstanding and $6. 1 million, or 1.24% of total loans outstanding, respectively. This increase in the allowance for loan losses is attributable to higher levels of loans included in the risk grades Substandard and Low Substandard, which are risk grades given to loans with a greater risk of loss. The increase in Substandard and Low Substandard is due to the adverse impact of the slow economy in the Company’s market.
| A-15 | ||
Table 10 presents the percentage of loans assigned to each risk grade along with the general reserve percentage applied to loans in each risk grade at December 31, 2003 and 2002.
Table 10 - Loan Risk Grade Analysis | |||||||||||||
Percentage of Loans | General Reserve | ||||||||||||
By Risk Grade | Percentage | ||||||||||||
Risk Grade | 2003 | 2002 | 2003 | 2002 | |||||||||
| Risk 1 (Excellent Quality) | 11.36 | % | 8.92 | % | 0.15 | % | 0.15 | % | |||||
| Risk 2 (High Quality) | 24.03 | % | 33.22 | % | 0.50 | % | 0.50 | % | |||||
| Risk 3 (Good Quality) | 53.80 | % | 46.33 | % | 1.00 | % | 1.00 | % | |||||
| Risk 4 (Management Attention) | 5.11 | % | 5.33 | % | 2.50 | % | 2.50 | % | |||||
| Risk 5 (Watch) | 1.15 | % | 3.32 | % | 7.00 | % | 7.00 | % | |||||
| Risk 6 (Substandard) | 2.43 | % | 1.98 | % | 12.00 | % | 12.00 | % | |||||
| Risk 7 (Low Substandard) | 1.33 | % | 0.00 | % | 25.00 | % | 25.00 | % | |||||
| Risk 8 (Doubtful) | 0.00 | % | 0.00 | % | 50.00 | % | 50.00 | % | |||||
| Risk 9 (Loss) | 0.00 | % | 0.00 | % | 100.00 | % | 100.00 | % | |||||
At December 31, 2003, there was one relationship which exceeded $1.0 million in the Watch risk grade, three relationships that exceeded $1.0 million each totaling $9.4 million in the Substandard risk grade and two relationships which exceed $1.0 million each totaling $6.6 million in the Low Substandard risk grade. One relationship in the Low Substandard was to a customer whose principal was also a director of the Company at December 31, 2003, with loans totaling $3.7 million. Balances of individual relationships exceeding $1.0 million in these risk grades ranged from $1.5 million to $3.9 million. These customers continue to meet payment requirements and these relationships would not become non-performing assets unless they are unable to meet those requirements.
Table 11 presents an analysis of the allowance for loan losses, including charge-off activity.
Table 11 - Analysis of Allowance for Loan Losses | ||||||||||||||||
(Dollars in Thousands) | 2003 | 2002 | 2001 | 2000 | 1999 | |||||||||||
| Reserve for loan losses at beginning | $ | 7,248 | 6,091 | 4,713 | 3,924 | 4,137 | ||||||||||
| Loans charged off: | ||||||||||||||||
| Commercial | 1,179 | 3,737 | 842 | 857 | 485 | |||||||||||
| Real estate - mortgage | 2,422 | 158 | 790 | 10 | 25 | |||||||||||
| Real estate - construction | 251 | - | 51 | 36 | - | |||||||||||
| Consumer | 630 | 546 | 675 | 255 | 195 | |||||||||||
Total loans charged off | $ | 4,482 | 4,441 | 2,358 | 1,158 | 705 | ||||||||||
| Recoveries of losses previously charged off: | ||||||||||||||||
| Commercial | 36 | 40 | 84 | 20 | 24 | |||||||||||
| Real estate - mortgage | 18 | - | - | - | - | |||||||||||
| Real estate - construction | 1 | 4 | 6 | - | - | |||||||||||
| Consumer | 157 | 122 | 101 | 48 | 43 | |||||||||||
Total recoveries | $ | 212 | 166 | 191 | 68 | 67 | ||||||||||
Net loans charged off | $ | 4,270 | 4,275 | 2,167 | 1,090 | 638 | ||||||||||
| Provision for loan losses | 6,744 | 5,432 | 3,545 | 1,879 | 425 | |||||||||||
Reserve for loan losses at end of year | $ | 9,722 | 7,248 | 6,091 | 4,713 | 3,924 | ||||||||||
| Loans charged off net of recoveries, as | ||||||||||||||||
| a percent of average loans outstanding | 0.79 | % | 0.84 | % | 0.48 | % | 0.29 | % | 0.20 | % | ||||||
| A-16 | ||
Non-performing Assets
Non-performing assets, comprised of non-accrual loans, other real estate owned, other repossessed assets and loans for which payments are more than 90 days past due totaled $6.3 million at December 31, 2003 compared to $6.6 million at December 31, 2002. Non-accrual loans were $4.3 million at December 31, 2003, a decrease of $259,000 from non-accruals of $4.6 million at December 31, 2002. As a percentage of loans outstanding, non-accrual loans were 0.79% and 0.87% at December 31, 2003 and 2002, respectively. The Bank had loans ninety days past due and still accruing at December 31, 2003 of $271,000 as compared to $239,000 for the same period in 2002. Other real estate owned totaled $1.4 million and $240,000 as of December 31, 2003 and 2002, respectively. This increase is primarily attributab le to the acquisition of properties through foreclosure from a real estate development customer that was adversely impacted by the slowdown in area businesses. Repossessed assets, primarily consisting of aircraft taken in collection of loans, totaled $206,000 and $1.5 million as of December 31, 2003 and 2002, respectively. The Bank is actively marketing other real estate owned and repossessed assets in an effort to dispose of these assets as quickly and efficiently as possible.
At December 31, 2003 the Company had non-performing loans, defined as non-accrual and accruing loans past due more than 90 days, of $4.6 million or 0.84% of total loans. Non-performing loans for 2002 were $4.8 million, or 0.92% of total loans and $4.4 million, or 0.90% of total loans for 2001. Interest that would have been recorded on non-accrual loans for the years ended December 31, 2003, 2002 and 2001, had they performed in accordance with their original terms, amounted to approximately $400,000, $484,000 and $695,000 respectively. Interest income on impaired loans included in the results of operations for 2003, 2002, and 2001 amounted to approximately $82,000, $22,000 and $38,000, respectively.
Management continually monitors the loan portfolio to ensure that all loans potentially having a material adverse impact on future operating results, liquidity or capital resources have been classified as non-performing. Should economic conditions deteriorate, the inability of distressed customers to service their existing debt could cause higher levels of non-performing loans.
It is the general policy of the Company to stop accruing interest income and place the recognition of interest on a cash basis when a loan is placed on non-accrual status and any interest previously accrued but not collected is reversed against current income. Generally a loan is placed on non-accrual status when it is over 90 days past due and there is reasonable doubt that all principal will be collected.
A summary of non-performing assets at December 31 for each of the years presented is shown in table 12.
Table 12 - Non-performing Assets | ||||||||||||||||
(Dollars in Thousands) | 2003 | 2002 | 2001 | 2000 | 1999 | |||||||||||
| Nonaccrual loans | $ | 4,343 | 4,602 | 3,756 | 5,421 | 2,866 | ||||||||||
| Loans 90 days or more past due and still accruing | 271 | 239 | 655 | 545 | 645 | |||||||||||
Total non-performing loans | 4,614 | 4,841 | 4,411 | 5,966 | 3,511 | |||||||||||
| All other real estate owned | 1,447 | 240 | 256 | 112 | 44 | |||||||||||
| All other repossessed assets | 206 | 1,538 | 4 | 3 | - | |||||||||||
Total non-performing assets | $ | 6,267 | 6,619 | 4,671 | 6,081 | 3,555 | ||||||||||
As a percent of total loans at year end | ||||||||||||||||
| Non-accrual loans | 0.79 | % | 0.87 | % | 0.77 | % | 1.32 | % | 0.84 | % | ||||||
| Loans 90 days or more past due and still accruing | 0.05 | % | 0.05 | % | 0.13 | % | 0.13 | % | 0.19 | % | ||||||
| Total non-performing assets | 1.14 | % | 1.26 | % | 0.95 | % | 1.48 | % | 1.05 | % | ||||||
Deposits
The Company primarily uses deposits to fund its loan and investment portfolios. The Company offers a variety of deposit accounts to individuals and businesses. Deposit accounts include checking, savings, money market and time deposits. As of December 31, 2003, total deposits were $549.8 million, an increase of $34.1 million or 7% increase over the December 31, 2002 balance of $515.7 million.The increase in deposits is primarily attributable to growth in core deposits to $378.2 million at December 31, 2003 from $354.9 million at December 31, 2002, which resulted from retail and commercial depo sit campaigns implemented in 2003.
| A-17 | ||
Time deposits in amounts of $100,000 or more totaled $171.6 million at December 31, 2003, $160.8 million and $156.0 million at December 31, 2002 and 2001, respectively. At December 31, 2003, brokered deposits amounted to $55.5 million as compared to $39.9 million at December 31, 2002. This reflects management’s efforts to manage the cost of funds by replacing high cost local deposits with lower cost brokered deposits to fund loan growth. Brokered deposits are generally considered to be more susceptible to withdrawal as a result of interest rate changes and to be a less stable source of funds, as compared to deposits from the local market. Brokered deposits outstanding as of December 31, 2003 have a weighted average rate of 2.54% with a weighted average original term of 22 months.
Table 13 is a summary of the maturity distribution of time deposits in amounts of $100,000 or more as of December 31, 2003.
Table 13 - Maturities of Time Deposits over $100,000 | ||||
(Dollars in Thousands) | 2003 | |||
| Three months or less | $ | 39,345 | ||
| Over three months through six months | 34,582 | |||
| Over six months through twelve months | 50,623 | |||
| Over twelve months | 47,047 | |||
Total | $ | 171,597 | ||
Borrowed Funds
The Company has access to various short-term borrowings, including the purchase of Federal Funds and borrowing arrangements from the FHLB and other financial institutions. At December 31, 2003, FHLB borrowings totaled $58.0 million compared to $63.1 million at December 31, 2002 and $68.2 million at December 31, 2001. Average FHLB borrowings for 2003 were $59.3 million, compared to average balances of $61.0 million for 2002 and $42.5 million for 2001. The maximum amount of outstanding FHLB borrowings was $75.1 million in 2003, and $74.2 in 2002 and $68.2 in 2001.The FHLB advances outstanding a t December 31, 2003 had both fixed and adjustable interest rates ranging from 1.14% to 6.49%. Currently $6.0 million of the FHLB advances outstanding have contractual maturities prior to December 31, 2004. As of December 31, 2003, the Company had $52.0 million in convertible FHLB advances. Additional information regarding FHLB advances is provided in note 6 to the consolidated financial statements.
Demand notes payable to the U. S. Treasury, which represent treasury tax and loan payments received from customers, amounted to approximately $443,000, $1.6 million and $118,000 at December 31, 2003, 2002 and 2001, respectively.
The Company had no federal funds purchased as of December 31, 2003, 2002 or 2001.
Junior Subordinated Debentures (related to Trust Preferred Securities)
In December 2001 the Company formed a wholly owned Delaware statutory trust, PEBK Capital Trust I ("PEBK Trust"), which issued $14.0 million of guaranteed preferred beneficial interests in the Company’s junior subordinated deferrable interest debentures that qualify as Tier I capital under Federal Reserve Board guidelines. All of the common securities of PEBK Trust are owned by the Company. The proceeds from the issuance of the common securities and the trust preferred securities were used by PEBK Trust to purchase $14.4 million of junior subordinated debentures of the Company, which pay interest at a floating rate equal to prime plus 50 basis points. The proceeds received by the Company from the sale of the junior subordinated debentures were used for general purposes,primarily to provide capital to the Bank. The debentures represent the sole asset of PEBK Trust. PEBK Trust is not included in the consolidated financial statements at December 31, 2003, 2002 or 2001.
The trust preferred securities accrue and pay quarterly distributions based on the liquidation value of $50,000 per capital security at a floating rate of prime plus 50 basis points. The Company has guaranteed distributions and other payments due on the trust preferred securities to the extent PEBK Trust has funds with which to make the distributions and other payments. The net combined effect of all the documents entered into in connection with the trust preferred securities is that the Company is liable to make the distributions and other payments required on the trust preferred securities.
The trust preferred securities are mandatorily redeemable upon maturity of the debentures on December 31, 2031, or upon earlier redemption as provided in the indenture. The Company has the right to redeem the debentures purchased by PEBK Trust, in whole or in part, on or after December 31, 2006. As specified in the indenture, if the debentures are redeemed prior to maturity, the redemption price will be the principal amount and any accrued but unpaid interest.
| A-18 | ||
Contractual Obligations and Off-Balance Sheet Arrangements
The Company's contractual obligations and other commitmentsas of December 31,2003 are summarized in table 14 below. The Company's contractual obligations include the repayment of principal and interest related to FHLB advances and junior subordinated debentures, as well as payments under current lease agreements. Other commitments include commitments to extend credit. Because not all of these commitments to extend credit will be drawn upon, the actual cash requirements are likely to be significantly less than the amounts reported for other commitments below.
Table 14 - Contractual Obligations and Other Commitments | ||||||||||||||||
(Dollars in Thousands) | Within one year | One to Three Years | Three to Five Years | Five Years or More | Total | |||||||||||
Contractual Cash Obligations | ||||||||||||||||
| Long-term borrowings* | $ | - | 5,000 | - | 47,000 | $ | 52,000 | |||||||||
| Junior subordinated debentures | - | - | - | 14,433 | 14,433 | |||||||||||
| Operating lease obligations | 672 | 1,244 | 737 | 1,953 | 4,606 | |||||||||||
Total | $ | 672 | 6,244 | 737 | 63,386 | $ | 71,039 | |||||||||
Other Commitments | ||||||||||||||||
| Commitments to extend credit | $ | 36,939 | $ | 13,498 | $ | 14,169 | $ | 40,124 | $ | 104,730 | ||||||
| Standby letters of credit | ||||||||||||||||
| and financial guarantees written | 3,520 | 356 | - | - | 3,876 | |||||||||||
Total | $ | 40,459 | 13,854 | 14,169 | 40,124 | $ | 108,606 | |||||||||
| *Excludes $6.0 million adjustable rate credit due to the FHLB, which matured in January 2004. | ||||||||||||||||
Off-Balance Sheet Arrangements
The Company enters into derivative contracts to manage various financial risks. A derivative is a financial instrument that derives its cash flows, and therefore its value, by reference to an underlying instrument, index or referenced interest rate. Derivative contracts are carried at fair value on the consolidated balance sheet with the fair value representing the net present value of expected future cash receipts or payments based on market interest rates as of the balance sheet date. Derivative contracts are written in amounts referred to as notional amounts, which only provide the basis for calculating payments between counterparties and are not a measure of financial risk. Therefore, the derivative liabilities recorded on the balance sheet as of December 31, 2003 do not represent the amounts that may ultimately be paid under these contracts. Further discussions of derivative i nstruments are included under “Asset Liability and Interest Rate Risk Management” beginning on page A-8 and in notes 1, 10, 11 and 16 to the consolidated financial statements.
Capital Resources
Shareholders’ equity at December 31, 2003 and 2002 was $48.6 million compared to $45.4 million at December 31, 2001. At December 31, 2003, unrealized gains and losses, net of taxes, amounted to a gain of approximately $588,000. For the years ended December 31, 2002 and 2001, unrealized gains and losses, net of taxes, amounted to a gain of approximately $1.4 million and a loss of approximately $922,000, respectively. Average shareholders’ equity as a percentage of total average assets is one measure used to determine capital strength. Average shareholders’ equity as a percentage of total average assets was 7.56%, 7.72% and 8.25% for 2003, 2002 and 2001. The return on average shareholders’ equity was 4.01% at December 31, 2003 as compared to 7.12% and 9.65% as of December 31, 2002 and December 31, 2001, respectively. Total cash dividends paid during 2003 and 2002 amounted to $1.3 million. In 2002, the Company repurchased $1.3 million, or 85,500 shares of its common stock as part of the stock repurchase plan implemented in February 2002, which expired in February 2003.
Under regulatory capital guidelines, financial institutions are currently required to maintain a total risk-based capital ratio of 8.0% or greater, with a Tier 1 risk-based capital ratio of 4.0% or greater. Tier 1 capital is generally defined as shareholders' equity and trust preferred securities less all intangible assets and goodwill. Tier 1 capital at December 31, 2003, 2002 and 2001 includes $14.0 million in trust preferred securities. The Company’s Tier I capital ratio was 10.50%, 10.76% and 11.14% at December 31, 2003, 2002 and 2001, respectively. Total risk-based capital is defined as Tier 1 capital plus supplementary capital. Supplementary capital, or Tier 2 capital, consists of the Company's allowance for loan losses, not exceeding 1.25% of the Company's risk-weighted assets. Total risk-based capital ratio is therefore defined as the ratio of total capital (Tier 1 capi tal and Tier 2 capital) to risk-weighted assets. The Company’s total risk-based capital ratio was 11.75%,
| A-19 | ||
12.01% and 12.27% at December 31, 2003, 2002 and 2001, respectively. In addition to the Tier I and total risk-based capital requirements, financial institutions are also required to maintain a leverage ratio of Tier 1 capital to total average assets of 4.0% or greater. The Company’s Tier I leverage capital ratio was 9.37%, 9.78% and 10.46% at December 31, 2003, 2002 and 2001, respectively.
The Capital treatment of trust preferred securities is currently under review by the Federal Reserve Bank due to PEBK Trust being deconsolidated under FIN 46. Depending on capital treatment resolution, trust preferred securities may no longer qualify as Tier 1 Capital. In July 2003, the Federal Reserve Bank issued a Supervision and Regulation letter requiring bank holding companies to continue to follow current instructions for reporting trust preferred securities in regulatory reports. Accordingly, the Company will continue to report trust preferred securities as Tier 1 Capital until further notice from the Federal Reserve Bank. Further discussions of FIN 46 are included under “Recent Accounting Pronouncements” in note 1 to the consolidated financial statements.
A bank is considered to be "well capitalized" if it has a total risk-based capital ratio of 10.0 % or greater, a Tier I risk-based capital ratio of 6.0% or greater, and has a leverage ratio of 5.0% or greater.Based upon these guidelines, the Bank was considered to be "well capitalized" at December 31, 2003, 2002 and 2001.
The Company’s key equity ratios as of December 31, 2003, 2002 and 2001 are presented in Table 15.
Table 15 - Equity Ratios | ||||||||||
2003 | 2002 | 2001 | ||||||||
| Return on average assets | 0.30 | % | 0.55 | % | 0.80 | % | ||||
| Return on average equity | 4.01 | % | 7.12 | % | 9.65 | % | ||||
| Dividend payout ratio | 62.56 | % | 36.58 | % | 28.14 | % | ||||
| Average equity to average assets | 7.56 | % | 7.72 | % | 8.25 | % | ||||
Quarterly Financial Data
The Company’s consolidated quarterly operating results for the years ended December 31, 2003 and 2002 are presented in table 16.
Table 16 - Quarterly Financial Data | |||||||||||||||||||||||||
2003 | 2002 | ||||||||||||||||||||||||
(Dollars in thousands, except per share amounts) | First | Second | Third | Fourth | First | Second | Third | Fourth | |||||||||||||||||
| Total interest income | $ | 8,694 | 8,651 | 8,610 | 8,899 | $ | 9,089 | 9,138 | 9,345 | 9,052 | |||||||||||||||
| Total interest expense | 3,238 | 3,216 | 3,193 | 3,101 | 4,607 | 4,127 | 3,639 | 3,404 | |||||||||||||||||
Net interest income | 5,456 | 5,435 | 5,417 | 5,798 | 4,482 | 5,011 | 5,706 | 5,648 | |||||||||||||||||
| Provision for loan losses | 793 | 2,277 | 1,560 | 2,114 | 500 | 1,266 | 1,578 | 2,088 | |||||||||||||||||
| Other income | 1,984 | 1,056 | 1,590 | 1,295 | 1,524 | 1,406 | 2,070 | 1,491 | |||||||||||||||||
| Other expense | 4,447 | 4,175 | 4,821 | 4,785 | 4,215 | 4,193 | 4,194 | 4,156 | |||||||||||||||||
Income before income taxes | 2,200 | 39 | 626 | 194 | 1,291 | 958 | 2,004 | 895 | |||||||||||||||||
| Income taxes | 782 | (52 | ) | 307 | 18 | 405 | 312 | 710 | 285 | ||||||||||||||||
Net earnings | $ | 1,418 | 91 | 319 | 176 | $ | 886 | 646 | 1,294 | 610 | |||||||||||||||
Basic earnings per share | $ | 0.45 | 0.03 | 0.10 | 0.06 | $ | 0.28 | 0.21 | 0.41 | 0.19 | |||||||||||||||
Diluted earnings per share | $ | 0.45 | 0.03 | 0.10 | 0.06 | $ | 0.28 | 0.20 | 0.41 | 0.19 | |||||||||||||||
| A-20 | ||
QUANTATIVE AND QUALITATIVE DISCLOSURES ABOUT MARKET RISK
Market risk reflects the risk of economic loss resulting from adverse changes in market prices and interest rates. This risk of loss can be reflected in either diminished current market values or reduced potential net interest income in future periods.
The Company’s market risk arises primarily from interest rate risk inherent in its lending and deposit taking activities. The structure of the Company’s loan and deposit portfolios is such that a significant decline (increase) in interest rates may adverselyimpact net market values and interest income. Management seeks to manage the risk through the utilization of its investment securities and off balance sheet derivative instruments. During the years ended December 31, 2003, 2002 and 2001, the Company used interest rate contracts to manage market risk as discussed above in the sect ion entitled "Asset Liability and Interest Rate Risk Management".
Table 17 presents in tabular form the contractual balances and the estimated fair value of the Company’s on-balance sheet financial instruments and the notional amount and estimated fair value of the Company’s off-balance sheet derivative instruments at their expected maturity dates for the period ended December 31, 2003. The expected maturity categories take into consideration historical prepayment experience as well as management’s expectations based on the interest rate environment at December 31, 2003. As of December 31, 2003, all fixed rate advances are callable at the option of FHLB. In the current rate environment management does not anticipate these to be called. For core deposits without contractual maturity (i.e. interest bearing checking, savings, and money market accounts), the table presents principal cash flows based on management’s judgment concerning their most likely runoff or repricing behaviors.
Table 17 - Market Risk Table | ||||||||||||||||||||||
(Dollars In Thousands) | Principal/Notional Amount Maturing in Year Ended December 31, | |||||||||||||||||||||
Loans Receivable | 2004 |
|
| 2005 |
|
| 2006 |
|
| 2007 & 2008 |
|
| Thereafter |
|
| Total |
|
| Fair Value | |||
| Fixed rate | $ | 21,215 | 19,986 | 14,178 | 22,270 | 29,156 | $ | 106,805 | $ | 106,172 | ||||||||||||
| Average interest rate | 7.23 | % | 8.11 | % | 7.73 | % | 7.56 | % | 7.52 | % | ||||||||||||
| Variable rate | $ | 196,574 | 55,321 | 38,759 | 73,755 | 80,912 | $ | 445,321 | $ | 445,321 | ||||||||||||
| Average interest rate | 4.93 | % | 5.00 | % | 4.99 | % | 5.15 | % | 4.90 | % | ||||||||||||
Investment Securities | ||||||||||||||||||||||
| Interest bearing cash | $ | - | - | - | - | 1,457 | $ | 1,457 | $ | 1,457 | ||||||||||||
| Average interest rate | - | - | - | - | 1.21 | % | ||||||||||||||||
| Federal funds sold | $ | 2,369 | - | - | - | - | $ | 2,369 | $ | 2,369 | ||||||||||||
| Average interest rate | 1.28 | % | - | - | - | - | ||||||||||||||||
| Securities available for sale | $ | 15,898 | 22,489 | 2,933 | 6,870 | 31,270 | $ | 79,460 | $ | 79,460 | ||||||||||||
| Average interest rate | 3.70 | % | 4.66 | % | 4.37 | % | 4.42 | % | 4.64 | % | ||||||||||||
| Nonmarketable equity securities | - | - | - | - | 4,217 | $ | 4,217 | $ | 4,217 | |||||||||||||
| Average interest rate | - | - | - | - | 3.62 | % | ||||||||||||||||
Debt Obligations | ||||||||||||||||||||||
| Deposits | $ | 242,739 | 48,672 | 7,860 | 21,769 | 228,762 | $ | 549,802 | $ | 551,115 | ||||||||||||
| Average interest rate | 2.29 | % | 2.20 | % | 2.56 | % | 4.14 | % | 0.61 | % | ||||||||||||
| Advances from FHLB | $ | 6,000 | - | 35,000 | - | 17,000 | $ | 58,000 | $ | 65,062 | ||||||||||||
| Average interest rate | 1.14 | % | - | 4.08 | % | - | 6.08 | % | ||||||||||||||
| Demand notes payable to U.S. Treasury | $ | 443 | - | - | - | - | $ | 443 | $ | 443 | ||||||||||||
| Average interest rate | 0.74 | % | - | - | - | - | ||||||||||||||||
| Junior subordinated debentures | $ | - | - | - | - | 14,433 | $ | 14,433 | $ | 14,433 | ||||||||||||
| Average interest rate | - | - | - | - | 4.42 | % | ||||||||||||||||
| A-21 | ||
Table 18 presents the simulated impact to net interest income under varying interest rate scenarios and the theoretical impact of rate changes over a twelve-month period referred to as "rate ramps". The table shows the estimated theoretical impact on the Company’s tax equivalent net interest income from hypothetical rate changes of plus and minus 1% and 2% as compared to the estimated theoretical impact of rates remaining unchanged. The table also shows the simulated impact to market value of equity under varying interest rate scenarios and the theoretical impact of immediate and sustained rate changes referred to as "rate shocks" of plus and minus 1% and 2% compared to the theoretical impact of rates remaining unchanged. The prospective effects of the hypothetical interest rate change s is based upon various assumptions, including relative and estimated levels of key interest rates. This type of modeling has limited usefulness because it does not allow for the strategies management would utilize in response to sudden and sustained rate changes. Also, management does not believe that rate changes of the magnitude presented are likely in the forecast period presented.
Table 18 - Interest Rate Risk | |||||
(Dollars in thousands) | |||||
Estimated Resulting Theoretical Net Interest Income | |||||
Hypothetical rate change (ramp over 12 months) | Amount | % Change | |||
| +2% | $ 24,665 | 7.71% | |||
| +1% | $ 23,662 | 3.33% | |||
| 0% | $ 22,899 | 0.00% | |||
| -1% | $ 22,258 | -2.80% | |||
| -2% | $ 21,560 | -5.85% | |||
Estimated Resulting Theoretical Market Value of Equity | |||||
Hypothetical rate change (immediate shock) | Amount | % Change | |||
| +2% | $ 43,210 | 11.02% | |||
| +1% | $ 40,934 | 5.17% | |||
| 0% | $ 38,921 | 0.00% | |||
| -1% | $ 36,271 | -6.81% | |||
| -2% | $ 36,733 | -5.62% | |||
| A-22 | ||
MARKET FOR THE COMPANY’S COMMON EQUITY
AND RELATED SHAREHOLDER MATTERS
Peoples Bancorp common stock is traded on the over-the-counter (OTC) market and quoted on the Nasdaq National Market, under the symbol "PEBK". Scott and Stringfellow, Inc., Ryan, Beck & Co., Sterne Agee & Leach, Inc. and Trident Securities, Inc. are market makers for the Company’s shares.
Although the payment of dividends by the Company is subject to certain requirements and limitations of North Carolina corporate law, neither the Commissioner nor the FDIC have promulgated any regulations specifically limiting the right of the Company to pay dividends and repurchase shares. However, the ability of the Company to pay dividends and repurchase shares may be dependent upon the Company’s receipt of dividends from the Bank. The Bank’s ability to pay dividends is limited. North Carolina commercial banks, such as the Bank, are subject to legal limitations on the amounts of dividends they are permitted to pay. Dividends may be paid by the Bank from undivided profits, which are determined by deducting and charging certain items against actual profits, including any contribut ions to surplus required by North Carolina law. Also, an insured depository institution, such as the Bank, is prohibited from making capital distributions, including the payment of dividends, if, after making such distribution, the institution would become "undercapitalized" (as such term is defined in the applicable law and regulations). Based on its current financial condition, the Bank does not expect that this provision will have any impact on the Bank’s ability to pay dividends.
As of March 12, 2004, the Company had 701 shareholders of record, not including the number of persons or entitieswhose stock is held in nominee or street name through various brokerage firms or banks. The market price for the Company’s common stock was $18.58 on March 12, 2004.
Table 19 presents certain market and dividend information for the last two fiscal years. Over-the-counter quotations reflect inter-dealer prices, without retail mark-up, mark down or commission and may not necessarily represent actual transactions.
Table 19 - Market and Dividend Data | ||||||||||
Cash Dividend | ||||||||||
2003 | Low Bid |
|
| High Bid |
|
| Per Share | |||
| First Quarter | $ | 13.910 | $ | 15.100 | $ | 0.10 | ||||
| Second Quarter | $ | 14.750 | $ | 18.250 | $ | 0.10 | ||||
| Third Quarter | $ | 16.380 | $ | 19.000 | $ | 0.10 | ||||
| Fourth Quarter | $ | 16.910 | $ | 20.820 | $ | 0.10 | ||||
Cash Dividend | ||||||||||
2002 | Low Bid | High Bid | Per Share | |||||||
| First Quarter | $ | 14.450 | $ | 16.250 | $ | 0.10 | ||||
| Second Quarter | $ | 16.050 | $ | 17.720 | $ | 0.10 | ||||
| Third Quarter | $ | 12.860 | $ | 16.450 | $ | 0.10 | ||||
| Fourth Quarter | $ | 13.170 | $ | 14.800 | $ | 0.10 | ||||
| A-23 | ||
DIRECTORS AND OFFICERS OF THE COMPANY
DIRECTORS
Robert C. Abernethy – Chairman
Chairman of the Board, Peoples Bancorp of North Carolina, Inc. and Peoples Bank;
President, Secretary and Treasurer, Carolina Glove Company, Inc. (glove manufacturer)
James S. Abernethy
President and Assistant Secretary, Midstate Contractors, Inc. (paving company)
Douglas S. Howard
Vice President, Howard Ventures, Inc.
John W. Lineberger, Jr.
President, Lincoln Bonded Warehouse Company (commercial warehousing and distribution facility)
Gary E. Matthews
President and Director, Matthews Construction Company, Inc.
Charles F. Murray
President, Murray’s Hatchery, Inc.
Billy L. Price, Jr. MD
Practicing Internist and Partner, Catawba Valley Internal Medicine, P.A.
Larry E. Robinson
President and Chief Executive Officer, Blue Ridge Distributing Co., Inc. (beer and wine distributor)
& President and Chief Executive Officer, Associated Brands, Inc. (beer and wine distributor)
Fred L. Sherrill, Jr.
Retired (furniture manufacturing executive)
William Gregory (Greg) Terry
Executive Vice President, Drum & Willis Funeral Homes and Crematory
Dan Ray Timmerman, Sr.
President, Timmerman Manufacturing, Inc. (wrought iron furniture manufacturer)
Benjamin I. Zachary
General Manager, Treasurer, Secretary and Member of the Board of Directors,
Alexander Railroad Company
OFFICERS
Tony W. Wolfe
President and Chief Executive Officer
Joseph F. Beaman, Jr.
Executive Vice President and Corporate Secretary
Lance A. Sellers
Executive Vice President and Assistant Corporate Secretary
William D. Cable
Executive Vice President and Assistant Corporate Treasurer
A. Joseph Lampron
Executive Vice President, Chief Financial Officer and Corporate Treasurer
| A-24 | ||
REPORT OF INDEPENDENT CERTIFIED PUBLIC ACCOUNTANTS
To the Board of Directors and Shareholders
Peoples Bancorp of North Carolina, Inc.
Newton, North Carolina:
We have audited the accompanying consolidated balance sheets of Peoples Bancorp of North Carolina, Inc. as of December 31, 2003 and 2002, and the related consolidated statements of earnings, changes in shareholders’ equity, comprehensive income and cash flows for each of the three years in the period ended December 31, 2003. These financial statements are the responsibility of the Company’s management. Our responsibility is to express an opinion on these financial statements based on our audits.
We conducted our audits in accordance with auditing standards generally accepted in the United States of America. Those standards require that we plan and perform the audit to obtain reasonable assurance about whether the financial statements are free of material misstatement. An audit includes examining, on a test basis, evidence supporting the amounts and disclosures in the financial statements. An audit also includes assessing the accounting principles used and significant estimates made by management, as well as evaluating the overall financial statement presentation. We believe that our audits provide a reasonable basis for our opinion.
In our opinion, the consolidated financial statements referred to above present fairly, in all material respects, the financial position of Peoples Bancorp of North Carolina, Inc. as of December 31, 2003 and 2002, and the results of their operations and their cash flows for each of the three years in the period ended December 31, 2003, in conformity with accounting principles generally accepted in the United States of America.
&nbs p; /s/ PORTER KEADLE MOORE, LLP
Atlanta, Georgia
Atlanta, Georgia
January 16, 2004
| A-25 | ||
PEOPLES BANCORP OF NORTH CAROLINA, INC.
Consolidated Balance Sheets
December 31, 2003 and 2002
| 2003 |
|
| 2002 | ||||
Assets | |||||||
| Cash and due from banks, including reserve requirements | |||||||
| of $3,262,000 and $2,633,000 | $ | 18,413,786 | 13,803,665 | ||||
| Federal funds sold | 2,369,000 | 1,774,000 | |||||
| Cash and cash equivalents | 20,782,786 | 15,577,665 | |||||
| Investment securities available for sale | 79,460,452 | 71,735,705 | |||||
| Other investments | 4,216,973 | 4,345,573 | |||||
| Mortgage loans held for sale | 587,495 | 5,064,635 | |||||
| Loans, net | 542,403,922 | 519,121,840 | |||||
| Premises and equipment, net | 12,537,230 | 15,620,977 | |||||
| Cash surrender value of life insurance | 5,045,449 | 4,828,708 | |||||
| Accrued interest receivable and other assets | 8,998,137 | 9,342,835 | |||||
$ | 674,032,444 | 645,637,938 | |||||
Liabilities and Shareholders’ Equity | |||||||
| Deposits: | |||||||
| Noninterest-bearing | $ | 72,420,923 | 67,398,458 | ||||
| Interest-bearing | 477,381,309 | 448,340,497 | |||||
| Total deposits | 549,802,232 | 515,738,955 | |||||
| Demand notes payable to U. S. Treasury | 443,384 | 1,600,000 | |||||
| Accrued interest payable and other liabilities | 2,799,932 | 2,189,821 | |||||
| Federal Home Loan Bank advances | 58,000,000 | 63,071,429 | |||||
| Junior subordinated debentures | 14,433,000 | 14,433,000 | |||||
| Total liabilities | 625,478,548 | 597,033,205 | |||||
| Commitments | |||||||
| Shareholders’ equity: | |||||||
| Preferred stock, no par value; authorized 5,000,000 shares; | |||||||
| no shares issued and outstanding | - | - | |||||
| Common stock, no par value; authorized 20,000,000 shares; | |||||||
| 3,135,202 and 3,133,547 shares issued and outstanding | 35,121,510 | 35,097,773 | |||||
| Retained earnings | 12,844,524 | 12,094,363 | |||||
| Accumulated other comprehensive income | 587,862 | 1,412,597 | |||||
| Total shareholders’ equity | 48,553,896 | 48,604,733 | |||||
$ | 674,032,444 | 645,637,938 | |||||
See accompanying notes to consolidated financial statements.
| A-26 | ||
PEOPLES BANCORP OF NORTH CAROLINA, INC.
Consolidated Statements of Earnings
For the Years Ended December 31, 2003, 2002 and 2001
| 2003 | 2002 | 2001 | ||||||||
| Interest income: | ||||||||||
| Interest and fees on loans | $ | 31,531,673 | 32,038,359 | 36,512,395 | ||||||
| Interest on federal funds sold | 58,384 | 45,271 | 126,791 | |||||||
| Interest and dividends on securities: | ||||||||||
| U. S. Government agencies | 2,244,375 | 3,439,814 | 3,918,551 | |||||||
| State and political subdivisions | 577,339 | 613,219 | 911,707 | |||||||
| Other | 441,958 | 487,284 | 428,157 | |||||||
| Total interest income | 34,853,729 | 36,623,947 | 41,897,601 | |||||||
| Interest expense: | ||||||||||
| Deposits | 9,476,208 | 12,364,245 | 20,790,136 | |||||||
| Federal Home Loan Bank advances | 2,597,043 | 2,658,742 | 2,118,511 | |||||||
| Other | 675,417 | 754,344 | 117,849 | |||||||
| Total interest expense | 12,748,668 | 15,777,331 | 23,026,496 | |||||||
| Net interest income | 22,105,061 | 20,846,616 | 18,871,105 | |||||||
| Provision for loan losses | 6,743,900 | 5,431,600 | 3,545,322 | |||||||
| Net interest income after provision for loan losses | 15,361,161 | 15,415,016 | 15,325,783 | |||||||
| Other income: | ||||||||||
| Service charges on deposit accounts | 3,266,949 | 3,060,581 | 2,805,492 | |||||||
| Other service charges and fees | 610,591 | 503,165 | 471,998 | |||||||
| Gain (loss) on sale of securities | (52,855 | ) | 625,616 | 1,613,992 | ||||||
| Mortgage banking income | 685,343 | 702,290 | 1,014,043 | |||||||
| Insurance and brokerage commissions | 420,762 | 477,765 | 348,582 | |||||||
| Loss on foreclosed and repossessed assets | (746,543 | ) | (564 | ) | (65,630 | ) | ||||
| Gain on sale of loans | 478,759 | - | - | |||||||
| Miscellaneous | 1,262,883 | 1,121,762 | 2,074,427 | |||||||
Total other income | 5,925,889 | 6,490,615 | 8,262,904 | |||||||
| Other expenses: | ||||||||||
| Salaries and employee benefits | 10,099,811 | 9,569,016 | 9,115,496 | |||||||
| Occupancy | 3,389,857 | 3,142,712 | 2,984,100 | |||||||
| Other operating | 4,738,253 | 4,046,347 | 4,652,197 | |||||||
| Total other expenses | 18,227,921 | 16,758,075 | 16,751,793 | |||||||
| Earnings before income taxes | 3,059,129 | 5,147,556 | 6,836,894 | |||||||
| Income tax expense | 1,055,538 | 1,712,000 | 2,261,542 | |||||||
| Net earnings | $ | 2,003,591 | 3,435,556 | 4,575,352 | ||||||
| Basic earnings per share | $ | 0.64 | 1.09 | 1.42 | ||||||
| Diluted earnings per share | $ | 0.63 | 1.09 | 1.42 | ||||||
See accompanying notes to consolidated financial statements.
| A-27 | ||
PEOPLES BANCORP OF NORTH CAROLINA, INC.
Consolidated Statements of Changes in Shareholders’ Equity
For the Years Ended December 31, 2003, 2002 and 2001
|
|
|
|
|
| Accumulated |
|
|
| |||||||
|
|
|
|
|
|
|
| Other |
|
|
| |||||
| Common Stock |
| Retained |
|
| Comprehensive |
|
|
| |||||||
|
|
|
|
|
|
|
|
|
|
| ||||||
|
| Shares |
|
| Amount |
|
| Earnings |
|
| Income (Loss | ) |
| Total |
| |
| Balance, December 31, 2000 | 3,218,714 | $ | 36,407,798 | 6,627,533 | 3,688 | 43,039,019 | ||||||||||
| Cash dividends declared ($0.40 per share) | - | - | (1,287,486 | ) | - | (1,287,486 | ) | |||||||||
| Net earnings | - | - | 4,575,352 | - | 4,575,352 | |||||||||||
| Change in accumulated other | ||||||||||||||||
| comprehensive income (loss), net of tax | - | - | - | (925,782 | ) | (925,782 | ) | |||||||||
| Balance, December 31, 2001 | 3,218,714 | 36,407,798 | 9,915,399 | (922,094 | ) | 45,401,103 | ||||||||||
| Cash dividends declared ($0.40 per share) | - | - | (1,256,592 | ) | - | (1,256,592 | ) | |||||||||
| Repurchase and retirement of common | ||||||||||||||||
| stock | (85,500 | ) | (1,314,250 | ) | - | - | (1,314,250 | ) | ||||||||
| Exercise of stock options | 333 | 4,225 | - | - | 4,225 | |||||||||||
| Net earnings | - | - | 3,435,556 | - | 3,435,556 | |||||||||||
| Change in accumulated other | ||||||||||||||||
| comprehensive income (loss), net of tax | - | - | - | 2,334,691 | 2,334,691 | |||||||||||
| Balance, December 31, 2002 | 3,133,547 | 35,097,773 | 12,094,363 | 1,412,597 | 48,604,733 | |||||||||||
| Cash dividends declared ($0.40 per share) | - | - | (1,253,430 | ) | - | (1,253,430 | ) | |||||||||
| Exercise of stock options | 1,655 | 23,737 | - | - | 23,737 | |||||||||||
| Net earnings | - | - | 2,003,591 | - | 2,003,591 | |||||||||||
| Change in accumulated other | ||||||||||||||||
| comprehensive income (loss), net of tax | - | - | - | (824,735 | ) | (824,735 | ) | |||||||||
| Balance, December 31, 2003 | 3,135,202 | $ | 35,121,510 | 12,844,524 | 587,862 | 48,553,896 | ||||||||||
See accompanying notes to consolidated financial statements.
| A-28 | ||
PEOPLES BANCORP OF NORTH CAROLINA, INC.
Consolidated Statements of Comprehensive Income
For the Years Ended December 31, 2003, 2002 and 2001
| 2003 | 2002 | 2001 | |
| Net earnings | $2,003,591 | 3,435,556 | 4,575,352 |
| Other comprehensive income: | |||
| Unrealized holding gains (losses) on securities available for sale | (419,147) | 2,951,843 | 97,560 |
| Reclassification adjustment for (gains) losses on | |||
| sales of securities available for sale included in net earnings | 52,855 | (625,616) | (1,613,992) |
| Unrealized holding gains (losses) on derivative financial | |||
| instruments qualifying as cash flow hedges | (284,000) | 1,498,000 | - |
| Reclassification adjustment for gains on derivative financial | |||
| instruments qualifying as cash flow hedges included in net earnings | (700,626) | - | - |
| Total other comprehensive income (loss), | |||
| before income taxes | (1,350,918) | 3,824,227 | (1,516,432) |
| Income tax expense (benefit) related to other comprehensive income: | |||
| Unrealized holding gains (losses) on securities available for sale | (163,258) | 1,149,742 | 38,000 |
| Reclassification adjustment for (gains) losses on | |||
| sales of securities available for sale included in net earnings | 20,587 | (243,677) | (628,650) |
| Unrealized holding gains (losses) on derivative financial instruments | |||
| qualifying as cash flow hedges | (110,618) | 583,471 | - |
| Reclassification adjustment for gains on derivative financial | |||
| instruments qualifying as cash flow hedges included in net earnings | (272,894) | - | - |
| Total income tax expense (benefit) related to | |||
| other comprehensive income | (526,183) | 1,489,536 | (590,650) |
| Total other comprehensive income (loss), | |||
| net of tax | (824,735) | 2,334,691 | (925,782) |
| Total comprehensive income | $1,178,856 | 5,770,247 | 3,649,570 |
See accompanying notes to consolidated financial statements.
| A-29 | ||
PEOPLES BANCORP OF NORTH CAROLINA, INC.
Consolidated Statements of Cash Flows
For the Years Ended December 31, 2003, 2002 and 2001
| 2003 | 2002 | 2001 | |
| Cash flows from operating activities: | |||
| Net earnings | $ 2,003,591 | 3,435,556 | 4,575,352 |
| Adjustments to reconcile net earnings to net | |||
| cash provided by operating activities: | |||
| Depreciation, amortization and accretion | 1,963,995 | 1,685,715 | 1,584,437 |
| Provision for loan losses | 6,743,900 | 5,431,600 | 3,545,322 |
| Deferred income tax benefit | (1,526,062) | (318,921) | (532,329) |
| Loss (gain) on sale of investment securities | 52,855 | (625,616) | (1,613,992) |
| Recognition of deferred gain on sale of derivative instruments | (700,626) | - | - |
| Gain on sale of loans | (478,759) | - | - |
| Loss (gain) on sale of other real estate and repossessions | 262,840 | (19,981) | 51,840 |
| Writedown of other real estate and repossessions | 483,703 | - | - |
| Change in: | |||
| Cash surrender value of life insurance | (216,741) | (245,708) | - |
| Other assets | 377,900 | (595,240) | 1,017,755 |
| Other liabilities | (4,582) | 178,282 | (1,384,145) |
| Mortgage loans held for sale | 4,477,140 | 274,296 | (3,775,231) |
| Net cash provided by operating activities | 13,439,154 | 9,199,983 | 3,469,009 |
| Cash flows from investing activities: | |||
| Purchase of investment securities available for sale | (55,439,455) | (48,339,951) | (118,372,897) |
| Proceeds from calls and maturities of investment securities | |||
| available for sale | 27,158,675 | 28,609,785 | 22,714,408 |
| Proceeds from sales of investment securities available for sale | 19,896,324 | 35,191,263 | 82,969,419 |
| Investment in unconsolidated subsidiary | - | - | (433,000) |
| Change in other investments | 28,600 | 257,200 | (2,203,900) |
| Purchase of cash surrender value of life insurance | - | - | (4,583,000) |
| Net change in loans | (31,533,937) | (42,113,346) | (82,092,812) |
| Proceeds from sale of loans | 4,207,206 | - | - |
| Purchases of premises and equipment | (1,913,876) | (2,614,380) | (3,652,961) |
| Proceeds from sale of premises and equipment | - | 412,289 | 645,429 |
| Proceeds from sale of derivative financial instruments | 1,254,000 | - | - |
| Construction in progress | - | - | (100,633) |
| Proceeds from sale of other real estate and repossessions | 1,502,891 | 488,647 | 60,310 |
| Net cash used by investing activities | (34,839,572) | (28,108,493) | (105,049,637) |
| Cash flows from financing activities: | |||
| Net change in deposits | 34,063,277 | 25,515,766 | 40,149,847 |
| Net change in demand notes payable to U. S. Treasury | (1,156,616) | 1,482,013 | (1,482,013) |
| Proceeds from FHLB borrowings | 46,650,000 | 68,100,000 | 51,000,000 |
| Repayments of FHLB advances | (51,721,429) | (73,242,857) | (4,142,856) |
| Proceeds from issuance of junior subordinated debentures | - | - | 14,433,000 |
| Transaction costs associated with junior subordinated debentures | - | (105,450) | (425,741) |
| Cash dividends | (1,253,430) | (1,256,592) | (1,287,486) |
| Proceeds from exercise of stock options | 23,737 | 4,225 | - |
| Common stock repurchased | - | (1,314,250) | - |
| Net cash provided by financing activities | 26,605,539 | 19,182,855 | 98,244,751 |
| Net change in cash and cash equivalents | 5,205,121 | 274,345 | (3,335,877) |
| Cash and cash equivalents at beginning of year | 15,577,665 | 15,303,320 | 18,639,197 |
| Cash and cash equivalents at end of year | $20,782,786 | 15,577,665 | 15,303,320 |
| A-30 | ||
PEOPLES BANCORP OF NORTH CAROLINA, INC.
Consolidated Statements of Cash Flows, continued
For the Years Ended December 31, 2003, 2002 and 2001
| 2003 | 2002 | 2001 | ||||||||
| Supplemental disclosures of cash flow information: | ||||||||||
| Cash paid during the year for: | ||||||||||
| Interest | $ | 12,975,587 | 16,006,155 | 23,068,630 | ||||||
| Income taxes | $ | 2,093,000 | 2,235,500 | 3,209,000 | ||||||
| Noncash investing and financing activities: | ||||||||||
| Change in unrealized gain/loss on securities available for sale, net | $ | (223,621 | ) | 2,334,691 | (925,782 | ) | ||||
| Change in unrealized gain/loss on derivative financial instruments, net | $ | (173,382 | ) | - | ||||||
| Transfer of loans to other real estate and repossessions | $ | 3,382,633 | 2,077,057 | 256,439 | ||||||
| Financed sales of other real estate | $ | 1,258,500 | - | - | ||||||
| Financed sales of premises and equipment | $ | 3,729,932 | - | |||||||
See accompanying notes to consolidated financial statements.
| A-31 | ||
PEOPLES BANCORP OF NORTH CAROLINA, INC.
Notes to Consolidated Financial Statements
(1) Summary of Significant Accounting Policies
Organization
Peoples Bancorp of North Carolina, Inc. (“Bancorp”) received regulatory approval to operate as a bank holding company on July 22, 1999, and became effective August 31, 1999. Bancorp is primarily regulated by the Federal Reserve Bank, and serves as the one-bank holding company for Peoples Bank.
Peoples Bank (the “Bank”) commenced business in 1912 upon receipt of its banking charter from the North Carolina State Banking Commission (the “SBC”). The Bank is primarily regulated by the SBC and the Federal Deposit Insurance Corporation and undergoes periodic examinations by these regulatory agencies. The Bank, whose main office is in Newton, North Carolina, provides a full range of commercial and consumer banking services primarily in Catawba, Alexander, Lincoln and Iredell counties in North Carolina.
Peoples Investment Services, Inc. is a wholly owned subsidiary of the Bank and began operations in 1996 to provide investment and trust services through agreements with an outside party.
Real Estate Advisory Services, Inc. is a wholly owned subsidiary of the Bank and began operations in 1997 to provide real estate appraisal and property management services to individuals and commercial customers of the Bank.
Principles of Consolidation
The consolidated financial statements include the financial statements of Bancorp and its wholly owned subsidiary, the Bank, along with its wholly owned subsidiaries, Peoples Investment Services, Inc. and Real Estate Advisory Services, Inc. (collectively called the “Company”). All significant intercompany balances and transactions have been eliminated in consolidation.
Basis of Presentation
The accounting principles followed by the Company, and the methods of applying these principles, conform with accounting principles generally accepted in the United States of America (“GAAP”) and with general practices in the banking industry. In preparing the financial statements in conformity with GAAP, management is required to make estimates and assumptions that affect the reported amounts in the financial statements. Actual results could differ significantly from these estimates. Material estimates common to the banking industry that are particularly susceptible to significant change in the near term include, but are not limited to, the determination of the allowance for loan losses and valuation of real estate acquired in connection with or in lieu of foreclosure on loans.
Reclassifications
Reclassifications of certain amounts in the 2002 and 2001 consolidated financial statements have been made to conform with the financial statement presentation for 2003.
Cash and Cash Equivalents
Cash and due from banks and federal funds sold are considered cash and cash equivalents for cash flow reporting purposes. Generally, federal funds are sold for one-day periods.
Investment Securities
The Company classifies its securities in one of three categories: trading, available for sale, or held to maturity. Trading securities are bought and held principally for sale in the near term. Held to maturity securities are those securities for which the Company has the ability and intent to hold until maturity. All other securities not included in trading or held to maturity are classified as available for sale. At December 31, 2003 and 2002, the Company had classified all of its investment securities as available for sale.
Available for sale securities are recorded at fair value. Unrealized holding gains and losses, net of the related tax effect, are excluded from earnings and are reported as a separate component of shareholders’ equity until realized.
A decline in the market value of any available for sale investment below cost that is deemed other than temporary is charged to earnings and establishes a new cost basis for the security.
| A-32 | ||
PEOPLES BANCORP OF NORTH CAROLINA, INC.
Notes to Consolidated Financial Statements, continued
(1) Summary of Significant Accounting Policies, continued
Investment Securities, continued
Premiums and discounts are amortized or accreted over the life of the related security as an adjustment to the yield. Realized gains and losses for securities classified as available for sale are included in earnings and are derived using the specific identification method for determining the cost of securities sold.
Other Investments
Other investments include equity securities with no readily determinable fair value. These investments are carried at cost.
Mortgage Loans Held for Sale
Mortgage loans held for sale are carried at the lower of aggregate cost or market value. At December 31, 2003 and 2002, the cost of mortgage loans held for sale approximates the market value.
Loans
Loans that management has the intent and ability to hold for the foreseeable future or until maturity are reported at the principal amount outstanding, net of the allowance for loan losses. Interest on loans is calculated by using the simple interest method on daily balances of the principal amount outstanding.
Impaired loans are measured based on the present value of expected future cash flows, discounted at the loan’s effective interest rate, or at the loan’s observable market price, or the fair value of the collateral if the loan is collateral dependent. A loan is impaired when, based on current information and events, it is probable that all amounts due according to the contractual terms of the loan will not be collected.
Accrual of interest is discontinued on a loan when management believes, after considering economic conditions and collection efforts, that the borrower’s financial condition is such that collection of interest is doubtful. Interest previously accrued but not collected is reversed against current period earnings and interest is recognized on a cash basis when such loans are placed on nonaccrual status.
Allowance for Loan Losses
The allowance for loan losses is established through a provision for loan losses charged to earnings. Loans are charged against the allowance for loan losses when management believes that the collectibility of the principal is unlikely. The allowance represents an amount, which, in management’s judgment, will be adequate to absorb probable losses on existing loans that may become uncollectible.
Management’s judgment in determining the adequacy of the allowance is based on evaluations of the collectibility of loans. These evaluations take into consideration such factors as changes in the nature and volume of the loan portfolio, current economic conditions that may affect the borrower’s ability to pay, overall portfolio quality, and review of specific problem loans. In determining the adequacy of the allowance for loan losses, management uses a loan grading system that rates individual loans into nine risk classifications. These risk categories are assigned allocations of loss based on management’s estimate of potential loss which is generally based on an analysis of historical loss experience, current economic conditions, performance trends, and discounted collateral deficiencies. The combination of these results is compared monthly to the recorded allowance for loan losses and material differences are adjusted by increasing or decreasing the provision for loan losses. Management uses an independent external loan reviewer to challenge and corroborate the loan grading system and provide additional analysis in determining the adequacy of the allowance for loan losses and the future provisions for estimated losses.
While management uses available information to recognize losses on loans, future additions to the allowance may be necessary based on changes in economic conditions. In addition, various regulatory agencies, as an integral part of their examination process, periodically review the Bank’s allowance for loan losses. Such agencies may require the Bank to recognize additions to the allowance based on judgments different than those of management.
| A-33 | ||
PEOPLES BANCORP OF NORTH CAROLINA, INC.
Notes to Consolidated Financial Statements, continued
(1) Summary of Significant Accounting Policies, continued
Mortgage Banking Activities
Mortgage banking income represents net gains from the sale of mortgage loans and fees received from borrowers and loan investors related to the Company’s origination of single-family residential mortgage loans.
Mortgage servicing rights represent the unamortized cost of purchased and originated contractual rights to service mortgages for others in exchange for a servicing fee. Mortgage servicing rights are amortized over the period of estimated net servicing income and are periodically adjusted for actual prepayments of the underlying mortgage loans. The Company recognized new servicing assets of approximately $37,600 and $61,000 during 2002 and 2001, respectively, and amortized approximately $338,000, $310,000 and $196,000 during 2003, 2002 and 2001, respectively. No new servicing assets were recognized during 2003.
Mortgage loans serviced for others are not included in the accompanying balance sheets. The unpaid principal balances of mortgage
loans serviced for others was approximately $29,714,000, $56,702,000 and $79,128,000 at December 31, 2003, 2002 and 2001, respectively.
Premises and Equipment
Premises and equipment are stated at cost less accumulated depreciation. Depreciation is computed primarily using the straight-line method over the estimated useful lives of the assets. When assets are retired or otherwise disposed, the cost and related accumulated depreciation are removed from the accounts, and any gain or loss is reflected in earnings for the period. The cost of maintenance and repairs which do not improve or extend the useful life of the respective asset is charged to earnings as incurred, whereas significant renewals and improvements are capitalized. The range of estimated useful lives for premises and equipment are generally as follows:
Buildings and improvements 10 - 50 years
Furniture and equipment 3 - 10 years
Foreclosed Assets
Foreclosed assets include all assets received in full or partial satisfaction of a loan and include real and personal property. Foreclosed assets are reported at the lower of carrying amount or net realizable value, and are included in other assets on the balance sheet.
Income Taxes
Deferred tax assets and liabilities are recognized for the future tax consequences attributable to differences between the financial statement carrying amounts of existing assets and liabilities and their respective tax bases. Additionally, the recognition of future tax benefits, such as net operating loss carryforwards, is required to the extent that realization of such benefits is more likely than not. Deferred tax assets and liabilities are measured using enacted tax rates expected to apply to taxable income in the years in which the assets and liabilities are expected to be recovered or settled. The effect on deferred tax assets and liabilities of a change in tax rates is recognized in income tax expense in the period that includes the enactment date.
In the event the future tax consequences of differences between the financial reporting bases and the tax bases of the Company’s assets and liabilities results in deferred tax assets, an evaluation of the probability of being able to realize the future benefits indicated by such asset is required. A valuation allowance is provided for the portion of the deferred tax asset when it is more likely than not that some portion or all of the deferred tax asset will not be realized. In assessing the realizability of the deferred tax assets, management considers the scheduled reversals of deferred tax liabilities, projected future taxable income, and tax planning strategies.
| A-34 | ||
PEOPLES BANCORP OF NORTH CAROLINA, INC.
Notes to Consolidated Financial Statements, continued
(1) Summary of Significant Accounting Policies, continued
Derivative Financial Instruments and Hedging Activities
In the normal course of business, the Company enters into derivative contracts to manage interest rate risk by modifying the characteristics of the related balance sheet instruments in order to reduce the adverse effect of changes in interest rates. All derivative financial instruments are recorded at fair value in the financial statements.
On the date a derivative contract is entered into, the Company designates the derivative as a fair value hedge, a cash flow hedge, or a trading instrument. Changes in the fair value of instruments used as fair value hedges are accounted for in the earnings of the period simultaneous with accounting for the fair value change of the item being hedged. Changes in the fair value of the effective portion of cash flow hedges are accounted for in other comprehensive income rather than earnings. Changes in fair value of instruments that are not intended as a hedge are accounted for in the earnings of the period of the change.
If a derivative instrument designated as a fair value hedge is terminated or the hedge designation removed, the difference between a hedged item’s then carrying amount and its face amount is recognized into income over the original hedge period. Likewise, if a derivative instrument designated as a cashflow hedge is terminated or the hedge designation removed, related amounts accumulated in other accumulated comprehensive income are reclassified into earnings over the original hedge period during which the hedged item affects income.
The Company formally documents all hedging relationships, including an assessment that the derivative instruments are expected to be highly effective in offsetting the changes in fair values or cash flows of the hedged items.
Advertising Costs
The costs of advertising are expensed as incurred.
Accumulated Other Comprehensive Income
At December 31, 2003, accumulated other comprehensive income consisted of net unrealized gains on securities available for sale of $274,447, net unrealized losses on derivatives of $24,420 and net deferred gains on the sale of derivative financial instruments of $337,835. At December 31, 2002, accumulated other comprehensive income (loss) consisted of net unrealized gains on securities available for sale of $498,068 and net gains on derivatives of $914,529.
Stock-Based Compensation
The Company’s stock-based compensation plan is accounted for under Accounting Principles Board Opinion No. 25 and related interpretations. No compensation expense has been recognized related to the grant of the incentive stock options. Had compensation cost been determined based upon the fair value of the options at the grant dates, the Company’s net earnings and net earnings per share would have been reduced to the proforma amounts indicated below. For disclosure purposes, the Company immediately recognized the expense associated with the option grants assuming that all awards vest upon grant. No stock options were granted or forfeited during 2003.
| 2002 | 2001 | ||||
| Net earnings | As reported | $ | 3,435,556 | 4,575,352 | |
| Effect of grants, net of tax | (276,415) | (400,453) | |||
| Effect of forfeitures, net of tax | 42,982 | - | |||
| Proforma | $ | 3,202,123 | 4,174,899 | ||
| Basic earnings per share | As reported | $ | 1.09 | 1.42 | |
| Proforma | $ | 1.02 | 1.30 | ||
| Diluted earnings per share | As reported | $ | 1.09 | 1.42 | |
| Proforma | $ | 1.01 | 1.29 | ||
The weighted average fair value of options at grant date in 2002 and 2001 was $6.60 and $10.40, respectively. The fair value of each option is estimated on the date of grant using the Black-Scholes options-pricing model with the following weighted average assumptions used for grants in 2002 and 2001, respectively - dividend yield of 2.8% and 2.8%, respectively; risk free interest rate of 4% and 5%, respectively; expected volatility of 0.53 and 0.90, respectively; and an expected life of 10 years.
| A-35 | ||
PEOPLES BANCORP OF NORTH CAROLINA, INC.
Notes to Consolidated Financial Statements, continued
(1) Summary of Significant Accounting Policies, continued
Net Earnings Per Share
Net earnings per share is based on the weighted average number of common shares outstanding during the period while the effects of potential common shares outstanding during the period are included in diluted earnings per share. The average market price during the year is used to compute equivalent shares. For the years ended December 31, 2002 and 2001, net earnings per share equaled diluted earnings per share, as the potential common shares outstanding during the period had no effect on the computation.
The reconciliations of the amounts used in the computation of both “basic earnings per share” and “diluted earnings per share” for the years ended December 31, 2003, 2002 and 2001 are as follows:
| Net | Common | Per Share | ||||||||
Earnings | Shares | Amount | ||||||||
For the year ended December 31, 2003 | ||||||||||
| Basic earnings per share | $ | 2,003,591 | 3,133,687 | $ | 0.64 | |||||
| Effect of dilutive securities: | ||||||||||
| Stock options | - | 27,099 | - | |||||||
| Diluted earnings per share | $ | 2,003,591 | 3,160,786 | $ | 0.63 | |||||
For the year ended December 31, 2002 | ||||||||||
| Basic earnings per share | $ | 3,435,556 | 3,151,975 | $ | 1.09 | |||||
| Effect of dilutive securities: | ||||||||||
| Stock options | - | 7,292 | - | |||||||
| Diluted earnings per share | $ | 3,435,556 | 3,159,267 | $ | 1.09 | |||||
For the year ended December 31, 2001 | ||||||||||
| Basic earnings per share | $ | 4,575,352 | 3,218,714 | $ | 1.42 | |||||
| Effect of dilutive securities: | ||||||||||
| Stock options | - | 10,215 | - | �� | ||||||
| Diluted earnings per share | $ | 4,575,352 | 3,228,929 | $ | 1.42 | |||||
At December 31, 2002 and 2001, a total of 84,578 and 85,614, potential common shares related to stock options were not included in the computation of diluted earnings per share because they would have been antidulutive.
Recent Accounting Pronouncements
In January 2003, the Financial Accounting Standards Board (“FASB”) issued FASB Interpretation No. 46, “Consolidation of Variable Interest Entities – An Interpretation of ARB No. 51” (“FIN 46”). In December 2003, the FASB issued a revised version of FIN 46 to resolve certain questions and confusion related to the application of the original FIN 46. The Company adopted FIN 46 (Revised) as of December 31, 2003, and as a result, the Company’s wholly owned subsidiary, PEBK Capital Trust I, is no longer included in these consolidated financial statements. The consolidated financial statements have been restated for all periods presented to reflect this change in accounting, and the adoption of FIN 46 (Revised) had no impact on the Company’s reported results of operations or stockholders’ equity.
| A-36 | ||
PEOPLES BANCORP OF NORTH CAROLINA, INC.
Notes to Consolidated Financial Statements, continued
(1) Summary of Significant Accounting Policies, continued
Recent Accounting Pronouncements, continued
In January 2004, the FASB issued as tentative guidance, Derivatives Implementation Group (“DIG”) Issue G25, “Cash Flow Hedges: Hedging the Variable Interest Payments on a Group of Prime-Rate-Based Interest-Bearing Loans.” This issue provides guidance for entities wishing to hedge the variability in loan interest receipts that are tied to the prime rate and other issues associated with cash flow hedges. Comments on this proposed DIG Issue are due February 25, 2004. This guidance, which is subject to revision, is intended to become effective on the first day of the first quarter after final issuance of the guidance. The Company cannot estimate when that date may occur. However, if the guidance is ultimately adopted in a manner similar to its current drafting, the Company will have to “de-designate” the interest rate swaps hedging certain prime-rate-based loans discussed in note 11 to the consolidated financial statements. If this were to happen, management has not concluded whether they will leave the swaps in place and record changes in value as a component of current earnings, terminate the swaps, or take some other action in response. Accordingly, management cannot determine the effect, if any, of this tentative guidance on its future results of operations or stockholders’ equity.
(2) Investment Securities
Investment securities available for sale at December 31, 2003 and 2002 are as follows:
December 31, 2003 | |||||||||||||
Gross | Gross | Estimated | |||||||||||
Amortized |
| Unrealized | Unrealized | Fair | |||||||||
Cost | Gains | Losses | Value | ||||||||||
| Mortgage-backed securities | $ | 24,911,000 | 96,142 | 87,282 | 24,919,860 | ||||||||
| U.S. government agencies | 34,545,774 | 107,847 | 136,375 | 34,517,246 | |||||||||
| State and political subdivisions | 14,454,137 | 559,907 | 64,137 | 14,949,907 | |||||||||
| Trust preferred securities | 5,000,000 | - | - | 5,000,000 | |||||||||
| Equity securities | 99,995 | - | 26,556 | 73,439 | |||||||||
| Total | $ | 79,010,906 | 763,896 | 314,350 | 79,460,452 | ||||||||
December 31, 2002 | |||||||||||||
Gross |
|
| Gross |
|
| Estimated | |||||||
Amortized | Unrealized |
|
| Unrealized |
|
| Fair |
| |||||
Cost | Gains |
|
| Losses |
|
| Value | ||||||
| Mortgage-backed securities | $ | 52,033,373 | 352,915 | - | 52,386,288 | ||||||||
| State and political subdivisions | 13,886,496 | 468,367 | 5,446 | 14,349,417 | |||||||||
| Trust preferred securities | 5,000,000 | - | - | 5,000,000 | |||||||||
| Total | $ | 70,919,869 | 821,282 | 5,446 | 71,735,705 | ||||||||
The current fair value and associated unrealized losses on investments in debt securities with unrealized losses at December 31, 2003 are summarized in the table below, with the length of time the individual securities have been in a continuous loss position. Unrealized losses on equity securities at December 31, 2003 are not considered material.
Less than 12 Months | 12 Months or More | Total | |||||||||||||||||
Fair |
|
| Unrealized |
|
| Fair |
|
| Unrealized |
|
| Fair |
|
| Unrealized | ||||
Value |
|
| Losses |
|
| Value |
|
| Losses |
|
| Value |
|
| Losses | ||||
| Mortgage-backed securities | $ | 11,510,389 | 87,282 | - | - | 11,510,389 | 87,282 | ||||||||||||
| U. S. government agencies | 7,911,840 | 136,375 | - | - | 7,911,840 | 136,375 | |||||||||||||
| State and political subdivisions | 2,267,965 | 64,137 | - | - | 2,267,965 | 64,137 | |||||||||||||
$ | 21,690,194 | 287,794 | - | - | 21,690,194 | 287,794 | |||||||||||||
| A-37 | ||
PEOPLES BANCORP OF NORTH CAROLINA, INC.
Notes to Consolidated Financial Statements, continued
(2) Investment Securities, continued
At December 31, 2003, unrealized losses in the investment securities portfolio related to debt securities totaled $287,794. The unrealized losses on these debt securities arose due to changing interest rates and are considered to be temporary. From the December 31, 2003 tables above, 5 out of 54 securities issued by state and political subdivisions contained unrealized losses and 17 out of 33 securities issued by U.S. government agencies and government sponsored corporations, including mortgage-backed securities, contained unrealized losses. These unrealized losses are considered temporary because of acceptable investment grades on each security and the repayment sources of principal and interest are government backed.
The amortized cost and estimated fair value of investment securities available for sale at December 31, 2003, by contractual maturity, are shown below. Expected maturities of mortgage-backed securities will differ from contractual maturities because borrowers have the right to call or prepay obligations with or without call or prepayment penalties.
| Amortized | Estimated | |||
| Cost | Fair Value | |||
| Due within one year | $ | 1,300,970 | 1,320,167 | |
| Due from one to five years | 14,639,241 | 14,925,512 | ||
| Due from five to ten years | 28,920,000 | 28,895,514 | ||
| Due after ten years | 9,139,700 | 9,325,960 | ||
| Mortgage-backed securities | 24,911,000 | 24,919,860 | ||
| Equity securities | 99,995 | 73,439 | ||
| $ | 79,010,906 | 79,460,452 | ||
Proceeds from sales of securities available for sale during 2003, 2002 and 2001 were $19,896,324, $35,191,263 and $82,969,419, respectively. Gross gains of $625,616 and $1,626,583 for 2002 and 2001, respectively, along with gross losses of $52,855 and $12,591 for 2003 and 2001, respectively, were realized on those sales.
Securities with a carrying value of approximately $20,140,000 and $30,195,000 at December 31, 2003 and 2002, respectively, were pledged to secure public deposits and for other purposes as required by law.
(3) Loans
Major classifications of loans at December 31, 2003 and 2002 are summarized as follows:
| 2003 | 2002 | ||
| Commercial | $ | 90,557,643 | 92,141,135 |
| Real estate - mortgage | 332,729,979 | 322,986,811 | |
| Real estate - construction | 110,392,005 | 80,552,263 | |
| Consumer | 18,446,562 | 30,689,537 | |
| Total loans | 552,126,189 | 526,369,746 | |
| Less allowance for loan losses | 9,722,267 | 7,247,906 | |
| Total net loans | $ | 542,403,922 | 519,121,840 |
The Company grants loans and extensions of credit primarily within the Catawba Valley region of North Carolina which encompasses Catawba, Lincoln and Alexander Counties and portions of Iredell County. Although the Bank has a diversified loan portfolio, a substantial portion of the loan portfolio is collateralized by improved and unimproved real estate which is dependent upon the real estate market.
| A-38 | ||
PEOPLES BANCORP OF NORTH CAROLINA, INC.
Notes to Consolidated Financial Statements, continued
(3) Loans, continued
At December 31, 2003 and 2002, the recorded investment in loans that were considered to be impaired was approximately $4,614,000 and $4,840,000, respectively, of which approximately $4,343,000 at December 31, 2003 and $4,602,000 at December 31, 2002 was on nonaccrual. In addition, the Company had approximately $271,000 and $239,000 in loans past due more than ninety days and still accruing interest at December 31, 2003 and 2002, respectively. The related allowance for loan losses on impaired loans was approximately $1,488,000 and $676,000 at December 31, 2003 and 2002, respectively. The average recorded investment in impaired loans for the twelve months ended December 31, 2003 and 2002 was approximately $7,746,000 and $7,220,000, respectively. For the years ended December 31, 2003, 2002 and 2001, the Company recognized approximately $82,000, $22,000 and $38,000, respectively, of in terest income on impaired loans.
Changes in the allowance for loan losses were as follows:
| 2003 | 2002 | 2001 | |||
| Balance at beginning of year | $ | 7,247,906 | 6,090,570 | 4,713,227 | |
| Amounts charged off | (4,481,548) | (4,441,007) | (2,358,320) | ||
| Recoveries on amounts previously charged off | 212,009 | 166,743 | 190,341 | ||
| Provision for loan losses | 6,743,900 | 5,431,600 | 3,545,322 | ||
| Balance at end of year | $ | 9,722,267 | 7,247,906 | 6,090,570 | |
Major classifications of premises and equipment are summarized as follows:
| 2003 | 2002 | |||
| Land | $ | 1,915,954 | 2,474,452 | |
| Buildings and improvements | 9,982,688 | 11,892,203 | ||
| Furniture and equipment | 10,618,908 | 9,966,950 | ||
| 22,517,550 | 24,333,605 | |||
| Less accumulated depreciation | 9,980,320 | 8,712,628 | ||
| $ | 12,537,230 | 15,620,977 | ||
Depreciation expense was approximately $1,268,000, $1,260,000 and $1,337,000, for the years ended December 31, 2003, 2002 and 2001, respectively.
During 2003, the Company sold two branch locations with net book values of approximately $3,115,000 and is currently leasing the facilities from the buyer. As a result of the sales, the Company deferred a gain of approximately $633,000 and is recognizing the gain over the lease term. During 2003, the Company recognized approximately $18,000 of the deferred gain.
(5) Time Deposits
The aggregate amount of time deposit accounts with a minimum denomination of $100,000 was $171,596,789 and $160,836,596 at December 31, 2003 and 2002, respectively.
At December 31, 2003, the scheduled maturities of time deposits are as follows:
| 2004 | $ | 247,181,867 | |||||
| 2005 | 47,558,684 | ||||||
| 2006 | 2,138,185 | ||||||
| 2007 | 14,123,076 | ||||||
| 2008 | 7,702,051 | ||||||
| $ | 318,703,863 | ||||||
At December 31, 2003 and 2002, the Company had approximately $55,483,000 and $39,873,000,respectively, in time deposits purchased through third party brokers.
| A-39 | ||
PEOPLES BANCORP OF NORTH CAROLINA, INC.
Notes to Consolidated Financial Statements, continued
(6) Federal Home Loan Bank Advances
The Bank has advances from the Federal Home Loan Bank (“FHLB”) with monthly interest payments at various maturity dates and interest rates ranging from 1.14% to 6.49% at December 31, 2003. The FHLB advances are collateralized by a blanket assignment on all residential first mortgage loans, commercial real estate loans, home equity lines of credit and loans secured by multi-family real estate that the Bank owns. At December 31, 2003, the carrying value of loans pledged as collateral totaled approximately $163,000,000.
Advances from the FHLB outstanding at December 31, 2003 consist of the following:
| Maturity Date | Call Date | Rate | Rate Type | Amount | |||||||||
| July 5, 2005 | October 5, 2000 and every three | ||||||||||||
| months thereafter | 6.16 | % | Convertible | $ | 5,000,000 | ||||||||
| March 30, 2010 | March 30, 2001 and every three | ||||||||||||
| months thereafter | 6.02 | % | Convertible | 5,000,000 | |||||||||
| March 30, 2010 | September 30, 2000 and every three | ||||||||||||
| months thereafter | 5.88 | % | Convertible | 5,000,000 | |||||||||
| May 24, 2010 | May 24, 2001 and every three | ||||||||||||
| months thereafter | 6.49 | % | Convertible | 2,000,000 | |||||||||
| January 10, 2011 | January 10, 2002 and every three | ||||||||||||
| months thereafter | 4.20 | % | Convertible | 5,000,000 | |||||||||
| May 2, 2011 | May 2, 2002 and every three | ||||||||||||
| months thereafter | 4.055 | % | Convertible | 30,000,000 | |||||||||
| January 26, 2004 | N/A | 1.14 | % | Adjustable | 6,000,000 | ||||||||
$ | 58,000,000 | ||||||||||||
The FHLB has the option to convert $52,000,000 of the total advances outstanding into three month LIBOR-based floating rate advances. If the FHLB elects to convert the advances, the Bank may terminate the transaction without payment of a prepayment fee.
The Bank is required to purchase and hold certain amounts of FHLB stock in order to obtain FHLB borrowings. No ready market exists for the FHLB stock, and it has no quoted market value. The stock is redeemable at $100 per share subject to certain limitations set by the FHLB. At December 31, 2003 and 2002 the Bank owned FHLB stock amounting to $3,125,000 and $3,153,600, respectively.
(7) Junior Subordinated Debentures
In December 2001 the Company formed a wholly owned Delaware statutory trust, PEBK Capital Trust I (“PEBK Trust”), which issued $14 million of guaranteed preferred beneficial interests in the Company’s junior subordinated deferrable interest debentures that qualify as Tier I capital under Federal Reserve Board guidelines. All of the common securities of PEBK Trust are owned by the Company. The proceeds from the issuance of the common securities and the trust preferred securities were used by PEBK Trust to purchase $14.4 million of junior subordinated debentures of the Company, which pay interest at a floating rate equal to prime plus 50 basis points. The proceeds received by the Company from the sale of the junior subordinated debentures were used for general purposes, primarily to provide capital to the Bank. The debentures represent the sole asset of PEBK Trust. As discussed in note 1, PEBK Trust was deconsolidated by the Company under FIN 46.
The trust preferred securities accrue and pay quarterly distributions based on the liquidation value of $50,000 per capital security at a floating rate of prime plus 50 basis points. The Company has guaranteed distributions and other payments due on the trust preferred securities to the extent PEBK Trust has funds with which to make the distributions and other payments. The net combined effect of all the documents entered into in connection with the trust preferred securities is that the Company is liable to make the distributions and other payments required on the trust preferred securities.
| A-40 | ||
PEOPLES BANCORP OF NORTH CAROLINA, INC.
Notes to Consolidated Financial Statements, continued
(7) Junior Subordinated Debentures, continued
The trust preferred securities are mandatorily redeemable upon maturity of the debentures on December 31, 2031, or upon earlier redemption as provided in the indenture. The Company has the right to redeem the debentures purchased by PEBK Trust, in whole or in part, on or after December 31, 2006. As specified in the indenture, if the debentures are redeemed prior to maturity, the redemption price will be the principal amount and any accrued but unpaid interest.
(8) Income Taxes
The provision for income taxes is summarized as follows:
| 2003 | 2002 | 2001 | ||
| Current | $ | 2,581,600 | 2,030,921 | 2,793,871 |
| Deferred | (1,526,062) | (318,921) | (532,329) | |
| $ | 1,055,538 | 1,712,000 | 2,261,542 | |
The differences between the provision for income taxes and the amount computed by applying the statutory federal income tax rate to earnings before income taxes are as follows:
| 2003 | 2002 | 2001 | ||
| Pre-tax income at statutory rates (34%) | $ | 1,040,104 | 1,750,169 | 2,324,544 |
| Differences: | ||||
| Tax exempt interest income | (216,431) | (231,395) | (331,035) | |
| Nondeductible interest and other expense | 18,668 | 24,088 | 56,330 | |
| Cash surrender value of life insurance | (73,692) | (83,541) | - | |
| State taxes, net of federal benefit | 270,493 | 230,088 | 228,147 | |
| Other, net | 16,396 | 22,591 | (16,444) | |
| $ | 1,055,538 | 1,712,000 | 2,261,542 | |
The following summarizes the tax effects of temporary differences that give rise to significant portions of the deferred tax assets and deferred tax liabilities. The net deferred tax asset is included as a component of other assets at December 31, 2003 and 2002.
| 2003 | 2002 | ||
| Deferred tax assets: | |||
| Allowance for loan losses | $ | 3,566,467 | 2,468,399 |
| Amortizable intangible assets | 209,849 | 247,405 | |
| Accrued retirement expense | 332,575 | 214,038 | |
| Income from non-accrual loans | 23,309 | 4,880 | |
| Deferred gain on sale of cash flow hedges | 217,284 | - | |
| Unrealized loss on cash flow hedges | 15,580 | - | |
| Other | 25,047 | 19,040 | |
| Total gross deferred tax assets | 4,390,111 | 2,953,762 | |
| Deferred tax liabilities: | |||
| Unrealized gains on available for sale securities | 175,098 | 317,769 | |
| Unrealized gains on sale of cash flow hedges | 215,540 | 583,471 | |
| Deferred loan fees | 1,103,661 | 1,178,321 | |
| Premises and equipment | 421,316 | 321,637 | |
| Deferred income from servicing rights | 142,848 | 273,160 | |
| Total gross deferred tax liabilities | 2,058,463 | 2,674,358 | |
| Net deferred tax asset | $ | 2,331,648 | 279,404 |
| A-41 | ||
PEOPLES BANCORP OF NORTH CAROLINA, INC.
Notes to Consolidated Financial Statements, continued
(9) Related Party Transactions
The Company conducts transactions with its directors and executive officers, including companies in which they have beneficial interests, in the normal course of business. It is the policy of the Company that loan transactions with directors and officers be made on substantially the same terms as those prevailing at the time made for comparable loans to other persons. The following is a summary of activity for related party loans for 2003:
| Beginning balance | $ | 9,272,000 | ||
| New loans | 2,418,000 | |||
| Repayments | (4,268,000) | |||
| Ending balance | $ | 7,422,000 | ||
At December 31, 2003, the Company had approximately $3,672,000 in potential problem loans to related parties, with an allowance for loan losses of approximately $918,000.
During 2003, an individual formerly considered a related party resigned as a director of the Company and as a result approximately $3,140,000 in loans to this individual and his affiliates have been removed from the beginning balance of the summary of related party loan activity. At December 31, 2003 and 2002, approximately $1,561,000 and $2,289,000 in loans to this individual were considered to be potential problem loans.
At December 31, 2003 and 2002, the Company had deposit relationships with related parties of approximately $10,170,000 and $10,041,000, respectively.
The Company also enters into contracts from time to time with certain directors for the construction of bank facilities. At December 31, 2003 and 2002, the Company had outstanding construction contracts with these directors amounting to approximately $30,850 and $289,000, respectively. During the year ended December 31, 2003, 2002 and 2001, total construction costs for bank facilities paid to directors were approximately $531,000, $1,545,000 and $1,435,000, respectively.
(10) Commitments
The Company leases various office space for banking and operational facilities under operating lease arrangements. Future minimum lease payments required for all operating leases having a remaining term in excess of one year at December 31, 2003 are as follows:
Year | |||||||
| 2004 | $ | 671,915 | |||||
| 2005 | 663,180 | ||||||
| 2006 | 580,746 | ||||||
| 2007 | 467,144 | ||||||
| 2008 | 269,879 | ||||||
| Thereafter | 1,953,603 | ||||||
| Total minimum obligation | $ | 4,606,467 | |||||
Total rent expense was approximately $481,000, $326,000 and $351,000, for 2003, 2002 and 2001, respectively.
The Company is a party to financial instruments with off-balance-sheet risk in the normal course of business to meet the financing needs of its customers. These financial instruments include commitments to extend credit, standby letters of credit and financial guarantees. Those instruments involve, to varying degrees, elements of credit risk in excess of the amount recognized in the balance sheet. The contract amounts of those instruments reflect the extent of involvement the Company has in particular classes of financial instruments.
The exposure to credit loss in the event of nonperformance by the other party to the financial instrument for commitments to extend credit and standby letters of credit and financial guarantees written is represented by the contractual amount of those instruments. The Company uses the same credit policies in making commitments and conditional obligations as it does for on-balance-sheet instruments.
| A-42 | ||
PEOPLES BANCORP OF NORTH CAROLINA, INC.
Notes to Consolidated Financial Statements, continued
(10) Commitments, continued
In most cases, the Company requires collateral or other security to support financial instruments with credit risk.
Contractual Amount
2003 2002
Financial instruments whose contract
amounts represent credit risk:
Commitments to extend credit $104,730,000 101,401,000
Standby letters of credit and
financial guarantees written $3,876,000 2,061,000
Commitments to extend credit are agreements to lend to a customer as long as there is no violation of any condition established in the contract. Commitments generally have fixed expiration dates or other termination clauses and may require payment of a fee. Since many of the commitments may expire without being drawn upon, the total commitment amounts do not necessarily represent future cash requirements. The Company evaluates each customer’s creditworthiness on a case-by-case basis. The amount of collateral obtained, if deemed necessary by the Company, upon extension of credit is based on management’s credit evaluation. Collateral held varies but may include unimproved and improved real estate, certificates of deposit, or personal property.
Standby letters of credit and financial guarantees written are conditional commitments issued by the Company to guarantee the performance of a customer to a third party. Those guarantees are primarily issued to businesses in the Company’s delineated trade area. The credit risk involved in issuing letters of credit is essentially the same as that involved in extending loan facilities to customers. The Company holds real estate, equipment, automobiles and customer deposits as collateral supporting those commitments for which collateral is deemed necessary.
In the normal course of business, the Company is a party (both as plaintiff and defendant) to a number of lawsuits. In the opinion of management and counsel, none of these cases should have a material adverse effect on the financial position of the Bank or the Company.
The Company has employment agreements with certain key employees. The agreements, among other things, include salary, bonus, incentive stock option, and change in control provisions.
The Company has $26,500,000 available for the purchase of overnight federal funds from three correspondent financial institutions.
(11) Derivatives and Hedging Transactions
The Company has an overall interest rate risk management strategy that incorporates the use of derivative instruments to minimize significant unplanned fluctuations in earnings that are caused by interest rate volatility. By using derivative instruments, the Company is exposed to credit and market risk. If the counterparty fails to perform, credit risk is equal to the extent of the fair-value gain in the derivative. The Company minimizes the credit risk in derivative instruments by entering into transactions with high-quality counterparties that are reviewed periodically by the Company.
At December 31, 2003, the Company had cash flow hedges with a notional amount of $55 million. These derivative instruments consist of two interest rate swap agreements that were used to convert $55 million of floating rate loans with rates based on prime that reprice daily to a fixed rate for a period of three years ending in April 2006 and September 2006. Interest rate swap agreements generally involve the exchange of fixed and variable rate interest payments between two parties, based on a common notional principal amount and maturity date. The terms of the swaps are determined based on management’s assessment of future interest rates and other factors. The company recorded an asset, included as a component of other assets, of $(40,000) for the fair value of these cash flow hedges resulting in an after tax decrease in other comprehensive income of $24,420. As of December 31, 2003, no ineffectiveness was recorded in earnings. All components of each derivative’s gain or loss are included in the assessment of hedge effectiveness. Gains and losses on derivative instruments reclassified from accumulated other comprehensive income to current period earnings are included in interest and fees on loans on the consolidated statement of earnings.
| A-43 | ||
PEOPLES BANCORP OF NORTH CAROLINA, INC.
Notes to Consolidated Financial Statements, continued
(11) Derivatives and Hedging Transactions, continued
At December 31, 2002, the Company had cash flow hedges with a notional amount of $60 million. These derivative instruments consisted of two interest rate swap agreements that were used to convert $60 million of floating rate loans with rates based on prime that reprice daily to a fixed rate for a period of two years ending in June 2004 and July 2004. The Company recorded an asset, included as a component of other assets, of $1,498,000 for the fair value of these cash flow hedges as of December 31, 2002, resulting in an after tax increase in other comprehensive income of $914,529. As of December 31, 2002, no ineffectiveness was recorded in earnings.
During 2003, the Company settled two previously outstanding interest rate swap agreements. The first swap, with a notional amount of $40 million and scheduled to mature in June 2004 was sold for a gain of $860,000. The second swap with a notional amount of $20 million and scheduled to mature in July 2004 was sold for a gain of $394,000. The gains realized upon settlement are being recognized over the original term of the agreements and during the year ended December 31, 2003, net gains of approximately $428,000 had been realized. The remaining net gain of approximately $338,000 is carried as a component of other comprehensive income.
(12) Employee and Director Benefit Programs
The Company has a profit sharing and 401(k) plan for the benefit of substantially all employees subject to certain minimum age and service requirements. Under this plan, the Company matches employee contributions to a maximum of five percent of annual compensation. The Company’s contribution pursuant to this formula was approximately $306,000, $339,000 and $318,000 for the years of 2003, 2002 and 2001, respectively. Investments of the plan are determined by the compensation committee consisting of selected outside directors and senior executive officers. No investments in Company stock have been made by the plan. The vesting schedule for the plan begins at 20 percent after two years of employment and graduates 20 percent each year until reaching 100 percent after six years of employment.
In December 2002, the Company initiated a postretirement benefit plan to provide retirement benefits to key officers and its Board of Directors and to provide death benefits for their designated beneficiaries. Under the plan, the Company purchased life insurance contracts on the lives of the key officers and each director. The increase in cash surrender value of the contracts, less the Company’s cost of funds, constitutes the Company’s contribution to the plan each year. Plan participants are to be paid annual benefits for a specified number of years commencing upon retirement. Expenses incurred for benefits relating to this plan were approximately $264,000 and 249,000 during 2003 and 2002, respectively. The Company incurred no expense for benefits relating to this plan during 2001.
The Company is currently paying medical benefits for certain retired employees. Postretirement benefits expense, including amortization of the transition obligation, as applicable, was approximately $16,305, $32,842 and $33,484, for the years ended December 31, 2003, 2002 and 2001, respectively. The following table sets forth the accumulated postretirement benefit obligation as of December 31, 2003 and 2002, which represents the liability for accrued postretirement benefit costs:
| 2003 | 2002 | |||||||||
| Accumulated postretirement benefit obligation | $ | 222,541 | 209,706 | |||||||
| Unrecognized transition obligation | - | |||||||||
| Unrecognized gain (loss) | (52,203) | (37,956) | ||||||||
| Net liability recognized | $ | 170,338 | 171,750 | |||||||
The Company has an Omnibus Stock Ownership and Long Term Incentive Plan (the “Plan”) whereby certain stock-based rights, such as stock options, restricted stock, performance units, stock appreciation rights, or book value shares, may be granted to eligible directors and employees. A total of 321,860 shares were reserved for possible issuance under this Plan. All rights must be granted or awarded within ten years from the effective date.
| A-44 | ||
PEOPLES BANCORP OF NORTH CAROLINA, INC.
Notes to Consolidated Financial Statements, continued
(12) Employee and Director Benefit Programs, continued
Under the Plan, the Company granted incentive stock options to certain eligible employees in order that they may purchase Company stock at a price equal to the fair market value on the date of the grant. The options granted in 1999 vest over a five-year period. Options granted subsequent to 1999 vest over a three-year period. All options expire after ten years. A summary of the activity in the Plan is presented below:
2003 | 2002 | 2001 | |||||||||||||||||
Shares | Weighted Average Option Price Per Share |
|
| Shares |
|
| Weighted Average Option Price Per Share |
|
| Shares |
|
| Weighted Average Option Price Per Share | ||||||
| Outstanding, beginning of year | 198,679 | $ | 14.58 | 139,703 | $ | 14.82 | 77,598 | $ | 14.00 | ||||||||||
| Granted during the year | - | - | 67,550 | $ | 14.10 | 62,105 | $ | 15.86 | |||||||||||
| Forfeited during the year | - | - | (8,241 | ) | $ | 14.78 | - | - | |||||||||||
| Exercised during the year | (1,655 | ) | $ | 14.34 | (333 | ) | $ | 12.69 | - | - | |||||||||
| Outstanding, end of year | 197,024 | $ | 14.59 | 198,679 | $ | 14.58 | 139,703 | $ | 14.82 | ||||||||||
| Number of shares exercisable | 128,983 | $ | 14.52 | 66,292 | $ | 14.49 | 27,709 | $ | 14.15 | ||||||||||
Options outstanding at December 31, 2003 are exercisable at option prices ranging from $12.69 to $16.36, as presented in the table above. Such options have a weighted average remaining contractual life of approximately eight years.
Under the Omnibus Stock Ownership and Long Term Incentive Plan, the Company awarded 5,365 book value shares to each of its ten directors with vesting for nine of the directors over a five year period, effective September 28, 1999, and immediate vesting for one director. Any recipient of book value shares has no rights as a shareholder with respect to the book value shares. The initial value of the book value shares awarded during 1999 was determined to be $11.45 per share. Book value shares awarded in 2001 have an initial value of $13.95. The Company recorded an expense of approximately $47,000, $83,000 and $43,000 associated with the benefits of this plan in the years ended December 31, 2003, 2002 and 2001, respectively.
(13) Regulatory Matters
The Company is subject to various regulatory capital requirements administered by the federal banking agencies. Failure to meet minimum capital requirements can initiate certain mandatory and possibly additional discretionary actions by regulators that, if undertaken, could have a direct material effect on the Company’s financial statements. Under capital adequacy guidelines and the regulatory framework for prompt corrective action, the Company must meet specific capital guidelines that involve quantitative measures of the assets, liabilities and certain off-balance-sheet items as calculated under regulatory accounting practices. The capital amounts and classification are also subject to qualitative judgments by the regulators about components, risk weightings, and other factors.
Quantitative measures established by regulation to ensure capital adequacy require the Company to maintain minimum amounts and ratios of capital in relation to both on- and off-balance sheet items at various risk weights. Total capital consists of two tiers of capital. Tier 1 Capital includes common shareholders’ equity and trust preferred securities less adjustments for intangible assets. Tier 2 Capital consists of the allowance for loan losses up to 1.25% of risk-weighted assets and other adjustments. Management believes, as of December 31, 2003, that the Company and the Bank meet all capital adequacy requirements to which they are subject.
The capital treatment of trust preferred securities is currently under review by the Federal Reserve Bank due to PEBK Trust being deconsolidated under FIN 46. Depending on the capital treatment resolution, trust preferred securities may no longer qualify as Tier 1 Capital. In July 2003, the Federal Reserve Bank issued a Supervision and Regulation letter requiring bank holding companies to continue to follow current instructions for reporting trust preferred securities in regulatory reports. Accordingly, the Company will continue to report trust preferred securities as Tier 1 Capital until further notice from the Federal Reserve Bank.
| A-45 | ||
PEOPLES BANCORP OF NORTH CAROLINA, INC.
Notes to Consolidated Financial Statements, continued
(13) Regulatory Matters, continued
As of December 31, 2003 the most recent notification from the FDIC categorized the Bank as well capitalized under the regulatory framework for prompt corrective action. To be categorized as well capitalized the Bank must maintain minimum total risk-based, Tier 1 risk-based and Tier 1 leverage ratios as set forth in the table. There are no conditions or events since that notification that management believes have changed the Bank’s category.
The Company’s and the Bank’s actual capital amounts and ratios are presented below.
| To Be Well | |||||||||||||||||||
| Capitalized Under | ||||||||||||||||||
| For Capital | Prompt Corrective | |||||||||||||||||
| Actual | Adequacy Purposes | Action Provisions | ||||||||||||||||
| Amount | Ratio | Amount | Ratio | Amount | Ratio | ||||||||||||||
(dollars inthousands) | |||||||||||||||||||
As of December 31, 2003: | |||||||||||||||||||
| Total Capital (to Risk-Weighted Assets) | |||||||||||||||||||
| Consolidated | $ | 69,294 | 11.75 | % | 47,187 | 8.00 | % | N/A | N/A | ||||||||||
| Bank | $ | 65,421 | 11.13 | % | 47,042 | 8.00 | % | 58,802 | 10.00 | % | |||||||||
| Tier 1 Capital (to Risk-Weighted Assets) | |||||||||||||||||||
| Consolidated | $ | 61,914 | 10.50 | % | 23,594 | 4.00 | % | N/A | N/A | ||||||||||
| Bank | $ | 58,041 | 9.87 | % | 23,521 | 4.00 | % | 35,282 | 6.00 | % | |||||||||
| Tier 1 Capital (to Average Assets) | |||||||||||||||||||
| Consolidated | $ | 61,914 | 9.37 | % | 26,424 | 4.00 | % | N/A | N/A | ||||||||||
| Bank | $ | 58,041 | 8.80 | % | 26,382 | 4.00 | % | 32,977 | 5.00 | % | |||||||||
As of December 31, 2002: | |||||||||||||||||||
| Total Capital (to Risk-Weighted Assets) | |||||||||||||||||||
| Consolidated | $ | 68,208 | 12.01 | % | 45,449 | 8.00 | % | N/A | N/A | ||||||||||
| Bank | $ | 66,479 | 11.73 | % | 45,337 | 8.00 | % | 56,671 | 10.00 | % | |||||||||
| Tier 1 Capital (to Risk-Weighted Assets) | |||||||||||||||||||
| Consolidated | $ | 61,122 | 10.76 | % | 22,725 | 4.00 | % | N/A | N/A | ||||||||||
| Bank | $ | 59,393 | 10.48 | % | 22,668 | 4.00 | % | 34,003 | 6.00 | % | |||||||||
| Tier 1 Capital (to Average Assets) | |||||||||||||||||||
| Consolidated | $ | 61,122 | 9.78 | % | 24,989 | 4.00 | % | N/A | N/A | ||||||||||
| Bank | $ | 59,393 | 9.52 | % | 24,943 | 4.00 | % | 31,179 | 5.00 | % | |||||||||
(14) Shareholders’ Equity
In February 2002 the Company’s Board of Directors authorized the repurchase of up to $3,000,000 in common shares of the Company’s outstanding common stock effective through the end of February 2003. During 2002, the Company repurchased a total of 85,500 shares at a total price of $1,314,250.
The Board of Directors, at its discretion, can issue shares of preferred stock up to a maximum of 5,000,000 shares. The Board is authorized to determine the number of shares, voting powers, designations, preferences, limitations and relative rights.
The Board of Directors of the Bank may declare a dividend of all of its retained earnings as it may deem appropriate, subject to the requirements of the General Statutes of North Carolina, without prior approval from the requisite regulatory authorities. As of December 31, 2003, this amount was approximately $12,849,000.
(15) Other Operating Expense
Other operating expense for the years ended December 31 included the following items that exceeded one percent of total revenues:
2003 |
|
| 2002 |
|
| 2001 | ||||
| Advertising | $ | 538,048 | 218,022 | 236,590 | ||||||
| Merchant Processing | $ | - | 77,828 | 551,513 |
| A-46 | ||
PEOPLES BANCORP OF NORTH CAROLINA, INC.
Notes to Consolidated Financial Statements, continued
(16) Fair Value of Financial Instruments
The Company is required to disclose fair value information about financial instruments, whether or not recognized on the face of the balance sheet, for which it is practicable to estimate that value. The assumptions used in the estimation of the fair value of the Company’s financial instruments are detailed below. Where quoted prices are not available, fair values are based on estimates using discounted cash flows and other valuation techniques. The use of discounted cash flows can be significantly affected by the assumptions used, including the discount rate and estimates of future cash flows. The following disclosures should not be considered a surrogate of the liquidation value of the Company, but rather a good faith estimate of the increase or decrease in value of financial instruments held by the Company since purchase, origination, or issuance.
Cash and Cash Equivalents
For cash, due from banks and federal funds sold, the carrying amount is a reasonable estimate of fair value.
Investment Securities Available for Sale
Fair values for investment securities are based on quoted market prices.
Other Investments
The carrying amount of other investments approximates fair value.
Loans and Mortgage Loans Held for Sale
The fair value of fixed rate loans is estimated by discounting the future cash flows using the current rates at which similar loans would be made to borrowers with similar credit ratings. For variable rate loans, the carrying amount is a reasonable estimate of fair value. Mortgage loans held for sale are valued based on the current price at which these loans could be sold into the secondary market.
Cash Surrender Value of Life Insurance
For cash surrender value of life insurance, the carrying value is a reasonable estimate of fair value.
Mortgage Servicing Rights
Fair value of mortgage servicing rights is determined by estimating the present value of the future net servicing income, on a disaggregated basis, using anticipated prepayment assumptions.
Derivative Instruments
For derivative instruments, fair value is estimated as the amount that the Company would receive or pay to terminate the contracts at the reporting date, taking into account the current unrealized gains or losses on open contracts.
Deposits and Demand Notes Payable
The fair value of demand deposits, interest-bearing demand deposits, savings, and demand notes payable to U.S. Treasury is the amount payable on demand at the reporting date. The fair value of fixed maturity certificates of deposit is estimated by discounting the future cash flows using the rates currently offered for deposits of similar remaining maturities.
FHLB Advances
The fair value of FHLB advances is estimated based upon discounted future cash flows using a discount rate comparable to the current market rate for such borrowings.
Junior Subordinated Debentures
Because the Company’s junior subordinated debentures were issued at a floating rate, the carrying amount is a reasonable estimate of fair value.
| A-47 | ||
PEOPLES BANCORP OF NORTH CAROLINA, INC.
Notes to Consolidated Financial Statements, continued
(16) Fair Value of Financial Instruments, continued
Commitments to Extend Credit and Standby Letters of Credit
Commitments to extend credit and standby letters of credit are generally short-term and at variable interest rates. Therefore, both
the carrying value and estimated fair value associated with these instruments are immaterial.
Limitations
Fair value estimates are made at a specific point in time, based on relevant market information and information about the financial
instrument. These estimates do not reflect any premium or discount that could result from offering for sale at one time the
Company’s entire holdings of a particular financial instrument. Because no market exists for a significant portion of the Company’s
financial instruments, fair value estimates are based on many judgments. These estimates are subjective in nature and involve
uncertainties and matters of significant judgment and therefore cannot be determined with precision. Changes in assumptions
could significantly affect the estimates.
Fair value estimates are based on existing on and off-balance sheet financial instruments without attempting to estimate the value
of anticipated future business and the value of assets and liabilities that are not considered financial instruments. Significant assets
and liabilities that are not considered financial instruments include the deferred income taxes and premises and equipment. In
addition, the tax ramifications related to the realization of the unrealized gains and losses can have a significant effect on fair value
estimates and have not been considered in the estimates.
The carrying amount and estimated fair values of the Company’s financial instruments at December 31, 2003 and 2002 are as follows:
2003 | 2002 | ||||||||||||
| Carrying | Estimated | Carrying | Estimated | ||||||||||
Amount | Fair Value | Amount | Fair Value | ||||||||||
(In thousands) | |||||||||||||
| Assets: | |||||||||||||
| Cash and cash equivalents | $ | 20,783 | 20,783 | 15,578 | 15,578 | ||||||||
| Investment securities available for sale | 79,460 | 79,460 | 71,736 | 71,736 | |||||||||
| Other investments | 4,217 | 4,217 | 4,346 | 4,346 | |||||||||
| Mortgage loans held for sale | 588 | 588 | 5,065 | 5,065 | |||||||||
| Loans, net | 542,403 | 541,770 | 519,122 | 520,601 | |||||||||
| Cash surrender value of life insurance | 5,045 | 5,045 | 4,829 | 4,829 | |||||||||
| Mortgage servicing rights | 371 | 371 | 709 | 709 | |||||||||
| Derivative instruments | (40 | ) | (40 | ) | 1,498 | 1,498 | |||||||
| Liabilities: | |||||||||||||
| Deposits and demand notes payable | 550,245 | 551,558 | 517,339 | 518,898 | |||||||||
| FHLB advances | 58,000 | 65,062 | 63,071 | 63,359 | |||||||||
| Junior subordinated debentures | 14,433 | 14,433 | 14,433 | 14,433 | |||||||||
| A-48 | ||
PEOPLES BANCORP OF NORTH CAROLINA, INC.
Notes to Consolidated Financial Statements, continued
(17) Peoples Bancorp of North Carolina, Inc. (Parent Company Only) Condensed Financial Statements
Balance Sheets
December 31, 2003 and 2002
| 2003 | 2002 | ||||||
Assets | |||||||
| Cash | $ | 689,613 | 475,820 | ||||
| Interest bearing time deposit | 2,000,000 | - | |||||
| Investment in subsidiaries | 59,115,062 | 61,310,019 | |||||
| Other investments | 788,439 | 815,000 | |||||
| Other assets | 601,425 | 589,645 | |||||
$ | 63,194,539 | 63,190,484 | |||||
Liabilities and Shareholders’ Equity | |||||||
| Accrued expenses | $ | 207,643 | 152,751 | ||||
| Junior subordinated debentures | 14,433,000 | 14,433,000 | |||||
| Shareholders’ equity | 48,553,896 | 48,604,733 | |||||
$ | 63,194,539 | 63,190,484 | |||||
Statements of Earnings
For the Years Ended December 31, 2003, 2002 and 2001
| 2003 | 2002 | 2001 | ||||||||
| Revenues: | ||||||||||
| Dividends from subsidiaries | $ | 3,948,455 | 3,526,824 | 1,462,486 | ||||||
| Interest and dividend income | 43,684 | - | - | |||||||
| Total revenues | 3,992,139 | 3,526,824 | 1,462,486 | |||||||
| Expenses: | ||||||||||
| Interest | 667,526 | 757,733 | 30,333 | |||||||
| Other operating expenses | 211,788 | 208,591 | 311,117 | |||||||
| Total expenses | 879,314 | 966,324 | 341,450 | |||||||
| Earnings before income tax benefit and equity in | ||||||||||
| undistributed earnings of subsidiaries | 3,112,825 | 2,560,500 | 1,121,036 | |||||||
| Income tax benefit | 277,200 | 320,800 | 131,900 | |||||||
| Earnings before equity in undistributed | ||||||||||
| earnings of subsidiaries | 3,390,025 | 2,881,300 | 1,252,936 | |||||||
| Equity in undistributed earnings of subsidiaries | - | 554,256 | 3,322,416 | |||||||
| Dividends paid in excess in earnings | (1,386,434 | ) | - | - | ||||||
| Net earnings | $ | 2,003,591 | 3,435,556 | 4,575,352 | ||||||
| A-49 | ||
PEOPLES BANCORP OF NORTH CAROLINA, INC.
Notes to Consolidated Financial Statements, continued
(17) Peoples Bancorp of North Carolina, Inc. (Parent Company Only) Condensed Financial Statements,continued
Statements of Cash Flows
For the Years Ended December 31, 2003, 2002 and 2001
| 2003 | 2002 | 2001 | ||||||||
| Cash flows from operating activities: | ||||||||||
| Net earnings | $ | 2,003,591 | 3,435,556 | 4,575,352 | ||||||
| Adjustments to reconcile net earnings to net | ||||||||||
| cash provided by operating activities: | ||||||||||
| Amortization | 17,742 | 16,668 | - | |||||||
| Equity in undistributed earnings of subsidiaries | 1,386,434 | (554,256 | ) | (3,322,416 | ) | |||||
| Deferred income tax benefit | (19,173 | ) | (27,991 | ) | (28,076 | ) | ||||
| Change in: | ||||||||||
| Accrued expenses | 54,892 | 49,708 | 63,630 | |||||||
| Net cash provided by operating activities | 3,443,486 | 2,919,685 | 1,288,490 | |||||||
| Cash flows from investing activities: | ||||||||||
| Net change in interest bearing time deposit | (2,000,000 | ) | - | - | ||||||
| Capital contributions to subsidiaries | - | - | (13,933,000 | ) | ||||||
| Net cash used by investing activities | (2,000,000 | ) | - | (13,933,000 | ) | |||||
| Cash flows from financing activities: | ||||||||||
| Proceeds from junior subordinated debentures | - | - | 14,433,000 | |||||||
| Transaction costs associated with trust preferred securities | - | (105,450 | ) | (425,741 | ) | |||||
| Dividends paid | (1,253,430 | ) | (1,256,592 | ) | (1,287,486 | ) | ||||
| Repurchase of common stock | - | (1,314,250 | ) | - | ||||||
| Proceeds from exercise of stock options | 23,737 | 4,225 | - | |||||||
| Net cash provided (used) by financing activities | (1,229,693 | ) | (2,672,067 | ) | 12,719,773 | |||||
| Net change in cash | 213,793 | 247,618 | 75,263 | |||||||
| Cash at beginning of year | 475,820 | 228,202 | 152,939 | |||||||
| Cash at end of year | $ | 689,613 | 475,820 | 228,202 | ||||||
| A-50 | ||
APPENDIX B
Peoples Bancorp of North Carolina, Inc.
and
Peoples Bank
Governance Committee Charter
The Governance Committee, consisting of independent directors, is responsible for developing and maintaining the corporate governance policy. Committee membership is recommended by the Chairman and approved by the Board. The Board Chairman serves as Committee Chairman. The Committee consists of a minimum of 3 independent directors.
The Governance Committee:
Establishes criteria for Board membership and Board “job” description.
Establishes performance criteria for Board members.
Establishes and coordinates annual Board review.
Establishes and maintains Board policies such as attendance, performance, board meeting procedures, director orientation, continuing education program, independent director meetings, assigns and rotates committee members, determines structure of Audit committee and other board committees, establishes management succession plan.
Maintains and monitors director compliance with Board policies and procedures. Counsels with Board members who do not perform to standards and may recommend to full Board, removal of directors for non-performance.
Monitors ethics, conflicts of interest and director Code of Conduct.
Performs duties of Nominating Committee
Recommends candidates for board membership
Interviews candidates for board membership
Slates director and shareholder votes and annual meeting
Provides for filing of director vacancies between shareholder meetings
The Committee establishes criteria for new Board members. For consideration, potential Board members should possess the following attributes: Ethical, integrity, involved in community, successful businessperson, maintain a banking relationship with Peoples Bank, investor in Peoples Bank/Holding Co., live in market area, possess financial expertise and not be a competitor of the Bank. The Committee meets quarterly per year or more often as necessary.
The Governance Committee performs the duties of the Compensation Committee, including
conducting the CEO’s annual review and recommends all forms of CEO compensation for Board approval. The Committee annually reviews, and recommends for Board approval, compensation of the Board of Directors and Board Committees.
The Committee approves compensation of other senior officers as requested by the CEO or required by law.
The Committee reviews and recommends to the Board of Directors the management incentive compensation plan.
APPENDIX C
Peoples Bancorp of North Carolina, Inc.
and
Peoples Bank
Audit Committee Charter
The Audit Committee is comprised solely of independent directors as established by the Governance Committee. The Audit Committee shall be comprised of a minimum of three independent directors. The Committee Chairman is selected from a member designated as an “Audit Committee Financial Expert.”
Committee members must be financially literate with competency in reviewing financial statements and an understanding of banking industry financial practices. To assure independence of committee members, neither they nor their businesses, either directly or indirectly, may accept any consulting, advisory or other compensatory fee from the corporation or the Bank. Committee members may only be compensated for services as members of the Board and the Audit Committee.
Each year, the Board will determine if one or more members of the Board meet the criteria which has been established by the SEC, applicable stock exchange, or regulatory agencies, to be identified as an “Audit Committee Financial Expert” and all will, if qualified, with the individual’s consent, be designated as an “Audit Committee Financial Expert” and be so identified in the company’s annual report or as stipulated in regulation or policy.
If no one is designated as an “Audit Committee Financial Expert,” the Committee will comply with applicable disclosure requirements as to the lack of an “Audit Committee Financial Expert.”
The Committee Chairman has independent lines of communication with the internal and external auditors and may, as necessary, communicate with any other staff member or director as necessary regarding audit or control issues.
The Committee operates independent from management and issues regular reports to the Board. The Audit Committee meets and reports at least quarterly to the Board.
Annually, the Committee will establish the Audit Committee budget for the Bank, which is contained as a line item in the Bank’s budget. The Committee will review, and execute the contract for external/independent audit services and will provide oversight of the work of the independent audit firm. The independent auditors report directly to the Audit Committee. The Committee, with the audit firm, will decide the scope of audit, establish all working relationships with the audit firm for all services and assure compliance with all applicable audit regulations. The Committee will review any other proposed services to be provided to the bank, officers, directors and related companies by the audit firm to determine that these services do not conflict with auditor independence and regulatory requirements. The audit firm is specifically prohibited from providing non-audit services for the Bank, holding company and subsidiaries as prohibited by regulation. The
Committee reviews audit invoices and fees, approves payment, assures that the audit is adequately staffed and that all relationships between the auditors, management, staff and directors are maintained on a professional basis.
The Committee will receive the report of the audit firm, review the report with the Board and management, and monitor compliance with auditor recommendations.
The internal auditor reports to the Audit Committee. For personnel management purposes the auditor reports to an EVP of the bank. The committee is responsible for hiring, firing, reviewing and compensation of the internal auditor. The committee will oversee the work of the internal auditor and assure that the auditor is competent, is afforded continuing education opportunities, is independent of management and has clear lines of communication with the audit chairman and Committee. The internal auditor submits reports and recommendations concerning all audit activities to the Audit Committee. The committee reports to the Board and monitors compliance with the auditor’s recommendations.
At its discretion, the Committee may, as it deems necessary, secure the services of legal or financial advisors to fulfill the Committee’s duties and responsibilities.
The Audit Committee submits a complete report of its activities to the Board quarterly or more frequently as circumstances may require.
The Committee establishes and monitors a procedure for the CEO and CFO to provide to auditors and the Committee certification as to the effectiveness of internal controls. The Committee monitors procedures for the CEO and CFO to provide certifications in quarterly and annual reports regarding full and fair disclosure, adequacy of disclosure controls and procedures and effectiveness of internal controls. This procedure addresses the adequacy and timeliness of disclosures required under federal securities laws.
The Committee establishes and maintains the company’s “whistleblower” policy and procedure as required by the Sarbanes-Oxley Act and provides assurance to management and staff that the policy provides meaningful protection for the “whistleblower.” The Committee is responsible for being certain that this policy is communicated to Bank staff. Additionally, the Committee establishes and monitors procedures to address public and shareholder complaints regarding accounting, internal accounting controls or auditing matters and the confidential, anonymous submission by employees of the Bank concerns regarding questionable accounting or auditing matters.
The Audit Committee meets at a minimum quarterly or more often as needed.
Peoples Bancorp
of North Carolina, Inc.
2003 Annual Report
Since 1912, Peoples Bank and Peoples Bancorp of North Carolina, Inc. have provided financial services in our local communities. We are proud of the growth and success of those who bank with us.
We appreciate the opportunity to partner with you - our friends, customers and shareholders - and look forward to many more productive years.
We appreciate the opportunity to partner with you - our friends, customers and shareholders - and look forward to many more productive years.
Table of Contents
1 Introduction
2 President's Message
3 Financial Performance
4 Financial Highlights
5 Selected Financial Data
6 Report of Independent Certified Public Accountants
7 Consolidated Balance Sheets
8 Consolidated Statement of Earnings
9 Shareholder & General Information & Board of Directors
10 Bank Officers and Subsidiaries
A Message from Tony Wolfe
President and CEO
Financial results alone could be viewed as less than stellar without consideration of the weak economic climate in which the Company has operated over the past eighteen to twenty-four months as a backdrop. It would be necessary to look far beyond the numbers in order to gain a complete perspective of accomplishments for the past year.
Despite the challenges faced by manufacturing companies and the resulting effect to our balance sheet and earnings stream, Peoples Bancorp recorded net income for fiscal year 2003 in the amount of $2.0 million, or $0.64 basic net income per share and $0.63 diluted net income per share. Recurring operations for the year generated net income amounting to $2.2 million, or $0.71 basic and diluted net income per share. These results represented a 26% decrease from net income from recurring operations for the prior year. You will find a discussion of the Company's f inancial performance on Page 3 in this Report.
Locally, we have continued to be challenged with an unemployment rate that is higher than the national average. Therefore, it is our belief that economic recovery on a regional basis will somewhat lag the national average.
An aggressive marketing and advertising campaign was launched last summer to attract new personal and small business relationships. The emphasis on the retail sector will serve to further diversify the Bank's book of business and increase core deposits. With interest rates at historic lows, our mortgage banking department was extremely successful in 2003 as customers chose this time to either originate or refinance their investment in real estate. Additionally, our West Lincoln and Catawba Valley Boulevard Offices opened in September and December of 2002, respectively. These banking offices will continue to enhance our corporate franchise and local communities.
The impact of the recently enacted Sarbanes-Oxley Act has had far reaching implications for us as we have worked throughout the year to implement its requirements. I wish to commend our Board of Directors for their untiring efforts and especially for their cooperation and commitment as we have prepared ourselves for compliance with all regulatory bodies. The Corporation's 2004 Proxy Statement outlines organizational changes to governing committees and required reporting that have been adopted by our corporate Board since the enactment of this legislation.
We have continued to seek additional visibility for the Bank's wholly-owned subsidiary, Peoples Investment Services, Inc., during recent months. The resources and investment choices that are available through this company and our financial advisors are being discovered by more and more area residents with increasing regularity. Securities are offered exclusively through Raymond James Financial Services, Inc., member NASD/SIPC, an independent broker/dealer and are not insured by the FDIC or any other Bank insur ance.
Despite the economic environment in which we have operated during the past year, common stock of Peoples Bancorp of North Carolina, Inc. increased in value by 33% and closed at $18.86 per share on December 31, 2003. Stock appreciation has continued into January and closed at $19.50 per share on January 26, 2004. Cash dividends totaled $1.3 million during 2003, or $0.40 per share. The Corporation's Dividend Reinvestment and Stock Purchase Plan provides an excellent and convenient means of increasing one's investment in Peoples Bancorp.
I wish to thank each officer and employee of Peoples Bancorp and Peoples Bank for the progress we have realized in continuing to move the organization forward in a less than desirable economic environment. Our team of banking professionals has been relentless in the pursuit of the efficient delivery of financial products that are backed by a quality of service that would rival any bank in the country. We insist on doing what is right for the customer and do so with a level of professionalism of which I am so proud.
Thank each of you, our shareholders and friends, for your continued loyalty and support of our efforts here at Peoples. Your recommendations and referrals are invaluable to us.
Sincerely,
/s/ Tony W. Wolfe
Tony W. Wolfe
President and Chief Executive Officer
President and Chief Executive Officer
Financial Performance
Net income for the year ended December 31, 2003 totaled $2.0 million or $0.64 basic net income per share and $0.63 diluted net income per share as compared to $3.4 million or $1.09 basic and diluted net income per share, for the year ended December 31, 2002. The decrease in consolidated net earnings for 2003 was primarily attributable to an increase in the Company's provision for loan losses, a reduction in non-interest income for the year, and an increase in non-interest expense. Net interest income increased 6% to $22.1 million for the year ended December 31, 2003 compared to $20.8 million for the previous year. This increase was primarily attributable to a reduction in interest expense resulting from a reduction in the cost of funds, which was somewhat offset by a decrease in interest income resulting from a reduction in the Bank's prime commercial lending rate during 2003.
The Company's provision for loan losses amounted to $6.7 million for the year ended December 31, 2003, as compared to $5.4 million in 2002. The increase in the provision for loan losses reflected an increase in classified loans, which was the result of adverse business conditions in the Bank's market area. At December 31, 2003, the ratio between the allowance for loan losses and total outstanding loans was 1.76% as compared to 1.38% at December 31, 2002.
Non-interest income decreased 9% to $5.9 million during the year ended December 31, 2003 as compared to $6.5 million for the prior year. The decrease in non-interest income was largely due to the decrease in non-recurring income during 2003, which included net losses on the disposition of assets totaling $233,000, net of income tax expense. Net losses on disposition of assets included a $747,000 net loss on repossessed assets and a $53,000 loss on the sale of securities, which were partially offset by a $479,000 gain associated with the sale of the Bank's $3.7 mil lion credit card portfolio. In the year ended December 31, 2002 the Company had non-recurring gains on the sale of securities of $626,000. Non-interest expense increased 9% in 2003 to $18.2 million as compared to $16.8 million in 2002. The increase in non-interest expense included an increase of $531,000 or 6% in salaries and benefits expense primarily due to normal salary increases and increased employee insurance costs, an increase of $247,000 or 8% in occupancy expense, primarily due to expenses associated with two new branch offices opened in late 2002, and an increase in non-interest expenses other than salary, benefits and occupancy expenses. The increase in other non-interest expenses included an increase in consulting and advertising expense of $440,000 due to an aggressive marketing campaign started by the Bank in 2003.
The Company continued its modest growth in 2003, as total assets increased 4% or $28.4 million to a total of $674.0 million after growing 4% or $26.1 million in 2002. Loans g rew 5% to $552.1 million as of December 31, 2003 while deposits totaled $549.8 million, an increase of 7% from the prior year.
Shareholders' equity amounted to $48.6 million at December 31, 2003. The Company's shareholders' equity to total assets was 7.20% at December 31, 2003 as compared to 7.53% at December 31, 2002. The Company ended the year as a well-capitalized financial institution. Directors of Peoples Bancorp authorized cash dividends to shareholders in the amount of $.40 per share during 2003, which totaled $1.3 million.
Book value per share was $15.49 at December 31, 2003 as compared to $15.51 at December 31, 2002. Market value of Peoples Bancorp common stock closed at $18.86 per share on December 31, 2003 reflecting an increase in market value of 33% in 2003.
Financial Highlights
Dollars in Thousands Except Per Share Amounts
| 2003 | 2002 | Change | |||||
| Interest income | $ | 34,854 | 36,624 | -5% | |||
| Interest expense | 12,749 | 15,777 | -19% | ||||
| Net interest income after provision for loan losses | 15,361 | 15,415 | 0% | ||||
| Non-interest income | 5,926 | 6,491 | -9% | ||||
| Non-interest expense | 18,228 | 16,758 | 9% | ||||
| Income taxes | 1,055 | 1,712 | -38% | ||||
| Net income | $ | 2,004 | 3,436 | -42% | |||
Per Share | |||||||
| Basic net income | $ | 0.64 | 1.09 | -42% | |||
| Diluted net income | 0.63 | 1.09 | -42% | ||||
| Cash dividends | 0.40 | 0.40 | 0% | ||||
| Market price at December 31 | 18.86 | 14.14 | 33% | ||||
| Book value at December 31 | 15.49 | 15.51 | 0% | ||||
At Year-end | |||||||
| Loans, net | $ | 542,404 | 519,122 | 4% | |||
| Mortgage loans held for sale | 587 | 5,065 | -88% | ||||
| Available for sale securities | 79,460 | 71,736 | 11% | ||||
| Assets | 674,032 | 645,638 | 4% | ||||
| Deposits | 549,802 | 515,739 | 7% | ||||
| Shareholders' equity | 48,554 | 48,605 | 0% | ||||
Key Performance Ratios | |||||||
| Return on average assets | 0.30% | 0.55% | |||||
| Return on average shareholders' equity | 4.01% | 7.12% | |||||
| Dividend payout ratio | 62.56% | 36.58% | |||||
| Average shareholders' equity to total average assets | 7.56% | 7.72% | |||||
Selected Financial Data
Dollars in Thousands Except Per Share Amounts
| 2003 | 2002 | 2001 | 2000 | 1999 | ||||||||||||
Summary of Operations | ||||||||||||||||
| Interest income | $ | 34,854 | 36,624 | 41,898 | 40,859 | 32,302 | ||||||||||
| Interest expense | 12,749 | 15,777 | 23,027 | 19,432 | 14,790 | |||||||||||
| Net interest income | 22,105 |
|
| 20,847 |
|
| 18,871 |
|
| 21,427 |
|
| 17,512 | |||
| Provision for loan losses | 6,744 | 5,432 | 3,545 | 1,879 | 425 | |||||||||||
| Net interest income after provision for loan losses | 15,361 | 15,415 | 15,326 | 19,548 | 17,087 | |||||||||||
| Non-interest income | 5,926 | 6,491 | 8,263 | 3,915 | 3,380 | |||||||||||
| Non-interest expense | 18,228 | 16,758 | 16,752 | 15,509 | 13,832 | |||||||||||
| Income before taxes | 3,059 | 5,148 | 6,837 | 7,954 | 6,635 | |||||||||||
| Income taxes | 1,055 | 1,712 | 2,262 | 2,576 | 2,093 | |||||||||||
| Net income | $ | 2,004 | 3,436 | 4,575 | 5,378 | 4,542 | ||||||||||
Selected Year-End Balances | ||||||||||||||||
| Assets | $ | 674,032 | 645,638 | 619,505 | 519,002 | 432,435 | ||||||||||
| Available for sale securities | 79,460 | 71,736 | 84,286 | 71,565 | 62,498 | |||||||||||
| Loans, net | 542,404 | 519,122 | 484,517 | 406,226 | 335,274 | |||||||||||
| Mortgage loans held for sale | 587 | 5,065 | 5,339 | 1,564 | 1,685 | |||||||||||
| Interest-earning assets | 639,501 | 608,619 | 586,496 | 490,449 | 411,734 | |||||||||||
| Deposits | 549,802 | 515,739 | 490,223 | 450,073 | 376,634 | |||||||||||
| Interest-bearing liabilities | 550,357 | 527,192 | 515,989 | 420,594 | 339,243 | |||||||||||
| Shareholders' equity | $ | 48,554 | 48,605 | 45,401 | 43,039 | 37,998 | ||||||||||
| Shares outstanding* | 3,135,202 | 3,133,547 | 3,218,714 | 3,218,714 | 3,218,950 | |||||||||||
Selected Average Balances | ||||||||||||||||
| Assets | $ | 660,644 | 624,796 | 575,142 | 469,536 | 417,387 | ||||||||||
| Available for sale securities | 72,072 | 77,414 | 84,549 | 66,218 | 60,642 | |||||||||||
| Loans | 539,559 | 507,879 | 454,371 | 374,226 | 324,651 | |||||||||||
| Interest-earning assets | 625,764 | 592,947 | 545,945 | 447,645 | 396,606 | |||||||||||
| Deposits | 533,704 | 499,224 | 481,289 | 408,210 | 363,637 | |||||||||||
| Interest-bearing liabilities | 540,243 | 516,314 | 472,435 | 373,167 | 326,164 | |||||||||||
| Shareholders' equity | $ | 49,914 | 48,257 | 47,432 | 42,852 | 39,348 | ||||||||||
| Shares outstanding* | 3,133,687 | 3,151,975 | 3,218,714 | 3,218,714 | 3,218,950 | |||||||||||
Profitability Ratios | ||||||||||||||||
| Return on average total assets | 0.30 | % | 0.55 | % | 0.80 | % | 1.15 | % | 1.09 | % | ||||||
| Return on average shareholders' equity | 4.01 | % | 7.12 | % | 9.65 | % | 12.55 | % | 11.54 | % | ||||||
| Dividend payout ratio | 62.56 | % | 36.58 | % | 28.14 | % | 23.39 | % | 23.84 | % | ||||||
Liquidity and Capital Ratios (averages) | ||||||||||||||||
| Loan to deposit | 101.10 | % | 101.73 | % | 94.41 | % | 91.67 | % | 89.28 | % | ||||||
| Shareholders' equity to total assets | 7.56 | % | 7.72 | % | 8.25 | % | 9.13 | % | 9.43 | % | ||||||
Per share of common stock* | ||||||||||||||||
| Basic net income | $ | 0.64 | 1.09 | 1.42 | 1.67 | 1.41 | ||||||||||
| Diluted net income | $ | 0.63 | 1.09 | 1.42 | 1.67 | 1.41 | ||||||||||
| Cash dividends | $ | 0.40 | 0.40 | 0.40 | 0.39 | 0.34 | ||||||||||
| Book value | $ | 15.49 | 15.51 | 14.11 | 13.37 | 11.81 | ||||||||||
| *Shares outstanding and per share computations have been restated to reflect a 10% stock dividend during second quarter | ||||||||||||||||
| 2000 and the 3 for 2 stock split during first quarter 1999. | ||||||||||||||||
Report of Independent
Certified Public Accountants
To the Board of Directors and Shareholders
Peoples Bancorp of North Carolina, Inc.
Newton, North Carolina:
We have audited the consolidated balance sheets of Peoples Bancorp of North Carolina, Inc. as of December 31, 2003 and 2002, and the related consolidated statements of earnings, changes in shareholders' equity, comprehensive income and cash flows for each of the three years in the period ended December 31, 2003. Such consolidated financial statements and our report thereon dated January 16, 2004, expressing an unqualified opinion (which are not included herein) are included in the proxy statement for the 2004 annual meeting of shareholders. The accompanying condensed consolidated balance sheets and consolidated statements of earnings are the responsibility of the Company's management. Our responsibility is to express an opinion on such consolidated balance sheets and consolida ted statements of earnings in relation to the complete consolidated financial statements.
In our opinion, the information set forth in the accompanying condensed consolidated balance sheets as of December 31, 2003 and 2002 and the related consolidated statements of earnings for each of the three years in the period ended December 31, 2003, is fairly stated in all material respects in relation to the basic consolidated financial statements from which it has been derived.
&n bsp; /s/ Porter Keadle Moore, LLP
Atlanta, Georgia
January 16, 2004
Consolidated Balance Sheets
December 31, 2003 and 2002
Assets | |||||||
2003 |
|
| 2002 | ||||
| Cash and due from banks | $ | 18,413,786 | 13,803,665 | ||||
| Federal funds sold | 2,369,000 | 1,774,000 | |||||
| | |||||||
| Cash and cash equivalents | 20,782,786 | 15,577,665 | |||||
| Investment securities available for sale | 79,460,452 | 71,735,705 | |||||
| Other investments | 4,216,973 | 4,345,573 | |||||
| Mortgage loans held for sale | 587,495 | 5,064,635 | |||||
| Loans, net | 542,403,922 | 519,121,840 | |||||
| Premises and equipment, net | 12,537,230 | 15,620,977 | |||||
| Cash surrender value of life insurance | 5,045,449 | 4,828,708 | |||||
| Accrued interest receivable and other assets | 8,998,137 | 9,342,835 | |||||
| | |||||||
| $ | 674,032,444 | 645,637,938 | |||||
| | |||||||
Liabilities and Shareholders' Equity | |||||||
| Deposits: | |||||||
| Noninterest-bearing | $ | 72,420,923 | 67,398,458 | ||||
| Interest-bearing | 477,381,309 | 448,340,497 | |||||
| | |||||||
| Total deposits | 549,802,232 | 515,738,955 | |||||
| | |||||||
| Demand notes payable to U.S. Treasury | 443,384 | 1,600,000 | |||||
| Accrued interest payable and other liabilities | 2,799,932 | 2,189,821 | |||||
| Federal Home Loan Bank advances | 58,000,000 | 63,071,429 | |||||
| Junior subordinated debentures | 14,433,000 | 14,433,000 | |||||
| | |||||||
| Total liabilities | 625,478,548 | 597,033,205 | |||||
| | |||||||
| Commitments | |||||||
| Shareholders' equity: | |||||||
| Preferred stock, no par value; authorized 5,000,000 shares; | |||||||
| no shares issued and outstanding | _____ | _____ | |||||
| Common stock, no par value, authorized 20,000,000 shares; | |||||||
| 3,135,202 and 3,133,547 shares issued and outstanding | 35,121,510 | 35,097,773 | |||||
| Retained earnings | 12,844,524 | 12,094,363 | |||||
| Accumulated other comprehensive income | 587,862 | 1,412,597 | |||||
| | |||||||
| Total shareholders' equity | 48,553,896 | 48,604,733 | |||||
| | |||||||
| $ | 674,032,444 | 645,637,938 | |||||
| | |||||||
| Refer to Appendix A of Peoples Bancorp of North Carolina, Inc. Proxy Statement, | |||||||
| dated April 2, 2004, for a complete set of Consolidated Financial Statements. | |||||||
Consolidated Statements of Earnings
For the Years Ended December 31, 2003,2002 and 2001
2003 |
|
| 2002 |
|
| 2001 | ||||
| | ||||||||||
| Interest income: | ||||||||||
| Interest and fees on loans | $ | 31,531,673 | 32,038,359 | 36,512,395 | ||||||
| Interest on federal funds sold | 58,384 | 45,271 | 126,791 | |||||||
| Interest and dividends on securities: | ||||||||||
| U.S. Government agencies | 2,244,375 | 3,439,814 | 3,918,551 | |||||||
| State and political subdivisions | 577,339 | 613,219 | 911,707 | |||||||
| Other | 441,958 | 487,284 | 428,157 | |||||||
| | ||||||||||
| Total interest income | 34,853,729 | 36,623,947 | 41,897,601 | |||||||
| | ||||||||||
| Interest expense: | ||||||||||
| Deposits | 9,476,208 | 12,364,245 | 20,790,136 | |||||||
| Federal Home Loan Bank advances | 2,597,043 | 2,658,742 | 2,118,511 | |||||||
| Other | 675,417 | 754,344 | 117,849 | |||||||
| | ||||||||||
| Total interest expense | 12,748,668 | 15,777,331 | 23,026,496 | |||||||
| | ||||||||||
| Net interest income | 22,105,061 | 20,846,616 | 18,871,105 | |||||||
| Provision for loan losses | 6,743,900 | 5,431,600 | 3,545,322 | |||||||
| | ||||||||||
| Net interest income after provision for loan losses | 15,361,161 | 15,415,016 | 15,325,783 | |||||||
| | ||||||||||
| Other income: | ||||||||||
| Service charges on deposit accounts | 3,266,949 | 3,060,581 | 2,805,492 | |||||||
| Other services charges and fees | 610,591 | 503,165 | 471,998 | |||||||
| Gain (loss) on sale of securities | (52,855) | 625,616 | 1,613,992 | |||||||
| Mortgage banking income | 685,343 | 702,290 | 1,014,043 | |||||||
| Insurance and brokerage commissions | 420,762 | 477,765 | 348,582 | |||||||
| Loss on foreclosed and repossessed assets | (746,543) | (564) | (65,630) | |||||||
| Gain on sale of loans | 478,759 | ------ | ------ | |||||||
| Miscellaneous | 1,262,883 | 1,121,762 | 2,074,427 | |||||||
| | ||||||||||
| Total other income | 5,925,889 | 6,490,615 | 8,262,904 | |||||||
| | ||||||||||
| Other expenses: | ||||||||||
| Salaries and employee benefits | 10,099,811 | 9,569,016 | 9,115,496 | |||||||
| Occupancy | 3,389,857 | 3,142,712 | 2,984,100 | |||||||
| Other operating | 4,738,253 | 4,046,347 | 4,652,197 | |||||||
| | ||||||||||
| Total other expenses | 18,227,921 | 16,758,075 | 16,751,793 | |||||||
| | ||||||||||
| Earnings before income taxes | 3,059,129 | 5,147,556 | 6,836,894 | |||||||
| Income tax expense | 1,055,538 | 1,712,000 | 2,261,542 | |||||||
| | ||||||||||
| Net earnings | $ | 2,003,591 | 3,435,556 | 4,575,352 | ||||||
| | ||||||||||
| Basic earnings per share | $ | .64 | 1.09 | 1.42 | ||||||
| | ||||||||||
| Diluted earnings per share | $ | .63 | 1.09 | 1.42 | ||||||
| | ||||||||||
Refer to Appendix A of Peoples Bancorp of North Carolina, Inc. Proxy Statement,
dated April 2, 2004 for a complete set of Consolidated Financial Statements.