UNITED STATES
SECURITIES AND EXCHANGE COMMISSION
Washington, D.C. 20549
SCHEDULE 14A
(Rule 14a-101)
Proxy Statement Pursuant to Section 14(a)
of the Securities Exchange Act of 1934
Filed by the Registrant [X]
Filed by a Party other than the Registrant [ ]
Check the appropriate box:
| [ ] | Preliminary Proxy Statement | [ ] | Confidential, for Use of the Commission | ||||
| [X] | Definitive Proxy Statement | Only (as permitted by Rule 14a-6(e)(2)) | |||||
| [ ] | Definitive Additional Materials | ||||||
| [ ] | Soliciting Material Pursuant to | ||||||
| §240.14a-12 |
Peoples Bancorp of North Carolina, Inc.
(Name of Registrant as Specified In Its Charter)
(Name of Person(s) Filing Proxy Statement, if other than the Registrant)
| Payment of Filing Fee (Check the appropriate box): | |||
| [X] | No fee required. | ||
| [ ] | Fee computed on table below per Exchange Act Rules 14a-6(i)(1) and 0-11. | ||
| (1) | Title of each class of securities to which transaction applies: | ||
| (2) | Aggregate number of securities to which transaction applies: | ||
| (3) | Per unit price or other underlying value of transaction computed pursuant to Exchange Act Rule 0-11 (set forth the amount on which the filing fee is calculated and state how it was determined): | ||
| (4) | Proposed maximum aggregate value of transaction: | ||
| (5) | Total fee paid: | ||
| [ ] | Fee paid previously with preliminary materials: | ||
| [ ] | Check box if any part of the fee is offset as provided by Exchange Act Rule 0-11(a)(2) and identify the filing for which the offsetting fee was paid previously. Identify the previous filing by registration statement number, or the Form or Schedule and the date of its filing. | ||
| (1) | Amount Previously Paid: | ||
| (2) | Form, Schedule or Registration Statement No.: | ||
| (3) | Filing Party: | ||
| (4) | Date Filed: | ||
| PEOPLES BANCORP | ||
| OF NORTH CAROLINA, INC. | ||
| Notice of 2008 Annual Meeting, | ||
| Proxy Statement and | ||
| Annual Report |
PEOPLES BANCORP OF NORTH CAROLINA, INC.
PROXY STATEMENT
| Table of Contents |
Page | |
| NOTICE OF 2008 ANNUAL MEETING OF SHAREHOLDERS ..................................................................................................................................................................................................... | ii |
| PROXY STATEMENT .......................................................................................................................................................................................................................................................................... | 1 |
| Security Ownership Of Certain Beneficial Owners and Management ....................................................................................................................................................................................... | 4 |
| Section 16(a) Beneficial Ownership Reporting Compliance ......................................................................................................................................................................................................... | 7 |
| Proposal 1 - Election of Directors ................................................................................................................................................................................................................................................... | 7 |
| Our Board of Directors and Its Committees .............................................................................................................................................................................................................................. | 9 |
| Report of the Compensation Committee .................................................................................................................................................................................................................................... | 10 |
| Report of Audit Committee .......................................................................................................................................................................................................................................................... | 10 |
| Compensation Discussion and Analysis ...................................................................................................................................................................................................................................... | 11 |
| Compensation Committee Members .......................................................................................................................................................................................................................................... | 11 |
| Objectives of Our Compensation Program ................................................................................................................................................................................................................................. | 12 |
| Compensation Decision Process ................................................................................................................................................................................................................................................. | 12 |
| Elements of Compensation ........................................................................................................................................................................................................................................................... | 12 |
| Compensation Committee Interlocks and Insider Participation .............................................................................................................................................................................................. | 15 |
| Executive Compensation and Benefits ........................................................................................................................................................................................................................................... | 15 |
| Director Compensation ................................................................................................................................................................................................................................................................. | 15 |
| Executive Officers ......................................................................................................................................................................................................................................................................... | 17 |
| Management Compensation ........................................................................................................................................................................................................................................................ | 17 |
| Employment Agreements ........................................................................................................................................................................................................................................................... | 20 |
| Equity Compensation Plan Information ................................................................................................................................................................................................................................... | 20 |
| Omnibus Stock Ownership and Long Term Incentive Plan .................................................................................................................................................................................................. | 21 |
| Federal Income Tax Consequences .......................................................................................................................................................................................................................................... | 24 |
| Incentive Compensation Plans .................................................................................................................................................................................................................................................... | 25 |
| Deferred Compensation Plan ....................................................................................................................................................................................................................................................... | 28 |
| Supplemental Retirement Plan ..................................................................................................................................................................................................................................................... | 29 |
| Discretionary Bonuses and Service Awards ............................................................................................................................................................................................................................ | 29 |
| Profit Sharing Plan and 401(k) Plan ............................................................................................................................................................................................................................................. | 29 |
| Indebtedness of and Transactions with Management and Directors ................................................................................................................................................................................... | 30 |
| Performance Graph ............................................................................................................................................................................................................................................................................. | 31 |
| Proposal 2 - Approval to Amend the Company’s Articles of Incorporation ........................................................................................................................................................................ | 32 |
| Proposal 3 - Ratification of Selection of Independent Auditor .................................................................................................................................................................................................. | 33 |
| Audit Fees ................................................................................................................................................................................................................................................................................... | 33 |
| Audit Related Fees ........................................................................................................................................................................................................................................................................ | 33 |
| Tax Fees .......................................................................................................................................................................................................................................................................................... | 33 |
| All Other Fees ............................................................................................................................................................................................................................................................................. | 33 |
| Date for Receipt of Shareholder Proposals .................................................................................................................................................................................................................................... | 34 |
| Other Matters ..................................................................................................................................................................................................................................................................................... | 34 |
| Miscellaneous .................................................................................................................................................................................................................................................................................... | 34 |
| Appendix A – Annual Report to Shareholders | |
| Appendix B – Amendment to Articles of Incorporation |
i
| PEOPLES BANCORP OF NORTH CAROLINA, INC. | ||
| Post Office Box 467 | ||
| 518 West C Street | ||
| Newton, North Carolina 28658-0467 | ||
| (828) 464-5620 | ||
| NOTICE OF 2008 ANNUAL MEETING OF SHAREHOLDERS | ||
| To Be Held on May 1, 2008 |
NOTICE IS HEREBY GIVEN that the 2008 Annual Meeting of Shareholders of Peoples Bancorp of North Carolina, Inc. (the “Company”) will be held as follows:
| Place: | Catawba Country Club | ||
| 1154 Country Club Road | |||
| Newton, North Carolina | |||
| Date: | May 1, 2008 | ||
| Time: | 11:00 a.m., Eastern Time |
The purposes of the Annual Meeting are to consider and vote upon the following matters:
| · | To elect two persons who will serve as members of the Board of Directors until the 2011 Annual Meeting of Shareholders or until their successors are duly elected and qualified; |
| · | To amend the Company’s Articles of Incorporation to provide that directors be elected annually; |
| · | To ratify the appointment of Porter Keadle Moore, LLP (“PKM”) as the Company’s independent registered public accounting firm for the fiscal year ending December 31, 2008; and |
| · | To consider and act on any other matters that may properly come before the Annual Meeting or any adjournment. |
The Board of Directors has established March 10, 2008 as the record date for the determination of shareholders entitled to notice of and to vote at the Annual Meeting. If an insufficient number of shares is present in person or by proxy to constitute a quorum at the time of the Annual Meeting, the Annual Meeting may be adjourned in order to permit further solicitation of proxies by the Company.
A form of proxy is enclosed to enable you to vote your shares at the Annual Meeting. You are urged, regardless of the number of shares you hold, to complete, sign, date and return the proxy promptly. A return envelope, which requires no postage if mailed in the United States, is enclosed for your convenience.
By Order of the Board of Directors,
/s/ Tony W. Wolfe
Tony W. Wolfe
President and Chief Executive Officer
Newton, North Carolina
March 31, 2008
ii
PEOPLES BANCORP OF NORTH CAROLINA, INC.
______________________________________
PROXY STATEMENT
______________________________________
Annual Meeting of Shareholders
To Be Held On May 1, 2008
_____________________________________
This Proxy Statement is being mailed to our shareholders on or about March 31, 2008 for solicitation of proxies by the Board of Directors of Peoples Bancorp of North Carolina, Inc. Our principal executive offices are located at 518 West C Street, Newton, North Carolina 28658. Our telephone number is (828) 464-5620.
In this Proxy Statement, the terms “we,” “us,” “our” and the “Company” refer to Peoples Bancorp of North Carolina, Inc. The term “Bank” means Peoples Bank, our wholly-owned, North Carolina-chartered bank subsidiary. The terms “you” and “your” refer to the shareholders of the Company.
INFORMATION ABOUT THE ANNUAL MEETING
Your vote is very important. For this reason, our Board is requesting that you allow your common stock to be represented at the 2008 Annual Meeting of Shareholders by the proxies named on the enclosed proxy card.
| When is the Annual Meeting? | May 1, 2008 at 11 a.m., Eastern Time |
| Where will the Annual Meeting be held? | At the Catawba Country Club, 1154 Country Club Road, Newton, North Carolina |
| What items will be voted on at the | ||
| Annual Meeting? | 1. | ELECTION OF DIRECTORS. To elect two directors to serve until the 2011 Annual Meeting of Shareholders; |
| 2. | AMENDMENT OF THE ARTICLES OF INCORPORATION. To amend the Company's Articles of Incorporation to | |
| provide that directors be elected annually; | ||
| 3. | RATIFICATION OF REGISTERED PUBLIC ACCOUNTING FIRM. To ratify the appointment of PKM as the Company's | |
| independent registered public accounting firm for fiscal year 2008; and | ||
| 4. | OTHER BUSINESS. To consider any other business as may properly come before the Annual Meeting or any | |
| adjournment. |
| Who can vote? | Only holders of record of our common stock at the close of business on March 10, 2008 (the “Record Date”) will be entitled to notice of and to vote at the Annual Meeting and any adjournment of the Annual Meeting. On the Record Date, there were 5,602,329 shares of our common stock outstanding and entitled to vote and 700 shareholders of record. |
| How do I vote by proxy? | You may vote your shares by marking, signing and dating the enclosed proxy card and returning it in the enclosed postage-paid envelope. If you return your signed proxy card before the Annual Meeting, the proxies will vote your shares as you direct. The Board of Directors has appointed proxies to represent shareholders who cannot attend the Annual Meeting in person. |
For the election of directors, you may vote for (1) all of the nominees, (2) none of the nominees, or (3) all of the nominees except those you designate. If a nominee for election as a director becomes unavailable for election at any time at or before the Annual Meeting, the proxies will vote your shares for a substitute nominee. For each other item of business, you may vote “FOR” or “AGAINST” or you may “ABSTAIN” from voting.
If you return your signed proxy card but do not specify how you want to vote your shares, the proxies will vote them “FOR” the election of all of our nominees for directors and “FOR” all other proposals presented in this Proxy Statement in accordance with Board of Directors recommendations.
If your shares are held in the name of a broker or other nominee (i.e., held in “street name”), you will need to obtain a proxy instruction form from the broker holding your shares and return the form as directed by your broker.
We are not aware of any other matters to be brought before the Annual Meeting. If matters other than those discussed above are properly brought before the Annual Meeting, the proxies may vote your shares in accordance with their best judgment.
| How do I change or revoke my proxy? | You can change or revoke your proxy at any time before it is voted at the Annual Meeting in any of three ways: (1) by delivering a written notice of revocation to the Secretary of the Company; (2) by delivering another properly signed proxy card to the Secretary of the Company with a more recent date than your first proxy card; or (3) by attending the Annual Meeting and voting in person. You should deliver your written notice or superseding proxy to the Secretary of the Company at our principal executive offices listed above. |
| How many votes can I cast? | You are entitled to one vote for each share held as of the Record Date on each nominee for election and each other matter presented for a vote at the Annual Meeting. You may not vote your shares cumulatively in the election of directors. |
2
How many votes are required to approve the proposals? | If a quorum is present at the Annual Meeting, each director nominee will be elected by a plurality of the votes cast in person or by proxy. If you withhold your vote on a nominee, your shares will not be counted as having voted for that nominee. |
| The proposal to approve amendments to the Company’s Articles of Incorporation will be approved by the affirmative vote of the holders of a majority of the shares present, or represented by proxy, at the Annual Meeting. |
| The proposal to ratify the appointment of the Company’s independent registered public accounting firm for 2008 will be approved if the votes cast in favor exceed the votes cast in opposition. |
| Any other matters properly coming before the Annual Meeting for a vote will require the affirmative vote of the holders of a majority of the shares represented in person or by proxy at the Annual Meeting and entitled to vote on that matter. |
| Abstentions and broker non-votes are not treated as votes cast on any proposal, therefore, neither will have an effect on the vote for the election of any director, amendment to the Company’s Articles of Incorporation, or the ratification of our independent registered public accounting firm. |
A broker non-vote occurs when a broker does not vote on a particular matter because the broker does not have discretionary authority on that matter and has not received instructions from the owner of the shares.
In the event there are insufficient votes present at the Annual Meeting for a quorum or to approve or ratify any proposal, the Annual Meeting may be adjourned in order to permit the further solicitation of proxies.
What constitutes a "quorum" for the Annual Meeting? | A majority of the outstanding shares of our common stock entitled to vote at the Annual Meeting, present in person or represented by proxy, constitutes a quorum (a quorum is necessary to conduct business at the Annual Meeting). Your shares will be considered part of the quorum if you have voted by proxy. Abstentions, broker non-votes and votes withheld from any director nominee count as shares present at the Annual Meeting for purposes of determining a quorum. |
| Who pays for the solicitation of proxies? | We will pay the cost of preparing, printing and mailing materials in connection with this solicitation of proxies. In addition to solicitation by mail, our officers, directors and regular employees, as well as those of the Bank, may make solicitations personally, by telephone or otherwise without additional compensation for doing so. We reserve the right to engage a proxy solicitation firm to assist in the solicitation of proxies for the Annual Meeting. We will, upon request, reimburse brokerage firms, banks and others for their reasonable out-of-pocket expenses in forwarding proxy materials to beneficial owners of stock or otherwise in connection with this solicitation of proxies. |
3
When are proposals for the 2009 Annual Meeting due? | To be considered either for inclusion in the proxy materials solicited by the Board of Directors for the 2009 Annual Meeting, proposals must be received by the Secretary of the Company at our principal executive offices at 518 West C Street, Newton, North Carolina 28658 (or at P.O. Box 467, Newton, North Carolina 28658-0467) no later than December 6, 2008. To be included in the proxy materials, a proposal must comply with our Bylaws, Rule 14a-8 and all other applicable provisions of Regulation 14A under the Securities Exchange Act of 1934, as amended (the “Exchange Act”). |
Any proposal not intended to be included in the proxy statement for the 2009 Annual Meeting, but intended to be presented at that Annual Meeting, must be received by us at our principal executive offices listed above no later than February 18, 2009.
SECURITY OWNERSHIP OF CERTAIN BENEFICIAL OWNERS
AND MANAGEMENT
The Securities and Exchange Act of 1934 (the “Exchange Act”), requires that any person who acquires the beneficial ownership of more than five percent of the Company’s common stock notify the Securities and Exchange Commission (the “SEC”) and the Company. Following is certain information, as of March 10, 2008, regarding those persons or groups who held of record, or who are known to the Company to own beneficially, more than five percent of the outstanding common stock.
Name and Address of Beneficial Owner | Amount and Nature of Beneficial Ownership1 | Percent of Class2 |
Christine S. Abernethy P.O. Box 820 Newton, NC 28658 | 646,843 3 | 11.55% |
Tontine Partners, LP 55 Railroad Avenue, 3rd Floor Greenwich, CT 06830-6378 | 519,408 | 9.27% |
| 1 | Unless otherwise noted, all shares are owned directly of record by the named individuals, by their spouses and minor children, or by other entities controlled by the named individuals. Voting and investment power is not shared unless otherwise indicated. |
| 2 | Based upon a total of 5,602,329 shares of common stock outstanding as of the Record Date. |
| 3 | Carolina Glove Company, Inc. owns 107,604 shares of common stock. These shares are included in the calculation of Ms. Abernethy’s total beneficial ownership interest. Ms. Abernethy owns approximately 50% of the stock of Carolina Glove Company, Inc. The business is operated by a family committee. Ms. Abernethy has no active day-to-day participation in the business affairs of Carolina Glove Company, Inc. |
4
Set forth below is certain information, as of the Record Date, regarding those shares of common stock owned beneficially by each of the persons who currently serves as a member of the Board of Directors, is a nominee for election to the Board at the Annual Meeting, or is a named executive officer of the Company. Also shown is the number of shares of common stock owned by the directors and executive officers of the Company as a group.
| Amount and | ||
| Nature of | Percentage | |
| Beneficial | of | |
| Name and Address | Ownership1 | Class2 |
| James S. Abernethy | 171,414 3 | 2.99% |
| Post Office Box 327 | ||
| Newton, NC 28658 | ||
| Robert C. Abernethy | 181,267 4 | 3.16% |
| Post Office Box 366 | ||
| Newton, NC 28658 | ||
| Joseph F. Beaman, Jr. | 32,869 5 | * |
| Post Office Box 467 | ||
| Newton, NC 28658 | ||
| William D. Cable, Sr. | 29,897 6 | * |
| Post Office Box 467 | ||
| Newton, NC 28658 | ||
| Douglas S. Howard | 10,403 7 | * |
| P.O. Box 587 | ||
| Denver, NC 28037 | ||
| A. Joseph Lampron | 19,965 8 | * |
| Post Office Box 467 | ||
| Newton, NC 28658 | ||
| John W. Lineberger, Jr. | 2,503 | * |
| P.O. Box 481 | ||
| Lincolnton, NC 28092 | ||
| Gary E. Matthews | 13,519 | * |
| 210 First Avenue South | ||
| Conover, NC 28613 | ||
| Billy L. Price, Jr., M.D. | 2,099 | * |
540 11th Ave. Place NW | ||
| Hickory, NC 28601 | ||
| Larry E. Robinson | 47,113 9 | * |
| Post Office Box 723 | ||
| Newton, NC 28658 | ||
| Lance A. Sellers | 27,402 10 | * |
| Post Office Box 467 | ||
| Newton, NC 28658 | ||
| William Gregory Terry | 8,720 11 | * |
| P.O. Box 395 | ||
| Conover, NC 28613 | ||
| Dan Ray Timmerman, Sr. | 58,072 12 | 1.01% |
| Post Office Box 1148 | ||
| Conover, NC 28613 | ||
| Tony W. Wolfe | 43,503 13 | * |
| Post Office Box 467 | ||
| Newton, NC 28658 | ||
| Benjamin I. Zachary | 75,632 14 | 1.32% |
| Post Office Box 277 | ||
| Taylorsville, NC 28681 | ||
| All current directors and nominees and executive officers as a group (15 people) | 660,340 15, 16 | 11.53% |
5
*Does not exceed one percent of the common stock outstanding.
______________________________________________
| 1 | Unless otherwise noted, all shares are owned directly of record by the named individuals, by their spouses and minor children, or by other entities controlled by the named individuals. Voting and investment power is not shared unless otherwise indicated. |
| 2 | Based upon a total of 5,602,329 shares of common stock outstanding as of the Record Date and 126,748 stock options exercisable within 60 days with respect to the designated recipient(s). |
| 3 | Includes 64,038 shares of common stock owned by Alexander Railroad Company. Mr. J. Abernethy is Vice President, Secretary and Chairman of the Board of Directors of Alexander Railroad Company. |
| 4 | Includes 5,096 shares of common stock owned by Mr. R. Abernethy’s spouse, for which Mr. R. Abernethy disclaims beneficial ownership. |
| 5 | Includes 26,764 shares of common stock in which Mr. Beaman has the right to acquire beneficial interest within 60 days by the exercise of stock options granted under the Omnibus Stock Ownership and Long Term Incentive Plan. |
| 6 | Includes 21,017 shares of common stock in which Mr. Cable has the right to acquire beneficial interest within 60 days by the exercise of stock options granted under the Omnibus Stock Ownership and Long Term Incentive Plan. |
| 7 | Includes 1,650 shares of common stock owned by Mr. Howard’s mother over which Mr. Howard holds a power of attorney. Includes 825 shares of common stock owned by Howard Ventures, Inc. Mr. Howard is Vice President of Howard Ventures, Inc. |
| 8 | Includes 18,400 shares of common stock in which Mr. Lampron has the right to acquire beneficial interest within 60 days by the exercise of stock options granted under the Omnibus Stock Ownership and Long Term Incentive Plan. |
| 9 | Includes 6,835 shares of common stock owned by Mr. Robinson’s spouse, for which Mr. Robinson disclaims beneficial ownership. |
| 10 | Includes 21,455 shares of common stock in which Mr. Sellers has the right to acquire beneficial interest within 60 days by the exercise of stock options granted under the Omnibus Stock Ownership and Long Term Incentive Plan. |
| 11 | Includes 1,650 shares of common stock owned by Drum Funeral Home, LLC. Mr. Terry is Executive Vice President of Drum Funeral Home, LLC. |
| 12 | Includes 2,722 shares of common stock owned by Timmerman Manufacturing, Inc. Mr. Timmerman is President and a Director of Timmerman Manufacturing, Inc. |
| 13 | Includes 39,112 shares of common stock in which Mr. Wolfe has the right to acquire beneficial interest within 60 days by the exercise of stock options granted under the Omnibus Stock Ownership and Long Term Incentive Plan. |
| 14 | Includes 64,038 shares of common stock owned by Alexander Railroad Company. Mr. Zachary is President, Treasurer, General Manager and a Director of Alexander Railroad Company. |
| 15 | The 64,038 shares owned by Alexander Railroad Company and attributed to Mr. J. Abernethy and Mr. Zachary are only included once in calculating this total. |
| 16 | Includes 126,748 shares of common stock in which the executive officers, as a group, have the right to acquire beneficial interest within 60 days by the exercise of stock options granted under the Omnibus Stock Ownership and Long Term Incentive Plan. |
Directors James S. Abernethy and Robert C. Abernethy are brothers and are sons of Christine S. Abernethy, who owns in excess of 10% of the common stock.
6
SECTION 16(a) BENEFICIAL OWNERSHIP REPORTING COMPLIANCE
Section 16(a) of the Exchange Act requires the Company’s executive officers and directors, and persons who own more than ten percent of the common stock, to file reports of ownership and changes in ownership with the SEC. Executive officers, directors and greater than ten percent beneficial owners are required by SEC regulations to furnish the Company with copies of all Section 16(a) forms they file.
Based solely on a review of the copies of such forms furnished to the Company and written representations from the Company’s executive officers and directors, the Company believes that during the fiscal year ended December 31, 2007, its executive officers and directors and greater than ten percent beneficial owners complied with all applicable Section 16(a) filing requirements.
PROPOSAL 1
ELECTION OF DIRECTORS
Our Board of Directors has set its number at ten members. Our current Bylaws provide that in order to be eligible for consideration at the Annual Meeting of Shareholders, all nominations of directors, other than those made by the Nominating Committee or the Board of Directors, must be in writing and must be delivered to the Secretary of the Company not less than 50 days nor more than 90 days prior to the meeting at which such nominations will be made; provided, however, that if less than 60 days' notice of the meeting is given to the shareholders, such nominations must be delivered to the Secretary of the Company not later than the close of business on the tenth day following the day on which the notice of meeting was mailed.
The following table provides information about the two nominees for election to the Board of Directors, as well as the eight continuing directors.
Name | Age on December 31, 2007 | Principal Occupation During Last Five Years | Director Since | Term Expires |
Douglas S. Howard | 48 | Vice President, Howard Ventures, Inc.; Secretary/Treasurer, Denver Equipment of Charlotte, Inc. | 2004 | 2011 |
| Billy L. Price, Jr., M.D. | 51 | Practicing Internist and Partner in Catawba Valley Internal Medicine, P.A.; Clinical Appointment, Wake Forest University School of Medicine, Department of Internal Mrdicine | 2004 | 2011 |
THE BOARD OF DIRECTORS RECOMMENDS THAT YOU VOTE “FOR” ALL OF THE NOMINEES NAMED ABOVE FOR ELECTION AS DIRECTORS. | ||||
7
The following table gives information about our directors continuing in office.
Name | Age on December 31, 2007 | Principal Occupation During Last Five Years | Director Since | Term Expires |
| Robert C. Abernethy | 57 | President, Secretary and Treasurer, Carolina Glove Company, Inc. (glove manufacturer); Secretary and Assistant Treasurer, Midstate Contractors, Inc. (paving company) | 1976 | 2009 |
| James S. Abernethy | 53 | Vice President, Carolina Glove Company, Inc. (glove manufacturer); President and Assistant Secretary, Midstate Contractors, Inc.(paving company); Vice President, Secretary and Chairman of the Board of Directors, Alexander Railroad Company | 1992 | 2009 |
Larry E. Robinson | 62 | President and Chief Executive Officer, The Blue Ridge Distributing Company, Inc. (beer and wine distributor); Partner and Vice President, United Beverages of North Carolina, LLC (beer distributor) | 1993 | 2009 |
William Gregory Terry | 40 | Executive Vice President, Drum & Willis-Reynolds Funeral Homes and Crematory | 2004 | 2009 |
John W. Lineberger, Jr. | 57 | President, Lincoln Bonded Warehouse Company (commercial warehousing facility) | 2004 | 2010 |
Gary E. Matthews | 52 | President and Director, Matthews Construction Company, Inc. | 2001 | 2010 |
Dan Ray Timmerman, Sr. | 60 | President/CEO, Timmerman Manufacturing, Inc. (wrought iron furniture, railings and gates manufacturer) | 1995 | 2010 |
Benjamin I. Zachary | 51 | President, Treasurer, General Manager and Director of Alexander Railroad Company | 1995 | 2010 |
We have no reason to believe that any of the nominees for election will be unable or will decline to serve if elected. In the event of death or disqualification of any nominee or the refusal or inability of any nominee to serve as a director, however, the proxies will vote for the election of another person as they determine in their discretion or may allow the vacancy to remain open until filled by the Board. In no circumstance will any proxy be voted for more than two nominees who are not named in this proxy statement. Properly executed and returned proxies, unless revoked, will be voted as directed by you or, in the absence of direction, will be voted in favor of the election of the recommended nominees. An affirmative vote of a plurality of votes cast at the Annual Meeting is necessary to elect a nominee as a director.
8
OUR BOARD OF DIRECTORS
AND ITS COMMITTEES
How often did our Board of Directors meet during 2007?
Our Board held 18 meetings during 2007. All incumbent directors attended more than 75% of the total number of meetings of the Board and its committees on which they served during the year.
What committees does our Board have?
During 2007, our Board had four standing committees, the Audit Committee, the Governance Committee, the Compensation Committee, and the Executive Committee. The voting members of these Committees are appointed by the Board annually from among its members. Certain of our executive officers also serve as non-voting, advisory members of these committees.
Governance Committee. The Governance Committee is comprised entirely of independent Directors, as defined in Rule 4200(a)(15) of the NASDAQ’s listing standards. During fiscal year 2007 the following persons served on the Committee: Directors R. Abernethy, J. Abernethy, Lineberger, Robinson, Terry, and Timmerman. The Governance Committee is responsible for developing and maintaining the corporate governance policy, as well as acting as the nominating committee for the Board.
The Governance Committee, serving as the nominating committee of the Board of Directors, interviews candidates for membership to the Board of Directors, recommends candidates to the full Board, slates candidates for Director and shareholder votes, and fills any vacancies on the Board of Directors which occur between shareholder meetings. The Governance Committee’s identification of candidates for Director typically results from the business interactions of the members of the Governance Committee or from recommendations received by the committee from other Directors or from Company management. The Governance Committee currently has no written policy with regard to the consideration of director candidates recommended by security holders. If a security holder recommends a director candidate to the Governance Committee, however, the Governance Committee will consider the candidate and apply the same considerations that it would to its own candidates. The recommendation of a candidate by a security holder should be made in writing, addressed to the attention of the Governance Committee at the Company’s corporate headquarters. The recommendation should include a description of the candidate’s background, his or her contact information, and any other information the security holder considers useful and appropriate for the Governance Committee’s consideration of the candidate. The criteria which have been established by the Governance Committee as bearing on the consideration of a candidate’s qualification to serve as a Director include the following: the candidate’s ethics, integrity, involvement in the community, success in business, relationship with the Bank, investment in the Company, place of residence (i.e., proximity to the Bank’s market area), and financial expertise.
The Governance Committee met two times during fiscal year 2007.
A copy of the Company’s Governance Committee Charter, which contains the Company’s and the Bank’s compensation policies and nomination policies, is reviewed annually and amended as needed, by the Committee. Shareholders may obtain a copy of the charter of the Governance Committee at no cost by requesting one from the Company’s Secretary at P.O. Box 467, Newton, North Carolina 28658-0467.
Compensation Committee. The Company’s Compensation Committee is responsible for reviewing the Bank’s salary programs and recommendations to the Company’s and the Bank’s board of directors regarding compensation of the executive officers. Upon recommendation from the Compensation Committee, the Company’s Board of Directors ultimately determines such compensation. See the discussion under Compensation Discussion and Analysis for more information on the functions and activities of the Compensation Committee.
9
REPORT OF THE COMPENSATION COMMITTEE
The Board of Directors has reviewed and discussed the Compensation and Analysis presented by the Compensation Committee with management of the Company. Based on these reviews and discussions, the Board of Directors recommends including the Compensation Disclosure and Analysis in the Company’s Proxy Statement and Annual Report on Form 10-K.
Robert C. Abernethy | John W. Lineberger, Jr. | ||
Larry E. Robinson | James S. Abernethy | ||
William G. Terry | Dan Ray Timmerman, Sr. |
Executive Committee. The Executive Committee performs duties as assigned by the full Board of Directors. Actions taken by the Executive Committee must be approved by the full Board. The Executive Committee consists of Directors R. Abernethy, J. Abernethy, Lineberger, Matthews and Howard, as well as Mr. Wolfe, the President and Chief Executive Officer of the Company. It meets on an “as needed” basis and met two times during 2007.
Audit Committee. The Company has a separately designated standing audit committee which was established in accordance with Section 3(a)(58)(A) of the Exchange Act. The Committee has a written charter which is reviewed annually, and amended as needed, by the Committee. A copy of the Audit Committee Charter is available on the Bank’s website (www.peoplesbanknc.com) under Investor Relations. The Audit Committee consists of Directors R. Abernethy, Howard, Matthews, Price, Timmerman and Zachary. The Board of Directors has determined that these members are independent as that term is defined in Rule 4200(a)(15) of the NASDAQ’s listing standards.
The Board of Directors has determined that each member of the Audit Committee named above qualifies as an “audit committee financial expert” based on each of the member’s educational background and business experience.
The Audit Committee meets at least quarterly and, among other responsibilities, oversees (i) the independent auditing of the Company; (ii) the system of internal controls that management has established; and (iii) the quarterly and annual financial information to be provided to shareholders and the Securities and Exchange Commission. The Audit Committee met eight times during the fiscal year ended December 31, 2007.
REPORT OF AUDIT COMMITTEE
The Audit Committee has reviewed and discussed the audited financial statements with management of the Company and has discussed with the independent auditors the matters required to be discussed by SAS 61 as amended (AICPA, Professional Standards, Vol. 1 AV section 380), as adopted by the Public Company Accounting Oversight Board in Rule 3200T. In addition, the Committee has received the written disclosures and the letter from the independent accountants required by Independence Standards Board Standard No. 1 as adopted by the Public Company Accounting Oversight Board in Rule 3600T, and has discussed with the independent accountant the independent accountant’s independence. Based upon these reviews and discussions, the Committee recommended to the Board of Directors that the audited financial statements be included in the Company’s Annual Report on Form 10-K for the fiscal year ended December 31, 2007.
Robert C. Abernethy | Douglas S. Howard | ||
Benjamin I. Zachary | Dan R. Timmerman, Sr. | ||
Gary E. Matthews | Dr. Billy L. Price, Jr. |
10
How can you communicate with the Board or its members?
We do not have formal procedures for shareholder communication with our Board. In general, our directors and officers are easily accessible by telephone, postal mail or e-mail. Any matter intended for your Board, or any individual director, can be directed to Tony Wolfe, our President and Chief Executive Officer or Joe Lampron, our Chief Financial Officer, at our principal executive offices 518 West C Street, Newton, North Carolina 28658. You also may direct correspondence to our Board, or any of its members, in care of the Company at the foregoing address. Your communication will be forwarded to the intended recipient unopened.
What is our policy for director attendance at Annual Meetings?
Although it is customary for all of our directors to attend Annual Meetings of Shareholders, we have no formal policy in place requiring attendance. All Board members attended our 2007 Annual Meeting of Shareholders held on May 3, 2007.
How can a shareholder nominate someone for election to the Board?
Our Bylaws provide that in order to be eligible for consideration at the Annual Meeting of Shareholders, all nominations of directors, other than those made by the Nominating Committee or the Board of Directors, must be in writing and must be delivered to the Secretary of the Company not less than fifty days nor more than ninety days prior to the meeting at which such nominations will be made; provided, however, that if less than sixty days' notice of the meeting is given to the shareholders, such nominations must be delivered to the Secretary of the Company not later than the close of business on the tenth day following the day on which the notice of meeting was mailed.
The Board may disregard any nominations that do not comply with these requirements. Upon the instruction of the Board, the inspector of voting for the Annual Meeting may disregard all votes cast for a nominee if the nomination does not comply with these requirements. Written notice of nominations should be directed to the Secretary of the Company.
Who serves on the Board of Directors of the Bank?
The Bank has ten directors currently serving on its board of directors, who are the same people who are currently Directors of the Company.
COMPENSATION DISCUSSION AND ANALYSIS
The following discussion provides an overview and analysis of our compensation program and policies with respect to our named executive officers. It is intended to help in understanding the detailed information provided in the compensation tables beginning on page 16 of this Proxy Statement.
Compensation Committee Members
All of the members of the Compensation Committee are independent as defined in Section 4200(a)(15) of the NASDAQ’s listing standards. The Board of Directors determines on an annual basis each director’s independence. The members of the Compensation Committee in fiscal year 2007 were Directors R. Abernethy, J. Abernethy, Lineberger, Robinson, Terry and Timmerman. The Compensation Committee is responsible for developing, implementing and maintaining the Company’s and the Bank’s compensation policies.
The Committee engages a compensation consultant to help evaluate the Company’s compensation design, process and decisions. Tony Wolfe, President and CEO of the Company and the Bank, makes recommendations to the Committee regarding the compensation of the executive officers. Mr. Wolfe participates in the deliberations, but not in the decisions, of the Committee regarding compensation of executive officers other than himself. He does not participate in the Committee’s discussion or decisions regarding his own compensation.
11
Objectives of Our Compensation Program
The overall objective of our compensation program is to align total compensation so that the individual executive believes it is fair and equitable and provides the highest perceived value to our shareholders and to that individual. In order to accomplish this overall objective, our compensation program is designed to: (i) attract the qualified executives necessary to meet our needs as defined by the Company’s strategic plans, and (ii) retain and motivate executives whose performance supports the achievement of our long-term plans and short-term goals.
Compensation Decision Process
As of December 2006, there is a separate Compensation Committee charged with the responsibility relating to the compensation of our executive officers. To assist in making its compensation decisions, the Committee retained a consulting firm in early 2007 but was unable to develop a comfortable working relationship with the firm. In September, 2007, the Committee retained Matthews Young Management Consulting (Matthews Young) to complete the review of elements of our compensation program and to identify its strengths and weaknesses. Matthews Young is a national strategy, organization and executive compensation consulting firm with a proprietary southeastern United States database that has expertise in several industries, including financial service institutions. For 2007, Matthews Young provided market data regarding compensation practices, including salary and non-cash and cash incentive awards, of the peer financial institutions to ensure that our executive officer compensation is competitive in the marketplace. The Company competes for executive talent with national and regional banks of similar scope of operations. As a result, the Committee determined that salary, target annual cash incentive awards and long-term incentive awards for our named executive officers should be comparable to those provided by a peer group of similar sized community banks. As described below in “Elements of Compensation,” we generally target the median of our peer group for the compensation of our named executive officers.
In December 2007, at the request of the Committee, Matthews Young conducted a review of total cash compensation provided to the named executive officers of banks in the following categories:
| · | Financial institutions in North Carolina, South Carolina and Georgia, using a regression analysis to compare to a $900 million bank, |
| · | United States financial institutions with average assets of $500 million to $1.9 billion, |
| · | United States community banks with average assets of $700 to $1.0 billion. |
Elements of Compensation
Our compensation program consists of the following elements: (i) base salary, (ii) annual cash incentive awards, (iii) long-term equity incentive awards, (iv) supplemental retirement plans, (v) deferred compensation and (vi) other executive benefits.
Base Salary. The salaries of our named executive officers are designed to provide a reasonable level of compensation that is affordable to the Company and fair to the executive. Salaries are reviewed annually, and adjustments, if any, are made based on the review of competitive salaries in our peer group, as well as an evaluation of the individual officer’s responsibilities, job scope, and individual performance. For example, we assess each officer’s success in achieving budgeted earnings and return ratios, business conduct and integrity, and leadership and team building skills.
Matthews Young and the Committee reviewed salaries of chief executive officers, chief financial officers, chief credit officers, chief operating officers and chief administrative officers available within the 2007 peer group described above. Based on this review, Matthews Young and the Committee determined that our named executive officers’ salaries were within a normal range around the median of comparable positions at comparable financial institutions. The 2007 base salaries for each of our named executive officers are reflected in the Summary Compensation table on page 18 of this Proxy Statement.
While we target the median base salary of peer companies, base salaries are managed within a range around the median. All salary increases reflect the Committee’s desire to maintain competitive compensation relative to the peer group.
12
Annual Cash Incentive Awards. We believe that annual cash incentive awards encourage our named executive officers to achieve short–term targets that are critical to achievement of our strategic plan. The following officers are eligible to receive annual cash incentive awards under our Management Incentive Plan, which provides for cash awards to participants upon achievement of certain financial objectives:
| · | Tony W. Wolfe, President and Chief Executive Officer |
| · | A. Joseph Lampron, Executive Vice President and Chief Financial Officer |
| · | Lance A. Sellers, Executive Vice President and Chief Credit Officer |
| · | William D. Cable, Sr., Executive Vice President and Chief Operating Officer |
| · | Joseph F. Beaman, Jr., Executive Vice President, Chief Administrative Officer and Corporate Secretary |
We seek to ensure that a significant portion of each executive officer’s total annual cash compensation is linked to the attainment of the annual performance objectives determined by the executive officer and the Committee under the Management Incentive Plan.
Financial Performance Objectives. For 2007, the award for Mr. Wolfe was based on return on assets (ROA), earnings per share (EPS) and return on equity (ROE). The awards for Messrs. Lampron, Sellers, Cable and Beaman included the same ROA, EPS and ROE goals along with other measures specific to their areas of responsibility. Mr. Lampron, Sellers and Cable’s objectives included goals for net interest margin, efficiency ratio and core earnings. Mr. Sellers’ objectives also included goals for credit quality, loan production and fee income. Mr. Beaman’s objectives included performance goals for Peoples Investment Services, Inc., a subsidiary of Peoples Bank.
These performance objectives represent those metrics that we believe are necessary for the long-term growth of a high performing community bank and are agreed upon by management and the Board of Directors as part of the annual strategic planning process. ROA, EPS and ROE ratios measure our success in providing profits and returns to our shareholders. Net interest margin is a measure of the effectiveness of our asset/liability management efforts. The efficiency ratio, which reflects the ratio of noninterest expenses to the sum of net interest income and noninterest income, is an industry measure that indicates the amount of cost needed to provide $1 of revenue and is a measure of our efficiency in revenue production.
Target Levels of Performance. In addition to determining the financial measures under the Annual Incentive Plan, the Committee also determines the level of performance under those measures necessary for an award to pay out under the Annual Incentive Plan. The Committee selects “minimum,” “target” and “superior” levels of performance, which reflect the percentage by which the financial measure is achieved as measured against budget. The “minimum” level is generally about 10% below the “target” level. The “minimum” level represents the level that should be relatively easy for executives to attain in the current fiscal year. In order to receive any annual incentive award under the Annual Incentive Plan, the executive officers’ performance must exceed the “minimum.” Performance at or below “minimum” would result in no annual incentive awards being paid to the Company’s executive officers. The “target” level is equivalent to the level we have set in our annual operating budget. It represents an amount that is attainable under the assumptions used in our annual operating budget. If all objectives are met at this level, the executives’ bonus will be approximately 95% of the maximum amount. The “superior” level is typically 10% greater than the “target” level, and therefore greater than the level the Company anticipates achieving in our annual operating budget. This level represents a “stretch” goal. In the past five years, there was one year (2003) where no incentive was paid, two years where the incentive was paid at or near the target (2004 and 2005) and two years (2006 and 2007) where the “superior” level was achieved.
For 2007, Messrs. Wolfe, Lampron, Sellers, Cable and Beaman were granted incentive awards under the Management Incentive Plan under which they were eligible to earn a cash payout equal to a percentage of the median salary for their individual salary grade, based upon the level of performance against the incentive goals described above. The following table reflects the dollar range of potential payouts for 2007.
13
| Wolfe | Lampron | Sellers | Cable | Beaman | |
| Minimum Level of Performance | $106,026 | $44,239 | $56,789 | $44,239 | $37,586 |
| Target Level of Performance | $125,905 | $52,533 | $67,436 | $52,533 | $44,633 |
| Superior Level of Performance | $132,532 | $55,298 | $70,986 | $55,298 | $46,982 |
In early 2008, after reviewing the year-end financial reports, the Committee determined that our named executive officers earned awards which approximated the following percentages of their individually targeted award: Mr. Wolfe, 85%; Mr. Lampron, 90%: Mr. Sellers, 95%: Mr. Cable, 95% and Mr. Beaman, 93%. Awards earned in 2007 by each of our named executive officers pursuant to the financial performance component of the Annual Incentive Plan are reflected in the Non-Equity Incentive Compensation column of the Summary Compensation table on page 18 of this Proxy Statement.
Discretionary Bonus and Service Awards. From time to time the Compensation Committee may recommend to the Board that additional bonuses be paid based on superior accomplishments during the fiscal year. These bonuses are totally discretionary as to who will receive a bonus and the amount of any such bonus. No discretionary bonuses were awarded in 2007. The Bank gives service awards to each employee and director for every five years of service with the Bank to promote longevity of service for both directors and employees. Service awards are made in the form of shares of the Company’s common stock. The number of shares awarded increases with the number of years of service to the Bank.
Long-Term Equity Incentive Awards. The Company maintains the 1999 Omnibus Stock Ownership and Long Term Incentive Plan (“Omnibus Plan”), under which it is permitted to grant incentive stock options, restricted stock grants, stock appreciation rights and performance units. The purpose of the Omnibus Plan is to promote the interests of the Company by attracting and retaining employees of outstanding ability and to provide executives of the Company greater incentive to make material contributions to the success of the Company by providing them with stock-based compensation which will increase in value based upon the market performance of the common stock and/or the corporate achievement of financial and other performance objectives. No options were granted to any executive officer in 2007. The Compensation Committee is reviewing the use of long-term equity incentives, with the intent to associate the vesting of awards to the achievement of selected financial performance goals.
Under the terms of the Omnibus Plan, option exercise prices are always based upon the closing trading price of the Company’s common stock on the date of grant by the Board of Directors.
Other Executive Benefits - Perquisites. The Company provides the following to our named executive officers:
| · | country club memberships and dues; |
| · | expenses for spouses to attend conferences; and |
| · | personal use of Company-provided cell phones. |
Mr. Wolfe is also provided the use of a company-owned vehicle.
The aggregate cost of the above-mentioned perquisites does not equal $10,000 for any of the Company’s named executive officers.
For 2007, we determined the level of perquisites and benefits to offer based on information gathered by Matthews Young and the Committee’s review of other financial institutions in our market area. We believe these perquisites serve a dual purpose. They are competitive with companies in our peer group, and they also facilitate the officer’s ability to work outside our corporate headquarters by assisting with travel and providing an external location to conduct business.
Other Executive Benefits - Retirement Benefits. The Company maintains supplemental executive retirement agreements (SERPs) for the benefit of Messrs. Wolfe, Lampron, Sellers, Cable and Beaman. The Committee’s goal is to provide competitive retirement benefits given the restrictions on executives within tax-qualified plans. The Committee worked with Matthews Young in analyzing the possible benefits of using SERPs to address the issues of internal and external equity in terms of retirement benefits offered to all employees at the Company as a percentage of final average pay and executives in our peer group. The Committee approved supplemental retirement benefits targeting 40% of the
14
final average pay for all named executive officers. The Committee selected a target of 40% to match such benefits offered to other employees fully participating in qualified retirement plans offered by the Company. For more information on the SERPs, see page 30 of this Proxy Statement.
Other Executive Benefits - Severance Benefits. The Company has employment agreements with our named executive officers which provide, among other things, for severance benefits upon certain types of employment terminations. We believe employment agreements serve a number of functions, including (i) retention of our executive team; (ii) mitigation of any uncertainty about future employment and continuity of management in the event of a change in control; and (iii) protection of the Company and customers through non-compete and non-solicitation covenants. Additional information regarding the employment agreements, including a description of key terms and a quantification of benefits that would have been received by our named executive officers had they incurred a termination of employment on December 31, 2007, may be found on page 20 of this Proxy Statement.
Tax Deductibility of Executive Compensation. Section 162(m) of the Internal Revenue Code of 1986, as amended, places a limit of $1,000,000 on the amount of compensation that the Company may deduct in any one year with respect to each of its five most highly paid executive officers. Thus far, none of our named executive officers have received compensation in excess of the Section 162(m) limitation and, therefore, all compensation has been fully deductible.
Compensation Committee Interlocks and Insider Participation
No member of the Compensation Committee is now, or formerly was, an officer or employee of the Company or the Bank. None of the named executive officers serves as a member of the board of directors of another entity whose executive officers or directors serve on the Company’s Board of Directors.
EXECUTIVE COMPENSATION AND BENEFITS
Director Compensation
Directors’ Fees. Members of the Board of Directors receive no fees or compensation for their service. However, all members of the Board of Directors are also directors of the Bank and are compensated for that service. Directors receive a fee of $750 for each Bank board of directors meeting attended. An additional fee of $500 is paid to committee members for each committee meeting attended. In addition to these meeting fees, each director also received an annual retainer of $9,000. The Chairman of the Bank’s board of directors receives as additional $250 per meeting attended and the chairpersons of each committee receive an additional $150 per meeting attended. Directors who are members of the board of directors of Real Estate Advisory Services, Inc., and Peoples Investment Services, Inc., subsidiaries of the Bank, received $500 per board meeting.
The Bank maintains a Service Recognition Program, under which directors, officers and employees are eligible for awards. Under this Program, directors, officers and employees are awarded a combination of common stock of the Company and cash, with the amount of the award based upon the length of service to the Bank. Any common stock awarded under the Program is purchased by the Bank on the open market, and no new shares are issued by the Company under the Service Recognition Program.
Directors’ Stock Benefits Plan. Members of the Board of Directors are eligible to participate in the Company’s Omnibus Stock Ownership and Long Term Incentive Plan (the “Omnibus Plan”). Each director has been awarded 9,737 book value shares (adjusted to reflect 10% stock dividends on April 24, 2000, March 16, 2005, and June 16, 2006 and a three-for-two stock split on June 15, 2007, as appropriate) under the Omnibus Plan. Directors J. Abernethy, R. Abernethy, Robinson, Timmerman and Zachary were awarded book value shares on September 28, 1999. The book value of the common stock on September 28, 1999, was $6.31 (as adjusted). These book value shares are now fully vested. Director Matthews was awarded book value shares upon his election to the Board of Directors on May 3, 2001. The book value of the common stock on May 3, 2001, was $7.69 (as adjusted). Mr. Matthews’ book value shares are now fully vested. Directors Howard, Lineberger, Price and Terry were awarded book value shares on May 6, 2004. The book value of the common stock on May 6, 2004, was $8.64 (as adjusted). Their shares vest at a rate of 20% annually, with the first 20% vesting on May 6, 2005, and the final 20% vesting on May 6, 2009.
Directors’ Deferred Compensation Plan. In January 2002, the Bank established a non-qualified deferred compensation plan for all of its directors. The Bank’s directors are also directors of the Company. Under this plan, each
15
director may defer all or a portion of his fees to the plan each year. The director may elect to invest the deferred compensation in a restricted list of eleven investment funds. The Bank may make matching contributions to the plan for the benefit of the director from time to time at the discretion of the Bank. Directors are fully vested in all amounts they contribute to the plan and in any amounts contributed by the Bank. The Bank has established a Rabbi Trust to hold the directors’ accrued benefits under the plan. Plan assets are invested as directed by each director. There are no “above-market” returns provided for in this Plan.
Benefits under the plan are payable in the event of the director’s death, resignation, removal, failure to be re-elected, retirement or in cases of hardship. Directors may elect to receive deferred compensation payments in one lump sum or in installments.
Directors’ Supplemental Retirement Plan. In January 2002, the Bank implemented a non-qualified supplemental retirement benefits plan for all its directors. The plan is designed to provide a retirement benefit to the directors while at the same time minimizing the financial impact on the Bank’s earnings. Under the Plan, the Company purchased life insurance contracts on the lives of each director. The increase in cash surrender value of the contracts constitutes the Company’s contribution to the plan each year. The Bank will pay annual benefits to each director for 15 years beginning upon retirement from the Board of Directors. The Bank is the sole owner of all of the insurance contracts.
The following table reports all forms of compensation paid to or accrued for the benefit of each director during the 2007 fiscal year.
DIRECTOR COMPENSATION
| Name | Fees Earned or Paid in Cash ($) | Stock Awards ($) 1 | Option Awards ($) | Non-Equity Incentive Plan Compensation ($) | Change in Pension Value and Nonqualified Deferred Compensation Earnings2 | All Other Compensation ($) | Total ($) |
| (a) | (b) | (c) | (d) | (e) | (f) | (g) | (h) |
James S. Abernethy3 | $30,600 | $16,319 | 0 | 0 | $1,457 | 0 | $48,376 |
| Robert C. Abernethy | $39,750 | $15,044 | 0 | 0 | $2,409 | 0 | $57,203 |
| Douglas S. Howard | $29,250 | $17,104 | 0 | 0 | $1,316 | 0 | $47,670 |
| John W. Lineberger, Jr. | $30,300 | $17,104 | 0 | 0 | $3,813 | 0 | $51,217 |
| Gary E. Matthews | $25,550 | $15,043 | 0 | 0 | $1,292 | 0 | $41,885 |
| Billy L. Price, Jr., M.D. | $25,300 | $17,104 | 0 | 0 | $1,838 | 0 | $44,242 |
| Larry E. Robinson | $30,050 | $15,044 | 0 | 0 | $4,914 | 0 | $50,008 |
| William Gregory Terry | $29,550 | $17,104 | 0 | 0 | $474 | 0 | $47,128 |
| Dan Ray Timmerman, Sr. | $36,650 | $15,044 | 0 | 0 | $4,318 | 0 | $56,012 |
| Benjamin I. Zachary | $26,550 | $15,044 | 0 | 0 | $1,320 | 0 | $42,914 |
1 Stock awards represent the expense accrued by the Bank for each director under the Omnibus Stock Ownership and Long Term Incentive Plan as described on page 16, “Directors’ Stock Benefits Plan.”
2 Change in Pension Value and Nonqualified Deferred Compensation Earnings represents the expense accrued by the Bank for each director under the Directors’ Supplemental Retirement Plan as described on page 16, “Directors’ Supplemental Retirement Plan.”
3 Mr. Abernethy completed 15 years of service with the Bank in 2007. He received a service award of 60 shares of the Company’s common stock and cash for a total value of $1,275 on the grant date.
16
Executive Officers
The following table sets forth certain information with respect to the persons who are executive officers of either the Company or the Bank, or both.
Name | Age on December 31, 2007 | Positions and Occupations During Last Five Years | Employed by the Company or the Bank Since |
Tony W. Wolfe | 61 | President and Chief Executive Officer of the Company and the Bank | 1990 |
Joseph F. Beaman, Jr. | 58 | Executive Vice President and Corporate Secretary of the Company; Executive Vice President, Chief Administrative Officer and Secretary of the Bank | 1977 |
William D. Cable, Sr. | 39 | Executive Vice President and Assistant Corporate Treasurer of the Company; Executive Vice President and Chief Operating Officer of the Bank; Prior to 2002, Bank Senior Vice President - Information Services. | 1995 |
Lance A. Sellers | 45 | Executive Vice President and Assistant Corporate Secretary of the Company; Executive Vice President and Chief Credit Officer of the Bank. | 1998 |
A. Joseph Lampron | 53 | Executive Vice President, Chief Financial Officer and Corporate Treasurer of the Company; Executive Vice President and Chief Financial Officer of the Bank. | 2001 |
Management Compensation
The executive officers of the Company are not paid any cash compensation by the Company. However, the executive officers of the Company also are executive officers of the Bank and receive compensation from the Bank.
The table on the following page shows, for the fiscal years ended December 31, 2007, 2006 and 2005, the cash compensation received by, as well as certain other compensation paid or accrued for those years, the Bank’s Chief Executive Officer and the Bank’s executive officers whose total annual salary and bonus exceeded $100,000.
17
| Summary Compensation Table | |||||||||||
| Change in | |||||||||||
| Pension Value | |||||||||||
| and Nonqualified | |||||||||||
| Non-Equity | Deferred | ||||||||||
| Stock | Option | Incentive Plan | Compensation | All Other | |||||||
| Year | Salary | Bonus | Awards | Awards | Compensation | Earnings | Compensation(1) | Total | |||
| (a) | (b) | (c) | (d) | (e) | (f) | (g) | (h) | (i) | (j) | ||
| Tony W. Wolfe | 2007 | $243,269 | $0 | $0 | $0 | $111,526 | $123,811 | $23,374 | 2 | $501,980 | |
| President and Chief | 2006 | $227,255 | $0 | $0 | $0 | $97,043 | $108,610 | $21,072 | $453,980 | ||
| Executive Officer | 2005 | $215,994 | $0 | $0 | $0 | $68,019 | $93,551 | $19,046 | $396,610 | ||
| A. Joseph Lampron, Jr. | 2007 | $136,253 | $0 | $0 | $0 | $49,271 | $13,454 | $11,343 | 3 | $210,321 | |
| Executive Vice President, | 2006 | $128,069 | $0 | $325 | 7 | $0 | $52,908 | $11,684 | $12,007 | $204,993 | |
| Chief Financial Officer | 2005 | $122,758 | $0 | $0 | $0 | $40,210 | $10,121 | $9,696 | $182,785 | ||
| Joseph F. Beaman, Jr. | 2007 | $119,269 | $0 | $5,000 | 8 | $0 | $43,257 | $17,037 | $12,024 | 4 | $196,587 |
| Executive Vice President, | 2006 | $114,899 | $0 | $0 | $0 | $50,792 | $14,789 | $12,520 | $193,000 | ||
| Chief Administrative Officer | 2005 | $113,004 | $0 | $0 | $0 | $28,549 | $12,792 | $10,573 | $164,918 | ||
| and Corporate Secretary | |||||||||||
| Lance A. Sellers | 2007 | $173,198 | $0 | $0 | $0 | $66,762 | $10,555 | $14,693 | 5 | $265,208 | |
| Executive Vice President, | 2006 | $163,836 | $0 | $0 | $0 | $61,432 | $9,208 | $13,542 | $248,018 | ||
| Chief Credit Officer | 2005 | $156,919 | $0 | $0 | $0 | $47,985 | $7,986 | $12,106 | $224,996 | ||
| William D. Cable, Sr. | 2007 | $139,751 | $0 | $0 | $0 | $52,008 | $3,303 | $11,701 | 6 | $206,763 | |
| Executive Vice President, | 2006 | $132,231 | $0 | $0 | $0 | $52,908 | $2,878 | $10,609 | $198,626 | ||
| Chief Operating Officer | 2005 | $127,211 | $0 | $0 | $0 | $40,210 | $2,495 | $10,214 | $180,130 | ||
1 Perquisites for the fiscal year did not exceed $10,000 as reported for the named employee. |
2 For Mr. Wolfe, includes for 2007:$11,212 under the 401(k) plan, $3,469 premium paid for group term life insurance in excess of $50,000 and $1,812 paid for the Split Dollar Death Benefit; for 2006: $10,764 under the 401(k) plan, $3,247 premium paid for group term life insurance in excess of $50,000 and $1,719 paid for the Split Dollar Death Benefit; for 2005: $10,000 under the 401(k) plan, $1,992 premium paid for group term life insurance in excess of $50,000 and $1,668 paid for the Split Dollar Death Benefit. |
3 For Mr. Lampron, includes for 2007: $7,347 under the 401(k) plan, $618 premium for the group term life insurance in excess of $50,000 and $329 paid for the Split Dollar Death Benefit; for 2006: $7,738 under the 401(k) plan, $574 premium for the group term life insurance in excess of $50,000 and $311 paid for the Split Dollar Death Benefit; 2005: $6,109 under the 401(k) plan, $541 premium for the group term life insurance in excess of $50,000 and $296 paid for the Split Dollar Death Benefit. |
18
4 For Mr. Beaman, includes for 2007: $6,084 under the 401(k) plan, $980 premium for the group term life insurance in excess of $50,000 and $339 paid for the Split Dollar Death Benefit; for 2006: $7,236 under the 401(k) plan, $939 premium for the group term life insurance in excess of $50,000 and $325 paid for the Split Dollar Death Benefit; 2005: $5,711 under the 401(k) plan, $918 premium for the group term life insurance in excess of $50,000 and $308 paid for the Split Dollar Death Benefit. |
5 For Mr. Sellers, includes for 2007: $8,643 under the 401(k) plan, $536 premium for the group term life insurance in excess of $50,000 and $308 paid for the Split Dollar Death Benefit; for 2006: $8,216 under the 401(k) plan, $336 premium for the group term life insurance in excess of $50,000 and $151 paid for the Split Dollar Death Benefit; 2005:$7,869 under the 401(k) plan, $319 premium for the group term life insurance in excess of $50,000 and $138 paid for the Split Dollar Death Benefit. |
6 For Mr. Cable, includes for 2007: $7,327 under the 401(k) plan, $251 premium paid for group term life insurance in excess of $50,000 and $104 paid for the Split Dollar Death Benefit; for 2006: $6,627 under the 401(k) plan and a $233 premium paid for group term life insurance in excess of $50,000 and $76 paid for the Split Dollar Death Benefit; 2005: $6,343 under the 401(k) plan and a $222 premium paid for group term life insurance in excess of $50,000 and $73 paid for the Split Dollar Death Benefit. |
7 Mr. Lampron completed five years of service with the Bank in 2006. He received a service award of eight shares of the Company’s common stock and cash for a total value on the grant date of $325. |
8 Mr. Beaman completed thirty years of service with the Bank in 2007. He received a service award of 241 shares of the Company’s common stock and cash for a total value on the grant date of $5,000. |
19
Employment Agreements
The Bank has entered into employment agreements with Tony W. Wolfe, President and Chief Executive Officer; Joseph F. Beaman, Jr., Executive Vice President, Chief Administrative Officer and Corporate Secretary; Lance A. Sellers, Executive Vice President, Chief Credit Officer and Assistant Corporate Secretary; A. Joseph Lampron, Executive Vice President, Chief Financial Officer and Corporate Treasurer; and William D. Cable, Sr., Executive Vice President, Chief Operating Officer and Assistant Corporate Treasurer, in order to establish their duties and compensation and to provide for their continued employment with the Bank. The agreements provide for an initial term of employment of three years. Commencing on the first anniversary date and continuing on each anniversary date thereafter, unless notice of a non-extension is given by either party, each agreement is automatically extended for an additional year so that the remaining term shall always be no less than two and no more than three years. The agreements also provide that the base salary shall be reviewed by the Board of Directors not less often than annually. In addition, the employment agreements provide for discretionary bonuses and participation in other management incentive, pension, profit-sharing, medical or retirement plans maintained by the Bank, as well as fringe benefits normally associated with such employee’s office. Mr. Wolfe’s agreement provides for a company automobile. The employment agreements provide that they may be terminated by the Bank for cause, as defined in the agreements, and that they may otherwise be terminated by the Bank (subject to vested rights) or by the employee.
In the event of a change in control, the term of the employment agreements shall be automatically extended for three years from the date of the change of control. For purposes of the employment agreement, a change in control generally will occur if (i) any “person” (as such term is used in Section 13(d) and 14(d) of the Exchange Act), other than a person who beneficially owned as of January 1, 1998, more than 5% of the Bank’s securities, acquires beneficial ownership of voting stock and irrevocable proxies representing 20% or more of any class of voting securities of either the Company or the Bank, (ii) the election of directors constituting more than one-half of the Board of Directors of the Company or the Bank who, prior to their election, were not nominated for election or approved by at least three-fourths of the Board of Directors of the Company as then constituted; (iii) either the Company or the Bank consolidates or merges with or into another corporation, association or entity or is otherwise reorganized, where neither the Company nor the Bank, respectively, is the surviving corporation in the transaction; or (iv) all or substantially all of the assets of either the Company or the Bank are sold or otherwise transferred to or acquired by any other entity or group.
In addition, the employee may voluntarily terminate his employment at any time following a change in control and continue to receive his base salary for the remainder of the term of the employment agreement, if, after the change in control, (i) the employee is assigned duties and/or responsibilities that are inconsistent with his position prior to the change in control or that are inconsistent with his reporting responsibilities at that time, (ii) the employee’s compensation or benefits are reduced, or (iii) the employee is transferred, without his consent, to a location which is an unreasonable distance from his current principal work location.
If there had been a change in control of the Company, or Mr. Wolfe had terminated his employment after a change in control, that was effective as of December 31, 2007, Mr. Wolfe would have been entitled to receive $1,108,162 under the terms of his employment agreement.
If there had been a change of control, or any voluntary termination of employment following a change in control under the terms of their respective employment agreements, Mr. Lampron would have been entitled to receive $597,371; Mr. Beaman, $529,837; Mr. Sellers $756,561; and Mr. Cable, $612,810.
An additional thirteen (13) middle management officers had employment agreements during 2007. The term of these agreements is until December 1, 2008, renewed annually and the agreements contain provisions similar to those discussed above.
Equity Compensation Plan Information
The following table presents the number of shares of Company common stock to be issued upon the exercise of outstanding options, warrants and rights; the weighted-average price of the outstanding options, warrants and rights and the number of options, warrants and rights remaining that may be issued under the Company’s Omnibus Plan described below.
20
The following table presents the number of shares of Company common stock to be issued upon the exercise of outstanding options, warrants and rights; the weighted-average price of the outstanding options, warrants and rights and the number of options, warrants and rights remaining that may be issued under the Company’s Omnibus Plan described below.
Plan Category | Number of securities to be issued upon exercise of outstanding options, warrants and rights | Weighted-average exercise price of outstanding options, warrants and rights | Number of securities remaining available for future issuance under equity compensation plans (excluding securities reflected in column (a)) |
(a) | (b) | (c) | |
Equity compensation plans approved by security holders | 195,7251,2 | $8.383 | 636,6874 |
Equity compensation plans not approved by security holders | 0 | $0 | 0 |
Total | 195,7251,2 | $8.383 | 636,6874 |
| 1 | Includes 192,725 stock options issued under the 1999 Omnibus Plan, which are fully vested as of December 31, 2007. Of the outstanding stock options, options to purchase a total of 18,350 shares of the common stock were granted on September 28, 1999; 20,984 options were granted on September 25, 2000; 64,399 options were granted on October 30, 2001; 7,510 options were granted on December 18, 2001; 75,431 options were granted on December 17,2002; 3,630 options were granted on May 6, 2004; and 2,421 options were granted on December 16, 2004. |
| 2 | Includes 3,000 shares of restricted stock granted on September 20, 2007 under the 1999 Omnibus Plan. These restricted stock grants cliff vest three years after issuance. |
| 3 | The exercise prices for the grants of stock options under the 1999 Omnibus Plan on September 28, 1999; September 25, 2000; October 30, 2001; December 18, 2001; December 17, 2002; May 6, 2004 and December 16, 2004 are: $9.02 (as adjusted due to a 10% stock dividend granted on April 24, 2000); $6.99; $8.78; $8.10; $7.77; $10.31; and $10.57, respectively. All prices and shares have been adjusted for the 10% stock dividends paid March 16, 2005 and June 16, 2006 and the three-for-two stock split paid June 15, 2007. The exercise price for the grants of restricted stock is $17.40. |
| 4 | The number of securities remaining available for future issuance under equity compensation plans (excluding securities reflected in column (a)) reflects 390,000 additional shares approved May 3, 2007, which have been restated to 585,000 additional shares to reflect the three-for-two stock split paid June 15, 2007. |
Omnibus Stock Ownership and Long Term Incentive Plan
The Board of Directors implemented the Omnibus Plan which was approved by the Company’s shareholders on May 13, 1999. Last year, shareholders approved Amendment No. 1 to the Company’s Omnibus Stock Option and Long Term Incentive Plan (the “Omnibus Plan”), which provided for 585,000, adjusted for the three-for-two stock split on June 4, 2007 shares of the Company’s common stock to be added to the 1999 Omnibus Plan. These shares underlie Rights which may be granted under the Omnibus Plan. On March 20, 2008, the Board of Directors amended the 1999 Omnibus Plan to bring it into compliance with 409A of the Internal Revenue Code of 1986, as amended. Under the terms of the 1999 Omnibus Plan, these amendments did not require shareholder approval. The 1999 Omnibus Plan will expire in 2009.
General. The purpose of the Omnibus Plan is to promote the interests of the Company by attracting and retaining directors and employees of outstanding ability and to provide executive and other key employees of the Company and its subsidiaries greater incentive to make material contributions to the success of the Company by providing them with stock-based compensation which will increase in value based upon the market performance of the common stock and/or the corporate achievement of financial and other performance objectives.
21
The Omnibus Plan will be administered by the Governance Committee of the Board of Directors (the “Committee”). Subject to the terms of the Omnibus Plan, the Committee and the Board of Directors have authority to construe and interpret, for eligible employees and eligible directors, respectively, the Omnibus Plan, to determine the terms and provisions of Rights (as defined below) to be granted under the Omnibus Plan, to define the terms used in the Omnibus Plan and in the Rights granted thereunder, to prescribe, amend and rescind rules and regulations relating to the Omnibus Plan, to determine the individuals to whom and the times at which Rights shall be granted and the number of shares to be subject to, or to underlie, each Right awarded, and to make all other determinations necessary or advisable for the administration of the Omnibus Plan.
Rights Which May Be Granted. Under the Omnibus Plan, the Committee may grant or award eligible participants Options, rights to receive restricted shares of common stock, long term incentive units (each equivalent to one share of common stock), SARs, and/or Book Value Shares. These grants and awards are referred to herein as the “Rights.” Any Rights that the Governance Committee grants must be awarded by March 30, 2009, the tenth anniversary of the date the Board of Directors adopted the Omnibus Plan. Any Rights not granted are forfeited.
Options. Options granted under the Omnibus Plan to eligible directors and employees may be either incentive stock options (“ISOs”) or non-qualified stock options (“NSOs”). The exercise price of an Option may not be less than 100% of the last-transaction price for the common stock quoted by the Nasdaq Global Market on the date of grant.
The Committee shall determine the expiration date of each Option granted, up to a maximum of ten years from the date of grant. In the Committee's discretion, it may specify the period or periods of time within which each Option will first become exercisable, which period or periods may be accelerated or shortened by the Committee.
Each Option granted will terminate upon the expiration date established by the Committee or upon the earlier of (i) twelve months after the holder ceases to be an eligible employee or director by reason of death or disability, and (ii) immediately as of the date the holder is no longer an eligible employee or director for any reason other than death or disability. In the event of a change in control (as that term is defined in the Omnibus Plan), any unvested options granted under the Omnibus Plan will immediately and automatically vest.
Restricted Stock. The Committee may award Rights to acquire shares of common stock subject to certain transfer restrictions (“Restricted Stock”) to eligible participants under the Omnibus Plan for such purchase price per share, if any, as the Committee, in its discretion, may determine appropriate. The Committee shall determine the expiration date for each Restricted Stock award, up to a maximum of ten years from the date of grant. In the Committee’s discretion, it may specify the period or periods of time within which each Restricted Stock award will first become exercisable, which period or periods may be accelerated or shortened by the Committee. Under the terms of the Omnibus Plan, the Committee also has the discretion to pay out awards of Restricted Stock in the Company’s common stock, cash or a combination of stock and cash.
Awards of Restricted Stock shall terminate in the same manner as described above in connection with the termination of Options.
Units. Under the Omnibus Plan, the Committee may grant to eligible directors and employees awards of long term incentive units, each equivalent in value to one share of common stock (“Units”). Except as otherwise provided, Units awarded may be distributed only after the end of a performance period of two or more years, as determined by the Committee, beginning with the year in which the awards are granted.
The percentage of the Units awarded that are to be distributed will depend on the level of financial and other performance goals achieved by the Company during the performance period. The Committee may adopt one or more performance categories in addition to, or in substitution for, a performance category or may eliminate all performance categories other than financial performance. All performance categories other than financial performance may not be applied in the aggregate as a factor of more than one against financial performance.
As soon as practicable after each performance period, the percentage of Units awarded that are to be distributed, based on the levels of performance achieved, will be determined and distributed to the recipients of such awards in the
22
form of a combination of shares of common stock and cash. Units awarded, but which the recipients are not entitled to receive, will be cancelled.
In the event of the death or disability of a Unit recipient prior to the end of any performance period, the number of Units awarded for such performance period will be reduced in proportion to the number of months remaining in the performance period after the date of death or disability; and the remaining portion of the award, if any, may, in the discretion of the Committee, be adjusted based upon the levels of performance achieved prior to the date of death or disability, and distributed within a reasonable time after death or disability. In the event a recipient of Units ceases to be an eligible director or employee for any reason other than death or disability, all Units awarded, but not yet distributed, will be cancelled.
In the event of a change in control (as that term is defined in the Omnibus Plan), any outstanding Units will immediately and automatically be reduced as appropriate to reflect a shorter performance period.
An amount equal to the dividend payable on one share of common stock (a “dividend equivalent credit”) will be determined and credited on the payment date to each Unit recipient’s account for each Unit awarded and not yet distributed or cancelled. Such amount will be converted within the account to an additional number of Units equal to the number of shares of common stock which could be purchased at the last-transaction price of the common stock on the Nasdaq Global Market on the dividend payment date.
No dividend equivalent credits or distribution of Units may be credited or made if, at the time of crediting or distribution, (i) the regular quarterly dividend on the common stock has been omitted and not subsequently paid or there exists any default in payment of dividends on any such outstanding shares of common stock; (ii) the rate of dividends on the common stock is lower than at the time the Units to which the dividend equivalent credit relates were awarded, adjusted for certain changes; (iii) estimated consolidated net income of the Company for the twelve-month period preceding the month the dividend equivalent credit or distribution would otherwise have been made is less than the sum of the amount of the dividend equivalent credits and Units eligible for distribution under the Omnibus Plan in that month plus all dividends applicable to such period on an accrual basis, either paid, declared or accrued at the most recently paid rate, on all outstanding shares of common stock; or (iv) the dividend equivalent credit or distribution would result in a default in any agreement by which the Company is bound.
If an extraordinary event occurs during a performance period which significantly alters the basis upon which the performance levels were established, the Committee may make adjustments which it deems appropriate in the performance levels. Such events may include changes in accounting practices, tax, financial institution laws or regulations or other laws or regulations, economic changes not in the ordinary course of business cycles, or compliance with judicial decrees or other legal requirements.
Stock Appreciation Rights. The Omnibus Plan provides that the Committee may award to eligible directors and employees Rights to receive cash based upon increases in the market price of common stock over the last transaction price of the common stock on the Nasdaq Market (the “Base Price”) on the date of the award. The Committee may adjust the Base Price of a SAR based upon the market value performance of the common stock in comparison with the aggregate market value performance of a selected index or at a stated annual percentage rate. The expiration date of a SAR may be no more than ten years from the date of award.
Each SAR awarded by the Committee may be exercisable immediately or may become vested over such period or periods as the Committee may establish, which periods may be accelerated or shortened in the Committee's discretion.
Each SAR awarded will terminate upon the expiration date established by the Committee, termination of the employment or directorship of the SAR recipient, or in the event of a change in control, as described above in connection with the termination of Options.
Book Value Shares. The Omnibus Plan provides that the Committee may award to eligible directors and eligible employees long term incentive units, each equivalent in value to the book value of one share of common stock on the date of award (“Book Value Shares”). The Committee shall specify the period or periods of time within which each Book Value Share will vest, which period or periods may be accelerated or shortened by the Committee. Upon
23
redemption, the holder of a Book Value Share will receive an amount equal to the difference between the book value of the common stock at the time the Book Value Share is awarded and the book value of the common stock at the time the Book Value Share is redeemed, adjusted for the effects of dividends, new share issuances, and mark-to-market valuations of the Company’s investment securities portfolio in accordance with FASB 115.
The expiration date of each Book Value Share awarded shall be established by the Committee, up to a maximum of ten years from the date of award. However, awards of Book Value Shares shall earlier terminate in the same manner as described above in connection with the termination of Options.
Adjustments. In the event the outstanding shares of the common stock are increased, decreased, changed into or exchanged for a different number or kind of securities as a result of a stock split, reverse stock split, stock dividend, recapitalization, merger, share exchange acquisition, or reclassification, appropriate proportionate adjustments will be made in (i) the aggregate number or kind of shares which may be issued pursuant to exercise of, or which underlie, Rights; (ii) the exercise or other purchase price, or Base Price, and the number and/or kind of shares acquirable under, or underlying, Rights; (iii) and rights and matters determined on a per share basis under the Omnibus Plan. Any such adjustment will be made by the Committee, subject to ratification by the Board of Directors. As described above, the Base Price of a SAR may also be adjusted by the Committee to reflect changes in a selected index. Except with regard to Units and Book Value Shares awarded under the Omnibus Plan, no adjustment in the Rights will be required by reason of the issuance of common stock, or securities convertible into common stock, by the Company for cash or the issuance of shares of common stock by the Company in exchange for shares of the capital stock of any corporation, financial institution or other organization acquired by the Company or a subsidiary thereof in connection therewith.
Any shares of common stock allocated to Rights granted under the Omnibus Plan, which Rights are subsequently cancelled or forfeited, will be available for further allocation upon such cancellation or forfeiture.
Federal Income Tax Consequences
Options. Under current provisions of the Code, the federal income tax treatment of ISOs and NSOs is different. Options granted to employees under the Omnibus Plan may be ISOs which are designed to result in beneficial tax treatment to the employee but not a tax deduction to the Company.
The holder of an ISO generally is not taxed for federal income tax purposes on either the grant or the exercise of the option. However, the optionee must include in his or her federal alternative minimum tax income any excess (the “Bargain Element”) of the acquired common stock’s fair market value at the time of exercise over the exercise price paid by the optionee. Furthermore, if the optionee sells, exchanges, gives or otherwise disposes of such common stock (other than in certain types of transactions) either within two years after the option was granted or within one year after the option was exercised (an “Early Disposition”), the optionee generally must recognize the Bargain Element as compensation income for regular federal income tax purposes. Any gain realized on the disposition in excess of the Bargain Element is subject to recognition under the usual rules applying to dispositions of property. If a taxable sale or exchange is made after such holding periods are satisfied, the difference between the exercise price and the amount realized upon the disposition of the common stock generally will constitute a capital gain or loss for tax purposes.
Options granted to directors under the Omnibus Plan would be “NSOs.” In general, the holder of an NSO will recognize at the time of exercise of the NSO, compensation income equal to the amount by which the fair market value of the common stock received on the date of exercise exceeds the sum of the exercise price and any amount paid for the NSO.
If an optionee exercises an ISO or NSO and delivers shares of common stock as payment for part or all of the exercise price of the stock purchased (the “Payment Stock”), no gain or loss generally will be recognized with respect to the Payment Stock; provided, however, if the Payment Stock was acquired pursuant to the exercise of an ISO, the optionee will be subject to recognizing as compensation income the Bargain Element on the Payment Stock as an Early Disposition if the exchange for the new shares occurs prior to the expiration of the holding periods for the Payment Stock.
24
The Company generally would not recognize gain or loss or be entitled to a deduction upon either the grant of an ISO or NSO or the optionee’s exercise of an ISO. The Company generally will recognize gain or loss or be entitled to a deduction upon the exercise of an NSO. If there is an Early Disposition, the Company generally would be entitled to deduct the Bargain Element as compensation paid to the optionee.
The above and other descriptions of federal income tax consequences are necessarily general in nature and do not purport to be complete. Moreover, statutory provisions are subject to change, as are their interpretations, and their application may vary in individual circumstances. Such descriptions may not be used to avoid any federal tax penalty. Such descriptions are written to support this proxy statement. Each taxpayer should seek advice based on the taxpayer’s particular circumstances from an independent tax advisor. Finally, the consequences under applicable state and local income tax laws may not be the same as under the federal income tax laws
Restricted Stock. Pursuant to Section 83 of the Code, recipients of Restricted Stock awards under the Omnibus Plan will recognize ordinary income in an amount equal to the fair market value of the shares of common stock granted to them at the time that the shares vest and become transferable. The Company will be entitled to deduct as a compensation expense for tax purposes the same amounts recognized as income by recipients of Restricted Stock awards in the year in which such amounts are included in income.
Units. The Company expects that participants generally will not be taxed on the award of Units. Instead, any cash and the then fair market value of any common stock received by the participants upon the distribution of a Unit generally will be taxable to the participants as compensation income upon such distribution. At that time, the Company generally will be entitled to claim a deduction in an amount equal to the compensation income.
SARs. Pursuant to Section 83 of the code, recipients of SARs under the Omnibus Plan will recognize, at the time a SAR award is exercised, ordinary income in an amount equal to the difference between the fair market value of the common stock at the time of award of the SAR and the fair market value of the common stock at the time that the SAR is exercised. The Company will be entitled to deduct as a compensation expense for tax purposes the same amounts recognized as income by recipients of SAR awards in the year in which such amounts are included in income.
Book Value Shares. The Company expects that participants generally will not be taxed on the award of Book Value Shares. Instead, any cash received by the participants upon redemption of the Book Value Shares generally will be taxable to the participant as compensation income upon distribution. At that time, the Company generally will be entitled to claim a deduction in an amount equal to the compensation income.
Incentive Compensation Plans
The Bank also has a Management Incentive Plan for officers and an Employee Incentive Plan for employees of the Bank. Eligibility under the Employee Incentive Plan is granted to all employees upon ninety (90) days of service with the Bank. Participants in the Employee Incentive Plan are entitled to receive quarterly cash incentives based upon a graduated schedule indexed to attainment of corporate budget. Participants in the Management Incentive Plan are recommended annually by the President and Chief Executive Officer to the Bank’s Board of Directors. Each individual’s incentive pool is determined by a formula which links attainment of corporate budget with attainment of individual goals and objectives. Incentives under the Management Incentive Plan are paid annually. More details about the Management Incentive Plan can be found in the Compensation and Disclosure Section of this Proxy Statement.
Grants of Plan-Based Awards. The following table gives information related to grants of plan-based awards made by the Company to the named executive officers during the 2007 fiscal year:
25
GRANTS OF PLAN-BASED AWARDS
| Name | Grant Date | Estimated Future Payouts Under Non- Equity Incentive Plan Awards | Estimated Future Payouts Under Equity Incentive Plan Awards | All Other Stock Awards: Number of Shares of Stock or Units (#) | All Other Option Awards: Number of Securities Under- lying Options (#) | Exercise or Base Price of Option Awards ($/Sh) | Grant Date Fair Value of Stock and Option'Awards | ||||
Threshold ($) | Target ($) | Maximum ($) | Threshold (#) | Target (#) | Maximum (#) | ||||||
| (a) | (b) | (c) | (d) | (e) | (f) | (g) | (h) | (i) | (j) | (k) | (l) |
| Tony W. Wolfe | 01/01/2007 | $106,026 | $125,905 | $132,532 | |||||||
| A. Joseph Lampron | 01/01/2007 | $44,239 | $52,533 | $55,298 | |||||||
| Joseph F. Beaman, Jr. | 01/01/2007 | $37,586 | $44,633 | $46,982 | |||||||
| Lance A. Sellers | 01/01/2007 | $56,789 | $67,436 | $70,986 | |||||||
| William D. Cable, Sr. | 01/01/2007 | $44,239 | $52,533 | $55,298 | |||||||
26
Outstanding Equity Awards at Fiscal Year End. The table below gives information related to equity awards held by the Company’s named executive officers at the end of fiscal year 2007:
OUTSTANDING EQUITY AWARDS AT FISCAL YEAR-END
| Option Awards | Stock Awards | ||||||||
| Name | Number of Securities Underlying Unexercised Options (#) Exercisable1 | Number of Securities Underlying Unexercised Options (#) Unexercisable | Equity Incentive Plan Awards: Number of Securities Underlying Unexercised Unearned Options (#) | Option Exercise Price ($) | Option Expiration Date | Number of Shares or Units of Stock That Have Not Vested (#) | Market Value of Shares or Units of Stock That Have Not Vested ($) | Equity Incentive Plan Awards: Number of Unearned Shares, Units or Other Rights That Have Not Vested (#) | Equity Incentive Plan Awards: Market or Payout Value of Unearned Shares, Units or Other Rights That Have Not Vested ($) |
| (a) | (b) | (c) | (d) | (e) | (f) | (g) | (h) | (i) | (j) |
| Tony W. Wolfe | 12,989 | $9.02 | 09/28/2009 | ||||||
| 17,048 | $8.78 | 10/30/2011 | |||||||
| 9,075 | $7.77 | 12/17/2012 | |||||||
| A. Joseph Lampron | 7,510 | $8.10 | 12/18/2011 | ||||||
| 10,890 | $7.77 | 12/17/2012 | |||||||
| Joseph F. Beaman, Jr. | 10,463 | $6.99 | 10/25/2010 | ||||||
| 9,041 | $8.78 | 10/30/2011 | |||||||
| 7,260 | $7.77 | 12/17/2012 | |||||||
| Lance A. Sellers | 2,379 | $9.02 | 09/28/2009 | ||||||
| 8,750 | $8.78 | 10/30/2011 | |||||||
| 12,705 | $7.77 | 12/17/2012 | |||||||
| William D. Cable, Sr. | 4,456 | $6.99 | 10/25/2010 | ||||||
| 6,387 | $8.78 | 10/30/2011 | |||||||
| 10,890 | $7.77 | 12/17/2012 | |||||||
1Securities underlying options have been adjusted for the three-for-two stock split on June 15, 2007.
27
OPTION EXERCISES AND STOCK VESTED
| Option Awards | Stock Awards | |||
| Name | Number of Shares Acquired on Exercise (#) | Value Realized on Exercise ($) | Number of Shares Acquired on Vesting (#) | Value Realized on Vesting ($) |
| (a) | (b) | (c) | (d) | (e) |
| Tony W. Wolfe | 0 | $0 | ||
| A. Joseph Lampron | 0 | $0 | ||
Joseph F. Beaman, Jr.1 | 3,897 | $63,404 | 241 | 5,000 |
| Lance A. Sellers | 2,500 | $43,175 | ||
| William D. Cable, Sr. | 0 | $0 | ||
| 1 | Mr. Beaman completed 30 years of service with the Bank in 2007. He received a service award of 241 shares of the Company’s common stock and cash for a total value on the grant date of $5,000. |
Deferred Compensation Plan
In January 2002, the Bank established a non-qualified deferred compensation plan for directors and certain officers. Eligible officers selected by the Bank’s board of directors may elect to contribute a percentage of their compensation to the plan. The Bank may make matching or other contributions to the plan as well, in amounts determined at the discretion of the Bank. Participants are fully vested in all amounts contributed to the plan by them or on their behalf.
Benefits under the plan are payable in the event of the participant’s retirement, death, termination, or as a result of hardship. Benefit payments may be made in a lump sum or in installments, as selected by the participant.
The Bank has established a Rabbi Trust to hold the accrued benefits of the participants under the plan.
NONQUALIFIED DEFERRED COMPENSATION
| Name | Executive Contributions in Last FY ($) | Registrant Contributions in Last FY ($) | Aggregate Earnings in Last FY ($) | Aggregate Withdrawals/ Distributions ($) | Aggregate Balance at Last FYE ($) |
| (a) | (b) | (c) | (d) | (e) | (f) |
| Tony W. Wolfe | $9,731 | $0 | |||
| A. Joseph Lampron | $4,135 | $0 | |||
| Joseph F. Beaman, Jr. | $1,214 | $0 | |||
| Lance A. Sellers | $0 | $0 | |||
| William D. Cable, Sr. | $15,446 | $0 |
28
Supplemental Retirement Plan
In January 2002, the Bank implemented a non-qualified supplemental retirement benefits plan (“SERP”) for certain officers. The plan is designed to provide a retirement benefit to the officers while at the same time minimizing the financial impact on the Bank’s earnings. Under the Plan, the Company purchased life insurance contracts on the lives of certain officers. The increase in cash surrender value of the contracts constitutes the Company’s contribution to the plan each year. The Bank will pay benefits to participating officers for a period between ten years and the life of the officer. The Bank is the sole owner of all of the insurance contracts.
PENSION BENEFITS
| Name | Plan Name | Number of Years Credited Service (#) | Present Value of Accumulated Benefit ($) | Payments During Last Fiscal Year ($) |
| (a) | (b) | (c) | (d) | (e) |
| Tony W. Wolfe | SERP | 5 | $544,235 | 0 |
| A. Joseph Lampron | SERP | 5 | $66,249 | 0 |
| Joseph F. Beaman, Jr. | SERP | 5 | $76,519 | 0 |
| Lance A. Sellers | SERP | 5 | $59,151 | 0 |
| William D. Cable, Sr. | SERP | 5 | $20,688 | 0 |
Discretionary Bonuses and Service Awards
In the past, the Bank has paid bonuses to its employees in amounts determined in the discretion of the Bank’s board of directors. The Bank anticipates that discretionary bonuses will continue to be paid to its employees in the future. The Bank also gives service awards to each employee for every five years of service with the Bank. Service awards are made in the form of shares of the Company’s common stock. The number of shares awarded increases with the years of service to the Bank.
Profit Sharing Plan and 401(k) Plan
The Bank has a Profit Sharing Plan and 401(k) Plan for all eligible employees. The Bank made no contribution to the Profit Sharing Plan for the year ended December 31, 2007. No investments in Bank stock have been made by the plan.
Under the Bank’s 401(k) plan, the Bank matches employee contributions to a maximum of five percent of annual compensation. The Bank’s 2007 contribution to the 401(k) Plan pursuant to this formula was approximately $424,000. All contributions to the 401(k) Plan are tax deferred.
The Profit Sharing Plan and 401(k) Plan permit participants to choose from ten investment funds which are selected by a committee comprised of senior management. Both the 401(k) Plan and Profit Sharing Plan were amended in 2000 to permit participation in the plans beginning in the second month of employment. Both plans provide for vesting of 20% of the benefit after two years employment and 20% each year thereafter until participants are 100% vested after six years employment.
29
Indebtedness of and Transactions with Management and Directors
The Company is a “listed issuer” under the rules and regulations of the Exchange Act whose common stock is listed on NASDAQ. The Company uses the definition of independence contained in NASDAQ’s listing standards to determine the independence of its directors and that the Board of Directors and each standing committee of the Board is in compliance with NASDAQ listing standards for independence.
Certain directors and executive officers of the Bank and their immediate families and associates were customers of and had transactions with the Bank in the ordinary course of business during 2007. All outstanding loans, extensions of credit or overdrafts, endorsements and guarantees outstanding at any time during 2007 (i) were made in the ordinary course of business, (ii) were made on substantially the same terms, including interest rates and collateral, as those prevailing at the time for comparable transactions with other persons, and (iii) were transactions which in the opinion of management of the Bank did not involve more than the normal risk of collectibility or present other unfavorable features.
The Bank leases two of its facilities from Shortgrass Associates, L.L.C. (AShortgrass@). Director John W. Lineberger, Jr., owns 25% of the membership interests in Shortgrass. Pursuant to the terms of the leases for the two facilities leased by the Bank, during 2007 the Bank paid a total of $186,905 to Shortgrass in lease payments for these facilities. Each of the facilities is subject to a 20-year lease between the Bank and Shortgrass. The Board of Directors routinely, and no less than annually, reviews all transactions, direct and indirect, between the Company or the Bank and any employee or director, or any of such person’s immediate family members. Transactions are reviewed as to comparable market values for similar transactions. All material facts of the transactions and the director’s interest are discussed by all disinterested directors and a decision made about whether the transaction is fair to the Company and the Bank. A majority vote of all disinterested directors is required to approve the transaction.
The Board of Directors also evaluates the influence family relationships may have on the independence of directors who are related by blood or marriage. Christine S. Abernethy, a greater than ten percent shareholder of the Company, has two sons, Robert C. Abernethy and James S. Abernethy, who serve on the Board of Directors. All of the non-related directors have determined that the family relationships among Christine S. Abernethy, James S. Abernethy and Robert C. Abernethy do not affect the brothers’ independence as directors.
30
PERFORMANCE GRAPH
The following graph compares the Company’s cumulative shareholder return on its common stock with a NASDAQ index and with a southeastern bank index. The graph was prepared by SNL Securities, L.C., Charlottesville, Virginia, using data as of December 31, 2007.
COMPARISON OF SIX-YEAR CUMULATIVE TOTAL RETURNS
Performance Report for
Peoples Bancorp of North Carolina, Inc.
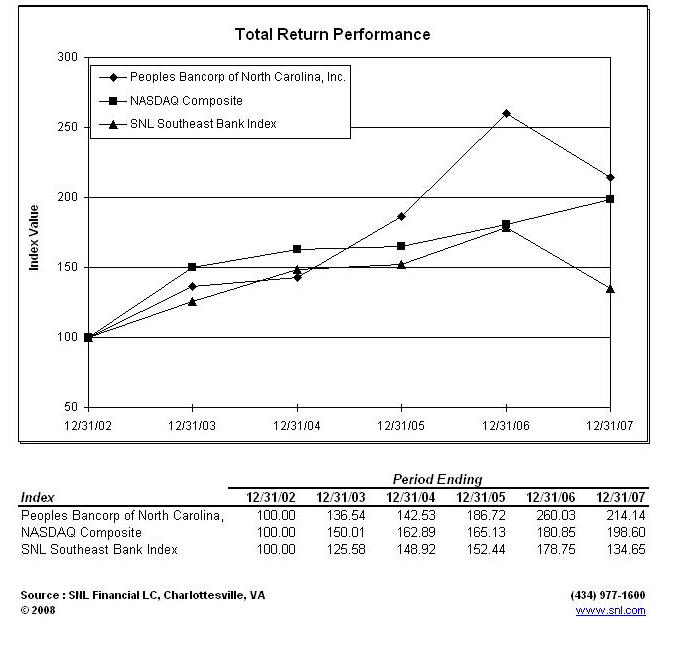
31
PROPOSAL 2
APPROVAL TO AMEND THE COMPANY’S ARTICLES OF INCORPORATION
The Board of Directors recommends that the Company’s Articles of Incorporation be amended to eliminate the classified structure of the Company’s Board and allow for the annual election of the directors. Article VIII, Section 8.1 of the Articles of Incorporation provides that any time the total number of directors exceeds nine or more, the directors will be divided into three classes and each class of directors will be elected for three year terms. This Proposal would amend the Company’s Articles to provide that in the future years, all directors would be elected each year at the Annual Meeting of Shareholders. Current directors, including the directors elected at the 2008 Annual Meeting, would continue to serve for their elected terms. Thus, beginning with the Annual Meeting of Shareholders in the year 2011, all directors would be elected annually. The proposed amendment is attached as Appendix B to this Proxy Statement.
Under Sections 55-10-20 and 55-10-03 of the North Carolina Business Corporation Act, the adoption of the amendments to the Articles requires the affirmative vote of the holders of a majority of the outstanding shares of the Company’s common stock entitled to vote at an Annual Meeting.
Classified or staggered boards have been widely adopted and have a long history in corporate law. Classified boards have been viewed as a means of promoting stability and continuity of experience on a board of directors primarily because the majority of directors at any given time will have had at least one year of experience on the board, thus assisting a company in its long-term strategic planning efforts. Also, because it would take at least two elections for a potential acquiror to gain control of a classified board without the cooperation of the board, the existence of a classified structure has been considered as possibly enhancing shareholder value by making it more likely that a party seeking to gain control of a target company will engage in arm’s-length discussions with the target’s existing board instead of launching a proxy fight in an attempt to gain control of the board and take over the company.
However, many investors and others have come to view a classified board structure as having the effect of reducing the accountability of directors because classified boards limit the ability of shareholders to evaluate and elect all directors on an annual basis. The election of directors is the primary means for shareholders to influence corporate governance policies and to hold management accountable for the implementation of these policies. Opponents of classified boards also believe that they discourage takeover proposals and proxy contests that could have the effect of increasing shareholder value. In light of these views, a number of major corporations have determined that principles of good corporate governance dictate that all directors of a corporation should be elected annually.
After considering the advantages and disadvantages of the classified board structure, the Board of Directors has voted to propose to the shareholders that the Company’s directors be elected annually. In reaching this determination, the Board concluded that the benefits of a classified board structure were outweighed by the following considerations:
• Annual voting for directors enables the Company’s shareholders to register their views on the collective performance of the Board of Directors and on each director individually which will further the Company’s goal of ensuring that its corporate governance policies conform to current best practices and maximize accountability to the shareholders;
• Because there is no limit to the number of terms an individual may serve (other than an age limitation), the continuity and stability of Board membership should not be materially affected by declassification of the Company Board; and
• Even though annual election of directors may enhance the ability of a third party to acquire control of the Company without engaging in arm’s-length discussions with the Board, there are other factors, such as the requirement of approvals of various bank and bank holding company regulators before an acquiror may exceed various levels of stock ownership, that reduce the likelihood that a third-party would be successful in taking over the Company without engaging in arm’s-length discussions with the Board of Directors.
32
THE BOARD RECOMMENDS THAT THE SHAREHOLDERS VOTE “FOR” THE AMENDMENT TO THE ARTICLES OF INCORPORATION.
PROPOSAL 3
RATIFICATION OF SELECTION OF INDEPENDENT AUDITOR
Porter Keadle Moore, LLP, of Atlanta, Georgia (“PKM”), has been selected by the Audit Committee as the Company’s and the Bank’s independent auditor for the year ending December 31, 2008. Such selection is being submitted to the Company’s shareholders for ratification. Representatives of PKM are expected to attend the Meeting and will be afforded an opportunity to make a statement, if they so desire, and to respond to appropriate questions from shareholders.
Audit Fees
The aggregate fees billed by PKM for professional services rendered in connection with the (i) audit of the Company’s annual financial statements for 2007 and 2006; (ii) review of the financial statements included in the Company’s quarterly filings on Form 10-Q during those fiscal years; and (iii) review of the company’s internal controls over financial reporting in 2007 and 2006 were approximately $202,000 each year.
Audit Related Fees
The aggregate fees billed by PKM in 2007 and 2006 for professional services rendered for assurance and related services that are reasonably related to the performance of the audit or review of the Company’s financial statements and not included in “Audit Fees” above were approximately $19,000 and $13,000, respectively. These fees were primarily related to the audit of the Company’s profit sharing and 401(k) plan and the testing of management’s assertions regarding internal controls in accordance with the Federal Deposit Insurance Corporation Improvement Act.
Tax Fees
The aggregate fees billed in each of the last two fiscal years for professional services rendered by PKM for tax compliance, tax advice, and tax planning were approximately $25,000 and $23,000 in 2007 and 2006, respectively. These fees were primarily related to the preparation of the Company’s income tax returns, assistance with quarterly income tax estimates and preparation of Forms 5500 for various benefit plans.
All Other Fees
PKM did not bill the Company for any other fees during 2007 or 2006.
The fees billed by PKM are pre-approved by the Audit Committee of the Company in accordance with the policies and procedures for the Audit Committee set forth in the committee’s charter. The Audit Committee typically pre-approves all audit and non-audit services provided by the Company’s independent auditors and may not engage the independent auditors to perform any prohibited non-audit services. For 2007, one hundred percent (100%) of the total fees paid for audit, audit related and tax services were pre-approved. For 2006, one hundred percent (100%) of the fees for audit, audit related, and tax were pre-approved. The Audit Committee has determined that the rendering of non-audit professional services by PKM, as identified above, is compatible with maintaining PKM’s independence.
THE BOARD OF DIRECTORS RECOMMENDS THAT THE SHAREHOLDERS VOTE FOR RATIFICATION OF THE APPOINTMENT OF PKM AS INDEPENDENT AUDITOR FOR THE COMPANY AND THE BANK FOR THE FISCAL YEAR ENDING DECEMBER 31, 2008.
DATE FOR RECEIPT OF SHAREHOLDER PROPOSALS
33
It is presently anticipated that the 2009 Annual Meeting of Shareholders of the Company will be held on May 7, 2009. In order for shareholder proposals to be included in the Company’s proxy materials for that meeting, such proposals must be received by the Secretary of the Company at the Company’s principal executive office no later than December 6, 2008 and meet all other applicable requirements for inclusion in the Proxy Statement.
In the alternative, a shareholder may commence his or her own proxy solicitation and present a proposal from the floor at the 2008 Annual Meeting of Shareholders of the Company. In order to do so, the shareholder must notify the Secretary of the Company in writing, at the Company’s principal executive office no later than February 18, 2009, of his or her proposal. If the Secretary of the Company is not notified of the shareholder’s proposal by February 18, 2009, the Board of Directors may vote on the proposal pursuant to the discretionary authority granted by the proxies solicited by the Board of Directors for the 2009 Annual Meeting.
OTHER MATTERS
Management knows of no other matters to be presented for consideration at the Meeting or any adjournments thereof. If any other matters shall properly come before the Meeting, it is intended that the proxyholders named in the enclosed form of proxy will vote the shares represented thereby in accordance with their judgment, pursuant to the discretionary authority granted therein.
MISCELLANEOUS
The Annual Report of the Company for the year ended December 31, 2007, which includes financial statements audited and reported upon by the Company’s independent auditor, is being mailed as Appendix A to this Proxy Statement; however, it is not intended that the Annual Report be deemed a part of this Proxy Statement or a solicitation of proxies.
THE FORM 10-K FILED BY THE COMPANY WITH THE SEC, INCLUDING THE FINANCIAL STATEMENTS AND SCHEDULES THERETO, WILL BE PROVIDED FREE OF CHARGE UPON WRITTEN REQUEST DIRECTED TO: PEOPLES BANCORP OF NORTH CAROLINA, INC., POST OFFICE BOX 467, 518 WEST C STREET, NEWTON, NORTH CAROLINA 28658-0467, ATTENTION: A. JOSEPH LAMPRON.
By Order of the Board of Directors,
/s/ Tony W. Wolfe
Tony W. Wolfe
President and Chief Executive Officer
Newton, North Carolina
March 31, 2008
34
APPENDIX A
PEOPLES BANCORP OF NORTH CAROLINA, INC.
General Description of Business
Peoples Bancorp of North Carolina, Inc. (the “Company”), was formed in 1999 to serve as the holding company for Peoples Bank (the “Bank”). The Company is a bank holding company registered with the Board of Governors of the Federal Reserve System (the “Federal Reserve”) under the Bank Holding Company Act of 1956, as amended (the “BHCA”). The Company’s principal source of income is any dividends, which are declared and paid by the Bank on its capital stock. The Company has no operations and conducts no business of its own other than owning the Bank. Accordingly, the discussion of the business which follows concerns the business conducted by the Bank, unless otherwise indicated.
The Bank, founded in 1912, is a state-chartered commercial bank serving the citizens and business interests of the Catawba Valley and surrounding communities through 19 banking offices located in Lincolnton, Newton, Denver, Catawba, Conover, Maiden, Claremont, Hiddenite, Hickory, Charlotte, Monroe and Cornelius, North Carolina. The Bank also operates a loan production office in Denver, North Carolina. In January 2008, the Bank opened a traditional banking office in Iredell County, in Mooresville, North Carolina and a Banco de la Gente office in Wake County, in Raleigh, North Carolina. At December 31, 2007, the Company had total assets of $907.3 million, net loans of $713.2 million, deposits of $693.7 million, total securities of $127.4 million, and shareholders’ equity of $70.1 million.
The Bank has a diversified loan portfolio, with no foreign loans and few agricultural loans. Real estate loans are predominately variable rate commercial property loans, which include residential development loans to commercial customers. Commercial loans are spread throughout a variety of industries with no one particular industry or group of related industries accounting for a significant portion of the commercial loan portfolio. The majority of the Bank's deposit and loan customers are individuals and small to medium-sized businesses located in the Bank's market area. The Bank’s loan portfolio also includes Individual Taxpayer Identification Number (ITIN) mortgage loans generated thorough the Bank’s Banco de le Gente offices. Additional discussion of the Bank’s loan portfolio and sources of funds for loans can be found in “Management’s Discussion and Analysis of Financial Condition and Results of Operations” on pages A-4 through A-25 of the Annual Report, which is included in this Form 10-K as Exhibit 13.
The operations of the Bank and depository institutions in general are significantly influenced by general economic conditions and by related monetary and fiscal policies of depository institution regulatory agencies, including the Federal Reserve, the Federal Deposit Insurance Corporation (the “FDIC”) and the North Carolina Commissioner of Banks (the "Commissioner").
At December 31, 2007, the Bank employed 264 full-time equivalent employees.
The Bank is a subsidiary of the Company. The Bank has two subsidiaries, Peoples Investment Services, Inc. and Real Estate Advisory Services, Inc. Through a relationship with Raymond James Financial Services, Inc., Peoples Investment Services, Inc. provides the Bank's customers access to investment counseling and non-deposit investment products such as stocks, bonds, mutual funds, tax deferred annuities, and related brokerage services. Real Estate Advisory Services, Inc., provides real estate appraisal and real estate brokerage services.
In June 2006, the Company formed a wholly owned Delaware statutory trust, PEBK Capital Trust II (“PEBK Trust II”), which issued $20.0 million of guaranteed preferred beneficial interests in the Company’s junior subordinated deferrable interest debentures. All of the common securities of PEBK Trust II are owned by the Company. The proceeds from the issuance of the common securities and the trust preferred securities were used by PEBK Trust II to purchase $20.6 million of junior subordinated debentures of the Company, which pay a floating rate equal to three month LIBOR plus 163 basis points. The proceeds received by the Company from the sale of the junior subordinated debentures were used in December 2006 to repay the trust preferred securities issued by PEBK Trust in December 2001 and for general purposes. The debentures represent the sole asset of PEBK Trust II. PEBK Trust II is not included in the consolidated financial statements.
The trust preferred securities issued by PEBK Trust II accrue and pay quarterly at a floating rate of three-month LIBOR plus 163 basis points. The Company has guaranteed distributions and other payments due on the trust preferred securities to the extent PEBK Trust II does not have funds with which to make the distributions and other payments. The net combined effect of the trust preferred securities transaction is that the Company is obligated to make the distributions and other payments required on the trust preferred securities.
These trust preferred securities are mandatorily redeemable upon maturity of the debentures on June 28, 2036, or upon earlier redemption as provided in the indenture. The Company has the right to redeem the debentures purchased by PEBK Trust II, in whole or in part, on or after June 28, 2011. As specified in the indenture, if the debentures are redeemed prior to maturity, the redemption price will be the principal amount and any accrued but unpaid interest.
A-1
This report contains certain forward-looking statements with respect to the financial condition, results of operations and business of Peoples Bancorp of North Carolina, Inc. (the “Company”). These forward-looking statements involve risks and uncertainties and are based on the beliefs and assumptions of management of the Company and on the information available to management at the time that these disclosures were prepared. These statements can be identified by the use of words like “expect,” “anticipate,” “estimate” and “believe,” variations of these words and other similar expressions. Readers should not place undue reliance on forward-looking statements as a number of important factors could cause actual results to differ materially from those in the forward-looking statements. Factors that could cause actual results to differ materially include, but are not limited to, (1) competition in the markets served by Peoples Bank (the “Bank”), (2) changes in the interest rate environment, (3) general national, regional or local economic conditions may be less favorable than expected, resulting in, among other things, a deterioration in credit quality and the possible impairment of collectibility of loans, (4) legislative or regulatory changes, including changes in accounting standards, (5) significant changes in the federal and state legal and regulatory environment and tax laws, (6) the impact of changes in monetary and fiscal policies, laws, rules and regulations and (7) other risks and factors identified in the Company’s other filings with the Securities and Exchange Commission. The Company undertakes no obligation to update any forward-looking statements.
A-2
| SELECTED FINANCIAL DATA | ||||||||||||||||||||
| Dollars in Thousands Except Per Share Amounts | ||||||||||||||||||||
| 2007 | 2006 | 2005 | 2004 | 2003 | ||||||||||||||||
| Summary of Operations | ||||||||||||||||||||
| Interest income | $ | 61,732 | 55,393 | 41,913 | 35,095 | 33,799 | ||||||||||||||
| Interest expense | 27,585 | 23,110 | 15,429 | 12,335 | 12,749 | |||||||||||||||
| Net interest income | 34,147 | 32,283 | 26,484 | 22,760 | 21,050 | |||||||||||||||
| Provision for loan losses | 2,038 | 2,513 | 3,110 | 3,256 | 6,744 | |||||||||||||||
| Net interest income after provision for loan losses | 32,109 | 29,770 | 23,374 | 19,504 | 14,306 | |||||||||||||||
| Non-interest income | 8,816 | 7,554 | 6,668 | 6,000 | 5,825 | |||||||||||||||
| Non-interest expense | 25,993 | 22,983 | 20,330 | 18,840 | 17,072 | |||||||||||||||
| Income before taxes | 14,932 | 14,341 | 9,712 | 6,664 | 3,059 | |||||||||||||||
| Income taxes | 5,340 | 5,170 | 3,381 | 2,233 | 1,055 | |||||||||||||||
| Net income | $ | 9,592 | 9,171 | 6,331 | 4,431 | 2,004 | ||||||||||||||
| Selected Year-End Balances | ||||||||||||||||||||
| Assets | $ | 907,262 | 818,948 | 730,280 | 686,348 | 674,032 | ||||||||||||||
| Available for sale securities | 120,968 | 117,581 | 115,158 | 105,598 | 79,460 | |||||||||||||||
| Loans, net | 713,174 | 643,078 | 559,239 | 527,419 | 542,404 | |||||||||||||||
| Mortgage loans held for sale | - | - | 2,248 | 3,783 | 587 | |||||||||||||||
| Interest-earning assets | 853,878 | 780,082 | 692,835 | 653,111 | 639,934 | |||||||||||||||
| Deposits | 693,639 | 633,820 | 582,854 | 556,522 | 549,802 | |||||||||||||||
| Interest-bearing liabilities | 718,870 | 650,364 | 576,681 | 553,135 | 550,357 | |||||||||||||||
| Shareholders' equity | $ | 70,102 | 62,835 | 54,353 | 50,938 | 48,554 | ||||||||||||||
| Shares outstanding* | 5,624,234 | 5,745,951 | 5,677,328 | 5,689,763 | 5,690,392 | |||||||||||||||
| Selected Average Balances | ||||||||||||||||||||
| Assets | $ | 846,836 | 772,585 | 706,843 | 684,385 | 661,077 | ||||||||||||||
| Available for sale securities | 120,296 | 118,137 | 108,690 | 93,770 | 72,072 | |||||||||||||||
| Loans | 665,379 | 604,427 | 550,545 | 547,753 | 539,559 | |||||||||||||||
| Interest-earning assets | 801,094 | 732,244 | 668,614 | 650,528 | 626,197 | |||||||||||||||
| Deposits | 659,174 | 605,407 | 570,997 | 558,142 | 533,703 | |||||||||||||||
| Interest-bearing liabilities | 665,727 | 613,686 | 563,210 | 553,880 | 540,676 | |||||||||||||||
| Shareholders' equity | $ | 70,586 | 62,465 | 55,989 | 51,978 | 49,971 | ||||||||||||||
| Shares outstanding* | 5,700,860 | 5,701,829 | 5,692,290 | 5,707,975 | 5,687,642 | |||||||||||||||
| Profitability Ratios | ||||||||||||||||||||
| Return on average total assets | 1.13 | % | 1.19 | % | 0.90 | % | 0.65 | % | 0.30 | % | ||||||||||
| Return on average shareholders' equity | 13.59 | % | 14.68 | % | 11.31 | % | 8.52 | % | 4.01 | % | ||||||||||
| Dividend payout ratio | 24.30 | % | 20.78 | % | 22.34 | % | 28.37 | % | 62.56 | % | ||||||||||
| Liquidity and Capital Ratios (averages) | ||||||||||||||||||||
| Loan to deposit | 100.94 | % | 99.84 | % | 96.42 | % | 98.14 | % | 101.10 | % | ||||||||||
| Shareholders' equity to total assets | 8.34 | % | 8.09 | % | 7.92 | % | 7.59 | % | 7.56 | % | ||||||||||
| Per share of common stock* | ||||||||||||||||||||
| Basic net income | $ | 1.68 | 1.61 | 1.11 | 0.77 | 0.35 | ||||||||||||||
| Diluted net income | $ | 1.65 | 1.58 | 1.09 | 0.77 | 0.35 | ||||||||||||||
| Cash dividends | $ | 0.41 | 0.33 | 0.25 | 0.22 | 0.22 | ||||||||||||||
| Book value | $ | 12.46 | 10.94 | 9.57 | 8.95 | 8.53 | ||||||||||||||
| *Shares outstanding and per share computations have been retroactively restated to reflect a 10% stock dividend during first quarter 2005, a 10% stock dividend during second quarter 2006 and a 3-for-2 stock split during second quarter 2007. | ||||||||||||||||||||
A-3
MANAGEMENT'S DISCUSSION AND ANALYSIS OF FINANCIAL CONDITION
AND RESULTS OF OPERATIONS
The following is a discussion of our financial position and results of operations and should be read in conjunction with the information set forth under Item 1A Risk Factors and the Company’s consolidated financial statements and notes thereto on pages A-27 through A-56.
Introduction
Management's discussion and analysis of earnings and related data are presented to assist in understanding the consolidated financial condition and results of operations of the Company, for the years ended December 31, 2007, 2006 and 2005. The Company is a registered bank holding company operating under the supervision of the Federal Reserve Board and the parent company of Peoples Bank (the “Bank”). The Bank is a North Carolina-chartered bank, with offices in Catawba, Lincoln, Alexander, Mecklenburg, Iredell and Union Counties, operating under the banking laws of North Carolina and the rules and regulations of the Federal Deposit Insurance Corporation (the “FDIC”).
Overview
Our business consists principally of attracting deposits from the general public and investing these funds in loans secured by commercial real estate, secured and unsecured commercial loans and consumer loans. Our profitability depends primarily on our net interest income, which is the difference between the income we receive on our loan and investment securities portfolios and our cost of funds, which consists of interest paid on deposits and borrowed funds. Net interest income also is affected by the relative amounts of interest-earning assets and interest-bearing liabilities. When interest-earning assets approximate or exceed interest-bearing liabilities, any positive interest rate spread will generate net interest income. Our profitability is also affected by the level of other income and operating expenses. Other income consists primarily of miscellaneous fees related to our loans and deposits, mortgage banking income and commissions from sales of annuities and mutual funds. Operating expenses consist of compensation and benefits, occupancy related expenses, federal deposit and other insurance premiums, data processing, advertising and other expenses.
Our operations are influenced significantly by local economic conditions and by policies of financial institution regulatory authorities. The earnings on our assets are influenced by the effects of, and changes in, trade, monetary and fiscal policies and laws, including interest rate policies of the Board of Governors of the Federal Reserve System (the “Federal Reserve”), inflation, interest rates, market and monetary fluctuations. Lending activities are affected by the demand for commercial and other types of loans, which in turn is affected by the interest rates at which such financing may be offered. Our cost of funds is influenced by interest rates on competing investments and by rates offered on similar investments by competing financial institutions in our market area, as well as general market interest rates. These factors can cause fluctuations in our net interest income and other income. In addition, local economic conditions can impact the credit risk of our loan portfolio, in that (1) local employers may be required to eliminate employment positions of individual borrowers, and small businesses and (2) commercial borrowers may experience a downturn in their operating performance and become unable to make timely payments on their loans. Management evaluates these factors in estimating its allowance for loan losses and changes in these economic factors could result in increases or decreases to the provision for loan losses.
Our business emphasis has been to operate as a well-capitalized, profitable and independent community-oriented financial institution dedicated to providing quality customer service. We are committed to meeting the financial needs of the communities in which we operate. We believe that we can be more effective in serving our customers than many of our non-local competitors because of our ability to quickly and effectively provide senior management responses to customer needs and inquiries. Our ability to provide these services is enhanced by the stability of our senior management team.
The Company qualified as an accelerated filer in accordance with Rule 12b-2 of the Securities Exchange Act of 1934, effective December 31, 2006. Therefore, the Company is subject to the requirements of Section 404 of the Sarbanes-Oxley Act of 2002 (“SOX 404”). The Company incurred additional consulting and audit expenses in becoming compliant with SOX 404, and will continue to incur additional audit expenses to comply with SOX 404 going forward. Management does not expect expenses related to SOX 404 to have a material impact on the Company’s financial statements.
The Bank opened a new office in Mecklenburg County, in Cornelius, North Carolina in June 2007and a new office in Iredell County, in Mooresville, North Carolina in January 2008. Also in January 2008, the Bank opened a new Banco de la Gente office in Wake County, in Raleigh, North Carolina in a continuing effort to serve the Latino community. While there are no additional traditional offices planned in 2008, management will consider opening at least one new traditional office in Mecklenburg or Iredell counties in the next two to three years and additional Banco de la Gente offices in other metropolitan areas in North Carolina.
A-4
Summary of Significant Accounting Policies
The consolidated financial statements include the financial statements of Peoples Bancorp of North Carolina, Inc. and its wholly owned subsidiary, Peoples Bank, along with its wholly owned subsidiaries, Peoples Investment Services, Inc. and Real Estate Advisory Services, Inc (collectively called the “Company”). All significant intercompany balances and transactions have been eliminated in consolidation.
The Company’s accounting policies are fundamental to understanding management’s discussion and analysis of results of operations and financial condition. Many of the Company’s accounting policies require significant judgment regarding valuation of assets and liabilities and/or significant interpretation of specific accounting guidance. The following is a summary of some of the more subjective and complex accounting policies of the Company. A more complete description of the Company’s significant accounting policies can be found in Note 1 of the Notes to Consolidated Financial Statements in the Company’s 2007 Annual Report to Shareholders which is Appendix A to the Proxy Statement for the May 1, 2008 Annual Meeting of Shareholders.
Many of the Company’s assets and liabilities are recorded using various techniques that require significant judgment as to recoverability. The collectability of loans is reflected through the Company’s estimate of the allowance for loan losses. The Company performs periodic and systematic detailed reviews of its lending portfolio to assess overall collectability. In addition, certain assets and liabilities are reflected at their estimated fair value in the consolidated financial statements. Such amounts are based on either quoted market prices or estimated values derived from dealer quotes used by the Company, market comparisons or internally generated modeling techniques. The Company’s internal models generally involve present value of cash flow techniques. The various techniques are discussed in greater detail elsewhere in management’s discussion and analysis and the Notes to Consolidated Financial Statements.
There are other complex accounting standards that require the Company to employ significant judgment in interpreting and applying certain of the principles prescribed by those standards. These judgments include, but are not limited to, the determination of whether a financial instrument or other contract meets the definition of a derivative in accordance with Statement of Financial Accounting Standards (“SFAS”) No. 133, “Accounting for Derivative Instruments and Hedging Activities” (SFAS 133). For a more complete discussion of policies, see the notes to consolidated financial statements.
In June 2006, FASB issued Financial Interpretation No. 48 (“FIN 48”) “Accounting for Uncertainty in Income Taxes – an interpretation of SFAS No. 109.” FIN 48 clarifies the accounting for uncertainty in income taxes recognized in the financial statements and prescribes a recognition threshold and measurement attribute for a tax position taken or expected to be taken in a tax return. This interpretation also provides guidance on derecognition, classification, interest and penalties, accounting in interim periods, disclosure and transition. This interpretation was effective for the Company beginning in January of 2007. The Company assessed the impact of FIN 48 and determined that there are no significant positions taken in the preparation of its tax return, and therefore FIN 48 did not have a material impact on its financial position or its results of operations.
In September 2006, the FASB ratified the conclusions reached by the Emerging Issues Task Force (EITF) on EITF 06-4, “Accounting for Deferred Compensation and Postretirement Benefit Aspects of Endorsement Split-Dollar Life Insurance Arrangements.” This issue will require companies to recognize an obligation for either the present value of the entire promised death benefit or the annual “cost of insurance” required to keep the policy in force during the post-retirement years. EITF 06-4 is effective for the Company as of January 1, 2008. This standard is not expected to have a material effect on the Company's financial position, results of operations or disclosures.
In September 2006, the FASB issued SFAS No. 157, “Fair Value Measurements” (SFAS 157). SFAS 157 defines fair value, establishes a framework for measuring fair value in generally accepted accounting principles (GAAP), and expands disclosures about fair value measurements. SFAS 157 applies under other accounting pronouncements that require or permit fair value measurements. SFAS 157 is effective for the Company as of January 1, 2008. This standard is not expected to have a material effect on the Company's financial position or results of operations.
In September 2006, the FASB issued SFAS No. 158, “Employers’ Accounting for Defined Benefit Pension and Other Postretirement Plans” (SFAS 158) – an amendment of FASB Statements No. 87, 88, 106 and 132(R). SFAS 158 requires employers to recognize the overfunded or underfunded status of a defined benefit postretirement plan as an asset or liability in its statement of financial position and to recognize changes in that funded status in the year in which the changes occur through comprehensive income. SFAS 158 requires an employer to measure the funded status of a plan as of the date of its year-end statement of financial position, with limited exceptions and includes expanded disclosures. SFAS 158 was effective for the Company as of January 1, 2007. This standard did not have a material effect on the Company's financial position, results of operations or disclosures.
A-5
In February 2007, the FASB issued SFAS No. 159, “The Fair Value Option for Financial Assets and Financial Liabilities” (SFAS 159), which permits entities to choose to measure financial instruments and certain other instruments at fair value. SFAS 159 is effective for the Company as of January 1, 2008. The Company does not expect to choose this option for any asset or liability and therefore does not expect SFAS 159 to have a material effect on the Company's financial position, results of operations or disclosures.
Management of the Company has made a number of estimates and assumptions relating to reporting of assets and liabilities and the disclosure of contingent assets and liabilities to prepare the accompanying consolidated financial statements in conformity with GAAP. Actual results could differ from those estimates.
The remainder of management’s discussion and analysis of the Company’s results of operations and financial position should be read in conjunction with the consolidated financial statements and related notes presented on pages A-27 through A-56.
Results of Operations
Summary. The Company reported earnings of $9.6 million in 2007, or $1.68 basic net earnings per share and $1.65 diluted net earnings per share, a 5% increase as compared to $9.2 million, or $1.61 basic net earnings per share and $1.58 diluted net earnings per share, for 2006. The Company’s increase in net earnings for 2007 is primarily attributable to growth in interest-earning assets, which contributed to increases in net interest income and an increase in non-interest income. In addition, the Company had a decrease in the provision for loan losses for the year ended December 31, 2007 as compared to the same period one year ago. The increases in net interest income and non-interest income and the decrease in the provision for loan losses were partially offset by an increase in non-interest expense.
Net earnings for 2006 represented an increase of 45% as compared to 2005 net earnings of $6.3 million or $1.11 basic net earnings per share and $1.09 diluted net earnings per share. The increase in 2006 net earnings was primarily attributable to an increase in net interest income, an increase in non-interest income and a decrease in the provision for loan losses, which were partially offset by an increase in non-interest expense.
The return on average assets in 2007 was 1.13%, compared to 1.19% in 2006 and 0.90% in 2005. The return on average shareholders’ equity was 13.59% in 2007 compared to 14.68% in 2006 and 11.31% in 2005.
Net Interest Income. Net interest income, the major component of the Company's net income, is the amount by which interest and fees generated by interest-earning assets exceed the total cost of funds used to carry them. Net interest income is affected by changes in the volume and mix of interest-earning assets and interest-bearing liabilities, as well as changes in the yields earned and rates paid. Net interest margin is calculated by dividing tax-equivalent net interest income by average interest-earning assets, and represents the Company’s net yield on its interest-earning assets.
Net interest income was $34.1 million for 2007, or 6% over net interest income of $32.3 million in 2006. The increase was attributable to an increase in interest income due to an increase in the average outstanding balance of loans. Net interest income increased 22% in 2006 from $26.5 million in 2005.
Table 1 sets forth for each category of interest-earning assets and interest-bearing liabilities, the average amounts outstanding, the interest incurred on such amounts and the average rate earned or incurred for the years ended December 31, 2007, 2006 and 2005. The table also sets forth the average rate earned on total interest-earning assets, the average rate paid on total interest-bearing liabilities, and the net yield on average total interest-earning assets for the same periods. Yield information does not give effect to changes in fair value that are reflected as a component of shareholders’ equity. Yields and interest income on tax-exempt investments have been adjusted to tax equivalent basis using an effective tax rate 38.55% for securities that are both federal and state tax exempt and an effective tax rate of 6.90% for state tax exempt securities. Non-accrual loans and the interest income that was recorded on these loans, if any, are included in the yield calculations for loans in all periods reported.
A-6
| Table 1- Average Balance Table | ||||||||||||||||||||||||||||||
| December 31, 2007 | December 31, 2006 | December 31, 2005 | ||||||||||||||||||||||||||||
| (Dollars in Thousands) | Average Balance | Interest | Yield / Rate | Average Balance | Interest | Yield / Rate | Average Balance | Interest | Yield / Rate | |||||||||||||||||||||
| Interest-earning assets: | ||||||||||||||||||||||||||||||
| Loans | $ | 665,379 | 55,109 | 8.28 | % | 604,427 | 49,665 | 8.22 | % | 550,545 | 37,234 | 6.76 | % | |||||||||||||||||
| Interest rate swap agreements | - | (406 | ) | -0.06 | % | - | (698 | ) | -0.12 | % | - | (575 | ) | -0.14 | % | |||||||||||||||
| Loan fees | - | 698 | 0.10 | % | - | 701 | 0.12 | % | - | 464 | 0.80 | % | ||||||||||||||||||
| Total loans | 665,379 | 55,401 | 8.33 | % | 604,427 | 49,668 | 8.22 | % | 550,545 | 37,123 | 6.74 | % | ||||||||||||||||||
| Investments - taxable | 20,305 | 868 | 4.27 | % | 29,784 | 1,306 | 4.38 | % | 37,487 | 1,595 | 4.25 | % | ||||||||||||||||||
| Investments - nontaxable* | 99,991 | 5,470 | 5.47 | % | 88,353 | 4,642 | 5.25 | % | 71,202 | 3,472 | 4.88 | % | ||||||||||||||||||
| Federal funds sold | 7,378 | 383 | 5.19 | % | 1,766 | 85 | 4.81 | % | 2,272 | 73 | 3.21 | % | ||||||||||||||||||
| Other | 8,041 | 444 | 5.52 | % | 7,914 | 424 | 5.36 | % | 7,108 | 269 | 3.61 | % | ||||||||||||||||||
| Total interest-earning assets | 801,094 | 62,566 | 7.81 | % | 732,244 | 56,125 | 7.66 | % | 668,614 | 42,532 | 6.36 | % | ||||||||||||||||||
| Cash and due from banks | 20,081 | 17,022 | 15,149 | |||||||||||||||||||||||||||
| Other assets | 34,287 | 31,218 | 30,891 | |||||||||||||||||||||||||||
| Allowance for loan losses | (8,626 | ) | (7,899 | ) | (7,811 | ) | ||||||||||||||||||||||||
| Total assets | $ | 846,836 | 772,585 | 706,843 | ||||||||||||||||||||||||||
| Interest-bearing liabilities: | ||||||||||||||||||||||||||||||
| NOW accounts | $ | 79,550 | 1,127 | 1.42 | % | 87,329 | 1,214 | 1.39 | % | 110,852 | 1,468 | 1.32 | % | |||||||||||||||||
| Regular savings accounts | 18,685 | 54 | 0.29 | % | 19,768 | 57 | 0.29 | % | 21,205 | 65 | 0.31 | % | ||||||||||||||||||
| Money market accounts | 87,916 | 2,918 | 3.32 | % | 66,035 | 1,789 | 2.71 | % | 56,858 | 1,112 | 1.96 | % | ||||||||||||||||||
| Time deposits | 361,859 | 17,430 | 4.82 | % | 335,092 | 14,189 | 4.23 | % | 292,807 | 8,923 | 3.05 | % | ||||||||||||||||||
| FHLB borrowings | 80,058 | 3,759 | 4.70 | % | 74,082 | 3,588 | 4.84 | % | 65,934 | 2,889 | 4.38 | % | ||||||||||||||||||
| Demand notes payable to U.S. Treasury | 814 | 39 | 4.79 | % | 722 | 34 | 4.71 | % | 702 | 21 | 3.02 | % | ||||||||||||||||||
| Trust preferred securities | 20,619 | 1,476 | 7.16 | % | 24,878 | 1,963 | 7.89 | % | 14,433 | 938 | 6.50 | % | ||||||||||||||||||
| Other | 16,226 | 782 | 4.82 | % | 5,780 | 276 | 4.78 | % | 419 | 13 | 3.00 | % | ||||||||||||||||||
| Total interest-bearing liabilities | 665,727 | 27,585 | 4.14 | % | 613,686 | 23,110 | 3.77 | % | 563,210 | 15,429 | 2.74 | % | ||||||||||||||||||
| Demand deposits | 111,164 | 97,183 | 89,275 | |||||||||||||||||||||||||||
| Other liabilities | 3,022 | 3,044 | 1,275 | |||||||||||||||||||||||||||
| Shareholders' equity | 70,586 | 62,465 | 55,989 | |||||||||||||||||||||||||||
| Total liabilities and shareholder's equity | $ | 850,499 | 776,378 | 709,749 | ||||||||||||||||||||||||||
| Net interest spread | $ | 34,981 | 3.67 | % | 33,015 | 3.89 | % | 27,103 | 3.62 | % | ||||||||||||||||||||
| Net yield on interest-earning assets | 4.37 | % | 4.51 | % | 4.05 | % | ||||||||||||||||||||||||
| Taxable equivalent adjustment | ||||||||||||||||||||||||||||||
| Investment securities | $ | 834 | 731 | 619 | ||||||||||||||||||||||||||
| Net interest income | $ | 34,147 | 32,284 | 26,484 | ||||||||||||||||||||||||||
| *Includes U.S. government agency securities that are non-taxable for state income tax purposes of $74.9 million in 2007, $65.9 million in 2006 and $50.7 million in 2005. An effective tax rate of 6.90% was used to calculate the tax equivalent yield on these securities. | ||||||||||||||||||||||||||||||
Changes in interest income and interest expense can result from variances in both volume and rates. Table 2 describes the impact on the Company’s tax equivalent net interest income resulting from changes in average balances and average rates for the periods indicated. The changes in interest due to both volume and rate have been allocated to volume and rate changes in proportion to the relationship of the absolute dollar amounts of the changes in each.
A-7
| Table 2 - Rate/Volume Analysis-Tax Equivalent Basis | ||||||||
| December 31, 2007 | December 31, 2006 | |||||||
| (Dollars in Thousands) | Changes in average volume | Changes in average rates | Total increase (decrease) | Changes in average volume | Changes in average rates | Total increase (decrease) | ||
| Interest income: | ||||||||
| Loans: net of unearned income | $ | 5,042 | 691 | 5,733 | $ | 4,030 | 8,515 | 12,545 | ||||||||||||||||
| Investments - taxable | (411 | ) | (27 | ) | (438 | ) | (333 | ) | 44 | (289 | ) | |||||||||||||
| Investments - nontaxable | 624 | 204 | 828 | 869 | 301 | 1,170 | ||||||||||||||||||
| Federal funds sold | 281 | 17 | 298 | (20 | ) | 32 | 12 | |||||||||||||||||
| Other | 7 | 13 | 20 | 37 | 118 | 155 | ||||||||||||||||||
| Total interest income | 5,543 | 898 | 6,441 | 4,583 | 9,010 | 13,593 | ||||||||||||||||||
| Interest expense: | ||||||||||||||||||||||||
| NOW accounts | (109 | ) | 22 | (87 | ) | (320 | ) | 66 | (254 | ) | ||||||||||||||
| Regular savings accounts | (3 | ) | 0 | (3 | ) | (4 | ) | (4 | ) | (8 | ) | |||||||||||||
| Money market accounts | 660 | 469 | 1,129 | 214 | 463 | 677 | ||||||||||||||||||
| Time deposits | 1,211 | 2,030 | 3,241 | 1,540 | 3,726 | 5,266 | ||||||||||||||||||
| FHLB borrowings | 285 | (114 | ) | 171 | 375 | 324 | 699 | |||||||||||||||||
| Demand notes payable to | ||||||||||||||||||||||||
| U.S. Treasury | 4 | 1 | 5 | 1 | 12 | 13 | ||||||||||||||||||
| Trust Preferred Securities | (320 | ) | (167 | ) | (487 | ) | 752 | 273 | 1,025 | |||||||||||||||
| Other | 501 | 5 | 506 | 208 | 55 | 263 | ||||||||||||||||||
| Total interest expense | 2,229 | 2,246 | 4,475 | 2,766 | 4,915 | 7,681 | ||||||||||||||||||
| Net interest income | $ | 3,314 | (1,348 | ) | 1,966 | $ | 1,817 | 4,095 | 5,912 |
Net interest income on a tax equivalent basis totaled $35.0 million in 2007, increasing 6% or $2.0 million from 2006. The increase was attributable to an increase interest income due to increases in the average outstanding balance of loans. The interest rate spread, which represents the rate earned on interest-earning assets less the rate paid on interest-bearing liabilities, was 3.67% in 2007, a decrease from the 2006 net interest spread of 3.89%. The net yield on interest-earning assets in 2007 decreased to 4.37% from the 2006 net interest margin of 4.51%.
Tax equivalent interest income increased $6.4 million or 11% in 2007 primarily due to an increase in the Bank’s average outstanding balance of loans combined with an increase in the yield of interest-earning assets. The yield on interest-earning assets increased to 7.81% in 2007 from 7.66% in 2006 as a result of a higher Prime Rate in effect for the first six months of 2007 being earned on higher loan balances plus an increase in the balance outstanding of higher yielding adjustable rate mortgage loans. Average interest-earning assets increased $68.9 million primarily as the result of a $61.0 million increase in average loans. Average investment securities in 2007 increased 2% to $120.3 million when compared to 2006. All other interest-earning assets including federal funds sold were $15.4 million in 2007 and $9.7 million in 2006.
Interest expense increased $4.5 million or 19% in 2007 due to an increase in the average rate paid on interest-bearing liabilities combined with a $52.0 million increase in volume of interest-bearing liabilities. The cost of funds increased to 4.14% in 2007 from 3.77% in 2006. This increase in the cost of funds was primarily attributable to increases in the average rate paid on interest-bearing checking and savings accounts and certificates of deposit. The $52.0 million growth in average interest-bearing liabilities was primarily attributable to an increase in time deposits of $26.8 million to $361.9 million in 2007 from $335.1 million in 2006 and an increase in interest-bearing checking and savings accounts of $13.1 million to $186.2 million in 2007 from $173.1 million in 2006.
In 2006 net interest income on a tax equivalent basis increased $5.9 million or 22% to $33.0 million in 2006 from $27.1 million in 2005. The interest rate spread was 3.89% in 2006, an increase from the 2005 net interest spread of 3.62%. The net yield on interest-earning assets in 2006 increased to 4.51% from the 2005 net interest margin of 4.05%.
A-8
Provision for Loan Losses. Provisions for loan losses are charged to income in order to bring the total allowance for loan losses to a level deemed appropriate by management of the Company based on factors such as management’s judgment as to losses within the Company’s loan portfolio, including the valuation of impaired loans in accordance with SFAS No. 114 and No. 118, loan growth, net charge-offs, changes in the composition of the loan portfolio, delinquencies and management’s assessment of the quality of the loan portfolio and general economic climate.
The provision for loan losses was $2.0 million, $2.5 million, and $3.1 million for the years ended December 31, 2007, 2006 and 2005, respectively. The decrease in the provision for loan losses for 2007 is primarily attributable to a decrease in net charge-offs of $396,000 for the year ended December 31, 2007 when compared to the year ended December 31, 2006, offset by the effect of loan growth. Please see the section below entitled “Allowance for Loan Losses” for a more complete discussion of the Bank’s policy for addressing potential loan losses.
Non-Interest Income. Non-interest income for 2007 totaled $8.8 million, an increase of $1.2 million or 17% from non-interest income of $7.6 million for 2006. The increases in non-interest income for 2007 are primarily due to an increase in service charges and fees resulting from growth in deposit base coupled with normal pricing changes, an increase in insurance and brokerage commissions, an increase in mortgage banking income and an increase in miscellaneous income. Non-interest income for 2006 increased $886,000 or 13% from non-interest income of $6.7 million for 2005. The increase in non-interest income for 2006 is primarily due to an increase in service charges and fees resulting from activity in new branches and an increase in miscellaneous income.
Service charges on deposit accounts totaled $4.3 million during 2007, an increase of $349,000, or 9% over 2006. Service charge income increased $150,000, or 4% in 2006 compared to 2005. These increases are primarily attributable to growth in the deposit base coupled with normal pricing changes, which resulted in an increase in account maintenance fees.
Other service charges and fees increased 26% to $1.9 million for the year ended December 31, 2007 as compared to $1.5 million for the same period one year ago. This increase is primarily attributable to fee income from new branches.
The Company reported net losses on sale and writedown of securities of $562,000, $592,000 and $730,000 in 2007, 2006 and 2005, respectively. The Company periodically evaluates its investments for any impairment which would be deemed other than temporary. As part of its evaluation in 2007, the Company determined that the fair value of two investments was less than the original cost of the investments and that the decline in fair value was not temporary in nature. As a result, the Company wrote down its original investment by $430,000. The remaining value of the investments at December 31, 2007 is $348,000. Losses on the sale of securities in 2006 and 2005 were primarily due to restructuring of the Bank’s investment portfolio to reduce exposure to a decrease in interest rates.
Mortgage banking income increased to $118,000 in 2007 from $108,000 in 2006 primarily due to an increase in brokered loan activity. During 2006 mortgage banking income decreased $180,000 from the $469,000 reported in 2005. The decrease in mortgage banking income for 2006 was primarily attributable to the $185,000 write-down of the Bank’s mortgage servicing asset due to Management’s assessment that there was minimal fair value in the mortgage servicing rights due to the small remaining balance in the loans serviced for others.
Net losses on repossessed assets were $118,000 for 2007 compared to net losses on repossessed assets of $108,000 for 2006. During 2005 a net loss on repossessed assets of $38,000 was recognized. The increase in net losses on repossessed assets during 2006 was primarily attributable to a $110,000 write-down on foreclosed property partially offset by a gain on the disposition of assets. Management determined that the market value of these assets had decreased significantly and charges were appropriate during fourth quarter 2006.
Miscellaneous income for 2007 totaled $2.2 million, an increase of 4% from $2.1 million for 2006. During 2006, miscellaneous income increased 27% primarily due to an increase in debit card fee income. The 2006 increase in miscellaneous income was primarily attributable to an increase in debit card fee income primarily associated with increased card usage due to an increased number of demand accounts and income amounting to $118,000 distributed by a SBIC investment owned by the Bank.
A-9
Table 3 presents a summary of non-interest income for the years ended December 31, 2007, 2006 and 2005.
| Table 3 - Non-Interest Income | ||||||||||||
| (Dollars in Thousands) | 2007 | 2006 | 2005 | |||||||||
| Service charges | $ | 4,279 | 3,930 | 3,780 | ||||||||
| Other service charges and fees | 1,938 | 1,540 | 1,142 | |||||||||
| Gain (loss) on sale of securities | (562 | ) | (592 | ) | (730 | ) | ||||||
| Mortgage banking income | 560 | 289 | 469 | |||||||||
| Insurance and brokerage commissions | 521 | 389 | 387 | |||||||||
| Loss on foreclosed and repossessed assets | (118 | ) | (108 | ) | (38 | ) | ||||||
| Miscellaneous | 2,198 | 2,106 | 1,658 | |||||||||
| Total non-interest income | $ | 8,816 | 7,554 | 6,668 | ||||||||
Non-Interest Expense. Total non-interest expense amounted to $26.0 million for 2007, an increase of 13% from 2006. Non-interest expense for 2006 increased 13% to $23.0 million from non-interest expense of $20.3 million for 2005.
Salary and employee benefit expense was $13.9 million in 2007, compared to $11.8 million during 2006, an increase of $2.1 million or 18%, following a $921,000 or 8% increase in salary and employee benefit expense in 2006 over 2005. The increase in salary and employee benefits in 2007 and 2006 is primarily due to normal salary increases and expense associated with additional staff for new branches.
The Company recorded occupancy expenses of $4.8 million in 2007, compared to $4.2 million during 2006, an increase of $571,000 or 14%, following an increase of $231,000 or 6% in occupancy expenses in 2006 over 2005. The increases in 2007 and 2006 are primarily due to an increase in furniture and equipment expense and lease expense associated with new branches. During 2003, the Company sold a branch location with net book value of approximately $2.4 million and was leasing the facility from the buyer. As a result of the sale, the Company deferred a gain of approximately $633,000 and was recognizing the gain over the lease term. For the period ended December 31, 2007 the Company recognized approximately $10,000 of the deferred gain and for the periods ended December 31, 2006 and 2005, respectively, approximately $21,000 and $22,000 of the deferred gain was recognized. In 2007, the Company repurchased the branch location for $3.0 million, which was $588,000 greater than the original cost of the building. The remaining deferred gain was netted against the purchase price resulting in a net cost of $2.5 million. This cost is being depreciated over 39 years.
The total of all other operating expenses increased $336,000 or 5% during 2007. The increase in other expense for 2007 is primarily attributable to an increase of $215,000 in advertising expense. Other operating expense increased $1.5 million or 27% in 2006 over 2005. The increase in other expense for 2006 is primarily attributable to increases of $342,000 in consulting expenses due to Sarbanes-Oxley 404 compliance related expenses and disaster recovery planning expenses, and increase of $444,000 in amortization of the issuance costs of the trust preferred securities issued in 2001 that were called on December 31, 2006, an increase in $206,000 in debit card expense and an increase of $117,000 in advertising expense.
A-10
Table 4 presents a summary of non-interest expense for the years ended December 31, 2007, 2006 and 2005.
| Table 4 - Non-Interest Expense | |||||||||||
| (Dollars in Thousands) | 2007 | 2006 | 2005 | ||||||||
| Salaries and wages | $ | 10,276 | 9,368 | 7,162 | |||||||
| Employee benefits | 3,612 | 2,417 | 3,702 | ||||||||
| Total personnel expense | 13,888 | 11,785 | 10,864 | ||||||||
| Occupancy expense | 4,751 | 4,180 | 3,949 | ||||||||
| Office supplies | 554 | 436 | 314 | ||||||||
| FDIC deposit insurance | 140 | 75 | 76 | ||||||||
| Professional services | 400 | 239 | 389 | ||||||||
| Postage | 320 | 307 | 264 | ||||||||
| Telephone | 405 | 338 | 403 | ||||||||
| Director fees and expense | 499 | 423 | 334 | ||||||||
| Advertising | 988 | 772 | 656 | ||||||||
| Consulting fees | 460 | 575 | 233 | ||||||||
| Taxes and licenses | 272 | 293 | 218 | ||||||||
| Other operating expense | 3,316 | 3,560 | 2,630 | ||||||||
| Total non-interest expense | $ | 25,993 | 22,983 | 20,330 | |||||||
Income Taxes. Total income tax expense was $5.3 million in 2007 compared with $5.2 million in 2006 and $3.4 million in 2005. The primary reason for the increase in taxes for 2007 and 2006 as compared to 2005 was the increase in pretax income, which reduced the impact of non-taxable income. The Company’s effective tax rates were 35.76%, 36.05% and 34.81% in 2007, 2006 and 2005, respectively.
Liquidity. The objectives of the Company’s liquidity policy are to provide for the availability of adequate funds to meet the needs of loan demand, deposit withdrawals, maturing liabilities and to satisfy regulatory requirements. Both deposit and loan customer cash needs can fluctuate significantly depending upon business cycles, economic conditions and yields and returns available from alternative investment opportunities. In addition, the Company’s liquidity is affected by off-balance sheet commitments to lend in the form of unfunded commitments to extend credit and standby letters of credit. As of December 31, 2007 such unfunded commitments to extend credit were $190.7 million, while commitments in the form of standby letters of credit totaled $3.9 million.
The Company uses several sources to meet its liquidity requirements. The primary source is core deposits, which includes demand deposits, savings accounts and certificates of deposits of denominations less than $100,000. The Company considers these to be a stable portion of the Company’s liability mix and the result of on-going consumer and commercial banking relationships. As of December 31, 2007, the Company’s core deposits totaled $490.1 million, or 71% of total deposits.
The other sources of funding for the Company are through large denomination certificates of deposit, including brokered deposits, federal funds purchased and FHLB advances. The Bank is also able to borrow from the Federal Reserve on a short-term basis.
At December 31, 2007, the Bank had a significant amount of deposits in amounts greater than $100,000, including brokered deposits of $53.9 million, which mature over the next two years. The balance and cost of these deposits are more susceptible to changes in the interest rate environment than other deposits. For additional information, please see the section below entitled “Deposits.”
The Bank has a line of credit with the FHLB equal to 20% of the Bank’s total assets, with an outstanding balance of $87.5 million at December 31, 2007. The remaining availability at FHLB was $63.9 million at December 31, 2007. The Bank also had the ability to borrow up to $35.0 million for the purchase of overnight federal funds from three correspondent financial institutions as of December 31, 2007.
The liquidity ratio for the Bank, which is defined as net cash, interest-bearing deposits with banks, federal funds sold, certain investment securities and certain FHLB advances available under the line of credit, as a percentage of net deposits (adjusted for deposit runoff projections) and short-term liabilities was 28.04% at December 31, 2007, 31.15% at December 31, 2006 and 36.81% at December 31, 2006. The minimum required liquidity ratio as defined in the Bank’s Asset/Liability and Interest Rate Risk Management Policy is 20%.
A-11
As disclosed in the Company’s Consolidated Statements of Cash Flows included elsewhere herein, net cash provided by operating activities was approximately $14.5 million during 2007. Net cash used in investing activities of $80.6 million consisted primarily of a net increase in loans of $72.8 million. Net cash provided by financing activities amounted to $74.4 million, primarily from $59.8 million net increase in deposits.
Asset Liability and Interest Rate Risk Management. The objective of the Company’s Asset Liability and Interest Rate Risk strategies is to identify and manage the sensitivity of net interest income to changing interest rates and to minimize the interest rate risk between interest-earning assets and interest-bearing liabilities at various maturities. This is done in conjunction with the need to maintain adequate liquidity and the overall goal of maximizing net interest income. Table 5 presents an interest rate sensitivity analysis for the interest-earning assets and interest-bearing liabilities for the year ended December 31, 2007.
| Table 5 - Interest Sensitivity Analysis | |||||||||||||||||||||||
| (Dollars in Thousands) | Immediate | 1-3 months | 4-12 months | Total Within One Year | Over One Year & Non-sensitive | Total | |||||||||||||||||
| Interest-earning assets: | |||||||||||||||||||||||
| Loans | $ | 481,495 | 4,941 | 13,170 | 499,606 | 222,671 | 722,277 | ||||||||||||||||
| Mortgage loans available for sale | - | - | - | - | - | - | |||||||||||||||||
| Investment securities | - | 8,881 | - | 8,881 | 112,087 | 120,968 | |||||||||||||||||
| Federal funds sold | 2,152 | - | - | 2,152 | - | 2,152 | |||||||||||||||||
| Interest-bearing deposit accounts | 1,539 | - | - | 1,539 | - | 1,539 | |||||||||||||||||
| Other interest-earning assets | - | - | - | - | 6,942 | 6,942 | |||||||||||||||||
| Total interest-earning assets | 485,186 | 13,822 | 13,170 | 512,178 | 341,700 | 853,878 | |||||||||||||||||
| Interest-bearing liabilities: | |||||||||||||||||||||||
| NOW, savings, and money market deposits | 196,960 | - | - | 196,960 | - | 196,960 | |||||||||||||||||
| Time deposits | 69,515 | 101,204 | 192,517 | 363,236 | 21,372 | 384,608 | |||||||||||||||||
| Other short term borrowings | 1,600 | - | - | 1,600 | - | 1,600 | |||||||||||||||||
| FHLB borrowings | 10,500 | 5,000 | - | 15,500 | 72,000 | 87,500 | |||||||||||||||||
| Securities sold under agreement to repurchase | 27,583 | - | - | 27,583 | - | 27,583 | |||||||||||||||||
| Trust preferred securities | - | 20,619 | - | 20,619 | - | 20,619 | |||||||||||||||||
| Total interest-bearing liabilities | 306,158 | 126,823 | 192,517 | 625,498 | 93,372 | 718,870 | |||||||||||||||||
| Interest-sensitive gap | $ | 179,028 | (113,001 | ) | (179,347 | ) | (113,320 | ) | 248,328 | 135,008 | |||||||||||||
| Cumulative interest-sensitive gap | $ | 179,028 | 66,027 | (113,320 | ) | (113,320 | ) | 135,008 | |||||||||||||||
| Interest-earning assets as a percentage of | |||||||||||||||||||||||
| interest-bearing liabilities | 158.48 | % | 10.90 | % | 6.84 | % | 81.88 | % | 365.96 | % | |||||||||||||
The Company manages its exposure to fluctuations in interest rates through policies established by the Asset/Liability Committee (“ALCO”) of the Bank. The ALCO meets monthly and has the responsibility for approving asset/liability management policies, formulating and implementing strategies to improve balance sheet positioning and/or earnings and reviewing the interest rate sensitivity of the Company. ALCO tries to minimize interest rate risk between interest-earning assets and interest-bearing liabilities by attempting to minimize wide fluctuations in net interest income due to interest rate movements. The ability to control these fluctuations has a direct impact on the profitability of the Company. Management monitors this activity on a regular basis through analysis of its portfolios to determine the difference between rate sensitive assets and rate sensitive liabilities.
The Company’s rate sensitive assets are those earning interest at variable rates and those with contractual maturities within one year. Rate sensitive assets therefore include both loans and available for sale securities. Rate sensitive liabilities include interest-bearing checking accounts, money market deposit accounts, savings accounts, time deposits and borrowed funds. As shown in Table 5, the Company’s balance sheet is asset-sensitive, meaning that in a given period there will be more assets than liabilities subject to immediate repricing as interest rates change in the market. Because most of the Company’s loans are tied to the prime rate, they reprice more rapidly than rate sensitive interest-bearing deposits. During periods of rising rates, this results in increased net interest income. The opposite occurs during periods of declining rates. Rate sensitive assets at December 31, 2007 totaled $853.9 million, exceeding rate sensitive liabilities of $718.9 million by $135.0 million.
A-12
In order to assist in achieving a desired level of interest rate sensitivity, the Company entered into off-balance sheet contracts that are considered derivative financial instruments. As of December 31, 2007, the Company had cash flow hedges with a notional amount of $185.0 million. These derivative instruments consist of five interest rate floor contracts that are used to hedge future cash flows from payments on the first $185.0 million of certain variable rate loans against the downward effects of their repricing in the event of a decreasing rate environment for periods ending in July 2008, November 2008, January 2009, June 2009 and December 2009. If the prime rate falls below 6.25% during the term of the contract on the first floor, the Company will receive payments based on the $35.0 million notional amount times the difference between 6.25% and the weighted average prime rate for the quarter. No payments will be received by the Company if the weighted average prime rate is 6.25% or higher. The Company paid a premium of $161,000 on this contact. On the second floor if the prime rate falls below 7.00% during the term of the contract, the Company will receive payments based on the $35.0 million notional amount times the difference between 7.00% and the weighted average prime rate for the quarter. No payments will be received by the Company if the weighted average prime rate is 7.00% or higher. The Company paid a premium of $203,000 on this contract. On the third floor if the prime rate falls below 7.50% during the term of the contract, the Company will receive payments based on the $45.0 million notional amount times the difference between 7.50% and the weighted average prime rate for the quarter. No payments will be received by the Company if the weighted average prime rate is 7.50% or higher. The Company paid a premium of $562,500 on this contract. On the fourth floor if the prime rate falls below 8.00% during the term of the contract, the Company will receive payments based on the $35.0 million notional amount times the difference between 8.00% and the weighted average prime rate for the quarter. No payments will be received by the Company if the weighted average prime rate is 8.00% or higher. The Company paid a premium of $399,000 on this contract. On the fifth floor if the prime rate falls below 7.25% during the term of the contract, the Company will receive payments based on the $35.0 million notional amount times the difference between 7.25% and the weighted average prime rate for the quarter. No payments will be received by the Company if the weighted average prime rate is 7.25% or higher. The Company paid a premium of $634,000 on this contract.
The Company recognized $47,000 in interest income from payments on interest rate floor contracts in 2007. Based on the current interest rate environment, it is expected the Company will continue to receive income on these interest rate contracts in 2008.
Included in the rate sensitive assets are $471.6 million in variable rate loans indexed to prime rate subject to immediate repricing upon changes by the FOMC. The Bank utilizes interest rate floors on certain variable rate loans to protect against further downward movements in the prime rate. At December 31, 2007, the Bank had $75.6 million in loans with interest rate floors. The floors were in effect on $27.7 million of these loans pursuant to the terms of the promissory notes on these loans. The weighted average rate on these loans is 0.25% higher than the indexed rate on the promissory notes without interest rate floors.
The Bank also had $1.6 million in loans that are tied to the prime rate and had interest rate caps in effect pursuant to the terms of the promissory notes on these loans. The weighted average rate on these loans is 0.47% lower than the indexed rate on the promissory notes without the interest rate caps.
An analysis of the Company’s financial condition and growth can be made by examining the changes and trends in interest-earning assets and interest-bearing liabilities. A discussion of these changes and trends follows.
Analysis of Financial Condition
Investment Securities. All of the Company’s investment securities are held in the available-for-sale (“AFS”) category. At December 31, 2007 the market value of AFS securities totaled $121.0 million, compared to $117.6 million and $115.2 million at December 31, 2006 and 2005, respectively. The increase in 2007 investment securities is the result of net securities purchases that are part of management’s objective to grow the investment portfolio in an effort to manage the credit risk in the balance sheet. This increase in AFS securities was partially offset by paydowns on mortgage-backed securities, calls and maturities. Table 6 presents the market value of the AFS securities held at December 31, 2007, 2006 and 2005.
A-13
| Table 6 - Summary of Investment Portfolio | ||||||||||||
| (Dollars in Thousands) | 2007 | 2006 | 2005 | |||||||||
| Obligations of United States government | ||||||||||||
| agencies and corporations | $ | 76,992 | 72,744 | 60,243 | ||||||||
| Obligations of states and political subdivisions | 25,905 | 24,366 | 21,609 | |||||||||
| Mortgage-backed securities | 16,271 | 19,220 | 31,004 | |||||||||
| Trust preferred securities | 250 | 750 | 1,750 | |||||||||
| Equity securities | 1,550 | 501 | 552 | |||||||||
| Total securities | $ | 120,968 | 117,581 | 115,158 | ||||||||
The composition of the investment securities portfolio reflects the Company’s investment strategy of maintaining an appropriate level of liquidity while providing a relatively stable source of income. The investment portfolio also provides a balance to interest rate risk and credit risk in other categories of the balance sheet while providing a vehicle for the investment of available funds, furnishing liquidity, and supplying securities to pledge as required collateral for certain deposits.
The Company’s investment portfolio consists of U.S. government agency securities, municipal securities, U.S. government agency sponsored mortgage-backed securities, trust preferred securities and equity securities. AFS securities averaged $120.3 million in 2007, $118.1 million in 2006 and $108.7 million in 2005. Table 7 presents the amortized cost of AFS securities held by the Company by maturity category at December 31, 2007. Yield information does not give effect to changes in fair value that are reflected as a component of shareholders’ equity. Yields are calculated on a tax equivalent basis. Yields and interest income on tax-exempt investments have been adjusted to tax equivalent basis using an effective tax rate 38.55% for securities that are both federal and state tax exempt and an effective tax rate of 6.90% for state tax exempt securities.
| Table 7 - Maturity Distribution and Weighted Average Yield on Investments | ||||||||||||||||||||||||||||||
| After One Year | After 5 Years | |||||||||||||||||||||||||||||
| One Year or Less | Through 5 Years | Through 10 Years | After 10 Years | Totals | ||||||||||||||||||||||||||
| (Dollars in Thousands) | Amount | Yield | Amount | Yield | Amount | Yield | Amount | Yield | Amount | Yield | ||||||||||||||||||||
| Book value: | ||||||||||||||||||||||||||||||
| United States Government agencies | $ | 4,999 | 4.52% | 45,249 | 4.93% | 22,228 | 5.47% | 2,679 | 6.08% | 75,155 | 5.11% | |||||||||||||||||||
| States and political subdivisions | 2,320 | 6.23% | 11,173 | 4.76% | 7,052 | 6.13% | 5,311 | 6.58% | 25,856 | 5.64% | ||||||||||||||||||||
| Mortgage backed securities | - | - | 673 | 4.55% | 3,591 | 4.46% | 12,206 | 4.71% | 16,470 | 4.65% | ||||||||||||||||||||
| Trust preferred securities | - | - | - | - | - | - | 250 | 8.11% | 250 | 8.11% | ||||||||||||||||||||
| Equity securities | - | - | - | - | - | - | 1,693 | 0.92% | 1,693 | 0.92% | ||||||||||||||||||||
| Total securities | $ | 7,319 | 5.06% | 57,095 | 4.90% | 32,871 | 5.50% | 22,139 | 5.07% | 119,424 | 5.10% | |||||||||||||||||||
Loans. The loan portfolio is the largest category of the Company’s earning assets and is comprised of commercial loans, real estate mortgage loans, real estate construction loans and consumer loans. The Company grants loans and extensions of credit primarily within the Catawba Valley region of North Carolina, which encompasses Catawba, Alexander, Iredell and Lincoln counties and also in Mecklenburg and Union counties. Although the Company has a diversified loan portfolio, a substantial portion of the loan portfolio is collateralized by real estate, which is dependent upon the real estate market. Non-real estate loans also can be affected by local economic conditions.
A-14
In management’s opinion, there are no significant concentrations of credit with particular borrowers engaged in similar activities.
Real estate mortgage loans include both commercial and residential mortgage loans. At December 31, 2007, the Company had $94.8 million in residential mortgage loans, $79.3 million in home equity loans and $243.6 million in commercial mortgage loans, which include $195.1 million using commercial property as collateral and $48.5 million using residential property as collateral.
Residential mortgage loans include $36.9 million made to customers in the Company’s traditional banking offices and $57.9 million in mortgage loans originated in the Company’s Latino banking operations. All residential mortgage loans are originated as fully amortizing loans, with no negative amortization. Also, the Company does not have credit exposure for residential mortgage loans originated that are not reflected in the Company’s assets and does not have any residential mortgage loans with a loan-to-value ratio in excess of 100%.
The mortgage loans originated in the traditional banking offices are generally 15 to 30 year fixed rate loans with attributes that cause the loans to not be sellable in the secondary market. These factors may include higher loan-to-value ratio, limited documentation on income, non-conforming appraisal or non-conforming property type and are generally made to existing Bank customers. These loans have been originated throughout the Company’s five county service area, with no geographic concentration. At December 31, 2007 there were 14 loans with an outstanding balance of $2.0 million more than 30 days past due and no loans more than 90 days past due.
The mortgage loans originated in the Company’s Latino operations are primarily adjustable rate mortgage loans that adjust annually after the end of the first five years of the loan. The loans are tied to the one-year T-Bill index and, if they were to adjust at 12/31/07, would have a reduction in the interest rate on the loan. The underwriting on these loans includes both full income verification and no income verification, with loan-to-value ratios of up to 95% without private mortgage insurance. A majority of these loans would be considered subprime loans, as they were underwritten using stated income rather than fully documented income verification. No other loans in the Company’s portfolio would be considered subprime. The majority of these loans have been originated within the Charlotte, NC metro area. At this time, Charlotte has not experienced a decline in values within the residential real estate market. At December 31, 2007 there were 46 loans with an outstanding balance of $4.9 million more than 30 days past due and no loans more than 90 days past due. Total losses on this portfolio, since the first loans were originated in 2004 have amounted to approximately $15,000 through December 31, 2007.
The composition of the Company’s loan portfolio is presented in Table 8.
| Table 8 - Loan Portfolio | ||||||||||||||||||||||||||||||||||||||||
| 2007 | 2006 | 2005 | 2004 | 2003 | ||||||||||||||||||||||||||||||||||||
| (Dollars in Thousands) | Amount | % of Loans | Amount | % of Loans | Amount | % of Loans | Amount | % of Loans | Amount | % of Loans | ||||||||||||||||||||||||||||||
| Breakdown of loan receivables: | ||||||||||||||||||||||||||||||||||||||||
| Commercial | $ | 82,190 | 11.38 | % | 85,064 | 13.06 | % | 79,902 | 14.10 | % | 79,189 | 14.79 | % | 90,558 | 16.41 | % | ||||||||||||||||||||||||
| Real estate - mortgage | 417,709 | 57.83 | % | 364,595 | 55.97 | % | 330,227 | 58.28 | % | 312,988 | 58.45 | % | 332,730 | 60.26 | % | |||||||||||||||||||||||||
| Real estate - construction | 209,644 | 29.03 | % | 187,960 | 28.86 | % | 141,420 | 24.96 | % | 127,042 | 23.73 | % | 110,392 | 19.99 | % | |||||||||||||||||||||||||
| Consumer | 12,734 | 1.76 | % | 13,762 | 2.11 | % | 15,115 | 2.66 | % | 16,249 | 3.03 | % | 18,446 | 3.34 | % | |||||||||||||||||||||||||
| Total loans | $ | 722,277 | 100.00 | % | 651,381 | 100.00 | % | 566,664 | 100.00 | % | 535,468 | 100.00 | % | 552,126 | 100.00 | % | ||||||||||||||||||||||||
| Less: Allowance for loan losses | 9,103 | 8,303 | 7,425 | 8,049 | 9,722 | |||||||||||||||||||||||||||||||||||
| Net loans | $ | 713,174 | 643,078 | 559,239 | 527,419 | 542,404 | ||||||||||||||||||||||||||||||||||
As of December 31, 2007, gross loans outstanding were $722.3 million, an increase of $70.9 million or 11% from the December 31, 2006 balance of $651.4 million. Commercial loans decreased $2.9 million in 2007. Real estate mortgage loans grew $53.1 million when compared to 2006 due to an increase in non-conforming mortgage loans and commercial real estate loans. Real estate construction loans increased $21.7 million in 2007 as a result of an increase in real estate development loans. Consumer loans decreased $1.0 million in 2007.
A-15
Table 9 identifies the maturities of all loans as of December 31, 2007 and addresses the sensitivity of these loans to changes in interest rates.
| Table 9 - Maturity and Repricing Data for Loans | |||||||||||||||
| (Dollars in Thousands) | Within one year or less | After one year through five years | After five years | Total loans | |||||||||||
| Commercial | $ | 65,308 | 14,835 | 2,047 | 82,190 | ||||||||||
| Real estate - mortgage | 233,365 | 138,492 | 45,852 | 417,709 | |||||||||||
| Real estate - construction | 195,626 | 12,402 | 1,616 | 209,644 | |||||||||||
| Consumer | 5,307 | 6,544 | 883 | 12,734 | |||||||||||
| Total loans | $ | 499,606 | 172,273 | 50,398 | 722,277 | ||||||||||
| Total fixed rate loans | $ | 18,484 | 113,733 | 50,398 | 182,615 | ||||||||||
| Total floating rate loans | 481,122 | 58,540 | - | 539,662 | |||||||||||
| Total loans | $ | 499,606 | 172,273 | 50,398 | 722,277 | ||||||||||
In the normal course of business, there are various commitments outstanding to extend credit that are not reflected in the financial statements. At December 31, 2007, outstanding loan commitments totaled $190.7 million. Commitments to extend credit are agreements to lend to a customer as long as there is no violation of any condition established in the contract. Commitments generally have fixed expiration dates or other termination clauses and may require payment of a fee. Since many of the commitments may expire without being drawn upon, the total commitment amounts do not necessarily represent future cash requirements. Additional information regarding commitments is provided below in the section entitled “Contractual Obligations” and in Note 10 to the Consolidated Financial Statements.
Allowance for Loan Losses. The allowance for loan losses reflects management's assessment and estimate of the risks associated with extending credit and its evaluation of the quality of the loan portfolio. The Bank periodically analyzes the loan portfolio in an effort to review asset quality and to establish an allowance for loan losses that management believes will be adequate in light of anticipated risks and loan losses. In assessing the adequacy of the allowance, size, quality and risk of loans in the portfolio are reviewed. Other factors considered are:
| · | the Bank’s loan loss experience; |
| · | the amount of past due and non-performing loans; |
| · | specific known risks; |
| · | the status and amount of other past due and non-performing assets; |
| · | underlying estimated values of collateral securing loans; |
| · | current and anticipated economic conditions; and |
| · | other factors which management believes affect the allowance for potential credit losses. |
Management uses several measures to assess and monitor the credit risks in the loan portfolio, including a loan grading system that begins upon loan origination and continues until the loan is collected or collectibility becomes doubtful. Upon loan origination, the Bank’s originating loan officer evaluates the quality of the loan and assigns one of nine risk grades, each grade indicating a different level of loss reserves. The loan officer monitors the loan’s performance and credit quality and makes changes to the credit grade as conditions warrant. When originated or renewed, all loans over a certain dollar amount receive in-depth reviews and risk assessments by the Bank’s Credit Administration. Before making any changes in these risk grades, management considers assessments as determined by the third party credit review firm (as described below), regulatory examiners and the Bank’s Credit Administration. Any issues regarding the risk assessments are addressed by the Bank’s senior credit administrators and factored into management’s decision to originate or renew the loan as well as the level of reserves deemed appropriate for the loan. The Bank’s Board of Directors reviews, on a monthly basis, an analysis of the Bank’s reserves relative to the range of reserves estimated by the Bank’s Credit Administration.
As an additional measure, the Bank engages an independent third party to review the underwriting, documentation, risk grading analyses and the methodology of determining the adequacy of the allowance for losses. This independent third party reviews and evaluates all loan relationships greater than $1.0 million. The third party’s evaluation and report is shared with management and the Bank’s Board of Directors.
A-16
Management considers certain commercial loans with weak credit risk grades to be individually impaired and measures such impairment based upon available cash flows and the value of the collateral. Allowance or reserve levels are estimated for all other graded loans in the portfolio based on their assigned credit risk grade, type of loan and other matters related to credit risk.
Management uses the information developed from the procedures described above in evaluating and grading the loan portfolio. This continual grading process is used to monitor the credit quality of the loan portfolio and to assist management in determining the appropriate levels of the allowance for loan losses.
The allowance for loan losses is comprised of three components: specific reserves, general reserves and unallocated reserves. After a loan has been identified as impaired, management measures impairment in accordance with SFAS No. 114, “Accounting By Creditors for Impairment of a Loan.” When the measure of the impaired loan is less than the recorded investment in the loan, the amount of the impairment is recorded as a specific reserve. These specific reserves are determined on an individual loan basis based on management’s current evaluation of the Company’s loss exposure for each credit, given the payment status, financial condition of the borrower, and value of any underlying collateral. Loans for which specific reserves are provided are excluded from the general allowance calculations as described below. At December 31, 2007 and 2006, the recorded investment in loans that were considered to be impaired under SFAS No. 114 was approximately $8.0 million and $7.6 million, respectively, with related allowance for loan losses of approximately $1.2 million for December 31, 2007 and 2006.
The general allowance reflects reserves established under the provisions of SFAS No. 5, “Accounting for Contingencies” for collective loan impairment. These reserves are based upon historical net charge-offs using the last three years’ experience. This charge-off experience may be adjusted to reflect the effects of current conditions. The Bank considers information derived from its loan risk ratings and external data related to industry and general economic trends.
The unallocated allowance is determined through management’s assessment of probable losses that are in the portfolio but are not adequately captured by the other two components of the allowance, including consideration of current economic and business conditions and regulatory requirements. The unallocated allowance also reflects management’s acknowledgement of the imprecision and subjectivity that underlie the modeling of credit risk. Due to the subjectivity involved in determining the overall allowance, including the unallocated portion, this unallocated portion may fluctuate from period to period based on management’s evaluation of the factors affecting the assumptions used in calculating the allowance.
Management considers the allowance for loan losses adequate to cover the estimated losses inherent in the Company’s loan portfolio as of the date of the financial statements. Management believes it has established the allowance in accordance with accounting principles generally accepted in the United States of America and in consideration of the current economic environment. Although management uses the best information available to make evaluations, significant future additions to the allowance may be necessary based on changes in economic and other conditions that adversely affect the operating results of the Company.
There were no significant changes in the estimation methods or fundamental assumptions used in the evaluation of the allowance for loan losses for the year ended December 31, 2007 as compared to the year ended December 31, 2006. Such revisions, estimates and assumptions are made in any period in which the supporting factors indicate that loss levels may vary from the previous estimates.
Additionally, various regulatory agencies, as an integral part of their examination process, periodically review the Bank’s allowances for loan losses. Such agencies may require adjustments to the allowances based on their judgments of information available to them at the time of their examinations.
Net charge-offs for 2007 were $1.2 million. The ratio of net charge-offs to average total loans was 0.19% in 2007, 0.27% in 2006 and 0.68% in 2005. Management expects the ratio of net charge-offs to average total loans in 2008 to be in a range similar to the ratios for 2007 and 2006. The allowance for loan losses increased to $9.1 million or 1.26% of total loans outstanding at December 31, 2007. For December 31, 2006 and 2005, the allowance for loan losses amounted to $8.3 million or 1.27% of total loans outstanding and $7.4 million, or 1.31% of total loans outstanding, respectively.
A-17
Table 10 presents the percentage of loans assigned to each risk grade along with the general reserve percentage applied to loans in each risk grade at December 31, 2007 and 2006.
| Table 10 - Loan Risk Grade Analysis | |||
| Percentage of Loans | |||
| By Risk Grade* | |||
| Risk Grade | 2007 | 2006 | |
| Risk 1 (Excellent Quality) | 11.06% | 12.03% | |
| Risk 2 (High Quality) | 14.06% | 14.89% | |
| Risk 3 (Good Quality) | 62.53% | 60.31% | |
| Risk 4 (Management Attention) | 9.51% | 10.46% | |
| Risk 5 (Watch) | 1.57% | 0.41% | |
| Risk 6 (Substandard) | 0.13% | 0.70% | |
| Risk 7 (Low Substandard) | 0.03% | 0.02% | |
| Risk 8 (Doubtful) | 0.00% | 0.00% | |
| Risk 9 (Loss) | 0.00% | 0.00% | |
| * Excludes non-accrual loans | |||
Table 11 presents an analysis of the allowance for loan losses, including charge-off activity.
| Table 11 - Analysis of Allowance for Loan Losses | ||||||||||||||||||||
| (Dollars in Thousands) | 2007 | 2006 | 2005 | 2004 | 2003 | |||||||||||||||
| Reserve for loan losses at beginning | $ | 8,303 | 7,425 | 8,049 | 9,722 | 7,248 | ||||||||||||||
| Loans charged off: | ||||||||||||||||||||
| Commercial | 414 | 505 | 293 | 1,004 | 1,179 | |||||||||||||||
| Real estate - mortgage | 471 | 568 | 2,141 | 3,842 | 2,422 | |||||||||||||||
| Real estate - construction | 252 | 250 | 1,250 | 4 | 251 | |||||||||||||||
| Consumer | 489 | 636 | 516 | 535 | 630 | |||||||||||||||
| Total loans charged off | 1,626 | 1,959 | 4,200 | 5,385 | 4,482 | |||||||||||||||
| Recoveries of losses previously charged off: | ||||||||||||||||||||
| Commercial | 86 | 64 | 144 | 162 | 36 | |||||||||||||||
| Real estate - mortgage | 21 | 108 | 162 | 144 | 18 | |||||||||||||||
| Real estate - construction | 102 | 2 | - | - | 1 | |||||||||||||||
| Consumer | 179 | 150 | 160 | 150 | 157 | |||||||||||||||
| Total recoveries | 388 | 324 | 466 | 456 | 212 | |||||||||||||||
| Net loans charged off | 1,238 | 1,635 | 3,734 | 4,929 | 4,270 | |||||||||||||||
| Provision for loan losses | 2,038 | 2,513 | 3,110 | 3,256 | 6,744 | |||||||||||||||
| Reserve for loan losses at end of year | $ | 9,103 | 8,303 | 7,425 | 8,049 | 9,722 | ||||||||||||||
| Loans charged off net of recoveries, as | ||||||||||||||||||||
| a percent of average loans outstanding | 0.19 | % | 0.27 | % | 0.68 | % | 0.90 | % | 0.79 | % | ||||||||||
Non-performing Assets. Non-performing assets, comprised of non-accrual loans, other real estate owned, other repossessed assets and loans for which payments are more than 90 days past due totaled $8.5 million at December 31, 2007 compared to $8.0 million at December 31, 2006. Non-accrual loans were $8.0 million at December 31, 2007, an increase of $427,000 from non-accruals of $7.6 million at December 31, 2006. As a percentage of loans outstanding, non-accrual loans were 1.11% and 1.16% at December 31, 2007 and 2006, respectively. The Bank had no loans 90 days past due and still accruing at December 31, 2007 as compared to $78,000 for the same period in 2006. Other real estate owned totaled $483,000 and $344,000 as of December 31, 2007 and 2006, respectively. The Bank had no repossessed assets as of December 31, 2007 and 2006.
A-18
At December 31, 2007 the Company had non-performing loans, defined as non-accrual and accruing loans past due more than 90 days, of $8.0 million or 1.11% of total loans. Non-performing loans for 2006 were $7.6 million, or 1.17% of total loans and $4.4 million, or 0.79% of total loans for 2005. Interest that would have been recorded on non-accrual loans for the years ended December 31, 2007, 2006 and 2005, had they performed in accordance with their original terms, amounted to approximately $693,000, $429,000 and $507,000, respectively. Interest income on impaired loans included in the results of operations for 2007, 2006, and 2005 amounted to approximately $29,000, $144,000 and $77,000, respectively.
Management continually monitors the loan portfolio to ensure that all loans potentially having a material adverse impact on future operating results, liquidity or capital resources have been classified as non-performing. Should economic conditions deteriorate, the inability of distressed customers to service their existing debt could cause higher levels of non-performing loans.
It is the general policy of the Company to stop accruing interest income and place the recognition of interest on a cash basis when a loan is placed on non-accrual status and any interest previously accrued but not collected is reversed against current income. Generally a loan is placed on non-accrual status when it is over 90 days past due and there is reasonable doubt that all principal will be collected.
A summary of non-performing assets at December 31 for each of the years presented is shown in Table 12.
| Table 12 - Non-performing Assets | ||||||||||||||||||||
| (Dollars in Thousands) | 2007 | 2006 | 2005 | 2004 | 2003 | |||||||||||||||
| Non-accrual loans | $ | 7,987 | 7,560 | 3,492 | 5,097 | 4,343 | ||||||||||||||
| Loans 90 days or more past due and still accruing | - | 78 | 946 | 245 | 271 | |||||||||||||||
| Total non-performing loans | 7,987 | 7,638 | 4,438 | 5,342 | 4,614 | |||||||||||||||
| All other real estate owned | 483 | 344 | 531 | 682 | 1,447 | |||||||||||||||
| All other repossessed assets | - | - | - | - | 206 | |||||||||||||||
| Total non-performing assets | $ | 8,470 | 7,982 | 4,969 | 6,024 | 6,267 | ||||||||||||||
| As a percent of total loans at year end | ||||||||||||||||||||
| Non-accrual loans | 1.11 | % | 1.16 | % | 0.62 | % | 0.95 | % | 0.79 | % | ||||||||||
| Loans 90 days or more past due and still accruing | 0.00 | % | 0.01 | % | 0.17 | % | 0.05 | % | 0.05 | % | ||||||||||
| Total non-performing assets | 1.17 | % | 1.23 | % | 0.88 | % | 1.12 | % | 1.14 | % | ||||||||||
Deposits. The Company primarily uses deposits to fund its loan and investment portfolios. The Company offers a variety of deposit accounts to individuals and businesses. Deposit accounts include checking, savings, money market and time deposits. As of December 31, 2007, total deposits were $693.6 million, an increase of $59.8 million or 9% increase over the December 31, 2006 balance of $633.8 million. Core deposits, which include demand deposits, savings accounts and certificates of deposits of denominations less than $100,000, increased to $490.1 million at December 31, 2007 from $439.6 million at December 31, 2006.
Time deposits in amounts of $100,000 or more totaled $203.5 million at December 31, 2007, $194.2 million and $152.4 million at December 31, 2006 and 2005, respectively. At December 31, 2007, brokered deposits amounted to $53.9 million as compared to $60.0 million at December 31, 2006. Brokered deposits are generally considered to be more susceptible to withdrawal as a result of interest rate changes and to be a less stable source of funds, as compared to deposits from the local market. Brokered deposits outstanding as of December 31, 2007 have a weighted average rate of 5.06% with a weighted average original term of 7 months.
A-19
Table 13 is a summary of the maturity distribution of time deposits in amounts of $100,000 or more as of December 31, 2007.
| Table 13 - Maturities of Time Deposits over $100,000 | ||||
| (Dollars in Thousands) | 2007 | |||
| Three months or less | $ | 84,001 | ||
| Over three months through six months | 70,734 | |||
| Over six months through twelve months | 35,917 | |||
| Over twelve months | 12,848 | |||
| Total | $ | 203,500 | ||
Borrowed Funds. The Company has access to various short-term borrowings, including the purchase of federal funds and borrowing arrangements from the FHLB and other financial institutions. At December 31, 2007, FHLB borrowings totaled $87.5 million compared to $89.3 million at December 31, 2006 and $71.6 million at December 31, 2005. Average FHLB borrowings for 2007 were $80.1 million, compared to average balances of $74.1 million for 2006 and $65.9 million for 2005. The maximum amount of outstanding FHLB borrowings was $95.0 million in 2007, and $99.5 in 2006 and $77.6 in 2005. The FHLB advances outstanding at December 31, 2007 had both fixed and adjustable interest rates ranging from 3.71% to 6.49%. Currently $10.5 million of the FHLB advances outstanding have contractual maturities prior to December 31, 2008. The FHLB has the option to convert $72.0 million of the total advances to a floating rate and, if converted, the Bank may repay advances without a prepayment fee. The Company also has an additional $5.0 million in variable rate convertible advances, which may be repaid without a prepayment fee if converted by the FHLB. Additional information regarding FHLB advances is provided in Note 6 to the Consolidated Financial Statements.
Demand notes payable to the U. S. Treasury, which represent treasury tax and loan payments received from customers, amounted to approximately $1.6 million at December 31, 2007 and 2006 and $1.5 million at December 31, 2005.
Securities sold under agreements to repurchase amounted to $27.6 million, $6.4 million and $981,000 as of December 31, 2007, 2006 and 2005, respectively.
Junior Subordinated Debentures (related to Trust Preferred Securities). In June 2007 the Company formed a wholly owned Delaware statutory trust, PEBK Capital Trust II (“PEBK Trust II”), which issued $20.0 million of guaranteed preferred beneficial interests in the Company’s junior subordinated deferrable interest debentures. All of the common securities of PEBK Trust II are owned by the Company. The proceeds from the issuance of the common securities and the trust preferred securities were used by PEBK Trust II to purchase $20.6 million of junior subordinated debentures of the Company, which pay a floating rate equal to three-month LIBOR plus 163 basis points. The proceeds received by the Company from the sale of the junior subordinated debentures were used to repay in December 2007 the trust preferred securities issued by PEBK Trust in December 2001 and for general purposes. The debentures represent the sole asset of PEBK Trust II. PEBK Trust II is not included in the consolidated financial statements.
The trust preferred securities issued by PEBK Trust II accrue and pay quarterly at a floating rate of three-month LIBOR plus 163 basis points. The Company has guaranteed distributions and other payments due on the trust preferred securities to the extent PEBK Trust II has funds with which to make the distributions and other payments. The net combined effect of the trust preferred securities transaction is that the Company is obligated to make the distributions and other payments required on the trust preferred securities.
These trust preferred securities are mandatorily redeemable upon maturity of the debentures on June 28, 2036, or upon earlier redemption as provided in the indenture. The Company has the right to redeem the debentures purchased by PEBK Trust II, in whole or in part, on or after June 28, 2011. As specified in the indenture, if the debentures are redeemed prior to maturity, the redemption price will be the principal amount and any accrued but unpaid interest.
Contractual Obligations and Off-Balance Sheet Arrangements. The Company’s contractual obligations and other commitments as of December 31, 2007 are summarized in Table 14 below. The Company’s contractual obligations include the repayment of principal and interest related to FHLB advances and junior subordinated debentures, as well as certain payments under current lease agreements. Other commitments include commitments to extend credit. Because not all of these commitments to extend credit will be drawn upon, the actual cash requirements are likely to be significantly less than the amounts reported for other commitments below.
A-20
| Table 14 - Contractual Obligations and Other Commitments | ||||||||||||||||||||
| (Dollars in Thousands) | Within One Year | One to Three Years | Three to Five Years | Five Years or More | Total | |||||||||||||||
| Contractual Cash Obligations | ||||||||||||||||||||
| Long-term borrowings* | $ | - | 7,000 | 5,000 | 65,000 | 77,000 | ||||||||||||||
| Junior subordinated debentures | - | - | - | 20,619 | 20,619 | |||||||||||||||
| Operating lease obligations | 897 | 1,381 | 863 | 2,149 | 5,290 | |||||||||||||||
| Total | $ | 897 | 8,381 | 5,863 | 87,768 | 102,909 | ||||||||||||||
| Other Commitments | ||||||||||||||||||||
| Commitments to extend credit | $ | 62,838 | 40,706 | 5,160 | 81,950 | 190,654 | ||||||||||||||
| Standby letters of credit | ||||||||||||||||||||
| and financial guarantees written | 3,792 | 102 | - | - | 3,894 | |||||||||||||||
| Total | $ | 66,630 | 40,808 | 5,160 | 81,950 | 194,548 | ||||||||||||||
| *Excludes $10.5 million adjustable rate credit due to the FHLB, which matured in February 2008. | ||||||||||||||||||||
The Company enters into derivative contracts to manage various financial risks. A derivative is a financial instrument that derives its cash flows, and therefore its value, by reference to an underlying instrument, index or referenced interest rate. Derivative contracts are carried at fair value on the consolidated balance sheet with the fair value representing the net present value of expected future cash receipts or payments based on market interest rates as of the balance sheet date. Derivative contracts are written in amounts referred to as notional amounts, which only provide the basis for calculating payments between counterparties and are not a measure of financial risk. Therefore, the derivative amounts recorded on the balance sheet do not represent the amounts that may ultimately be paid under these contracts. Further discussions of derivative instruments are included above in the section entitled “Asset Liability and Interest Rate Risk Management” beginning on page A-12 and in Notes 1, 10, 11 and 16 to the Consolidated Financial Statements.
Capital Resources. Shareholders’ equity at December 31, 2007 was $70.1 million compared to $62.8 million at December 31, 2006 and $54.4 million at December 31, 2005. Unrealized gains and losses, net of taxes, at December 31, 2007 amounted to a gain of $1.7 million. At December 31, 2006 and 2005, unrealized gains and losses, net of taxes, amounted to losses of $771,000 and $1.4 million, respectively. Average shareholders’ equity as a percentage of total average assets is one measure used to determine capital strength. Average shareholders’ equity as a percentage of total average assets was 8.34%, 8.09% and 7.92% for 2007, 2006 and 2005. The return on average shareholders’ equity was 13.59% at December 31, 2007 as compared to 14.68% and 11.31% as of December 31, 2006 and December 31, 2005, respectively. Total cash dividends paid during 2007 amounted to $2.3 million. Cash dividends totaling $1.9 million and $1.4 million were paid during 2006 and 2005, respectively.
In November 2006, the Company’s Board of Directors authorized the repurchase of up to $2.0 million in common shares of the Company’s outstanding common stock through its existing Stock Repurchase Plan effective through the end of November 2007. During 2007 the Company repurchased $1.9 million, or 100,000 shares, of its common stock under this plan.
In August 2007, the Company’s Board of Directors authorized the repurchase of up to 75,000 common shares of the Company’s outstanding common stock through its existing Stock Repurchase Plan effective through the end of August 2008. The Company has repurchased 50,497 shares, or $873,000, of its common stock under this plan as of December 31, 2007.
Under regulatory capital guidelines, financial institutions are currently required to maintain a total risk-based capital ratio of 8.0% or greater, with a Tier 1 risk-based capital ratio of 4.0% or greater. Tier 1 capital is generally defined as shareholders' equity and trust preferred securities less all intangible assets and goodwill. Tier 1 capital at December 31, 2007 and 2006 includes $20.0 million in trust preferred securities. At December 31, 2005, Tier 1 capital includes $14.0 million in trust preferred securities. The Company’s Tier 1 capital ratio was 11.03%, 11.70% and 11.02% at December 31, 2007, 2006 and 2005, respectively. Total risk-based capital is defined as Tier 1 capital plus supplementary capital. Supplementary capital, or Tier 2 capital, consists of the Company's allowance for loan losses, not exceeding 1.25% of the Company's risk-weighted assets. Total risk-based capital ratio is therefore defined as the ratio of total capital (Tier 1 capital and Tier 2 capital) to risk-weighted assets. The Company’s total risk-based capital ratio was 12.16%, 12.86% and 12.19% at December 31, 2007, 2006 and 2005, respectively. In addition to the Tier 1 and total risk-based capital requirements, financial institutions are also required to maintain a leverage ratio of Tier 1 capital to
A-21
total average assets of 4.0% or greater. The Company’s Tier 1 leverage capital ratio was 10.43%, 10.80% and 9.84% at December 31, 2007, 2006 and 2005, respectively.
The Bank’s Tier 1 risk-based capital ratio was 9.80%, 10.21% and 10.46% at December 31, 2007, 2006 and 2005, respectively. The total risk-based capital ratio for the Bank was 10.93%, 11.37% and 11.64% at December 31, 2007, 2006 and 2005, respectively. The Bank’s Tier 1 leverage capital ratio was 9.26%, 9.41% and 9.33% at December 31, 2007, 2006 and 2005 respectively.
A bank is considered to be "well capitalized" if it has a total risk-based capital ratio of 10.0 % or greater, a Tier 1 risk-based capital ratio of 6.0% or greater, and has a leverage ratio of 5.0% or greater. Based upon these guidelines, the Bank was considered to be "well capitalized" at December 31, 2007, 2006 and 2005.
The Company’s key equity ratios as of December 31, 2007, 2006 and 2005 are presented in Table 15.
| Table 15 - Equity Ratios | ||||||||||||
| 2007 | 2006 | 2005 | ||||||||||
| Return on average assets | 1.13 | % | 1.19 | % | 0.90 | % | ||||||
| Return on average equity | 13.59 | % | 14.68 | % | 11.31 | % | ||||||
| Dividend payout ratio | 24.30 | % | 20.78 | % | 22.34 | % | ||||||
| Average equity to average assets | 8.34 | % | 8.09 | % | 7.92 | % | ||||||
Quarterly Financial Data. The Company’s consolidated quarterly operating results for the years ended December 31, 2007 and 2006 are presented in Table 16.
| Table 16 - Quarterly Financial Data | ||||||||||||||||||||||||||||||||
| 2007 | 2006 | |||||||||||||||||||||||||||||||
(Dollars in thousands, except per share amounts) | First | Second | Third | Fourth | First | Second | Third | Fourth | ||||||||||||||||||||||||
| Total interest income | $ | 15,200 | 15,446 | 15,625 | 15,461 | 12,484 | 13,559 | 14,390 | 14,961 | |||||||||||||||||||||||
| Total interest expense | 6,607 | 6,735 | 7,038 | 7,205 | 4,863 | 5,429 | 6,243 | 6,575 | ||||||||||||||||||||||||
| Net interest income | 8,593 | 8,711 | 8,587 | 8,256 | 7,621 | 8,130 | 8,147 | 8,386 | ||||||||||||||||||||||||
| Provision for loan losses | 323 | 634 | 296 | 785 | 759 | 413 | 686 | 655 | ||||||||||||||||||||||||
| Other income | 2,122 | 2,139 | 2,007 | 2,548 | 1,929 | 2,017 | 2,043 | 1,564 | ||||||||||||||||||||||||
| Other expense | 6,021 | 6,180 | 6,214 | 7,578 | 5,307 | 5,548 | 5,787 | 6,341 | ||||||||||||||||||||||||
| Income before income taxes | 4,371 | 4,036 | 4,084 | 2,441 | 3,484 | 4,186 | 3,717 | 2,954 | ||||||||||||||||||||||||
| Income taxes | 1,584 | 1,446 | 1,471 | 839 | 1,249 | 1,525 | 1,344 | 1,052 | ||||||||||||||||||||||||
| Net earnings | $ | 2,787 | 2,590 | 2,613 | 1,602 | 2,235 | 2,661 | 2,373 | 1,902 | |||||||||||||||||||||||
| Basic earnings per share | $ | 0.49 | 0.45 | 0.46 | 0.28 | 0.39 | 0.47 | 0.42 | 0.33 | |||||||||||||||||||||||
| Diluted earnings per share | $ | 0.48 | 0.44 | 0.45 | 0.28 | 0.38 | 0.46 | 0.41 | 0.33 | |||||||||||||||||||||||
A-22
QUANTATIVE AND QUALITATIVE DISCLOSURES ABOUT MARKET RISK
Market risk reflects the risk of economic loss resulting from adverse changes in market prices and interest rates. This risk of loss can be reflected in either diminished current market values or reduced potential net interest income in future periods.
The Company’s market risk arises primarily from interest rate risk inherent in its lending and deposit taking activities. The structure of the Company’s loan and deposit portfolios is such that a significant decline (increase) in interest rates may adversely (positively) impact net market values and interest income. Management seeks to manage the risk through the utilization of its investment securities and off-balance sheet derivative instruments. During the years ended December 31, 2007, 2006 and 2005, the Company used interest rate contracts to manage market risk as discussed above in the section entitled “Asset Liability and Interest Rate Risk Management.”
Table 17 presents in tabular form the contractual balances and the estimated fair value of the Company’s on-balance sheet financial instruments and the notional amount and estimated fair value of the Company’s off-balance sheet derivative instruments at their expected maturity dates for the period ended December 31, 2007. The expected maturity categories take into consideration historical prepayment experience as well as management’s expectations based on the interest rate environment at December 31, 2007. As of December 31, 2007, all fixed rate advances are callable at the option of FHLB. For core deposits without contractual maturity (i.e. interest bearing checking, savings, and money market accounts), the table presents principal cash flows based on management’s judgment concerning their most likely runoff or repricing behaviors.
| Table 17 - Market Risk Table | ||||||||||||||||||||||
| (Dollars In Thousands) | Principal/Notional Amount Maturing in Year Ended December 31, | |||||||||||||||||||||
| Loans Receivable | 2008 | 2009 | 2010 | 2011 & 2012 | Thereafter | Total | Fair Value | |||||||||||||||
| Fixed rate | $ | 34,493 | 26,881 | 27,894 | 54,865 | 38,483 | 182,615 | 183,130 | ||||||||||||||
| Average interest rate | 7.41 | % | 7.53 | % | 7.39 | % | 7.65 | % | 7.64 | % | ||||||||||||
| Variable rate | $ | 206,001 | 75,033 | 51,738 | 54,833 | 152,058 | 539,662 | 539,662 | ||||||||||||||
| Average interest rate | 7.70 | % | 7.64 | % | 7.67 | % | 7.77 | % | 7.94 | % | ||||||||||||
| - | 722,277 | 722,792 | ||||||||||||||||||||
| Investment Securities | . | |||||||||||||||||||||
| Interest bearing cash | $ | - | - | - | - | 1,539 | 1,539 | 1,539 | ||||||||||||||
| Average interest rate | - | - | - | - | 4.60 | % | ||||||||||||||||
| Federal funds sold | $ | 2,152 | - | - | - | - | 2,152 | 2,152 | ||||||||||||||
| Average interest rate | 4.10 | % | - | - | - | - | ||||||||||||||||
| Securities available for sale | $ | 24,240 | 28,056 | 17,799 | 38,646 | 12,226 | 120,968 | 120,968 | ||||||||||||||
| Average interest rate | 4.91 | % | 4.96 | % | 4.61 | % | 4.27 | % | 3.64 | % | ||||||||||||
| Nonmarketable equity securities | $ | - | - | - | - | 6,434 | 6,434 | 6,434 | ||||||||||||||
| Average interest rate | - | - | - | - | 5.74 | % | ||||||||||||||||
| Debt Obligations | ||||||||||||||||||||||
| Deposits | $ | 372,596 | 27,540 | 11,245 | 1,130 | 281,128 | 693,639 | 694,059 | ||||||||||||||
| Average interest rate | 4.02 | % | 4.12 | % | 4.20 | % | 3.88 | % | 1.58 | % | ||||||||||||
| Advances from FHLB | $ | 10,500 | 20,000 | 52,000 | 5,000 | - | 87,500 | 90,233 | ||||||||||||||
| Average interest rate | 4.40 | % | 4.41 | % | 4.71 | % | 4.21 | % | - | |||||||||||||
| Demand notes payable to U.S. Treasury | $ | 1,600 | - | - | - | - | 1,600 | 1,600 | ||||||||||||||
| Average interest rate | 3.27 | % | - | - | - | - | ||||||||||||||||
| Securities sold under agreement to repurchase | $ | 27,583 | - | - | - | - | 27,583 | 27,583 | ||||||||||||||
| Average interest rate | 4.15 | % | - | - | - | - | ||||||||||||||||
| Junior subordinated debentures | $ | - | - | - | - | 20,619 | 20,619 | 20,619 | ||||||||||||||
| Average interest rate | - | - | - | - | 6.62 | % | ||||||||||||||||
| Derivative Instruments (notional amount) | ||||||||||||||||||||||
| Interest rate floor contracts | $ | 70,000 | 115,000 | - | - | - | 185,000 | 1,907 | ||||||||||||||
| Average interest rate | 6.63 | % | 7.58 | % | - | - | - | |||||||||||||||
A-23
Table 18 presents the simulated impact to net interest income under varying interest rate scenarios and the theoretical impact of rate changes over a twelve-month period referred to as “rate ramps.” The table shows the estimated theoretical impact on the Company’s tax equivalent net interest income from hypothetical rate changes of plus and minus 1% and 2% as compared to the estimated theoretical impact of rates remaining unchanged. The table also shows the simulated impact to market value of equity under varying interest rate scenarios and the theoretical impact of immediate and sustained rate changes referred to as “rate shocks” of plus and minus 1% and 2% compared to the theoretical impact of rates remaining unchanged. The prospective effects of the hypothetical interest rate changes are based upon various assumptions, including relative and estimated levels of key interest rates. This type of modeling has limited usefulness because it does not allow for the strategies management would utilize in response to sudden and sustained rate changes. Also, management does not believe that rate changes of the magnitude presented are likely in the forecast period presented.
| Table 18 - Interest Rate Risk | |||||
| (Dollars in thousands) | |||||
Estimated Resulting Theoretical Net Interest Income | |||||
| Hypothetical rate change (ramp over 12 months) | Amount | % Change | |||
| +2% | $ | 39,311 | 6.29% | ||
| +1% | $ | 38,037 | 2.85% | ||
| 0% | $ | 36,983 | 0.00% | ||
| -1% | $ | 36,349 | -1.72% | ||
| -2% | $ | 35,711 | -3.44% | ||
Estimated Resulting Theoretical Market Value of Equity | |||||
| Hypothetical rate change (immediate shock) | Amount | % Change | |||
| +2% | $ | 68,006 | -7.82% | ||
| +1% | $ | 70,737 | -4.11% | ||
| 0% | $ | 73,772 | 0.00% | ||
| -1% | $ | 77,197 | 4.64% | ||
| -2% | $ | 81,030 | 9.84% | ||
A-24
MARKET FOR THE COMPANY’S COMMON EQUITY
AND RELATED SHAREHOLDER MATTERS
Peoples Bancorp common stock is traded on the over-the-counter (OTC) market and quoted on the Nasdaq Global Market, under the symbol “PEBK.” Scott and Stringfellow, Inc., Ryan, Beck & Co. and Sterne Agee & Leach, Inc. are market makers for the Company’s shares.
Although the payment of dividends by the Company is subject to certain requirements and limitations of North Carolina corporate law, neither the Commissioner nor the FDIC have promulgated any regulations specifically limiting the right of the Company to pay dividends and repurchase shares. However, the ability of the Company to pay dividends and repurchase shares may be dependent upon the Company’s receipt of dividends from the Bank. The Bank’s ability to pay dividends is limited. North Carolina commercial banks, such as the Bank, are subject to legal limitations on the amounts of dividends they are permitted to pay. Dividends may be paid by the Bank from undivided profits, which are determined by deducting and charging certain items against actual profits, including any contributions to surplus required by North Carolina law. Also, an insured depository institution, such as the Bank, is prohibited from making capital distributions, including the payment of dividends, if, after making such distribution, the institution would become “undercapitalized” (as such term is defined in the applicable law and regulations). Based on its current financial condition, the Bank does not expect that this provision will have any impact on the Bank’s ability to pay dividends.
As of March 10, 2008, the Company had 700 shareholders of record, not including the number of persons or entities whose stock is held in nominee or street name through various brokerage firms or banks. The market price for the Company’s common stock was $13.34 on March 10, 2008.
Table 19 presents certain market and dividend information for the last two fiscal years. Over-the-counter quotations reflect inter-dealer prices, without retail mark-up, mark down or commission and may not necessarily represent actual transactions.
| Table 19 - Market and Dividend Data | ||||||||||
| Cash Dividend | ||||||||||
| 2007 | Low Bid | High Bid | Per Share | |||||||
| First Quarter | $ | 17.37 | 19.26 | 0.08 | ||||||
| Second Quarter | $ | 17.89 | 21.15 | 0.09 | ||||||
| Third Quarter | $ | 17.13 | 20.03 | 0.12 | ||||||
| Fourth Quarter | $ | 14.75 | 18.00 | 0.12 | ||||||
| Cash Dividend | ||||||||||
| 2006 | Low Bid | High Bid | Per Share | |||||||
| First Quarter | $ | 13.37 | 16.37 | 0.07 | ||||||
| Second Quarter | $ | 15.77 | 19.47 | 0.07 | ||||||
| Third Quarter | $ | 16.18 | 19.47 | 0.07 | ||||||
| Fourth Quarter | $ | 17.97 | 20.09 | 0.12 | ||||||
A-25
STOCK PERFORMANCE GRAPH
The following graph compares the Company’s cumulative shareholder return on its Common Stock with a NASDAQ index and with a southeastern bank index. The graph was prepared by SNL Securities, L.C., Charlottesville, Virginia, using data as of December 31, 2007.
COMPARISON OF SIX-YEAR CUMULATIVE TOTAL RETURNS
Performance Report for
Peoples Bancorp of North Carolina, Inc.
A-26
| PEOPLES BANCORP OF NORTH CAROLINA, INC. AND SUBSIDIARIES | |
| Consolidated Financial Statements | |
| December 31, 2007, 2006 and 2005 | |
| INDEX | |
| PAGE(S) | |
| Management's Report on Internal Control Over Financial Reporting | A-28 |
| Report of Independent Registered Public Accounting Firm on the Consolidated Financial Statements | |
| and Internal Control Over Financial Reporting | A-29 - A-30 |
| Financial Statements | |
| Consolidated Balance Sheets at December 31, 2007 and December 31, 2006 | A-31 |
| Consolidated Statements of Earnings for the years ended December 31, 2007, 2006 and 2005 | A-32 |
| Consolidated Statements of Changes in Shareholders' Equity for the years ended December 31, 2007, 2006 and 2005 | A-33 |
| Consolidated Statements of Comprehensive Income for the years ended December 31, 2007, 2006 and 2005 | A-34 |
| Consolidated Statements of Cash Flows for the years ended December 31, 2007, 2006 and 2005 | A-35 - A-36 |
| Notes to Consolidated Financial Statements | A-37 - A-56 |
A-27
MANAGEMENT’S REPORT ON INTERNAL CONTROLS OVER FINANCIAL REPORTING
The Company’s management is responsible for establishing and maintaining adequate internal control over financial reporting. Internal control over financial reporting is defined in Rule 13a-15(f) promulgated under the Securities Exchange Act of 1934. The Company’s internal control over financial reporting is a process designed to provide reasonable assurance regarding the reliability of financial reporting and the preparation of financial statements for external purposes in accordance with accounting principles generally accepted in the United States of America. Internal control over financial reporting includes those policies and procedures that (1) pertain to the maintenance of records that in reasonable detail accurately and fairly reflect the transactions and depositions of the assets of the company, (2) provide reasonable assurance that transactions are recorded as necessary to permit preparation of financial statements in accordance with accounting principles generally accepted in the United States of America, and that receipts and expenditures of the company are being made only in accordance with authorizations of management and directors of the company and (3) provide reasonable assurance regarding prevention or timely detection of unauthorized acquisition, use or disposition of the company’s assets that could have a material effect on the financial statements.
Because of its inherent limitations, internal control over financial reporting may not prevent or detect misstatements. Projections of any evaluation of effectiveness to future periods are subject to the risk that controls may become inadequate because of changes in conditions, or that the degree of compliance with the policies or procedures may deteriorate.
Management assessed the effectiveness of the internal control over financial reporting as of December 31, 2007. In making this assessment, management used the criteria established in Internal Control – Integrated Framework issued by the Committee of Sponsoring Organizations of the Treadway Commission (COSO). Based on our assessment and those criteria, management believes that the Company maintained effective internal control over financial reporting as of December 31, 2007.
The Company’s independent registered public accountants have issued an audit report on our assessment of the company’s internal control over financial reporting. Their report is included herein.
| /s/ Tony W. Wolfe | /s/ A. Joseph Lampron | ||
| Tony W. Wolfe | A. Joseph Lampron | ||
| Chief Executive Officer | Chief Financial Officer | ||
| March 12, 2008 | March 12, 2008 |
A-28
Porter Keadle Moore, LLP
REPORT OF INDEPENDENT REGISTERED PUBLIC ACCOUNTING FIRM
To the Board of Directors and shareholders
Peoples Bancorp of North Carolina, Inc.
Newton, North Carolina
We have audited the accompanying consolidated balance sheets of Peoples Bancorp of North Carolina, Inc. and subsidiaries (the “Company”) as of December 31, 2007 and 2006, and the related consolidated statements of earnings, changes in shareholders’ equity, comprehensive income, and cash flows for each of the years in the three-year period ended December 31, 2007. We have also audited the Company’s internal controls over financial reporting as of December 31, 2007, based on the criteria established in Internal Control – Integrated Framework issued by the Committee of Sponsoring Organizations of the Treadway Commission (COSO). The Company’s management is responsible for these financial statements, for maintaining effective control over financial reporting and for its assessment of the effectiveness of internal control over financial reporting included in the accompanying Management’s Report of Internal Controls Over Financial Reporting. Our responsibility is to express an opinion on these financial statements and an opinion on the Company’s internal control over financial reporting based on our audits.
We conducted our audits in accordance with the auditing standards of the Public Company Accounting Oversight Board (United States). Those standards require that we plan and perform the audits to obtain reasonable assurance about whether the financial statements are free of material misstatement and whether effective internal control over financial reporting was maintained in all material respects. Our audits of the financial statements included examining, on a test basis, evidence supporting the amounts and disclosures in the financial statements. Our audits also include assessing the accounting principles used and significant estimates made by management, as well as evaluating the overall financial statement presentation. Our audit of internal control over financial reporting included obtaining an understanding of internal control over financial reporting, assessing the risk that a material weakness exists, and testing and evaluating the design and operating effectiveness of internal control based on the assessed risk. Our audits also included performing such other procedures as we considered necessary in the circumstances. We believe that our audits provide a reasonable basis for our opinions.
A company’s internal control over financial reporting is a process designed to provide reasonable assurance regarding the reliability of financial reporting and the preparation of the financial statements for external purposes in accordance with generally accepted accounting principles. A company’s internal control over financial reporting includes those policies and procedures that (1) pertain to the maintenance of records that, in reasonable detail, accurately and fairly reflect the transactions and dispositions of the assets of the company; (2) provide reasonable assurance that transactions are recorded as necessary to permit preparation of financial statements in accordance with generally accepted accounting principles, and that receipts and expenditures of the company are being made only in accordance with authorizations of management and directors of the company; and (3) provide reasonable assurance regarding prevention or timely detection of unauthorized acquisition, use, or disposition of the company’s assets that could have a material effect on the financial statements.
Because of its inherent limitations, internal control over financial reporting may not prevent or detect misstatements. Also, projections of any evaluation of effectiveness to future periods are subject to the risk that controls may become inadequate because of changes in conditions, or that the degree of compliance with the policies or procedures may deteriorate.
A-29
In our opinion, the consolidated financial statements referred to above present fairly, in all material respects, the financial position of Peoples Bancorp of North Carolina, Inc. and subsidiaries as of December 31, 2007 and 2006, and the results of their operations and their cash flows for each of the years in the three-year period ended December 31, 2007, in conformity with accounting principles generally accepted in the United States of America. Also, in our opinion, Peoples Bancorp of North Carolina, Inc. maintained, in all material respects, effective internal control over financial reporting as of December 31, 2007, based on criteria established in Internal Control – Integrated Framework issued by the Committee of Sponsoring Organizations of the Treadway Commission (COSO).
/s/ Porter Keadle Moore, LLP
Atlanta, Georgia
February 29, 2008
Certified Public Accountants
____________________________________________________________________________________________________________________________________________
Suite 1800 Ÿ 235 Peachtree Street NE Ÿ Atlanta, Georgia 30303 Ÿ Phone 404-588-4200 Ÿ Fax 404-588-4222 Ÿ www.pkm.com
A-30
| PEOPLES BANCORP OF NORTH CAROLINA, INC. AND SUBSIDIARIES | ||||||||
| Consolidated Balance Sheets | ||||||||
| December 31, 2007 and 2006 | ||||||||
| Assets | 2007 | 2006 | ||||||
| Cash and due from banks, including reserve requirements | $ | 26,108,437 | 17,389,046 | |||||
| of $7,439,000 and $6,243,000 | ||||||||
| Interest bearing deposits | 1,539,190 | 1,471,272 | ||||||
| Federal funds sold | 2,152,000 | 2,640,000 | ||||||
| Cash and cash equivalents | 29,799,627 | 21,500,318 | ||||||
| Investment securities available for sale | 120,968,358 | 117,581,000 | ||||||
| Other investments | 6,433,947 | 7,295,449 | ||||||
| Total securities | 127,402,305 | 124,876,449 | ||||||
| Loans | 722,276,948 | 651,381,129 | ||||||
| Less allowance for loan losses | (9,103,058 | ) | (8,303,432 | ) | ||||
| Net loans | 713,173,890 | 643,077,697 | ||||||
| Premises and equipment, net | 18,234,393 | 12,816,385 | ||||||
| Cash surrender value of life insurance | 6,776,379 | 6,532,406 | ||||||
| Accrued interest receivable and other assets | 11,875,202 | 10,144,283 | ||||||
| Total assets | $ | 907,261,796 | 818,947,538 | |||||
| Liabilities and Shareholders' Equity | ||||||||
| Deposits: | ||||||||
| Non-interest bearing demand | $ | 112,071,090 | 101,393,142 | |||||
| NOW, MMDA & savings | 196,959,895 | 174,577,641 | ||||||
| Time, $100,000 or more | 203,499,504 | 194,176,291 | ||||||
| Other time | 181,108,214 | 163,673,215 | ||||||
| Total deposits | 693,638,703 | 633,820,289 | ||||||
| Demand notes payable to U.S. Treasury | 1,600,000 | 1,600,000 | ||||||
| Securities sold under agreement to repurchase | 27,583,263 | 6,417,803 | ||||||
| FHLB borrowings | 87,500,000 | 89,300,000 | ||||||
| Junior subordinated debentures | 20,619,000 | 20,619,000 | ||||||
| Accrued interest payable and other liabilities | 6,219,248 | 4,355,073 | ||||||
| Total liabilities | 837,160,214 | 756,112,165 | ||||||
| Shareholders' equity: | ||||||||
| Preferred stock, no par value; authorized | ||||||||
| 5,000,000 shares; no shares issued | ||||||||
| and outstanding | - | - | ||||||
| Common stock, no par value; authorized | ||||||||
| 20,000,000 shares; issued and | ||||||||
| outstanding 5,624,234 shares in 2007 | ||||||||
| and 3,830,634 shares in 2006 | 48,651,895 | 51,122,147 | ||||||
| Retained earnings | 19,741,876 | 12,484,463 | ||||||
| Accumulated other comprehensive income (loss) | 1,707,811 | (771,237 | ) | |||||
| Total shareholders' equity | 70,101,582 | 62,835,373 | ||||||
| Total liabilities and shareholders' equity | $ | 907,261,796 | 818,947,538 | |||||
| See accompanying notes to consolidated financial statements. | ||||||||
A-31
| PEOPLES BANCORP OF NORTH CAROLINA, INC. AND SUBSIDIARIES | ||||||||||||
| Consolidated Statements of Earnings | ||||||||||||
| For the Years Ended December 31, 2007, 2006 and 2005 | ||||||||||||
| 2007 | 2006 | 2005 | ||||||||||
| Interest income: | ||||||||||||
| Interest and fees on loans | $ | 55,400,514 | 49,667,700 | 37,123,327 | ||||||||
| Interest on federal funds sold | 383,492 | 85,307 | 72,578 | |||||||||
| Interest on investment securities: | ||||||||||||
| U.S. Government agencies | 4,571,571 | 4,321,346 | 3,584,755 | |||||||||
| States and political subdivisions | 887,584 | 798,185 | 735,892 | |||||||||
| Other | 488,465 | 521,077 | 396,020 | |||||||||
| Total interest income | 61,731,626 | 55,393,615 | 41,912,572 | |||||||||
| Interest expense: | ||||||||||||
| NOW, MMDA & savings deposits | 4,098,892 | 3,060,201 | 2,644,413 | |||||||||
| Time deposits | 17,430,012 | 14,188,623 | 8,923,488 | |||||||||
| FHLB borrowings | 3,758,996 | 3,588,169 | 2,888,785 | |||||||||
| Junior subordinated debentures | 1,475,701 | 1,962,692 | 938,145 | |||||||||
| Other | 821,331 | 310,188 | 33,790 | |||||||||
| Total interest expense | 27,584,932 | 23,109,873 | 15,428,621 | |||||||||
| Net interest income | 34,146,694 | 32,283,742 | 26,483,951 | |||||||||
| Provision for loan losses | 2,038,000 | 2,513,282 | 3,110,000 | |||||||||
| Net interest income after provision for loan losses | 32,108,694 | 29,770,460 | 23,373,951 | |||||||||
| Other income: | ||||||||||||
| Service charges | 4,278,238 | 3,929,956 | 3,779,933 | |||||||||
| Other service charges and fees | 1,938,137 | 1,539,367 | 1,141,879 | |||||||||
| Loss on sale and writedown of securities | (561,832 | ) | (591,856 | ) | (729,727 | ) | ||||||
| Mortgage banking income | 560,291 | 289,293 | 469,109 | |||||||||
| Insurance and brokerage commissions | 521,095 | 388,559 | 386,662 | |||||||||
| Loss on sale of repossessed assets | (117,880 | ) | (107,712 | ) | (37,811 | ) | ||||||
| Miscellaneous | 2,197,645 | 2,106,188 | 1,658,189 | |||||||||
| Total other income | 8,815,694 | 7,553,795 | 6,668,234 | |||||||||
| Other expense: | ||||||||||||
| Salaries and employee benefits | 13,887,841 | 11,785,094 | 10,863,779 | |||||||||
| Occupancy | 4,750,634 | 4,180,058 | 3,948,694 | |||||||||
| Other | 7,354,401 | 7,017,986 | 5,517,832 | |||||||||
| Total other expenses | 25,992,876 | 22,983,138 | 20,330,305 | |||||||||
| Earnings before income taxes | 14,931,512 | 14,341,117 | 9,711,880 | |||||||||
| Income taxes | 5,339,541 | 5,170,300 | 3,380,900 | |||||||||
| Net earnings | $ | 9,591,971 | 9,170,817 | 6,330,980 | ||||||||
| Basic earnings per share | $ | 1.68 | 1.61 | 1.11 | ||||||||
| Diluted earnings per share | $ | 1.65 | 1.58 | 1.09 | ||||||||
| Cash dividends declared per share | $ | 0.41 | 0.33 | 0.25 | ||||||||
| See accompanying notes to consolidated financial statements. | ||||||||||||
A-32
| PEOPLES BANCORP OF NORTH CAROLINA, INC. | ||||||||||||||||||||
| Consolidated Statements of Changes in Shareholders' Equity | ||||||||||||||||||||
| For the Years Ended December 31, 2007, 2006 and 2005 | ||||||||||||||||||||
| Accumulated | ||||||||||||||||||||
| Other | ||||||||||||||||||||
| Common Stock | Retained | Comprehensive | ||||||||||||||||||
| Shares | Amount | Earnings | Income (Loss) | Total | ||||||||||||||||
| Balance, December 31, 2004 | 3,135,074 | $ | 35,040,390 | 16,018,206 | (120,744 | ) | 50,937,852 | |||||||||||||
| 10% stock dividend | 313,546 | 6,274,087 | (6,274,087 | ) | - | - | ||||||||||||||
| Cash paid in lieu of fractional shares | - | - | (4,700 | ) | - | (4,700 | ) | |||||||||||||
| Cash dividends declared | - | - | (1,414,239 | ) | - | (1,414,239 | ) | |||||||||||||
| Repurchase and retirement of common | ||||||||||||||||||||
| stock | (15,000 | ) | (314,750 | ) | - | - | (314,750 | ) | ||||||||||||
| Exercise of stock options | 7,185 | 96,773 | - | - | 96,773 | |||||||||||||||
| Net earnings | - | - | 6,330,980 | - | 6,330,980 | |||||||||||||||
| Change in accumulated other | ||||||||||||||||||||
| comprehensive income (loss), net of tax | - | - | - | (1,278,922 | ) | (1,278,922 | ) | |||||||||||||
| Balance, December 31, 2005 | 3,440,805 | 41,096,500 | 14,656,160 | (1,399,666 | ) | 54,352,994 | ||||||||||||||
| 10% stock dividend | 343,850 | 9,430,532 | (9,430,532 | ) | - | - | ||||||||||||||
| Cash paid in lieu of fractional shares | - | - | (6,426 | ) | - | (6,426 | ) | |||||||||||||
| Cash dividends declared | - | - | (1,905,556 | ) | - | (1,905,556 | ) | |||||||||||||
| Repurchase and retirement of common | ||||||||||||||||||||
| stock | (19,250 | ) | (425,000 | ) | - | - | (425,000 | ) | ||||||||||||
| Exercise of stock options | 65,229 | 771,325 | - | - | 771,325 | |||||||||||||||
| Stock option tax benefit | - | 243,100 | - | - | 243,100 | |||||||||||||||
| Stock option compensation expense | - | 5,690 | - | - | 5,690 | |||||||||||||||
| Net earnings | - | - | 9,170,817 | - | 9,170,817 | |||||||||||||||
| Change in accumulated other | ||||||||||||||||||||
| comprehensive income (loss), net of tax | - | - | - | 628,429 | 628,429 | |||||||||||||||
| Balance, December 31, 2006 | 3,830,634 | $ | 51,122,147 | 12,484,463 | (771,237 | ) | 62,835,373 | |||||||||||||
| 3 for 2 stock split | 1,915,147 | - | - | - | - | |||||||||||||||
| Cash paid in lieu of fractional shares | - | - | (3,355 | ) | - | (3,355 | ) | |||||||||||||
| Cash dividends declared | - | - | (2,331,203 | ) | - | (2,331,203 | ) | |||||||||||||
| Repurchase and retirement of common | ||||||||||||||||||||
| stock | (150,497 | ) | (2,810,907 | ) | - | - | (2,810,907 | ) | ||||||||||||
| Exercise of stock options | 28,950 | 239,182 | - | - | 239,182 | |||||||||||||||
| Stock option tax benefit | - | 91,815 | - | - | 91,815 | |||||||||||||||
| Stock option compensation expense | - | 9,658 | - | - | 9,658 | |||||||||||||||
| Net earnings | - | - | 9,591,971 | - | 9,591,971 | |||||||||||||||
| Change in accumulated other | ||||||||||||||||||||
| comprehensive income (loss), net of tax | - | - | - | 2,479,048 | 2,479,048 | |||||||||||||||
| Balance, December 31, 2007 | 5,624,234 | $ | 48,651,895 | 19,741,876 | 1,707,811 | 70,101,582 | ||||||||||||||
| See accompanying notes to consolidated financial statements. | ||||||||||||||||||||
A-33
| PEOPLES BANCORP OF NORTH CAROLINA, INC. AND SUBSIDIARIES | ||||||||||||
| Consolidated Statements of Comprehensive Income | ||||||||||||
| For the Years Ended December 31, 2007, 2006 and 2005 | ||||||||||||
2007 | 2006 | 2005 | ||||||||||
| Net earnings | $ | 9,591,971 | 9,170,817 | 6,330,980 | ||||||||
| Other comprehensive income (loss): | ||||||||||||
| Unrealized holding gains (losses) on securities | ||||||||||||
| available for sale | 1,964,861 | 197,569 | (3,045,565 | ) | ||||||||
| Reclassification adjustment for losses on | ||||||||||||
| sales of securities available for sale included | ||||||||||||
| in net earnings | 561,832 | 591,856 | 729,727 | |||||||||
| Unrealized holding gains (losses) on derivative | ||||||||||||
| financial instruments qualifying as cash flow | ||||||||||||
| hedges | 1,244,910 | (345,049 | ) | (283,493 | ) | |||||||
| Reclassification adjustment for losses (gains) on | ||||||||||||
| derivative financial instruments qualifying as | ||||||||||||
| cash flow hedges included in net earnings | - | 386,285 | 483,715 | |||||||||
| Total other comprehensive income (loss), | ||||||||||||
| before income taxes | 3,771,603 | 830,661 | (2,115,616 | ) | ||||||||
| Income tax expense (benefit) related to other | ||||||||||||
| comprehensive income: | ||||||||||||
| Unrealized holding gains (losses) on securities | ||||||||||||
| available for sale | 765,313 | 76,953 | (1,186,248 | ) | ||||||||
| Reclassification adjustment for losses on | ||||||||||||
| sales of securities available for sale included | ||||||||||||
| in net earnings | 218,834 | 230,528 | 284,229 | |||||||||
| Unrealized holding gains (losses) on derivative | ||||||||||||
| financial instruments qualifying as cash flow | ||||||||||||
| hedges | 308,408 | (255,707 | ) | (123,082 | ) | |||||||
| Reclassification adjustment for losses (gains) on | ||||||||||||
| derivative financial instruments qualifying as | ||||||||||||
| cash flow hedges included in net earnings | - | 150,458 | 188,407 | |||||||||
| Total income tax expense (benefit) related to | ||||||||||||
| other comprehensive income | 1,292,555 | 202,232 | (836,694 | ) | ||||||||
| Total other comprehensive income (loss), | ||||||||||||
| net of tax | 2,479,048 | 628,429 | (1,278,922 | ) | ||||||||
| Total comprehensive income | $ | 12,071,019 | 9,799,246 | 5,052,058 | ||||||||
| See accompanying notes to consolidated financial statements. | ||||||||||||
A-34
| PEOPLES BANCORP OF NORTH CAROLINA, INC. | ||||||||||||
| Consolidated Statements of Cash Flows | ||||||||||||
| For the Years Ended December 31, 2007, 2006 and 2005 | ||||||||||||
| 2007 | 2006 | 2005 | ||||||||||
| Cash flows from operating activities: | ||||||||||||
| Net earnings | $ | 9,591,971 | 9,170,817 | 6,330,980 | ||||||||
| Adjustments to reconcile net earnings to | ||||||||||||
| net cash provided by operating activities: | ||||||||||||
| Depreciation, amortization and accretion | 1,553,251 | 1,616,558 | 1,643,459 | |||||||||
| Provision for loan losses | 2,038,000 | 2,513,282 | 3,110,000 | |||||||||
| Deferred income taxes | (479,806 | ) | (615,626 | ) | 332,806 | |||||||
| Loss on sale and writedown of investment securities | 561,832 | 591,856 | 729,727 | |||||||||
| Recognition of gain on sale of | ||||||||||||
| derivative instruments | - | 386,285 | 483,715 | |||||||||
| Amortization of deferred gain on sale of premises | (10,337 | ) | (20,896 | ) | (21,984 | ) | ||||||
| Loss (gain) on sale of repossessed assets | 83,294 | (2,288 | ) | (2,189 | ) | |||||||
| Writedown of other real estate and repossessions | 34,586 | 110,000 | 40,000 | |||||||||
| Amortization of deferred issuance costs on | ||||||||||||
| trust preferred securities | - | 461,298 | 17,742 | |||||||||
| Stock option compensation expense | 9,658 | 5,690 | - | |||||||||
| Change in: | ||||||||||||
| Mortgage loans held for sale | - | 2,247,900 | 1,535,275 | |||||||||
| Cash surrender value of life insurance | (243,973 | ) | (220,649 | ) | (277,569 | ) | ||||||
| Other assets | (1,013,866 | ) | (1,206,937 | ) | 444,944 | |||||||
| Other liabilities | 2,403,990 | (230,144 | ) | 651,204 | ||||||||
| Net cash provided by operating activities | 14,528,600 | 14,807,146 | 15,018,110 | |||||||||
| Cash flows from investing activities: | ||||||||||||
| Purchases of investment securities available for sale | (15,858,155 | ) | (30,579,262 | ) | (49,431,813 | ) | ||||||
| Proceeds from calls and maturities of investment securities | ||||||||||||
| available for sale | 7,470,991 | 8,562,058 | 9,655,995 | |||||||||
| Proceeds from sales of investment securities available | ||||||||||||
| for sale | 8,362,525 | 19,871,979 | 27,768,392 | |||||||||
| Purchases of other investments | (8,356,900 | ) | (12,748,200 | ) | (5,367,790 | ) | ||||||
| Proceeds from sale of other investments | 8,424,000 | 11,263,500 | 4,239,000 | |||||||||
| Net change in loans | (72,815,928 | ) | (86,825,349 | ) | (35,062,738 | ) | ||||||
| Purchases of premises and equipment | (7,672,018 | ) | (1,624,299 | ) | (1,373,019 | ) | ||||||
| Proceeds from sale of premises and equipment | 55,630 | - | 1,750 | |||||||||
| Proceeds from sale of repossessed assets | 425,158 | 825,115 | 246,218 | |||||||||
| Purchases of derivative financial instruments | (634,000 | ) | (961,500 | ) | (364,000 | ) | ||||||
| Payment on settlement of derivative | ||||||||||||
| financial instruments | - | - | (870,000 | ) | ||||||||
| Net cash used by investing activities | (80,598,697 | ) | (92,215,958 | ) | (50,558,005 | ) | ||||||
| Cash flows from financing activities: | ||||||||||||
| Net change in deposits | 59,818,414 | 50,966,628 | 26,331,588 | |||||||||
| Net change in demand notes payable to U.S. Treasury | - | 126,307 | 289,301 | |||||||||
| Net change in securities sold under agreement to repurchase | 21,165,460 | 5,436,753 | 981,050 | |||||||||
| Proceeds from FHLB borrowings | 275,300,000 | 700,800,000 | 162,300,000 | |||||||||
| Repayments of FHLB borrowings | (277,100,000 | ) | (683,100,000 | ) | (149,700,000 | ) | ||||||
| Proceeds from issuance of trust preferred securities | - | 20,619,000 | - | |||||||||
| Repayments of trust preferred securities | - | (14,433,000 | ) | - | ||||||||
| Proceeds from exercise of stock options | 330,997 | 1,014,425 | 96,773 | |||||||||
| Common stock repurchased | (2,810,907 | ) | (425,000 | ) | (314,750 | ) | ||||||
| Cash paid in lieu of fractional shares | (3,355 | ) | (6,426 | ) | (4,700 | ) | ||||||
| Cash dividends paid | (2,331,203 | ) | (1,905,556 | ) | (1,414,239 | ) | ||||||
| Net cash provided by financing activities | 74,369,406 | 79,093,131 | 38,565,023 | |||||||||
| Net change in cash and cash equivalent | 8,299,309 | 1,684,319 | 3,025,128 | |||||||||
| Cash and cash equivalents at beginning of period | 21,500,318 | 19,815,999 | 16,790,871 | |||||||||
| Cash and cash equivalents at end of period | $ | 29,799,627 | 21,500,318 | 19,815,999 | ||||||||
A-35
| PEOPLES BANCORP OF NORTH CAROLINA, INC. | ||||||||||||
| Consolidated Statements of Cash Flows, continued | ||||||||||||
| For the Years ended December 31, 2007, 2006 and 2005 | ||||||||||||
| 2007 | 2006 | 2005 | ||||||||||
| Supplemental disclosures of cash flow information: | ||||||||||||
| Cash paid during the year for: | ||||||||||||
| Interest | $ | 27,420,245 | 23,171,572 | 15,189,559 | ||||||||
| Income taxes | $ | 5,689,500 | 6,398,100 | 2,245,000 | ||||||||
| Noncash investing and financing activities: | ||||||||||||
| Change in unrealized gain (loss) on investment securities | ||||||||||||
| available for sale, net | $ | 1,542,546 | 481,944 | (1,413,819 | ) | |||||||
| Change in unrealized gain on derivative financial | ||||||||||||
| instruments, net | $ | 936,502 | 146,485 | 134,897 | ||||||||
| Transfer of loans to other real estate and repossessions | $ | 681,735 | 746,004 | 133,210 | ||||||||
| Financed portion of sale of other real estate | $ | - | 273,000 | - | ||||||||
| Reclassification of an investment from other assets | ||||||||||||
| to securities available for sale | $ | 499,995 | - | - | ||||||||
| Reclassification of a security from other investments | ||||||||||||
| to securities available for sale | $ | 600,000 | - | 715,000 | ||||||||
| Transfer of retained earnings to common stock for | ||||||||||||
| issuance of stock dividend | $ | - | 9,430,532 | 6,274,087 | ||||||||
| Deferred gain rolled into cost basis of | ||||||||||||
| acquired building | $ | 539,815 | - | - | ||||||||
| See accompanying notes to consolidated financial statements. | ||||||||||||
A-36
PEOPLES BANCORP OF NORTH CAROLINA, INC.
Notes to Consolidated Financial Statements
| (1) | Summary of Significant Accounting Policies |
Organization
Peoples Bancorp of North Carolina, Inc. (“Bancorp”) received regulatory approval to operate as a bank holding company on July 22, 1999, and became effective August 31, 1999. Bancorp is primarily regulated by the Board of Governors of the Federal Reserve System, and serves as the one-bank holding company for Peoples Bank.
Peoples Bank (the “Bank”) commenced business in 1912 upon receipt of its banking charter from the North Carolina State Banking Commission (the “SBC”). The Bank is primarily regulated by the SBC and the Federal Deposit Insurance Corporation and undergoes periodic examinations by these regulatory agencies. The Bank, whose main office is in Newton, North Carolina, provides a full range of commercial and consumer banking services primarily in Catawba, Alexander, Lincoln, Mecklenburg, Iredell and Union counties in North Carolina.
Peoples Investment Services, Inc. is a wholly owned subsidiary of the Bank and began operations in 1996 to provide investment and trust services through agreements with an outside party.
Real Estate Advisory Services, Inc. is a wholly owned subsidiary of the Bank and began operations in 1997 to provide real estate appraisal and property management services to individuals and commercial customers of the Bank.
Principles of Consolidation
The consolidated financial statements include the financial statements of Peoples Bancorp of North Carolina, Inc. and its wholly owned subsidiary, the Bank, along with the Bank’s wholly owned subsidiaries, Peoples Investment Services, Inc. and Real Estate Advisory Services, Inc. (collectively called the “Company”). All significant intercompany balances and transactions have been eliminated in consolidation.
Basis of Presentation
The accounting principles followed by the Company, and the methods of applying these principles, conform with accounting principles generally accepted in the United States of America (“GAAP”) and with general practices in the banking industry. In preparing the financial statements in conformity with GAAP, management is required to make estimates and assumptions that affect the reported amounts in the financial statements. Actual results could differ significantly from these estimates. Material estimates common to the banking industry that are particularly susceptible to significant change in the near term include, but are not limited to, the determination of the allowance for loan losses and valuation of real estate acquired in connection with or in lieu of foreclosure on loans.
Cash and Cash Equivalents
Cash and due from banks and federal funds sold are considered cash and cash equivalents for cash flow reporting purposes. Generally, federal funds are sold for one-day periods.
Investment Securities
The Company classifies its securities in one of three categories: trading, available for sale, or held to maturity. Trading securities are bought and held principally for sale in the near term. Held to maturity securities are those securities for which the Company has the ability and intent to hold until maturity. All other securities not included in trading or held to maturity are classified as available for sale. At December 31, 2007 and 2006, the Company had classified all of its investment securities as available for sale.
Available for sale securities are recorded at fair value. Unrealized holding gains and losses, net of the related tax effect, are excluded from earnings and are reported as a separate component of shareholders’ equity until realized.
A decline in the market value of any available for sale investment below cost that is deemed other than temporary is charged to earnings and establishes a new cost basis for the security.
Premiums and discounts are amortized or accreted over the life of the related security as an adjustment to the yield. Realized gains and losses for securities classified as available for sale are included in earnings and are derived using the specific identification method for determining the cost of securities sold.
A-37
Other Investments
Other investments include equity securities with no readily determinable fair value. These investments are carried at cost.
Loans
Loans that management has the intent and ability to hold for the foreseeable future or until maturity are reported at the principal amount outstanding, net of the allowance for loan losses. Interest on loans is calculated by using the simple interest method on daily balances of the principal amount outstanding. The recognition of certain loan origination fee income and certain loan origination costs is deferred when such loans are originated and amortized over the life of the loan.
Impaired loans are measured based on the present value of expected future cash flows, discounted at the loan’s effective interest rate, or at the loan’s observable market price, or the fair value of the collateral if the loan is collateral dependent. A loan is impaired when, based on current information and events, it is probable that all amounts due according to the contractual terms of the loan will not be collected.
Accrual of interest is discontinued on a loan when management believes, after considering economic conditions and collection efforts that the borrower’s financial condition is such that collection of interest is doubtful. Interest previously accrued but not collected is reversed against current period earnings and interest is recognized on a cash basis when such loans are placed on non-accrual status.
Allowance for Loan Losses
The allowance for loan losses reflects management's assessment and estimate of the risks associated with extending credit and its evaluation of the quality of the loan portfolio. The Bank periodically analyzes the loan portfolio in an effort to review asset quality and to establish an allowance for loan losses that management believes will be adequate in light of anticipated risks and loan losses. In assessing the adequacy of the allowance, size, quality and risk of loans in the portfolio are reviewed. Other factors considered are:
| · | the Bank’s loan loss experience; |
| · | the amount of past due and non-performing loans; |
| · | specific known risks; |
| · | the status and amount of other past due and non-performing assets; |
| · | underlying estimated values of collateral securing loans; |
| · | current and anticipated economic conditions; and |
| · | other factors which management believes affect the allowance for potential credit losses. |
The allowance for loan losses is comprised of three components: specific reserves, general reserves and unallocated reserves. After a loan has been identified as impaired, management measures impairment in accordance with SFAS No. 114, “Accounting By Creditors for Impairment of a Loan.” When the measure of the impaired loan is less than the recorded investment in the loan, the amount of the impairment is recorded as a specific reserve. These specific reserves are determined on an individual loan basis based on management’s current evaluation of the Company’s loss exposure for each credit, given the payment status, financial condition of the borrower, and value of any underlying collateral. Loans for which specific reserves are provided are excluded from the general allowance calculations as described below. At December 31, 2007 and 2006, the recorded investment in loans that were considered to be impaired under SFAS No. 114 was approximately $8.0 million and $7.6 million, respectively, with related allowance for loan losses of approximately $1.2 million for December 31, 2007 and 2006.
The general allowance reflects reserves established under the provisions of SFAS No. 5, “Accounting for Contingencies” for collective loan impairment. These reserves are based upon historical net charge-offs using the last three years’ experience. This charge-off experience may be adjusted to reflect the effects of current conditions. The Bank considers information derived from its loan risk ratings and external data related to industry and general economic trends.
The unallocated allowance is determined through management’s assessment of probable losses that are in the portfolio but are not adequately captured by the other two components of the allowance, including consideration of current economic and business conditions and regulatory requirements. The unallocated allowance also reflects management’s acknowledgement of the imprecision and subjectivity that underlie the modeling of credit risk. Due to the subjectivity involved in determining the overall allowance, including the unallocated portion, this
A-38
unallocated portion may fluctuate from period to period based on management’s evaluation of the factors affecting the assumptions used in calculating the allowance.
Management considers the allowance for loan losses adequate to cover the estimated losses inherent in the Company’s loan portfolio as of the date of the financial statements. Management believes it has established the allowance in accordance with accounting principles generally accepted in the United States of America and in consideration of the current economic environment. Although management uses the best information available to make evaluations, significant future additions to the allowance may be necessary based on changes in economic and other conditions, thus adversely affecting the operating results of the Company.
There were no significant changes in the estimation methods or fundamental assumptions used in the evaluation of the allowance for loan losses for the year ended December 31, 2007 as compared to the year ended December 31, 2006. Such revisions, estimates and assumptions are made in any period in which the supporting factors indicate that loss levels may vary from the previous estimates.
Additionally, various regulatory agencies, as an integral part of their examination process, periodically review the Bank’s allowances for loan losses. Such agencies may require adjustments to the allowances based on their judgments of information available to them at the time of their examinations.
Mortgage Banking Activities
Mortgage banking income represents net gains from the sale of mortgage loans and fees received from borrowers and loan investors related to the Company’s origination of single-family residential mortgage loans.
Mortgage servicing rights (“MSR's”) represent the unamortized cost of purchased and originated contractual rights to service mortgages for others in exchange for a servicing fee. MSRs are amortized over the period of estimated net servicing income and are periodically adjusted for actual prepayments of the underlying mortgage loans. During the year ended December 31, 2006, the Company fully amortized the remaining balance of the Bank’s MSRs. Management determined there was minimal fair value in the MSRs due to the small remaining balance in the loans serviced for others. The Company amortized approximately $227,000 and $56,000 during 2006 and 2005, respectively. No new servicing assets were recognized during 2007, 2006 and 2005.
Mortgage loans serviced for others are not included in the accompanying balance sheets. The unpaid principal balances of mortgage loans serviced for others was approximately $12.1 million, $14.8 million and $18.1 million at December 31, 2007, 2006 and 2005, respectively.
Premises and Equipment
Premises and equipment are stated at cost less accumulated depreciation. Depreciation is computed primarily using the straight-line method over the estimated useful lives of the assets. When assets are retired or otherwise disposed, the cost and related accumulated depreciation are removed from the accounts, and any gain or loss is reflected in earnings for the period. The cost of maintenance and repairs that do not improve or extend the useful life of the respective asset is charged to earnings as incurred, whereas significant renewals and improvements are capitalized. The range of estimated useful lives for premises and equipment are generally as follows:
| Buildings and improvements | 10 - 50 years | |
| Furniture and equipment | 3 - 10 years |
Foreclosed Assets
Foreclosed assets include all assets received in full or partial satisfaction of a loan and include real and personal property. Foreclosed assets are reported at the lower of carrying amount or net realizable value, and are included in other assets on the balance sheet.
Income Taxes
Deferred tax assets and liabilities are recognized for the future tax consequences attributable to differences between the financial statement carrying amounts of existing assets and liabilities and their respective tax bases. Additionally, the recognition of future tax benefits, such as net operating loss carryforwards, is required to the extent that realization of such benefits is more likely than not. Deferred tax assets and liabilities are measured using enacted tax rates expected to apply to taxable income in the years in which the assets and liabilities are expected to be recovered or settled. The effect on deferred tax assets and liabilities of a change in tax rates is recognized in income tax expense in the period that includes the enactment date.
A-39
In the event the future tax consequences of differences between the financial reporting bases and the tax bases of the Company’s assets and liabilities results in deferred tax assets, an evaluation of the probability of being able to realize the future benefits indicated by such asset is required. A valuation allowance is provided for the portion of the deferred tax asset when it is more likely than not that some portion or all of the deferred tax asset will not be realized. In assessing the realizability of the deferred tax assets, management considers the scheduled reversals of deferred tax liabilities, projected future taxable income, and tax planning strategies.
Derivative Financial Instruments and Hedging Activities
In the normal course of business, the Company enters into derivative contracts to manage interest rate risk by modifying the characteristics of the related balance sheet instruments in order to reduce the adverse effect of changes in interest rates. All derivative financial instruments are recorded at fair value in the financial statements.
On the date a derivative contract is entered into, the Company designates the derivative as a fair value hedge, a cash flow hedge, or a trading instrument. Changes in the fair value of instruments used as fair value hedges are accounted for in the earnings of the period simultaneous with accounting for the fair value change of the item being hedged. Changes in the fair value of the effective portion of cash flow hedges are accounted for in other comprehensive income rather than earnings. Changes in fair value of instruments that are not intended as a hedge are accounted for in the earnings of the period of the change.
If a derivative instrument designated as a fair value hedge is terminated or the hedge designation removed, the difference between a hedged item’s then carrying amount and its face amount is recognized into income over the original hedge period. Likewise, if a derivative instrument designated as a cash flow hedge is terminated or the hedge designation removed, related amounts accumulated in other accumulated comprehensive income are reclassified into earnings over the original hedge period during which the hedged item affects income.
The Company formally documents all hedging relationships, including an assessment that the derivative instruments are expected to be highly effective in offsetting the changes in fair values or cash flows of the hedged items.
Advertising Costs
The costs of advertising costs are expensed as incurred.
Accumulated Other Comprehensive Income
At December 31, 2007, accumulated other comprehensive income (loss) consisted of net unrealized gains on securities available for sale of $943,000 and net unrealized gains on derivatives of $765,000. At December 31, 2006, accumulated other comprehensive income (loss) consisted of net unrealized losses on securities available for sale of $600,000 and net unrealized losses on derivatives of $171,000.
Stock-Based Compensation
The Company has an Omnibus Stock Ownership and Long Term Incentive Plan (the “Plan”) whereby certain stock-based rights, such as stock options, restricted stock, performance units, stock appreciation rights, or book value shares, may be granted to eligible directors and employees. A total of 636,687 shares are currently reserved for possible issuance under this Plan. All rights must be granted or awarded within ten years from the May 13, 1999 effective date of the plan.
Under the Plan, the Company has granted incentive stock options to certain eligible employees in order that they may purchase Company stock at a price equal to the fair market value on the date of the grant. The options granted in 1999 vested over a five-year period. Options granted subsequent to 1999 vest over a three-year period. All options expire after ten years. A summary of the activity in the Plan is presented below:
A-40
| Stock Option Activity | |||||||||||
| For the years ended December 31, 2007, 2006 and 2005 | |||||||||||
| Shares | Weighted Average Option Price Per Share | Weighted Average Remaining Contractual Term (in years) | Aggregate Intrinsic Value | ||||||||
| Outstanding, December 31, 2004 | 333,978 | $ | 8.11 | ||||||||
| Granted during the period | - | $ | - | ||||||||
| Forfeited during the period | (1,970 | ) | $ | 7.77 | |||||||
| Exercised during the period | (12,316 | ) | $ | 7.86 | |||||||
| Outstanding, December 31, 2005 | 319,692 | $ | 8.13 | ||||||||
| Granted during the period | - | $ | - | ||||||||
| Forfeited during the period | (164 | ) | $ | 7.38 | |||||||
| Exercised during the period | (97,854 | ) | $ | 7.87 | |||||||
| Outstanding, December 31, 2006 | 221,674 | $ | 8.24 | ||||||||
| Granted during the period | - | $ | - | ||||||||
| Forfeited during the period | - | $ | - | ||||||||
| Exercised during the period | (28,949 | ) | $ | 8.26 | |||||||
| Outstanding, December 31, 2007 | 192,725 | $ | 8.24 | 4.05 | $ 1,303,460 | ||||||
| Exercisable, December 31, 2007 | 192,725 | $ | 8.24 | 4.05 | $ 1,303,460 | ||||||
Options outstanding at December 31, 2007 are exercisable at option prices ranging from $6.99 to $10.57, as presented in the table above. Such options have a weighted average remaining contractual life of approximately four years.
The Company adopted Statement of Financial Accounting Standards (“SFAS”) No. 123(R), “Share-Based Payment” (SFAS 123(R)), on January 1, 2006 using the “modified prospective” method. Under this method, awards that are granted, modified, or settled after December 31, 2005, are measured and accounted for in accordance with SFAS 123(R). Also under this method, expense is recognized for unvested awards that were granted prior to January 1, 2006, based upon the fair value determined at the grant date under SFAS No. 123, “Accounting for Stock-Based Compensation” (SFAS 123). The Company recognized compensation expense for employee stock options of $10,000 and $6,000 for the years ended December 31, 2007 and 2006, respectively. As of December 31, 2007, there was no unrecognized compensation cost related to nonvested employee stock options.
Prior to the adoption of SFAS 123(R), the Company accounted for stock compensation under Accounting Principles Board Opinion No. 25 and related interpretations. Accordingly, the Company previously recognized no compensation cost for employee stock options. The following table illustrates the effect on net earnings and earnings per share if the Company had applied the fair value recognition provisions of SFAS 123 as of December 31, 2005.
| 2005 | |||||
| Net earnings | As reported | $ | 6,330,980 | ||
| Effect of grants | (143,747 | ) | |||
| Effect of forfeitures | 5,253 | ||||
| Proforma | $ | 6,192,486 | |||
| Basic earnings per share | As reported | $ | 1.11 | ||
| Proforma | $ | 1.09 | |||
| Diluted earnings per share | As reported | $ | 1.09 | ||
| Proforma | $ | 1.07 |
A-41
No options were granted during the years ended December 31, 2007 and 2006. The total intrinsic value (amount by which the fair market value of the underlying stock exceeds the exercise price of an option on exercise date) of options exercised during the years ended December 31, 2007 and 2006 was $264,000 and $923,000, respectively. There were 2,420 options vested during the years ended December 31, 2007 and 2006. Cash received from option exercises for the years ended December 31, 2007 and 2006 was $239,000 and $771,000, respectively. The tax benefit for the tax deductions from option exercises totaled $92,000 and $243,000, respectively for the years ended December 31, 2007 and 2006.
The Company granted 3,000 shares of restricted stock during the three months ended September 30, 2007. These restricted stock grants cliff vest three years after issuance. The fair value of the restricted stock granted is $17.40 per share. As of September 30, 2007, there was $48,000 of total unrecognized compensation cost related to restricted stock grants, which is expected to be recognized over a period of 3 years.
Net Earnings Per Share
Net earnings per share is based on the weighted average number of common shares outstanding during the period while the effects of potential common shares outstanding during the period are included in diluted earnings per share. The average market price during the year is used to compute equivalent shares.
The reconciliations of the amounts used in the computation of both “basic earnings per share” and “diluted earnings per share” for the years ended December 31, 2007, 2006 and 2005 are as follows:
| Common | Per Share | ||||||||||
| For the year ended December 31, 2007: | Net Earnings | Shares | Amount | ||||||||
| Basic earnings per share | $ | 9,591,971 | 5,700,860 | $ | 1.68 | ||||||
| Effect of dilutive securities: | |||||||||||
| Stock options | - | 109,455 | |||||||||
| Diluted earnings per share | $ | 9,591,971 | 5,810,315 | $ | 1.65 | ||||||
| For the year ended December 31, 2006: | Common | Per Share | |||||||||
| Net Earnings | Shares | Amount | |||||||||
| Basic earnings per share | $ | 9,170,817 | 5,701,829 | $ | 1.61 | ||||||
| Effect of dilutive securities: | |||||||||||
| Stock options | - | 100,495 | |||||||||
| Diluted earnings per share | $ | 9,170,817 | 5,802,324 | $ | 1.58 | ||||||
| For the year ended December 31, 2005: | Common | Per Share | |||||||||
| Net Earnings | Shares | Amount | |||||||||
| Basic earnings per share | $ | 6,330,980 | 5,692,290 | $ | 1.11 | ||||||
| Effect of dilutive securities: | |||||||||||
| Stock options | - | 100,084 | |||||||||
| Diluted earnings per share | $ | 6,330,980 | 5,792,374 | $ | 1.09 | ||||||
On April 19, 2007, the Board of Directors of the Company authorized a 3-for-2 stock split that was paid in conjunction with the Company’s regular cash dividend for the second quarter of 2007. As a result of the stock split, each shareholder received three new shares of stock for every two shares of stock they held as of the record date. Shareholders received a cash payment in lieu of any fractional shares resulting from the stock split. The cash dividend was paid based on the number of shares held by shareholders as adjusted by the stock split. All previously reported per share amounts have been restated to reflect this stock split.
Recent Accounting Pronouncements
In June 2006, FASB issued Financial Interpretation No. 48 ("FIN 48") "Accounting for Uncertainty in Income Taxes - an interpretation of SFAS No. 109". FIN 48 clarifies the accounting for uncertainty in income taxes recognized in the financial statements and prescribes a recognition threshold and measurement attribute for a tax position taken or expected to be taken in a tax return. This interpretation also provides guidance on derecognition, classification, interest and penalties, accounting in interim periods, disclosure and transition. This interpretation was effective for the Company beginning in January of 2007. The Company assessed the impact of FIN 48 and determined that there are no significant positions taken in the preparation of its tax return, and therefore FIN 48 did not have a material impact on its financial position or its results of operations.
A-42
In September 2006, the FASB ratified the conclusions reached by the Emerging Issues Task Force (EITF) on EITF 06-4, "Accounting for Deferred Compensation and Postretirement Benefit Aspects of Endorsement Split-Dollar Life Insurance Arrangements." This issue will require companies to recognize an obligation for either the present value of the entire promised death benefit or the annual "cost of insurance" required to keep the policy in force during the post-retirement years. EITF 06-4 is effective for the Company as of January 1, 2008. This standard is not expected to have a material effect on the Company's financial position, results of operations or disclosures.
In September 2006, the FASB issued SFAS No. 157, “Fair Value Measurements” (SFAS 157). SFAS 157 defines fair value, establishes a framework for measuring fair value in generally accepted accounting principles (GAAP), and expands disclosures about fair value measurements. SFAS 157 applies under other accounting pronouncements that require or permit fair value measurements. SFAS 157 is effective for the Company as of January 1, 2008. This standard is not expected to have a material effect on the Company's financial position or results of operations
In September 2006, the FASB issued SFAS No. 158, “Employers’ Accounting for Defined Benefit Pension and Other Postretirement Plans” (SFAS 158) – an amendment of FASB Statements No. 87, 88, 106 and 132(R). SFAS 158 requires employers to recognize the overfunded or underfunded status of a defined benefit postretirement plan as an asset or liability in its statement of financial position and to recognize changes in that funded status in the year in which the changes occur through comprehensive income. SFAS 158 requires an employer to measure the funded status of a plan as of the date of its year-end statement of financial position, with limited exceptions and includes expanded disclosures. SFAS 158 was effective for the Company as of January 1, 2007. This standard did not have a material effect on the Company's financial position, results of operations or disclosures.
In February 2007, the FASB issued SFAS No. 159, “The Fair Value Option for Financial Assets and Financial Liabilities” (SFAS 159), which permits entities to choose to measure financial instruments and certain other instruments at fair value. SFAS 159 is effective for the Company as of January 1, 2008. The Company does not expect to choose this option for any asset or liability and therefore does not expect SFAS 159 to have a material effect on the Company's financial position, results of operations or disclosures.
Reclassification
Certain amounts in the 2005 consolidated financial statements have been reclassified to conform to the 2007 and 2006 presentation.
| (2) | Investment Securities |
Investment securities available for sale at December 31, 2007 and 2006 are as follows:
| December 31, 2007 | |||||||||||||||
| Gross | Gross | ||||||||||||||
| Amortized | Unrealized | Unrealized | Estimated Fair | ||||||||||||
| Cost | Gains | Losses | Value | ||||||||||||
| Mortgage-backed securities | $ | 16,469,053 | 6,423 | 204,509 | 16,270,967 | ||||||||||
| U.S. government agencies | 75,155,693 | 1,839,143 | 3,035 | 76,991,801 | |||||||||||
| State and political subdivisions | 25,856,311 | 250,483 | 201,406 | 25,905,388 | |||||||||||
| Trust preferred securities | 250,000 | - | - | 250,000 | |||||||||||
| Equity securities | 1,692,799 | 246,000 | 388,597 | 1,550,202 | |||||||||||
| Total | $ | 119,423,856 | 2,342,049 | 797,547 | 120,968,358 | ||||||||||
A-43
| December 31, 2006 | |||||||||||||||
Amortized Cost | Gross Unrealized Gains | Gross Unrealized Losses | Estimated Fair Value | ||||||||||||
| Mortgage-backed securities | $ | 19,666,345 | - | 446,751 | 19,219,594 | ||||||||||
| U.S. government agencies | 72,838,407 | 171,828 | 265,821 | 72,744,414 | |||||||||||
| State and political subdivisions | 24,493,444 | 242,204 | 369,178 | 24,366,470 | |||||||||||
| Trust preferred securities | 750,000 | - | - | 750,000 | |||||||||||
| Equity securities | 814,995 | - | 314,473 | 500,522 | |||||||||||
| Total | $ | 118,563,191 | 414,032 | 1,396,223 | 117,581,000 | ||||||||||
The current fair value and associated unrealized losses on investments in debt securities with unrealized losses at December 31, 2007 and 2006 are summarized in the tables below, with the length of time the individual securities have been in a continuous loss position.
| December 31, 2007 | |||||||||||||
| Less than 12 Months | 12 Months or More | Total | |||||||||||
| Unrealized | Unrealized | Unrealized | |||||||||||
| Fair Value | Losses | Fair Value | Losses | Fair Value | Losses | ||||||||
| Mortgage-backed securities | $ | 24,591 | 104 | 14,320,043 | 204,405 | 14,344,634 | 204,509 | ||||||
| U.S. government agencies | - | - | 689,775 | 3,035 | 689,775 | 3,035 | |||||||
| State and political subdivisions | 2,059,746 | 33,781 | 11,188,720 | 167,625 | 13,248,466 | 201,406 | |||||||
| Equity securities | 425,620 | 88,134 | 278,581 | 300,463 | 704,201 | 388,597 | |||||||
| Total | $ | 2,509,957 | 122,019 | 26,477,119 | 675,528 | 28,987,076 | 797,547 | ||||||
| December 31, 2006 | |||||||||||||
| Less than 12 Months | 12 Months or More | Total | |||||||||||
| Unrealized | Unrealized | Unrealized | |||||||||||
| Fair Value | Losses | Fair Value | Losses | Fair Value | Losses | ||||||||
| Mortgage-backed securities | $ | - | - | 19,202,188 | 446,751 | 19,202,188 | 446,751 | ||||||
| U.S. government agencies | 23,069,770 | 13,361 | 21,510,425 | 252,460 | 44,580,195 | 265,821 | |||||||
| State and political subdivisions | 1,445,462 | 35,988 | 11,589,682 | 333,190 | 13,035,144 | 369,178 | |||||||
| Equity securities | - | - | 500,522 | 314,473 | 500,522 | 314,473 | |||||||
| Total | $ | 24,515,232 | 49,349 | 52,802,817 | 1,346,874 | 77,318,049 | 1,396,223 | ||||||
At December 31, 2007, unrealized losses in the investment securities portfolio related to debt securities totaled $409,000. The unrealized losses on these debt securities arose due to changing interest rates and are considered to be temporary. From the December 31, 2007 tables above, 32 out of 72 securities issued by state and political subdivisions contained unrealized losses and 19 out of 59 securities issued by U.S. government agencies and government sponsored corporations, including mortgage-backed securities, contained unrealized losses. These unrealized losses are considered temporary because of acceptable investment grades on each security and the repayment sources of principal and interest are government backed.
The Company periodically evaluates its investments for any impairment which would be deemed other than temporary. As part of its evaluation in 2007, the Company determined that the fair value of two investments was less than the original cost of the investments and that the decline in fair value was not temporary in nature. As a result, the Company wrote down its original investment by $430,000. The remaining value of the investments at December 31, 2007 is $348,000.
The amortized cost and estimated fair value of investment securities available for sale at December 31, 2007, by contractual maturity, are shown below. Expected maturities of mortgage-backed securities will differ from contractual maturities because borrowers have the right to call or prepay obligations with or without call or prepayment penalties.
A-44
| Amortized | Estimated Fair | ||||||
| Cost | Value | ||||||
| Due within one year | $ | 7,319,434 | 7,331,682 | ||||
| Due from one to five years | 56,422,798 | 57,569,880 | |||||
| Due from five to ten years | 29,280,174 | 29,899,813 | |||||
| Due after ten years | 8,239,598 | 8,345,814 | |||||
| Mortgage-backed securities | 16,469,053 | 16,270,967 | |||||
| Equity securities | 1,692,799 | 1,550,202 | |||||
| Total | $ | 119,423,856 | 120,968,358 |
Proceeds from sales of securities available for sale during 2007, 2006 and 2005 were $8.4 million, $19.9 million and $27.8 million, respectively. Gross losses of $132,000, $592,000 and $730,000 for 2007, 2006 and 2005, respectively, were realized on those sales.
Securities with a fair value of approximately $50.4 million and $25.0 million at December 31, 2007 and 2006, respectively, were pledged to secure public deposits and for other purposes as required by law.
| (3) | Loans |
Major classifications of loans at December 31, 2007 and 2006 are summarized as follows:
| 2007 | 2006 | ||||||
| Commercial | $ | 82,190,391 | 85,064,322 | ||||
| Real estate - mortgage | 417,708,750 | 364,595,188 | |||||
| Real estate - construction | 209,643,836 | 187,959,880 | |||||
| Consumer | 12,733,971 | 13,761,739 | |||||
| Total loans | 722,276,948 | 651,381,129 | |||||
| Less allowance for loan losses | 9,103,058 | 8,303,432 | |||||
| Total net loans | $ | 713,173,890 | 643,077,697 |
The Company grants loans and extensions of credit primarily within the Catawba Valley region of North Carolina, which encompasses Catawba, Alexander, Iredell and Lincoln counties and also in Mecklenburg and Union Counties. Although the Bank has a diversified loan portfolio, a substantial portion of the loan portfolio is collateralized by improved and unimproved real estate, the value of which is dependent upon the real estate market.
At December 31, 2007 and 2006, the recorded investment in loans that were considered to be impaired was approximately $8.0 million and $7.6 million, respectively. In addition, the Company had approximately $0 and $78,000 in loans past due more than ninety days and still accruing interest at December 31, 2007 and 2006, respectively. The related allowance for loan losses on impaired loans was approximately $1.2 million at December 31, 2007 and 2006. The average recorded investment in impaired loans for the twelve months ended December 31, 2007, 2006 and 2005 was approximately $7.3 million, $4.7 million and $6.2 million, respectively. For the years ended December 31, 2007, 2006 and 2005, the Company recognized approximately $29,000, $144,000 and $77,000, respectively, of interest income on impaired loans.
Changes in the allowance for loan losses were as follows:
| 2007 | 2006 | 2005 | ||||||||||
| Balance at beginning of year | $ | 8,303,432 | 7,424,782 | 8,048,627 | ||||||||
| Amounts charged off | (1,626,458 | ) | (1,958,551 | ) | (4,199,650 | ) | ||||||
| Recoveries on amounts previously charged off | 388,084 | 323,919 | 465,805 | |||||||||
| Provision for loan losses | 2,038,000 | 2,513,282 | 3,110,000 | |||||||||
| Balance at end of year | $ | 9,103,058 | 8,303,432 | 7,424,782 |
A-45
| (4) | Premises and Equipment |
Major classifications of premises and equipment are summarized as follows:
| 2007 | 2006 | ||||||
| Land | $ | 3,572,241 | 2,349,041 | ||||
| Buildings and improvements | 14,700,078 | 10,618,896 | |||||
| Furniture and equipment | 15,496,630 | 13,992,524 | |||||
| Total premises and equipment | 33,768,949 | 26,960,461 | |||||
| Less accumulated depreciation | 15,534,556 | 14,144,076 | |||||
| Total net premises and equipment | $ | 18,234,393 | 12,816,385 |
��
Depreciation expense was approximately $1.7 million for the year ended December 31, 2007. The Company recognized approximately $1.5 million in depreciation expense for the years ended December 31, 2006 and 2005.
During 2003, the Company sold a branch location with net book value of approximately $2.4 million and was leasing the facility from the buyer. As a result of the sale, the Company deferred a gain of approximately $633,000 and was recognizing the gain over the lease term. For the period ended December 31, 2007 the Company recognized approximately $10,000 of the deferred gain and for the periods ended December 31, 2006 and 2005, respectively, approximately $21,000 and $22,000 of the deferred gain was recognized. In 2007, the Company repurchased the branch location for $3.0 million, which was $588,000 greater than the original cost of the building. The remaining deferred gain was netted against the purchase price resulting in a net cost of $2.5 million. This cost is being depreciated over 39 years.
| (5) | Time Deposits |
At December 31, 2007, the scheduled maturities of time deposits are as follows:
| 2008 | $ | 363,236,019 | |
| 2009 | 17,088,127 | ||
| 2010 | 3,153,109 | ||
| 2011 | 200,648 | ||
| 2012 and thereafter | 929,815 | ||
| Total | $ | 384,607,718 |
At December 31, 2007 and 2006, the Company has approximately $53.9 million and $60.0 million, respectively, in time deposits purchased through third party brokers. The weighted average rate of brokered deposits as of December 31, 2007 and 2006 was 5.06% and 5.11%, respectively.
| (6) | Federal Home Loan Bank Advances |
The Bank has advances from the Federal Home Loan Bank of Atlanta (“FHLB”) with monthly or quarterly interest payments at December 31, 2007. The FHLB advances are collateralized by a blanket assignment on all residential first mortgage loans, commercial real estate loans, home equity lines of credit and loans secured by multi-family real estate that the Bank owns. At December 31, 2007, the carrying value of loans pledged as collateral totaled approximately $239.0 million.
Advances from the FHLB outstanding at December 31, 2007 consist of the following:
A-46
| Maturity Date | Call Date | Rate | Rate Type | Amount | ||||||
| February 4, 2008 | N/A | 4.400% | Daily Rate | $ | 10,500,000 | |||||
| March 30, 2010 | September 30, 2000 and every | |||||||||
| three months thereafter | 5.880% | Convertible | 5,000,000 | |||||||
| May 24, 2010 | May 24, 2001 and every three | |||||||||
| months thereafter | 6.490% | Convertible | 2,000,000 | |||||||
| June 24, 2015 | June 24, 2010 | 3.710% | Convertible | 5,000,000 | ||||||
| March 25, 2019 | March 25, 2009 | 4.360% | Convertible | 5,000,000 | ||||||
| March 31, 2016 | March 31, 2009 and every three | |||||||||
| months thereafter | 4.620% | Convertible | 5,000,000 | |||||||
| October 5, 2016 | October 5, 2009 | 4.450% | Convertible | 5,000,000 | ||||||
| December 12, 2011 | December 12, 2007 and every | 4.210% | Convertible | 5,000,000 | ||||||
| three months thereafter | ||||||||||
| January 30, 2017 | October 30, 2008 and every | 4.500% | Convertible | 5,000,000 | ||||||
| three months thereafter | ||||||||||
| June 8, 2017 | December 8, 2008 and every | 4.713% | Convertible | 15,000,000 | ||||||
| three months thereafter | ||||||||||
| June 9, 2014 | February 11, 2008 and every | 4.685% | Convertible | 15,000,000 | ||||||
| month thereafter | ||||||||||
| July 11, 2017 | January 11, 2008 and every | 4.440% | Convertible | 5,000,000 | ||||||
| three months thereafter | ||||||||||
| July 24, 2017 | April 24, 2008 and every | 4.420% | Convertible | 5,000,000 | ||||||
| month thereafter | ||||||||||
| $ | 87,500,000 | |||||||||
The FHLB has the option to convert $72.0 million of the total advances to a floating rate and, if converted, the Bank may repay advances without payment of a prepayment fee. The Company also has an additional $5.0 million in variable rate convertible advances, which may be repaid without a prepayment fee if converted by the FHLB.
The Bank is required to purchase and hold certain amounts of FHLB stock in order to obtain FHLB borrowings. No ready market exists for the FHLB stock, and it has no quoted market value. The stock is redeemable at $100 per share subject to certain limitations set by the FHLB. At December 31, 2007 and 2006, the Bank owned FHLB stock amounting to $5.4 million and $5.5 million, respectively.
| (7) | Junior Subordinated Debentures |
In June 2006 the Company formed a second wholly owned Delaware statutory trust, PEBK Capital Trust II (“PEBK Trust II”), which issued $20.0 million of guaranteed preferred beneficial interests in the Company’s junior subordinated deferrable interest debentures. All of the common securities of PEBK Trust II are owned by the Company. The proceeds from the issuance of the common securities and the trust preferred securities were used by PEBK Trust II to purchase $20.6 million of junior subordinated debentures of the Company, which pay a floating rate equal to three month LIBOR plus 163 basis points. The proceeds received by the Company from the sale of the junior subordinated debentures were used to repay in December 2006 the trust preferred securities issued by PEBK Trust in December 2001 and for general purposes. The debentures represent the sole asset of PEBK Trust II. PEBK Trust II is not included in the consolidated financial statements.
The trust preferred securities issued by PEBK Trust II accrue and pay quarterly at a floating rate of three-month LIBOR plus 163 basis points. The Company has guaranteed distributions and other payments due on the trust preferred securities to the extent PEBK Trust II has funds with which to make the distributions and other payments. The net combined effect of all the documents entered into in connection with the trust preferred securities is that the Company is liable to make the distributions and other payments required on the trust preferred securities.
A-47
These trust preferred securities are mandatorily redeemable upon maturity of the debentures on June 28, 2036, or upon earlier redemption as provided in the indenture. The Company has the right to redeem the debentures purchased by PEBK Trust II, in whole or in part, on or after June 28, 2011. As specified in the indenture, if the debentures are redeemed prior to maturity, the redemption price will be the principal amount and any accrued but unpaid interest.
| (8) | Income Taxes |
The provision for income taxes in summarized as follows:
| 2007 | 2006 | 2005 | |||||||||
| Current | $ | 5,819,347 | 5,785,926 | 3,048,094 | |||||||
| Deferred | (479,806 | ) | (615,626 | ) | 332,806 | ||||||
| Total | $ | 5,339,541 | 5,170,300 | 3,380,900 |
The differences between the provision for income taxes and the amount computed by applying the statutory federal income tax rate to earnings before income taxes are as follows:
| 2007 | 2006 | 2005 | ||||||||||
| Pre-tax income at statutory rates (34%) | $ | 5,076,714 | 4,875,980 | 3,302,039 | ||||||||
| Differences: | ||||||||||||
| Tax exempt interest income | (307,169 | ) | (280,826 | ) | (263,555 | ) | ||||||
| Nondeductible interest and other expense | 55,871 | 45,872 | 30,511 | |||||||||
| Cash surrender value of life insurance | (82,951 | ) | (75,021 | ) | (73,973 | ) | ||||||
| State taxes, net of federal benefits | 559,905 | 576,444 | 363,264 | |||||||||
| Other, net | 37,170 | 27,851 | 22,614 | |||||||||
| Total | $ | 5,339,541 | 5,170,300 | 3,380,900 |
The following summarized the tax effects of temporary differences that give rise to significant portions of the deferred tax assets and deferred tax liabilities. The net deferred tax asset is included as a component of other assets at December 31, 2007 and 2006.
| 2007 | 2006 | ||||||
| Deferred tax assets: | |||||||
| Allowance for loan losses | $ | 3,531,076 | 3,201,305 | ||||
| Amortizable intangible assets | 76,398 | 108,472 | |||||
| Accrued retirement expense | 819,246 | 664,581 | |||||
| Income from non-accrual loans | 50,219 | 72,475 | |||||
| Deferred gain on sale of premises | - | 212,820 | |||||
| Unrealized loss on cash flow hedges | 20,525 | 328,933 | |||||
| Unrealized loss on available for sale securities | - | 382,564 | |||||
| Premises and equipment | 9,757 | - | |||||
| Total gross deferred tax assets | 4,507,221 | 4,971,150 | |||||
| Deferred tax liabilities: | |||||||
| Deferred loan fees | 1,346,322 | 1,310,178 | |||||
| Premises and equipment | - | 291,107 | |||||
| Deferred income from servicing rights | - | - | |||||
| Unrealized gain on available for sale securities | 601,583 | - | |||||
| Other | 12,482 | 10,283 | |||||
| Total gross deferred tax liabilities | 1,960,387 | 1,611,568 | |||||
| Net deferred tax asset | $ | 2,546,834 | 3,359,582 |
(9) Related Party Transactions
The Company conducts transactions with its directors and executive officers, including companies in which they have beneficial interests, in the normal course of business. It is the policy of the Company that loan transactions with directors and officers are made on substantially the same terms as those prevailing at the time made for comparable loans to other persons. The following is a summary of activity for related party loans for 2007:
A-48
| Beginning balance | $ | 7,274,778 | |
| New loans | 1,153,336 | ||
| Repayments | 2,812,215 | ||
| Ending balance | $ | 5,615,899 |
At December 31, 2007 and 2006, the Company had deposit relationships with related parties of approximately $15.7 million and $9.1 million, respectively.
| (10) | Commitments and Contingencies |
The Company leases various office spaces for banking and operational facilities and equipment under operating lease arrangements. Future minimum lease payments required for all operating leases having a remaining term in excess of one year at December 31, 2007 are as follows:
| Year | |||
| 2008 | $ | 897,192 | |
| 2009 | 753,827 | ||
| 2010 | 626,965 | ||
| 2011 | 563,901 | ||
| 2012 | 298,771 | ||
| Thereafter | 2,149,222 | ||
| Total minimum obligation | $ | 5,289,878 | |
Total rent expense was approximately $1.1 million, $959,000 and $956,000 for 2007, 2006 and 2005, respectively.
The Company is party to financial instruments with off-balance-sheet risk in the normal course of business to meet the financing needs of its customers. These financial instruments include commitments to extend credit, standby letters of credit and financial guarantees. Those instruments involve, to varying degrees, elements of credit risk in excess of the amount recognized in the balance sheet. The contract amounts of those instruments reflect the extent of involvement the Company has in particular classes of financial instruments.
The exposure to credit loss in the event of nonperformance by the other party to the financial instrument for commitments to extend credit and standby letters of credit and financial guarantees written is represented by the contractual amount of those instruments. The Company uses the same credit policies in making commitments and conditional obligations as it does for on-balance-sheet instruments.
In most cases, the Company requires collateral or other security to support financial instruments with credit risk.
| Contractual Amount | |||||||
| 2007 | 2006 | ||||||
| Financial instruments whose contract amount represent credit risk: | |||||||
| Commitments to extend credit | $ | 190,653,583 | 157,358,229 | ||||
| Standby letters of credit and financial guarantees written | $ | 3,894,259 | 4,573,544 | ||||
Commitments to extend credit are agreements to lend to a customer as long as there is no violation of any condition established in the contract. Commitments generally have fixed expiration dates and because they may expire without being drawn upon, the total commitment amount of $194.5 million does not necessarily represent future cash requirements.
Standby letters of credit and financial guarantees written are conditional commitments issued by the Company to guarantee the performance of a customer to a third party. Those guarantees are primarily issued to businesses in the Company’s delineated market area. The credit risk involved in issuing letters of credit is essentially the same as that involved in extending loan facilities to customers. The Company holds real estate, equipment, automobiles and customer deposits as collateral supporting those commitments for which collateral is deemed necessary.
A-49
The Company has an overall interest rate-risk management strategy that incorporates the use of derivative instruments to minimize significant unplanned fluctuations in earnings that are caused by interest rate volatility. By using derivative instruments, the Company is exposed to credit and market risk. If the counterparty fails to perform, credit risk is equal to the extent of the fair-value gain in the derivative. The Company attempts to minimize the credit risk in derivative instruments by entering into transactions with counterparties that are reviewed periodically by the Company and are believed to be of high quality.
In the normal course of business, the Company is a party (both as plaintiff and defendant) to a number of lawsuits. In the opinion of management and counsel, none of these cases should have a material adverse effect on the financial position of the Bank or the Company.
The Company has employment agreements with certain key employees. The agreements, among other things, include salary, bonus, incentive stock option, and change in control provisions.
The Company has $35.0 million available for the purchase of overnight federal funds from three correspondent financial institutions.
| (11) | Derivative Financial Instruments and Hedging Transactions |
The Company has an overall interest rate risk management strategy that incorporates the use of derivative instruments to minimize significant unplanned fluctuations in earnings that are caused by interest rate volatility. By using derivative instruments, the Company is exposed to credit and market risk. If the counterparty fails to perform, credit risk is equal to the extent of the fair-value gain in the derivative. The Company minimizes the credit risk in derivative instruments by entering into transactions with high-quality counterparties that are reviewed periodically by the Company.
As of December 31, 2007, the Company had cash flow hedges with a notional amount of $185.0 million. These derivative instruments consist of five interest rate floor contracts that are used to hedge future cash flows from payments on the first $185.0 million of certain variable rate loans against the downward effects of their repricing in the event of a decreasing rate environment for periods ending in July 2008, November 2008, January 2009, June 2009 and December 2009. If the prime rate falls below 6.25% during the term of the contract on the first floor, the Company will receive payments based on the $35.0 million notional amount times the difference between 6.25% and the weighted average prime rate for the quarter. No payments will be received by the Company if the weighted average prime rate is 6.25% or higher. The Company paid a premium of $161,000 on this contact. On the second floor if the prime rate falls below 7.00% during the term of the contract, the Company will receive payments based on the $35.0 million notional amount times the difference between 7.00% and the weighted average prime rate for the quarter. No payments will be received by the Company if the weighted average prime rate is 7.00% or higher. The Company paid a premium of $203,000 on this contract. On the third floor if the prime rate falls below 7.50% during the term of the contract, the Company will receive payments based on the $45.0 million notional amount times the difference between 7.50% and the weighted average prime rate for the quarter. No payments will be received by the Company if the weighted average prime rate is 7.50% or higher. The Company paid a premium of $562,500 on this contract. On the fourth floor if the prime rate falls below 8.00% during the term of the contract, the Company will receive payments based on the $35.0 million notional amount times the difference between 8.00% and the weighted average prime rate for the quarter. No payments will be received by the Company if the weighted average prime rate is 8.00% or higher. The Company paid a premium of $399,000 on this contract. On the fifth floor if the prime rate falls below 7.25% during the term of the contract, the Company will receive payments based on the $35.0 million notional amount times the difference between 7.25% and the weighted average prime rate for the quarter. No payments will be received by the Company if the weighted average prime rate is 7.25% or higher. The Company paid a premium of $634,000 on this contract.
The Company recognized $47,000 in interest income from payments on interest rate floor contracts in 2007.
| (12) | Employee and Director Benefit Programs |
The Company has a profit sharing and 401(k) plan for the benefit of substantially all employees subject to certain minimum age and service requirements. Under this plan, the Company matches employee contributions to a maximum of five percent of annual compensation. The Company’s contribution pursuant to this formula was approximately $424,000, $405,000 and $360,000 for the years of 2007, 2006 and 2005, respectively. Investments of the plan are determined by the compensation committee consisting of selected outside directors and senior executive officers. No investments in Company stock have been made by the plan. The vesting schedule for the
A-50
plan begins at 20 percent after two years of employment and graduates 20 percent each year until reaching 100 percent after six years of employment.
In December 2001, the Company initiated a postretirement benefit plan to provide retirement benefits to key officers and its Board of Directors and to provide death benefits for their designated beneficiaries. Under the plan, the Company purchased life insurance contracts on the lives of the key officers and each director. The increase in cash surrender value of the contracts constitutes the Company’s contribution to the plan each year. Plan participants are to be paid annual benefits for a specified number of years commencing upon retirement. Expenses incurred for benefits relating to this plan were approximately $258,000, $240,000 and $245,000 during 2007, 2006 and 2005, respectively.
The Company is currently paying medical benefits for certain retired employees. Postretirement benefits expense, including amortization of the transition obligation, as applicable, was approximately $23,000 for the years ended December 31, 2007, 2006 and 2005. The following table sets forth the accumulated postretirement benefit obligation as of December 31, 2007 and 2006, which represents the liability for accrued postretirement benefit costs:
| 2007 | 2006 | |||||||
| Accumulated postretirement benefit obligation | $ | 170,302 | 196,002 | |||||
| Unrecognized gain (loss) | (21,576 | ) | (38,327 | ) | ||||
| Net liability recognized | $ | 148,726 | 157,675 | |||||
In September 2006, the FASB released SFAS No. 158, “Employers’ Accounting for Defined Benefit Pension and Other Postretirement Plans” which requires employers to recognize the overfunded or underfunded status of defined benefit postretirement plans. The effective date for public companies is for years ending after December 15, 2006. Management has compared the accrued postretirement benefit expense and the charge to other comprehensive income, as calculated in accordance with SFAS 106 and 132 to the requirement under SFAS 158 and determined that the difference is immaterial.
Members of the Board of Directors are eligible to participate in the Company’s Omnibus Stock Ownership and Long Term Incentive Plan (the “Stock Benefits Plan”). Each director has been awarded 9,737 book value shares (adjusted to reflect a 10% stock dividend on April 24, 2000, a 10% stock dividend on March 16, 2005, a 10% stock divided on June 16, 2006 and a 3-for-2 stock split on June 15, 2007) under the Stock Benefits Plan. Five directors were awarded book value shares on September 28, 1999. The book value of the common stock on September 28, 1999 was $6.31 (as adjusted). These book value shares are now fully vested. One director was awarded 9,737 book value shares upon his election to the Board of Directors on May 3, 2001. The book value of the common stock on May 3, 2001 was $7.69 (as adjusted). These book value shares are now fully vested. Four directors were awarded 9,737 book value shares on May 6, 2004. The book value of the common stock on May 6, 2004 was $8.64 (as adjusted). Their shares vest at a rate of 20% annually, with the first 20% vesting on May 6, 2005, and the final 20% vesting on May 6, 2009. The Company recorded expenses of approximately $159,000, $128,000 and $102,000 associated with the benefits of this plan in the years ended December 31, 2007, 2006 and 2005, respectively.
A summary of book value shares activity under the Stock Benefits Plan for the years ended December 31, 2007, 2006 and 2005 is presented below.
| 2007 | 2006 | 2005 | |||||||||||||||||
| Shares | Weighted Average Price of Book Value Shares | Shares | Weighted Average Price of Book Value Shares | Shares | Weighted Average Price of Book Value Shares | ||||||||||||||
| Outstanding, beginning of period | 97,377 | $ | 7.38 | 97,377 | $ | 7.38 | 116,850 | $ | 7.20 | ||||||||||
| Exercised during the period | - | $ | - | - | $ | - | (19,473 | ) | $ | 6.31 | |||||||||
| Outstanding, end of period | 97,377 | $ | 7.38 | 97,377 | $ | 7.38 | 97,377 | $ | 7.38 | ||||||||||
| Number of shares exercisable | 81,791 | $ | 7.89 | 73,998 | $ | 6.98 | 66,208 | $ | 6.79 | ||||||||||
A-51
| (13) | Regulatory Matters |
The Company is subject to various regulatory capital requirements administered by the federal banking agencies. Failure to meet minimum capital requirements can initiate certain mandatory and possibly additional discretionary actions by regulators that, if undertaken, could have a direct material effect on the Company’s financial statements. Under capital adequacy guidelines and the regulatory framework for prompt corrective action, the Company must meet specific capital guidelines that involve quantitative measures of the assets, liabilities and certain off-balance-sheet items as calculated under regulatory accounting practices. The capital amounts and classification are also subject to qualitative judgments by the regulators about components, risk weightings, and other factors.
Quantitative measures established by regulation to ensure capital adequacy require the Company to maintain minimum amounts and ratios of capital in relation to both on- and off-balance sheet items at various risk weights. Total capital consists of two tiers of capital. Tier 1 Capital includes common shareholders’ equity and trust preferred securities less adjustments for intangible assets. Tier 2 Capital consists of the allowance for loan losses up to 1.25% of risk-weighted assets and other adjustments. Management believes, as of December 31, 2007, that the Company and the Bank meet all capital adequacy requirements to which they are subject.
As of December 31, 2007, the most recent notification from the FDIC categorized the Bank as well capitalized under the regulatory framework for prompt corrective action. To be categorized as well capitalized the Bank must maintain minimum total risk-based, Tier 1 risk-based and Tier 1 leverage ratios as set forth in the table. There are no conditions or events since that notification that management believes have changed the Bank’s category.
The Company’s and the Bank’s actual capital amounts and ratios are presented below:
| Actual | For Capital Adequacy Purposes | To Be Well Capitalized Under Prompt Corrective Action Provisions | ||||||||||||||||||||||
| Amount | Ratio | Amount | Ratio | Amount | Ratio | |||||||||||||||||||
| (dollars in thousands) | ||||||||||||||||||||||||
| As of December 31, 2007: | ||||||||||||||||||||||||
| Total Capital (to Risk-Weighted Assets) | ||||||||||||||||||||||||
| Consolidated | $ | 97,410 | 12.16 | % | 64,071 | 8.00 | % | N/A | N/A | |||||||||||||||
| Bank | $ | 87,393 | 10.93 | % | 63,940 | 8.00 | % | 79,926 | 10.00 | % | ||||||||||||||
| Tier 1 Capital (to Risk-Weighted Assets) | ||||||||||||||||||||||||
| Consolidated | $ | 88,307 | 11.03 | % | 32,035 | 4.00 | % | N/A | N/A | |||||||||||||||
| Bank | $ | 78,290 | 9.80 | % | 31,970 | 4.00 | % | 47,955 | 6.00 | % | ||||||||||||||
| Tier 1 Capital (to Average Assets) | ||||||||||||||||||||||||
| Consolidated | $ | 88,307 | 10.43 | % | 33,873 | 4.00 | % | N/A | N/A | |||||||||||||||
| Bank | $ | 78,290 | 9.26 | % | 33,827 | 4.00 | % | 42,284 | 5.00 | % | ||||||||||||||
| As of December 31, 2006: | ||||||||||||||||||||||||
| Total Capital (to Risk-Weighted Assets) | ||||||||||||||||||||||||
| Consolidated | $ | 91,718 | 12.86 | % | 57,056 | 8.00 | % | N/A | N/A | |||||||||||||||
| Bank | $ | 80,857 | 11.37 | % | 56,875 | 8.00 | % | 71,094 | 10.00 | % | ||||||||||||||
| Tier 1 Capital (to Risk-Weighted Assets) | ||||||||||||||||||||||||
| Consolidated | $ | 83,415 | 11.70 | % | 28,528 | 4.00 | % | N/A | N/A | |||||||||||||||
| Bank | $ | 72,554 | 10.21 | % | 28,438 | 4.00 | % | 42,656 | 6.00 | % | ||||||||||||||
| Tier 1 Capital (to Average Assets) | ||||||||||||||||||||||||
| Consolidated | $ | 83,415 | 10.80 | % | 30,903 | 4.00 | % | N/A | N/A | |||||||||||||||
| Bank | $ | 72,554 | 9.41 | % | 30,857 | 4.00 | % | 38,571 | 5.00 | % | ||||||||||||||
A-52
| (14) | Shareholders’ Equity |
In November 2006, the Company’s Board of Directors authorized the repurchase of up to $2.0 million in common shares of the Company’s outstanding common stock through its existing Stock Repurchase Plan effective through the end of November 2007. During 2007 the Company repurchased 100,000 shares, or $1,938,000 of its common stock under this plan.
In August 2007, the Company’s Board of Directors authorized the repurchase of up to 75,000 common shares of the Company’s outstanding common stock through its existing Stock Repurchase Plan effective through the end of August 2008. The Company has repurchased 50,497 shares, or $873,000, of its common stock under this plan as of December 31, 2007.
The Board of Directors, at its discretion, can issue shares of preferred stock up to a maximum of 5,000,000 shares. The Board is authorized to determine the number of shares, voting powers, designations, preferences, limitations and relative rights.
The Board of Directors of the Bank may declare a dividend of all of its retained earnings as it may deem appropriate, subject to the requirements of the General Statutes of North Carolina, without prior approval from the requisite regulatory authorities. As of December 31, 2007, this amount was approximately $19.7 million.
| (15) | Other Operating Expense |
Other operating expense for the years ended December 31 included the following items that exceeded one percent of total revenues:
| 2007 | 2006 | 2005 | |||||||||
| Advertising | $ | 988,116 | 772,917 | 656,184 | |||||||
| (16) | Fair Value of Financial Instruments |
The Company is required to disclose fair value information about financial instruments, whether or not recognized on the face of the balance sheet, for which it is practicable to estimate that value. The assumptions used in the estimation of the fair value of the Company’s financial instruments are detailed below. Where quoted prices are not available, fair values are based on estimates using discounted cash flows and other valuation techniques. The use of discounted cash flows can be significantly affected by the assumptions used, including the discount rate and estimates of future cash flows. The following disclosures should not be considered a surrogate of the liquidation value of the Company, but rather a good faith estimate of the increase or decrease in value of financial instruments held by the Company since purchase, origination, or issuance.
Cash and Cash Equivalents
For cash, due from banks, interest bearing deposits and federal funds sold, the carrying amount is a reasonable estimate of fair value.
Investment Securities Available for Sale
Fair values for investment securities are based on quoted market prices.
Other Investments
For other investments, the carrying value is a reasonable estimate of fair value.
Loans
The fair value of fixed rate loans is estimated by discounting the future cash flows using the current rates at which similar loans would be made to borrowers with similar credit ratings. For variable rate loans, the carrying amount is a reasonable estimate of fair value.
Cash Surrender Value of Life Insurance
For cash surrender value of life insurance, the carrying value is a reasonable estimate of fair value.
Derivative Instruments
For derivative instruments, fair value is estimated as the amount that the Company would receive or pay to terminate the contracts at the reporting date, taking into account the current unrealized gains or losses on open contracts.
A-53
Deposits and Demand Notes Payable
The fair value of demand deposits, interest-bearing demand deposits, savings, and demand notes payable to U.S. Treasury is the amount payable on demand at the reporting date. The fair value of certificates of deposit is estimated by discounting the future cash flows using the rates currently offered for deposits of similar remaining maturities.
FHLB Advances
The fair value of FHLB advances is estimated based upon discounted future cash flows using a discount rate comparable to the current market rate for such borrowings.
Junior Subordinated Debentures
Because the Company’s junior subordinated debentures were issued at a floating rate, the carrying amount is a reasonable estimate of fair value.
Commitments to Extend Credit and Standby Letters of Credit
Commitments to extend credit and standby letters of credit are generally short-term and at variable interest rates. Therefore, both the carrying value and estimated fair value associated with these instruments are immaterial.
Limitations
Fair value estimates are made at a specific point in time, based on relevant market information and information about the financial instrument. These estimates do not reflect any premium or discount that could result from offering for sale at one time the Company’s entire holdings of a particular financial instrument. Because no market exists for a significant portion of the Company’s financial instruments, fair value estimates are based on many judgments. These estimates are subjective in nature and involve uncertainties and matters of significant judgment and therefore cannot be determined with precision. Changes in assumptions could significantly affect the estimates.
Fair value estimates are based on existing on and off-balance sheet financial instruments without attempting to estimate the value of anticipated future business and the value of assets and liabilities that are not considered financial instruments. Significant assets and liabilities that are not considered financial instruments include the deferred income taxes and premises and equipment. In addition, the tax ramifications related to the realization of the unrealized gains and losses can have a significant effect on fair value estimates and have not been considered in the estimates.
The carrying amount and estimated fair value of the Company’s financial instruments at December 31, 2007 and 2006 are as follows:
| 2007 | 2006 | ||||||||||||||
| Carrying | Estimated | Carrying | Estimated | ||||||||||||
| Amount | Fair Value | Amount | Fair Value | ||||||||||||
| (dollars in thousands) | |||||||||||||||
| Assets: | |||||||||||||||
| Cash and cash equivalents | $ | 29,800 | 29,800 | 21,500 | 21,500 | ||||||||||
| Investment securities available for sale | $ | 120,968 | 120,968 | 117,581 | 117,581 | ||||||||||
| Other investments | $ | 6,434 | 6,434 | 7,295 | 7,295 | ||||||||||
| Loans, net | $ | 713,174 | 713,689 | 643,078 | 641,414 | ||||||||||
| Cash surrender value of life insurance | $ | 6,776 | 6,776 | 6,532 | 6,532 | ||||||||||
| Derivative instruments | $ | 1,907 | 1,907 | 481 | 481 | ||||||||||
| Liabilities: | |||||||||||||||
| Deposits and demand notes payable | $ | 695,239 | 695,659 | 635,420 | 635,371 | ||||||||||
| FHLB advances | $ | 87,500 | 90,223 | 89,300 | 88,819 | ||||||||||
| Junior subordinated debentures | $ | 20,619 | 20,619 | 20,619 | 20,619 | ||||||||||
A-54
(17) Peoples Bancorp of North Carolina, Inc. (Parent Company Only) Condensed Financial Statements
| Balance Sheets | |||||||
| December 31, 2007 and 2006 | |||||||
| Assets | 2007 | 2006 | |||||
| Cash | $ | 725,416 | 1,646,880 | ||||
| Interest-bearing time deposit | 8,000,000 | 8,000,000 | |||||
| Investment in subsidiaries | 80,703,540 | 72,593,671 | |||||
| Investment securities available for sale | 1,374,581 | 750,521 | |||||
| Other investments | - | 600,000 | |||||
| Other assets | 251,724 | 293,049 | |||||
| Total assets | $ | 91,055,261 | 83,884,121 | ||||
| Liabilities and Shareholders' Equity | |||||||
| Accrued expenses | $ | 334,679 | 429,748 | ||||
| Junior subordinated debentures | 20,619,000 | 20,619,000 | |||||
| Shareholders' equity | 70,101,582 | 62,835,373 | |||||
| Total liabilities and shareholders' equity | $ | 91,055,261 | 83,884,121 | ||||
| Statements of Earnings | |||||||||||
| For the Years Ended December 31, 2007, 2006 and 2005 | |||||||||||
| Revenues: | 2007 | 2006 | 2005 | ||||||||
| Dividends from subsidiaries | $ | 4,811,203 | 3,855,556 | 2,346,897 | |||||||
| Interest and dividend income | 463,866 | 672,922 | 111,777 | ||||||||
| Loss on sale of securities | (235,950 | ) | - | - | |||||||
| Total revenues | 5,039,119 | 4,528,478 | 2,458,674 | ||||||||
| Expenses: | |||||||||||
| Interest | 1,475,701 | 1,962,692 | 938,145 | ||||||||
| Other operating expenses | 266,146 | 786,014 | 289,691 | ||||||||
| Total expenses | 1,741,847 | 2,748,706 | 1,227,836 | ||||||||
| Earnings before income tax benefit and equity in | |||||||||||
| undistributed earnings of subsidiaries | 3,297,272 | 1,779,772 | 1,230,838 | ||||||||
| Income tax benefit | 514,800 | 705,800 | 379,500 | ||||||||
| Earnings before undistributed earnings in subsidiaries | 3,812,072 | 2,485,572 | 1,610,338 | ||||||||
| Equity in undistributed earnings in subsidiaries | 5,779,899 | 6,685,245 | 4,720,642 | ||||||||
| Net earnings | $ | 9,591,971 | 9,170,817 | 6,330,980 | |||||||
A-55
| Statements of Cash Flows | ||||||||||||
| For the Years Ended December 31, 2007, 2006 and 2005 | ||||||||||||
| 2007 | 2006 | 2005 | ||||||||||
| Cash flows from operating activities: | ||||||||||||
| Net earnings | $ | 9,591,971 | 9,170,817 | 6,330,980 | ||||||||
| Adjustments to reconcile net earnings to net | ||||||||||||
| cash provided by operating activities: | ||||||||||||
| Amortization | - | 461,298 | 17,742 | |||||||||
| Book value shares accrual | 158,678 | 128,444 | 21,818 | |||||||||
| Equity in undistributed earnings of subsidiaries | (5,779,899 | ) | (6,685,245 | ) | (4,720,642 | ) | ||||||
| Deferred income tax benefit | (61,551 | ) | (49,520 | ) | (8,412 | ) | ||||||
| Loss on sale of investment securities | 235,950 | - | - | |||||||||
| Change in: | ||||||||||||
| Accrued income | 1,603 | (1,421 | ) | 17,930 | ||||||||
| Accrued expense | (253,748 | ) | 25,975 | (21,063 | ) | |||||||
| Net cash provided by operating activities | 3,893,004 | 3,050,348 | 1,638,353 | |||||||||
| Cash flows from investing activities: | ||||||||||||
| Net change in interest-bearing time deposit | - | (6,000,000 | ) | - | ||||||||
| Purchases of other investments | - | (600,000 | ) | - | ||||||||
| Purchase of equity in PEBK Capital Trust II | - | (619,000 | ) | - | ||||||||
| Proceeds from liquidation of PEBK Capital Trust I | - | 433,000 | - | |||||||||
| Net cash used by investing activities | - | (6,786,000 | ) | - | ||||||||
| Cash flows from financing activities: | ||||||||||||
| Proceeds from issuance of trust preferred securities | - | 20,619,000 | - | |||||||||
| Repayments of trust preferred securities | - | (14,433,000 | ) | - | ||||||||
| Cash dividends paid | (2,331,203 | ) | (1,905,556 | ) | (1,414,239 | ) | ||||||
| Cash paid in lieu of fractional shares | (3,355 | ) | (6,426 | ) | (4,700 | ) | ||||||
| Common stock repurchased | (2,810,907 | ) | (425,000 | ) | (314,750 | ) | ||||||
| Proceeds from exercise of stock options | 330,997 | 1,014,425 | 96,773 | |||||||||
| Net cash provided (used) by financing activities | (4,814,468 | ) | 4,863,443 | (1,636,916 | ) | |||||||
| Net change in cash | (921,464 | ) | 1,127,791 | 1,437 | ||||||||
| Cash at beginning of year | 1,646,880 | 519,089 | 517,652 | |||||||||
| Cash at end of year | $ | 725,416 | 1,646,880 | 519,089 | ||||||||
A-56
DIRECTORS AND OFFICERS OF THE COMPANY
DIRECTORS
Robert C. Abernethy – Chairman
Chairman of the Board, Peoples Bancorp of North Carolina, Inc. and Peoples Bank;
President, Secretary and Treasurer, Carolina Glove Company, Inc. (glove manufacturer)
James S. Abernethy
President and Assistant Secretary, Midstate Contractors, Inc. (paving company)
Douglas S. Howard
Vice President, Howard Ventures, Inc. (private equity firm)
John W. Lineberger, Jr.
President, Lincoln Bonded Warehouse Company (commercial warehousing and distribution facility)
Gary E. Matthews
President and Director, Matthews Construction Company, Inc. (general contractor)
Billy L. Price, Jr. MD
Practicing Internist and Partner, Catawba Valley Internal Medicine, P.A.
Larry E. Robinson
President and Chief Executive Officer, The Blue Ridge Distributing Co., Inc. (beer and wine distributor)
William Gregory (Greg) Terry
Executive Vice President, Drum & Willis-Reynolds Funeral Homes and Crematory
Dan Ray Timmerman, Sr.
President, Timmerman Manufacturing, Inc. (wrought iron furniture manufacturer)
Benjamin I. Zachary
President, Treasurer, General Manager and Member of the Board of Directors,
Alexander Railroad Company
OFFICERS
Tony W. Wolfe
President and Chief Executive Officer
Joseph F. Beaman, Jr.
Executive Vice President and Corporate Secretary
Lance A. Sellers
Executive Vice President and Assistant Corporate Secretary
William D. Cable, Sr.
Executive Vice President and Assistant Corporate Treasurer
A. Joseph Lampron
Executive Vice President, Chief Financial Officer and Corporate Treasurer
A-57
APPENDIX B
PROPOSED AMENDMENT TO ARTICLE VIII
ARTICLE VIII
The number of directors of the Corporation shall not be less than five (5) nor more than fifteen (15), with the exact number to be fixed from time to time as provided in the Corporation’s Bylaws.
In the first election of directors, and in all elections thereafter until the 2009 annual meeting of shareholders that the total number of directors as fixed pursuant to the Corporation’s Bylaws is nine (9) or more, the directors shall be divided into three (3) classes, as nearly equal as possible in number as may be, to serve in the first instance for terms of one, two and three years, respectively, from the date such class of directors takes office or until their earlier death, resignation, retirement, removal or disqualification or until their successors shall be elected and shall qualify. Thereafter, until the 2009 annual meeting of shareholders, the successors in each class of directors shall be elected for terms of three (3) years or until their earlier death, resignation, retirement, removal, or disqualification or until their successors shall be elected and shall qualify. In the event of any increase or decrease in the number of directors at a time that the directors are so classified, the additional or eliminated directorships shall be classified or chosen so that all classes of directors shall remain or become as nearly equal as possible in number. At all times that the number of directors, as fixed pursuant to the Corporation’s Bylaws, is less than nine (9), each director shall be elected to a term ending as of the next succeeding annual meeting of shareholders or until his or her earlier death, resignation,
B-1
retirement, removal or disqualification or until his or her successor shall be elected and shall qualify.
All directors elected or appointed prior to the 2009 annual meeting of shareholders shall serve as a director until the expiration of the director’s current term or the director’s earlier death, resignation, disqualification or removal. At the 2009 annual meeting of shareholders, each expiring director’s position to be filled shall be filled by the election or reelection of a director whose term will expire at the 2011 annual meeting of shareholders or the director’s earlier death, resignation disqualification or removal. At the 2010 annual meeting of shareholders, each expiring director’s position to be filled shall be filled by the election or reelection of a director whose term will expire at the 2011 annual meeting of shareholders or the director’s earlier death, resignation, disqualification or removal.
Beginning with the 2011 annual meeting of shareholders, directors shall be elected to term ending as of the next succeeding annual meeting of shareholders or until his or her earlier death, resignation, retirement, removal or disqualification.
B-2
| x | PLEASE MARK VOTES | REVOCABLE PROXY | ||
| AS IN THIS EXAMPLE | PEOPLES BANCORP OF NORTH CAROLINA, INC. | |||
Annual Meeting of Shareholders
May 1, 2008 11:00 a.m.
(Solicited on behalf of the Board of Directors)
The undersigned holder of Common Stock of Peoples Bancorp of North Carolina, Inc. (the "Company"), revoking all proxies heretofore given, hereby constitutes and appoints the official proxy committee of the Company, comprised of all of the members of the Board of Directors of the Company, each with full power of substitution, for the undersigned and in the name, place and stead of the undersigned to vote all of the undersigned's shares of said stock, according to the number of votes and with all the powers the undersigned would possess if personally present, at the 2008 Annual Meeting of Shareholders of Peoples Bancorp of North Carolina, Inc. (the "Meeting") to be held at the Catawba Country Club, 1154 Country Club Road, Newton, North Carolina, on May 1, 2008 at 11:00 A.M., Eastern Time, and at any adjournments or postponements thereof.
| For | With- | For All | |||||
| hold | Except | ||||||
| o | o | o | |||||
| 1. | The approval of the election of the following named directors: |
Douglas S. Howard and Billy L. Price, Jr. M.D., to serve as directors until the 2011 Annual Meeting of Shareholders or until their successors are duly elected and qualified.
INSTRUCTIONS: To withhold authority to vote for any individual nominee, mark "For All Except" and write that nominee's name in the space provided below.
| For | Against | Abstain | |||||
| 2. | To approve the amendment to the Company's Articles of Incorporation. | o | o | o | |||
| 3. | The ratification and approval of the appointment of Porter Keadle Moore, LLP as | o | o | o | |||
| the Company's independent registered public accounting firm for the fiscal year ending December 31, 2008. | |||||||
The proxy committee of the Company is authorized to vote in their discretion upon such other matters as may properly come before the Meeting.
THE BOARD OF DIRECTORS RECOMMENDS A VOTE "FOR" EACH OF THE LISTED PROPOSALS.
The shares represented by this proxy will be voted in the manner directed. In the absence of any direction, the shares will be voted FOR each nominee listed above; FOR the approval of the amendment to the Company’s Articles of Incorporation; FOR the ratification and approval of the appointment of Porter Keadle Moore, LLP as the Company's independent registered public accounting firm for the fiscal year ending December 31, 2008; and in accordance with the discretion of the proxy committee of the Company on such other matters as may properly come before the Meeting. If instructions are given with respect to one but not all proposals, such instructions as are given will be followed and the proxy will be voted as indicated above on the proposal(s) for which no instructions are given.
Signature(s) should conform to names as registered. For jointly owned shares, each owner should sign. When signing as attorney, executor, administrator, trustee, guardian or officer of a corporation, please give full title.
Please be sure to sign and date this Proxy in the box below. | Date |
Stockholder sign above Co-holder (if any) sign above
| ...................................................................................................................................................................................................................................................................................................................................... |
Detach above card, sign, date and mail in the postage paid envelope provided.
PEOPLES BANCORP OF NORTH CAROLINA, Inc.
| THIS PROXY IS SOLICITED BY THE BOARD OF DIRECTORS |
| The above signed hereby acknowledges receipt of the Notice of Meeting and Proxy Statement each dated March 31, 2008, relating to the Meeting and hereby revokes any proxy |
| or proxies heretofore given. |
| Each properly executed proxy will be voted in accordance with the specifications made above and in the discretion of the proxy committee of the Company on any other matter |
| that may come before the Meeting. Where no choice is specified, this proxy will be voted (i) FOR all listed nominees to serve as directors, (ii) FOR the approval of the amendment |
| to the Company's Articles of Incorporation, (iii) FOR the ratification and approval of the appointment of Porter Keadle Moore, LLP as the Company's independent registered public |
| accounting firm for the fiscal year ending December 31, 2008. |
| PLEASE ACT PROMPTLY |
| SIGN, DATE & MAIL YOUR PROXY CARD TODAY |
IF YOUR ADDRESS HAS CHANGED, PLEASE CORRECT THE ADDRESS IN THE SPACE PROVIDED BELOW AND RETURN THE PROXY IN THE ENVELOPE PROVIDED.
___________________________________________
___________________________________________
___________________________________________