UNITED STATES
SECURITIES AND EXCHANGE COMMISSION
WASHINGTON, D.C. 20549
SCHEDULE 14A INFORMATION
Proxy Statement Pursuant to Section 14(a) of the Securities Exchange Act of 1934
(Amendment No. __)
Filed by the Registrant ☒
Filed by a Party other than the Registrant ☐
Check the appropriate box:
☐ Preliminary Proxy Statement
☐ Confidential, For Use of the Commission Only (As Permitted by Rule 14a-6(e)(2))
☒ Definitive Proxy Statement
☐ Definitive Additional Materials
☐ Soliciting Material under Rule 14a-12
Peoples Bancorp of North Carolina, Inc. |
(Name of Registrant as Specified In Its Charter) |
|
(Name of Person(s) Filing Proxy Statement, if other than the Registrant) |
Payment of Filing Fee (Check the appropriate box):
☒ No fee required
☐ Fee computed on table below per Exchange Act Rules 14a-6(i)(1) and 0-11.
(1) | Title of each class of securities to which transaction applies: |
(2) | Aggregate number of securities to which transaction applies: |
(3) | Per unit price or other underlying value of transaction computed pursuant to Exchange Act Rule 0-11 (set forth the amount on which the filing fee is calculated and state how it was determined): |
(4) | Proposed maximum aggregate value of transaction: |
(5) | Total fee paid: |
☐ Fee paid previously with preliminary materials.
☐ Check box if any part of the fee is offset as provided by Exchange Act Rule 0-11(a)(2) and identify the filing for which the offsetting fee was paid previously. Identify the previous filing by registration statement number, or the form or schedule and the date of its filing.
(1) | Amount Previously Paid: |
(2) | Form, Schedule or Registration Statement No.: |
(3) | Filing Party: |
(4) | Date Filed: |

Notice of 2023 Annual Meeting,
Proxy Statement and
Annual Report
PEOPLES BANCORP OF NORTH CAROLINA, INC.
PROXY STATEMENT
Table of Contents
|
| Page |
|
|
|
|
|
|
| ||
|
|
|
|
| 2 |
| |
|
|
|
|
| 2 |
| |
|
|
|
|
SECURITY OWNERSHIP OF CERTAIN BENEFICIAL OWNERS AND MANAGEMENT |
| 6 |
|
|
|
|
|
| 8 |
| |
|
|
|
|
| 8 |
| |
|
|
|
|
| 8 |
| |
| 10 |
| |
| 11 |
| |
What is our policy for director attendance at Annual Meetings? |
| 11 |
|
| 11 |
| |
| 12 |
| |
| 13 |
| |
| 13 |
| |
How can a shareholder nominate someone for election to the Board of Directors? |
| 13 |
|
| 14 |
| |
| 14 |
| |
|
|
|
|
| 16 |
| |
| 16 |
| |
| 16 |
| |
| 17 |
| |
| 19 |
| |
|
|
|
|
| 20 |
| |
| 20 |
| |
| 21 |
| |
| 21 |
| |
| 22 |
| |
| 22 |
| |
| 23 |
| |
| 23 |
| |
| 23 |
| |
| 24 |
| |
| 25 |
| |
| 27 |
| |
Analysis of the Information Presented in the Pay Versus Performance Table |
| 27 |
|
| 27 |
| |
| 29 |
| |
| 31 |
| |
| 31 |
| |
|
|
|
|
PROPOSAL 2 RATIFICATION OF SELECTION OF INDEPENDENT REGISTERED PUBLIC ACCOUNTING FIRM |
| 32 |
|
| 32 |
| |
|
|
|
|
| 33 |
| |
|
|
|
|
| 33 |
| |
|
|
|
|
| 33 |
| |
Appendices |
|
|
|
| 34 |
|
| i |
| Table of Contents |
PEOPLES BANCORP OF NORTH CAROLINA, INC.
Post Office Box 467
518 West C Street
Newton, North Carolina 28658-0467
(828) 464-5620
NOTICE OF 2023 ANNUAL MEETING OF SHAREHOLDERS
NOTICE IS HEREBY GIVEN that the 2023 Annual Meeting of Shareholders (the “Annual Meeting”) of Peoples Bancorp of North Carolina, Inc. (the “Company”) will be held virtually on May 4, 2023 at 11:00 a.m., Eastern Time. The purpose of the Annual Meeting is to consider and vote upon the following proposals:
| · | To elect 11 persons to serve as members of the Board of Directors until the 2024 Annual Meeting of Shareholders or until their successors are duly elected and qualified; |
|
|
|
| · | To ratify the appointment of Elliott Davis, PLLC as the Company’s independent registered public accounting firm for the fiscal year ending December 31, 2023; and |
to consider and act on any other matters that may properly come before the Annual Meeting or any adjournment thereof.
We will again hold our Annual Meeting in a “virtual only” format, via live audio webcast. Shareholders will have an opportunity to participate remotely (online) in the Annual Meeting regardless of their geographic locations.
Shareholders desiring to attend in the Annual Meeting should email the Company’s Assistant Corporate Secretary, Krissy Price, at kprice@peoplesbanknc.com on or before 5:30 p.m., Eastern Time, on Wednesday, May 3, 2023, stating (1) such shareholder’s name, address, phone number and the 16-digit identification code that appears on such shareholder’s proxy card, (2) the number of shares of the Company’s common stock that they held of record as of March 8, 2023 and (3) that they desire to participate in the Annual Meeting. The Company will then take measures to verify such shareholder’s identity. After verifying such shareholder’s identity, those shareholders desiring to participate remotely at the Annual Meeting will be sent a response email providing information to enable them to participate in the Annual Meeting. Regardless of whether a shareholder intends to participate remotely in the Annual Meeting, all shareholders are encouraged to vote their shares prior to the Annual Meeting, as directed on the proxy cards.
The Board of Directors has established March 8, 2023, as the record date for the determination of shareholders entitled to notice of and to vote at the Annual Meeting. If an insufficient number of shares is present to constitute a quorum at the time of the Annual Meeting, the Annual Meeting may be adjourned in order to permit further solicitation of proxies by the Company.
Your vote is important. We urge you to vote as soon as possible so that your votes will be properly recorded. You may vote by executing and returning your proxy card in the accompanying envelope, or by voting electronically over the Internet or by telephone. Please refer to the proxy card for information on voting electronically and by phone. If you participate remotely at the Annual Meeting, you may vote in person, in which event your proxy will not be used.
|
| By Order of the Board of Directors, |
|
|
|
|
|
|
|
|
|
|
| Lance A. Sellers President and Chief Executive Officer |
|

Newton, North Carolina
March 27, 2023
| Table of Contents |
PEOPLES BANCORP OF NORTH CAROLINA, INC.
______________________________________
______________________________________
Annual Meeting of Shareholders
To Be Held on May 4, 2023
_____________________________________
This Proxy Statement is being mailed to our shareholders on or about March 27, 2023, for solicitation of proxies by the Board of Directors (the “Board of Directors” or the “Board”) of Peoples Bancorp of North Carolina, Inc. Our principal executive offices are located at 518 West C Street, Newton, North Carolina 28658. Our telephone number is (828) 464-5620.
In this Proxy Statement, the terms “we,” “us,” “our” and the “Company” refer to Peoples Bancorp of North Carolina, Inc. The term “Bank” refers to Peoples Bank, our wholly-owned, North Carolina-chartered bank subsidiary, and the term “Bank Board” refers to the board of directors of the Bank. The terms “you” and “your” refer to our shareholders, and the term “common stock” refers to our common stock, no par value per share.
Important Notice Regarding the Availability of Proxy Materials for the Shareholder Meeting to Be Held on May 4, 2023. The Notice, Proxy Statement and the Annual Report to Shareholders for the year ended December 31, 2022 are also available at https://pebk.q4ir.com/filings-financials/proxy-material-and-annual-report/default.aspx. You may also access the above off-site website by going to www.peoplesbanknc.com and clicking on the link.
INFORMATION ABOUT THE ANNUAL MEETING
Your vote is very important. For this reason, our Board of Directors is requesting that you allow your common stock to be represented at the 2023 Annual Meeting of Shareholders by the proxies named on the enclosed proxy card.
When is the Annual Meeting? | May 4, 2023, at 11 a.m., Eastern Time. | |
|
| |
What items will be voted on at the Annual Meeting? | 1. | ELECTION OF DIRECTORS. To elect 11 persons to serve as directors of the Company until the 2024 Annual Meeting of Shareholders or until their successors are duly elected and qualified. |
|
|
|
| 2. | RATIFICATION OF APPOINTMENT OF INDEPENDENT REGISTERED PUBLIC ACCOUNTING FIRM. To ratify the appointment of Elliott Davis, PLLC (“Elliott Davis”) as the Company’s independent registered public accounting firm for fiscal year 2023. |
|
|
|
| 3. | OTHER BUSINESS. To consider any other business as may properly come before the Annual Meeting or any adjournment thereof. |
|
|
|
Who can vote? | Only holders of record of our common stock at the close of business on March 8, 2023 (the “Record Date”) will be entitled to notice of and to vote at the Annual Meeting and any adjournment thereof. On the Record Date, there were 5,637,021 shares of our common stock outstanding and entitled to vote, and 668 shareholders of record. | |
| 2 |
| Table of Contents |
How do I vote by proxy? | You may vote your shares by marking, signing and dating the enclosed proxy card and returning it in the enclosed postage-paid envelope or by voting electronically over the Internet or by telephone using the information on the proxy card. If you return your signed proxy card before the Annual Meeting, the proxies will vote your shares as you direct. The Board of Directors has appointed proxies to represent shareholders who cannot participate at the Annual Meeting.
For the election of directors, you may vote for (1) all of the nominees, (2) none of the nominees, or (3) all of the nominees except those you designate. If a nominee for election as a director becomes unavailable for election at any time at or before the Annual Meeting, the proxies will vote your shares for a substitute nominee. For each other item of business, you may vote “FOR” or “AGAINST” or you may “ABSTAIN” from voting.
If you return your signed proxy card but do not specify how you want to vote your shares, the proxies will vote them “FOR” the election of all of our nominees for directors and “FOR” all other proposals presented in this Proxy Statement in accordance with recommendations from the Board.
If your shares are held in the name of a bank, broker, or other holder of record (each hereafter referred to as a “broker”) (i.e., held in “street name”), you will need to obtain a proxy instruction card from the broker holding your shares and return the card as directed by your broker. Your broker is not permitted to vote on your behalf in the election of directors unless you provide specific instructions to your broker by following the instructions from your broker about voting your shares by telephone or over the Internet or completing and returning the voting instruction card provided by your broker. For your vote to be counted in the election of directors, you will need to communicate your voting decision to your broker before the date noted on the proxy instruction card.
We are not aware of any other matters to be brought before the Annual Meeting. If matters other than those discussed above are properly brought before the Annual Meeting, the proxies may vote your shares in accordance with their best judgment. | |
|
|
|
How do I change or revoke my proxy? | You can change or revoke your proxy at any time before it is voted at the Annual Meeting in any of three ways: (1) by delivering a written notice of revocation to the Secretary of the Company; (2) by delivering another properly signed proxy card to the Secretary with a more recent date than your first proxy card or by changing your vote by telephone or the Internet; or (3) by participating in and voting at the Annual Meeting. You should deliver your written notice or superseding proxy to the Secretary at our principal executive offices listed above. See information under the heading “How do I participate at the Annual Meeting?” below for information on how to participate and vote at the Annual Meeting. | |
| 3 |
| Table of Contents |
How many votes can I cast? | You are entitled to one vote for each share held as of the Record Date on each nominee for election and each other matter presented for a vote at the Annual Meeting. You may not vote your shares cumulatively in the election of directors. | |
|
|
|
How many votes are required to approve the proposals? | If a quorum is present at the Annual Meeting, each director nominee will be elected by the affirmative vote of a majority of votes cast, with a plurality vote standard for a contested director election, that is, when the number of director nominees exceeds the number of Board seats for which elections are being held. Abstentions from voting, as well as broker non-votes, if any, are not treated as votes cast and, therefore, will have no effect on the proposal to elect directors.
The proposal to ratify the appointment of the Company’s independent registered public accounting firm for 2023 will be approved if the votes cast in favor exceed the votes cast in opposition. Abstentions will not be included in determining the number of votes cast on the proposal, and accordingly, will have no effect on such vote.
Any other matters properly coming before the Annual Meeting for a vote will require the affirmative vote of the holders of a majority of the shares represented at the Annual Meeting and entitled to vote on that matter.
In the event there are insufficient votes present at the Annual Meeting for a quorum or to approve any proposal, the Annual Meeting may be adjourned in order to permit the further solicitation of proxies. | |
|
|
|
What constitutes a “quorum” for the Annual Meeting? | A majority of the outstanding shares of our common stock entitled to vote at the Annual Meeting constitutes a quorum (a quorum is necessary to conduct business at the Annual Meeting). Your shares will be considered part of the quorum if you have voted your shares by proxy or by telephone or Internet. Abstentions, broker non-votes and votes withheld from any director nominee count as shares present at the Annual Meeting for purposes of determining a quorum. | |
|
|
|
Who pays for the solicitation of proxies? | We will pay the cost of preparing, printing and mailing materials in connection with this solicitation of proxies. In addition to solicitation by mail, our officers, directors and regular employees, as well as those of the Bank, may make solicitations personally, by telephone or otherwise without additional compensation for doing so. We reserve the right to engage a proxy solicitation firm to assist in the solicitation of proxies for the Annual Meeting. We will, upon request, reimburse brokerage firms, banks and others for their reasonable out-of-pocket expenses in forwarding proxy materials to beneficial owners of stock or otherwise in connection with this solicitation of proxies. | |
| 4 |
| Table of Contents |
How do I participate at the Annual Meeting? | The Company is holding the Annual Meeting in a “virtual-only” format, which will be conducted via live audio webcast. Shareholders will not be able to attend the Annual Meeting in person. Participating in the Annual Meeting online enables registered shareholders and duly appointed proxyholders, including beneficial shareholders who have duly appointed themselves as proxyholder, to participate at the Annual Meeting and ask questions, all in real time. Registered shareholders and duly appointed proxyholders can vote at the appropriate times during the Annual Meeting.
Shareholders desiring to participate in the Annual Meeting should email the Company’s Assistant Corporate Secretary, Krissy Price, at kprice@peoplesbanknc.com, on or before 5:30 p.m., Eastern Time, on Wednesday, May 3, 2023, stating (1) such shareholder’s name, address, phone number and the 16-digit identification code that appears on such shareholder’s proxy card, (2) the number of shares of common stock that they held of record as of March 8, 2023 and (3) that they desire to participate in the Annual Meeting. The Company will then take measures to verify such shareholder’s identity. After verifying such shareholder’s identity, those shareholders desiring to participate in the Annual Meeting will be sent a response email providing information to enable them to attend the Annual Meeting via remote participation. Rules of conduct will also be provided in the response email. Shareholders are encouraged to vote their shares prior to the Annual Meeting, as directed on the proxy cards. | |
| 5 |
| Table of Contents |
SECURITY OWNERSHIP OF CERTAIN BENEFICIAL OWNERS AND MANAGEMENT
The Securities Exchange Act of 1934, as amended (the “Exchange Act”) requires that any person who acquires the beneficial ownership of more than five percent (5%) of the Company’s common stock notify the Securities and Exchange Commission (the “SEC”) and the Company. Following is certain information, as of the Record Date, regarding those persons or groups who held of record, or who are known to the Company to own beneficially, more than five percent (5%) of the Company’s outstanding common stock.
Name and Address of Beneficial Owner |
| Amount and Nature of Beneficial Ownership1 |
|
| Percent of Class2 |
| ||
Robert C. Abernethy Post Office Box 366 Newton, NC 28658 |
|
| 381,1093 |
|
|
| 6.76 | % |
Fourthstone LLC |
|
| 419,0804 |
|
|
| 7.43 | % |
575 Maryville Centre Drive |
|
|
|
|
|
|
|
|
Suite 110 |
|
|
|
|
|
|
|
|
Saint Louis, MO 63141 |
|
|
|
|
|
|
|
|
|
|
|
|
|
|
|
|
|
Strategic Value Bank Partners LLC |
|
| 309,636 |
|
|
| 5.49 | % |
Key /Tower |
|
|
|
|
|
|
|
|
127 Public Square, Suite 1510 |
|
|
|
|
|
|
|
|
Cleveland, OH 44114 |
|
|
|
|
|
|
|
|
________________________
1 | Unless otherwise noted, all shares are owned directly of record by the named individuals, by their spouses and minor children, or by other entities controlled by the named individuals. Voting and investment power is not shared unless otherwise indicated. |
2 | Based upon a total of 5,637,021 shares of common stock outstanding as of the Record Date. |
3 | Includes 7,416 shares of common stock owned by Mr. R. Abernethy’s spouse, for which Mr. R. Abernethy disclaims beneficial ownership. Includes 47,994 shares of common stock owned by the Estate of Christine S. Abernethy for which Mr. R. Abernethy serves as a co-executor. Includes 118,363 shares owned by Carolina Glove Company, Inc. Mr. R. Abernethy is the President, Secretary and Treasurer of Carolina Glove Company, Inc. Also includes 12,351 shares of common stock held in Rabbi Trust associated with the Bank’s deferred compensation plan, under which a director may defer all or a portion of his or her fees. |
4 | Based on the schedule 13G filed by Fourthstone LLC with the SEC on February 14, 2023. |
5 | Based on the schedule 13G filed by Strategic Value Partners LLC with the SEC on January 31, 2023. |
| 6 |
| Table of Contents |
Set forth below is certain information, as of the Record Date regarding those shares of common stock owned beneficially by each of the persons who currently serves as a member of the Board of Directors, is a nominee for election to the Board at the Annual Meeting, or is or was during the fiscal year ended December 31, 2022 a named executive officer of the Company. Also shown is the number of shares of common stock owned by the directors and named executive officers of the Company as a group.
Name and Address |
| Amount and Nature of Beneficial Ownership1 |
|
| Percentage of Class2 |
| ||
James S. Abernethy3 Post Office Box 327 Newton, NC 28658 |
|
| 257,4114 |
|
|
| 4.57 | % |
Robert C. Abernethy3 Post Office Box 366 Newton, NC 28658 |
|
| 381,1095 |
|
|
| 6.76 | % |
Kimberly Boyd-Leaks Post Office Box 467 Newton, NC 28658 |
|
| 8,473 |
|
| * |
| |
William D. Cable, Sr. Post Office Box 467 Newton, NC 28658 |
|
| 21,671 |
|
| * |
| |
Jeffrey N. Hooper Post Office Box 467 Newton, NC 28658 |
|
| 0 |
|
| * |
| |
Douglas S. Howard Post Office Box 587 Denver, NC 28037 |
|
| 21,1596 |
|
| * |
| |
John W. Lineberger, Jr. Post Office Box 481 Lincolnton, NC 28092 |
|
| 5,513 |
|
| * |
| |
Gary E. Matthews 210 First Avenue South Conover, NC 28613 |
|
| 26,455 |
|
| * |
| |
Billy L. Price, Jr., M.D. 540 11th Ave. Place NW Hickory, NC 28601 |
|
| 11,693 |
|
| * |
| |
Larry E. Robinson Post Office Box 723 Newton, NC 28658 |
|
| 67,4127 |
|
|
| 1.2 | % |
Lance A. Sellers Post Office Box 467 Newton, NC 28658 |
|
| 26,600 |
|
| * |
| |
William Gregory Terry Post Office Box 610 Newton, NC 28658 |
|
| 18,533 |
|
| * |
| |
Dan Ray Timmerman, Sr. Post Office Box 1148 Conover, NC 28613 |
|
| 110,1118 |
|
|
| 1.95 | % |
Benjamin I. Zachary Post Office Box 277 Taylorsville, NC 28681 |
|
| 117,4179 |
|
|
| 2.08 | % |
All current directors and nominees and named executive officers as a group (14 people) |
|
| 955,12310 |
|
|
| 16.94 | % |
________________________
*Does not exceed one percent of the common stock outstanding.
1 | Unless otherwise noted, all shares are owned directly of record by the named individuals, by their spouses and minor children, or by other entities controlled by the named individuals. Voting and investment power is not shared unless otherwise indicated. |
2 | Based upon a total of 5,637,021 shares of common stock outstanding as of the Record Date. |
3 | Directors James S. Abernethy and Robert C. Abernethy are brothers and are sons of Christine S. Abernethy, who passed away in November 2020. Ms. Abernethy owned in excess of 10% of the common stock of the Company at the time of her death. Directors James S. Abernethy and Robert C. Abernethy are co-executors of Ms. Abernethy’s Estate. |
4 | Includes 70,441 shares of common stock owned by Alexander Railroad Company. Mr. J. Abernethy is Vice President, Secretary and Chairman of the board of directors of Alexander Railroad Company. Includes 47,994 shares of common stock owned by the Estate of Christine S. Abernethy for which Mr. J. Abernethy serves as a co-executor. Also includes 49,290 shares of common stock owned by Mr. Abernethy’s son, Adrian Abernethy. |
5 | Includes 7,416 shares of common stock owned by Mr. R. Abernethy’s spouse, for which Mr. R. Abernethy disclaims beneficial ownership. Includes 47,994 shares of common stock owned by the Estate of Christine S. Abernethy for which Mr. R. Abernethy serves as a co-executor. Includes 118,363 shares owned by Carolina Glove Company, Inc. Mr. R. Abernethy is the President, Secretary and Treasurer of Carolina Glove Company, Inc. Also includes 12,351 shares of common stock held in Rabbi Trust associated with the Bank’s deferred compensation plan, under which a director may defer all or a portion of his or her fees. |
6 | Includes 495 shares of common stock owned by Mr. Howard’s spouse, for which Mr. Howard disclaims beneficial ownership. |
7 | Includes 19,344 shares of common stock owned by Mr. Robinson’s spouse, for which Mr. Robinson disclaims beneficial ownership. |
8 | Includes 2,994 shares of common stock owned by Timmerman Manufacturing, Inc. Mr. Timmerman is a shareholder, director, Chairman of the board, and the Chief Executive Officer of Timmerman Manufacturing, Inc. |
9 | Includes 70,441 shares of common stock owned by Alexander Railroad Company. Mr. Zachary is President, Treasurer, General Manager and a Director of Alexander Railroad Company. |
10 | The 70,441 shares owned by Alexander Railroad Company and attributed to Mr. J. Abernethy and Mr. Zachary are only included once in calculating this total. Likewise, the 47,994 shares owned by the Estate of Christine S. Abernethy and attributed to Mr. J. Abernethy and Mr. R. Abernethy are included once in calculating this total. |
| 7 |
| Table of Contents |
SECTION 16(a) BENEFICIAL OWNERSHIP REPORTING COMPLIANCE
Section 16(a) of the Exchange Act requires the Company’s executive officers and directors, and persons who own more than ten percent (10%) of the common stock, to file reports of ownership and changes in ownership with the SEC. Executive officers, directors and greater than ten percent (10%) beneficial owners are required by SEC regulations to furnish the Company with copies of all Section 16(a) forms they file.
Based solely on a review of the forms furnished to the Company and written representations from the Company’s executive officers and directors, the Company believes that during the fiscal year ended December 31, 2022, its executive officers and directors and greater than ten percent (10%) beneficial owners complied with all applicable Section 16(a) filing requirements.
ELECTION OF DIRECTORS
Our Bylaws provide for a board of directors consisting of not less than five nor more than 15 directors, the exact number to be determined by resolution of a majority of the Board of Directors. Our Board has set the number of directors at 11. Our Bylaws provide that in order to be eligible for consideration at the Annual Meeting of Shareholders, all nominations of directors, other than those made by the Governance Committee or the Board, must be in writing and must be delivered to the Secretary of the Company not less than 50 days nor more than 90 days prior to the meeting at which such nominations will be made; provided, however, that if less than 60 days’ notice of the meeting is given to the shareholders, such nominations must be delivered to the Secretary of the Company not later than the close of business on the tenth day following the day on which the notice of meeting was mailed.
The Board has nominated the 11 persons named below for election as directors to serve for a one-year term until the 2024 Annual Meeting of Shareholders. All of the director nominees currently serve as directors of the Company and the Bank.
Each of the nominees brings special skills and attributes to the Board through a variety of levels of education, business experience, director experience, banking experience, philanthropic interests, and community involvement. Additional information about each nominee and his or her special skills is provided below. The age of each nominee is given as of February 1, 2023.
James S. Abernethy, age 68, is employed by Carolina Glove Company, Inc., a glove manufacturing company as its Vice President. Mr. Abernethy also serves as President and Assistant Secretary of Midstate Contractors, Inc., a paving company and Vice President, Secretary and Chairman of the board of directors of Alexander Railroad Company. He has served as a director of the Company since 1992. Mr. Abernethy has a total of 30 years of banking experience and is a graduate of the North Carolina (N.C.) Bank Directors’ College and attended the initial Advanced Directors’ Training session offered by the N.C. Bank Directors’ College in association with the College of Management at North Carolina State University. Over his 30 years of service on the Board, Mr. Abernethy has served on all the committees of the Bank Board and the Board. Mr. Abernethy earned a business administration degree from Gardner Webb University.
Robert C. Abernethy, age 72, is employed by Carolina Glove Company, Inc., a glove manufacturing company, as its President, Secretary and Treasurer. Mr. Abernethy also serves as Secretary and Assistant Treasurer of Midstate Contractors, Inc., a paving company. He has served as a director of the Company since 1976 and as Chairman since 1991. Mr. Abernethy has a total of 46 years of banking experience and is a graduate of the N.C. Bank Directors’ College and attended the initial Advanced Directors’ Training session offered by the N.C. Bank Directors’ College in association with the College of Management at North Carolina State University. He serves on the Finance Committee and Investment Committee of Grace United Church of Christ, Newton, NC. Mr. Abernethy also serves on the board of directors of Carolina Glove Company, Inc. and Midstate Contractors, Inc. both privately held companies. Mr. Abernethy earned a B.S. degree from Gardner Webb University.
| 8 |
| Table of Contents |
Kimberly Boyd-Leaks, age 63, serves as Executive Vice President and Chief Banking Support Officer of the Company and the Bank. Currently, she is responsible for the Human Resources, Marketing, Learning & Development, Call Center, Retail Sales Support and Customer Relationship Management (CRM) teams. She has been employed by the Bank since 1994, serving as Chief Banking Support Officer since 2001. She has served as a director of the Company since September 2021. She serves on the N.C. Bankers Association Community Insurance Advisory Council and the Diversity, Equity, & Inclusion Council. Ms. Boyd-Leaks has been an active member of the Minority Businesswomen of Catawba County, and Hickory Metro Higher Education Advisory Council. She has previously served as a member of the board of directors of the Catawba County YMCA, Catawba County Department of Social Services, and the Volunteer Center – Catawba County United Way. Ms. Boyd-Leaks is a frequent spokesperson at community events, speaking on topics such as Retail Banking and Women’s Leadership. She has been recognized as a community leader by Catawba Valley Community College. She earned an associate degree in business from the University of Wisconsin, where she attended Retail Banking School. She has also completed the Human Resource Management program at Purdue University and has earned various other certifications in learning and development.
Douglas S. Howard, age 64, is employed by Denver Equipment Company of Charlotte, Inc. as Vice President and Treasurer. Mr. Howard is also an owner of Howard, Helderman, Howard, LLC. He has served as a director of the Company since 2004. Mr. Howard has a total of 24 years of banking experience and is a graduate of the N.C. Bank Directors’ College and attended the initial Advanced Directors’ Training session offered by the N.C. Bank Directors’ College in association with the College of Management at North Carolina State University. Mr. Howard formerly served as the Chairman of the Board of Trustees of Catawba Valley Medical Center and as the Chairman of the board of directors of Catawba Valley Medical Group. Mr. Howard also serves as a director of Catawba Valley Medical Center.
John W. Lineberger, Jr., age 72, is Vice President of Lineberger Brothers, Inc., a real estate development company. He has served as a director of the Company since 2004. Mr. Lineberger has a total of 18 years of banking experience and is a graduate of the N.C. Bank Directors’ College and attended the initial Advanced Directors’ Training session offered by the N.C. Bank Directors’ College in association with the College of Management at North Carolina State University. Mr. Lineberger earned a B.S. degree in business administration from Western Carolina University.
Gary E. Matthews, age 67, is employed by Matthews Construction Company, Inc. as its President and a Director. He has served as a director of the Company since 2001. Mr. Matthews has over 20 years of banking experience, is a graduate of the N.C. Bank Directors’ College, and attended the initial Advanced Directors’ Training session offered by the N.C. Bank Directors’ College in association with the College of Management at North Carolina State University. Mr. Matthews is also a director of Conover Metal Products, a privately held company. Mr. Matthews earned a B.S. degree in civil engineering/construction from North Carolina State University.
Billy L. Price, Jr., M.D., age 66, is a Practitioner of Internal Medicine at BL Price Jr Medical Consultants, PLLC. Dr. Price served on the Board of Trustees of Catawba Valley Medical Center through 2018. He has served as a director of the Company since 2004. Dr. Price has a total of 18 years of banking experience and is a graduate of the N.C. Bank Directors’ College and attended the initial Advanced Directors’ Training session offered by the N.C. Bank Directors’ College in association with the College of Management at North Carolina State University. Dr. Price was previously the owner/pharmacist of Conover Drug Company. He is also a Medical Director of Healthgram Medical, a private company. He serves as Medical Director and Assistant Professor to Lenoir Rhyne University Physician Assistants Master of Science Program. Dr. Price earned a B.S. degree in pharmacy from the University of North Carolina at Chapel Hill and his MD from East Carolina University School of Medicine.
Larry E. Robinson, age 77, is a shareholder, director and Chief Executive Officer of The Blue Ridge Distributing Company, Inc., a beer and wine distributor. He is also a director and member of the board of directors of United Beverages of North Carolina, LLC, a malt beverage beer distributor. He has served as a director of the Company since 1993. Mr. Robinson has a total of 29 years of banking experience and is a graduate of the N.C. Bank Directors’ College. Mr. Robinson attended Western Carolina University and earned an Associate Degree in business and accounting from Catawba Valley Community College.
| 9 |
| Table of Contents |
William Gregory Terry, age 55, is President of Clemson Legacy Designs and a consultant/director of Drum & Willis-Reynolds Funeral Homes and Crematory. Mr. Terry also served as President of DFH Holdings from 2007 through 2019. He has served as a director of the Company since 2004. Mr. Terry has a total of 18 years of banking experience and is a graduate of the N.C. Bank Directors’ College and attended the initial Advanced Directors’ Training session offered by the N.C. Bank Directors’ College in association with the College of Management at North Carolina State University. Mr. Terry serves on numerous civic and community boards. Mr. Terry graduated with a B.S. degree in business management from Clemson University.
Dan Ray Timmerman, Sr., age 75, is a shareholder, director, Chairman of the board of directors and the Chief Executive Officer of Timmerman Manufacturing, Inc., a wrought iron furniture, railings and gates manufacturer. He has served as a director of the Company since 1995. Mr. Timmerman has a total of 27 years of banking experience and is a graduate of the N.C. Bank Directors’ College and attended the initial Advanced Directors’ Training session offered by the N.C. Bank Directors’ College in association with the College of Management at North Carolina State University. Mr. Timmerman earned a B.S. degree in business administration with a concentration in accounting from Lenoir-Rhyne University.
Benjamin I. Zachary, age 66, is employed by Alexander Railroad Company as its President, Treasurer and General Manager. He has served as a director of the Company since 1995. Mr. Zachary has a total of 27 years of banking experience and is a graduate of the N.C. Bank Directors’ College. As a qualified Certified Public Accountant, he worked for a national accounting firm for eight years following graduation where his assignments included financial statement audits of several banks. Mr. Zachary is a member of the Taylorsville Rotary Club and serves as Treasurer for the Taylorsville Rotary Club and its Foundation. He also serves as a director of Alexander Railroad Company. Mr. Zachary earned a B.S. degree in business administration with a concentration in accounting from the University of North Carolina at Chapel Hill.
We have no reason to believe that any of the nominees for election will be unable or will decline to serve if elected. In the event of the death or disqualification of any nominee or the refusal or inability of any nominee to serve as a director, the proxies may vote for the election of such other person as they may determine in their discretion or may allow a vacancy to remain open until filled by the Board of Directors. Properly executed and returned proxies, unless revoked, will be voted as directed by you or, in the absence of direction, will be voted in favor of the election of the above nominees. Each nominee will be elected by the affirmative vote of a majority of votes cast at the Annual Meeting, with a plurality vote standard for a contested director election, that is, when the number of director nominees exceeds the number of Board seats for which elections are being held.
Except for Ms. Boyd-Leaks and Mr. Matthews, all members of the Board are “independent” as defined by the rules and listing standards of The NASDAQ Global Select Market.
THE BOARD OF DIRECTORS RECOMMENDS YOU VOTE “FOR” ALL OF THE NOMINEES NAMED ABOVE AS DIRECTORS
Executive Officers of the Company
During 2022, our executive officers were (ages as of February 1, 2023):
Lance A. Sellers, age 60, serves as the President and Chief Executive Officer of the Company and the Bank. Previously, Mr. Sellers served as Executive Vice President and Assistant Corporate Secretary of the Company and Executive Vice President and Chief Credit Officer of the Bank. He has been employed by the Company and the Bank since 1998. Mr. Sellers has a total of 38 years of banking experience. He is a graduate of the University of North Carolina at Chapel Hill and served as a senior credit officer at a regional bank headquartered in North Carolina.
| 10 |
| Table of Contents |
William D. Cable, Sr., age 54, serves as Executive Vice President, Assistant Corporate Treasurer and Corporate Secretary of the Company and Executive Vice President and Chief Operating Officer of the Bank. He has been employed by the Company and the Bank since 1995, previously serving as Senior Vice President-Information Services. Mr. Cable has a total of 31 years of banking experience. Prior to joining the Company, Mr. Cable was a regulatory examiner with the Federal Deposit Insurance Corporation. He is a graduate of Western Carolina University and the School of Banking of the South at Louisiana State University.
Jeffrey Hooper, age 53, serves as an Executive Vice President, Chief Financial Officer, Corporate Treasurer and Assistant Corporate Secretary of the Company and Executive Vice President and Chief Financial Officer of the Bank. Mr. Hooper joined the Company and the Bank in 2020. Previously, Mr. Hooper was an Executive Vice President and Chief Financial Officer of First South Bancorp, Inc. and First South Bank. He is a Certified Public Accountant and a graduate of the University of Alaska. Mr. Hooper has a total of 17 years of banking experience.
Kimberly Boyd-Leaks, age 63, serves as Executive Vice President and Chief Banking Support Officer of the Company and the Bank. Currently, she is responsible for the Human Resources, Marketing, Learning & Development, Call Center, Retail Sales Support and Customer Relationship Management (CRM) teams. Ms. Boyd-Leaks has been employed by the Bank since 1994, serving as Chief Banking Support Officer since 2001. She is a graduate of the University of Wisconsin, where she attended Retail Banking School. She has also completed the Human Resource Management program at Purdue University and has earned various other certifications in learning and development.
Timothy P. Turner, age 60, serves as Executive Vice President and Chief Credit Officer of the Bank. He is responsible for the Bank’s Commercial Credit and Credit Administration function. He has been employed by the Bank since 2010, previously serving as First Vice President-Commercial Credit Officer and Senior Vice President-Senior Credit Officer. Mr. Turner earned a Bachelor of Business Administration and a Master of Business Administration at Campbell University. He has spent 19 years in commercial lending, and three years in credit administration. Mr. Turner has a total of 35 years of banking experience.
James O. Perry, age 52, serves as Executive Vice President and Chief Retail Officer of the Bank. He is responsible for the Bank’s Mortgage Sales and Retail Banking functions. He has been employed by the Bank since 1999, previously serving as Vice President-Commercial Loan Officer, First Vice President-Commercial Area Executive and Senior Vice President-Retail Banking Manager. Mr. Perry earned a BA in Economics at the University of Illinois Urbana, and also graduate from the Graduate School of Banking at Louisiana State University. He previously spent two years as a small business banker with a national bank, two years in credit administration and as a commercial loan officer, and four years with the Office of the Comptroller of the Currency. Mr. Perry has a total of 31 years of banking experience.
How often did our Board of Directors meet during 2022?
Our Board held 13 meetings during 2022. All incumbent directors attended more than 75% of the total number of meetings of the Board and its committees on which they served during the year.
What is our policy for director attendance at Annual Meetings?
Although it is customary for all of our directors to attend Annual Meetings of Shareholders, we have no formal policy in place requiring attendance. All members of the Board attended our 2022 Annual Meeting of Shareholders held on May 5, 2022.
How can you communicate with the Board or its members?
We do not have formal procedures for shareholder communication with our Board. In general, our directors and officers are easily accessible by telephone, postal mail or e-mail. Any matter intended for your Board, or any individual director, can be directed to Lance Sellers, our President and Chief Executive Officer, or Jeffrey Hooper, our Chief Financial Officer, at our principal executive offices at 518 West C Street, Newton, North Carolina 28658. You also may direct correspondence to our Board, or any of its members, in care of the Company at the foregoing address. Your communication will be forwarded to the intended recipient unopened.
| 11 |
| Table of Contents |
Board Leadership Structure and Risk Oversight
The ultimate authority to oversee the business of the Company rests with the Board. The Board is led by our Chairman, and in his absence, our Vice Chairman. Robert Abernethy currently serves as Chairman of the Board of Directors, and James Abernethy serves as the Vice Chairman of the Board. The role of the Board is to effectively govern the affairs of the Company for the benefit of its shareholders and, to the extent appropriate under North Carolina corporate law, other constituencies including employees, customers, suppliers and the communities in which it does business. The officers of the Company are elected from time to time by the Board or appointed from time to time by the President and Chief Executive Officer (to the extent that the President and Chief Executive Officer is authorized by the Board to appoint officers). Our President and Chief Executive Officer is responsible for leading our management team and employees, and operating the Company. Neither our Chairman nor our Vice Chairman are employed by the Company or the Bank. We believe that having a non-employee Chairman and separating the role of Chairman from that of President/Chief Executive Officer is one more method to create appropriate “checks and balances” in corporate governance as we seek to operate the Company in an effective and efficient manner for the benefit of our shareholders and other constituencies.
The Governance Committee, as part of its annual review, evaluates our leadership structure and performance and reports its findings to the whole Board. We believe our current structure results in strong, independent leadership of our Board.
Risk management is the responsibility of management and risk oversight is the responsibility of the Board. The Board administers its risk oversight function and also utilizes its committee structure, with each board committee being responsible for overseeing risk within its area of responsibility. Significant risk oversight matters considered by the committees are reported to and considered by the Board. Some significant risk oversight matters are reported directly to the Board, including matters not falling within the area of responsibility of any committee. Types of risk with the potential to adversely affect us include credit, interest rate, liquidity and compliance risks, as well as risks relating to our operations and reputation.
Directors keep themselves informed of the activities and condition of the Company and of the risk environment in which it operates by regularly attending Board and assigned board committee meetings, and by review of meeting materials, auditors’ findings and recommendations, and supervisory communications. Directors stay current on general industry trends and any statutory and regulatory developments pertinent to us by periodic briefings by executive management, counsel, auditors or other consultants, and by more formal director education, including attendance at regulator sponsored “Director’s Colleges,” banking industry conventions, and other similar programs. Directors are provided access to all training and given specific in-person training on items such as Regulation O, Bank Secrecy Act, and other banking guidance and regulations.
The Board oversees the conduct of our business and administers the risk management function by:
| · | selecting, evaluating, and retaining competent executive management; |
| · | establishing, with executive management, our long- and short-term business objectives, and adopting operating policies to achieve these objectives in a legal and sound manner; |
| · | monitoring operations to ensure that they are controlled adequately and are in compliance with laws and policies; |
| · | overseeing our business performance; and |
| · | ensuring that we help to meet our communities’ credit needs. |
These responsibilities are governed by a complex framework of federal and state law and regulation as well as regulatory guidelines applicable to our operations.
The Board has established committees in order to effectively divide risk monitoring responsibilities and capabilities. The Company has four standing committees: the Executive Committee, Governance Committee, Audit and Enterprise Risk Committee, and Compensation Committee. The Chief Executive Officer also serves on the Executive Committee.
| 12 |
| Table of Contents |
The Audit and Enterprise Risk Committee, charged by the Board with the primary oversight responsibility for risk management, also oversees the integrity of financial reporting, compliance with laws and regulations, and the structure of internal control. The Compensation Committee provides oversight of executive compensation as well as other compensation programs for associates and bank officers. The Governance Committee assists in the establishment of principles for the Company and provides leadership on corporate governance matters. The Executive Committee studies and makes recommendations to the Board on matters related to setting the overall strategic direction for the preparation by the Company’s management of formal multi-year business plans. The Executive Committee may exercise, during intervals between meetings of the Board, all the powers and authority of the Board in directing the management of the business and affairs of the Company, except as otherwise provided in the Bylaws of the Company or by North Carolina law. In addition, the full Bank Board serves as the Bank’s loan committee, and the Bank Board has established a loan sub-committee which monitors credit risk.
In the day-to-day management of risk, management has established and implemented appropriate policies, procedures and risk assessment tools, and a defined organization and reporting structure. With respect to the organization and reporting structure, a hierarchy has been created which divides responsibility along functional lines of authority and further divides responsibilities efficiently and effectively into specific processes. The structure is further enhanced by providing the internal audit and loan review functions independent functional reporting responsibilities to the Audit and Enterprise Risk Committee. Risk assessments have been created to properly identify and monitor risk for the Company either at an entity level or within specific types of business as appropriate.
Code of Business Conduct and Ethics
The Company and the Bank have a Code of Business Conduct and Ethics for its directors, officers and employees. The Code of Business Conduct and Ethics requires that individuals avoid conflicts of interest, comply with all laws and other legal requirements, conduct business in an honest and ethical manner and otherwise act with integrity and in the best interests of the Company and the Bank. The Code is a guide to help ensure that all employees maintain the highest ethical standards of behavior.
A copy of the Code is available on the Bank’s website (www.peoplesbanknc.com) under the “Investor Relations” tab.
As is permitted by SEC rules, the Company intends to post on its website any amendment to or waiver from any provision in the Code that applies to the Chief Executive Officer, the Chief Financial Officer, the Controller, or persons performing similar functions, and that relates to any element of the standards enumerated in the rules of the SEC.
Diversity of the Board of Directors
The Bank Board has adopted a written diversity policy as an integral part of its employee handbook. The Company and the Bank value diversity in society, and believe that the virtues and pursuit of diversity are just as important within the Company and the Bank. The Company and the Bank adhere to a policy prohibiting discrimination and harassment on the basis of legally protected characteristics, including sex, pregnancy, race, color, religion, national origin, veteran status, age, and disability.
How can a shareholder nominate someone for election to the Board of Directors?
Our Bylaws provide that in order to be eligible for consideration at the Annual Meeting of Shareholders, all nominations of directors, other than those made by the Governance Committee or the Board, must be in writing and must be delivered to the Secretary of the Company not less than 50 days nor more than 90 days prior to the meeting at which such nominations will be made. However, if less than 60 days’ notice of the meeting is given to the shareholders, such nominations must be delivered to the Secretary of the Company not later than the close of business on the tenth day following the day on which the notice of meeting was mailed.
| 13 |
| Table of Contents |
The Board may disregard any nominations that do not comply with these requirements. Upon the instruction of the Board, the inspector of voting for the Annual Meeting may disregard all votes cast for a nominee if the nomination does not comply with these requirements. Written notice of nominations should be directed to the Secretary of the Company.
The Bank currently has an 11 member board of directors which is comprised of the same persons who are currently directors of the Company. Those persons elected to the Board at the Annual Meeting will also be elected by the Company as directors of the Bank.
During 2022, our Board had four standing committees, the Audit and Enterprise Risk Committee, the Governance Committee, the Compensation Committee, and the Executive Committee. The voting members of these Committees are appointed by the Board annually from among its members. Certain of our executive officers also serve as non-voting, advisory members of these committees.
Executive Committee. The Executive Committee performs duties as assigned by the full Board. The following persons currently serve on the Executive Committee: Directors R. Abernethy, J. Abernethy, Lineberger, Robinson and Terry, as well as the President and Chief Executive Officer of the Company, who serves in a non-voting capacity. It meets on an “as needed” basis and did not meet during 2022.
Governance Committee. The Governance Committee is responsible for developing and maintaining the Company’s corporate governance policy, as well as acting as the nominating committee for the Board. The following persons currently serve on the Governance Committee: Directors R. Abernethy, J. Abernethy, Howard, Terry, and Timmerman. The Board has determined that all of the members of the Governance Committee are independent as defined by the rules and listing standards of The NASDAQ Global Select Market.
The Governance Committee, serving as the nominating committee of the Board, interviews candidates for nomination and election to the Board. The Governance Committee’s identification of candidates for director typically results from the business interactions of the members of the Governance Committee or from recommendations received from other directors or from the Company’s management.
If a shareholder recommends a director candidate to the Governance Committee in accordance with the Company’s Bylaws, the Governance Committee will consider the candidate and apply the same considerations that it would to its own candidates. The recommendation of a candidate by a shareholder should be made in writing, addressed to the attention of the Governance Committee at the Company’s corporate headquarters. The recommendation should include a description of the candidate’s background, his or her contact information, and any other information the shareholder considers useful and appropriate for the Governance Committee’s consideration of the candidate. The criteria which have been established by the Governance Committee as bearing on the consideration of a candidate’s qualification to serve as a director include the following: the candidate’s ethics, integrity, involvement in the community, success in business, relationship with the Bank, investment in the Company, place of residence (i.e., proximity to the Bank’s market area), and financial expertise.
The Governance Committee met two times during the year ended December 31, 2022.
The Governance Committee has a written charter which is reviewed annually, and amended as needed, by the Governance Committee. A copy of the charter is available on the Bank’s website (www.peoplesbanknc.com) under the “Investor Relations” tab.
Audit and Enterprise Risk Committee. The Company has a separately designated standing Audit and Risk Enterprise Committee (the “Audit Committee”) which was established in accordance with Section 3(a)(58)(A) of the Exchange Act. The Audit Committee’s responsibilities include oversight of enterprise risk. The Audit Committee has a written charter which is reviewed annually, and amended as needed, by the Audit Committee. A copy of the charter is available on the Bank’s website (www.peoplesbanknc.com) under the “Investor Relations” tab. The following persons currently serve on the Audit Committee: Directors R. Abernethy, J. Abernethy, Howard, Price, Timmerman and Zachary.
| 14 |
| Table of Contents |
The Board has determined that each member of the Audit Committee is independent as that term is defined by the rules and listing standards of The NASDAQ Global Select Market and the SEC’s regulations. In addition, the Board has determined that each member of the Audit Committee qualifies as an “audit committee financial expert” based on each of the member’s educational background and business experience.
The Audit Committee meets at least quarterly and, among other responsibilities, oversees (i) the independent auditing of the Company, (ii) the system of internal controls that management has established, and (iii) the quarterly and annual financial information to be provided to shareholders and the SEC. The Audit Committee met eight times during the year ended December 31, 2022.
Audit Committee Report. The Audit Committee has reviewed and discussed the audited financial statements with management of the Company and has discussed with the independent auditors the matters required to be discussed by Auditing Standards No. 16 as amended (AICPA, Professional Standards, Vol. 1 AU section 380) as adopted by the Public Company Accounting Oversight Board in Rule 3200T. In addition, the Audit Committee has received the written disclosures and the letter from the independent accountants required by the applicable requirements of the Public Company Accounting Oversight Board regarding the independent accountant’s communications with the Audit Committee concerning independence, and has discussed with the independent accountant the independent accountant’s independence. Based upon these reviews and discussions, the Audit Committee recommended to the Board of Directors that the audited financial statements be included in the Company’s Annual Report on Form 10-K for the fiscal year ended December 31, 2022 for filing with the SEC.
| Robert C. Abernethy | Dan R. Timmerman, Sr. |
|
| Benjamin I. Zachary Douglas S. Howard | James S. Abernethy Billy L Price, Jr. MD, Committee Chair |
|
Compensation Committee. The Company’s Compensation Committee is responsible for developing, reviewing, implementing and maintaining the Bank’s salary, bonus, and incentive compensation programs and for making recommendations to the Board of Directors and the Bank Board regarding compensation of the executive officers. Upon recommendation from the Compensation Committee, the Board ultimately determines such compensation.
The Board of Directors has determined that all of the members of the Compensation Committee are independent as defined by the rules and listing standards of The NASDAQ Global Select Market. The following persons currently serve on the Compensation Committee: Directors R. Abernethy, J. Abernethy, Howard, Terry and Timmerman. The Compensation Committee met three times during the year ended December 31, 2022.
The Compensation Committee has a written charter which is reviewed annually, and amended as needed, by the Compensation Committee. A copy of the charter is available on the Bank’s website (www.peoplesbanknc.com) under the “Investor Relations” tab.
Compensation Committee Interlocks and Insider Participation. No member of the Compensation Committee is now, or formerly was, an officer or employee of the Company or the Bank. None of the named executive officers serve as a member of the board of directors of another entity whose executive officers or directors serve on the Board of Directors. See Indebtedness of and Transactions with Management and Directors starting on page 30 of this Proxy Statement.
| 15 |
| Table of Contents |
Compensation Committee Report. The Compensation Committee has reviewed and discussed the Compensation Discussion and Analysis in this Proxy Statement with management and has recommended that it be included in this Proxy Statement and our Annual Report on Form 10-K filed with the SEC for the year ended December 31, 2022.
Compensation Committee
Robert C. Abernethy
James S. Abernethy
Douglas S. Howard
William Gregory Terry
Dan R. Timmerman, Sr., Committee Chair
COMPENSATION DISCUSSION AND ANALYSIS
In this section, we will give an overview of our compensation program, the material compensation decisions we have made under the program and the material factors that we considered in making those decisions. Following this discussion, in the section entitled “– Summary Compensation Table,” we provide a table containing specific information about the compensation earned for the fiscal years indicated, by the following officers, whom we refer to as our “named executive officers:”
| · | Lance A. Sellers, President and Chief Executive Officer; |
| · | Jeffrey N. Hooper, Executive Vice President and Chief Financial Officer; and |
| · | William D. Cable, Sr., Executive Vice President and Chief Operating Officer. |
Compensation Committee Processes and Procedures
The Compensation Committee assists the Board in determining appropriate compensation levels for the members of the Board and our named executive officers. It also has strategic and administrative responsibility for a broad range of compensation issues. It seeks to ensure that we compensate key management employees effectively and in a manner consistent with the Compensation Committee’s stated compensation strategy and relevant requirements of various regulatory entities. A part of these responsibilities is overseeing the administration of executive compensation and employee benefit plans, including the design, selection of participants, establishment of performance measures, and evaluation of awards pursuant to our annual and long-term incentive programs.
The overall objective of our executive compensation program is to promote the interests of the Company by compensating our executives in a manner that closely aligns their interests with those of the Company’s shareholders. In order to accomplish this overall objective, our executive compensation program is designed to (i) attract qualified executives necessary to meet those needs identified in the Company’s strategic plans, and (ii) retain and motivate executives whose performance supports the achievement of our long-term plans and short-term goals. Our executive compensation program is founded upon the guiding principle that a strong, performance-oriented compensation program, generally consistent with that of our peers, is critical to our ability to succeed in becoming a leading performer among financial institutions of similar size, and thereby reward our shareholders for their investment in the Company.
The Compensation Committee considers a number of factors specific to each executive’s role when determining the amount and mix of compensation to be paid. These factors are:
| · | compensation of comparable executives at peer financial institutions; |
| · | financial performance of the Company (especially on a “net operating” basis, which excludes the effect of one-time gains and expenses) over the most recent fiscal year and the prior three years; |
| · | composition of earnings; |
| · | asset quality relative to the banking industry; |
| · | responsiveness to the economic environment; |
| · | the Company’s achievements compared to its corporate, financial, strategic and operational objectives and business plans; and |
| · | cumulative shareholder return. |
| 16 |
| Table of Contents |
Elements of the Executive Compensation Program
The Company’s compensation program consists of the following elements:
Base Salary. The salaries of our named executive officers are designed to provide a reasonable level of compensation that is affordable to the Company and fair to the executive. Salaries are reviewed annually, and adjustments, if any, are made based on the review of competitive salaries in our peer group, as well as an evaluation of the individual officer’s responsibilities, job scope, and performance. For example, we assess each officer’s success in achieving budgeted earnings and return ratios, business conduct and integrity, and leadership and team building skills.
Annual Cash Incentive Awards. We believe that annual cash incentive awards encourage our named executive officers to achieve short-term targets that are critical to achievement of our long-term strategic plan. The Bank has a Management Incentive Plan for officers of the Bank. Participants in the Management Incentive Plan are recommended annually by the President and Chief Executive Officer to the Bank Board. Each individual’s incentive pool is determined by a formula that links attainment of corporate budget with attainment of individual goals and objectives. Incentives under the Management Incentive Plan are paid annually. No named executive officer earned or was paid a cash incentive under the Management Incentive Plan during the fiscal year ended December 31, 2022.
Discretionary Bonus and Service Awards. From time to time the Compensation Committee may recommend to the Board that additional bonuses be paid based on accomplishments that significantly exceed expectations during the fiscal year. These bonuses are totally discretionary as to who will receive a bonus and the amount of any such bonus. In 2022, the Compensation Committee recommended, and the Board approved, discretionary bonuses as follows: $150,000 for Mr. Sellers; $70,000 for Mr. Hooper; and $70,000 for Mr. Cable. These discretionary bonuses were paid in January 2023. Under the Service Recognition Program, the Bank gives service awards to each employee and director for every five years of service with the Bank to promote and reward longevity of service for both directors and employees. Service awards are made in the form of shares of the Company’s common stock plus cash in the amount necessary to pay taxes on the award. The number of shares awarded increases with the number of years of service to the Bank. Common stock awarded under the Service Recognition Program is purchased by the Bank on the open market, and no new shares are issued by the Company under the Service Recognition Program.
Long-Term Equity Incentive Awards. Pursuant to the 2020 Omnibus Stock Ownership and Long Term Incentive Plan (“2020 Omnibus Plan”), the Company may grant incentive stock options, restricted stock, restricted stock units, stock appreciation rights, book value shares, and performance units to qualifying directors and employees. The purpose of the 2020 Omnibus Plan is to promote the interests of the Company by attracting and retaining directors and employees of outstanding ability and to provide executives of the Company greater incentive to make material contributions to the success of the Company by providing them with stock-based compensation which would increase in value based upon the market performance of our common stock. The 2020 Omnibus Plan was approved by our shareholders on May 7, 2020 and expires on May 7, 2030.
See “Grants of Plan-Based Awards Table” on page 20 of this Proxy Statement, “Outstanding Equity Awards at Fiscal Year-End Table” on page 20 of this Proxy Statement and “Option Exercises and Stock Vested” on page 21 of this Proxy Statement for information on equity incentive awards made to the named executed officers under the 2020 Omnibus Plan and the Company’s 2009 Omnibus Stock Ownership and Long Term Incentive Plan (“2009 Omnibus Plan” and together with the 2020 Omnibus Plan, the “Omnibus Plans”) which expired on May 7, 2019. See “Omnibus Plans” starting on page 23 of this Proxy Statement for additional information on the Omnibus Plans.
Supplemental Executive Retirement Agreements. The Bank has entered into Amended and Restated Executive Salary Continuation Agreements with Messrs. Sellers and Cable, and an Executive Salary Continuation Agreement with Mr. Hooper, which provide each executive a non-qualified supplemental executive retirement benefit. The Committee’s goal is to provide competitive retirement benefits given the restrictions on executives within tax-qualified plans. In prior years, the Committee worked with a compensation consultant to analyze and consider the possible benefits of providing supplemental retirement benefits and to consider what is provided to executives in our peer group. In connection with the non-qualified supplemental executive retirement benefits, the Company and/or the Bank purchased life insurance policies on the lives of the named executive officers. The increase in cash surrender value of a life insurance policy constitutes the Bank’s contribution to the plan each year. Under the terms of the agreements, the Bank will pay benefits to participating executives for a period between 13 years and the life of the executive.
| 17 |
| Table of Contents |
401(k) Plan. The Bank has established a 401(k) Plan for eligible employees. Under the Bank’s 401(k) Plan, the Bank matches employee contributions up to a maximum of 4.00% of annual compensation. The Bank’s 2022 contribution to the 401(k) Plan was approximately $728,000. All contributions to the 401(k) Plan are tax deferred. The 401(k) Plan permits participants to choose from investment funds selected by a committee comprised of senior management. Employees are eligible to participate in the 401(k) Plan beginning in the second month of employment. All participants are immediately 100% vested in employer contributions made under the plan.
Deferred Compensation Plan. The Bank maintains a non-qualified deferred compensation plan for directors and certain officers. Eligible officers selected by the Bank Board may elect to contribute a percentage of their compensation to the plan. Participating officers may elect to invest their deferred compensation in a restricted list of investment funds. The Bank may make matching or other contributions to the plan as well, in amounts determined at the discretion of the Bank. Participants are fully vested in all amounts contributed to the plan by them or on their behalf. The Bank has established a Rabbi Trust to hold the accrued benefits of the participants under the plan. There are no “above-market” returns provided for in this plan. The Bank made no contributions to the plan in 2022. Benefits under the plan are payable in the event of the participant’s retirement, death, termination, or as a result of hardship. Benefit payments may be made in a lump sum or in installments, as selected by the participant.
Employment Agreements. The Company has entered into an employment agreement with each named executive officer. The employment agreements serve a number of functions, including: (i) retention of the executive team; (ii) mitigation of any uncertainty about future employment and continuity of management in the event of a change in control; and (iii) protection of the Bank and its customers through non-compete and non-solicitation covenants. Additional information regarding the employment agreements, including a description of key terms may be found under the heading “Employment Agreements” starting on page 22 of this Proxy Statement.
Other Benefits. Executive officers are entitled to participate in fringe benefit plans offered to employees including health and dental insurance plans and life, accidental death and dismemberment and long-term disability plans. In addition, the Bank has paid country club dues for each named executive officer and provides a car allowance to Mr. Sellers.
The above elements of each named executive officer’s compensation are not inter-related. For example, if vesting standards on restricted stock awards are not achieved, the executive’s base salary is not increased to make up the difference. Similarly, the value of previously granted options is not considered by the Compensation Committee in recommending the other elements of the compensation package.
The Compensation Committee did not engage a compensation consultant during the year ended December 31, 2022. The President and Chief Executive Officer of the Company and the Bank makes recommendations to the Committee regarding the compensation of the other executive officers. The President and Chief Executive Officer participates in the deliberations, but not in the decisions, of the Committee. However, he does not participate in the Committee’s deliberations or decisions regarding his own compensation. The Committee reports its actions to the Board of Directors and keeps written minutes of its meetings, which minutes are maintained with the books and records of the Company.
The Compensation Committee also considers the results of the shareholders’ non-binding vote on executive compensation. At the 2019 Annual Meeting of Shareholders, a plurality of our shareholders voted to approve the compensation of our named executive officers (“Say-on-Pay”) once every three years. Accordingly, shareholders were, most recently, invited to vote on the “Say-on-Pay” proposal at the 2022 Annual Meeting. At the 2022 Annual Meeting, 89% of the shareholders who voted approved the executive compensation of our named executive officers.
| 18 |
| Table of Contents |
We believe our executive compensation program must be consistent and internally equitable to motivate our employees to perform in ways that enhance shareholder value. We are committed to internal pay equity, and the Compensation Committee monitors the relationship between the pay of our executive officers and the pay of our non-executive employees. The Compensation Committee reviewed a comparison of our Chief Executive Officer’s annual total compensation in fiscal year 2022 to that of all other Company employees (including all employees of the Bank) for the same period. The calculation of annual total compensation of all employees was determined in the same manner as the “Total Compensation” shown for our Chief Executive Officer in the “Summary Compensation Table” on page 19 of this Proxy Statement.
The calculation below includes all employees as of October 31, 2022.
The 2022 compensation disclosure ratio of the median annual total compensation of all Company employees to the annual total compensation of our Chief Executive Officer is as follows:
Median Annual Total Compensation of All Employees (excluding Lance A. Sellers, Chief Executive Officer) |
| $ | 48,345 |
|
|
|
|
|
|
Annual Total Compensation of Lance A. Sellers, Chief Executive Officer |
| $ | 635,630 |
|
|
|
|
|
|
Ratio of the Median Annual Total Compensation of All Employees to the Annual Total Compensation of Lance A. Sellers, Chief Executive Officer |
| 1:13.15 |
| |
| 19 |
| Table of Contents |
The named executive officers of the Company are not paid any cash compensation by the Company. However, they are also executive officers of the Bank and receive compensation from the Bank. The below tables show, for the fiscal years indicated, the cash compensation received by, as well as certain other compensation paid or accrued to, each named executive officer.
Name and Principal Position |
| Year |
| Salary($) |
|
| Bonus($) |
|
| Stock Awards($)1 |
|
| Change in Pension Value and Nonqualified Deferred Compensation Earnings($) |
|
| All Other Compensation($)2 |
|
| Total($) |
| ||||||
|
|
|
|
|
|
|
|
|
|
|
|
|
|
|
|
|
|
|
|
| ||||||
Lance A. Sellers |
| 2022 |
|
| 357,397 |
|
|
| 150,000 |
|
|
| -- |
|
|
| 94,892 |
|
|
| 33,341 |
|
|
| 635,630 |
|
President and Chief Executive |
| 2021 |
|
| 346,988 |
|
|
| 120,000 |
|
|
| -- |
|
|
| 87,439 |
|
|
| 26,097 |
|
|
| 580,525 |
|
|
|
|
|
|
|
|
|
|
|
|
|
|
|
|
|
|
|
|
|
|
|
|
|
|
|
|
Jeffrey Hooper |
| 2022 |
|
| 195,314 |
|
|
| 70,000 |
|
|
| 40,000 |
|
|
| 17,855 |
|
|
| 15,832 |
|
|
| 339,000 |
|
Executive Vice President and |
| 2021 |
|
| 189,625 |
|
|
| 60,000 |
|
|
| -- |
|
|
| 16,105 |
|
|
| 14,335 |
|
|
| 280,065 |
|
|
|
|
|
|
|
|
|
|
|
|
|
|
|
|
|
|
|
|
|
|
|
|
|
|
|
|
William D. Cable, Sr. |
| 2022 |
|
| 240,895 |
|
|
| 70,000 |
|
|
| -- |
|
|
| 37,587 |
|
|
| 32,978 |
|
|
| 381,460 |
|
Executive Vice President, |
| 2021 |
|
| 233,879 |
|
|
| 60,000 |
|
|
| 40,000 |
|
|
| 34,599 |
|
|
| 30,517 |
|
|
| 398,634 |
|
________________________
1 | Amount represents the aggregate grant date fair value computed in accordance with FASB ASC Topic 718. See Note 1 in the Notes to the Company’s Consolidated Financial Statements included in the Company’s Annual Report, which Annual Report is attached hereto as Appendix A. |
2 | All other compensation is comprised of the following: |
Name and Principal Position |
|
Year |
| Employer Match – 401(k) ($) |
|
Car Allowance($) |
| Country Club Dues($) |
| Split Dollar Death Benefit($) |
| Group Term Life($)(a) |
|
Disability and LTC Premiums($)(b) |
| Dividends Accrued on Restricted Stock Units($) |
|
Other($) |
|
Lance A. Sellers President and Chief Executive Officer |
|
2022 2021
|
|
12,200 11,600
|
|
6,461 1,435
|
|
4,320 3,960
|
|
647 631
|
|
3,564 2,322
|
|
6,150 6,150
|
|
0 0
|
|
0 0
|
|
Jeffrey Hooper Executive Vice President, Chief Financial Officer |
|
2022 2021
|
|
7,658 6,889
|
|
0 0
|
|
3,988 4,764
|
|
474 611
|
|
936 910
|
|
0 0
|
|
2,775 1,162
|
|
0 0
|
|
William D. Cable, Sr. Executive Vice President, Chief Operating Officer |
|
2022 2021
|
|
12,034 10,955
|
|
0 0
|
|
4,320 3,960
|
|
601 567
|
|
1,186 1,152
|
|
12,027 11,390
|
|
2,810 2,132
|
|
0 0
|
|
________________________
| (a) | Represents amounts paid by the Bank for premiums on group term life insurance in excess of $50,000 for each named executive officer. |
| (b) | Represents amounts paid by the Bank for premiums on disability and long-term care insurance for each named executive officer. |
| 20 |
| Table of Contents |
The following table shows certain information for those grants of plan-based awards that we made to the named executive officers during the fiscal year ended December 31, 2022.
Grants of Plan-Based Awards Table
Name |
| Grant Date |
|
| Threshold (#) |
|
| Target (#) |
|
| Maximum (#) |
|
| All Other Stock Awards: Number of Shares of Stock or Units (#) |
|
| All Other Option Awards: Number of Securities Under- lying Options (#) |
|
| Exercise or Base Price of Option Awards ($/Sh) |
|
| Grant Date Fair Value of Stock and Option Awards ($) |
| ||||||||
|
|
|
|
|
|
|
|
|
|
|
|
|
|
|
|
|
|
|
|
|
|
|
|
| ||||||||
Lance A. Sellers |
|
| -- |
|
|
| -- |
|
|
| -- |
|
|
| -- |
|
|
| -- |
|
|
| -- |
|
|
| -- |
|
|
| -- |
|
Jeffrey Hooper |
| January 20, 2022 |
|
|
| -- |
|
|
| -- |
|
|
| -- |
|
|
| 1,4301 |
|
|
| -- |
|
|
| -- |
|
|
| 27.992 |
| |
William D. Cable, Sr. |
|
| -- |
|
|
| -- |
|
|
| -- |
|
|
| -- |
|
|
| -- |
|
|
| -- |
|
|
| -- |
|
|
| -- |
|
________________________
| 1 | Restricted stock units vest in full on January 20, 2026 |
| 2 | Represents fair market value per share on January 20, 2022 |
Outstanding Equity Awards at Fiscal Year End
The following table shows certain information for the named executive officer’s outstanding equity awards as of December 31, 2022.
Outstanding Equity Awards at Fiscal Year-End Table
|
| Stock Awards |
| |||||||||||||
Name |
| Number of Shares or Units of Stock That Have Not Vested (#) |
|
| Market Value of Shares or Units of Stock That Have Not Vested ($) |
|
| Equity Incentive Plan Awards: Number of Unearned Shares, Units or Other Rights That Have Not Vested (#) |
|
| Equity Incentive Plan Awards: Market or Payout Value of Unearned Shares, Units or Other Rights That Have Not Vested3 ($) |
| ||||
Lance A. Sellers |
|
| -- |
|
|
| -- |
|
|
| -- |
|
|
| -- |
|
Jeffrey N. Hooper |
|
| -- |
|
|
| -- |
|
|
| 3,1902 |
|
|
| 103,866 |
|
William D. Cable, Sr. |
|
| -- |
|
|
| -- |
|
|
| 3,2301 |
|
|
| 105,169 |
|
______________________________________
1 | Represents 1,410 restricted stock units that were granted on February 21, 2019 (with a grant date fair value for each unit of $28.43) and will vest on February 21, 2023 and 1,820 restricted stock units that were granted on February 3, 2021 (with a grant date fair value for each unit of $22.04) and will vest on February 3, 2025. |
2 | Represents 1,760 restricted stock units that were granted on May 7, 2020 (with a grant date fair value for each unit of $17.08) and will vest on May 7, 2024, and 1,430 restricted stock units that were granted on January 20, 2022 (with a grant date fair value for each unit of $27.99) and will vest on January 20, 2026 |
3 | Based on a stock price of $32.56 per share on December 31, 2022. |
| 21 |
| Table of Contents |
Option Exercises and Stock Vested
During the fiscal year ended December 31, 2022, no options were exercised by the named executive officers and no previously granted restricted stock units vested.
The following table shows, for the fiscal year ended December 31, 2022, the pension benefits paid or earned by our named executive officers.
Pension Benefits Table |
Name |
| Plan Name |
| Number of Years Credited Service |
|
| Present Value of Accumulated Benefit($) |
|
| Payments During Last Fiscal Year($) |
| |||
Lance A. Sellers |
| Amended and Restated Executive Salary Continuation Agreement1 |
|
| 21 |
|
|
| 838,106 |
|
|
| -- |
|
Jeffrey N. Hooper |
| Executive Salary Continuation Agreement2 |
|
| 3 |
|
|
| 41,399 |
|
|
| -- |
|
William D. Cable, Sr. |
| Amended and Restated Executive Salary Continuation Agreement1 |
|
| 21 |
|
|
| 321,823 |
|
|
| -- |
|
________________________
1 | The Bank entered into Amended and Restated Executive Salary Continuation Agreement with Messrs. Sellers and Cable effective on December 18, 2008. The Amended and Restated Executive Salary Continuation Agreements for Messrs. Sellers and Cable were further amended on December 10, 2014, and such amendments were memorialized in a First Amendment to the Amended and Restated Executive Salary Continuation Agreements effective February 16, 2018. Unless a separation from service or a change in control (as defined in the Amended and Restated Executive Salary Continuation Agreements) occurs before the retirement age set forth in each Amended and Restated Executive Salary Continuation Agreement, the Amended and Restated Executive Salary Continuation Agreements provide for an annual supplemental retirement benefit to be paid to each of the named executive officers in 12 equal monthly installments payable on the first day of each month, beginning with the month immediately after the month in which the named executive officer attains the normal retirement age and for the named executive officer’s lifetime, or if longer, a 13-year term. Under the terms of the Amended and Restated Executive Salary Continuation Agreements, Mr. Sellers will receive an annual supplemental retirement benefit of $130,495 and Mr. Cable will receive an annual supplemental retirement benefit of $93,872. |
2 | The Bank entered into an Executive Salary Continuation Agreement with Mr. Hooper effective on July 1, 2020. Unless a separation from service or a change in control (as defined in Mr. Hooper’s Executive Salary Continuation Agreement) occurs before the retirement age set forth in his Executive Salary Continuation Agreement, the Executive Salary Continuation Agreement provides for an annual supplemental retirement benefit to be paid to Mr. Hooper in 12 equal monthly installments payable on the first day of each month, beginning with the month immediately after the month in which he attains the normal retirement age and for a 13-year term. Under the terms of the Executive Salary Continuation Agreement, Mr. Hooper will receive an annual supplemental retirement benefit of $45,000. |
| 22 |
| Table of Contents |
Nonqualified Deferred Compensation
The below table shows the compensation deferred by the named executive officers during the year ended December 31, 2022.
Nonqualified Deferred Compensation Table
Name |
| Executive Contributions in the Last FY ($)(1) |
|
| Registrant Contributions In Last FY ($) |
|
| Aggregate Earnings in Last FY ($)(2) |
|
| Aggregate Withdrawals/ Distributions ($) |
|
| Aggregate Balance at Last FYE ($)(3) |
| |||||
Lance A. Sellers |
|
| -- |
|
|
| -- |
|
|
| -- |
|
|
| -- |
|
|
| -- |
|
Jeffrey N. Hooper |
|
| -- |
|
|
| -- |
|
|
| -- |
|
|
| -- |
|
|
| -- |
|
William D. Cable, Sr. |
| $ | 19,292 |
|
|
| -- |
|
| $ | 64,688 |
|
|
| 0 |
|
| $ | 771,632 |
|
________________________
1 | The above contributions were based on the named executive officer’s deferral elections and the salaries shown in the Summary Compensation Table. The salaries in the Summary Compensation Table include these contributions. |
2 | This column reflects earnings or losses on plan balances in 2022. Earnings may increase or decrease depending on the performance of the elected hypothetical investment options. Earnings on these plans are not “above-market” and thus are not reported in the Summary Compensation Table. Plan balances may be hypothetically invested in various mutual funds and common stock as described below. Investment returns on those funds and common stock ranged from -31.32% to 21.77% for the year ended December 31, 2022. |
3 | This column represents the year-end balances of the named executive officer’s nonqualified deferred compensation accounts. These balances include contributions that were included in the Summary Compensation Tables in previous years. Amounts in this column include earnings that were not previously reported in the Summary Compensation Table because they were not “above-market” earnings. |
In 2015, the Company and the Bank entered into an employment agreement with Mr. Sellers and Mr. Cable, and in August 2021, the Company and the Bank entered into an employment agreement with Mr. Hooper (collectively, the “Employment Agreements”).
The Employment Agreements each provide for an initial term of 36 months. Annually, on the anniversary of the effective date of each Employment Agreement, the Employment Agreement is automatically extended for one additional year unless the Board of Directors or the executive gives the other party prior written notice that the term is not to be extended. Under the Employment Agreements, the Bank has agreed to pay Mr. Sellers a base salary of at least $311,400 per year, Mr. Cable a base salary of at least $198,750 per year, and Mr. Hooper a base salary of at least $189,625 per year. The Bank reviews each executive’s total compensation at least annually and in its sole discretion may adjust an executive’s total compensation from year to year; provided, however, that an executive’s base salary may not be reduced. In addition, the Employment Agreements provide for discretionary bonuses and participation in other management incentive, pension, profit-sharing, medical and retirement plans maintained by the Bank, as well as fringe benefits normally associated with such executive’s office.
Under the Employment Agreements, the Company and the Bank may terminate each executive’s employment for “cause”, “without cause” or in the event of a “disability” (each as defined in the Employment Agreements). In addition, each executive may voluntarily terminate his employment upon 60 days prior written notice to the Company and the Bank or for “good reason” (as defined in the Employment Agreement). If the Company and the Bank terminate an executive’s employment “without cause”, or an executive terminates his employment for “good reason”, in each case, other than in connection with a change of control, then the executive would be entitled to receive certain severance payments and access to welfare benefit plans as more particularly set forth in the Employment Agreements. In the event that the Company and the Bank terminate an executive’s employment “without cause”, or an executive terminates his employment for “good reason”, in any such case at the time of or within one year after a change of control, then the executive will be entitled to receive certain change in control payments as more particularly described below.
In addition, each Employment Agreement contains certain restrictive covenants prohibiting the executive from competing against the Company and the Bank or soliciting the Company’s or the Bank’s customers for a period of time following termination of employment.
Potential Payments upon Termination or Change in Control
Each of the Employment Agreements provide that in the event the Company terminates the employment of a named executive officer “without cause,” or the officer terminates his or her employment for “good reason,” in any such case at the time of or within one year after a “change of control” (as defined in the Employment Agreements), the officer will be entitled to receive the following payments and benefits: (1) the Company will pay the officer the aggregate of the following amounts: (a) the sum of his accrued obligations; (b) the greater of his base salary, divided by 365 and multiplied by the number of days remaining in the employment period, or an amount equal to 2.99 times his base salary; and (c) the product of his aggregate cash bonus for the last completed fiscal year, and a fraction, the numerator of which is the number of days in the current fiscal year through the date of termination, and the denominator of which is 365; (2) all restricted stock or restricted stock unit awards previously granted to the executive and which have not already become vested and released from restrictions on transfer, repurchase and forfeiture rights, either as a result of the change of control or otherwise, will immediately vest and be released from such restrictions as of the change of control termination date; and (3) all options previously granted to the officer that are unvested as of the change of control termination date will be deemed vested, fully exercisable and non-forfeitable as of the change of control termination date (other than transfer restrictions applicable to incentive stock options) and all previously granted options that are vested, but unexercised, on the change of control termination date will remain exercisable, in each case for the period during which they would have been exercisable absent the termination of his employment, except as otherwise specifically provided by the Internal Revenue Code; and (4) his benefits under all benefit plans that are non-qualified plans will be 100% vested, regardless of his age or years of service, as of the change of control termination date.
| 23 |
| Table of Contents |
If the named executive officers were terminated on December 31, 2022, “without cause” or for “good reason” at the time of or within one year after a “change of control”, Mr. Sellers, Mr. Cable, and Mr. Hooper would have been entitled to receive compensation of approximately $1,522,192, $932,685, and $795,942, respectively, pursuant to their Employment Agreements. These amounts are calculated based on each officer’s 2022 “Salary” and “Bonus” as shown in the “Summary Compensation Table” on page 19 of this Proxy Statement. In addition, if a “change in control” (as defined in the 2009 Omnibus Plan, or in the case Mr. Hooper, the 2020 Omnibus Plan) had occurred on December 31, 2022, all unvested restricted stock units previously granted to each of Mr. Cable and Mr. Hooper would have vested immediately. On December 31, 2022, these unvested restricted stock units had a fair market value of $105,169 for Mr. Cable and $103,866 for Mr. Hooper. Mr. Sellers had no outstanding restricted stock units at December 31, 2022.
General. The purpose of the Omnibus Plans is to promote the interests of the Company by attracting and retaining directors and employees of outstanding ability and to provide executive and other key employees of the Company and its subsidiaries greater incentive to make material contributions to the success of the Company by providing them with stock-based compensation which will increase in value based upon the market performance of the common stock.
The Omnibus Plans are administered by the Governance Committee. Subject to the terms of the Omnibus Plans, the Committee and the Board have authority to construe and interpret, for eligible employees and eligible directors, respectively, the Omnibus Plans, to determine the terms and provisions of Rights (as defined below) to be granted under the Omnibus Plans, to define the terms used in the Omnibus Plans and in the Rights granted thereunder, to prescribe, amend and rescind rules and regulations relating to the Omnibus Plans, to determine the individuals to whom and the times at which Rights shall be granted and the number of shares to be subject to, or to underlie, each Right awarded, and to make all other determinations necessary or advisable for the administration of the Omnibus Plans.
Rights Which May Be Granted. Under the Omnibus Plans, the Committee may grant or award eligible participants options, rights to receive restricted shares of common stock, long term incentive units (each equivalent to one share of common stock), and/or stock appreciation rights. The 2009 Omnibus Plan also permitted the Committee to award book value shares. These grants and awards are referred to herein as the “Rights.” The 2009 Omnibus Plan expired on May 7, 2019, ten years after it was approved by our shareholders. Accordingly, no new awards or grants may be made under the 2009 Omnibus Plan. The 2020 Omnibus Plan was approved by our shareholders on May 7, 2020. Accordingly, no new awards or grants may be made under the 2020 Omnibus Plan after May 7, 2030, the tenth anniversary of the date our shareholders approved the 2020 Omnibus Plan. The Board initially reserved 360,000 shares of common stock for issuance under the 2009 Omnibus Plan, and another 300,000 shares of common stock for issuance under the 2020 Omnibus Plan. Any shares of common stock allocated to Rights granted under the 2020 Omnibus Plan, which Rights are subsequently cancelled or forfeited, will be available for further allocation upon such cancellation or forfeiture.
Change in Control. In the event of a change in control (as such term is defined in the applicable Omnibus Plan), all Rights under the applicable Omnibus Plan will fully vest and be released from any restrictions on transfer. In addition, with respect to the 2020 Omnibus Plan, in the event of a change in control, the Committee may, with 10 days’ advance notice to affected persons, cancel any Right and pay to the holders thereof in cash or common stock or both, the value of the Right based upon the price per share of common stock received or to be received by the Company’s shareholders in the change in control.
| 24 |
| Table of Contents |
Clawback. The Company may cancel any Right, require reimbursement of any Right or previously paid compensation under the 2020 Omnibus Plan or an award agreement, or use any other right of recoupment of equity or compensation in accordance with any clawback policy adopted by the Company and as may be in effect from time to time.
Grants. During 2020, 2021, and 2022, the Board granted 7,635, 7,060, and 5,385, respectively, non-transferable restricted stock units in the aggregate to employees pursuant to the 2020 Omnibus Plan. All grants were compensatory in nature and were issued without cost to the employees. Each restricted stock unit is subject to time-based vesting restrictions and once vested will be convertible into one share of the Company’s common stock. See “Equity Compensation Plan Information” on page 30 for information regarding outstanding options and shares for future issuance under the Omnibus Plans as of December 31, 2022.
Pay Versus Performance Table | ||||||||||||||||||||||||
Year |
| Summary Compensation Table Total for PEO (1) |
|
| Compensation Actually Paid to PEO (2) |
|
| Average Summary Compensation Table Total for Non-PEO NEOs (3) |
|
| Average Compensation Actually Paid to Non-PEO NEOs (4) |
|
| Value of Initial Fixed $100 Investment Based On Total Shareholder Return (5) |
|
| Net Income (Millions) (6) |
| ||||||
(a) |
| (b) |
|
| (c) |
|
| (d) |
|
| (e) |
|
| (f) |
|
| (g) |
| ||||||
2022 |
| $ | 635,630 |
|
| $ | 540,738 |
|
| $ | 360,230 |
|
| $ | 371,470 |
|
| $ | 121.09 |
|
| $ | 16.1 |
|
2021 |
| $ | 580,524 |
|
| $ | 493,085 |
|
| $ | 339,350 |
|
| $ | 360,501 |
|
| $ | 99.42 |
|
| $ | 15.1 |
|
| (1) | The amounts reported in column (b) are the amounts of total compensation reported for our CEO (Chief Executive Officer) Lance A. Sellers (our PEO) for each corresponding year in the “Total” column of the Summary Compensation Table. |
|
|
|
| (2) | The amounts reported in column (c) represent the amount of “Compensation Actually Paid” to Mr. Sellers, as computed in accordance with Item 402(v) of Regulation S-K. The amounts reported do not reflect the actual amount of compensation earned by or paid to Mr. Sellers during the applicable year. In accordance with the requirements of Item 402(v), the following adjustments were made to Mr. Sellers' total compensation as presented in the “Summary Compensation Table” for each year to determine the “Compensation Actually Paid”. No equity awards have been granted to Mr. Sellers, and, as a result the table below table does not include any equity award adjustments. |
Year |
| Reported Summary Compensation Table Total for PEO |
|
| SERP Service Cost (a) |
|
| Compensation Actually Paid to PEO |
| |||
2022 |
| $ | 635,630 |
|
| $ | (94,892 | ) |
| $ | 540,738 |
|
2021 |
| $ | 580,524 |
|
| $ | (87,439 | ) |
| $ | 493,085 |
|
(a) | The amounts included in this column are the amounts reported in the “Change in Pension Value and Nonqualified Deferred Compensation Earnings” column of the “Summary Compensation Table” for each applicable year. |
| (3) | The amounts reported in column (d) represent the average of the amounts reported for our NEOs as a group (excluding Mr. Sellers) in the “Total” column of the ”Summary Compensation Table” in each applicable year. The names of the NEOs (excluding Mr. Sellers) included for purposes of calculating the average amounts in each applicable year are Jeffrey N. Hooper (our Chief Financial Officer, “CFO”) and William B. Cable (our Chief Operating Officer, “COO”). |
|
|
|
| (4) | The amounts reported in column (e) represent the average amount of “Compensation Actually Paid” to the NEOs as a group (excluding Mr. Sellers), as computed in accordance with Item 402(v) of Regulation S-K. The names of the NEOs (excluding Mr. Sellers) included for purposes of calculating the average amounts in each applicable year are Jeffrey N. Hooper and William B. Cable. The amounts reported do not reflect the actual average amount of compensation earned by or paid to the NEOs as a group (excluding Mr. Sellers) during the applicable year. In accordance with the requirements of Item 402(v), the following adjustments were made to average total compensation for the NEOs as a group (excluding Mr. Sellers) for each year to determine the “Compensation Actually Paid”, using the same methodology described above in footnote (2): |
|
|
|
| 25 |
| Table of Contents |
Year |
| Average Reported Summary Compensation Table Total For Non-PEO NEOs |
|
| Average Reported Grant Date Fair Value of Equity Awards (a1) |
|
| Average Equity Award Adjustments (b1) |
|
| Average SERP Service Cost |
|
| Average Compensation Actually Paid to Non-PEO NEOs |
| |||||
2022 |
| $ | 360,230 |
|
| $ | (20,000 | ) |
| $ | 58,961 |
|
| $ | (27,721 | ) |
| $ | 371,470 |
|
2021 |
| $ | 339,350 |
|
| $ | (20,000 | ) |
| $ | 66,503 |
|
| $ | (25,352 | ) |
| $ | 360,501 |
|
(a1) The amounts included in this column reflect the average for our NEOs as a group (excluding Mr. Sellers) of the fair value, computed in accordance with FASB ASC Topic 718, of equity awards granted in each applicable year.
(b1) The amounts deducted or added in calculating the total average equity award adjustments are as follows:
Year |
| Average Year-End Fair Value of Outstanding and Unvested Equity Awards Granted in Applicable Year |
|
| Average Year over Year Change in Fair Value of Outstanding and Unvested Equity Awards Granted in Prior Years |
|
| Total Average Equity Award Adjustments |
| |||
2022 |
| $ | 46,561 |
|
| $ | 12,400 |
|
| $ | 58,961 |
|
2021 |
| $ | 59,259 |
|
| $ | 7,243 |
|
| $ | 66,503 |
|
| (5) | “Total Shareholder Return” (“Company TSR”) represents our cumulative total stockholder return during each measurement period and is calculated by dividing the sum of (i) the difference between the share price of our common stock at the end and the beginning of the measurement period, plus (ii) the cumulative amount of dividends paid on our common stock for the measurement period, assuming dividend reinvestment, by the share price of our common stock at the beginning of the measurement period. Each amount assumes that $100 was invested in our common stock on December 31, 2020, and dividends were reinvested for additional shares. |
|
|
|
| (6) | The amounts reported represent the amount of net income (in millions) reflected in our audited consolidated financial statements for the applicable year. |
| 26 |
| Table of Contents |
Financial Performance Measures
As described in greater detail in the section captioned ”COMPENSATION DISCUSSION AND ANALYSIS - Elements of the Executive Compensation Program,” our executive compensation program includes variable components in the form of annual cash incentive awards, discretionary bonuses, and service awards and long-term incentive awards. The metrics that we use for their awards are selected based on an objective of incentivizing our NEOs to increase shareholder value. Changes in shareholder value are reflected in “Compensation Actually Paid” above through the fair value of our equity awards. “Compensation Actually Paid” for 2021 reflects an increase in the fair value of these equity awards as a result of an increase in our common share price from $23.02 at December 31, 2020 to $27.59 at December 31, 2021. “Compensation Actually Paid” for 2022 reflects an increase in the fair value of these equity awards as a result of an increase in our common stock price from $27.59 at December 31, 2021 to $32.56 at December 31, 2022. The most important financial performance measure used by us to link “Compensation Actually Paid” to the NEOs for the most recently completed fiscal year, to our performance is net income.
Analysis of the Information Presented in the Pay Versus Performance Table
As described in more detail in the section captioned ”COMPENSATION DISCUSSION AND ANALYSIS - Elements of the Executive Compensation Program,” Our executive compensation program includes variable components in the form of annual incentive compensation and long-term incentive awards. While we utilize several performance measures to align executive compensation with our performance, all of those measures are not presented in the ”Pay Versus Performance Table.” Moreover, we generally seek to incentivize long-term performance and, therefore, does not specifically align our performance measures with “Compensation Actually Paid” (as computed in accordance with Item 402(v) Regulation S-K) for a particular year. In accordance with Item 402(v), we are providing the following descriptions of the relationships between information presented in the table.
Compensation Actually Paid and Company TSR
As demonstrated by the following graph, the amount of “Compensation Actually Paid” to Mr. Sellers and the average amount of “Compensation Actually Paid” to our NEOs as a group (excluding Mr. Sellers) is generally aligned with TSR over the two years presented in the ”Pay Versus Performance Table.” The alignment of “Compensation Actually Paid” with our TSR over the period presented is due to the fact that a portion of the “Compensation Actually Paid” to Mr. Sellers and to the other NEOs is comprised of equity awards and cash bonuses tied to net income. As described in more detail in the section captioned ”COMPENSATION DISCUSSION AND ANALYSIS - Elements of the Executive Compensation Program,” the estimated grant date fair value of the target RSU award in 2022 was 0% of total direct compensation for Mr. Sellers and approximately 26% and 22% of total direct compensation for Mr. Hooper and Mr. Cable, respectively.
| 27 |
| Table of Contents |
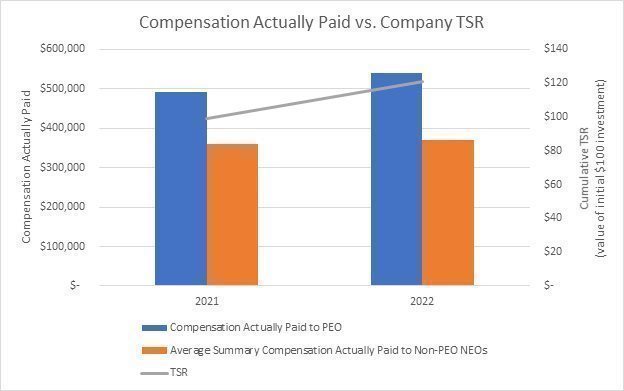
Compensation Actually Paid and Net Income
As demonstrated by the following table, the amount of “Compensation Actually Paid” to Mr. Sellers and the average amount of “Compensation Actually Paid” to our NEOs as a group (excluding Mr. Sellers) is generally aligned with our net income over the two years presented in the table.
| 28 |
| Table of Contents |

Directors’ Fees. Members of the Board of Directors receive no fees or compensation for their service. However, all members of the Board are also directors of the Bank and are compensated by the Bank for service on the Bank Board and its committees.
During the year ended December 31, 2022, each director received a fee of $1,200 for each Bank Board meeting attended, an additional fee of $750 for each committee meeting attended and a retainer of $20,000. In addition, the Chairman of the Bank Board received an additional $250 per meeting attended and the chairpersons of each committee received an additional $150 per meeting attended. Directors receive a reduced fee of $500 for meetings held via conference call.
Directors who serve as members of the boards of directors of Real Estate Advisory Services, Inc., Peoples Investment Services, Inc., and PB Real Estate Holdings, LLC, and Community Bank Real Estate Solutions, LLC, each subsidiaries of the Bank, receive $750 per meeting.
The Bank maintains a Service Recognition Program, under which directors, officers and employees are eligible for awards. Under the Service Recognition Program, directors, officers and employees are awarded a combination of common stock of the Company and cash in the amount necessary to pay taxes on the award, with the amount of the award based upon the length of service with the Bank. Any common stock awarded under the Service Recognition Program is purchased by the Bank on the open market, and no new shares are issued by the Company under the Service Recognition Program.
| 29 |
| Table of Contents |
Directors’ Stock Benefits Plan. Members of the Board of Directors were eligible to participate in the Omnibus Plans. The Company did not grant any plan-based awards to directors during the fiscal year ended December 31, 2022. On January 24, 2018, the Company granted 480 Restricted Stock Units to Kimberly Boyd Leaks, each Restricted Stock Unit being comprised of the right to receive one share of the Company’s common stock. The Restricted Stock Units awarded to Mrs. Leaks on January 24, 2018 vested in full on January 24, 2022, and upon vesting, each Restricted Stock Unit had a market value of $27.95 for a total value of $13,416, which was distributed in a cash payout along with an additional cash payout of $1,243 for accrued dividends.
Directors’ Deferred Compensation Plan. The Bank maintains a non-qualified deferred compensation plan for all of its directors. The Bank’s directors are also directors of the Company. Under the deferred compensation plan, each director may defer all or a portion of his or her fees to the plan each year. The director may elect to invest the deferred compensation in a restricted list of investment funds. The Bank may make matching contributions to the plan for the benefit of the director from time to time at the discretion of the Bank. Directors are fully vested in all amounts they contribute to the plan and in any amounts contributed by the Bank. The Bank has established a Rabbi Trust to hold the directors’ accrued benefits under the plan. There are no “above-market” returns provided for in the deferred compensation plan. The Bank made no contributions to this plan in 2022.
Benefits under the plan are payable in the event of the director’s death, resignation, removal, failure to be re-elected, retirement or in cases of hardship. Directors may elect to receive deferred compensation payments in one lump sum or in installments.
Directors’ Supplemental Retirement Plan. The Bank maintains a non-qualified supplemental retirement benefits plan for all its directors. The plan is designed to provide a retirement benefit to the directors while at the same time minimizing the financial impact on the Bank’s earnings. Under the plan, the Company and/or the Bank purchased life insurance policies on the lives of each director. The increase in cash surrender value of the policies constitutes the Bank’s contribution to the plan each year. The Bank will pay annual benefits to each director for 15 years beginning upon retirement from the Board of Directors.
The following table reports all forms of compensation paid to or accrued for the benefit of each director during the 2022 fiscal year.
Director Compensation
Name |
| Fees Earned or Paid in Cash ($) |
|
| Stock Awards1 ($) |
|
| Option Awards ($) |
|
| Non-Equity Incentive Plan Compensation ($) |
|
| Change in Pension Value and Nonqualified Deferred Compensation Earnings2 ($) |
|
| All Other Compensation ($)3 |
|
| Total ($) |
| |||||||
James S. Abernethy |
|
| 44,400 |
|
|
| -- |
|
|
| -- |
|
|
| -- |
|
|
| 11,184 |
|
|
| 5,000 |
|
|
| 60,584 |
|
Robert C. Abernethy |
|
| 50,950 |
|
|
| -- |
|
|
| -- |
|
|
| -- |
|
|
| 6,279 |
|
|
| -- |
|
|
| 57,229 |
|
Douglas S. Howard |
|
| 45,150 |
|
|
| -- |
|
|
| -- |
|
|
| -- |
|
|
| 6,942 |
|
|
| -- |
|
|
| 52,092 |
|
John W. Lineberger, Jr. |
|
| 35,900 |
|
|
| -- |
|
|
| -- |
|
|
| -- |
|
|
| 6,279 |
|
|
| -- |
|
|
| 42,179 |
|
Gary E. Matthews |
|
| 35,900 |
|
|
| -- |
|
|
| -- |
|
|
| -- |
|
|
| 10,140 |
|
|
| -- |
|
|
| 46,040 |
|
Billy L. Price, Jr., M.D. |
|
| 43,350 |
|
|
| -- |
|
|
| -- |
|
|
| -- |
|
|
| 9,171 |
|
|
| -- |
|
|
| 52,521 |
|
Larry E. Robinson |
|
| 36,650 |
|
|
| -- |
|
|
| -- |
|
|
| -- |
|
|
| 6,279 |
|
|
| -- |
|
|
| 42,929 |
|
William Gregory Terry |
|
| 38,900 |
|
|
| -- |
|
|
| -- |
|
|
| -- |
|
|
| 3,398 |
|
|
| -- |
|
|
| 42,298 |
|
Dan Ray Timmerman, Sr. |
|
| 47,100 |
|
|
| -- |
|
|
| -- |
|
|
| -- |
|
|
| 6,279 |
|
|
| -- |
|
|
| 53,379 |
|
Benjamin I. Zachary |
|
| 39,450 |
|
|
| -- |
|
|
| -- |
|
|
| -- |
|
|
| 9,211 |
|
|
| -- |
|
|
| 48,661 |
|
Kimberly Boyd Leaks |
|
| 35,900 |
|
|
| -- |
|
|
| -- |
|
|
| -- |
|
|
| -- |
|
|
| -- |
|
|
| 35,900 |
|
________________________
1 | The Company did not grant any plan-based awards to directors during the fiscal year ended December 31, 2022. At December 31, 2022, no director had restricted stock units outstanding. See information above under the heading “Directors Stock Benefit Plan” for information on each individual grant of restricted stock units. |
2 | Change in Pension Value and Nonqualified Deferred Compensation Earnings represents the expense accrued by the Bank for each director under the Directors’ Supplemental Retirement Plan as described above. |
3 | In 2022, Director James Abernethy received 142 shares of common stock and $977.14 in cash in recognition of 30 years’ service as a director under the Bank’s Service Recognition Program. |
| 30 |
| Table of Contents |
Indebtedness of and Transactions with Related Persons
The Bank provides loans and other credit facilities in the ordinary course of its business to members of our Board, members of the Bank Board, and employees, including executive officers, and businesses in which the foregoing have direct or indirect interests, as well as the immediate family of the foregoing (together, “Related Persons”). In accordance with Federal Reserve Regulation O, the Bank has adopted a policy which sets forth the requirements applicable to such loans and other credit facilities. These loans and other credit facilities are made using the same credit and underwriting standards as are applicable to the general public, and such loans and other credit facilities do not involve more than the normal risk of collectability or present other unfavorable features. Pursuant to this policy, outstanding loans and other credit facilities to Related Persons are made on the same terms, including interest rates and collateral, as those prevailing at the time for comparable transactions with nonaffiliated persons, and do not involve more than the normal risk of collectability or present to the Bank other unfavorable features.
Our Board is charged with reviewing and approving all transactions that either we or the Bank may have from time to time with Related Persons other than transactions subject to Federal Reserve Regulation O, discussed above. All material facts of each transaction and the Related Person’s interest are discussed by all disinterested directors and a decision is made about whether the transaction is fair to the Company and the Bank. A majority vote of all disinterested directors is required to approve any transaction involving a Related Person.
Equity Compensation Plan Information
The following table sets forth certain information regarding outstanding options and shares for future issuance under the Company’s two equity compensation plans as of December 31, 2022. Individual equity compensation arrangements are aggregated and included within this table. This table excludes any plan, contract or arrangement that provides for the issuance of options, warrants or other rights that are given to our shareholders on a pro rata basis and any employee benefit plan that is intended to meet the qualification requirements of Section 401(a) of the Internal Revenue Code.
Plan Category |
| Number of securities to be issued upon exercise of outstanding options, warrants and rights (1) |
|
| Weighted-average exercise price of outstanding options, warrants and rights (2) |
|
| Number of securities remaining available for future issuance under equity compensation plans (excluding securities reflected in column (a)) |
| |||
|
| (a) |
|
| (b) |
|
| (c) |
| |||
Equity compensation plans approved by security holders |
|
| 28,440 |
|
|
| - |
|
|
| 279,920 |
|
Equity compensation plans not approved by security holders |
|
| - |
|
|
| - |
|
|
| - |
|
Total |
|
| 28,440 |
|
|
| - |
|
|
| 279,920 |
|
________________________
1 | Includes 3,245 restricted stock units granted on January 24, 2018 under the 2009 Omnibus Plan. These restricted stock grants vested on January 24, 2022. Includes 5,115 restricted stock units granted on February 21, 2019 under the 2009 Omnibus Plan. These restricted stock grants vested on February 21, 2023. Includes 7,635 restricted stock units granted on May 7, 2020 under the 2020 Omnibus Plan. These restricted stock grants vest on May 7, 2024. Includes 7,060 restricted stock units granted on February 3, 2021 under the 2020 Omnibus Plan. These restricted stock grants vest on February 3, 2025. Includes 5,385 restricted stock units granted on January 20, 2022 under the 2020 Omnibus Plan. These restricted stock grants vest on January 20, 2026. |
2 | The restricted stock units granted by the Company under the Omnibus Plans do not have an exercise price. |
| 31 |
| Table of Contents |
The above table excludes shares to be awarded pursuant to the Service Recognition Program. The Service Recognition Program is described under the section captioned “Discretionary Bonus and Service Awards” on page 16 of this Proxy Statement.
RATIFICATION OF SELECTION OF INDEPENDENT REGISTERED PUBLIC ACCOUNTING FIRM
Elliott Davis, our registered independent public accounting firm for the fiscal year ended December 31, 2022, has been appointed by the Audit Committee as our registered independent public accounting firm for the fiscal year ending December 31, 2023, and you are being asked to ratify this appointment. Fees charged by this firm are at rates and upon terms that are customarily charged by other registered independent public accounting firms. A representative of the firm will be present at the Annual Meeting and will have an opportunity to make a statement if he or she desires to do so and to respond to appropriate questions.
Audit Fees Paid to Independent Auditors
The following table represents the approximate fees for professional services rendered by Elliott Davis for the audit of our annual financial statements and review of our financial statements included in our Forms 10-Q for the fiscal years ended December 31, 2022 and 2021 and fees billed for audit-related services, tax services and all other services rendered, for each of such years.
|
| Year Ended December 31 |
| |||||
|
| 2022 |
|
| 2021 |
| ||
| ||||||||
Audit Fees1 |
| $ | 205,592 |
|
| $ | 198,334 |
|
| ||||||||
Audit-Related Fees2 |
| $ | 13,500 |
|
| $ | 14,500 |
|
| ||||||||
Tax Fees3 |
| $ | 36,065 |
|
| $ | 29,060 |
|
| ||||||||
All Other Fees |
|
| -- |
|
|
| -- |
|
________________________
1 | For the fiscal year ending December 31, 2022 and 2021, Audit Fees include amounts for the integrated audit of the consolidated financial statements in accordance with the standards of the Public Company Accounting Oversight Board (PCAOB), quarterly reviews, and internal control over financial reporting in accordance with auditing and related professional practice standards established by the American Institute of Certified Public Accountants (AICPA), and the requirements of Section 112 of the Federal Deposit Insurance Corporation Improvement Act (FDICIA). |
2 | Represents amounts for the audit of the Bank’s 401(k) Plan. |
3 | Represents amounts for assistance in the preparation of our various federal, state and local tax returns. |
All audit related services, tax services and other services giving rise to the fees listed under “Audit-Related Fees”, “Tax Fees” and “All Other Fees” in the table above were pre-approved by the Audit Committee, which concluded that the provision of such services was compatible with the maintenance of that firm’s independence in the conduct of its auditing functions. The Audit Committee’s charter provides for pre-approval of all audit and non-audit services to be provided by our independent auditors. The charter authorizes the Audit Committee to delegate to one or more of its members pre-approval authority with respect to permitted services, provided that any such approvals are presented to the Audit Committee at its next scheduled meeting.
| 32 |
| Table of Contents |
THE BOARD OF DIRECTORS RECOMMENDS THAT THE SHAREHOLDERS VOTE FOR RATIFICATION OF THE APPOINTMENT OF ELLIOTT DAVIS AS THE COMPANY’S INDEPENDENT REGISTERED PUBLIC ACCOUNTING FIRM FOR THE FISCAL YEAR ENDING DECEMBER 31, 2023.
DATE FOR RECEIPT OF SHAREHOLDER PROPOSALS
It is presently anticipated that the 2024 Annual Meeting of Shareholders of the Company will be held on May 2 2024. In order for shareholder proposals to be included in the Company’s proxy materials for that meeting, such proposals must be received by the Secretary of the Company at the Company’s principal executive office no later than November 24, 2023 and meet all other applicable requirements for inclusion in the Proxy Statement.
In the alternative, a shareholder may commence his or her own proxy solicitation and present a proposal from the floor at the 2024 Annual Meeting of Shareholders of the Company. In order to do so, the shareholder must notify the Secretary of the Company in writing, at the Company’s principal executive office no later than February 7, 2024, of his or her proposal. If the Secretary of the Company is not notified of the shareholder’s proposal by February 7, 2024, the Board of Directors may vote on the proposal pursuant to the discretionary authority granted by the proxies solicited by the Board for the 2024 Annual Meeting of Shareholders.
Management knows of no other matters to be presented for consideration at the Annual Meeting or any adjournments thereof. If any other matters shall properly come before the Annual Meeting, it is intended that the proxyholders named in the enclosed form of proxy will vote the shares represented thereby in accordance with their judgment, pursuant to the discretionary authority granted therein.
The Annual Report of the Company for the year ended December 31, 2022, which includes financial statements audited and reported upon by the Company’s registered independent public accounting firm, is being mailed as Appendix A to this Proxy Statement; however, it is not intended that the Annual Report be deemed a part of this Proxy Statement or a solicitation of proxies.
THE COMPANY’S ANNUAL REPORT ON FORM 10-K FILED BY THE COMPANY WITH THE SEC, INCLUDING THE FINANCIAL STATEMENTS AND SCHEDULES THERETO, WILL BE PROVIDED FREE OF CHARGE UPON WRITTEN REQUEST DIRECTED TO: PEOPLES BANCORP OF NORTH CAROLINA, INC., POST OFFICE BOX 467, 518 WEST C STREET, NEWTON, NORTH CAROLINA 28658-0467, ATTENTION: JEFFREY HOOPER.
|
| By Order of the Board of Directors, |
|
|
|
|
|
|
| Lance A. Sellers |
|
|
| President and Chief Executive Officer |
|

Newton, North Carolina
March 27, 2023
| 33 |
| Table of Contents |
ANNUAL REPORT
OF
PEOPLES BANCORP OF NORTH CAROLINA, INC.
| 34 |
| Table of Contents |
PEOPLES BANCORP OF NORTH CAROLINA, INC.
General Description of Business
Peoples Bancorp of North Carolina, Inc. (the “Company”), was formed in 1999 to serve as the holding company for Peoples Bank (the “Bank”). The Company is a bank holding company registered with the Board of Governors of the Federal Reserve System (the “Federal Reserve”) under the Bank Holding Company Act of 1956, as amended (the “BHCA”). The Company’s principal source of income is dividends declared and paid by the Bank on its capital stock, if any. The Company has no operations and conducts no business of its own other than owning the Bank and PEBK Capital Trust II. Accordingly, the discussion of the business which follows primarily concerns the business conducted by the Bank. Our principal executive offices are located at 518 West C Street, Newtown, North Carolina, 28658, and our telephone number is (828) 464-5620.
The Bank, founded in 1912, is a state-chartered commercial bank serving the citizens and business interests of the Catawba Valley and surrounding communities through 17 banking offices, located in Lincolnton, Newton, Denver, Catawba, Conover, Maiden, Claremont, Hiddenite, Hickory, Charlotte, Huntersville, Mooresville, Raleigh, and Cary, North Carolina. The Bank also operates loan production offices in Charlotte, Denver, Salisbury and Winston-Salem North Carolina. The Company’s fiscal year ends December 31. At December 31, 2022, the Company had total assets of $1.6 billion, net loans of $1.0 billion, deposits of $1.4 billion, total securities of $448.1 million, and shareholders’ equity of $105.2 million.
The Bank operates three banking offices focused on the Latino population that were formerly operated as a division of the Bank under the name Banco de la Gente (“Banco”). These offices, which offer the same banking services as our other branches offer, now operate under the same name as our other offices; however, we continue to separately categorize mortgage loans originated from these offices.
The Bank has a diversified loan portfolio, with no foreign loans and few agricultural loans. Real estate loans are predominately variable rate and fixed rate commercial property loans, which include residential development loans to commercial customers. Commercial loans are spread throughout a variety of industries with no one particular industry or group of related industries accounting for a significant portion of the commercial loan portfolio. The majority of the Bank’s deposit and loan customers are individuals and small-to medium-sized businesses located in the Bank’s market area. The Bank’s loan portfolio also includes Individual Taxpayer Identification Number (ITIN) mortgage loans generated through the Bank’s former Banco offices. Additional discussion of the Bank’s loan portfolio and sources of funds for loans can be found in “Management’s Discussion and Analysis of Financial Condition and Results of Operations” on pages A-4 through A-26 of the Annual Report, which is included in this Form 10-K as Exhibit (13).
The operations of the Bank are significantly influenced by general economic conditions and by related monetary and fiscal policies of the Company and the Bank’s regulatory agencies, including the Federal Reserve, the Federal Deposit Insurance Corporation (the “FDIC”) and the North Carolina Commissioner of Banks (the “Commissioner”).
At December 31, 2022, the Company employed 279 full-time employees and 21 part-time employees, which equated to 291 full-time equivalent employees.
Subsidiaries
The Bank is a subsidiary of the Company. At December 31, 2022, the Bank had four subsidiaries, Peoples Investment Services, Inc., Real Estate Advisory Services, Inc., Community Bank Real Estate Solutions, LLC (“CBRES”) and PB Real Estate Holdings, LLC. Through a relationship with Raymond James Financial Services, Inc., Peoples Investment Services, Inc. provides the Bank’s customers access to investment counseling and non-deposit investment products such as stocks, bonds, mutual funds, tax deferred annuities, and related brokerage services. Real Estate Advisory Services, Inc. provides real estate appraisal and real estate brokerage services. CBRES serves as a “clearing-house” for appraisal services for community banks. Other banks are able to contract with CBRES to find and engage appropriate appraisal companies. As a separate legal entity, CBRES’s services and the appraisal process are conducted independent from the financing process of the Bank. PB Real Estate Holdings, LLC acquires, manages and disposes of real property, other collateral and assets obtained in the ordinary course of collecting debts previously contracted. In 2019, the Company launched PB Insurance Agency, which operated as a division of CBRES, until it was discontinued in 2022. All of the Bank’s subsidiaries are incorporated in the state of North Carolina.
In June 2006, the Company formed a wholly owned Delaware statutory trust, PEBK Capital Trust II (“PEBK Trust II”), to facilitate the issuance of $20.6 million of trust preferred securities. PEBK Trust II is not included in the consolidated financial statements. The Company redeemed $5.0 million of outstanding trust preferred securities in 2019. The trust preferred securities issued by PEBK Trust II accrue and pay quarterly dividends at a floating rate of three-month LIBOR plus 163 basis points. The Company has guaranteed payment of these dividends and other payments due on the trust preferred securities.
| A-1 |
This report contains certain forward-looking statements with respect to the financial condition, results of operations and business of the Company. These forward-looking statements involve risks and uncertainties and are based on the beliefs and assumptions of management of the Company and on the information available to management at the time that these disclosures were prepared. These statements can be identified by the use of words like “expect,” “anticipate,” “estimate” and “believe,” variations of these words and other similar expressions. Readers should not place undue reliance on forward-looking statements as a number of important factors could cause actual results to differ materially from those in the forward-looking statements. Factors that could cause actual results to differ materially include, but are not limited to, (1) competition in the markets served by the Company’s subsidiary, Peoples Bank, (2) changes in the interest rate environment, (3) general national, regional or local economic conditions may be less favorable than expected, resulting in, among other things, a deterioration in credit quality and the possible impairment of collectibility of loans, (4) legislative or regulatory changes, including changes in accounting standards, (5) significant changes in the federal and state legal and regulatory environment and tax laws, (6) the impact of changes in monetary and fiscal policies, laws, rules and regulations and (7) other risks and factors identified in the Company’s other filings with the Securities and Exchange Commission. The Company undertakes no obligation to update any forward-looking statements.
| A-2 |
SELECTED FINANCIAL DATA | ||||||||||||
Dollars in Thousands Except Per Share Amounts | ||||||||||||
|
|
|
|
|
|
|
|
|
| |||
|
| 2022 |
|
| 2021 |
|
| 2020 |
| |||
Summary of Operations |
|
|
|
|
|
|
|
|
| |||
Interest income |
| $ | 54,431 |
|
|
| 47,179 |
|
|
| 47,958 |
|
Interest expense |
|
| 3,323 |
|
|
| 3,205 |
|
|
| 3,836 |
|
Net interest income |
|
| 51,108 |
|
|
| 43,974 |
|
|
| 44,122 |
|
Provision for (recovery of) loan losses |
|
| 1,472 |
|
|
| (1,163 | ) |
|
| 4,259 |
|
Net interest income after provision for loan losses |
|
| 49,636 |
|
|
| 45,137 |
|
|
| 39,863 |
|
Non-interest income |
|
| 26,689 |
|
|
| 24,919 |
|
|
| 22,914 |
|
Non-interest expense |
|
| 56,030 |
|
|
| 51,127 |
|
|
| 48,931 |
|
Earnings before income taxes |
|
| 20,295 |
|
|
| 18,929 |
|
|
| 13,846 |
|
Income tax expense |
|
| 4,172 |
|
|
| 3,796 |
|
|
| 2,489 |
|
Net earnings |
| $ | 16,123 |
|
|
| 15,133 |
|
|
| 11,357 |
|
|
|
|
|
|
|
|
|
|
|
|
|
|
Selected Year-End Balances |
|
|
|
|
|
|
|
|
|
|
|
|
Assets |
| $ | 1,620,927 |
|
|
| 1,624,193 |
|
|
| 1,416,175 |
|
Investment securities available for sale |
|
| 445,394 |
|
|
| 406,549 |
|
|
| 245,249 |
|
Net loans |
|
| 1,022,114 |
|
|
| 875,514 |
|
|
| 938,731 |
|
Mortgage loans held for sale |
|
| 211 |
|
|
| 3,637 |
|
|
| 9,139 |
|
Interest-earning assets |
|
| 1,502,868 |
|
|
| 1,531,975 |
|
|
| 1,326,489 |
|
Deposits |
|
| 1,435,215 |
|
|
| 1,412,748 |
|
|
| 1,221,086 |
|
Interest-bearing liabilities |
|
| 975,279 |
|
|
| 950,987 |
|
|
| 805,771 |
|
Shareholders' equity |
| $ | 105,195 |
|
|
| 142,369 |
|
|
| 139,899 |
|
Shares outstanding |
|
| 5,636,830 |
|
|
| 5,661,569 |
|
|
| 5,632,035 |
|
|
|
|
|
|
|
|
|
|
|
|
|
|
Selected Average Balances |
|
|
|
|
|
|
|
|
|
|
|
|
Assets |
| $ | 1,663,665 |
|
|
| 1,568,417 |
|
|
| 1,366,962 |
|
Investment securities available for sale |
|
| 467,484 |
|
|
| 349,647 |
|
|
| 200,821 |
|
Loans |
|
| 949,175 |
|
|
| 908,682 |
|
|
| 935,970 |
|
Interest-earning assets |
|
| 1,601,168 |
|
|
| 1,483,519 |
|
|
| 1,271,764 |
|
Deposits |
|
| 1,480,113 |
|
|
| 1,372,855 |
|
|
| 1,115,019 |
|
Interest-bearing liabilities |
|
| 979,315 |
|
|
| 896,903 |
|
|
| 793,188 |
|
Shareholders' equity |
| $ | 123,887 |
|
|
| 147,740 |
|
|
| 141,287 |
|
Shares outstanding |
|
| 5,480,123 |
|
|
| 5,576,099 |
|
|
| 5,657,025 |
|
|
|
|
|
|
|
|
|
|
|
|
|
|
Profitability Ratios |
|
|
|
|
|
|
|
|
|
|
|
|
Return on average total assets |
|
| 0.97 | % |
|
| 0.96 | % |
|
| 0.83 | % |
Return on average shareholders' equity |
|
| 13.01 | % |
|
| 10.24 | % |
|
| 8.04 | % |
Dividend payout ratio |
|
| 30.61 | % |
|
| 24.83 | % |
|
| 38.67 | % |
|
|
|
|
|
|
|
|
|
|
|
|
|
Liquidity and Capital Ratios (averages) |
|
|
|
|
|
|
|
|
|
|
|
|
Loan to deposit |
|
| 64.13 | % |
|
| 66.19 | % |
|
| 83.94 | % |
Shareholders' equity to total assets |
|
| 7.45 | % |
|
| 9.42 | % |
|
| 10.35 | % |
|
|
|
|
|
|
|
|
|
|
|
|
|
Per share of Common Stock |
|
|
|
|
|
|
|
|
|
|
|
|
Basic net earnings |
| $ | 2.94 |
|
|
| 2.71 |
|
|
| 2.01 |
|
Diluted net earnings |
| $ | 2.85 |
|
|
| 2.63 |
|
|
| 1.95 |
|
Cash dividends |
| $ | 0.87 |
|
|
| 0.66 |
|
|
| 0.75 |
|
Book value |
| $ | 19.24 |
|
|
| 25.89 |
|
|
| 24.84 |
|
| A-3 |
MANAGEMENT'S DISCUSSION AND ANALYSIS OF FINANCIAL CONDITION
AND RESULTS OF OPERATIONS
The following is a discussion of our financial position and results of operations and should be read in conjunction with the information set forth under Item 1A Risk Factors in the Company’s Annual Report on Form 10-K and the Company’s consolidated financial statements and notes thereto on pages A-19 through A-59.
Introduction
Management’s discussion and analysis of earnings and related data are presented to assist in understanding the consolidated financial condition and results of operations of the Company, for the years ended December 31, 2022, 2021 and 2020. The Company is a registered bank holding company operating under the supervision of the Board of Governors of the Federal Reserve System (the “Federal Reserve”) and the parent company of the “Bank. The Bank is a North Carolina-chartered bank, with offices in Catawba, Lincoln, Alexander, Mecklenburg, Iredell, Wake, Rowan and Forsyth counties, operating under the banking laws of North Carolina and the rules and regulations of the Federal Deposit Insurance Corporation (the “FDIC”).
Overview
Our business consists principally of attracting deposits from the general public and investing these funds in commercial loans, real estate mortgage loans, real estate construction loans and consumer loans. Our profitability depends primarily on our net interest income, which is the difference between the income we receive on our loan and investment securities portfolios and our cost of funds, which consists of interest paid on deposits and borrowed funds. Net interest income also is affected by the relative amounts of our interest-earning assets and interest-bearing liabilities. When interest-earning assets approximate or exceed interest-bearing liabilities, a positive interest rate spread will generate net interest income. Our profitability is also affected by the level of other income and operating expenses. Other income consists primarily of miscellaneous fees related to our loans and deposits, mortgage banking income and commissions from sales of annuities and mutual funds. Operating expenses consist of compensation and benefits, occupancy related expenses, federal deposit and other insurance premiums, data processing, advertising and other expenses.
Our operations are influenced significantly by local economic conditions and by policies of financial institution regulatory authorities. The earnings on our assets are influenced by the effects of, and changes in, trade, monetary and fiscal policies and laws, including interest rate policies of the Federal Reserve, inflation, interest rates, market and monetary fluctuations. Lending activities are affected by the demand for commercial and other types of loans, which in turn is affected by the interest rates at which such financing may be offered. Our cost of funds is influenced by interest rates on competing investments and by rates offered on similar investments by competing financial institutions in our market area, as well as general market interest rates. These factors can cause fluctuations in our net interest income and other income. In addition, local economic conditions can impact the credit risk of our loan portfolio, in that (1) local employers may be required to eliminate employment positions of individual borrowers, and (2) small businesses and commercial borrowers may experience a downturn in their operating performance and become unable to make timely payments on their loans. Management evaluates these factors in estimating the allowance for loan and lease losses (“ALLL”, “allowance for loan losses”, or “allowance”) and changes in these economic factors could result in increases or decreases to the provision for loan losses.
COVID-19 has adversely affected, and may continue to adversely affect economic activity globally, nationally and locally. Following the COVID-19 outbreak in December 2019 and January 2020, market interest rates declined significantly, with the 10-year Treasury bond falling below 1.00% on March 3, 2020 for the first time. Such events generally had an adverse effect on business and consumer confidence and the Company and its customers. On March 3, 2020, the Federal Reserve Federal Open Market Committee (“FOMC”) reduced the target federal funds rate by 50 basis points to a range of 1.00% to 1.25%. Subsequently on March 16, 2020, the FOMC further reduced the target federal funds rate by an additional 100 basis points to a range of 0.00% to 0.25%. These reductions in interest rates and other effects of the COVID-19 pandemic had an adverse effect on the Company’s financial condition and results of operations. Prior to the occurrence of the COVID-19 pandemic, economic conditions, while not as robust as the economic conditions during the period from 2004 to 2007, had stabilized such that businesses in our market area were growing and investing again. The uncertainty expressed in the local, national and international markets through the primary economic indicators of activity were previously sufficiently stable to allow for reasonable economic growth in our markets. Subsequently, continuing supply-chain disruption and rising inflation has caused the FOMC to increase the target federal funds rate by 425 basis points in 2022 to a range of 4.25% to 4.50% at December 31, 2022.
| A-4 |
Although we are unable to control the external factors that influence our business, by maintaining high levels of balance sheet liquidity, managing our interest rate exposures and by actively monitoring asset quality, we seek to minimize the potentially adverse risks of unforeseen and unfavorable economic trends. Because the assets and liabilities of a bank are primarily monetary in nature (payable in fixed, determinable amounts), the performance of a bank is affected more by changes in interest rates than by inflation. Interest rates generally increase as the rate of inflation increases, but the magnitude of the change in rates may not be the same. The effect of inflation on banks is normally not as significant as its influence on those businesses that have large investments in plants and inventories. During periods of high inflation there are normally corresponding increases in the money supply, and banks will normally experience above average growth in assets, loans, and deposits. Also, general increases in the price of goods and services can be expected to result in increased operating expenses.
Our business emphasis has been and continues to be to operate as a well-capitalized, profitable and independent community-oriented financial institution dedicated to providing quality customer service. We are committed to meeting the financial needs of the communities in which we operate. We expect growth to be achieved in our local markets and through expansion opportunities in contiguous or nearby markets. While we would be willing to consider growth by acquisition in certain circumstances, we do not consider the acquisition of another company to be necessary for our continued ability to provide a reasonable return to our shareholders. We believe that we can be more effective in serving our customers than many of our non-local competitors because of our ability to quickly and effectively provide senior management responses to customer needs and inquiries. Our ability to provide these services is enhanced by the stability and experience of our Bank officers and managers.
The Company does not have specific plans for additional offices in 2023 but will continue to look for growth opportunities in nearby markets and may expand if considered a worthwhile opportunity.
Summary of Significant and Critical Accounting Policies
The consolidated financial statements include the financial statements of the Company and its wholly owned subsidiary, the Bank, along with the Bank’s wholly owned subsidiaries, Peoples Investment Services, Inc., Real Estate Advisory Services, Inc. (“REAS”), Community Bank Real Estate Solutions, LLC (“CBRES”) and PB Real Estate Holdings, LLC. All significant intercompany balances and transactions have been eliminated in consolidation.
The Company’s accounting policies are fundamental to understanding management’s discussion and analysis of results of operations and financial condition. Many of the Company’s accounting policies require significant judgment regarding valuation of assets and liabilities and/or significant interpretation of specific accounting guidance. The following is a summary of some of the more subjective and complex accounting policies of the Company. A more complete description of the Company’s significant accounting policies can be found in Note 1 of the Notes to Consolidated Financial Statements in the Company’s 2022 Annual Report to Shareholders which is Appendix A to the Proxy Statement for the May 4, 2023 Annual Meeting of Shareholders.
The allowance for loan losses reflects management’s assessment and estimate of the risks associated with extending credit and its evaluation of the quality of the loan portfolio. The Bank periodically analyzes the loan portfolio in an effort to review asset quality and to establish an allowance for loan losses that management believes will be adequate in light of anticipated risks and loan losses.
Many of the Company’s assets and liabilities are recorded using various techniques that require significant judgment as to recoverability. The collectability of loans is reflected through the Company’s estimate of the allowance for loan losses. The Company performs periodic and systematic detailed reviews of its lending portfolio to assess overall collectability. In addition, certain assets and liabilities are reflected at their estimated fair value in the consolidated financial statements. Such amounts are based on either quoted market prices or estimated values derived from dealer quotes used by the Company, market comparisons or internally generated modeling techniques. The Company’s internal models generally involve present value of cash flow techniques. The various techniques are discussed in greater detail elsewhere in this management’s discussion and analysis and the Notes to Consolidated Financial Statements.
There are other complex accounting standards that require the Company to employ significant judgment in interpreting and applying certain of the principles prescribed by those standards. These judgments include, but are not limited to, the determination of whether a financial instrument or other contract meets the definition of a derivative in accordance with U.S. Generally Accepted Accounting Principles (“GAAP”).
The Company has an overall interest rate risk management strategy that has, in prior years, incorporated the use of derivative instruments to minimize significant unplanned fluctuations in earnings that are caused by interest rate volatility. When using derivative instruments, the Company is exposed to credit and market risk. If the counterparty fails to perform, credit risk is equal to the extent of the fair-value gain in the derivative. The Company minimized the credit risk in derivative instruments by entering into transactions with high-quality counterparties that were reviewed periodically by the Company. The Company did not have any interest rate derivatives outstanding as of December 31, 2022 or 2021.
| A-5 |
Management of the Company has made a number of estimates and assumptions relating to reporting of assets and liabilities and the disclosure of contingent assets and liabilities to prepare the accompanying consolidated financial statements in conformity with GAAP. Actual results could differ from those estimates.
Results of Operations
Summary. The Company reported earnings of $16.1 million or $2.94 per share and $2.85 per diluted share for the year ended December 31, 2022, as compared to $15.1 million or $2.71 per share and $2.63 per diluted share for the prior year. The increase in year-to-date net earnings is primarily attributable to an increase in net interest income and an increase in non-interest income, which were partially offset by an increase in the provision for loan losses and an increase in non-interest expense for the year ended December 31, 2022, compared to the year ended December 31, 2021, as discussed below.
The Company reported earnings of $15.1 million or $2.71 per share and $2.63 per diluted share for the year ended December 31, 2021, as compared to $11.4 million or $2.01 per share and $1.95 per diluted share for the prior year. The increase in year-to-date net earnings is primarily attributable to a recovery in the provision for loan losses and an increase in non-interest income, which were partially offset by a decrease in net interest income and an increase in non-interest expense.
The return on average assets in 2022 was 0.97%, as compared to 0.96% in 2021 and 0.83% in 2020. The return on average shareholders’ equity was 13.01% in 2022, as compared to 10.24% in 2021 and 8.04% in 2020.
Net Interest Income. Net interest income, the major component of the Company’s net income, is the amount by which interest and fees generated by interest-earning assets exceed the total cost of funds used to carry them. Net interest income is affected by changes in the volume and mix of interest-earning assets and interest-bearing liabilities, as well as changes in the yields earned and rates paid. Net interest margin is calculated by dividing tax-equivalent net interest income by average interest-earning assets, and represents the Company’s net yield on its interest-earning assets.
Net interest income in 2022 was $51.1 million, compared to $44.0 million in 2021. The increase in net interest income is due to a $7.3 million increase in interest income, partially offset by a $118,000 increase in interest expense. The increase in interest income is primarily due to a $1.9 million increase in interest income and fees on loans, a $2.0 million increase in interest income on balances due from banks and a $3.4 million increase in interest income on investment securities. The increase in interest income and fees on loans is primarily due to an increase in total loans and rate increases by the Federal Reserve, partially offset by a $2.4 million decrease in fee income on SBA PPP loans. The increase in interest income on balances due from banks is primarily due to rate increases by the Federal Reserve. The increase in interest income on investment securities is primarily due to additional securities purchased with additional cash resulting from an increase in deposits combined with higher yields on securities purchased in 2022. The increase in interest expense is primarily due to an increase in rates paid on interest-bearing liabilities. Net interest income decreased to $44.0 million in 2021 from $44.1 million in 2020.
Table 1 sets forth for each category of interest-earning assets and interest-bearing liabilities, the average amounts outstanding, the interest incurred on such amounts and the average rate earned or incurred for the years ended December 31, 2022, 2021 and 2020. The table also sets forth the average rate earned on total interest-earning assets, the average rate paid on total interest-bearing liabilities, and the net yield on total average interest-earning assets for the same periods. Yield information does not give effect to changes in fair value that are reflected as a component of shareholders’ equity. Yields and interest income on tax-exempt investments have been adjusted to a tax equivalent basis using an effective tax rate of 22.98% for securities that are both federal and state tax exempt and an effective tax rate of 20.48% for federal tax-exempt securities. Non-accrual loans and the interest income that was recorded on non-accrual loans, if any, are included in the yield calculations for loans in all periods reported. The Company believes the presentation of net interest income on a tax-equivalent basis provides comparability of net interest income from both taxable and tax-exempt sources and facilitates comparability within the industry. Although the Company believes these non-GAAP financial measures enhance investors’ understanding of its business and performance, these non-GAAP financial measures should not be considered an alternative to GAAP. The reconciliations of these non-GAAP financial measures to their most directly comparable GAAP financial measures are presented below.
| A-6 |
Table 1 - Average Balance Table |
|
|
|
|
|
|
|
|
|
|
|
|
|
|
|
|
| |||||||||||||||||||
|
|
|
|
|
|
|
|
|
|
|
|
|
|
|
|
|
|
|
|
|
|
|
|
|
|
|
| |||||||||
|
| December 31, 2022 |
|
| December 31, 2021 |
|
| December 31, 2020 |
| |||||||||||||||||||||||||||
(Dollars in thousands) |
| Average Balance |
|
| Interest |
|
| Yield / Rate |
|
| Average Balance |
|
| Interest |
|
| Yield / Rate |
|
| Average Balance |
|
| Interest |
|
| Yield / Rate |
| |||||||||
Interest-earning assets: |
|
|
|
|
|
|
|
|
|
|
|
|
|
|
|
|
|
|
|
|
|
|
|
|
|
|
| |||||||||
Loans |
| $ | 949,175 |
|
|
| 43,077 |
|
|
| 4.54 | % |
|
| 908,682 |
|
|
| 41,186 |
|
|
| 4.53 | % |
|
| 935,970 |
|
|
| 42,314 |
|
|
| 4.52 | % |
Investments - taxable |
|
| 399,036 |
|
|
| 7,159 |
|
|
| 1.79 | % |
|
| 283,521 |
|
|
| 4,381 |
|
|
| 1.55 | % |
|
| 132,468 |
|
|
| 2,299 |
|
|
| 1.74 | % |
Investments - nontaxable* |
|
| 71,943 |
|
|
| 2,355 |
|
|
| 3.27 | % |
|
| 70,413 |
|
|
| 1,802 |
|
|
| 2.56 | % |
|
| 75,609 |
|
|
| 3,634 |
|
|
| 4.81 | % |
Federal funds sold |
|
| - |
|
|
| - |
|
|
| - |
|
|
| - |
|
|
| - |
|
|
| - |
|
|
| 91,166 |
|
|
| 204 |
|
|
| 0.22 | % |
Due from banks |
|
| 181,014 |
|
|
| 2,223 |
|
|
| 1.23 | % |
|
| 220,903 |
|
|
| 258 |
|
|
| 0.12 | % |
|
| 36,551 |
|
|
| 127 |
|
|
| 0.35 | % |
|
|
|
|
|
|
|
|
|
|
|
|
|
|
|
|
|
|
|
|
|
|
|
|
|
|
|
|
|
|
|
|
|
|
|
|
|
Total interest-earning assets |
|
| 1,601,168 |
|
|
| 54,814 |
|
|
| 3.42 | % |
|
| 1,483,519 |
|
|
| 47,627 |
|
|
| 3.21 | % |
|
| 1,271,764 |
|
|
| 48,578 |
|
|
| 3.82 | % |
|
|
|
|
|
|
|
|
|
|
|
|
|
|
|
|
|
|
|
|
|
|
|
|
|
|
|
|
|
|
|
|
|
|
|
|
|
Cash and due from banks |
|
| 36,778 |
|
|
|
|
|
|
|
|
|
|
| 32,104 |
|
|
|
|
|
|
|
|
|
|
| 34,569 |
|
|
|
|
|
|
|
|
|
Other assets |
|
| 35,373 |
|
|
|
|
|
|
|
|
|
|
| 62,322 |
|
|
|
|
|
|
|
|
|
|
| 69,062 |
|
|
|
|
|
|
|
|
|
Allowance for loan losses |
|
| (9,654 | ) |
|
|
|
|
|
|
|
|
|
| (9,528 | ) |
|
|
|
|
|
|
|
|
|
| (8,433 | ) |
|
|
|
|
|
|
|
|
|
|
|
|
|
|
|
|
|
|
|
|
|
|
|
|
|
|
|
|
|
|
|
|
|
|
|
|
|
|
|
|
|
|
|
|
|
Total assets |
| $ | 1,663,665 |
|
|
|
|
|
|
|
|
|
|
| 1,568,417 |
|
|
|
|
|
|
|
|
|
|
| 1,366,962 |
|
|
|
|
|
|
|
|
|
|
|
|
|
|
|
|
|
|
|
|
|
|
|
|
|
|
|
|
|
|
|
|
|
|
|
|
|
|
|
|
|
|
|
|
|
|
Interest-bearing liabilities: |
|
|
|
|
|
|
|
|
|
|
|
|
|
|
|
|
|
|
|
|
|
|
|
|
|
|
|
|
|
|
|
|
|
|
|
|
|
|
|
|
|
|
|
|
|
|
|
|
|
|
|
|
|
|
|
|
|
|
|
|
|
|
|
|
|
|
|
|
|
|
|
|
|
NOW, MMDA & savings deposits |
| $ | 824,955 |
|
|
| 2,019 |
|
|
| 0.24 | % |
|
| 745,616 |
|
|
| 2,029 |
|
|
| 0.27 | % |
|
| 584,177 |
|
|
| 1,962 |
|
|
| 0.34 | % |
Time deposits |
|
| 99,880 |
|
|
| 562 |
|
|
| 0.56 | % |
|
| 105,127 |
|
|
| 752 |
|
|
| 0.72 | % |
|
| 103,694 |
|
|
| 947 |
|
|
| 0.91 | % |
FHLB borrowings |
|
| - |
|
|
| - |
|
|
| - |
|
|
| - |
|
|
| - |
|
|
| - |
|
|
| 60,820 |
|
|
| 357 |
|
|
| 0.59 | % |
Trust preferred securities |
|
| 15,464 |
|
|
| 529 |
|
|
| 3.42 | % |
|
| 15,464 |
|
|
| 280 |
|
|
| 1.81 | % |
|
| 15,478 |
|
|
| 370 |
|
|
| 2.39 | % |
Other |
|
| 39,016 |
|
|
| 213 |
|
|
| 0.55 | % |
|
| 30,696 |
|
|
| 144 |
|
|
| 0.47 | % |
|
| 29,019 |
|
|
| 200 |
|
|
| 0.69 | % |
|
|
|
|
|
|
|
|
|
|
|
|
|
|
|
|
|
|
|
|
|
|
|
|
|
|
|
|
|
|
|
|
|
|
|
|
|
Total interest-bearing liabilities |
|
| 979,315 |
|
|
| 3,323 |
|
|
| 0.34 | % |
|
| 896,903 |
|
|
| 3,205 |
|
|
| 0.36 | % |
|
| 793,188 |
|
|
| 3,836 |
|
|
| 0.48 | % |
|
|
|
|
|
|
|
|
|
|
|
|
|
|
|
|
|
|
|
|
|
|
|
|
|
|
|
|
|
|
|
|
|
|
|
|
|
Demand deposits |
|
| 555,278 |
|
|
|
|
|
|
|
|
|
|
| 522,114 |
|
|
|
|
|
|
|
|
|
|
| 427,148 |
|
|
|
|
|
|
|
|
|
Other liabilities |
|
| 5,185 |
|
|
|
|
|
|
|
|
|
|
| 1,659 |
|
|
|
|
|
|
|
|
|
|
| 5,339 |
|
|
|
|
|
|
|
|
|
Shareholders' equity |
|
| 123,887 |
|
|
|
|
|
|
|
|
|
|
| 147,741 |
|
|
|
|
|
|
|
|
|
|
| 141,287 |
|
|
|
|
|
|
|
|
|
|
|
|
|
|
|
|
|
|
|
|
|
|
|
|
|
|
|
|
|
|
|
|
|
|
|
|
|
|
|
|
|
|
|
|
|
|
Total liabilities and shareholder's equity |
| $ | 1,663,665 |
|
|
|
|
|
|
|
|
|
|
| 1,568,417 |
|
|
|
|
|
|
|
|
|
|
| 1,366,962 |
|
|
|
|
|
|
|
|
|
|
|
|
|
|
|
|
|
|
|
|
|
|
|
|
|
|
|
|
|
|
|
|
|
|
|
|
|
|
|
|
|
|
|
|
|
|
Net interest spread |
|
|
|
|
| $ | 51,491 |
|
|
| 3.08 | % |
|
|
|
|
| $ | 44,422 |
|
|
| 2.85 | % |
|
|
|
|
| $ | 44,742 |
|
|
| 3.34 | % |
|
|
|
|
|
|
|
|
|
|
|
|
|
|
|
|
|
|
|
|
|
|
|
|
|
|
|
|
|
|
|
|
|
|
|
|
|
Net yield on interest-earning assets |
|
|
|
|
|
|
|
|
|
| 3.22 | % |
|
|
|
|
|
|
|
|
|
| 2.99 | % |
|
|
|
|
|
|
|
|
|
| 3.52 | % |
|
|
|
|
|
|
|
|
|
|
|
|
|
|
|
|
|
|
|
|
|
|
|
|
|
|
|
|
|
|
|
|
|
|
|
|
|
Taxable equivalent adjustment Investment securities |
|
|
|
|
| $ | 383 |
|
|
|
|
|
|
|
|
|
| $ | 448 |
|
|
|
|
|
|
|
|
|
| $ | 620 |
|
|
|
|
|
|
|
|
|
|
|
|
|
|
|
|
|
|
|
|
|
|
|
|
|
|
|
|
|
|
|
|
|
|
|
|
|
|
|
|
|
|
Net interest income |
|
|
|
|
| $ | 51,108 |
|
|
|
|
|
|
|
|
|
| $ | 43,974 |
|
|
|
|
|
|
|
|
|
| $ | 44,122 |
|
|
|
|
|
*Includes U.S. Government agency securities that are non-taxable for state income tax purposes of $13.3 million in 2022, $12.7 million in 2021 and $19.2 million in 2020. A tax rate of 2.50% was used to calculate the tax equivalent yields on these securities in 2022, 2021 and 2020.
Changes in interest income and interest expense can result from variances in both volume and rates. Table 2 describes the impact on the Company’s tax equivalent net interest income resulting from changes in average balances and average rates for the periods indicated. The changes in net interest income due to both volume and rate changes have been allocated to volume and rate changes in proportion to the relationship of the absolute dollar amounts of the changes in each.
| A-7 |
Table 2 - Rate/Volume Variance Analysis-Tax Equivalent Basis |
|
|
|
| ||||||||||||||||||||
|
|
|
|
|
|
|
|
|
|
|
|
|
|
|
|
|
|
| ||||||
|
| December 31, 2022 |
|
| December 31, 2021 |
| ||||||||||||||||||
(Dollars in thousands) |
| Changes in average volume |
|
| Changes in average rates |
|
| Total Increase (Decrease) |
|
| Changes in average volume |
|
| Changes in average rates |
|
| Total Increase (Decrease) |
| ||||||
Interest income: |
|
|
|
|
|
|
|
|
|
|
|
|
|
|
|
|
|
| ||||||
Loans: Net of unearned income |
| $ | 1,837 |
|
|
| 54 |
|
|
| 1,891 |
|
| $ | (1,235 | ) |
|
| 107 |
|
|
| (1,128 | ) |
Investments - taxable |
|
| 1,929 |
|
|
| 849 |
|
|
| 2,778 |
|
|
| 3,489 |
|
|
| (3,149 | ) |
|
| 340 |
|
Investments - nontaxable |
|
| 45 |
|
|
| 508 |
|
|
| 553 |
|
|
| (84 | ) |
|
| (6 | ) |
|
| (90 | ) |
Federal funds sold |
|
| - |
|
|
| - |
|
|
| - |
|
|
| (102 | ) |
|
| (102 | ) |
|
| (204 | ) |
Due from banks |
|
| (268 | ) |
|
| 2,233 |
|
|
| 1,965 |
|
|
| 428 |
|
|
| (297 | ) |
|
| 131 |
|
Total interest income |
|
| 3,543 |
|
|
| 3,644 |
|
|
| 7,187 |
|
|
| 2,496 |
|
|
| (3,447 | ) |
|
| (951 | ) |
|
|
|
|
|
|
|
|
|
|
|
|
|
|
|
|
|
|
|
|
|
|
|
|
|
Interest expense: |
|
|
|
|
|
|
|
|
|
|
|
|
|
|
|
|
|
|
|
|
|
|
|
|
NOW, MMDA & savings deposits |
|
| 205 |
|
|
| (215 | ) |
|
| (10 | ) |
|
| 491 |
|
|
| (424 | ) |
|
| 67 |
|
Time deposits |
|
| (34 | ) |
|
| (156 | ) |
|
| (190 | ) |
|
| 12 |
|
|
| (207 | ) |
|
| (195 | ) |
FHLB borrowings |
|
| - |
|
|
| - |
|
|
| - |
|
|
| (179 | ) |
|
| (178 | ) |
|
| (357 | ) |
Trust preferred securities |
|
| - |
|
|
| 249 |
|
|
| 249 |
|
|
| - |
|
|
| (90 | ) |
|
| (90 | ) |
Other |
|
| 42 |
|
|
| 27 |
|
|
| 69 |
|
|
| 10 |
|
|
| (66 | ) |
|
| (56 | ) |
Total interest expense |
|
| 213 |
|
|
| (95 | ) |
|
| 118 |
|
|
| 334 |
|
|
| (965 | ) |
|
| (631 | ) |
Net interest income |
| $ | 3,330 |
|
|
| 3,739 |
|
|
| 7,069 |
|
| $ | 2,162 |
|
|
| (2,482 | ) |
|
| (320 | ) |
Net interest income on a tax equivalent basis totaled $51.5 million in 2022, as compared to $44.4 million in 2021. The net interest spread, which represents the rate earned on interest-earning assets less the rate paid on interest-bearing liabilities, was 3.08% in 2022, as compared to a net interest spread of 2.85% in 2021. The net yield on interest-earning assets was 3.22% in 2022 and 2.99% in 2021.
Tax equivalent interest income increased $7.2 million in 2022 primarily due to a $1.9 million increase in interest income and fees on loans, a $3.3 million increase in tax equivalent interest income on investment securities and a $2.0 million increase in interest income on balances due from banks. The increase in interest income and fees on loans is primarily due to an increase in total loans and rate increases by the Federal Reserve, partially offset by a $2.4 million decrease in fee income on SBA PPP loans. The increase in interest income on investment securities is primarily due to additional securities purchased with additional cash resulting from an increase in deposits combined with higher yields on securities purchased in 2022. The increase in interest income on balances due from banks is primarily due to rate increases by the Federal Reserve. The yield on interest-earning assets was 3.42% in 2022, as compared to 3.21% in 2021.
Interest expense increased $118,000 in 2022, as compared to 2021. The increase in interest expense is primarily due to an increase in rates paid on interest-bearing liabilities. Average interest-bearing liabilities increased by $82.4 million to $979.3 million in 2022, as compared to $896.9 million in 2021. The cost of funds decreased to 0.34% in 2022 from 0.36% in 2021.
In 2021, net interest income on a tax equivalent basis was $44.4 million, as compared to $44.7 million in 2020. The net interest spread was 2.85% in 2021, as compared to 3.34% in 2020. The net yield on interest-earning assets was 2.99% in 2021, as compared to 3.52% in 2020.
Provision for Loan Losses. Provisions for loan losses are charged to income in order to bring the total allowance for loan losses to a level deemed appropriate by management of the Company based on factors such as management’s judgment as to losses within the Bank’s loan portfolio, including the valuation of impaired loans, loan growth, net charge-offs, changes in the composition of the loan portfolio, delinquencies and management’s assessment of the quality of the loan portfolio and general economic climate.
The provision for loan losses for the year ended December 31, 2022 was $1.5 million, compared to a recovery of $1.2 million for the year ended December 31, 2021. The increase in the provision for loan losses is primarily attributable to an increase in reserves due to an increase in the balance of loans in the general reserve pool. The recovery of provision for loan losses for the year ended December 31, 2021 was primarily attributable to a decrease in reserves on loans with payment modifications made as a result of the COVID-19 pandemic and a decrease in reserves in the general reserve pool. There were no loans with modifications as a result of the COVID-19 pandemic at December 31, 2022 and 2021.
| A-8 |
Net charge-offs for 2022 were $333,000. Net recoveries for 2021 were $610,000. Net charge-offs for 2020 were $1.0 million. The ratio of net charge-offs/(recoveries) to average total loans was 0.03% in 2022, -0.07% in 2021 and 0.11% in 2020. The allowance for loan losses was $10.5 million or 1.02% of total loans outstanding at December 31, 2022. For December 31, 2021 and 2020, the allowance for loan losses amounted to $9.4 million or 1.06% of total loans outstanding and $9.9 million, or 1.04% of total loans outstanding, respectively.
Table 3 presents a summary of net charge off activity for the years ended December 31, 2022, 2021 and 2020.
Table 3 - Net Charge-off Analysis |
|
|
|
|
|
|
|
|
|
| ||||||||||||||
|
|
|
|
|
|
|
|
|
|
|
|
|
|
|
|
|
|
| ||||||
|
| Net charge-offs/(recoveries) |
|
| Net charge-offs/(recoveries) as a percent of average loans outstanding |
| ||||||||||||||||||
|
| Years ended December 31, |
|
| Years ended December 31, |
| ||||||||||||||||||
(Dollars in thousands) |
| 2022 |
|
| 2021 |
|
| 2020 |
|
| 2022 |
|
| 2021 |
|
| 2020 |
| ||||||
Real estate loans |
|
|
|
|
|
|
|
|
|
|
|
|
|
|
|
|
|
| ||||||
Construction and land development |
| $ | - |
|
|
| (121 | ) |
|
| (31 | ) |
|
| 0.00 | % |
|
| -0.13 | % |
|
| -0.03 | % |
Single-family residential |
|
| (101 | ) |
|
| (182 | ) |
|
| (5 | ) |
|
| -0.03 | % |
|
| -0.07 | % |
|
| 0.00 | % |
Single-family residential - Banco de la Gente non-traditional |
|
| - |
|
|
| - |
|
|
| - |
|
|
| 0.00 | % |
|
| 0.00 | % |
|
| 0.00 | % |
Commercial |
|
| (9 | ) |
|
| (52 | ) |
|
| (63 | ) |
|
| 0.00 | % |
|
| -0.02 | % |
|
| -0.02 | % |
Multifamily and farmland |
|
| - |
|
|
| (3 | ) |
|
| - |
|
|
| 0.00 | % |
|
| -0.01 | % |
|
| 0.00 | % |
Total real estate loans |
|
| (110 | ) |
|
| (358 | ) |
|
| (99 | ) |
|
| -0.01 | % |
|
| -0.05 | % |
|
| -0.01 | % |
|
|
|
|
|
|
|
|
|
|
|
|
|
|
|
|
|
|
|
|
|
|
|
|
|
Loans not secured by real estate |
|
|
|
|
|
|
|
|
|
|
|
|
|
|
|
|
|
|
|
|
|
|
|
|
Commercial loans |
|
| (39 | ) |
|
| (493 | ) |
|
| 869 |
|
|
| -0.05 | % |
|
| -0.54 | % |
|
| 0.54 | % |
Farm loans |
|
| - |
|
|
| - |
|
|
| - |
|
|
| 0.00 | % |
|
| 0.00 | % |
|
| 0.00 | % |
Consumer loans (1) |
|
| 482 |
|
|
| 241 |
|
|
| 254 |
|
|
| 7.06 | % |
|
| 3.75 | % |
|
| 3.57 | % |
All other loans |
|
| - |
|
|
| - |
|
|
| 7 |
|
|
| 0.00 | % |
|
| 0.00 | % |
|
| 0.20 | % |
Total loans |
| $ | 333 |
|
|
| (610 | ) |
|
| 1,031 |
|
|
| 0.03 | % |
|
| -0.07 | % |
|
| 0.11 | % |
|
|
|
|
|
|
|
|
|
|
|
|
|
|
|
|
|
|
|
|
|
|
|
|
|
Provision for (recovery of) loan losses for the period |
| $ | 1,472 |
|
| $ | (1,163 | ) |
|
| 4,259 |
|
|
|
|
|
|
|
|
|
|
|
|
|
|
|
|
|
|
|
|
|
|
|
|
|
|
|
|
|
|
|
|
|
|
|
|
|
|
Allowance for loan losses at end of period |
| $ | 10,494 |
|
| $ | 9,355 |
|
|
| 9,908 |
|
|
|
|
|
|
|
|
|
|
|
|
|
|
|
|
|
|
|
|
|
|
|
|
|
|
|
|
|
|
|
|
|
|
|
|
|
|
Total loans at end of period |
| $ | 1,032,608 |
|
| $ | 884,869 |
|
|
| 948,639 |
|
|
|
|
|
|
|
|
|
|
|
|
|
|
|
|
|
|
|
|
|
|
|
|
|
|
|
|
|
|
|
|
|
|
|
|
|
|
Non-accrual loans at end of period |
| $ | 3,728 |
|
| $ | 3,230 |
|
|
| 3,758 |
|
|
|
|
|
|
|
|
|
|
|
|
|
|
|
|
|
|
|
|
|
|
|
|
|
|
|
|
|
|
|
|
|
|
|
|
|
|
Allowance for loan losses as a percent of total loans outstanding at end of period |
|
| 1.02 | % |
|
| 1.06 | % |
|
| 1.04 | % |
|
|
|
|
|
|
|
|
|
|
|
|
|
|
|
|
|
|
|
|
|
|
|
|
|
|
|
|
|
|
|
|
|
|
|
|
|
Non-accrual loans as a percent of total loans outstanding at end of period |
|
| 0.36 | % |
|
| 0.37 | % |
|
| 0.40 | % |
|
|
|
|
|
|
|
|
|
|
|
|
|
|
|
|
|
|
|
|
|
|
|
|
|
|
|
|
|
|
|
|
|
|
|
|
|
Allowance for loan losses as a percent of nonaccrual loans at end of period |
|
| 281.49 | % |
|
| 289.63 | % |
|
| 263.58 | % |
|
|
|
|
|
|
|
|
|
|
|
|
(1) The loss ratio for consumer loans is elevated because overdraft charge-offs related to DDA and NOW accounts are reported in consumer loan charge-offs and recoveries. The net overdraft charge-offs are not considered material and are therefore not shown separately.
Please see the section below entitled “Allowance for Loan Losses” for a more complete discussion of the Bank’s policy for addressing potential loan losses.
Non-Interest Income. Non-interest income was $26.7 million for the year ended December 31, 2022, compared to $24.9 million for the year ended December 31, 2021. The increase in non-interest income is primarily attributable to a $2.8 million increase in appraisal management fee income due to an increase in appraisal volume and a $1.3 million increase in service charge income, primarily due to service charge changes implemented in March 2022, which were partially offset by a $2.1 million decrease in mortgage banking income due to a decrease in mortgage loan volume and additional mortgage loans being retained in the Bank’s portfolio.
Non-interest income was $24.9 million for the year ended December 31, 2021, compared to $22.9 million for the year ended December 31, 2020. The increase in non-interest income is primarily attributable to a $2.1 million increase in appraisal management fee income due to an increase in the volume of appraisals and a $1.7 million increase in miscellaneous non-interest income primarily due to an increase in debit card income resulting from increased debit card activity and an increase in income on Small Business Investment Company (“SBIC”) investments. These increases in non-interest income were partially offset by a $2.6 million decrease in gains on sale of securities.
| A-9 |
The Company periodically evaluates its investments for any impairment which would be deemed other-than-temporary. No investment impairments were deemed other-than-temporary in 2022, 2021 or 2020.
Table 4 presents a summary of non-interest income for the years ended December 31, 2022, 2021 and 2020.
Table 4 - Non-Interest Income |
|
|
|
|
|
|
|
|
| |||
|
|
|
|
|
|
|
|
|
| |||
(Dollars in thousands) |
| 2022 |
|
| 2021 |
|
| 2020 |
| |||
Service charges |
| $ | 5,290 |
|
| $ | 3,921 |
|
| $ | 3,528 |
|
Other service charges and fees |
|
| 734 |
|
|
| 803 |
|
|
| 742 |
|
Gain on sale of securities |
|
| - |
|
|
| - |
|
|
| 2,639 |
|
Mortgage banking income |
|
| 393 |
|
|
| 2,505 |
|
|
| 2,469 |
|
Insurance and brokerage commissions |
|
| 945 |
|
|
| 1,035 |
|
|
| 897 |
|
Gain/(loss) on sale and write-down of other real estate |
|
| - |
|
|
| 21 |
|
|
| (47 | ) |
Visa debit card income |
|
| 4,901 |
|
|
| 5,045 |
|
|
| 4,237 |
|
Appraisal management fee income |
|
| 11,663 |
|
|
| 8,890 |
|
|
| 6,754 |
|
Miscellaneous |
|
| 2,763 |
|
|
| 2,699 |
|
|
| 1,695 |
|
Total non-interest income |
| $ | 26,689 |
|
| $ | 24,919 |
|
| $ | 22,914 |
|
Non-Interest Expense. Non-interest expense was $56.0 million for the year ended December 31, 2022, compared to $51.1 million for the year ended December 31, 2021. The increase in non-interest expense is primarily attributable to a $2.2 million increase in appraisal management fee expense due to an increase in appraisal volume and a $1.6 million increase in salaries and employee benefits expense primarily due to increases in insurance costs and salary expense and a $421,000 increase in other non-interest expenses primarily due to increases in consulting expense, online banking expense and office supplies expense.
Non-interest expense was $51.1 million for the year ended December 31, 2021, compared to $48.9 million for the year ended December 31, 2020. The increase in non-interest expense was primarily attributable to a $968,000 increase in salaries and employee benefits expense primarily due to an increase in incentive compensation and a $1.8 million increase in appraisal management fee expense due to an increase in the volume of appraisals.
Table 5 presents a summary of non-interest expense for the years ended December 31, 2022, 2021 and 2020.
Table 5 - Non-Interest Expense |
|
|
|
|
|
|
|
|
| |||
|
|
|
|
|
|
|
|
|
| |||
(Dollars in thousands) |
| 2022 |
|
| 2021 |
|
| 2020 |
| |||
Salaries and employee benefits |
| $ | 26,130 |
|
| $ | 24,506 |
|
| $ | 23,538 |
|
Occupancy expense |
|
| 8,048 |
|
|
| 7,858 |
|
|
| 7,933 |
|
Office supplies |
|
| 532 |
|
|
| 374 |
|
|
| 528 |
|
FDIC deposit insurance |
|
| 461 |
|
|
| 415 |
|
|
| 263 |
|
Visa debit card expense |
|
| 1,224 |
|
|
| 1,000 |
|
|
| 1,012 |
|
Professional services |
|
| 451 |
|
|
| 489 |
|
|
| 502 |
|
Postage |
|
| 238 |
|
|
| 230 |
|
|
| 190 |
|
Telephone |
|
| 691 |
|
|
| 730 |
|
|
| 794 |
|
Director fees and expense |
|
| 454 |
|
|
| 381 |
|
|
| 360 |
|
Advertising |
|
| 693 |
|
|
| 536 |
|
|
| 787 |
|
Consulting fees |
|
| 1,464 |
|
|
| 1,337 |
|
|
| 1,078 |
|
Taxes and licenses |
|
| 277 |
|
|
| 254 |
|
|
| 295 |
|
Foreclosure/OREO expense |
|
| 7 |
|
|
| 5 |
|
|
| 20 |
|
Internet banking expense |
|
| 949 |
|
|
| 768 |
|
|
| 729 |
|
FHLB advance prepayment penalty |
|
| - |
|
|
| - |
|
|
| 1,100 |
|
Appraisal management fee expense |
|
| 9,264 |
|
|
| 7,112 |
|
|
| 5,274 |
|
Other operating expense |
|
| 5,147 |
|
|
| 5,132 |
|
|
| 4,528 |
|
Total non-interest expense |
| $ | 56,030 |
|
| $ | 51,127 |
|
| $ | 48,931 |
|
| A-10 |
Income Taxes. The Company reported income tax expense of $4.2 million, $3.8 million and $2.5 million for the years ended December 31, 2022, 2021 and 2020, respectively. The Company’s effective tax rates were 20.56%, 20.05% and 17.98% in 2022, 2021 and 2020, respectively. The increase in the effective tax rate in 2021 and 2022 was primarily due to a reduction in non-taxable investments combined with an increase in earnings before income taxes.
Liquidity. The objectives of the Company’s liquidity policy are to provide for the availability of adequate funds to meet the needs of loan demand, deposit withdrawals, maturing liabilities and to satisfy regulatory requirements. Both deposit and loan customer cash needs can fluctuate significantly depending upon business cycles, economic conditions and yields and returns available from alternative investment opportunities. In addition, the Company’s liquidity is affected by off-balance sheet commitments to lend in the form of unfunded commitments to extend credit and standby letters of credit. As of December 31, 2022, such unfunded commitments to extend credit were $382.7 million, while commitments in the form of standby letters of credit totaled $4.4 million.
The Company uses several funding sources to meet its liquidity requirements. The primary funding source is core deposits, a non-GAAP measure, which includes demand deposits, savings accounts and non-brokered certificates of deposits of denominations less than $250,000. Management believes it is useful to calculate and present core deposits because of the positive impact this low cost funding source provides to the Bank’s funding base The Company considers these to be a stable portion of the Company’s liability mix and the result of on-going consumer and commercial banking relationships. As of December 31, 2022, the Company’s core deposits totaled $1.4 billion, or 98% of total deposits.
The Bank’s five largest deposit relationships, including securities sold under agreements to repurchase, amounted to $117.0 million and $118.9 million at December 31, 2022 and 2021, respectively. These balances represent 7.89% of total deposits and securities sold under agreements to repurchase combined at December 31, 2022, as compared to 8.20% of total deposits and securities sold under agreements to repurchase combined at December 31, 2021. Total deposits for the five largest relationships referenced above amounted to $85.7 million, or 5.97% of total deposits at December 31, 2022, as compared to $100.5 million, or 7.12% of total deposits at December 31, 2021. Total securities sold under agreements to repurchase for the five largest relationships referenced above amounted to $31.4 million, or 65.76% of total securities sold under agreements to repurchase at December 31, 2022, as compared to $18.3 million, or 49.44% of total securities sold under agreements to repurchase at December 31, 2021.
The other sources of funding for the Company are through large denomination certificates of deposit, including brokered deposits, federal funds purchased, securities under agreement to repurchase and FHLB borrowings. The Bank is also able to borrow from the Federal Reserve Bank (“FRB”) on a short-term basis. The Bank’s policies include the ability to access wholesale funding up to 40% of total assets. The Bank’s wholesale funding includes FHLB borrowings, FRB borrowings, brokered deposits and internet certificates of deposit. The Bank’s ratio of wholesale funding to total assets was 0.92% as of December 31, 2022.
The Bank has a line of credit with the FHLB equal to 20% of the Bank’s total assets, with no balances outstanding at December 31, 2022. At December 31, 2022, the carrying value of loans pledged as collateral totaled approximately $149.4 million. The remaining availability under the line of credit with the FHLB was $86.5 million at December 31, 2022. The Bank had no borrowings from the FRB at December 31, 2022. FRB borrowings are collateralized by a blanket assignment on all qualifying loans that the Bank owns which are not pledged to the FHLB. At December 31, 2022, the carrying value of loans pledged as collateral to the FRB totaled approximately $585.0 million. Availability under the line of credit with the FRB was $445.1 million at December 31, 2021.
The Bank also had the ability to borrow up to $110.5 million for the purchase of overnight federal funds from five correspondent financial institutions as of December 31, 2022.
The liquidity ratio for the Bank, which is defined as net cash, interest-bearing deposits with banks, federal funds sold and certain investment securities, as a percentage of net deposits and short-term liabilities was 30.32%, 43.28% and 28.12% at December 31, 2022, 2021 and 2020, respectively. The minimum required liquidity ratio as defined in the Bank’s Asset/Liability and Interest Rate Risk Management Policy for on balance sheet liquidity was 10% at December 31, 2022, 2021 and 2020.
As disclosed in the Company’s Consolidated Statements of Cash Flows included elsewhere herein, net cash provided by operating activities was approximately $22.7 million during 2022. Net cash used in investing activities was $256.0 million during 2021 and net cash provided by financing activities was $27.4 million during 2022.
Asset Liability and Interest Rate Risk Management. The objective of the Company’s Asset Liability and Interest Rate Risk strategies is to identify and manage the sensitivity of net interest income to changing interest rates and to minimize the interest rate risk between interest-earning assets and interest-bearing liabilities at various maturities. This is done in conjunction with the need to maintain adequate liquidity and the overall goal of maximizing net interest income. Table 6 presents an interest rate sensitivity analysis for the interest-earning assets and interest-bearing liabilities for the year ended December 31, 2022.
| A-11 |
| Table 6 - Interest Sensitivity Analysis |
|
|
|
|
|
|
|
|
|
|
|
|
|
|
|
|
|
| ||||||
|
|
|
|
|
|
|
|
|
|
|
|
|
|
|
|
|
|
| ||||||
(Dollars in thousands) |
| Immediate |
|
| 1-3 months |
|
| 4-12 months |
|
| Total Within One Year |
|
| Over One Year & Non-sensitive |
|
| Total |
| ||||||
| Interest-earning assets: |
|
|
|
|
|
|
|
|
|
|
|
|
|
|
|
|
|
| ||||||
| Loans |
| $ | 197,430 |
|
|
| 5,381 |
|
|
| 19,499 |
|
|
| 222,310 |
|
|
| 810,298 |
|
|
| 1,032,608 |
|
| Mortgage loans held for sale |
|
| 211 |
|
|
| - |
|
|
| - |
|
|
| 211 |
|
|
| - |
|
|
| 211 |
|
| Investment securities available for sale |
|
| - |
|
|
| 1,162 |
|
|
| 1,691 |
|
|
| 2,853 |
|
|
| 442,541 |
|
|
| 445,394 |
|
| Interest-bearing deposit accounts |
|
| 21,535 |
|
|
| - |
|
|
| - |
|
|
| 21,535 |
|
|
| - |
|
|
| 21,535 |
|
| Other interest-earning assets |
|
| - |
|
|
| - |
|
|
| - |
|
|
| - |
|
|
| 4,132 |
|
|
| 4,132 |
|
| Total interest-earning assets |
|
| 219,176 |
|
|
| 6,543 |
|
|
| 21,190 |
|
|
| 246,909 |
|
|
| 1,256,971 |
|
|
| 1,503,880 |
|
|
|
|
|
|
|
|
|
|
|
|
|
|
|
|
|
|
|
|
|
|
|
|
|
|
| Interest-bearing liabilities: |
|
|
|
|
|
|
|
|
|
|
|
|
|
|
|
|
|
|
|
|
|
|
|
|
| NOW, savings, and money market deposits |
|
| 814,128 |
|
|
| - |
|
|
| - |
|
|
| 814,128 |
|
|
| - |
|
|
| 814,128 |
|
| Time deposits |
|
| 15,035 |
|
|
| 9,189 |
|
|
| 34,875 |
|
|
| 59,099 |
|
|
| 38,900 |
|
|
| 97,999 |
|
Securities sold under agreement to repurchase |
|
| 47,688 |
|
|
| - |
|
|
| - |
|
|
| 47,688 |
|
|
| - |
|
|
| 47,688 |
|
| Trust preferred securities |
|
| - |
|
|
| 15,464 |
|
|
| - |
|
|
| 15,464 |
|
|
| - |
|
|
| 15,464 |
|
| Total interest-bearing liabilities |
|
| 876,851 |
|
|
| 24,653 |
|
|
| 34,875 |
|
|
| 936,379 |
|
|
| 38,900 |
|
|
| 975,279 |
|
|
|
|
|
|
|
|
|
|
|
|
|
|
|
|
|
|
|
|
|
|
|
|
|
|
| Interest-sensitive gap |
| $ | (657,675 | ) |
|
| (18,110 | ) |
|
| (13,685 | ) |
|
| (689,470 | ) |
|
| 1,218,071 |
|
|
| 528,601 |
|
|
|
|
|
|
|
|
|
|
|
|
|
|
|
|
|
|
|
|
|
|
|
|
|
|
| Cumulative interest-sensitive gap |
| $ | (657,675 | ) |
|
| (675,785 | ) |
|
| (689,470 | ) |
|
| (689,470 | ) |
|
| 528,601 |
|
|
|
|
|
|
|
|
|
|
|
|
|
|
|
|
|
|
|
|
|
|
|
|
|
|
|
|
|
|
| Interest-earning assets as a percentage of interest-bearing liabilities |
|
| 25.00 | % |
|
| 26.54 | % |
|
| 60.76 | % |
|
| 26.37 | % |
|
| 3,231.29 | % |
|
|
|
|
The Company manages its exposure to fluctuations in interest rates through policies established by the Asset/Liability Committee (“ALCO”) of the Bank. The ALCO meets quarterly and has the responsibility for approving asset/liability management policies, formulating and implementing strategies to improve balance sheet positioning and/or earnings and reviewing the interest rate sensitivity of the Company. ALCO seeks to minimize interest rate risk between interest-earning assets and interest-bearing liabilities by attempting to minimize wide fluctuations in net interest income due to interest rate movements. The ability to control these fluctuations has a direct impact on the profitability of the Company. Management monitors this activity on a regular basis through analysis of its portfolios to determine the difference between rate sensitive assets and rate sensitive liabilities.
The Company’s rate sensitive assets are those earning interest at variable rates and those with contractual maturities within one year. Rate sensitive assets therefore include both loans and available for sale (“AFS”) securities. Rate sensitive liabilities include interest-bearing checking accounts, money market deposit accounts, savings accounts, time deposits and borrowed funds. At December 31, 2022, rate sensitive assets and rate sensitive liabilities totaled $1.6 billion and $979.0 million, respectively.
Included in the rate sensitive assets are $185.2 million in variable rate loans indexed to prime rate subject to immediate repricing upon changes by the Federal Open Market Committee (“FOMC”). The Bank utilizes interest rate floors on certain variable rate loans to protect against further downward movements in the prime rate. At December 31, 2022, the Bank had $111.6 million in loans with interest rate floors. The floors were in effect on $8,000 of these loans.
An analysis of the Company’s financial condition and growth can be made by examining the changes and trends in interest-earning assets and interest-bearing liabilities. A discussion of these changes and trends follows.
Analysis of Financial Condition
Investment Securities. The composition of the investment securities portfolio reflects the Company’s investment strategy of maintaining an appropriate level of liquidity while providing a relatively stable source of income. The investment portfolio also provides a balance to interest rate risk and credit risk in other categories of the balance sheet while providing a vehicle for the investment of available funds, furnishing liquidity, and supplying securities to pledge as required collateral for certain deposits.
All of the Company’s investment securities are held in the available for sale (“AFS”) category. At December 31, 2022 the market value of AFS securities totaled $445.4 million, as compared to $406.5 million and $245.2 million at December 31, 2021 and 2020, respectively.
| A-12 |
The Company’s investment portfolio consists of U.S. Government sponsored enterprise securities, municipal securities, U.S. Treasury securities, U.S. Government sponsored enterprise mortgage-backed securities, trust preferred securities and equity securities. AFS securities averaged $467.5 million in 2022, $349.6 million in 2021 and $200.8 million in 2020. Yield information does not give effect to changes in fair value that are reflected as a component of shareholders’ equity. Yields are calculated on a tax equivalent basis. Yields and interest income on tax-exempt investments have been adjusted to a tax equivalent basis using an effective tax rate of 22.98% for securities that are both federal and state tax exempt and an effective tax rate of 20.48% for federal tax-exempt securities.
Loans. The loan portfolio is the largest category of the Company’s earning assets and is comprised of commercial loans, real estate mortgage loans, real estate construction loans and consumer loans. The Bank makes loans and extensions of credit primarily within the Catawba Valley region of North Carolina, which encompasses Catawba, Alexander, Iredell and Lincoln counties and also in Mecklenburg, Wake, Rowan and Forsyth counties in North Carolina.
Although the Bank has a diversified loan portfolio, a substantial portion of the loan portfolio is collateralized by real estate, which is dependent upon the real estate market. Real estate mortgage loans include both commercial and residential mortgage loans. At December 31, 2022, the Bank had $101.5 million in residential mortgage loans, $101.1 million in home equity loans and $610.0 million in commercial mortgage loans, which include $472.3 million secured by commercial property and $137.7 million secured by residential property. Residential mortgage loans include $20.0 million in non-traditional mortgage loans from the former Banco division of the Bank. All residential mortgage loans are originated as fully amortizing loans, with no negative amortization.
The mortgage loans originated in the traditional banking offices are generally 15 –30-year fixed rate loans with attributes that prevent the loans from being sellable in the secondary market. These factors may include higher loan-to-value ratio, limited documentation on income, non-conforming appraisal or non-conforming property type. These loans are generally made to existing Bank customers and have been originated throughout the Bank’s seven county service area, with no geographic concentration.
As of December 31, 2022, gross loans outstanding were $1.0 billion, as compared to $884.9 million at December 31, 2021. Average loans represented 59% and 61% of average total earning assets for the years ended December 31, 2022 and 2021, respectively. The Bank had $211,000 and $3.6 million in mortgage loans held for sale as of December 31, 2022 and 2021, respectively.
Past due TDR loans and non-accrual TDR loans totaled $3.7 million and $2.2 million at December 31, 2022 and December 31, 2021, respectively. The terms of these loans have been renegotiated to provide a concession to original terms, including a reduction in principal or interest as a result of the deteriorating financial position of the borrower. There were no performing loans classified as TDR loans at December 31, 2022 and December 31, 2021.
On March 27, 2020, President Trump signed the CARES Act, which established a $2 trillion economic stimulus package, including cash payments to individuals, supplemental unemployment insurance benefits and a $349 billion loan program administered through the Small Business Administration (“SBA”) Paycheck Protection Program (“PPP”). Under the PPP, small businesses, sole proprietorships, independent contractors and self-employed individuals were able to apply for loans from existing SBA lenders and other approved regulated lenders, subject to certain limitations and eligibility criteria. A second round of PPP funding provided a total of $320 billion additional funding for the PPP. The Bank participated as a lender in the PPP. Total PPP loans originated during the years ended December 31, 2020 and 2021 amounted to $128.1 million. The outstanding balance of PPP loans was $103,000 and $18.0 million at December 31, 2022 and 2021, respectively. These loans are classified as commercial loans in the tables above. The Bank recognized $948,000 and $3.4 million of PPP loan fee income for the year ended December 31, 2022 and year ended December, 2021, respectively. PPP loan fee income is reported in interest and fees on loans in the Consolidated Statements of Earnings on page A-23.
There were no loans with existing modifications as a result of the COVID-19 pandemic at December 31, 2022 and 2021. At December 31, 2022, the Bank continues to maintain a pool of loans that were previously modified as a result of the COVID-19 pandemic. The loan balances associated with those loans that were previously modified as a result of the COVID-19 pandemic related modifications have been grouped into their own pool within the Bank’s ALLL model as management considers that they have a higher risk profile, and a higher reserve rate has been applied to this pool. As such, a higher reserve rate has been applied to this pool. Loans included in this pool totaled $70.5 million and $88.7 million at December 31, 2022 and December 31, 2021, respectively. Loan payment modifications associated with the COVID-19 pandemic are not classified as TDR due to Section 4013 of the CARES Act, which provides that a qualified loan modification is exempt by law from classification as a TDR pursuant to GAAP.
| A-13 |
Table 7 identifies the maturities of all loans as of December 31, 2022 and addresses the sensitivity of these loans to changes in interest rates.
Table 7 - Maturity and Repricing Data for Loans |
|
|
|
|
|
|
|
|
|
|
|
|
| |||||||
|
|
|
|
|
|
|
|
|
|
|
|
|
|
|
| |||||
(Dollars in thousands) |
| Within one year or less |
|
| After one year through five years |
|
| After five years through 15 years |
|
| After fifteen years |
|
| Total loans |
| |||||
Real estate loans |
|
|
|
|
|
|
|
|
|
|
|
|
|
|
| |||||
Construction and land development |
| $ | 39,401 |
|
|
| 32,795 |
|
|
| 41,664 |
|
|
| 586 |
|
|
| 114,446 |
|
Single-family residential |
|
| 116,876 |
|
|
| 83,201 |
|
|
| 78,754 |
|
|
| 43,431 |
|
|
| 322,262 |
|
Single-family residential- Banco de la Gente stated income |
|
| 9,432 |
|
|
| - |
|
|
| 5,384 |
|
|
| 5,203 |
|
|
| 20,019 |
|
Commercial |
|
| 46,751 |
|
|
| 183,754 |
|
|
| 170,049 |
|
|
| 6,196 |
|
|
| 406,750 |
|
Multifamily and farmland |
|
| 3,933 |
|
|
| 23,052 |
|
|
| 19,598 |
|
|
| 18,979 |
|
|
| 65,562 |
|
Total real estate loans |
|
| 216,393 |
|
|
| 322,802 |
|
|
| 315,449 |
|
|
| 74,395 |
|
|
| 929,039 |
|
|
|
|
|
|
|
|
|
|
|
|
|
|
|
|
|
|
|
|
|
|
| Loans not secured by real estate |
|
|
|
|
|
|
|
|
|
|
|
|
|
|
|
|
|
|
|
|
Commercial loans |
|
| 37,081 |
|
|
| 22,005 |
|
|
| 19,461 |
|
|
| 2,760 |
|
|
| 81,307 |
|
Farm loans |
|
| 473 |
|
|
| 465 |
|
|
| - |
|
|
| - |
|
|
| 938 |
|
Consumer loans |
|
| 2,972 |
|
|
| 2,795 |
|
|
| 1,067 |
|
|
| - |
|
|
| 6,834 |
|
All other loans |
|
| 7,096 |
|
|
| 1,959 |
|
|
| 5,435 |
|
|
| - |
|
|
| 14,490 |
|
| Total loans |
| $ | 264,015 |
|
|
| 350,026 |
|
|
| 341,412 |
|
|
| 77,155 |
|
|
| 1,032,608 |
|
|
|
|
|
|
|
|
|
|
|
|
|
|
|
|
|
|
|
|
|
|
| Total fixed rate loans |
| $ | 41,705 |
|
|
| 337,736 |
|
|
| 331,308 |
|
|
| 77,155 |
|
|
| 787,904 |
|
| Total floating rate loans |
|
| 222,310 |
|
|
| 12,290 |
|
|
| 10,104 |
|
|
| - |
|
|
| 244,704 |
|
|
|
|
|
|
|
|
|
|
|
|
|
|
|
|
|
|
|
|
|
|
| Total loans |
| $ | 264,015 |
|
|
| 350,026 |
|
|
| 341,412 |
|
|
| 77,155 |
|
|
| 1,032,608 |
|
In the normal course of business, there are various commitments outstanding to extend credit that are not reflected in the financial statements. At December 31, 2022, outstanding loan commitments totaled $382.7 million. Commitments to extend credit are agreements to lend to a customer as long as there is no violation of any condition established in the commitment contract. Commitments generally have fixed expiration dates or other termination clauses and may require payment of a fee. Since many of the commitments may expire without being drawn upon, the total commitment amounts do not necessarily represent future cash requirements. Additional information regarding commitments is provided below in the section entitled “Commitments and Contingencies” and in Note 11 to the Consolidated Financial Statements.
Allowance for Loan Losses (ALLL). The allowance for loan losses reflects management’s assessment and estimate of the risks associated with extending credit and its evaluation of the quality of the loan portfolio. The Bank periodically analyzes the loan portfolio in an effort to review asset quality and to establish an allowance that management believes will be adequate in light of anticipated risks and loan losses. In assessing the adequacy of the allowance, size, quality and risk of loans in the portfolio are reviewed. Other factors considered are:
| · | the Bank’s loan loss experience; |
| · | the amount of past due and non-performing loans; |
| · | specific known risks; |
| · | the status and amount of other past due and non-performing assets; |
| · | underlying estimated values of collateral securing loans; |
| · | current and anticipated economic conditions (including those arising out of the COVID-19 pandemic); and |
| · | other factors which management believes affect the allowance for potential credit losses. |
Management uses several measures to assess and monitor the credit risks in the loan portfolio, including a loan grading system that begins upon loan origination and continues until the loan is collected or collectability becomes doubtful. Upon loan origination, the Bank’s originating loan officer evaluates the quality of the loan and assigns one of eight risk grades. The loan officer monitors the loan’s performance and credit quality and makes changes to the credit grade as conditions warrant. When originated or renewed, all loans over a certain dollar amount receive in-depth reviews and risk assessments by the Bank’s Credit Administration. Before making any changes in these risk grades, management considers assessments as determined by the third-party credit review firm (as described below), regulatory examiners and the Bank’s Credit Administration. Any issues regarding the risk assessments are addressed by the Bank’s senior credit administrators and factored into management’s decision to originate or renew the loan. The Bank Board reviews, on a monthly basis, an analysis of the Bank’s reserves relative to the range of reserves estimated by the Bank’s Credit Administration.
| A-14 |
As an additional measure, the Bank engages an independent third party to review the underwriting, documentation and risk grading analyses. This independent third party reviews and evaluates loan relationships greater than or equal to $1.5 million as well as a periodic sample of commercial relationships with exposures below $1.5 million, excluding loans in default, and loans in process of litigation or liquidation. The third party’s evaluation and report is shared with management and the Board of Directors of the Bank (“Bank Board”).
Management considers certain commercial loans with weak credit risk grades to be individually impaired and measures such impairment based upon available cash flows and the value of the collateral. Allowance or reserve levels are estimated for all other graded loans in the portfolio based on their assigned credit risk grade, type of loan and other matters related to credit risk.
Management uses the information developed from the procedures described above in evaluating and grading the loan portfolio. This continual grading process is used to monitor the credit quality of the loan portfolio and to assist management in estimating the allowance. The provision for loan losses charged or credited to earnings is based upon management’s judgment of the amount necessary to maintain the allowance at a level appropriate to absorb probable incurred losses in the loan portfolio at the balance sheet date. The amount each quarter is dependent upon many factors, including growth and changes in the composition of the loan portfolio, net charge-offs, delinquencies, management’s assessment of loan portfolio quality, the value of collateral, and other macro-economic factors and trends. The evaluation of these factors is performed quarterly by management through an analysis of the appropriateness of the allowance.
The allowance is comprised of three components: specific reserves, general reserves and unallocated reserves. After a loan has been identified as impaired, management measures impairment. When the measure of the impaired loan is less than the recorded investment in the loan, the amount of the impairment is recorded as a specific reserve. These specific reserves are determined on an individual loan basis based on management’s current evaluation of the Bank’s loss exposure for each credit, given the appraised value of any underlying collateral. Loans for which specific reserves are provided are excluded from the general allowance calculations as described below.
The general allowance reflects reserves established under GAAP for collective loan impairment. These reserves are based upon historical net charge-offs using the greater of the last two, three, four, or five years’ loss experience. This charge-off experience may be adjusted to reflect the effects of current conditions. The Bank considers information derived from its loan risk ratings and external data related to industry and general economic trends in establishing reserves. Qualitative factors applied in the Bank’s ALLL model include the impact to the economy from the COVID-19 pandemic and reserves on loans with payment modifications as a result of the COVID-19 pandemic. There were no loans with existing modifications as a result of the COVID-19 pandemic at December 31, 2022 and 2021. At December 31, 2022, the Bank continues to maintain a pool of loans that were previously modified as a result of the COVID-19 pandemic. The loan balances associated with those loans that were previously modified as a result of the COVID-19 pandemic related modifications have been grouped into their own pool within the Bank’s ALLL model as management considers that they have a higher risk profile, and a higher reserve rate has been applied to this pool. As such, a higher reserve rate has been applied to this pool. Loans included in this pool totaled $70.5 million and $88.7 million at December 31, 2022 and December 31, 2021, respectively.
The unallocated allowance is determined through management’s assessment of probable losses that are in the portfolio but are not adequately captured by the other two components of the allowance, including consideration of current economic and business conditions and regulatory requirements. The unallocated allowance also reflects management’s acknowledgement of the imprecision and subjectivity that underlie the modeling of credit risk. Due to the subjectivity involved in determining the overall allowance, including the unallocated portion, the unallocated portion may fluctuate from period to period based on management’s evaluation of the factors affecting the assumptions used in calculating the allowance.
There were no significant changes in the estimation methods or fundamental assumptions used in the evaluation of the allowance for the year ended December 31, 2022 as compared to the year ended December 31, 2021. Revisions, estimates and assumptions may be made in any period in which the supporting factors indicate that loss levels may vary from the previous estimates. The Company adopted CECL as of January 1, 2023.
Effective December 31, 2012, certain mortgage loans from the former Banco division of the Bank were analyzed separately from other single-family residential loans in the Bank’s loan portfolio. These loans are first mortgage loans made to the Latino market, primarily in Mecklenburg, North Carolina and surrounding counties. These loans are non-traditional mortgages in that the customer normally did not have a credit history, so all credit information was accumulated by the loan officers.
PPP loans are excluded from the allowance as PPP loans are 100 percent guaranteed by the SBA.
| A-15 |
Various regulatory agencies, as an integral part of their examination process, periodically review the Bank’s allowance. Such agencies may require adjustments to the allowance based on their judgments of information available to them at the time of their examinations. Management believes it has established the allowance for credit losses pursuant to GAAP, and has taken into account the views of its regulators and the current economic environment. Management considers the allowance adequate to cover the estimated losses inherent in the Bank’s loan portfolio as of the date of the financial statements. Although management uses the best information available to make evaluations, significant future additions to the allowance may be necessary based on changes in economic and other conditions, thus adversely affecting the operating results of the Company.
Non-performing Assets. Non-performing assets were $3.7 million or 0.23% of total assets at December 31, 2022, compared to $3.2 million or 0.20% of total assets at December 31, 2021. Non-performing assets include $3.7 million in commercial and residential mortgage loans and $8,000 in other loans at December 31, 2022, compared to $3.2 million in commercial and residential mortgage loans and $51,000 in other loans at December 31, 2021. The Bank had no other real estate owned as of December 31, 2022 and 2021. The Bank had no repossessed assets as of December 31, 2022 and 2021.
At December 31, 2022, the Bank had non-performing loans, defined as non-accrual and accruing loans past due more than 90 days, of $3.7 million or 0.36% of total loans. Non-performing loans at December 31, 2021 were $3.2 million or 0.38% of total loans.
Management continually monitors the loan portfolio to ensure that all loans potentially having a material adverse impact on future operating results, liquidity or capital resources have been classified as non-performing. Should economic conditions deteriorate, the inability of distressed customers to service their existing debt could cause higher levels of non-performing loans. Management expects the future level of non-accrual loans to continue to be in-line with the level of non-accrual loans at December 31, 2022 and 2021.
It is the general policy of the Bank to stop accruing interest income when a loan is placed on non-accrual status and any interest previously accrued but not collected is reversed against current income. Generally, a loan is placed on non-accrual status when it is over 90 days past due and there is reasonable doubt that all principal will be collected.
Deposits. The Bank primarily uses deposits to fund its loan and investment portfolios. The Bank offers a variety of deposit accounts to individuals and businesses. Deposit accounts include checking, savings, money market and time deposits. Total deposits were $1.4 billion as of December 31, 2022 and 2021. Core deposits, a non-GAAP measure, which include noninterest-bearing demand deposits, NOW, MMDA, savings and non-brokered certificates of deposit of denominations less than $250,000, were $1.4 billion at December 31, 2022 and 2021. Management believes it is useful to calculate and present core deposits because of the positive impact this low cost funding source provides to the Bank’s funding base.
Time deposits in amounts of $250,000 or more totaled $31.0 million and $26.3 million at December 31, 2022 and 2021, respectively. At December 31, 2022 and 2021, the Bank had approximately $15.2 million and $11.1 million, respectively, in time deposits purchased through third party brokers, including certificates of deposit participated through the Certificate of Deposit Account Registry Service (“CDARS”) on behalf of local customers. CDARS balances totaled $7.1 million and $3.0 million as of December 31, 2022 and 2021, respectively. The weighted average rate of brokered deposits as of December 31, 2022 and 2021 was 1.27% and 1.49%, respectively.
Table 8 is a summary of the maturity distribution of time deposits in amounts of $250,000 or more as of December 31, 2022.
Table 8 - Maturities of Time Deposits of $250,000 or greater |
|
|
| |
|
|
|
| |
(Dollars in thousands) |
| 2022 |
| |
Three months or less |
| $ | 7,589 |
|
Over three months through six months |
|
| 4,732 |
|
Over six months through twelve months |
|
| 5,802 |
|
Over twelve months |
|
| 12,878 |
|
Total |
| $ | 31,001 |
|
Borrowed Funds. The Bank has access to various short-term borrowings, including the purchase of federal funds and borrowing arrangements from the FHLB and other financial institutions. There were no FHLB borrowings outstanding at December 31, 2022 and 2021. Average FHLB borrowings for 2022 and 2021 were zero. Additional information regarding FHLB borrowings is provided in Note 7 to the Consolidated Financial Statements.
| A-16 |
The Bank had no borrowings from the FRB at December 31, 2021 and 2021. FRB borrowings are collateralized by a blanket assignment on all qualifying loans that the Bank owns which are not pledged to the FHLB. At December 31, 2022, the carrying value of loans pledged as collateral totaled approximately $585.0 million.
Securities sold under agreements to repurchase were $47.7 million at December 31, 2022, compared to $37.1 million at December 31, 2021.
Junior subordinated debentures were $15.5 million at December 31, 2022 and December 31, 2021.
Contractual Obligations and Off-Balance Sheet Arrangements. The Company’s contractual obligations include junior subordinated debentures, as well as certain payments under current lease agreements. Other commitments include commitments to extend credit.
The Company enters into derivative contracts to manage various financial risks. A derivative is a financial instrument that derives its cash flows, and therefore its value, by reference to an underlying instrument, index or referenced interest rate. Derivative contracts are carried at fair value on the consolidated balance sheet with the fair value representing the net present value of expected future cash receipts or payments based on market interest rates as of the balance sheet date. Derivative contracts are written in amounts referred to as notional amounts, which only provide the basis for calculating payments between counterparties and are not a measure of financial risk. Therefore, the derivative amounts recorded on the balance sheet do not represent the amounts that may ultimately be paid under these contracts. Further discussions of derivative instruments are included above in the section entitled “Asset Liability and Interest Rate Risk Management” beginning on page A-11 and in Note 1 to the Consolidated Financial Statements. There were no derivatives at December 31, 2022 or 2021.
Capital Resources. Shareholders’ equity was $105.2 million, or 6.49% of total assets, at December 31, 2022, compared to $142.4 million, or 8.77% of total assets, at December 31, 2021.
Average shareholders’ equity as a percentage of total average assets is one measure used to determine capital strength. Average shareholders’ equity as a percentage of total average assets was 7.45%, 9.42% and 10.35% for 2022, 2021 and 2020, respectively. The return on average shareholders’ equity was 13.01% at December 31, 2022, as compared to 10.24% and 8.04% at December 31, 2021 and December 31, 2020, respectively. Total cash dividends paid on common stock were $4.9 million, $3.8 million and $4.4 million during 2022, 2021 and 2020, respectively.
The Board of Directors, at its discretion, can issue up to 5,000,000 shares of preferred stock. The Board is authorized to determine the number of shares, voting powers, designations, preferences, limitations and relative rights.
In 2021, the Board of Directors authorized a stock repurchase program, whereby up to $4.0 million was allocated to repurchase the Company’s common stock. Any purchases under the Company’s stock repurchase program may be made periodically as permitted by securities laws and other legal requirements in the open market or in privately-negotiated transactions. The timing and amount of any repurchase of shares will be determined by the Company’s management, based on its evaluation of market conditions and other factors. The stock repurchase program may be suspended at any time or from time-to-time without prior notice. The Company repurchased approximately $3.6 million, or 127,597 shares of its common stock, under this stock repurchase program through December 31, 2021.
In 2022, the Board of Directors authorized a stock repurchase program, whereby up to $2.0 million was allocated to repurchase the Company’s common stock. Any purchases under the Company’s stock repurchase program may be made periodically as permitted by securities laws and other legal requirements in the open market or in privately-negotiated transactions. The timing and amount of any repurchase of shares will be determined by the Company’s management, based on its evaluation of market conditions and other factors. The stock repurchase program may be suspended at any time or from time-to-time without prior notice. The Company repurchased approximately $711,000, or 26,200 shares of its common stock, under this stock repurchase program through December 31, 2022.
In 2013, the FRB approved its final rule on the Basel III capital standards, which implement changes to the regulatory capital framework for banking organizations. The Basel III capital standards, which became effective January 1, 2015, include new risk-based capital and leverage ratios, which were phased in from 2015 to 2019. The new minimum capital level requirements applicable to the Company and the Bank under the final rules are as follows: (i) a new common equity Tier 1 capital ratio of 4.5%; (ii) a Tier 1 capital ratio of 6% (increased from 4%); (iii) a total risk based capital ratio of 8% (unchanged from previous rules); and (iv) a Tier 1 leverage ratio of 4% (unchanged from previous rules). An additional capital conservation buffer was added to the minimum requirements for capital adequacy purposes beginning on January 1, 2016 and was phased in through 2019 (increasing by 0.625% on January 1, 2016 and each subsequent January 1, until it reached 2.5% on January 1, 2019). This resulted in the following minimum ratios beginning in 2019: (i) a common equity Tier 1 capital ratio of 7.0%, (ii) a Tier 1 capital ratio of 8.5%, and (iii) a total capital ratio of 10.5%. Under the final rules, institutions would be subject to limitations on paying dividends, engaging in share repurchases, and paying discretionary bonuses if its capital level falls below the buffer amount. These limitations establish a maximum percentage of eligible retained earnings that could be utilized for such actions.
| A-17 |
Under the regulatory capital guidelines, financial institutions are currently required to maintain a total risk-based capital ratio of 8.0% or greater, with a Tier 1 risk-based capital ratio of 6.0% or greater and a common equity Tier 1 capital ratio of 4.5% or greater, as required by the Basel III capital standards referenced above. Tier 1 capital is generally defined as shareholders’ equity and trust preferred securities less all intangible assets and goodwill. Tier 1 capital includes $15.0 million in trust preferred securities at December 31, 2022 and December 31, 2021. The Company’s Tier 1 capital ratio was 13.21% and 15.43% at December 31, 2022 and December 31, 2021, respectively. Total risk-based capital is defined as Tier 1 capital plus supplementary capital. Supplementary capital, or Tier 2 capital, consists of the Company’s allowance for loan losses, not exceeding 1.25% of the Company’s risk-weighted assets. Total risk-based capital ratio is therefore defined as the ratio of total capital (Tier 1 capital and Tier 2 capital) to risk-weighted assets. The Company’s total risk-based capital ratio was 14.04% and 16.35% at December 31, 2022 and December 31, 2021, respectively. The Company’s common equity Tier 1 capital consists of common stock and retained earnings. The Company’s common equity Tier 1 capital ratio was 12.03% and 13.96% at December 31, 2022 and December 31, 2021, respectively. Financial institutions are also required to maintain a leverage ratio of Tier 1 capital to total average assets of 4.0% or greater. The Company’s Tier 1 leverage capital ratio was 9.82% and 9.64% at December 31, 2022 and December 31, 2021, respectively.
The Bank’s Tier 1 risk-based capital ratio was 13.10% and 15.27% at December 31, 2022 and December 31, 2021, respectively. The total risk-based capital ratio for the Bank was 13.93% and 16.19% at December 31, 2022 and December 31, 2021, respectively. The Bank’s common equity Tier 1 capital ratio was 13.10% and 15.27% at December 31, 2022 and December 31, 2021, respectively. The Bank’s Tier 1 leverage capital ratio was 9.68% and 9.50% at December 31, 2022 and December 31, 2021, respectively.
A bank is considered to be “well capitalized” if it has a total risk-based capital ratio of 10.0% or greater, a Tier 1 risk-based capital ratio of 8.0% or greater, a common equity Tier 1 capital ratio of 6.5% or greater and a leverage ratio of 5.0% or greater. Based upon these guidelines, the Bank was considered to be “well capitalized” at December 31, 2022.
| A-18 |
PEOPLES BANCORP OF NORTH CAROLINA, INC. | |||
Consolidated Financial Statements | |||
December 31, 2022, 2021 and 2020 | |||
| |||
INDEX | |||
|
| ||
| PAGE(S) |
| |
|
| ||
Reports of Independent Registered Public Accounting Firm on the Consolidated Financial Statements PCAOB #149 |
| A-20 - A-21 |
|
|
| ||
Financial Statements |
|
| |
| A-22 |
| |
|
| ||
Consolidated Statements of Earnings for the years ended December 31, 2022, 2021 and 2020 |
| A-23 |
|
|
| ||
| A-24 |
| |
|
| ||
| A-25 |
| |
|
| ||
Consolidated Statements of Cash Flows for the years ended December 31, 2022, 2021 and 2020 |
| A-26 - A-27 |
|
|
| ||
| A-28 - A-59 |
| |
| A-19 |

Report of Independent Registered Public Accounting Firm
To the Shareholders and the Board of Directors of Peoples Bancorp of North Carolina, Inc.
Opinion on the Financial Statements
We have audited the accompanying consolidated balance sheets of Peoples Bancorp of North Carolina, Inc. and its subsidiaries (the Company) as of December 31, 2022 and 2021, the related consolidated statements of earnings, comprehensive income (loss), shareholders’ equity and cash flows for each of the three years in the period ended December 31, 2022, and the related notes to the consolidated financial statements (collectively, the financial statements). In our opinion, the financial statements present fairly, in all material respects, the financial position of the Company as of December 31, 2022 and 2021, and the results of its operations and its cash flows for each of the three years in the period ended December 31, 2022, in conformity with accounting principles generally accepted in the United States of America.
Basis for Opinion
These financial statements are the responsibility of the Company’s management. Our responsibility is to express an opinion on the Company’s financial statements based on our audits. We are a public accounting firm registered with the Public Company Accounting Oversight Board (United States) (PCAOB) and are required to be independent with respect to the Company in accordance with U.S. federal securities laws and the applicable rules and regulations of the Securities and Exchange Commission and the PCAOB.
We conducted our audits in accordance with the standards of the PCAOB. Those standards require that we plan and perform the audit to obtain reasonable assurance about whether the financial statements are free of material misstatement, whether due to error or fraud. The Company is not required to have, nor were we engaged to perform, an audit of its internal control over financial reporting. As part of our audits we are required to obtain an understanding of internal control over financial reporting but not for the purpose of expressing an opinion on the effectiveness of the Company’s internal control over financial reporting. Accordingly, we express no such opinion.
Our audits included performing procedures to assess the risks of material misstatement of the financial statements, whether due to error or fraud, and performing procedures that respond to those risks. Such procedures included examining, on a test basis, evidence regarding the amounts and disclosures in the financial statements. Our audits also included evaluating the accounting principles used and significant estimates made by management, as well as evaluating the overall presentation of the financial statements. We believe that our audits provide a reasonable basis for our opinion.
| A-20 |
Critical Audit Matters
The critical audit matters communicated below are matters arising from the current period audit of the financial statements that were communicated or required to be communicated to the audit committee and that: (1) relate to accounts or disclosures that are material to the financial statements and (2) involved our especially challenging, subjective or complex judgments. The communication of critical audit matters does not alter in any way our opinion on the financial statements, taken as a whole, and we are not, by communicating the critical audit matters below, providing separate opinions on the critical audit matters or on the accounts or disclosures to which they relate.
Allowance for Loan Losses – Qualitative Factors
As discussed in Note 3 to the Company’s financial statements, the Company had a gross loan portfolio of approximately $1.0 billion and associated allowance for loan losses of approximately $10.5 million as of December 31, 2022. As described by the Company in Note 1, the allowance for loan losses is evaluated on a regular basis by management and is based on management’s periodic review of the collectability of the loans in light of the Company’s historical loan loss experience, the amount of past due and non-performing loans, specific known risks, underlying estimated values of collateral securing loans, current and anticipated economic conditions, and other factors which management believes represents the best estimate of the allowance for loan losses.
We identified the Company’s estimate of qualitative factors applied to adjust the historical loss experience of the allowance for loan losses as a critical audit matter. The principal considerations for our determination of the allowance for loan losses as a critical audit matter related to the high degree of subjectivity in the Company’s judgments in determining the qualitative factors. Auditing these complex judgments and assumptions by the Company involves especially challenging auditor judgment due to the nature and extent of audit evidence and effort required to address these matters, including the extent of specialized skill or knowledge needed.
The primary procedures we performed to address this critical audit matter included the following:
· | We evaluated the relevance and the reasonableness of assumptions related to evaluation of the loan portfolio, current economic conditions, and other risk factors used in development of the qualitative factors for collectively evaluated loans. |
· | We evaluated the reasonableness of assumptions and data used by the Company in developing the qualitative factors by comparing these data points to internally developed and third-party sources, as well as other audit evidence gathered. |
· | Analytical procedures were performed to evaluate the directional consistency of changes that occurred in the allowance for loan losses for loans collectively evaluated for impairment. |
/s/ Elliott Davis, PLLC
We have served as the Company's auditor since 2015.
Raleigh, North Carolina
March 17, 2023
| A-21 |
|
|
|
|
| ||||
Consolidated Balance Sheets | ||||||||
|
|
|
|
| ||||
December 31, 2022 and December 31, 2021 | ||||||||
|
|
|
|
| ||||
(Dollars in thousands) | ||||||||
|
| December 31, |
|
| December 31, |
| ||
Assets |
| 2022 |
|
| 2021 |
| ||
|
| (Audited) |
|
| (Audited) |
| ||
|
|
|
|
|
|
| ||
Cash and due from banks, including reserve requirements of $0 at both 12/31/22 and 12/31/21 |
| $ | 50,061 |
|
|
| 44,711 |
|
Interest-bearing deposits |
|
| 21,535 |
|
|
| 232,788 |
|
Cash and cash equivalents |
|
| 71,596 |
|
|
| 277,499 |
|
|
|
|
|
|
|
|
|
|
Investment securities available for sale |
|
| 445,394 |
|
|
| 406,549 |
|
Other investments |
|
| 2,656 |
|
|
| 3,668 |
|
Total securities |
|
| 448,050 |
|
|
| 410,217 |
|
|
|
|
|
|
|
|
|
|
Mortgage loans held for sale |
|
| 211 |
|
|
| 3,637 |
|
|
|
|
|
|
|
|
|
|
Loans |
|
| 1,032,608 |
|
|
| 884,869 |
|
Less allowance for loan losses |
|
| (10,494 | ) |
|
| (9,355 | ) |
Net loans |
|
| 1,022,114 |
|
|
| 875,514 |
|
|
|
|
|
|
|
|
|
|
Premises and equipment, net |
|
| 18,205 |
|
|
| 16,104 |
|
Cash surrender value of life insurance |
|
| 17,703 |
|
|
| 17,365 |
|
Right of use lease asset |
|
| 5,116 |
|
|
| 4,612 |
|
Accrued interest receivable and other assets |
|
| 37,932 |
|
|
| 19,245 |
|
Total assets |
| $ | 1,620,927 |
|
|
| 1,624,193 |
|
|
|
|
|
|
|
|
|
|
Liabilities and Shareholders' Equity |
|
|
|
|
|
|
|
|
|
|
|
|
|
|
|
|
|
Deposits: |
|
|
|
|
|
|
|
|
Noninterest-bearing demand |
| $ | 523,088 |
|
|
| 514,319 |
|
Interest-bearing demand, MMDA & savings |
|
| 814,128 |
|
|
| 797,179 |
|
Time, $250,000 or more |
|
| 31,001 |
|
|
| 26,333 |
|
Other time |
|
| 66,998 |
|
|
| 74,917 |
|
Total deposits |
|
| 1,435,215 |
|
|
| 1,412,748 |
|
|
|
|
|
|
|
|
|
|
Securities sold under agreements to repurchase |
|
| 47,688 |
|
|
| 37,094 |
|
Junior subordinated debentures |
|
| 15,464 |
|
|
| 15,464 |
|
Lease liability |
|
| 5,185 |
|
|
| 4,677 |
|
Accrued interest payable and other liabilities |
|
| 12,180 |
|
|
| 11,841 |
|
Total liabilities |
|
| 1,515,732 |
|
|
| 1,481,824 |
|
|
|
|
|
|
|
|
|
|
Commitments |
|
|
|
|
|
|
|
|
|
|
|
|
|
|
|
|
|
Shareholders' equity: |
|
|
|
|
|
|
|
|
Preferred stock, no par value; authorized 5,000,000 shares; no shares issued and outstanding |
|
| - |
|
|
| - |
|
Common stock, no par value; authorized 20,000,000 shares; issued and outstanding 5,636,830 shares at December 31, 2022 and 5,661,569 shares at December 31, 2021 |
|
| 52,636 |
|
|
| 53,305 |
|
Common stock held by deferred compensation trust, at cost; 169,004 shares at December 31, 2022 and 162,193 shares at December 31, 2021 |
|
| (2,181 | ) |
|
| (1,992 | ) |
Deferred compensation |
|
| 2,181 |
|
|
| 1,992 |
|
Retained earnings |
|
| 100,156 |
|
|
| 88,968 |
|
Accumulated other comprehensive income (loss) |
|
| (47,597 | ) |
|
| 96 |
|
Total shareholders' equity |
|
| 105,195 |
|
|
| 142,369 |
|
|
|
|
|
|
|
|
|
|
Total liabilities and shareholders' equity |
| $ | 1,620,927 |
|
|
| 1,624,193 |
|
See accompanying Notes to Consolidated Financial Statements.
| A-22 |
|
|
|
|
|
|
| ||||||
Consolidated Statements of Earnings | ||||||||||||
|
|
|
|
|
|
| ||||||
For the Years Ended December 31, 2022, 2021 and 2020 | ||||||||||||
|
|
|
|
|
|
| ||||||
(Dollars in thousands, except per share amounts) | ||||||||||||
|
|
|
|
| ||||||||
|
| 2022 |
|
| 2021 |
|
| 2020 |
| |||
|
|
|
|
|
|
|
|
|
| |||
Interest income: |
|
|
|
|
|
|
|
|
| |||
Interest and fees on loans |
| $ | 43,077 |
|
|
| 41,186 |
|
|
| 42,314 |
|
Interest on due from banks |
|
| 2,223 |
|
|
| 258 |
|
|
| 127 |
|
Interest on federal funds sold |
|
| - |
|
|
| - |
|
|
| 204 |
|
Interest on investment securities: |
|
|
|
|
|
|
|
|
|
|
|
|
U.S. Government sponsored enterprises |
|
| 4,962 |
|
|
| 2,478 |
|
|
| 2,361 |
|
States and political subdivisions |
|
| 4,075 |
|
|
| 3,146 |
|
|
| 2,691 |
|
Other |
|
| 94 |
|
|
| 111 |
|
|
| 261 |
|
Total interest income |
|
| 54,431 |
|
|
| 47,179 |
|
|
| 47,958 |
|
|
|
|
|
|
|
|
|
|
|
|
|
|
Interest expense: |
|
|
|
|
|
|
|
|
|
|
|
|
Demand deposits, MMDA & savings deposits |
|
| 2,019 |
|
|
| 2,029 |
|
|
| 1,962 |
|
Time deposits |
|
| 562 |
|
|
| 752 |
|
|
| 947 |
|
FHLB borrowings |
|
| - |
|
|
| - |
|
|
| 357 |
|
Junior subordinated debentures |
|
| 529 |
|
|
| 280 |
|
|
| 370 |
|
Other |
|
| 213 |
|
|
| 144 |
|
|
| 200 |
|
Total interest expense |
|
| 3,323 |
|
|
| 3,205 |
|
|
| 3,836 |
|
|
|
|
|
|
|
|
|
|
|
|
|
|
Net interest income |
|
| 51,108 |
|
|
| 43,974 |
|
|
| 44,122 |
|
|
|
|
|
|
|
|
|
|
|
|
|
|
Provision for (recovery of) loan losses |
|
| 1,472 |
|
|
| (1,163 | ) |
|
| 4,259 |
|
|
|
|
|
|
|
|
|
|
|
|
|
|
Net interest income after provision for loan losses |
|
| 49,636 |
|
|
| 45,137 |
|
|
| 39,863 |
|
|
|
|
|
|
|
|
|
|
|
|
|
|
Non-interest income: |
|
|
|
|
|
|
|
|
|
|
|
|
Service charges |
|
| 5,290 |
|
|
| 3,921 |
|
|
| 3,528 |
|
Other service charges and fees |
|
| 734 |
|
|
| 803 |
|
|
| 742 |
|
Gain on sale of securities |
|
| - |
|
|
| - |
|
|
| 2,639 |
|
Mortgage banking income |
|
| 393 |
|
|
| 2,505 |
|
|
| 2,469 |
|
Insurance and brokerage commissions |
|
| 945 |
|
|
| 1,035 |
|
|
| 897 |
|
Appraisal management fee income |
|
| 11,663 |
|
|
| 8,890 |
|
|
| 6,754 |
|
Gain (loss) on sale of premises and equipment |
|
| (85 | ) |
|
| 105 |
|
|
| - |
|
Gain (loss) on sales and write-downs of other real estate, net |
|
| - |
|
|
| 21 |
|
|
| (47 | ) |
Miscellaneous |
|
| 7,749 |
|
|
| 7,639 |
|
|
| 5,932 |
|
Total non-interest income |
|
| 26,689 |
|
|
| 24,919 |
|
|
| 22,914 |
|
|
|
|
|
|
|
|
|
|
|
|
|
|
Non-interest expense: |
|
|
|
|
|
|
|
|
|
|
|
|
Salaries and employee benefits |
|
| 26,130 |
|
|
| 24,506 |
|
|
| 23,538 |
|
Occupancy |
|
| 8,048 |
|
|
| 7,858 |
|
|
| 7,933 |
|
Professional fees |
|
| 1,915 |
|
|
| 1,826 |
|
|
| 1,580 |
|
Advertising |
|
| 693 |
|
|
| 536 |
|
|
| 787 |
|
Debit card expense |
|
| 1,224 |
|
|
| 1,000 |
|
|
| 1,012 |
|
FDIC insurance |
|
| 461 |
|
|
| 415 |
|
|
| 263 |
|
Appraisal management fee expense |
|
| 9,264 |
|
|
| 7,112 |
|
|
| 5,274 |
|
Other |
|
| 8,295 |
|
|
| 7,874 |
|
|
| 8,544 |
|
Total non-interest expense |
|
| 56,030 |
|
|
| 51,127 |
|
|
| 48,931 |
|
|
|
|
|
|
|
|
|
|
|
|
|
|
Earnings before income taxes |
|
| 20,295 |
|
|
| 18,929 |
|
|
| 13,846 |
|
|
|
|
|
|
|
|
|
|
|
|
|
|
Income tax expense |
|
| 4,172 |
|
|
| 3,796 |
|
|
| 2,489 |
|
|
|
|
|
|
|
|
|
|
|
|
|
|
Net earnings |
| $ | 16,123 |
|
|
| 15,133 |
|
|
| 11,357 |
|
|
|
|
|
|
|
|
|
|
|
|
|
|
Basic net earnings per share |
| $ | 2.94 |
|
|
| 2.71 |
|
|
| 2.01 |
|
Diluted net earnings per share |
| $ | 2.85 |
|
|
| 2.63 |
|
|
| 1.95 |
|
Cash dividends declared per share |
| $ | 0.87 |
|
|
| 0.66 |
|
|
| 0.75 |
|
See accompanying Notes to Consolidated Financial Statements.
| A-23 |
|
|
|
|
|
|
| ||||||
Consolidated Statements of Comprehensive Income (Loss) | ||||||||||||
|
|
|
|
|
|
| ||||||
For the Years Ended December 31, 2022, 2021 and 2020 | ||||||||||||
|
|
|
|
|
|
| ||||||
(Dollars in thousands) | ||||||||||||
|
|
|
|
| ||||||||
|
| 2022 |
|
| 2021 |
|
| 2020 |
| |||
|
|
|
|
|
|
|
|
|
| |||
Net earnings |
| $ | 16,123 |
|
|
| 15,133 |
|
|
| 11,357 |
|
|
|
|
|
|
|
|
|
|
|
|
|
|
Other comprehensive income (loss): |
|
|
|
|
|
|
|
|
|
|
|
|
Unrealized holding gains (losses) on securities available for sale |
|
| (61,919 | ) |
|
| (6,886 | ) |
|
| 4,919 |
|
Reclassification adjustment for gains on securities available for sale included in net earnings |
|
| - |
|
|
| - |
|
|
| (2,639 | ) |
|
|
|
|
|
|
|
|
|
|
|
|
|
Total other comprehensive income (loss), before income taxes |
|
| (61,919 | ) |
|
| (6,886 | ) |
|
| 2,280 |
|
|
|
|
|
|
|
|
|
|
|
|
|
|
Income tax expense (benefit) related to other comprehensive income (loss): |
|
|
|
|
|
|
|
|
|
|
|
|
|
|
|
|
|
|
|
|
|
|
|
|
|
Unrealized holding gain (losses) on securities available for sale |
|
| (14,226 | ) |
|
| (1,582 | ) |
|
| 1,130 |
|
Reclassification adjustment for gains on securities available for sale included in net earnings |
|
| - |
|
|
| - |
|
|
| (606 | ) |
|
|
|
|
|
|
|
|
|
|
|
|
|
Total income tax expense (benefit) related to other comprehensive income (loss) |
|
| (14,226 | ) |
|
| (1,582 | ) |
|
| 524 |
|
|
|
|
|
|
|
|
|
|
|
|
|
|
Total other comprehensive income (loss), net of tax |
|
| (47,693 | ) |
|
| (5,304 | ) |
|
| 1,756 |
|
|
|
|
|
|
|
|
|
|
|
|
|
|
Total comprehensive income (loss) |
| $ | (31,570 | ) |
|
| 9,829 |
|
|
| 13,113 |
|
See accompanying Notes to Consolidated Financial Statements.
| A-24 |
|
|
|
|
|
|
|
|
|
|
|
|
|
|
| ||||||||||||||
Consolidated Statements of Changes in Shareholders' Equity | ||||||||||||||||||||||||||||
|
|
|
|
|
|
|
|
|
|
|
|
|
|
| ||||||||||||||
For the Years Ended December 31, 2022, 2021 and 2020 | ||||||||||||||||||||||||||||
|
|
|
|
|
|
|
|
|
|
|
|
|
|
| ||||||||||||||
(Dollars in thousands) | ||||||||||||||||||||||||||||
|
|
|
|
|
|
|
|
|
| Common Stock |
|
|
| |||||||||||||||
|
|
|
|
|
|
|
|
|
| Held By |
|
| Accumulated |
|
|
| ||||||||||||
|
| Common |
|
| Common |
|
|
|
|
|
| Deferred |
|
| Other |
|
|
| ||||||||||
|
| Stock |
|
| Stock |
|
| Retained |
|
| Deferred |
|
| Compensation |
|
| Comprehensive |
|
|
| ||||||||
|
| Shares |
|
| Amount |
|
| Earnings |
|
| Compensation |
|
| Trust |
|
| Income (Loss) |
|
| Total |
| |||||||
Balance, December 31, 2019 |
|
| 5,912,300 |
|
| $ | 59,813 |
|
|
| 70,663 |
|
|
| 1,588 |
|
|
| (1,588 | ) |
|
| 3,644 |
|
|
| 134,120 |
|
|
|
|
|
|
|
|
|
|
|
|
|
|
|
|
|
|
|
|
|
|
|
|
|
|
|
|
|
|
Common stock repurchase |
|
| (126,800 | ) |
|
| (2,999 | ) |
|
| - |
|
|
| - |
|
|
| - |
|
|
| - |
|
|
| (2,999 | ) |
Cash dividends declared on common stock |
|
| - |
|
|
| - |
|
|
| (4,392 | ) |
|
| - |
|
|
| - |
|
|
| - |
|
|
| (4,392 | ) |
Restricted stock units exercised |
| 2004 |
|
|
| 57 |
|
|
| - |
|
|
| - |
|
|
| - |
|
|
| - |
|
|
| 57 |
| |
Equity incentive plan, net |
|
| - |
|
|
| - |
|
|
| - |
|
|
| 208 |
|
|
| (208 | ) |
|
| - |
|
|
| - |
|
Net earnings |
|
| - |
|
|
| - |
|
|
| 11,357 |
|
|
| - |
|
|
| - |
|
|
| - |
|
|
| 11,357 |
|
Change in accumulated other comprehensive income, net of tax |
|
| - |
|
|
| - |
|
|
| - |
|
|
| - |
|
|
| - |
|
|
| 1,756 |
|
|
| 1,756 |
|
Balance, December 31, 2020 |
|
| 5,787,504 |
|
| $ | 56,871 |
|
|
| 77,628 |
|
|
| 1,796 |
|
|
| (1,796 | ) |
|
| 5,400 |
|
|
| 139,899 |
|
|
|
|
|
|
|
|
|
|
|
|
|
|
|
|
|
|
|
|
|
|
|
|
|
|
|
|
|
|
Common stock repurchase |
|
| (127,597 | ) |
|
| (3,605 | ) |
|
| - |
|
|
| - |
|
|
| - |
|
|
| - |
|
|
| (3,605 | ) |
Cash dividends declared on common stock |
|
| - |
|
|
| - |
|
|
| (3,793 | ) |
|
|
|
|
|
|
|
|
|
| - |
|
|
| (3,793 | ) |
Restricted stock units exercised |
|
| 1,662 |
|
|
| 39 |
|
|
| - |
|
|
| - |
|
|
| - |
|
|
| - |
|
|
| 39 |
|
Equity incentive plan, net |
|
| - |
|
|
| - |
|
|
| - |
|
|
| 196 |
|
|
| (196 | ) |
|
| - |
|
|
| - |
|
Net earnings |
|
| - |
|
|
| - |
|
|
| 15,133 |
|
|
| - |
|
|
| - |
|
|
| - |
|
|
| 15,133 |
|
Change in accumulated other comprehensive loss, net of tax |
|
| - |
|
|
| - |
|
|
| - |
|
|
| - |
|
|
| - |
|
|
| (5,304 | ) |
|
| (5,304 | ) |
Balance, December 31, 2021 |
|
| 5,661,569 |
|
| $ | 53,305 |
|
|
| 88,968 |
|
|
| 1,992 |
|
|
| (1,992 | ) |
|
| 96 |
|
|
| 142,369 |
|
|
|
|
|
|
|
|
|
|
|
|
|
|
|
|
|
|
|
|
|
|
|
|
|
|
|
|
|
|
Common stock repurchase |
|
| (26,200 | ) |
|
| (710 | ) |
|
| - |
|
|
| - |
|
|
| - |
|
|
| - |
|
|
| (710 | ) |
Cash dividends declared on common stock |
|
| - |
|
|
| - |
|
|
| (4,935 | ) |
|
|
|
|
|
|
|
|
|
| - |
|
|
| (4,935 | ) |
Restricted stock units exercised |
|
| 1,461 |
|
|
| 41 |
|
|
| - |
|
|
| - |
|
|
| - |
|
|
| - |
|
|
| 41 |
|
Equity incentive plan, net |
|
| - |
|
|
| - |
|
|
| - |
|
|
| 189 |
|
|
| (189 | ) |
|
| - |
|
|
| - |
|
Net earnings |
|
| - |
|
|
| - |
|
|
| 16,123 |
|
|
| - |
|
|
| - |
|
|
| - |
|
|
| 16,123 |
|
Change in accumulated other comprehensive loss, net of tax |
|
| - |
|
|
| - |
|
|
| - |
|
|
| - |
|
|
| - |
|
|
| (47,693 | ) |
|
| (47,693 | ) |
Balance, December 31, 2022 |
|
| 5,636,830 |
|
| $ | 52,636 |
|
|
| 100,156 |
|
|
| 2,181 |
|
|
| (2,181 | ) |
|
| (47,597 | ) |
|
| 105,195 |
|
See accompanying Notes to Consolidated Financial Statements.
| A-25 |
|
|
|
|
|
|
|
|
|
| |||
Consolidated Statements of Cash Flows | ||||||||||||
|
|
|
|
|
|
|
|
|
| |||
For the Years Ended December 31, 2022, 2021 and 2020 | ||||||||||||
|
|
|
|
|
|
|
|
|
| |||
(Dollars in thousands) | ||||||||||||
|
|
|
|
|
|
|
|
|
| |||
|
| 2022 |
|
| 2021 |
|
| 2020 |
| |||
|
|
|
|
|
|
|
|
|
| |||
Cash flows from operating activities: |
|
|
|
|
|
|
|
|
| |||
Net earnings |
| $ | 16,123 |
|
|
| 15,133 |
|
|
| 11,357 |
|
Adjustments to reconcile net earnings to net cash provided by operating activities: |
|
|
|
|
|
|
|
|
|
|
|
|
Depreciation, amortization and accretion |
|
| 6,031 |
|
|
| 5,569 |
|
|
| 4,183 |
|
Provision for (recovery of) loan losses |
|
| 1,472 |
|
|
| (1,163 | ) |
|
| 4,259 |
|
Deferred income taxes |
|
| (541 | ) |
|
| (227 | ) |
|
| (560 | ) |
Gain on sale of investment securities |
|
| - |
|
|
| - |
|
|
| (2,639 | ) |
Gain on sale of other real estate |
|
| - |
|
|
| (21 | ) |
|
| - |
|
Write-down of other real estate |
|
| - |
|
|
| - |
|
|
| 47 |
|
(Gain) loss on sale and writedowns of premises and equipment |
|
| 85 |
|
|
| (105 | ) |
|
| - |
|
Restricted stock units expense |
|
| 249 |
|
|
| 181 |
|
|
| 27 |
|
Proceeds from sales of loans held for sale |
|
| 22,659 |
|
|
| 98,365 |
|
|
| 112,426 |
|
Origination of loans held for sale |
|
| (19,233 | ) |
|
| (92,863 | ) |
|
| (117,148 | ) |
Change in: |
|
|
|
|
|
|
|
|
|
|
|
|
Cash surrender value of life insurance |
|
| (403 | ) |
|
| (397 | ) |
|
| (380 | ) |
Right of use lease asset |
|
| 1,677 |
|
|
| 738 |
|
|
| 199 |
|
Other assets |
|
| (3,920 | ) |
|
| (554 | ) |
|
| (596 | ) |
Lease liability |
|
| (1,673 | ) |
|
| (721 | ) |
|
| (176 | ) |
Other liabilities |
|
| 131 |
|
|
| 2,965 |
|
|
| (1,837 | ) |
|
|
|
|
|
|
|
|
|
|
|
|
|
Net cash provided by operating activities |
|
| 22,657 |
|
|
| 26,900 |
|
|
| 9,162 |
|
|
|
|
|
|
|
|
|
|
|
|
|
|
Cash flows from investing activities: |
|
|
|
|
|
|
|
|
|
|
|
|
Purchases of investment securities available for sale |
|
| (149,738 | ) |
|
| (209,306 | ) |
|
| (127,893 | ) |
Proceeds from sales, calls and maturities of investment securities available for sale |
|
| 7,875 |
|
|
| 9,540 |
|
|
| 62,408 |
|
Proceeds from paydowns of investment securities available for sale |
|
| 37,400 |
|
|
| 28,536 |
|
|
| 19,169 |
|
Purchases of other investments |
|
| - |
|
|
| - |
|
|
| (45 | ) |
Proceeds from paydowns of other investment securities |
|
| 1,162 |
|
|
| 201 |
|
|
| 176 |
|
Net change in FHLB stock |
|
| (105 | ) |
|
| 331 |
|
|
| (55 | ) |
Net change in loans |
|
| (148,072 | ) |
|
| 64,380 |
|
|
| (99,971 | ) |
Purchases of premises and equipment |
|
| (4,563 | ) |
|
| (484 | ) |
|
| (2,492 | ) |
Purchases of bank owned life insurance |
|
| - |
|
|
| - |
|
|
| (269 | ) |
Proceeds from sale of premises and equipment |
|
| - |
|
|
| 515 |
|
|
| - |
|
Proceeds from sale of other real estate and repossessions |
|
| - |
|
|
| 149 |
|
|
|
|
|
Proceeds from bank owned life insurance |
|
| 65 |
|
|
| - |
|
|
| - |
|
|
|
|
|
|
|
|
|
|
|
|
|
|
Net cash used by investing activities |
|
| (255,976 | ) |
|
| (106,138 | ) |
|
| (148,972 | ) |
|
|
|
|
|
|
|
|
|
|
|
|
|
Cash flows from financing activities: |
|
|
|
|
|
|
|
|
|
|
|
|
Net change in deposits |
|
| 22,467 |
|
|
| 191,662 |
|
|
| 254,569 |
|
Net change in securities sold under agreement to repurchase |
|
| 10,594 |
|
|
| 10,893 |
|
|
| 1,980 |
|
Proceeds from FHLB borrowings |
|
| - |
|
|
| - |
|
|
| 70,000 |
|
Repayments of FHLB borrowings |
|
| - |
|
|
| - |
|
|
| (70,000 | ) |
Proceeds from FRB borrowings |
|
| 1 |
|
|
| 1 |
|
|
| 1 |
|
Repayments of FRB borrowings |
|
| (1 | ) |
|
| (1 | ) |
|
| (1 | ) |
Proceeds from Fed Funds Purchased |
|
| 162 |
|
|
| 162 |
|
|
| 7,011 |
|
Repayments of Fed Funds Purchased |
|
| (162 | ) |
|
| (162 | ) |
|
| (7,011 | ) |
Repayments of Junior Subordinated Debentures |
|
| - |
|
|
| - |
|
|
| (155 | ) |
Common stock repurchased |
|
| (710 | ) |
|
| (3,605 | ) |
|
| (2,999 | ) |
Cash dividends paid on common stock |
|
| (4,935 | ) |
|
| (3,793 | ) |
|
| (4,392 | ) |
|
|
|
|
|
|
|
|
|
|
|
|
|
Net cash provided by financing activities |
|
| 27,416 |
|
|
| 195,157 |
|
|
| 249,003 |
|
|
|
|
|
|
|
|
|
|
|
|
|
|
Net change in cash and cash equivalents |
|
| (205,903 | ) |
|
| 115,919 |
|
|
| 109,193 |
|
|
|
|
|
|
|
|
|
|
|
|
|
|
Cash and cash equivalents at beginning of period |
|
| 277,499 |
|
|
| 161,580 |
|
|
| 52,387 |
|
|
|
|
|
|
|
|
|
|
|
|
|
|
Cash and cash equivalents at end of period |
| $ | 71,596 |
|
|
| 277,499 |
|
|
| 161,580 |
|
| A-26 |
PEOPLES BANCORP OF NORTH CAROLINA, INC. | ||||||||||||
|
|
|
|
|
|
|
|
|
| |||
Consolidated Statements of Cash Flows, continued | ||||||||||||
|
|
|
|
|
|
|
|
|
| |||
For the Years Ended December 31, 2022, 2021 and 2020 | ||||||||||||
|
|
|
|
|
|
|
|
|
| |||
(Dollars in thousands) | ||||||||||||
|
|
|
|
|
|
|
|
|
| |||
|
| 2022 |
|
| 2021 |
|
| 2020 |
| |||
|
|
|
|
|
|
|
|
|
| |||
Supplemental disclosures of cash flow information: |
|
|
|
|
|
|
|
|
| |||
Cash paid during the year for: |
|
|
|
|
|
|
|
|
| |||
Interest |
| $ | 3,284 |
|
|
| 3,224 |
|
|
| 3,856 |
|
Income taxes |
| $ | 4,659 |
|
|
| 3,669 |
|
|
| 2,781 |
|
|
|
|
|
|
|
|
|
|
|
|
|
|
Noncash investing and financing activities: |
|
|
|
|
|
|
|
|
|
|
|
|
Change in unrealized gain (loss) on investment securities available for sale, net |
| $ | (47,693 | ) |
|
| (5,304 | ) |
|
| 1,756 |
|
Transfer of loans to other real estate |
| $ | - |
|
|
| - |
|
|
| 175 |
|
Issuance of accrued restricted stock units |
| $ | 41 |
|
|
| 39 |
|
|
| 57 |
|
Initial recognition of lease right of use asset and lease liability |
| $ | 2,181 |
|
|
| 1,927 |
|
|
| 942 |
|
See accompanying Notes to Consolidated Financial Statements.
| A-27 |
PEOPLES BANCORP OF NORTH CAROLINA, INC.
Notes to Consolidated Financial Statements
(1) Summary of Significant Accounting Policies
Organization
Peoples Bancorp of North Carolina, Inc. (the “Company”) has served as the holding company to Peoples Bank (the “Bank”) since 1999. The Company is primarily regulated by the Board of Governors of the Federal Reserve System, and serves as the one-bank holding company for the Bank.
The Bank commenced business in 1912 upon receipt of its banking charter from the North Carolina Commissioner of Banks (the “Commissioner”). The Bank is primarily regulated by the Commissioner and the Federal Deposit Insurance Corporation (the “FDIC”) and undergoes periodic examinations by these regulatory agencies. The Bank, whose main office is in Newton, North Carolina, provides a full range of commercial and consumer banking services primarily in Catawba, Alexander, Lincoln, Mecklenburg, Iredell and Wake counties in North Carolina.
Peoples Investment Services, Inc. (“PIS”) is a wholly owned subsidiary of the Bank and began operations in 1996 to provide investment and trust services through agreements with an outside party.
Real Estate Advisory Services, Inc. (“REAS”) is a wholly owned subsidiary of the Bank and began operations in 1997 to provide real estate appraisal and property management services to individuals and commercial customers of the Bank.
Community Bank Real Estate Solutions, LLC (“CBRES”) is a wholly owned subsidiary of the Bank and began operations in 2009 as a “clearing house” for appraisal services for community banks. Other banks are able to contract with CBRES to find and engage appropriate appraisal companies. In 2019, the Company launched PB Insurance Agency, which operated as a division of CBRES, until it was discontinued in 2022.
PB Real Estate Holdings, LLC (“PBREH”) is a wholly owned subsidiary of the Bank and began operation in 2015. PBREH acquires, manages and disposes of real property, other collateral and other assets obtained in the ordinary course of collecting debts previously contracted.
The Bank operates three banking offices focused on the Latino population that were formerly operated as a division of the Bank under the name Banco de la Gente (“Banco”). These offices, which offer the same banking services as our other branches offer, now operate under the same name as our other offices; however, we continue to separately categorize mortgage loans originated from these offices.
Principles of Consolidation
The consolidated financial statements include the financial statements of the Company and its wholly owned subsidiary, the Bank, along with the Bank’s wholly owned subsidiaries, PIS, REAS, CBRES and PBREH. All significant intercompany balances and transactions have been eliminated in consolidation.
Basis of Presentation
The accounting principles followed by the Company, and the methods of applying these principles, conform with accounting principles generally accepted in the United States of America (“GAAP”) and with general practices in the banking industry. In preparing the financial statements in conformity with GAAP, management is required to make estimates and assumptions that affect the reported amounts in the financial statements. Actual results could differ significantly from these estimates. Material estimates common to the banking industry that are particularly susceptible to significant change in the near term include, but are not limited to, the determination of the allowance for loan losses and valuation of real estate acquired in connection with or in lieu of foreclosure on loans.
Business Segments
Operating segments are components of an enterprise about which separate financial information is available that is evaluated regularly by management in deciding how to allocate resources and in assessing performance. Management has determined that the Company has two significant operating segment: Banking Operations and CBRES, as discussed more fully in Note 16. In determining the appropriateness of segment definition, the Company considers the criteria of ASC 280, Segment Reporting.
| A-28 |
Cash and Cash Equivalents
Cash, due from banks, interest-bearing deposits and federal funds sold are considered cash and cash equivalents for cash flow reporting purposes.
Investment Securities
The Company uses three classifications for its investment securities: trading, available for sale, or held to maturity. Trading securities are bought and held principally for sale in the near term. Held to maturity securities are those securities for which the Company has the ability and intent to hold until maturity. All other securities not included in trading or held to maturity are classified as available for sale. At December 31, 2022 and 2021, the Company classified all of its investment securities as available for sale.
Available for sale securities are recorded at fair value. Unrealized holding gains and losses, net of the related tax effect, are excluded from earnings and are reported as a separate component of shareholders’ equity until realized.
Management evaluates investment securities for other-than-temporary impairment on a quarterly basis. A decline in the market value of any investment below cost that is deemed other-than-temporary is charged to earnings for the decline in value deemed to be credit related and a new cost basis in the security is established. The decline in value attributed to non-credit related factors is recognized in comprehensive income.
Premiums and discounts are recognized in interest income using the interest method over the terms of the securities. Realized gains and losses for securities classified as available for sale are included in earnings and are derived using the specific identification method for determining the cost of securities sold.
Other Investments
Other investments include equity securities with no readily determinable fair value. These investments are carried at cost.
Loans
Loans that management has the intent and ability to hold for the foreseeable future or until maturity are reported at the principal amount outstanding, net of the allowance for loan losses. Interest on loans is calculated by using the simple interest method on daily balances of the principal amount outstanding. The recognition of certain loan origination fee income and certain loan origination costs is deferred when such loans are originated and amortized over the life of the loan.
A loan is impaired when, based on current information and events, it is probable that all amounts due according to the contractual terms of the loan will not be collected. Impaired loans are measured based on the present value of expected future cash flows, discounted at the loan’s effective interest rate, or at the loan’s observable market price, or the fair value of the collateral if the loan is collateral dependent.
Accrual of interest is discontinued on a loan when management believes, after considering economic conditions and collection efforts, that the borrower’s financial condition is such that collection of interest is doubtful. Interest previously accrued but not collected is reversed against current period earnings.
Allowance for Loan Losses
The allowance for loan losses (“ALLL” or “allowance”) reflects management’s assessment and estimate of the risks associated with extending credit and its evaluation of the quality of the loan portfolio. The Bank periodically analyzes the loan portfolio in an effort to review asset quality and to establish an allowance that management believes will be adequate in light of anticipated risks and loan losses. In assessing the adequacy of the allowance, size, quality and risk of loans in the portfolio are reviewed. Other factors considered are:
| · | the Bank’s loan loss experience; |
| · | the amount of past due and non-performing loans; |
| · | specific known risks; |
| · | the status and amount of other past due and non-performing assets; |
| · | underlying estimated values of collateral securing loans; |
| · | current and anticipated economic conditions; and |
| · | other factors which management believes affect the allowance for potential credit losses. |
| A-29 |
Management uses several measures to assess and monitor the credit risks in the loan portfolio, including a loan grading system that begins upon loan origination and continues until the loan is collected or collectability becomes doubtful. Upon loan origination, the Bank’s originating loan officer evaluates the quality of the loan and assigns one of eight risk grades. The loan officer monitors the loan’s performance and credit quality and makes changes to the credit grade as conditions warrant. When originated or renewed, all loans over a certain dollar amount receive in-depth reviews and risk assessments by the Bank’s Credit Administration. Before making any changes in these risk grades, management considers assessments as determined by the third party credit review firm (as described below), regulatory examiners and the Bank’s Credit Administration. Any issues regarding the risk assessments are addressed by the Bank’s senior credit administrators and factored into management’s decision to originate or renew the loan. The Bank’s Board of Directors reviews, on a monthly basis, an analysis of the Bank’s reserves relative to the range of reserves estimated by the Bank’s Credit Administration.
As an additional measure, the Bank engages an independent third party to review the underwriting, documentation and risk grading analyses. This independent third party reviews and evaluates loan relationships greater than or equal to $1.5 million as well as a periodic sample of commercial relationships with exposures below $1.5 million, excluding loans in default, and loans in process of litigation or liquidation. The third party’s evaluation and report is shared with management and the Board of Directors of the Bank (“Bank Board”).
Management considers certain commercial loans with weak credit risk grades to be individually impaired and measures such impairment based upon available cash flows and the value of the collateral. Allowance or reserve levels are estimated for all other graded loans in the portfolio based on their assigned credit risk grade, type of loan and other matters related to credit risk.
Management uses the information developed from the procedures described above in evaluating and grading the loan portfolio. This continual grading process is used to monitor the credit quality of the loan portfolio and to assist management in estimating the allowance. The provision for loan losses charged or credited to earnings is based upon management’s judgment of the amount necessary to maintain the allowance at a level appropriate to absorb probable incurred losses in the loan portfolio at the balance sheet date. The amount each quarter is dependent upon many factors, including growth and changes in the composition of the loan portfolio, net charge-offs, delinquencies, management’s assessment of loan portfolio quality, the value of collateral, and other macro-economic factors and trends. The evaluation of these factors is performed quarterly by management through an analysis of the appropriateness of the allowance.
The allowance is comprised of three components: specific reserves, general reserves and unallocated reserves. After a loan has been identified as impaired, management measures impairment. When the measure of the impaired loan is less than the recorded investment in the loan, the amount of the impairment is recorded as a specific reserve. These specific reserves are determined on an individual loan basis based on management’s current evaluation of the Bank’s loss exposure for each credit, given the appraised value of any underlying collateral. Loans for which specific reserves are provided are excluded from the general allowance calculations as described below.
The general allowance reflects reserves established under GAAP for collective loan impairment. These reserves are based upon historical net charge-offs using the greater of the last two, three, four, or five years’ loss experience. This charge-off experience may be adjusted to reflect the effects of current conditions. The Bank considers information derived from its loan risk ratings and external data related to industry and general economic trends in establishing reserves. Qualitative factors applied in the Bank’s ALLL model include the impact to the economy from the COVID-19 pandemic and reserves on loans with payment modifications as a result of the COVID-19 pandemic. There were no loans with existing modifications as a result of the COVID-19 pandemic at December 31, 2022 and 2021. At December 31, 2022 and 2021, the Bank maintained a pool of loans that were previously modified as a result of the COVID-19 pandemic. The loan balances associated with those loans that were previously modified as a result of the COVID-19 pandemic related modifications have been grouped into their own pool within the Bank’s ALLL model as management considers that they have a higher risk profile, and a higher reserve rate has been applied to this pool. As such, a higher reserve rate has been applied to this pool. Loans included in this pool totaled $70.5 million and $88.7 million at December 31, 2022 and December 31, 2021, respectively.
The unallocated allowance is determined through management’s assessment of probable losses that are in the portfolio but are not adequately captured by the other two components of the allowance, including consideration of current economic and business conditions and regulatory requirements. The unallocated allowance also reflects management’s acknowledgement of the imprecision and subjectivity that underlie the modeling of credit risk. Due to the subjectivity involved in determining the overall allowance, including the unallocated portion, the unallocated portion may fluctuate from period to period based on management’s evaluation of the factors affecting the assumptions used in calculating the allowance.
There were no significant changes in the estimation methods or fundamental assumptions used in the evaluation of the allowance for the year ended December 31, 2022 as compared to the year ended December 31, 2021. Revisions, estimates and assumptions may be made in any period in which the supporting factors indicate that loss levels may vary from the previous estimates.
| A-30 |
Effective December 31, 2012, certain mortgage loans from the former Banco division of the Bank were analyzed separately from other single family residential loans in the Bank’s loan portfolio. These loans are first mortgage loans made to the Latino market, primarily in Mecklenburg, North Carolina and surrounding counties. These loans are non-traditional mortgages in that the customer normally did not have a credit history, so all credit information was accumulated by the loan officers.
SBA PPP loans are excluded from the allowance as PPP loans are 100 percent guaranteed by the SBA.
Various regulatory agencies, as an integral part of their examination process, periodically review the Bank’s allowance. Such agencies may require adjustments to the allowance based on their judgments of information available to them at the time of their examinations. Management believes it has established the allowance for credit losses pursuant to GAAP, and has taken into account the views of its regulators and the current economic environment. Management considers the allowance adequate to cover the estimated losses inherent in the Bank’s loan portfolio as of the date of the financial statements. Although management uses the best information available to make evaluations, significant future additions to the allowance may be necessary based on changes in economic and other conditions, thus adversely affecting the operating results of the Company.
Mortgage Banking Activities
Mortgage banking income represents income from the sale of mortgage loans and fees received from borrowers and loan investors related to the Bank’s origination of single-family residential mortgage loans.
Mortgage loans serviced for others are not included in the accompanying balance sheets. The unpaid principal balances of mortgage loans serviced for others was approximately $285,000, $351,000 and $578,000 at December 31, 2022, 2021 and 2020, respectively. Mortgage servicing rights related to these loans are immaterial for all periods presented.
The Bank originates certain fixed rate mortgage loans and commits these loans for sale. The commitments to originate fixed rate mortgage loans and the commitments to sell these loans to a third party are both derivative contracts. The fair value of these derivative contracts is immaterial and has no effect on the recorded amounts in the financial statements.
Mortgage loans held for sale are carried at the lower of aggregate cost or market value. The cost of mortgage loans held for sale approximates the market value.
Premises and Equipment
Premises and equipment are stated at cost less accumulated depreciation. Depreciation is computed primarily using the straight-line method over the estimated useful lives of the assets. When assets are retired or otherwise disposed of, the cost and related accumulated depreciation are removed from the accounts, and any gain or loss is reflected in earnings for that period. The cost of maintenance and repairs that do not improve or extend the useful life of the respective asset is charged to earnings as incurred, whereas significant renewals and improvements are capitalized. The range of estimated useful lives for premises and equipment are generally as follows:
Buildings and improvements |
| 10 - 50 years |
Furniture and equipment |
| 3 - 10 years |
Other Real Estate
Foreclosed assets include all assets received in full or partial satisfaction of a loan. Foreclosed assets are reported at fair value less estimated selling costs. Any write-downs at the time of foreclosure are charged to the allowance. Subsequent to foreclosure, valuations are periodically performed by management, and a valuation allowance is established if fair value less estimated selling costs declines below carrying value. Costs relating to the development and improvement of the property are capitalized. Revenues and expenses from operations are included in other expenses. Changes in the valuation allowance are included in loss on sale and write-down of other real estate.
Income Taxes
Deferred tax assets and liabilities are recognized for the future tax consequences attributable to differences between the financial statement carrying amounts of existing assets and liabilities and their respective tax bases. Additionally, the recognition of future tax benefits, such as net operating loss carryforwards, is required to the extent that the realization of such benefits is more likely than not to occur. Deferred tax assets and liabilities are measured using enacted tax rates expected to apply to taxable income in the years in which the assets and liabilities are expected to be recovered or settled. The effect on deferred tax assets and liabilities of a change in tax rates is recognized in income tax expense in the period that includes the enactment date.
| A-31 |
In the event the future tax consequences of differences between the financial reporting bases and the tax bases of the Company’s assets and liabilities results in a deferred tax asset, an evaluation of the probability of being able to realize the future benefits indicated by such asset is required. A valuation allowance is provided for the portion of the deferred tax asset when it is more likely than not that some portion or all of the deferred tax asset will not be realized. In assessing the realizability of a deferred tax asset, management considers the scheduled reversals of deferred tax liabilities, projected future taxable income, and tax planning strategies.
Tax effects from an uncertain tax position can be recognized in the financial statements only when it is more likely than not that the tax position will be sustained upon examination by the appropriate taxing authority that would have full knowledge of all relevant information. A tax position that meets the more likely than not recognition threshold is measured at the largest amount of benefit that is greater than fifty percent likely of being realized upon ultimate settlement. Previously recognized tax positions that no longer meet the more likely than not recognition threshold should be derecognized in the first subsequent financial reporting period in which that threshold is no longer met. The Company assessed the impact of this guidance and determined that it did not have a material impact on the Company’s financial position, results of operations or disclosures.
Advertising Costs
Advertising costs are expensed as incurred.
Stock-Based Compensation
The Company has an Omnibus Stock Ownership and Long Term Incentive Plan that was approved by shareholders on May 7, 2009 (the “2009 Plan”) whereby certain stock-based rights, such as stock options, restricted stock, restricted stock units, performance units, stock appreciation rights or book value shares, may be granted to eligible directors and employees. The 2009 Plan expired on May 7, 2019 but still governs the rights and obligations of the parties for grants made thereunder. No new awards may be made after May 7, 2019.
The Company granted 16,583 restricted stock units under the 2009 Plan at a grant date fair value of $16.34 per share during the first quarter of 2015. The Company granted 5,544 restricted stock units under the 2009 Plan at a grant date fair value of $16.91 per share during the first quarter of 2016. The Company granted 4,114 restricted stock units under the 2009 Plan at a grant date fair value of $25.00 per share during the first quarter of 2017. The Company granted 3,725 restricted stock units under the 2009 Plan at a grant date fair value of $31.43 per share during the first quarter of 2018. The Company granted 5,290 restricted stock units under the 2009 Plan at a grant date fair value of $28.43 per share during the first quarter of 2019. The number of restricted stock units granted and grant date fair values for the restricted stock units granted in 2015 through 2017 have been restated to reflect the 10% stock dividend that was paid in the fourth quarter of 2017. The Company recognizes compensation expense on the restricted stock units over the vesting period (four years from the grant date for the 2015, 2016, 2017, 2018 and 2019 grants). The amount of expense recorded each period reflects the changes in the Company’s stock price during such period. As of December 31, 2022, the total unrecognized compensation expense related to the restricted stock unit grants under the 2009 Plan was $3,000.
The Company also has an Omnibus Stock Ownership and Long Term Incentive Plan that was approved by shareholders on May 7, 2020 (the “2020 Plan”) whereby certain stock-based rights, such as stock options, restricted stock, restricted stock units, performance units, stock appreciation rights or book value shares, may be granted to eligible directors and employees. A total of 300,000 shares were reserved for possible issuance under the 2020 Plan when it was adopted. As of December 31, 2021, a total of 285,305 shares out of the initial 300,000 shares reserved remain available for future issuance under the 2020 Plan. No new awards may be made after May 7, 2030 (ten years from the 2020 Plan effective date).
The Company granted 7,635 restricted stock units under the 2020 Plan at a grant date fair value of $17.08 per share during the second quarter of 2020. The Company granted 7,060 restricted stock units under the 2020 Plan at a grant date fair value of $22.04 per share during the first quarter of 2021. The Company granted 5,385 restricted stock units under the 2020 Plan at a grant date fair value of $27.99 per share during the first quarter of 2022. The Company recognizes compensation expense on the restricted stock units over the vesting period (four years from the grant date for 2020, 2021 and 2022 grants). As of December 31, 2022, the total unrecognized compensation expense related to the restricted stock unit grants under the 2020 Plan was $334,000.
| A-32 |
The Company recognized compensation expense for restricted stock units granted under the 2009 Plan and 2020 Plan of $249,000, $181,000 and $27,000 for the years ended December 31, 2022, 2021 and 2020, respectively.
Net Earnings Per Share
Net earnings per common share is based on the weighted average number of common shares outstanding during the period while the effects of potential common shares outstanding during the period are included in diluted earnings per common share. The average market price during the year is used to compute equivalent shares.
The reconciliations of the amounts used in the computation of both “basic earnings per common share” and “diluted earnings per common share” for the years ended December 31, 2022, 2021 and 2020 are as follows:
For the year ended December 31, 2022 |
|
|
|
|
|
|
|
|
| |||
|
| Net Earnings (Dollars in thousands) |
|
| Weighted Average Number of Shares |
|
| Per Share Amount |
| |||
Basic earnings per share |
| $ | 16,123 |
|
|
| 5,480,123 |
|
| $ | 2.94 |
|
Effect of dilutive securities: |
|
|
|
|
|
|
|
|
|
|
|
|
Restricted stock units - unvested |
|
| - |
|
|
| 15,467 |
|
|
|
|
|
Shares held in deferred comp plan by deferred compensation trust |
|
|
|
|
|
| 165,599 |
|
|
|
|
|
Diluted earnings per share |
| $ | 16,123 |
|
|
| 5,661,189 |
|
| $ | 2.85 |
|
For the year ended December 31, 2021 |
|
|
|
|
|
|
|
|
| |||
|
| Net Earnings (Dollars in thousands) |
|
| Weighted Average Number of Shares |
|
| Per Share Amount |
| |||
Basic earnings per share |
| $ | 15,133 |
|
|
| 5,576,099 |
|
| $ | 2.71 |
|
Effect of dilutive securities: |
|
|
|
|
|
|
|
|
|
|
|
|
Restricted stock units - unvested |
|
| - |
|
|
| 13,935 |
|
|
|
|
|
Shares held in deferred comp plan by deferred compensation trust |
|
|
|
|
|
| 158,831 |
|
|
|
|
|
Diluted earnings per share |
| $ | 15,133 |
|
|
| 5,748,865 |
|
| $ | 2.63 |
|
For the year ended December 31, 2020 |
|
|
|
|
|
|
|
|
| |||
|
| Net Earnings (Dollars in thousands) |
|
| Weighted Average Number of Shares |
|
| Per Share Amount |
| |||
Basic earnings per share |
| $ | 11,357 |
|
|
| 5,657,025 |
|
| $ | 2.01 |
|
Effect of dilutive securities: |
|
|
|
|
|
|
|
|
|
|
|
|
Restricted stock units |
|
| - |
|
|
| 14,203 |
|
|
|
|
|
Shares held in deferred comp plan by deferred compensation trust |
|
| - |
|
|
| 150,394 |
|
|
|
|
|
Diluted earnings per share |
| $ | 11,357 |
|
|
| 5,821,622 |
|
| $ | 1.95 |
|
| A-33 |
Recent Accounting Pronouncements
The following tables provide a summary of Accounting Standards Updates (“ASU”) issued by the Financial Accounting Standards Board (“FASB”) that the Company has recently adopted.
Recently Adopted Accounting Guidance
ASU | Description | Effective Date | Effect on Financial Statements or Other Significant Matters |
ASU 2020-04: Reference Rate Reform (Topic 848): Facilitation of the Effects of Reference Rate Reform on Financial Reporting | Guidance that provides optional expedients and exceptions for applying GAAP to contract modifications and hedging relationships, subject to meeting certain criteria, that reference LIBOR or another reference rate expected to be discontinued. The ASU is intended to help stakeholders during the global market-wide reference rate transition period. Therefore, it will be in effect for a limited time through December 31, 2022. | March 12, 2020 through December 31, 2022 | The adoption of this guidance did not have a material impact on the Company’s results of operations, financial position or disclosures. |
The following tables provide a summary of ASU’s issued by the FASB that the Company has not adopted as of December 31, 2022, which may impact the Company’s financial statements.
Recently Issued Accounting Guidance Not Yet Adopted
ASU | Description | Effective Date | Effect on Financial Statements or Other Significant Matters |
ASU 2016-13: Measurement of Credit Losses on Financial Instruments | Provides guidance to change the accounting for credit losses and modify the impairment model for certain debt securities. | See ASU 2019-10 below. | The Company will apply this guidance through a cumulative-effect adjustment to retained earnings as of the beginning of the year of adoption. The Company is still evaluating the impact of this guidance on its consolidated financial statements. The Company has formed a Current Expected Credit Losses (“CECL”) committee and implemented a model from a third-party vendor for running CECL calculations. The Company has developed CECL model assumptions and is comparing results to current allowance for loan loss calculations. Parallel processing of the existing allowance for loan losses model with the CECL was completed during the fourth quarter of 2022. At this time, the Company expects its allowance for credit losses related to all financial assets will increase by approximately $1.1 million upon adoption compared to its allowance for loan losses at December 31, 2022 of approximately $10.5 million. The impact of the initial adoption will be reflected in the Company's SEC Form 10-Q for the period ended March 31, 2023. |
ASU 2018-19: Codification Improvements to Topic 326, Financial Instruments—Credit Losses | Aligns the implementation date of the topic for annual financial statements of nonpublic companies with the implementation date for their interim financial statements. The guidance also clarifies that receivables arising from operating leases are not within the scope of the topic, but rather, should be accounted for in accordance with the leases topic. | See ASU 2019-10 below. | The adoption of this guidance is not expected to have a material impact on the Company’s results of operations, financial position or disclosures. See ASU 2016-13 above. |
ASU 2019-04: Codification Improvements to Topic 326, Financial Instruments—Credit Losses, Topic 815, Derivatives and Hedging, and Topic 825, Financial Instruments | Addresses unintended issues accountants flagged when implementing ASU 2016-01, Recognition and Measurement of Financial Assets and Financial Liabilities, ASU 2016-13, Measurement of Credit Losses on Financial Instruments, and ASU 2017-12, Targeted Improvements to Accounting for Hedging Activities. | See ASU 2019-10 below. | The adoption of this guidance is not expected to have a material impact on the Company’s results of operations, financial position or disclosures. See ASU 2016-13 above. |
ASU 2019-05: Financial Instruments—Credit Losses (Topic 326): Targeted Transition Relief | Guidance to provide entities with an option to irrevocably elect the fair value option, applied on an instrument-by-instrument basis for eligible instruments, upon adoption of ASU 2016-13, Measurement of Credit Losses on Financial Instruments. | See ASU 2019-10 below. | The adoption of this guidance is not expected to have a material impact on the Company’s results of operations, financial position or disclosures. See ASU 2016-13 above. |
| A-34 |
ASU | Description | Effective Date | Effect on Financial Statements or Other Significant Matters |
ASU 2019-10: Financial Instruments Credit Losses (Topic 326), Derivatives and Hedging (Topic 815), and Leases (Topic 842): Effective Dates | Guidance to defer the effective dates for private companies, not-for-profit organizations, and certain smaller reporting companies applying standards on current expected credit losses (CECL), leases and hedging. | January 1, 2023 | The adoption of this guidance is not expected to have a material impact on the Company s results of operations, financial position or disclosures. |
ASU 2019-11: Codification Improvements to Topic 326, Financial Instruments Credit Losses | Guidance that addresses issues raised by stakeholders during the implementation of ASU 2016-13, Financial Instruments Credit Losses (Topic 326): Measurement of Credit Losses on Financial Instruments. The amendments affect a variety of Topics in the ASC. | January 1, 2023 | The adoption of this guidance is not expected to have a material impact on the Company s results of operations, financial position or disclosures. |
ASU 2020-03: Codification Improvements to Financial Instruments | Guidance to clarify that the contractual term of a net investment in a lease, determined in accordance with the leases standard, should be the contractual term used to measure expected credit losses under ASC 326. | January 1, 2023 | The adoption of this guidance is not expected to have a material impact on the Company s results of operations, financial position or disclosures. |
ASU 2022-02: Financial Instruments - Credit Losses (Topic 326): Troubled Debt Restructurings and Vintage Disclosures | Eliminates the guidance on troubled debt restructurings (TDRs) for creditors in ASC 310-40 2 and amends the guidance on vintage disclosures to require disclosure of current-period gross write-offs by year of origination. | January 1, 2023 | The adoption of this guidance is not expected to have a material impact on the Company s results of operations or financial position but will impact future disclosure requirements and reduce individually evaluated loan totals. |
Other accounting standards that have been issued or proposed by FASB or other standards-setting bodies are not expected to have a material impact on the Company’s results of operations, financial position or disclosures.
Reclassification
Certain amounts in the 2021 and 2020 consolidated financial statements have been reclassified to conform to the 2022 presentation.
(2) Investment Securities
Investment securities available for sale at December 31, 2022 and 2021 are as follows:
(Dollars in thousands) |
|
|
|
|
|
|
|
| ||||||||
|
| December 31, 2022 |
| |||||||||||||
|
| Amortized Cost |
|
| Gross Unrealized Gains |
|
| Gross Unrealized Losses |
|
| Fair Value |
| ||||
U.S Treasuries |
| $ | 10,951 |
|
|
| - |
|
|
| 1,137 |
|
|
| 9,814 |
|
U.S. Government sponsored enterprises |
|
| 12,245 |
|
|
| - |
|
|
| 706 |
|
|
| 11,539 |
|
Mortgage-backed securities |
|
| 299,222 |
|
|
| 445 |
|
|
| 25,829 |
|
|
| 273,838 |
|
State and political subdivisions |
|
| 184,768 |
|
|
| 91 |
|
|
| 34,656 |
|
|
| 150,203 |
|
Total |
| $ | 507,186 |
|
|
| 536 |
|
|
| 62,328 |
|
|
| 445,394 |
|
(Dollars in thousands) |
|
|
|
|
|
|
|
| ||||||||
|
| December 31, 2021 |
| |||||||||||||
|
| Amortized Cost |
|
| Gross Unrealized Gains |
|
| Gross Unrealized Losses |
|
| Fair Value |
| ||||
U.S Treasuries |
| $ | 7,964 |
|
|
| - |
|
|
| 75 |
|
|
| 7,889 |
|
U.S. Government sponsored enterprises |
|
| 14,252 |
|
|
| 200 |
|
|
| 185 |
|
|
| 14,267 |
|
Mortgage-backed securities |
|
| 218,402 |
|
|
| 1,769 |
|
|
| 3,019 |
|
|
| 217,152 |
|
State and political subdivisions |
|
| 165,804 |
|
|
| 3,694 |
|
|
| 2,257 |
|
|
| 167,241 |
|
Total |
| $ | 406,422 |
|
|
| 5,663 |
|
|
| 5,536 |
|
|
| 406,549 |
|
| A-35 |
The current fair value and associated unrealized losses on investments in debt securities with unrealized losses at December 31, 2022 and 2021 are summarized in the tables below, with the length of time the individual securities have been in a continuous loss position.
(Dollars in thousands) |
|
|
|
|
|
|
|
|
|
|
|
|
|
|
|
|
|
| ||||||
|
| December 31, 2022 |
| |||||||||||||||||||||
|
| Less than 12 Months |
|
| 12 Months or More |
|
| Total |
| |||||||||||||||
|
| Fair Value |
|
| Unrealized Losses |
|
| Fair Value |
|
| Unrealized Losses |
|
| Fair Value |
|
| Unrealized Losses |
| ||||||
U.S. Treasuries |
| $ | 2,878 |
|
|
| 104 |
|
|
| 6,936 |
|
|
| 1,033 |
|
|
| 9,814 |
|
|
| 1,137 |
|
U.S. Government sponsored enterprises |
|
| 2,904 |
|
|
| 87 |
|
|
| 8,635 |
|
|
| 619 |
|
|
| 11,539 |
|
|
| 706 |
|
Mortgage-backed securities |
|
| 128,241 |
|
|
| 8,740 |
|
|
| 120,464 |
|
|
| 17,089 |
|
|
| 248,705 |
|
|
| 25,829 |
|
State and political subdivisions |
|
| 65,880 |
|
|
| 7,766 |
|
|
| 76,291 |
|
|
| 26,890 |
|
|
| 142,171 |
|
|
| 34,656 |
|
Total |
| $ | 199,903 |
|
|
| 16,697 |
|
|
| 212,326 |
|
|
| 45,631 |
|
|
| 412,229 |
|
|
| 62,328 |
|
(Dollars in thousands) |
|
|
|
|
|
|
|
|
|
|
|
|
|
|
|
|
|
| ||||||
|
| December 31, 2021 |
| |||||||||||||||||||||
|
| Less than 12 Months |
|
| 12 Months or More |
|
| Total |
| |||||||||||||||
|
| Fair Value |
|
| Unrealized Losses |
|
| Fair Value |
|
| Unrealized Losses |
|
| Fair Value |
|
| Unrealized Losses |
| ||||||
U.S. Treasuries |
| $ | 7,889 |
|
|
| 75 |
|
|
| - |
|
|
| - |
|
|
| 7,889 |
|
|
| 75 |
|
U.S. Government sponsored enterprises |
|
| 5,232 |
|
|
| 15 |
|
|
| 3,263 |
|
|
| 170 |
|
|
| 8,495 |
|
|
| 185 |
|
Mortgage-backed securities |
|
| 131,483 |
|
|
| 2,477 |
|
|
| 19,632 |
|
|
| 542 |
|
|
| 151,115 |
|
|
| 3,019 |
|
State and political subdivisions |
|
| 80,076 |
|
|
| 1,981 |
|
|
| 5,922 |
|
|
| 276 |
|
|
| 85,998 |
|
|
| 2,257 |
|
Total |
| $ | 224,680 |
|
|
| 4,548 |
|
|
| 28,817 |
|
|
| 988 |
|
|
| 253,497 |
|
|
| 5,536 |
|
At December 31, 2022, unrealized losses in the investment securities portfolio relating to debt securities totaled $62.3 million. The unrealized losses on these debt securities arose due to changing interest rates and are considered to be temporary. From the December 31, 2022 tables above, all three of the U.S. Treasury securities, 149 of the 158 securities issued by state and political subdivisions contained unrealized losses, all seven of the securities issued by U.S. Government sponsored enterprises, and 123 of the 133 mortgage-backed securities, contained unrealized losses. These unrealized losses are considered temporary because of acceptable financial condition and results of operations on each security and the repayment sources of principal and interest on U.S. Government sponsored enterprises, including mortgage-backed securities, are government backed.
The Company periodically evaluates its investments for any impairment which would be deemed other-than-temporary. No investment impairments were deemed other-than-temporary in 2022, 2021 or 2020.
The amortized cost and estimated fair value of investment securities available for sale at December 31, 2022, by contractual maturity, are shown below. Expected maturities of mortgage-backed securities will differ from contractual maturities because borrowers have the right to call or prepay obligations with or without call or prepayment penalties.
December 31, 2022 |
|
|
|
|
|
| ||
(Dollars in thousands) |
|
|
|
|
|
| ||
|
| Amortized Cost |
|
| Fair Value |
| ||
Due within one year |
| $ | 240 |
|
|
| 240 |
|
Due from one to five years |
|
| 8,434 |
|
|
| 8,128 |
|
Due from five to ten years |
|
| 58,540 |
|
|
| 49,599 |
|
Due after ten years |
|
| 140,750 |
|
|
| 113,589 |
|
Mortgage-backed securities |
|
| 299,222 |
|
|
| 273,838 |
|
Total |
| $ | 507,186 |
|
|
| 445,394 |
|
No securities available for sale were sold during 2022 and 2021. During 2020, proceeds from sales of securities available for sale were $56.3 million and resulted in gross gains of $2.7 million and gross losses of $56,000.
| A-36 |
Securities with a fair value of approximately $96.0 million and $98.6 million at December 31, 2022 and 2021, respectively, were pledged to secure public deposits, FHLB borrowings and for other purposes as required by law.
GAAP establishes a framework for measuring fair value and expands disclosures about fair value measurements. There is a three-level fair value hierarchy for fair value measurements. Level 1 inputs are quoted prices in active markets for identical assets or liabilities that a company has the ability to access at the measurement date. Level 2 inputs are inputs other than quoted prices included within Level 1 that are observable for the asset or liability, either directly or indirectly. Level 3 inputs are unobservable inputs for the asset or liability. The table below presents the balance of securities available for sale, which are measured at fair value on a recurring basis by level within the fair value hierarchy as of December 31, 2022 and 2021.
(Dollars in thousands) |
|
|
|
|
|
|
|
|
|
|
|
| ||||
|
| December 31, 2022 |
| |||||||||||||
|
| Fair Value Measurements |
|
| Level 1 Valuation |
|
| Level 2 Valuation |
|
| Level 3 Valuation |
| ||||
U. S Treasuries |
| $ | 9,814 |
|
|
| - |
|
|
| 9,814 |
|
|
| - |
|
U.S. Government sponsored enterprises |
| $ | 11,539 |
|
|
| - |
|
|
| 11,539 |
|
|
| - |
|
Mortgage-backed securities |
| $ | 273,838 |
|
|
| - |
|
|
| 273,838 |
|
|
| - |
|
State and political subdivisions |
| $ | 150,203 |
|
|
| - |
|
|
| 150,203 |
|
|
| - |
|
(Dollars in thousands) |
|
|
|
|
|
|
|
|
|
|
|
| ||||
|
| December 31, 2021 |
| |||||||||||||
|
| Fair Value Measurements |
|
| Level 1 Valuation |
|
| Level 2 Valuation |
|
| Level 3 Valuation |
| ||||
U. S Treasuries |
| $ | 7,889 |
|
|
| - |
|
|
| 7,889 |
|
|
| -88.7 |
|
U.S. Government sponsored enterprises |
| $ | 14,267 |
|
|
| - |
|
|
| 14,267 |
|
|
| - |
|
Mortgage-backed securities |
| $ | 217,152 |
|
|
| - |
|
|
| 217,152 |
|
|
| - |
|
State and political subdivisions |
| $ | 167,241 |
|
|
| - |
|
|
| 167,241 |
|
|
| - |
|
Fair values of investment securities available for sale are determined by obtaining quoted prices on nationally recognized securities exchanges when available. If quoted prices are not available, fair value is determined using matrix pricing, which is a mathematical technique used widely in the industry to value debt securities without relying exclusively on quoted prices for the specific securities but rather by relying on the securities’ relationship to other benchmark quoted securities.
(3) Loans
Major classifications of loans at December 31, 2022 and 2021 are summarized as follows:
| A-37 |
(Dollars in thousands) |
|
|
|
|
|
| ||
|
| December 31, 2022 |
|
| December 31, 2021 |
| ||
Real estate loans: |
|
|
|
|
|
| ||
Construction and land development |
| $ | 114,446 |
|
|
| 95,760 |
|
Single-family residential |
|
| 322,262 |
|
|
| 266,111 |
|
Single-family residential - Banco de la Gente non-traditional |
|
| 20,019 |
|
|
| 23,147 |
|
Commercial |
|
| 406,750 |
|
|
| 337,841 |
|
Multifamily and farmland |
|
| 65,562 |
|
|
| 58,366 |
|
Total real estate loans |
|
| 929,039 |
|
|
| 781,225 |
|
|
|
|
|
|
|
|
|
|
Loans not secured by real estate: |
|
|
|
|
|
|
|
|
Commercial loans |
|
| 81,307 |
|
|
| 91,172 |
|
Farm loans |
|
| 938 |
|
|
| 796 |
|
Consumer loans |
|
| 6,834 |
|
|
| 6,436 |
|
All other loans |
|
| 14,490 |
|
|
| 5,240 |
|
|
|
|
|
|
|
|
|
|
Total loans |
|
| 1,032,608 |
|
|
| 884,869 |
|
|
|
|
|
|
|
|
|
|
Less allowance for loan losses |
|
| (10,494 | ) |
|
| (9,355 | ) |
|
|
|
|
|
|
|
|
|
Total net loans |
| $ | 1,022,114 |
|
|
| 875,514 |
|
The above table includes deferred costs, net of deferred fees, totaling $909,000 at December 31, 2022. The above table includes deferred costs, net of deferred fees, totaling $198,000 at December 31, 2021 including $945,000 in deferred PPP loan fees.
The Bank makes loans and extensions of credit primarily within the Catawba Valley region of North Carolina, which encompasses Catawba, Alexander, Iredell and Lincoln counties and also in Mecklenburg, Wake, Rowan and Forsyth counties of North Carolina. Although the Bank has a diversified loan portfolio, a substantial portion of the loan portfolio is collateralized by improved and unimproved real estate, the value of which is dependent upon the real estate market. Risk characteristics of the major components of the Bank’s loan portfolio are discussed below:
| · | Construction and land development loans – The risk of loss is largely dependent on the initial estimate of whether the property’s value at completion equals or exceeds the cost of property construction and the availability of take-out financing. During the construction phase, a number of factors can result in delays or cost overruns. If the estimate is inaccurate or if actual construction costs exceed estimates, the value of the property securing the loan may be insufficient to ensure full repayment when completed through a permanent loan, sale of the property, or by seizure of collateral. |
|
|
|
| · | Single-family residential loans – Declining home sales volumes, decreased real estate values and higher than normal levels of unemployment could contribute to losses on these loans. |
|
|
|
| · | Commercial real estate loans – Repayment is dependent on income being generated in amounts sufficient to cover operating expenses and debt service. These loans also involve greater risk because they are generally not fully amortizing over the loan period, but rather have a balloon payment due at maturity. A borrower’s ability to make a balloon payment typically will depend on being able to either refinance the loan or timely sell the underlying property. |
|
|
|
| · | Commercial loans – Repayment is generally dependent upon the successful operation of the borrower’s business. In addition, the collateral securing the loans may depreciate over time, be difficult to appraise, be illiquid, or fluctuate in value based on the success of the business. |
|
|
|
| · | Multifamily and farmland loans – Decreased real estate values and higher than normal levels of unemployment could contribute to losses on these loans. |
| A-38 |
Loans are considered past due if the required principal and interest payments have not been received within 30 days of the date such payments were due. Loans are placed on non-accrual status when, in management’s opinion, the borrower may be unable to meet payment obligations as they become due, as well as when required by regulatory provisions. Generally, a loan is placed on non-accrual status when it is over 90 days past due and there is reasonable doubt that all principal will be collected. When interest accrual is discontinued, all unpaid accrued interest is reversed. Interest income is subsequently recognized only to the extent cash payments are received in excess of principal due. Loans are returned to accrual status when all the principal and interest amounts contractually due are brought current and future payments are reasonably assured.
On March 27, 2020, President Trump signed the CARES Act, which established a $2 trillion economic stimulus package, including cash payments to individuals, supplemental unemployment insurance benefits and a $349 billion loan program administered through the PPP. Under the PPP, small businesses, sole proprietorships, independent contractors and self-employed individuals were able to apply for loans from existing SBA lenders and other approved regulated lenders, subject to certain limitations and eligibility criteria. A second round of PPP funding provided a total of $320 billion additional funding for the PPP. The Bank participated as a lender in the PPP. Total PPP loans originated during the years ended December 31, 2020 and 2021 amounted to $128.1 million. The outstanding balance of PPP loans was $103,000 and $18.0 million at December 31, 2022 and 2021, respectively. These loans are classified as commercial loans in the tables above. The Bank recognized $948,000 and $3.4 million of PPP loan fee income for the year ended December 31, 2022 and year ended December, 2021, respectively.
The following tables present an age analysis of past due loans, by loan type, as of December 31, 2022 and 2021:
December 31, 2022 |
|
|
|
|
|
|
|
|
|
|
|
|
|
|
|
|
|
| ||||||
(Dollars in thousands) |
|
|
|
|
|
|
|
|
|
|
|
|
|
|
|
|
|
| ||||||
|
| Loans 30-89 Days Past Due |
|
| Loans 90 or More Days Past Due |
|
| Total Past Due Loans |
|
| Total Current Loans |
|
| Total Loans |
|
| Accruing Loans 90 or More Days Past Due |
| ||||||
Real estate loans: |
|
|
|
|
|
|
|
|
|
|
|
|
|
|
|
|
|
| ||||||
Construction and land development |
| $ | 363 |
|
|
| - |
|
|
| 363 |
|
|
| 114,083 |
|
|
| 114,446 |
|
|
| - |
|
Single-family residential |
|
| 4,318 |
|
|
| 256 |
|
|
| 4,574 |
|
|
| 317,688 |
|
|
| 322,262 |
|
|
| - |
|
Single-family residential - Banco de la Gente non-traditional |
|
| 2,977 |
|
|
| 264 |
|
|
| 3,241 |
|
|
| 16,778 |
|
|
| 20,019 |
|
|
| - |
|
Commercial |
|
| 306 |
|
|
| - |
|
|
| 306 |
|
|
| 406,444 |
|
|
| 406,750 |
|
|
| - |
|
Multifamily and farmland |
|
| - |
|
|
| - |
|
|
| - |
|
|
| 65,562 |
|
|
| 65,562 |
|
|
| - |
|
Total real estate loans |
|
| 7,964 |
|
|
| 520 |
|
|
| 8,484 |
|
|
| 920,555 |
|
|
| 929,039 |
|
|
| - |
|
|
|
|
|
|
|
|
|
|
|
|
|
|
|
|
|
|
|
|
|
|
|
|
|
|
Loans not secured by real estate: |
|
|
|
|
|
|
|
|
|
|
|
|
|
|
|
|
|
|
|
|
|
|
|
|
Commercial loans |
|
| 3 |
|
|
| - |
|
|
| 3 |
|
|
| 81,304 |
|
|
| 81,307 |
|
|
| - |
|
Farm loans |
|
| - |
|
|
| - |
|
|
| - |
|
|
| 938 |
|
|
| 938 |
|
|
| - |
|
Consumer loans |
|
| 71 |
|
|
| - |
|
|
| 71 |
|
|
| 6,763 |
|
|
| 6,834 |
|
|
| - |
|
All other loans |
|
| - |
|
|
| - |
|
|
| - |
|
|
| 14,490 |
|
|
| 14,490 |
|
|
| - |
|
Total loans |
| $ | 8,038 |
|
|
| 520 |
|
|
| 8,558 |
|
|
| 1,024,050 |
|
|
| 1,032,608 |
|
|
| - |
|
December 31, 2021 |
|
|
|
|
|
|
|
|
|
|
|
|
|
|
|
|
|
| ||||||
(Dollars in thousands) |
|
|
|
|
|
|
|
|
|
|
|
|
|
|
|
|
|
| ||||||
|
| Loans 30-89 Days Past Due |
|
| Loans 90 or More Days Past Due |
|
| Total Past Due Loans |
|
| Total Current Loans |
|
| Total Loans |
|
| Accruing Loans 90 or More Days Past Due |
| ||||||
Real estate loans: |
|
|
|
|
|
|
|
|
|
|
|
|
|
|
|
|
|
| ||||||
Construction and land development |
| $ | - |
|
|
| - |
|
|
| - |
|
|
| 95,760 |
|
|
| 95,760 |
|
|
| - |
|
Single-family residential |
|
| 2,323 |
|
|
| 634 |
|
|
| 2,957 |
|
|
| 263,154 |
|
|
| 266,111 |
|
|
| - |
|
Single-family residential - Banco de la Gente non-traditional |
|
| 2,593 |
|
|
| 112 |
|
|
| 2,705 |
|
|
| 20,442 |
|
|
| 23,147 |
|
|
| - |
|
Commercial |
|
| 488 |
|
|
| - |
|
|
| 488 |
|
|
| 337,353 |
|
|
| 337,841 |
|
|
| - |
|
Multifamily and farmland |
|
| - |
|
|
| - |
|
|
| - |
|
|
| 58,366 |
|
|
| 58,366 |
|
|
| - |
|
Total real estate loans |
|
| 5,404 |
|
|
| 746 |
|
|
| 6,150 |
|
|
| 775,075 |
|
|
| 781,225 |
|
|
| - |
|
|
|
|
|
|
|
|
|
|
|
|
|
|
|
|
|
|
|
|
|
|
|
|
|
|
Loans not secured by real estate: |
|
|
|
|
|
|
|
|
|
|
|
|
|
|
|
|
|
|
|
|
|
|
|
|
Commercial loans |
|
| 43 |
|
|
| - |
|
|
| 43 |
|
|
| 91,129 |
|
|
| 91,172 |
|
|
| - |
|
Farm loans |
|
| - |
|
|
| - |
|
|
| - |
|
|
| 796 |
|
|
| 796 |
|
|
| - |
|
Consumer loans |
|
| 38 |
|
|
| - |
|
|
| 38 |
|
|
| 6,398 |
|
|
| 6,436 |
|
|
| - |
|
All other loans |
|
| - |
|
|
| - |
|
|
| - |
|
|
| 5,240 |
|
|
| 5,240 |
|
|
| - |
|
Total loans |
| $ | 5,485 |
|
|
| 746 |
|
|
| 6,231 |
|
|
| 878,638 |
|
|
| 884,869 |
|
|
| - |
|
| A-39 |
The following table presents the Bank’s non-accrual loans as of December 31, 2022 and 2021:
(Dollars in thousands) |
|
|
|
|
|
| ||
|
| December 31, 2022 |
|
| December 31, 2021 |
| ||
Real estate loans: |
|
|
|
|
|
| ||
Construction and land development |
| $ | 53 |
|
|
| - |
|
Single-family residential |
|
| 1,914 |
|
|
| 1,642 |
|
Single-family residential - Banco de la Gente non-traditional |
|
| 1,532 |
|
|
| 1,232 |
|
Commercial |
|
| 129 |
|
|
| 200 |
|
Multifamily and farmland |
|
| 91 |
|
|
| 105 |
|
Total real estate loans |
|
| 3,719 |
|
|
| 3,179 |
|
|
|
|
|
|
|
|
|
|
Loans not secured by real estate: |
|
|
|
|
|
|
|
|
Commercial loans |
|
| - |
|
|
| 49 |
|
Consumer loans |
|
| 9 |
|
|
| 2 |
|
Total |
| $ | 3,728 |
|
|
| 3,230 |
|
At the end of each reporting period, the Bank determines which loans are impaired. Accordingly, the Bank’s impaired loans are reported at their estimated fair value on a non-recurring basis. An allowance for each impaired loan that is collateral-dependent is calculated based on the fair value of its collateral. The fair value of the collateral is based on appraisals performed by REAS, a subsidiary of the Bank. REAS is staffed by certified appraisers who also perform appraisals for third parties. Factors, including the assumptions and techniques utilized by the appraiser, are considered by management in determining the fair value of collateral. If the recorded investment in the impaired loan exceeds the measure of fair value of the collateral, a valuation allowance is recorded as a component of the allowance for loan losses. An allowance for each impaired loan that is not collateral dependent is calculated based on the present value of projected cash flows. If the recorded investment in the impaired loan exceeds the present value of projected cash flows, a valuation allowance is recorded as a component of the allowance for loan losses. Impaired loans under $250,000 are not individually evaluated for impairment with the exception of the Bank’s Troubled Debt Restructurings (“TDR loans”) in the residential mortgage loan portfolio, which are individually evaluated for impairment. Impaired loans collectively evaluated for impairment totaled $4.9 million and $5.3 million at December 31, 2022 and 2021, respectively. Accruing impaired loans were $15.4 and $18.3 million at December 31, 2022 and December 31, 2021, respectively. Interest income recognized on accruing impaired loans was $862,000 and $1.0 million for the years ended December 31, 2022 and 2021, respectively. No interest income is recognized on non-accrual impaired loans subsequent to their classification as non-accrual.
The following tables present the Bank’s impaired loans as of December 31, 2022, 2021 and 2020:
December 31, 2022 |
|
|
|
|
|
|
|
|
|
|
|
|
|
|
|
|
|
|
|
|
| |||||||
(Dollars in thousands) |
|
|
|
|
|
|
|
|
|
|
|
|
|
|
|
|
|
|
|
|
| |||||||
|
|
|
|
|
|
|
|
|
|
|
|
|
|
|
|
|
|
|
|
|
| |||||||
|
| Unpaid Contractual Principal Balance |
|
| Recorded Investment With No Allowance |
|
| Recorded Investment With Allowance |
|
| Recorded Investment in Impaired Loans |
|
| Related Allowance |
|
| Average Outstanding Impaired Loans |
|
| YTD Interest Income Recognized |
| |||||||
Real estate loans: |
|
|
|
|
|
|
|
|
|
|
|
|
|
|
|
|
|
|
|
|
| |||||||
Construction and land development |
| $ | 110 |
|
|
| - |
|
|
| 110 |
|
|
| 110 |
|
|
| 2 |
|
|
| 75 |
|
|
| 8 |
|
Single-family residential |
|
| 3,912 |
|
|
| 236 |
|
|
| 3,300 |
|
|
| 3,536 |
|
|
| 60 |
|
|
| 5,194 |
|
|
| 194 |
|
Single-family residential - Banco de la Gente non-traditional |
|
| 10,441 |
|
|
| - |
|
|
| 9,748 |
|
|
| 9,748 |
|
|
| 611 |
|
|
| 8,757 |
|
|
| 552 |
|
Commercial |
|
| 1,785 |
|
|
| 421 |
|
|
| 1,346 |
|
|
| 1,767 |
|
|
| 9 |
|
|
| 1,916 |
|
|
| 93 |
|
Multifamily and farmland |
|
| 104 |
|
|
| - |
|
|
| 91 |
|
|
| 91 |
|
|
| - |
|
|
| 96 |
|
|
| 5 |
|
Total impaired real estate loans |
|
| 16,352 |
|
|
| 657 |
|
|
| 14,595 |
|
|
| 15,252 |
|
|
| 682 |
|
|
| 16,038 |
|
|
| 852 |
|
|
|
|
|
|
|
|
|
|
|
|
|
|
|
|
|
|
|
|
|
|
|
|
|
|
|
|
|
|
Loans not secured by real estate: |
|
|
|
|
|
|
|
|
|
|
|
|
|
|
|
|
|
|
|
|
|
|
|
|
|
|
|
|
Commercial loans |
|
| 116 |
|
|
| - |
|
|
| 116 |
|
|
| 116 |
|
|
| 1 |
|
|
| 137 |
|
|
| 8 |
|
Consumer loans |
|
| 11 |
|
|
| - |
|
|
| 9 |
|
|
| 9 |
|
|
| - |
|
|
| 15 |
|
|
| 2 |
|
Total impaired loans |
| $ | 16,479 |
|
|
| 657 |
|
|
| 14,720 |
|
|
| 15,377 |
|
|
| 683 |
|
|
| 16,190 |
|
|
| 862 |
|
| A-40 |
December 31, 2021 |
|
|
|
|
|
|
|
|
|
|
|
|
|
|
|
|
|
|
|
|
| |||||||
(Dollars in thousands) |
|
|
|
|
|
|
|
|
|
|
|
|
|
|
|
|
|
|
|
|
| |||||||
|
|
|
|
|
|
|
|
|
|
|
|
|
|
|
|
|
|
|
|
|
| |||||||
|
| Unpaid Contractual Principal Balance |
|
| Recorded Investment With No Allowance |
|
| Recorded Investment With Allowance |
|
| Recorded Investment in Impaired Loans |
|
| Related Allowance |
|
| Average Outstanding Impaired Loans |
|
| YTD Interest Income Recognized |
| |||||||
Real estate loans: |
|
|
|
|
|
|
|
|
|
|
|
|
|
|
|
|
|
|
|
|
| |||||||
Construction and land development |
| $ | 73 |
|
|
| - |
|
|
| 73 |
|
|
| 73 |
|
|
| 3 |
|
|
| 82 |
|
|
| 6 |
|
Single-family residential |
|
| 5,138 |
|
|
| 524 |
|
|
| 4,374 |
|
|
| 4,898 |
|
|
| 86 |
|
|
| 6,017 |
|
|
| 253 |
|
Single-family residential - Banco de la Gente non-traditional |
|
| 11,753 |
|
|
| - |
|
|
| 10,922 |
|
|
| 10,922 |
|
|
| 687 |
|
|
| 10,325 |
|
|
| 609 |
|
Commercial |
|
| 2,138 |
|
|
| 435 |
|
|
| 1,608 |
|
|
| 2,043 |
|
|
| 11 |
|
|
| 2,385 |
|
|
| 109 |
|
Multifamily and farmland |
|
| 113 |
|
|
| - |
|
|
| 105 |
|
|
| 105 |
|
|
| - |
|
|
| 110 |
|
|
| 6 |
|
Total impaired real estate loans |
|
| 19,215 |
|
|
| 959 |
|
|
| 17,082 |
|
|
| 18,041 |
|
|
| 787 |
|
|
| 18,919 |
|
|
| 983 |
|
|
|
|
|
|
|
|
|
|
|
|
|
|
|
|
|
|
|
|
|
|
|
|
|
|
|
|
|
|
Loans not secured by real estate: |
|
|
|
|
|
|
|
|
|
|
|
|
|
|
|
|
|
|
|
|
|
|
|
|
|
|
|
|
Commercial loans |
|
| 282 |
|
|
| 49 |
|
|
| 170 |
|
|
| 219 |
|
|
| 2 |
|
|
| 271 |
|
|
| 19 |
|
Consumer loans |
|
| 8 |
|
|
| - |
|
|
| 4 |
|
|
| 4 |
|
|
| - |
|
|
| 11 |
|
|
| 1 |
|
Total impaired loans |
| $ | 19,505 |
|
|
| 1,008 |
|
|
| 17,256 |
|
|
| 18,264 |
|
|
| 789 |
|
|
| 19,201 |
|
|
| 1,003 |
|
December 31, 2020 |
|
|
|
|
|
|
|
|
|
|
|
|
|
|
|
|
|
|
|
|
| |||||||
(Dollars in thousands) |
|
|
|
|
|
|
|
|
|
|
|
|
|
|
|
|
|
|
|
|
| |||||||
|
|
|
|
|
|
|
|
|
|
|
|
|
|
|
|
|
|
|
|
|
| |||||||
|
| Unpaid Contractual Principal Balance |
|
| Recorded Investment With No Allowance |
|
| Recorded Investment With Allowance |
|
| Recorded Investment in Impaired Loans |
|
| Related Allowance |
|
| Average Outstanding Impaired Loans |
|
| YTD Interest Income Recognized |
| |||||||
Real estate loans: |
|
|
|
|
|
|
|
|
|
|
|
|
|
|
|
|
|
|
|
|
| |||||||
Construction and land development |
| $ | 108 |
|
|
| - |
|
|
| 108 |
|
|
| 108 |
|
|
| 4 |
|
|
| 134 |
|
|
| 8 |
|
Single-family residential |
|
| 5,302 |
|
|
| 379 |
|
|
| 4,466 |
|
|
| 4,845 |
|
|
| 33 |
|
|
| 4,741 |
|
|
| 262 |
|
Single-family residential - Banco de la Gente non-traditional |
|
| 13,417 |
|
|
| - |
|
|
| 12,753 |
|
|
| 12,753 |
|
|
| 862 |
|
|
| 13,380 |
|
|
| 798 |
|
Commercial |
|
| 2,999 |
|
|
| 1,082 |
|
|
| 1,891 |
|
|
| 2,973 |
|
|
| 14 |
|
|
| 2,940 |
|
|
| 139 |
|
Multifamily and farmland |
|
| 119 |
|
|
| - |
|
|
| 117 |
|
|
| 117 |
|
|
| - |
|
|
| 29 |
|
|
| 6 |
|
Total impaired real estate loans |
|
| 21,945 |
|
|
| 1,461 |
|
|
| 19,335 |
|
|
| 20,796 |
|
|
| 913 |
|
|
| 21,224 |
|
|
| 1,213 |
|
|
|
|
|
|
|
|
|
|
|
|
|
|
|
|
|
|
|
|
|
|
|
|
|
|
|
|
|
|
Loans not secured by real estate: |
|
|
|
|
|
|
|
|
|
|
|
|
|
|
|
|
|
|
|
|
|
|
|
|
|
|
|
|
Commercial loans |
|
| 515 |
|
|
| 211 |
|
|
| 244 |
|
|
| 455 |
|
|
| 5 |
|
|
| 564 |
|
|
| 32 |
|
Consumer loans |
|
| 41 |
|
|
| - |
|
|
| 37 |
|
|
| 37 |
|
|
| 1 |
|
|
| 60 |
|
|
| 5 |
|
Total impaired loans |
| $ | 22,501 |
|
|
| 1,672 |
|
|
| 19,616 |
|
|
| 21,288 |
|
|
| 919 |
|
|
| 21,848 |
|
|
| 1,250 |
|
The fair value measurements for mortgage loans held for sale, impaired loans and other real estate on a non-recurring basis at December 31, 2022 and 2021 are presented below. The Bank’s valuation methodology is discussed in Note 16.
(Dollars in thousands) |
|
|
|
|
|
|
|
|
|
|
|
| ||||
|
| Fair Value Measurements December 31, 2022 |
|
| Level 1 Valuation |
|
| Level 2 Valuation |
|
| Level 3 Valuation |
| ||||
Mortgage loans held for sale |
| $ | 211 |
|
|
| - |
|
|
| - |
|
|
| 211 |
|
Impaired loans |
| $ | 14,694 |
|
|
| - |
|
|
| - |
|
|
| 14,694 |
|
(Dollars in thousands) |
|
|
|
|
|
|
|
|
|
|
|
| ||||
|
| Fair Value Measurements December 31, 2021 |
|
| Level 1 Valuation |
|
| Level 2 Valuation |
|
| Level 3 Valuation |
| ||||
Mortgage loans held for sale |
| $ | 3,637 |
|
|
| - |
|
|
| - |
|
|
| 3,637 |
|
Impaired loans |
| $ | 17,475 |
|
|
| - |
|
|
| - |
|
|
| 17,475 |
|
| A-41 |
|
| Fair Value December 31, 2022 |
|
| Fair Value December 31, 2021 |
|
| Valuation Technique |
| Significant Unobservable Inputs |
|
| General Range of Significant Unobservable Input Values |
| ||||
Mortgage loans held for sale |
| $ | 211 |
|
| $ | 3,637 |
|
| Rate lock commitment |
|
| N/A |
|
| N/A |
| |
Impaired loans |
| $ | 14,694 |
|
| $ | 17,475 |
|
| Appraised value and discounted cash flows |
| Discounts to reflect current market conditions and ultimate collectability |
|
| 0 - 25% |
| ||
The following table presents changes in the allowance for loan losses for the year ended December 31, 2022. PPP loans are excluded from the allowance for loan losses as PPP loans are 100 percent guaranteed by the SBA.
(Dollars in thousands) |
|
|
|
|
|
|
|
|
|
|
|
|
|
|
|
|
|
|
|
|
|
|
|
|
|
|
|
|
|
| ||||||||||
|
| Real Estate Loans |
|
|
|
|
|
|
|
|
|
|
|
|
|
|
|
| ||||||||||||||||||||||
|
| Construction and Land Development |
|
| Single-Family Residential |
|
| Single-Family Residential - Banco de la Gente Non-traditional |
|
| Commercial |
|
| Multifamily and Farmland |
|
| Commercial |
|
| Farm |
|
| Consumer and All Other |
|
| Unallocated |
|
| Total |
| ||||||||||
Twelve months ended December 31, 2022 |
|
|
|
|
|
|
|
|
|
|
|
|
|
|
|
|
|
|
|
|
|
|
|
|
|
|
|
|
|
| ||||||||||
Allowance for loan losses: |
|
|
|
|
|
|
|
|
|
|
|
|
|
|
|
|
|
|
|
|
|
|
|
|
|
|
|
|
|
| ||||||||||
Beginning balance |
| $ | 1,193 |
|
|
| 2,013 |
|
|
| 864 |
|
|
| 2,234 |
|
|
| 150 |
|
|
| 711 |
|
|
| - |
|
|
| 110 |
|
|
| 2,080 |
|
|
| 9,355 |
|
Charge-offs |
|
| - |
|
|
| (128 | ) |
|
| - |
|
|
| - |
|
|
| - |
|
|
| (33 | ) |
|
| - |
|
|
| (591 | ) |
|
| - |
|
|
| (752 | ) |
Recoveries |
|
| - |
|
|
| 229 |
|
|
| - |
|
|
| 9 |
|
|
| - |
|
|
| 72 |
|
|
| - |
|
|
| 109 |
|
|
| - |
|
|
| 419 |
|
Provision |
|
| 222 |
|
|
| 208 |
|
|
| (101 | ) |
|
| 964 |
|
|
| 14 |
|
|
| (93 | ) |
|
| - |
|
|
| 586 |
|
|
| (328 | ) |
|
| 1,472 |
|
Ending balance |
| $ | 1,415 |
|
|
| 2,322 |
|
|
| 763 |
|
|
| 3,207 |
|
|
| 164 |
|
|
| 657 |
|
|
| - |
|
|
| 214 |
|
|
| 1,752 |
|
|
| 10,494 |
|
|
|
|
|
|
|
|
|
|
|
|
|
|
|
|
|
|
|
|
|
|
|
|
|
|
|
|
|
|
|
|
|
|
|
|
|
|
|
|
|
|
Allowance for loan losses December 31, 2022 |
|
|
|
|
|
|
|
|
|
|
|
|
|
|
|
|
|
|
|
|
|
|
|
|
|
|
|
|
|
|
|
|
|
|
|
|
|
|
|
|
Ending balance: individually evaluated for impairment |
| $ | - |
|
|
| 36 |
|
|
| 597 |
|
|
| 6 |
|
|
| - |
|
|
| - |
|
|
| - |
|
|
| - |
|
|
| - |
|
|
| 639 |
|
Ending balance: collectively evaluated for impairment |
|
| 1,415 |
|
|
| 2,286 |
|
|
| 166 |
|
|
| 3,201 |
|
|
| 164 |
|
|
| 657 |
|
|
| - |
|
|
| 214 |
|
|
| 1,752 |
|
|
| 9,855 |
|
Ending balance |
| $ | 1,415 |
|
|
| 2,322 |
|
|
| 763 |
|
|
| 3,207 |
|
|
| 164 |
|
|
| 657 |
|
|
| - |
|
|
| 214 |
|
|
| 1,752 |
|
|
| 10,494 |
|
|
|
|
|
|
|
|
|
|
|
|
|
|
|
|
|
|
|
|
|
|
|
|
|
|
|
|
|
|
|
|
|
|
|
|
|
|
|
|
|
|
Loans at December 31, 2022 |
|
|
|
|
|
|
|
|
|
|
|
|
|
|
|
|
|
|
|
|
|
|
|
|
|
|
|
|
|
|
|
|
|
|
|
|
|
|
|
|
Ending balance |
| $ | 114,446 |
|
|
| 322,262 |
|
|
| 20,019 |
|
|
| 406,750 |
|
|
| 65,562 |
|
|
| 81,307 |
|
|
| 938 |
|
|
| 21,324 |
|
|
| - |
|
|
| 1,032,608 |
|
|
|
|
|
|
|
|
|
|
|
|
|
|
|
|
|
|
|
|
|
|
|
|
|
|
|
|
|
|
|
|
|
|
|
|
|
|
|
|
|
|
Ending balance: individually evaluated for impairment |
| $ | - |
|
|
| 537 |
|
|
| 8,555 |
|
|
| 1,388 |
|
|
| - |
|
|
| - |
|
|
| - |
|
|
| - |
|
|
| - |
|
|
| 10,480 |
|
Ending balance: collectively evaluated for impairment |
| $ | 114,446 |
|
|
| 321,725 |
|
|
| 11,464 |
|
|
| 405,362 |
|
|
| 65,562 |
|
|
| 81,307 |
|
|
| 938 |
|
|
| 21,324 |
|
|
| - |
|
|
| 1,022,128 |
|
Changes in the allowance for loan losses for the year ended December 31, 2021 were as follows:
| A-42 |
(Dollars in thousands) |
|
|
|
|
|
|
|
|
|
|
|
|
|
|
|
|
|
|
|
|
|
|
|
|
|
|
|
|
|
| ||||||||||
|
| Real Estate Loans |
|
|
|
|
|
|
|
|
|
|
|
|
|
|
|
| ||||||||||||||||||||||
|
| Construction and Land Development |
|
| Single-Family Residential |
|
| Single-Family Residential - Banco de la Gente Non-traditional |
|
| Commercial |
|
| Multifamily and Farmland |
|
| Commercial |
|
| Farm |
|
| Consumer and All Other |
|
| Unallocated |
|
| Total |
| ||||||||||
Twelve months ended December 31, 2021 |
|
|
|
|
|
|
|
|
|
|
|
|
|
|
|
|
|
|
|
|
|
|
|
|
|
|
|
|
|
| ||||||||||
Allowance for loan losses: |
|
|
|
|
|
|
|
|
|
|
|
|
|
|
|
|
|
|
|
|
|
|
|
|
|
|
|
|
|
| ||||||||||
Beginning balance |
| $ | 1,196 |
|
|
| 1,843 |
|
|
| 1,052 |
|
|
| 2,212 |
|
|
| 122 |
|
|
| 1,345 |
|
|
| - |
|
|
| 128 |
|
|
| 2,010 |
|
|
| 9,908 |
|
Charge-offs |
|
| - |
|
|
| (89 | ) |
|
| - |
|
|
| - |
|
|
| - |
|
|
| (293 | ) |
|
| - |
|
|
| (380 | ) |
|
| - |
|
|
| (762 | ) |
Recoveries |
|
| 121 |
|
|
| 271 |
|
|
| - |
|
|
| 52 |
|
|
| 3 |
|
|
| 786 |
|
|
| - |
|
|
| 139 |
|
|
| - |
|
|
| 1,372 |
|
Provision |
|
| (124 | ) |
|
| (12 | ) |
|
| (188 | ) |
|
| (30 | ) |
|
| 25 |
|
|
| (1,127 | ) |
|
| - |
|
|
| 223 |
|
|
| 70 |
|
|
| (1,163 | ) |
Ending balance |
| $ | 1,193 |
|
|
| 2,013 |
|
|
| 864 |
|
|
| 2,234 |
|
|
| 150 |
|
|
| 711 |
|
|
| - |
|
|
| 110 |
|
|
| 2,080 |
|
|
| 9,355 |
|
|
|
|
|
|
|
|
|
|
|
|
|
|
|
|
|
|
|
|
|
|
|
|
|
|
|
|
|
|
|
|
|
|
|
|
|
|
|
|
|
|
Allowance for loan losses December 31, 2021 |
|
|
|
|
|
|
|
|
|
|
|
|
|
|
|
|
|
|
|
|
|
|
|
|
|
|
|
|
|
|
|
|
|
|
|
|
|
|
|
|
Ending balance: individually evaluated for impairment |
| $ | 1 |
|
|
| 57 |
|
|
| 672 |
|
|
| 7 |
|
|
| - |
|
|
| - |
|
|
| - |
|
|
| - |
|
|
| - |
|
|
| 737 |
|
Ending balance: collectively evaluated for impairment |
|
| 1,192 |
|
|
| 1,956 |
|
|
| 192 |
|
|
| 2,227 |
|
|
| 150 |
|
|
| 711 |
|
|
| - |
|
|
| 110 |
|
|
| 2,080 |
|
|
| 8,618 |
|
Ending balance |
| $ | 1,193 |
|
|
| 2,013 |
|
|
| 864 |
|
|
| 2,234 |
|
|
| 150 |
|
|
| 711 |
|
|
| - |
|
|
| 110 |
|
|
| 2,080 |
|
|
| 9,355 |
|
|
|
|
|
|
|
|
|
|
|
|
|
|
|
|
|
|
|
|
|
|
|
|
|
|
|
|
|
|
|
|
|
|
|
|
|
|
|
|
|
|
Loans at December 31, 2021 |
|
|
|
|
|
|
|
|
|
|
|
|
|
|
|
|
|
|
|
|
|
|
|
|
|
|
|
|
|
|
|
|
|
|
|
|
|
|
|
|
Ending balance |
| $ | 95,760 |
|
|
| 266,111 |
|
|
| 23,147 |
|
|
| 337,841 |
|
|
| 58,366 |
|
|
| 91,172 |
|
|
| 796 |
|
|
| 11,676 |
|
|
| - |
|
|
| 884,869 |
|
|
|
|
|
|
|
|
|
|
|
|
|
|
|
|
|
|
|
|
|
|
|
|
|
|
|
|
|
|
|
|
|
|
|
|
|
|
|
|
|
|
Ending balance: individually evaluated for impairment |
| $ | 6 |
|
|
| 1,633 |
|
|
| 9,795 |
|
|
| 1,437 |
|
|
| - |
|
|
| 49 |
|
|
| - |
|
|
| - |
|
|
| - |
|
|
| 12,920 |
|
Ending balance: collectively evaluated for impairment |
| $ | 95,754 |
|
|
| 264,478 |
|
|
| 13,352 |
|
|
| 336,404 |
|
|
| 58,366 |
|
|
| 91,123 |
|
|
| 796 |
|
|
| 11,676 |
|
|
| - |
|
|
| 871,949 |
|
Changes in the allowance for loan losses for the year ended December 31, 2020 were as follows:
(Dollars in thousands) |
|
|
|
|
|
|
|
|
|
|
|
|
|
|
|
|
|
|
|
|
|
|
|
|
|
|
|
|
|
| ||||||||||
|
| Real Estate Loans |
|
|
|
|
|
|
|
|
|
|
|
|
|
|
|
| ||||||||||||||||||||||
|
| Construction and Land Development |
|
| Single-Family Residential |
|
| Single-Family Residential - Banco de la Gente Non-traditional |
|
| Commercial |
|
| Multifamily and Farmland |
|
| Commercial |
|
| Farm |
|
| Consumer and All Other |
|
| Unallocated |
|
| Total |
| ||||||||||
Twelve months ended December 31, 2020 |
|
|
|
|
|
|
|
|
|
|
|
|
|
|
|
|
|
|
|
|
|
|
|
|
|
|
|
|
|
| ||||||||||
Allowance for loan losses: |
|
|
|
|
|
|
|
|
|
|
|
|
|
|
|
|
|
|
|
|
|
|
|
|
|
|
|
|
|
| ||||||||||
Beginning balance |
| $ | 694 |
|
|
| 1,274 |
|
|
| 1,073 |
|
|
| 1,305 |
|
|
| 120 |
|
|
| 688 |
|
|
| - |
|
|
| 138 |
|
|
| 1,388 |
|
|
| 6,680 |
|
Charge-offs |
|
| (5 | ) |
|
| (65 | ) |
|
| - |
|
|
| (7 | ) |
|
| - |
|
|
| (903 | ) |
|
| - |
|
|
| (434 | ) |
|
| - |
|
|
| (1,414 | ) |
Recoveries |
|
| 36 |
|
|
| 70 |
|
|
| - |
|
|
| 70 |
|
|
| - |
|
|
| 34 |
|
|
| - |
|
|
| 173 |
|
|
| - |
|
|
| 383 |
|
Provision |
|
| 471 |
|
|
| 564 |
|
|
| (21 | ) |
|
| 844 |
|
|
| 2 |
|
|
| 1,526 |
|
|
| - |
|
|
| 251 |
|
|
| 622 |
|
|
| 4,259 |
|
Ending balance |
| $ | 1,196 |
|
|
| 1,843 |
|
|
| 1,052 |
|
|
| 2,212 |
|
|
| 122 |
|
|
| 1,345 |
|
|
| - |
|
|
| 128 |
|
|
| 2,010 |
|
|
| 9,908 |
|
|
|
|
|
|
|
|
|
|
|
|
|
|
|
|
|
|
|
|
|
|
|
|
|
|
|
|
|
|
|
|
|
|
|
|
|
|
|
|
|
|
Allowance for loan losses December 31, 2020 |
|
|
|
|
|
|
|
|
|
|
|
|
|
|
|
|
|
|
|
|
|
|
|
|
|
|
|
|
|
|
|
|
|
|
|
|
|
|
|
|
Ending balance: individually evaluated for impairment |
| $ | 1 |
|
|
| 4 |
|
|
| 844 |
|
|
| 8 |
|
|
| - |
|
|
| - |
|
|
| - |
|
|
| - |
|
|
| - |
|
|
| 857 |
|
Ending balance: collectively evaluated for impairment |
|
| 1,195 |
|
|
| 1,839 |
|
|
| 208 |
|
|
| 2,204 |
|
|
| 122 |
|
|
| 1,345 |
|
|
| - |
|
|
| 128 |
|
|
| 2,010 |
|
|
| 9,051 |
|
Ending balance |
| $ | 1,196 |
|
|
| 1,843 |
|
|
| 1,052 |
|
|
| 2,212 |
|
|
| 122 |
|
|
| 1,345 |
|
|
| - |
|
|
| 128 |
|
|
| 2,010 |
|
|
| 9,908 |
|
|
|
|
|
|
|
|
|
|
|
|
|
|
|
|
|
|
|
|
|
|
|
|
|
|
|
|
|
|
|
|
|
|
|
|
|
|
|
|
|
|
Loans at December 31, 2020 |
|
|
|
|
|
|
|
|
|
|
|
|
|
|
|
|
|
|
|
|
|
|
|
|
|
|
|
|
|
|
|
|
|
|
|
|
|
|
|
|
Ending balance |
| $ | 94,124 |
|
|
| 272,325 |
|
|
| 26,883 |
|
|
| 332,971 |
|
|
| 48,880 |
|
|
| 161,740 |
|
|
| 855 |
|
|
| 10,861 |
|
|
| - |
|
|
| 948,639 |
|
|
|
|
|
|
|
|
|
|
|
|
|
|
|
|
|
|
|
|
|
|
|
|
|
|
|
|
|
|
|
|
|
|
|
|
|
|
|
|
|
|
Ending balance: individually evaluated for impairment |
| $ | 7 |
|
|
| 1,558 |
|
|
| 11,353 |
|
|
| 2,118 |
|
|
| - |
|
|
| 212 |
|
|
| - |
|
|
| - |
|
|
| - |
|
|
| 15,248 |
|
Ending balance: collectively evaluated for impairment |
| $ | 94,117 |
|
|
| 270,767 |
|
|
| 15,530 |
|
|
| 330,853 |
|
|
| 48,880 |
|
|
| 161,528 |
|
|
| 855 |
|
|
| 10,861 |
|
|
| - |
|
|
| 933,391 |
|
Impaired loans collectively evaluated for impairment totaled $4.9 million, $5.3 million and $5.8 million at December 31, 2022, 2021 and 2020, respectively and are included in the tables above. Allowance on impaired loans collectively evaluated for impairment totaled $44,000, $42,000 and 61,000 at December 31, 2022, 2021 and 2020, respectively.
| A-43 |
The Bank utilizes an internal risk grading matrix to assign a risk grade to each of its loans. Loans are graded on a scale of 1 to 8. These risk grades are evaluated on an ongoing basis. A description of the general characteristics of the eight risk grades is as follows:
| · | Risk Grade 1 – Excellent Quality: Loans are well above average quality and a minimal amount of credit risk exists. CD or cash secured loans or properly margined actively traded stock or bond secured loans would fall in this grade. |
| · | Risk Grade 2 – High Quality: Loans are of good quality with risk levels well within the Bank’s range of acceptability. The organization or individual is established with a history of successful performance though somewhat susceptible to economic changes. |
| · | Risk Grade 3 – Good Quality: Loans of average quality with risk levels within the Bank’s range of acceptability but higher than normal. This may be a new organization or an existing organization in a transitional phase (e.g. expansion, acquisition, market change). |
| · | Risk Grade 4 – Management Attention: These loans have higher risk and servicing needs but still are acceptable. Evidence of marginal performance or deteriorating trends is observed. These are not problem credits presently, but may be in the future if the borrower is unable to change its present course. |
| · | Risk Grade 5 – Watch: These loans are currently performing satisfactorily, but there has been some recent past due history on repayment and there are potential weaknesses that may, if not corrected, weaken the asset or inadequately protect the Bank’s position at some future date. |
| · | Risk Grade 6 – Substandard: A Substandard loan is inadequately protected by the current sound net worth and paying capacity of the obligor or the collateral pledged (if there is any). There is a well-defined weakness or weaknesses that jeopardize the liquidation of the debt. There is a distinct possibility that the Bank will sustain some loss if the deficiencies are not corrected. |
| · | Risk Grade 7 – Doubtful: Loans classified as Doubtful have all the weaknesses inherent in loans classified Substandard, plus the added characteristic that the weaknesses make collection or liquidation in full on the basis of currently existing facts, conditions, and values highly questionable and improbable. Doubtful is a temporary grade where a loss is expected but is presently not quantified with any degree of accuracy. Once the loss position is determined, the amount is charged off. |
| · | Risk Grade 8 – Loss: Loans classified as Loss are considered uncollectable and of such little value that their continuance as bankable assets is not warranted. This classification does not mean that the asset has absolutely no recovery or salvage value, but rather that it is not practical or desirable to defer writing off this worthless loan even though partial recovery may be realized in the future. Loss is a temporary grade until the appropriate authority is obtained to charge the loan off. |
The following tables present the credit risk profile of each loan type based on internally assigned risk grades as of December 31, 2022 and 2021.
December 31, 2022 |
|
|
|
|
|
|
|
|
|
|
|
|
|
|
|
|
|
|
|
|
|
|
|
|
|
|
|
|
|
| ||||||||||
(Dollars in thousands) |
|
|
|
|
|
|
|
|
|
|
|
|
|
|
|
|
|
|
|
|
|
|
|
|
|
|
|
|
|
| ||||||||||
|
| Real Estate Loans |
|
|
|
|
|
|
|
|
|
|
|
|
|
|
|
| ||||||||||||||||||||||
|
| Construction and Land Development |
|
| Single-Family Residential |
|
| Single-Family Residential - Banco de la Gente non-traditional |
|
| Commercial |
|
| Multifamily and Farmland |
|
| Commercial |
|
| Farm |
|
| Consumer |
|
| All Other |
|
| Total |
| ||||||||||
|
|
|
|
|
|
|
|
|
|
|
|
|
|
|
|
|
|
|
|
|
|
|
|
|
|
|
|
|
|
| ||||||||||
1- Excellent Quality |
| $ | - |
|
|
| 2,782 |
|
|
| - |
|
|
| - |
|
|
| - |
|
|
| 1,365 |
|
|
| - |
|
|
| 527 |
|
|
| - |
|
|
| 4,674 |
|
2- High Quality |
|
| 14,912 |
|
|
| 138,124 |
|
|
| - |
|
|
| 33,353 |
|
|
| 17 |
|
|
| 13,302 |
|
|
| - |
|
|
| 2,384 |
|
|
| 1,366 |
|
|
| 203,458 |
|
3- Good Quality |
|
| 94,113 |
|
|
| 166,329 |
|
|
| 7,442 |
|
|
| 340,926 |
|
|
| 63,270 |
|
|
| 64,422 |
|
|
| 938 |
|
|
| 3,663 |
|
|
| 12,851 |
|
|
| 753,954 |
|
4- Management Attention |
|
| 5,257 |
|
|
| 10,615 |
|
|
| 8,968 |
|
|
| 27,957 |
|
|
| 2,061 |
|
|
| 1,507 |
|
|
| - |
|
|
| 244 |
|
|
| 128 |
|
|
| 56,737 |
|
5- Watch |
|
| 54 |
|
|
| 922 |
|
|
| 1,136 |
|
|
| 3,963 |
|
|
| 123 |
|
|
| 711 |
|
|
| - |
|
|
| 1 |
|
|
| 145 |
|
|
| 7,055 |
|
6- Substandard |
|
| 110 |
|
|
| 3,490 |
|
|
| 2,473 |
|
|
| 551 |
|
|
| 91 |
|
|
| - |
|
|
| - |
|
|
| 15 |
|
|
| - |
|
|
| 6,730 |
|
7- Doubtful |
|
| - |
|
|
| - |
|
|
| - |
|
|
| - |
|
|
| - |
|
|
| - |
|
|
| - |
|
|
| - |
|
|
| - |
|
|
| - |
|
8- Loss |
|
| - |
|
|
| - |
|
|
| - |
|
|
| - |
|
|
| - |
|
|
| - |
|
|
| - |
|
|
| - |
|
|
| - |
|
|
| - |
|
Total |
| $ | 114,446 |
|
|
| 322,262 |
|
|
| 20,019 |
|
|
| 406,750 |
|
|
| 65,562 |
|
|
| 81,307 |
|
|
| 938 |
|
|
| 6,834 |
|
|
| 14,490 |
|
|
| 1,032,608 |
|
| A-44 |
December 31, 2021 |
|
|
|
|
|
|
|
|
|
|
|
|
|
|
|
|
|
|
|
|
|
|
|
|
|
|
|
|
|
| ||||||||||
(Dollars in thousands) |
|
|
|
|
|
|
|
|
|
|
|
|
|
|
|
|
|
|
|
|
|
|
|
|
|
|
|
|
|
| ||||||||||
|
| Real Estate Loans |
|
|
|
|
|
|
|
|
|
|
|
|
|
|
|
| ||||||||||||||||||||||
|
| Construction and Land Development |
|
| Single-Family Residential |
|
| Single-Family Residential - Banco de la Gente non-traditional |
|
| Commercial |
|
| Multifamily and Farmland |
|
| Commercial |
|
| Farm |
|
| Consumer |
|
| All Other |
|
| Total |
| ||||||||||
|
|
|
|
|
|
|
|
|
|
|
|
|
|
|
|
|
|
|
|
|
|
|
|
|
|
|
|
|
|
| ||||||||||
1- Excellent Quality |
| $ | - |
|
|
| 5,923 |
|
|
| - |
|
|
| - |
|
|
| - |
|
|
| 371 |
|
|
| - |
|
|
| 581 |
|
|
| - |
|
|
| 6,875 |
|
2- High Quality |
|
| 11,752 |
|
|
| 109,337 |
|
|
| - |
|
|
| 28,546 |
|
|
| 19 |
|
|
| 16,177 |
|
|
| - |
|
|
| 2,039 |
|
|
| 1,309 |
|
|
| 169,179 |
|
3- Good Quality |
|
| 80,325 |
|
|
| 129,856 |
|
|
| 8,712 |
|
|
| 272,786 |
|
|
| 54,945 |
|
|
| 68,183 |
|
|
| 792 |
|
|
| 3,510 |
|
|
| 3,931 |
|
|
| 623,040 |
|
4- Management Attention |
|
| 3,534 |
|
|
| 14,964 |
|
|
| 10,478 |
|
|
| 30,937 |
|
|
| 2,754 |
|
|
| 5,214 |
|
|
| 4 |
|
|
| 284 |
|
|
| - |
|
|
| 68,169 |
|
5- Watch |
|
| 76 |
|
|
| 2,464 |
|
|
| 1,703 |
|
|
| 4,938 |
|
|
| 543 |
|
|
| 1,177 |
|
|
| - |
|
|
| 1 |
|
|
| - |
|
|
| 10,902 |
|
6- Substandard |
|
| 73 |
|
|
| 3,567 |
|
|
| 2,254 |
|
|
| 634 |
|
|
| 105 |
|
|
| 50 |
|
|
| - |
|
|
| 21 |
|
|
| - |
|
|
| 6,704 |
|
7- Doubtful |
|
| - |
|
|
| - |
|
|
| - |
|
|
| - |
|
|
| - |
|
|
| - |
|
|
| - |
|
|
| - |
|
|
| - |
|
|
| - |
|
8- Loss |
|
| - |
|
|
| - |
|
|
| - |
|
|
| - |
|
|
| - |
|
|
| - |
|
|
| - |
|
|
| - |
|
|
| - |
|
|
| - |
|
Total |
| $ | 95,760 |
|
|
| 266,111 |
|
|
| 23,147 |
|
|
| 337,841 |
|
|
| 58,366 |
|
|
| 91,172 |
|
|
| 796 |
|
|
| 6,436 |
|
|
| 5,240 |
|
|
| 884,869 |
|
Past due TDR loans and non-accrual TDR loans totaled $3.7 million and $2.2 million at December 31, 2022 and December 31, 2021, respectively. The terms of these loans have been renegotiated to provide a concession to original terms, including a reduction in principal or interest as a result of the deteriorating financial position of the borrower. There were no performing loans classified as TDR loans at December 31, 2022 and December 31, 2021.
There were no new TDR modifications during the years ended December 31, 2022 and 2021.
There were no TDR loans with a payment default occurring within 12 months of the restructure date, and the payment default occurring during the years ended December 31, 2022 and 2021. TDR loans are deemed to be in default if they become past due by 90 days or more.
(4) Premises and Equipment
Major classifications of premises and equipment at December 31, 2022 and 2021 are summarized as follows:
(Dollars in thousands) |
|
|
|
|
|
| ||
|
| 2022 |
|
| 2021 |
| ||
|
|
|
|
|
|
| ||
Land |
| $ | 3,851 |
|
|
| 3,857 |
|
Buildings and improvements |
|
| 18,371 |
|
|
| 18,359 |
|
Furniture and equipment |
|
| 26,156 |
|
|
| 25,420 |
|
Construction in process |
|
| 3,028 |
|
|
| - |
|
|
|
|
|
|
|
|
|
|
Total premises and equipment |
|
| 51,406 |
|
|
| 47,636 |
|
|
|
|
|
|
|
|
|
|
Less accumulated depreciation |
|
| (33,201 | ) |
|
| (31,532 | ) |
|
|
|
|
|
|
|
|
|
Total net premises and equipment |
| $ | 18,205 |
|
|
| 16,104 |
|
The Bank recognized depreciation expense totaling $2.4 million, $2.6 million and $2.5 million for the years ended December 31, 2022, 2021 and 2020, respectively.
The Bank had $85,000 net losses on the sale of and write-downs on premises and equipment for the year ended December 31, 2022. The Bank had $105,000 net gains on the sale of and write-downs on premises and equipment for the year ended December 31, 2021. The Bank had no gains or losses on the sale of or write-downs on premises and equipment for the year ended December 31, 2020.
(5) Leases
The Bank leases various office spaces for banking and operational facilities and equipment under operating lease arrangements.
| A-45 |
Total rent expense was approximately $976,000, $703,000 and $880,000 for the years ended December 31, 2022, 2021 and 2020, respectively.
As of December 31, 2022, the Bank had operating right of use assets of $5.1 million and operating lease liabilities of $5.2 million. The Bank maintains operating leases on land and buildings for some of the Bank’s branch facilities and loan production offices. Most leases include one option to renew, with renewal terms extending up to 15 years. The exercise of renewal options is based on the judgment of management as to whether or not the renewal option is reasonably certain to be exercised. Factors in determining whether an option is reasonably certain of exercise include, but are not limited to, the value of leasehold improvements, the value of renewal rates compared to market rates, and the presence of factors that would cause a significant economic penalty to the Bank if the option is not exercised. Leases with a term of 12 months or less are not recorded on the balance sheet and instead are recognized in lease expense on a straight-line basis over the lease term.
The following table presents lease cost and other lease information as of December 31, 2022.
(Dollars in thousands) |
|
|
| |
|
| December 31, 2022 |
| |
|
|
|
| |
Operating lease cost |
| $ | 888 |
|
|
|
|
|
|
Other information: |
|
|
|
|
Cash paid for amounts included in the measurement of lease liabilities |
|
| 873 |
|
Operating cash flows from operating leases |
|
| - |
|
Right-of-use assets obtained in exchange for new lease liabilities - operating leases |
|
| 1,726 |
|
Weighted-average remaining lease term - operating leases |
|
| 9.26 |
|
Weighted-average discount rate - operating leases |
|
| 2.23 | % |
The following table presents lease maturities as of December 31, 2022.
(Dollars in thousands) |
|
|
| |
|
|
|
| |
Maturity Analysis of Operating Lease Liabilities: |
| December 31, 2022 |
| |
|
|
|
| |
2023 |
| $ | 805 |
|
2024 |
|
| 750 |
|
2025 |
|
| 694 |
|
2026 |
|
| 577 |
|
2027 |
|
| 528 |
|
Thereafter |
|
| 2,418 |
|
Total |
|
| 5,727 |
|
Less: Imputed Interest |
|
| (542 | ) |
Operating Lease Liability |
| $ | 5,185 |
|
(6) Time Deposits
At December 31, 2022, the scheduled maturities of time deposits are as follows:
(Dollars in thousands) |
|
|
| |
|
|
|
| |
2023 |
| $ | 59,099 |
|
2024 |
|
| 26,526 |
|
2025 |
|
| 7,380 |
|
2026 |
|
| 3,420 |
|
2027 and thereafter |
|
| 1,574 |
|
Total |
| $ | 97,999 |
|
| A-46 |
At December 31, 2022 and 2021, the Bank had approximately $15.0 million and $11.1 million, respectively, in time deposits purchased through third party brokers, including certificates of deposit participated through the Certificate of Deposit Account Registry Service (“CDARS”) on behalf of local customers. CDARS balances totaled $7.1 million and $3.0 million as of December 31, 2022 and 2021, respectively. The weighted average rate of brokered deposits as of December 31, 2022 and 2021 was 1.27% and 1.49%, respectively.
(7) Federal Home Loan Bank (FHLB) and Federal Reserve Bank Borrowings
The Bank had no borrowings from the FHLB at December 31, 2022 and 2021. FHLB borrowings are collateralized by a blanket assignment on all residential first mortgage loans, home equity lines of credit and loans secured by multi-family real estate that the Bank owns. At December 31, 2022, the carrying value of loans pledged as collateral totaled approximately $149.4 million. The remaining availability under the line of credit with the FHLB was $86.5 million at December 31, 2022. The Bank incurred a $1.1 million prepayment penalty on the prepayment of a $70.0 million FHLB advance in 2020.
The Bank is required to purchase and hold certain amounts of FHLB stock in order to obtain FHLB borrowings. No ready market exists for the FHLB stock, and it has no quoted market value. The stock is redeemable at $100 per share subject to certain limitations set by the FHLB. The Bank owned $812,000 and $707,000 of FHLB stock, included in other investments, at December 31, 2022 and 2021, respectively.
As of December 31, 2022 and 2021, the Bank had no borrowings from the Federal Reserve Bank (“FRB”). FRB borrowings are collateralized by a blanket assignment on all qualifying loans that the Bank owns which are not pledged to the FHLB. At December 31, 2022, the carrying value of loans pledged as collateral totaled approximately $585.0 million. Availability under the line of credit with the FRB was $445.1 million at December 31, 2022.
(8) Junior Subordinated Debentures
In June 2006, the Company formed a second wholly owned Delaware statutory trust, PEBK Capital Trust II (“PEBK Trust II”), which issued $20.0 million of guaranteed preferred beneficial interests in the Company’s junior subordinated deferrable interest debentures. All of the common securities of PEBK Trust II are owned by the Company. The proceeds from the issuance of the common securities and the trust preferred securities were used by PEBK Trust II to purchase $20.6 million of junior subordinated debentures of the Company. The proceeds received by the Company from the sale of the junior subordinated debentures were used to repay in December 2006 the trust preferred securities issued in December 2001 by PEBK Capital Trust, a wholly owned Delaware statutory trust of the Company, and for general purposes. The debentures represent the sole assets of PEBK Trust II. PEBK Trust II is not included in the consolidated financial statements. The Company redeemed $5.0 million of outstanding trust preferred securities in 2019.
The trust preferred securities issued by PEBK Trust II accrue and pay interest quarterly at a floating rate of three-month LIBOR plus 163 basis points. The Company has guaranteed distributions and other payments due on the trust preferred securities. The net combined effect of all the documents entered into in connection with the trust preferred securities is that the Company is liable to make the distributions and other payments required on the trust preferred securities.
These trust preferred securities are mandatorily redeemable upon maturity of the debentures on June 28, 2036. The Company has the right to redeem the debentures purchased by PEBK Trust II, in whole or in part, if the debentures are redeemed prior to maturity, the redemption price will be the principal amount plus any accrued but unpaid interest.
The Company has no financial instruments tied to LIBOR other than the trust preferred securities issued by PEBK Trust II, which are tied to three-month LIBOR. The one-week and two-month U.S. dollar-denominated (USD) LIBOR rates ceased to be published on December 31, 2021. The overnight, one-month, three-month, nine-month, and 12-month USD LIBOR rates will continue to be published through June 30, 2023. Management has reviewed the implications of the Adjustable Interest Rate Act (LIBOR Act) enacted in March 2022 and the related Federal Reserve regulations with legal counsel, and is currently working with the trustee to complete required updates prior to June 30, 2023.
(9) Income Taxes
The provision for income taxes is summarized as follows:
| A-47 |
(Dollars in thousands) |
|
|
|
|
|
|
|
|
| |||
|
| 2022 |
|
| 2021 |
|
| 2020 |
| |||
Current expense |
| $ | 4,713 |
|
|
| 4,023 |
|
|
| 3,049 |
|
Deferred income tax benefit |
|
| (541 | ) |
|
| (227 | ) |
|
| (560 | ) |
Total income tax |
| $ | 4,172 |
|
|
| 3,796 |
|
|
| 2,489 |
|
The differences between the provision for income taxes and the amount computed by applying the statutory federal income tax rate to earnings before income taxes are as follows:
(Dollars in thousands) |
|
|
|
|
|
|
|
|
| |||
|
| 2022 |
|
| 2021 |
|
| 2020 |
| |||
Tax expense at statutory rate |
| $ | 4,262 |
|
|
| 3,975 |
|
|
| 2,908 |
|
State income tax, net of federal income tax effect |
|
| 395 |
|
|
| 339 |
|
|
| 261 |
|
Tax-exempt interest income |
|
| (445 | ) |
|
| (497 | ) |
|
| (649 | ) |
Increase in cash surrender value of life insurance |
|
| (71 | ) |
|
| (83 | ) |
|
| (80 | ) |
Tax credits |
|
| (230 | ) |
|
| (234 | ) |
|
| (234 | ) |
Nondeductible interest and other expense |
|
| 24 |
|
|
| 30 |
|
|
| 46 |
|
Other |
|
| 237 |
|
|
| 266 |
|
|
| 237 |
|
Total |
| $ | 4,172 |
|
|
| 3,796 |
|
|
| 2,489 |
|
The following summarizes the tax effects of temporary differences that give rise to significant portions of the deferred tax assets and deferred tax liabilities. The net deferred tax asset is included as a component of other assets at December 31, 2022 and 2021.
(Dollars in thousands) |
|
|
|
|
|
| ||
|
| 2022 |
|
| 2021 |
| ||
Deferred tax assets: |
|
|
|
|
|
| ||
Allowance for loan losses |
| $ | 2,411 |
|
|
| 2,149 |
|
Accrued retirement expense |
|
| 1,174 |
|
|
| 1,148 |
|
Restricted stock |
|
| 245 |
|
|
| 209 |
|
Interest income on nonaccrual loans |
|
| 1 |
|
|
| 2 |
|
Lease liability |
|
| 1,191 |
|
|
| 1,075 |
|
Unrealized loss on available for sale securities |
|
| 14,197 |
|
|
| - |
|
Total gross deferred tax assets |
|
| 19,219 |
|
|
| 4,583 |
|
|
|
|
|
|
|
|
|
|
Deferred tax liabilities: |
|
|
|
|
|
|
|
|
Deferred loan fees |
|
| 209 |
|
|
| 263 |
|
Accumulated depreciation |
|
| 438 |
|
|
| 563 |
|
Prepaid expenses |
|
| 3 |
|
|
| 4 |
|
ROU Asset |
|
| 1,175 |
|
|
| 1,060 |
|
Other |
|
| (93 | ) |
|
| (55 | ) |
Unrealized gain on available for sale securities |
|
| - |
|
|
| 29 |
|
Total gross deferred tax liabilities |
|
| 1,732 |
|
|
| 1,864 |
|
|
|
|
|
|
|
|
|
|
Net deferred tax asset |
| $ | 17,487 |
|
|
| 2,719 |
|
The Company has analyzed the tax positions taken or expected to be taken in its tax returns and has concluded that it has no liability related to uncertain tax positions.
As of December 31, 2022, the Company’s Federal income tax filings for years 2019 through 2021 are open to audit by the Internal Revenue Service. The Company’s North Carolina income tax returns are currently under audit for tax year 2014-2016, tax years 2019, 2020, 2021 and 2022 remain open to audit by the North Carolina Department of Revenue.
(10) Related Party Transactions
The Company conducts transactions with its directors and executive officers, including companies in which they have beneficial interests, in the normal course of business. In accordance with Regulation O of the Federal Reserve, it is the policy of the Bank that loan transactions with directors and officers are made on substantially the same terms as those prevailing at the time made for comparable loans to other persons. The following is a summary of activity for related party loans for 2022 and 2021:
| A-48 |
(Dollars in thousands) |
|
|
|
|
|
| ||
|
| 2022 |
|
| 2021 |
| ||
Beginning balance |
| $ | 2,687 |
|
|
| 1,852 |
|
Disbursements |
|
| 4,090 |
|
|
| 3,636 |
|
Repayments |
|
| (3,396 | ) |
|
| (2,801 | ) |
Ending balance |
| $ | 3,381 |
|
|
| 2,687 |
|
At December 31, 2022 and 2021, the Company had deposit relationships with related parties of approximately $44.5 million and $43.4 million, respectively.
(11) Commitments and Contingencies
The Bank is party to financial instruments with off-balance-sheet risk in the normal course of business to meet the financing needs of its customers. These financial instruments include commitments to extend credit, standby letters of credit and financial guarantees. Those instruments involve, to varying degrees, elements of credit risk in excess of the amount recognized in the balance sheet. The contract amounts of those instruments reflect the extent of involvement the Bank has in particular classes of financial instruments.
The exposure to credit loss in the event of nonperformance by the other party to the financial instrument for commitments to extend credit and standby letters of credit and financial guarantees written is represented by the contractual amount of those instruments. The Bank uses the same credit policies in making commitments and conditional obligations as it does for on-balance-sheet instruments.
In most cases, the Bank requires collateral or other security to support financial instruments with credit risk.
(Dollars in thousands) |
|
|
|
|
|
| ||
|
| Contractual Amount |
| |||||
|
| 2022 |
|
| 2021 |
| ||
Financial instruments whose contract amount represent credit risk: |
|
|
|
|
|
| ||
|
|
|
|
|
|
| ||
Commitments to extend credit |
| $ | 382,699 |
|
|
| 304,258 |
|
|
|
|
|
|
|
|
|
|
Standby letters of credit |
| $ | 4,352 |
|
|
| 4,892 |
|
Commitments to extend credit are conditional agreements to lend to a customer. Commitments generally have fixed expiration dates and because they may expire without being drawn upon, the total commitment amount of $387.1 million does not necessarily represent future cash requirements.
Standby letters of credit are conditional commitments issued by the Bank to pay a third party on behalf of a customer. Those letters of credit are primarily issued to businesses in the Bank’s delineated market area. The credit risk involved in issuing letters of credit is essentially the same as that involved in extending loan facilities to customers. The Bank holds real estate, equipment, automobiles and customer deposits as collateral supporting those commitments for which collateral is deemed necessary.
In the normal course of business, the Company is a party (both as plaintiff and defendant) to lawsuits. In the opinion of management and counsel, none of these cases should have a material adverse effect on the financial position of the Company.
The Company and the Bank have entered into employment agreements with certain key employees. The agreements, among other things, include salary, bonus, incentive compensation, and change in control provisions.
The Company has $110.5 million available for the purchase of overnight federal funds from five correspondent financial institutions as of December 31, 2022.
At December 31, 2017, the Bank committed to invest $3.0 million in an income tax credit partnership owning and developing two multifamily housing developments in Charlotte, North Carolina, with $1.5 million allocated to each property. As of December 31, 2022, the Bank has funded $2.9 million of this commitment. At December 31, 2022, the Bank had $1.5 million in unfunded commitments for SBA Small Business Investment Company (“SBIC”) investments.
| A-49 |
(12) Employee and Director Benefit Programs
The Bank has a profit sharing and 401(k) plan for the benefit of substantially all employees subject to certain minimum age and service requirements. Under the 401(k) plan, the Bank matched employee contributions to a maximum of 4.00% of annual compensation in 2020, 2021 and 2022. The Company’s contribution pursuant to this formula was approximately $719,000, $709,000 and $692,000 for the years ended December 31, 2022, 2021 and 2020, respectively. Investments made available under the 401(k) plan are determined by a committee comprised of senior management. No investments in Company stock are available under the 401(k) plan. Contributions to the 401(k) plan are vested immediately.
In December 2001, the Company initiated a retirement benefit plan to provide retirement benefits to key officers and its Board of Directors and to provide death benefits for their designated beneficiaries. Under the postretirement benefit plan, the Company purchased life insurance policies on the lives of the key officers and each director. The increase in cash surrender value of the policies constitutes the Company’s contribution to the postretirement benefit plan each year. Postretirement benefit plan participants are to be paid annual benefits for a specified number of years commencing upon retirement. Expenses incurred for benefits relating to the postretirement benefit plan were approximately $369,000, $447,000 and $368,000 for the years ended December 31, 2022, 2021 and 2020, respectively.
The Company paid medical benefits for certain retired employees through the first quarter of 2022. The Company did not incur any postretirement medical benefits expense in 2022, 2021 and 2020 due to an excess accrual balance.
The following table sets forth the change in the accumulated benefit obligation for the Company’s two postretirement benefit plans described above:
(Dollars in thousands) |
|
|
|
|
|
| ||
|
| 2022 |
|
| 2021 |
| ||
|
|
|
|
|
|
| ||
Benefit obligation at beginning of period |
| $ | 5,011 |
|
|
| 4,870 |
|
Service cost |
|
| 325 |
|
|
| 359 |
|
Interest cost |
|
| 63 |
|
|
| 70 |
|
Benefits paid |
|
| (289 | ) |
|
| (288 | ) |
|
|
|
|
|
|
|
|
|
Benefit obligation at end of period |
| $ | 5,110 |
|
|
| 5,011 |
|
The amounts recognized in the Company’s Consolidated Balance Sheet as of December 31, 2022 and 2021 are shown in the following two tables:
(Dollars in thousands) |
|
|
|
|
|
| ||
|
| 2022 |
|
| 2021 |
| ||
|
|
|
|
|
|
| ||
Benefit obligation |
| $ | 5,110 |
|
|
| 5,011 |
|
Fair value of plan assets |
|
| - |
|
|
| - |
|
| A-50 |
(Dollars in thousands) |
|
|
|
|
|
| ||
|
| 2022 |
|
| 2021 |
| ||
|
|
|
|
|
|
| ||
Funded status |
| $ | (5,110 | ) |
|
| (5,011 | ) |
Unrecognized prior service cost/benefit |
|
| - |
|
|
| - |
|
Unrecognized net actuarial loss |
|
| - |
|
|
| - |
|
|
|
|
|
|
|
|
|
|
Net amount recognized |
| $ | (5,110 | ) |
|
| (5,011 | ) |
|
|
|
|
|
|
|
|
|
Unfunded accrued liability |
| $ | (5,110 | ) |
|
| (5,011 | ) |
Intangible assets |
|
| - |
|
|
| - |
|
|
|
|
|
|
|
|
|
|
Net amount recognized |
| $ | (5,110 | ) |
|
| (5,011 | ) |
Net periodic benefit cost of the Company’s postretirement benefit plans for the years ended December 31, 2022, 2021 and 2020 consisted of the following:
(Dollars in thousands) |
|
|
|
|
|
| ||||||
|
| 2022 |
|
| 2021 |
|
| 2020 |
| |||
|
|
|
|
|
|
|
|
|
| |||
Service cost |
| $ | 325 |
|
|
| 359 |
|
|
| 359 |
|
Interest cost |
|
| 63 |
|
|
| 70 |
|
|
| 70 |
|
|
|
|
|
|
|
|
|
|
|
|
|
|
Net periodic cost |
| $ | 388 |
|
|
| 429 |
|
|
| 429 |
|
|
|
|
|
|
|
|
|
|
|
|
|
|
Weighted average discount rate assumption used to determine benefit obligation |
|
| 5.50 | % |
|
| 5.50 | % |
|
| 5.49 | % |
The Company paid postretirement plan benefits totaling $289,000, $288,000 and $216,000 during the years ended December 31, 2022, 2021 and 2020, respectively. Information about the expected benefit payments for the Company’s two postretirement benefit plans is as follows:
(Dollars in thousands) |
|
|
| |
|
|
|
| |
Year ending December 31, |
|
|
| |
2023 |
| $ | 329 |
|
2024 |
| $ | 353 |
|
2025 |
| $ | 370 |
|
2026 |
| $ | 368 |
|
2027 |
| $ | 494 |
|
Thereafter |
| $ | 8,358 |
|
(13) Regulatory Matters
The Company and the Bank are subject to regulatory capital requirements administered by the federal banking agencies. Failure to meet minimum capital requirements can initiate certain mandatory and possibly additional discretionary actions by regulators that, if undertaken, could have a direct material effect on the Company’s financial statements. Under capital adequacy guidelines and the regulatory framework for prompt corrective action, the Bank must meet specific capital guidelines that involve quantitative measures of the assets, liabilities and certain off-balance-sheet items as calculated under regulatory accounting practices. The capital amounts and classification are also subject to qualitative judgments by the regulators about components, risk weightings, and other factors.
Quantitative measures established by regulation to ensure capital adequacy require the Company and the Bank to maintain minimum capital ratios in relation to both on- and off-balance sheet items at various risk weights. Total capital consists of two tiers of capital. Tier 1 capital includes common shareholders’ equity and trust preferred securities less adjustments for intangible assets. Tier 2 capital consists of the allowance for loan losses, up to 1.25% of risk-weighted assets and other adjustments. Management believes, as of December 31, 2022, that the Company and the Bank meet all capital adequacy requirements to which they are subject.
| A-51 |
As of December 31, 2022, the most recent notification from the FDIC categorized the Bank as well capitalized under the regulatory framework for prompt corrective action. To be categorized as well capitalized the Bank must maintain minimum total risk-based, Tier 1 risk-based and Tier 1 leverage ratios as set forth in the table below. There have been no conditions or events since that notification that management believes have changed the Bank’s category.
In 2013, the Federal Reserve approved its final rule on the Basel III capital standards, which implement changes to the regulatory capital framework for banking organizations. The Basel III capital standards, which became effective January 1, 2015, include new risk-based capital and leverage ratios, which were phased in from 2015 to 2019. The new minimum capital level requirements applicable to the Company and the Bank under the final rules are as follows: (i) a new common equity Tier 1 capital ratio of 4.5%; (ii) a Tier 1 capital ratio of 6% (increased from 4%); (iii) a total risk based capital ratio of 8% (unchanged from previous rules); and (iv) a Tier 1 leverage ratio of 4% (unchanged from previous rules). An additional capital conservation buffer was added to the minimum requirements for capital adequacy purposes beginning on January 1, 2016 and was phased in through 2019. This resulted in the following minimum ratios beginning in 2019: (i) a common equity Tier 1 capital ratio of 7.0%, (ii) a Tier 1 capital ratio of 8.5%, and (iii) a total capital ratio of 10.5%. Under the final rules, institutions would be subject to limitations on paying dividends, engaging in share repurchases, and paying discretionary bonuses if its capital level falls below the buffer amount. These limitations establish a maximum percentage of eligible retained earnings that could be utilized for such actions.
The Company’s and the Bank’s actual capital amounts and ratios are presented below:
(Dollars in thousands) |
|
|
|
|
|
|
|
|
|
|
|
|
|
|
|
|
|
| ||||||
|
| Actual |
|
| Minimum Regulatory Capital Ratio |
|
| Minimum Ratio plus Capital Conservation Buffer |
| |||||||||||||||
|
| Amount |
|
| Ratio |
|
| Amount |
|
| Ratio |
|
| Amount |
|
| Ratio |
| ||||||
|
|
|
|
|
|
|
|
|
|
|
|
|
|
|
|
|
|
| ||||||
As of December 31, 2022: |
|
|
|
|
|
|
|
|
|
|
|
|
|
|
|
|
|
| ||||||
|
|
|
|
|
|
|
|
|
|
|
|
|
|
|
|
|
|
| ||||||
Total Capital (to Risk-Weighted Assets) |
|
|
|
|
|
|
|
|
|
|
|
|
|
|
|
|
|
| ||||||
Consolidated |
| $ | 178,286 |
|
|
| 14.04 | % |
|
| 101,608 |
|
|
| 8.00 | % |
|
| N/A |
|
|
| N/A |
|
Bank |
| $ | 176,923 |
|
|
| 13.93 | % |
|
| 101,606 |
|
|
| 8.00 | % |
|
| 133,357 |
|
|
| 10.50 | % |
Tier 1 Capital (to Risk-Weighted Assets) |
|
|
|
|
|
|
|
|
|
|
|
|
|
|
|
|
|
|
|
|
|
|
|
|
Consolidated |
| $ | 167,792 |
|
|
| 13.21 | % |
|
| 76,206 |
|
|
| 6.00 | % |
|
| N/A |
|
|
| N/A |
|
Bank |
| $ | 166,429 |
|
|
| 13.10 | % |
|
| 76,204 |
|
|
| 6.00 | % |
|
| 107,956 |
|
|
| 8.50 | % |
Tier 1 Capital (to Average Assets) |
|
|
|
|
|
|
|
|
|
|
|
|
|
|
|
|
|
|
|
|
|
|
|
|
Consolidated |
| $ | 167,792 |
|
|
| 9.82 | % |
|
| 68,347 |
|
|
| 4.00 | % |
|
| N/A |
|
|
| N/A |
|
Bank |
| $ | 166,429 |
|
|
| 9.68 | % |
|
| 68,780 |
|
|
| 4.00 | % |
|
| 68,780 |
|
|
| 4.00 | % |
Common Equity Tier 1 (to Risk-Weighted Assets) |
|
|
|
|
|
|
|
|
|
|
|
|
|
|
|
|
|
|
|
|
|
|
|
|
Consolidated |
| $ | 152,792 |
|
|
| 12.03 | % |
|
| 57,154 |
|
|
| 4.50 | % |
|
| N/A |
|
|
| N/A |
|
Bank |
| $ | 166,429 |
|
|
| 13.10 | % |
|
| 57,153 |
|
|
| 4.50 | % |
|
| 88,905 |
|
|
| 7.00 | % |
(Dollars in thousands) |
|
|
|
|
|
|
|
|
|
|
|
|
|
|
|
|
|
| ||||||
|
| Actual |
|
| Minimum Regulatory Capital Ratio |
|
| Minimum Ratio plus Capital Conservation Buffer |
| |||||||||||||||
|
| Amount |
|
| Ratio |
|
| Amount |
|
| Ratio |
|
| Amount |
|
| Ratio |
| ||||||
|
|
|
|
|
|
|
|
|
|
|
|
|
|
|
|
|
|
| ||||||
As of December 31, 2021: |
|
|
|
|
|
|
|
|
|
|
|
|
|
|
|
|
|
| ||||||
|
|
|
|
|
|
|
|
|
|
|
|
|
|
|
|
|
|
| ||||||
Total Capital (to Risk-Weighted Assets) |
|
|
|
|
|
|
|
|
|
|
|
|
|
|
|
|
|
| ||||||
Consolidated |
| $ | 166,628 |
|
|
| 16.35 | % |
|
| 81,547 |
|
|
| 8.00 | % |
|
| N/A |
|
|
| N/A |
|
Bank |
| $ | 164,975 |
|
|
| 16.19 | % |
|
| 81,539 |
|
|
| 8.00 | % |
|
| 107,020 |
|
|
| 10.50 | % |
Tier 1 Capital (to Risk-Weighted Assets) |
|
|
|
|
|
|
|
|
|
|
|
|
|
|
|
|
|
|
|
|
|
|
|
|
Consolidated |
| $ | 157,273 |
|
|
| 15.43 | % |
|
| 61,160 |
|
|
| 6.00 | % |
|
| N/A |
|
|
| N/A |
|
Bank |
| $ | 155,620 |
|
|
| 15.27 | % |
|
| 61,154 |
|
|
| 6.00 | % |
|
| 86,635 |
|
|
| 8.50 | % |
Tier 1 Capital (to Average Assets) |
|
|
|
|
|
|
|
|
|
|
|
|
|
|
|
|
|
|
|
|
|
|
|
|
Consolidated |
| $ | 157,273 |
|
|
| 9.64 | % |
|
| 65,258 |
|
|
| 4.00 | % |
|
| N/A |
|
|
| N/A |
|
Bank |
| $ | 155,620 |
|
|
| 9.50 | % |
|
| 65,557 |
|
|
| 4.00 | % |
|
| 65,557 |
|
|
| 4.00 | % |
Common Equity Tier 1 (to Risk-Weighted Assets) |
|
|
|
|
|
|
|
|
|
|
|
|
|
|
|
|
|
|
|
|
|
|
|
|
Consolidated |
| $ | 142,273 |
|
|
| 13.96 | % |
|
| 45,870 |
|
|
| 4.50 | % |
|
| N/A |
|
|
| N/A |
|
Bank |
| $ | 155,620 |
|
|
| 15.27 | % |
|
| 45,866 |
|
|
| 4.50 | % |
|
| 71,347 |
|
|
| 7.00 | % |
| A-52 |
(14) Other Operating Income and Expense
Miscellaneous non-interest income for the years ended December 31, 2022, 2021 and 2020 included the following items:
(Dollars in thousands) |
|
|
|
|
|
|
|
|
| |||
|
| 2022 |
|
| 2021 |
|
| 2020 |
| |||
Visa debit card income |
| $ | 4,901 |
|
|
| 5,045 |
|
|
| 4,237 |
|
Bank owned life insurance income |
|
| 458 |
|
|
| 397 |
|
|
| 380 |
|
Other |
|
| 2,390 |
|
|
| 2,197 |
|
|
| 1,315 |
|
|
| $ | 7,749 |
|
|
| 7,639 |
|
|
| 5,932 |
|
Other non-interest expense for the years ended December 31, 2022, 2021 and 2020 included the following items:
(Dollars in thousands) |
|
|
|
|
|
|
|
|
| |||
|
| 2022 |
|
| 2021 |
|
| 2020 |
| |||
ATM expense |
| $ | 629 |
|
|
| 619 |
|
|
| 567 |
|
Data processing |
|
| 777 |
|
|
| 643 |
|
|
| 635 |
|
Deposit program expense |
|
| 348 |
|
|
| 415 |
|
|
| 426 |
|
Dues and subscriptions |
|
| 628 |
|
|
| 588 |
|
|
| 538 |
|
FHLB advance prepayment penalty |
|
| - |
|
|
| - |
|
|
| 1,100 |
|
Internet banking expense |
|
| 949 |
|
|
| 768 |
|
|
| 729 |
|
Office supplies |
|
| 532 |
|
|
| 374 |
|
|
| 538 |
|
Telephone |
|
| 691 |
|
|
| 730 |
|
|
| 794 |
|
Other |
|
| 3,741 |
|
|
| 3,737 |
|
|
| 3,217 |
|
|
| $ | 8,295 |
|
|
| 7,874 |
|
|
| 8,544 |
|
(15) Fair Value of Financial Instruments
The Company is required to disclose fair value information about financial instruments, whether or not recognized on the face of the balance sheet, for which it is practicable to estimate that value. The assumptions used in the estimation of the fair value of the Company’s financial instruments are detailed below. Where quoted prices are not available, fair values are based on estimates using discounted cash flows and other valuation techniques. The use of discounted cash flows can be significantly affected by the assumptions used, including the discount rate and estimates of future cash flows. The following disclosures should not be considered a surrogate of the liquidation value of the Company, but rather a good faith estimate of the increase or decrease in the value of financial instruments held by the Company since purchase, origination, or issuance.
The Company groups assets and liabilities at fair value in three levels, based on the markets in which the assets and liabilities are traded and the reliability of the assumptions used to determine fair value. These levels are:
| · | Level 1 – Valuation is based upon quoted prices for identical instruments traded in active markets. |
| · | Level 2 – Valuation is based upon quoted prices for similar instruments in active markets, quoted prices for identical or similar instruments in markets that are not active, and model-based valuation techniques for which all significant assumptions are observable in the market. |
| · | Level 3 – Valuation is generated from model-based techniques that use at least one significant assumption not observable in the market. These unobservable assumptions reflect estimates of assumptions that market participants would use in pricing the asset or liability. Valuation techniques include use of option pricing models, discounted cash flow models and similar techniques. |
Cash and Cash Equivalents
For cash, due from banks and interest-bearing deposits, the carrying amount is a reasonable estimate of fair value. Cash and cash equivalents are reported in the Level 1 fair value category.
Investment Securities Available for Sale
Fair values of investment securities available for sale are determined by obtaining quoted prices on nationally recognized securities exchanges when available. If quoted prices are not available, fair value is determined using matrix pricing, which is a mathematical technique used widely in the industry to value debt securities without relying exclusively on quoted prices for the specific securities but rather by relying on the securities’ relationship to other benchmark quoted securities. Fair values for investment securities with quoted market prices are reported in the Level 1 fair value category. Fair value measurements obtained from independent pricing services are reported in the Level 2 fair value category. All other fair value measurements are reported in the Level 3 fair value category.
| A-53 |
Other Investments
For other investments, the carrying value is a reasonable estimate of fair value. Other investments are reported in the Level 3 fair value category.
Mortgage Loans Held for Sale
Mortgage loans held for sale are carried at lower of aggregate cost or market value. The cost of mortgage loans held for sale approximates the market value. Mortgage loans held for sale are reported in the Level 3 fair value category.
Loans
The fair value of loans, excluding previously presented impaired loans measured at fair value on a non-recurring basis, is estimated using discounted cash flow analyses. The discount rates used to determine fair value use interest rate spreads that reflect factors such as liquidity, credit, and nonperformance risk of the loans. Loans are reported in the Level 3 fair value category, as the pricing of loans is more subjective than the pricing of other financial instruments.
Mutual Funds
For mutual funds held in the deferred compensation trust, the carrying value is a reasonable estimate of fair value. Mutual funds held in the deferred compensation trust are included in other assets on the balance sheet and reported in the Level 2 fair value category.
Deposits
The fair value of demand deposits, interest-bearing demand deposits and savings is the amount payable on demand at the reporting date. The fair value of certificates of deposit is estimated by discounting the future cash flows using the rates currently offered for deposits of similar remaining maturities. Deposits are reported in the Level 3 fair value category.
Securities Sold Under Agreements to Repurchase
For securities sold under agreements to repurchase, the carrying value is a reasonable estimate of fair value. Securities sold under agreements to repurchase are reported in the Level 2 fair value category.
FHLB Borrowings
The fair value of FHLB borrowings is estimated based upon discounted future cash flows using a discount rate comparable to the current market rate for such borrowings. FHLB borrowings are reported in the Level 3 fair value category.
Junior Subordinated Debentures
Because the Company’s junior subordinated debentures were issued at a floating rate, the carrying amount is a reasonable estimate of fair value. Junior subordinated debentures are reported in the Level 2 fair value category.
Commitments to Extend Credit and Standby Letters of Credit
Commitments to extend credit and standby letters of credit are generally short-term and at variable interest rates. Therefore, both the carrying value and estimated fair value associated with these instruments are immaterial.
Limitations
Fair value estimates are made at a specific point in time, based on relevant market information and information about the financial instrument. These estimates do not reflect any premium or discount that could result from offering for sale at one time the Company’s entire holdings of a particular financial instrument. Because no market exists for a significant portion of the Company’s financial instruments, fair value estimates are based on many judgments. These estimates are subjective in nature and involve uncertainties and matters of significant judgment and therefore cannot be determined with precision. Changes in assumptions could significantly affect the estimates.
Fair value estimates are based on existing on and off-balance sheet financial instruments without attempting to estimate the value of anticipated future business and the value of assets and liabilities that are not considered financial instruments. Significant assets and liabilities that are not considered financial instruments include deferred income taxes and premises and equipment. In addition, the tax ramifications related to the realization of unrealized gains and losses can have a significant effect on fair value estimates and have not been considered in the estimates.
| A-54 |
The fair value presentation for recurring assets is presented in Note 2. There were no recurring liabilities at December 31, 2022 and 2021. The fair value presentation for non-recurring assets is presented in Note 3. There were no non-recurring liabilities at December 31, 2022 and 2021. The carrying amount and estimated fair value of the Company’s financial instruments at December 31, 2022 and 2021 are as follows:
(Dollars in thousands) |
|
|
|
|
|
|
|
|
|
|
|
|
|
|
| |||||
|
|
|
|
| Fair Value Measurements at December 31, 2022 |
| ||||||||||||||
|
| Carrying Amount |
|
| Level 1 |
|
| Level 2 |
|
| Level 3 |
|
| Total |
| |||||
Assets: |
|
|
|
|
|
|
|
|
|
|
|
|
|
|
| |||||
Cash and cash equivalents |
| $ | 71,596 |
|
|
| 71,596 |
|
|
| - |
|
|
| - |
|
|
| 71,596 |
|
Investment securities available for sale |
|
| 445,394 |
|
|
| - |
|
|
| 445,394 |
|
|
| - |
|
|
| 445,394 |
|
Other investments |
|
| 2,656 |
|
|
| - |
|
|
| - |
|
|
| 2,656 |
|
|
| 2,656 |
|
Mortgage loans held for sale |
|
| 211 |
|
|
| - |
|
|
| - |
|
|
| 211 |
|
|
| 211 |
|
Loans, net |
|
| 1,022,114 |
|
|
| - |
|
|
| - |
|
|
| 998,587 |
|
|
| 998,587 |
|
Mutual funds held in deferred compensation trust |
|
| 1,327 |
|
|
| - |
|
|
| 1,327 |
|
|
| - |
|
|
| 1,327 |
|
|
|
|
|
|
|
|
|
|
|
|
|
|
|
|
|
|
|
|
|
|
Liabilities: |
|
|
|
|
|
|
|
|
|
|
|
|
|
|
|
|
|
|
|
|
Deposits |
| $ | 1,435,215 |
|
|
| - |
|
|
| - |
|
|
| 1,434,871 |
|
|
| 1,434,871 |
|
Securities sold under agreements to repurchase |
|
| 47,688 |
|
|
| - |
|
|
| 47,688 |
|
|
| - |
|
|
| 47,688 |
|
Junior subordinated debentures |
|
| 15,464 |
|
|
| - |
|
|
| 15,464 |
|
|
| - |
|
|
| 15,464 |
|
(Dollars in thousands) |
|
|
|
|
|
|
|
|
|
|
|
|
|
|
| |||||
|
|
|
|
| Fair Value Measurements at December 31, 2021 |
| ||||||||||||||
|
| Carrying Amount |
|
| Level 1 |
|
| Level 2 |
|
| Level 3 |
|
| Total |
| |||||
Assets: |
|
|
|
|
|
|
|
|
|
|
|
|
|
|
| |||||
Cash and cash equivalents |
| $ | 277,499 |
|
|
| 277,499 |
|
|
| - |
|
|
| - |
|
|
| 277,499 |
|
Investment securities available for sale |
|
| 406,549 |
|
|
| - |
|
|
| 406,549 |
|
|
| - |
|
|
| 406,549 |
|
Other investments |
|
| 3,668 |
|
|
| - |
|
|
| - |
|
|
| 3,668 |
|
|
| 3,668 |
|
Mortgage loans held for sale |
|
| 3,637 |
|
|
| - |
|
|
| - |
|
|
| 3,637 |
|
|
| 3,637 |
|
Loans, net |
|
| 875,514 |
|
|
| - |
|
|
| - |
|
|
| 855,814 |
|
|
| 855,814 |
|
Mutual funds held in deferred compensation trust |
|
| 1,510 |
|
|
| - |
|
|
| 1,510 |
|
|
| - |
|
|
| 1,510 |
|
|
|
|
|
|
|
|
|
|
|
|
|
|
|
|
|
|
|
|
|
|
Liabilities: |
|
|
|
|
|
|
|
|
|
|
|
|
|
|
|
|
|
|
|
|
Deposits |
| $ | 1,412,748 |
|
|
| - |
|
|
| - |
|
|
| 1,401,833 |
|
|
| 1,401,833 |
|
Securities sold under agreements to repurchase |
|
| 37,094 |
|
|
| - |
|
|
| 37,094 |
|
|
| - |
|
|
| 37,094 |
|
Junior subordinated debentures |
|
| 15,464 |
|
|
| - |
|
|
| 15,464 |
|
|
| - |
|
|
| 15,464 |
|
The tables below present the balance of mutual funds held in the deferred compensation trust, which are measured at fair value on a recurring basis by level within the fair value hierarchy, as of December 31, 2022 and 2021.
(Dollars in thousands) |
|
|
|
|
|
|
|
|
|
|
|
| ||||
|
| December 31, 2022 |
| |||||||||||||
|
| Fair Value Measurements |
|
| Level 1 Valuation |
|
| Level 2 Valuation |
|
| Level 3 Valuation |
| ||||
Mutual funds held in deferred compensation trust |
| $ | 1,327 |
|
|
| - |
|
|
| 1,327 |
|
|
| - |
|
| A-55 |
(Dollars in thousands) |
|
|
|
|
|
|
|
|
|
|
|
| ||||
|
| December 31, 2021 |
| |||||||||||||
|
| Fair Value Measurements |
|
| Level 1 Valuation |
|
| Level 2 Valuation |
|
| Level 3 Valuation |
| ||||
Mutual funds held in deferred compensation trust |
| $ | 1,510 |
|
|
| - |
|
|
| 1,510 |
|
|
| - |
|
(16) Reportable Segments
The Company has two reportable segments as described below.
Banking Operations – This segment reflects the consolidated Bank, excluding CBRES. The primary source of revenue for this segment is net interest income.
CBRES – A Bank subsidiary that provides appraisal management services to community banks. The primary source of revenue for this segment is appraisal management fee income.
The following table presents financial information for the reportable segments. The information provided under the caption “Other” represents the parent company, which is not considered to be a reportable segment, is included to reconcile the results of the operating segments to the consolidated financial statements prepared in conformity with GAAP.
(Dollars in thousands) |
|
|
|
|
|
|
|
|
|
|
|
| ||||
|
| Banking |
|
|
|
|
|
|
|
|
|
| ||||
|
| Operations |
|
| CBRES |
|
| Other |
|
| Consolidated |
| ||||
As of and for the year ended December 31, 2022 |
|
|
|
|
|
|
|
|
|
|
|
| ||||
Interest income |
| $ | 54,416 |
|
| $ | - |
|
| $ | 15 |
|
| $ | 54,431 |
|
Interest expense |
|
| 2,796 |
|
|
| - |
|
|
| 527 |
|
|
| 3,323 |
|
Net interest income |
|
| 51,620 |
|
|
| - |
|
|
| (512 | ) |
|
| 51,108 |
|
Provision for loan losses |
|
| 1,472 |
|
|
| - |
|
|
| - |
|
|
| 1,472 |
|
Noninterest income |
|
| 15,012 |
|
|
| 14 |
|
|
| - |
|
|
| 15,026 |
|
Appraisal management fee income |
|
| - |
|
|
| 11,663 |
|
|
| - |
|
|
| 11,663 |
|
Noninterest expense |
|
| 44,433 |
|
|
| 1,695 |
|
|
| 638 |
|
|
| 46,766 |
|
Appraisal management fee expense |
|
| - |
|
|
| 9,264 |
|
|
| - |
|
|
| 9,264 |
|
Income tax expense (benefit) |
|
| 4,248 |
|
|
| 166 |
|
|
| (242 | ) |
|
| 4,172 |
|
Net income (loss) |
| $ | 16,479 |
|
| $ | 552 |
|
| $ | (908 | ) |
| $ | 16,123 |
|
Total assets |
| $ | 1,617,212 |
|
| $ | 3,227 |
|
| $ | 488 |
|
| $ | 1,620,927 |
|
As of and for the year ended December 31, 2021 |
|
|
|
|
|
|
|
|
|
|
|
|
|
|
|
|
Interest income |
| $ | 47,171 |
|
| $ | - |
|
| $ | 8 |
|
| $ | 47,179 |
|
Interest expense |
|
| 2,930 |
|
|
| - |
|
|
| 275 |
|
|
| 3,205 |
|
Net interest income |
|
| 44,241 |
|
|
| - |
|
|
| (267 | ) |
|
| 43,974 |
|
Recovery of loan losses |
|
| (1,163 | ) |
|
| - |
|
|
| - |
|
|
| (1,163 | ) |
Noninterest income |
|
| 16,014 |
|
|
| 15 |
|
|
| - |
|
|
| 16,029 |
|
Appraisal management fee income |
|
| - |
|
|
| 8,890 |
|
|
| - |
|
|
| 8,890 |
|
Noninterest expense |
|
| 42,239 |
|
|
| 1,163 |
|
|
| 613 |
|
|
| 44,015 |
|
Appraisal management fee expense |
|
| - |
|
|
| 7,112 |
|
|
| - |
|
|
| 7,112 |
|
Income tax expense (benefit) |
|
| 3,836 |
|
|
| 145 |
|
|
| (185 | ) |
|
| 3,796 |
|
Net income (loss) |
| $ | 15,343 |
|
| $ | 485 |
|
| $ | (695 | ) |
| $ | 15,133 |
|
Total assets |
| $ | 1,620,933 |
|
| $ | 2,692 |
|
| $ | 568 |
|
| $ | 1,624,193 |
|
As of and for the year ended December 31, 2020 |
|
|
|
|
|
|
|
|
|
|
|
|
|
|
|
|
Interest income |
| $ | 47,926 |
|
| $ | - |
|
| $ | 32 |
|
| $ | 47,958 |
|
Interest expense |
|
| 3,473 |
|
|
| - |
|
|
| 363 |
|
|
| 3,836 |
|
Net interest income |
|
| 44,453 |
|
|
| - |
|
|
| (331 | ) |
|
| 44,122 |
|
Provision for loan losses |
|
| 4,259 |
|
|
| - |
|
|
| - |
|
|
| 4,259 |
|
Noninterest income |
|
| 16,148 |
|
|
| 12 |
|
|
| - |
|
|
| 16,160 |
|
Appraisal management fee income |
|
| - |
|
|
| 6,754 |
|
|
| - |
|
|
| 6,754 |
|
Noninterest expense |
|
| 42,041 |
|
|
| 991 |
|
|
| 625 |
|
|
| 43,657 |
|
Appraisal management fee expense |
|
| - |
|
|
| 5,274 |
|
|
| - |
|
|
| 5,274 |
|
Income tax expense (benefit) |
|
| 2,574 |
|
|
| 116 |
|
|
| (201 | ) |
|
| 2,489 |
|
Net income (loss) |
| $ | 11,727 |
|
| $ | 385 |
|
| $ | (755 | ) |
| $ | 11,357 |
|
| A-56 |
(17) Peoples Bancorp of North Carolina, Inc. (Parent Company Only) Condensed Financial Statements
Balance Sheets | ||||||||
|
|
|
|
|
|
| ||
December 31, 2022 and 2021 | ||||||||
(Dollars in thousands) | ||||||||
|
|
|
|
|
|
| ||
Assets |
| 2022 |
|
| 2021 |
| ||
|
|
|
|
|
|
| ||
Cash |
| $ | 384 |
|
|
| 561 |
|
Interest-bearing time deposit |
|
| 1,000 |
|
|
| 1,000 |
|
Investment in subsidiaries |
|
| 118,832 |
|
|
| 155,716 |
|
Investment in PEBK Capital Trust II |
|
| 464 |
|
|
| 464 |
|
Other assets |
|
| 24 |
|
|
| 105 |
|
|
|
|
|
|
|
|
|
|
Total assets |
| $ | 120,704 |
|
|
| 157,846 |
|
|
|
|
|
|
|
|
|
|
Liabilities and Shareholders' Equity |
|
|
|
|
|
|
|
|
|
|
|
|
|
|
|
|
|
Junior subordinated debentures |
| $ | 15,464 |
|
|
| 15,464 |
|
Liabilities |
|
| 45 |
|
|
| 13 |
|
Shareholders' equity |
|
| 105,195 |
|
|
| 142,369 |
|
|
|
|
|
|
|
|
|
|
Total liabilities and shareholders' equity |
| $ | 120,704 |
|
|
| 157,846 |
|
Statements of Earnings | ||||||||||||
|
|
|
|
|
|
|
|
|
| |||
For the Years Ended December 31, 2022, 2021 and 2020 | ||||||||||||
(Dollars in thousands) | ||||||||||||
|
|
|
|
|
|
|
|
|
| |||
Revenues: |
| 2022 |
|
| 2021 |
|
| 2020 |
| |||
|
|
|
|
|
|
|
|
|
| |||
Interest and dividend from subsidiary |
| $ | 6,240 |
|
|
| 7,419 |
|
|
| 7,539 |
|
|
|
|
|
|
|
|
|
|
|
|
|
|
Total revenues |
|
| 6,240 |
|
|
| 7,419 |
|
|
| 7,539 |
|
|
|
|
|
|
|
|
|
|
|
|
|
|
Expenses: |
|
|
|
|
|
|
|
|
|
|
|
|
|
|
|
|
|
|
|
|
|
|
|
|
|
Interest |
|
| 529 |
|
|
| 280 |
|
|
| 370 |
|
Other operating expenses |
|
| 639 |
|
|
| 613 |
|
|
| 625 |
|
|
|
|
|
|
|
|
|
|
|
|
|
|
Total expenses |
|
| 1,168 |
|
|
| 893 |
|
|
| 995 |
|
|
|
|
|
|
|
|
|
|
|
|
|
|
Income before income tax benefit and equity in undistributed earnings of subsidiaries |
|
| 5,072 |
|
|
| 6,526 |
|
|
| 6,544 |
|
|
|
|
|
|
|
|
|
|
|
|
|
|
Income tax benefit |
|
| 242 |
|
|
| 185 |
|
|
| 201 |
|
|
|
|
|
|
|
|
|
|
|
|
|
|
Income before equity in undistributed earnings of subsidiaries |
|
| 5,314 |
|
|
| 6,711 |
|
|
| 6,745 |
|
|
|
|
|
|
|
|
|
|
|
|
|
|
Equity in undistributed earnings of subsidiaries |
|
| 10,809 |
|
|
| 8,422 |
|
|
| 4,612 |
|
|
|
|
|
|
|
|
|
|
|
|
|
|
Net earnings |
| $ | 16,123 |
|
|
| 15,133 |
|
|
| 11,357 |
|
| A-57 |
Statements of Cash Flows | ||||||||||||
|
|
|
|
|
|
|
|
|
| |||
For the Years Ended December 31, 2022, 2021 and 2020 | ||||||||||||
(Dollars in thousands) | ||||||||||||
|
|
|
|
|
|
|
|
|
| |||
|
| 2022 |
|
| 2021 |
|
| 2020 |
| |||
Cash flows from operating activities: |
|
|
|
|
|
|
|
|
| |||
|
|
|
|
|
|
|
|
|
| |||
Net earnings |
| $ | 16,123 |
|
|
| 15,133 |
|
|
| 11,357 |
|
Adjustments to reconcile net earnings to net cash provided by operating activities: |
|
|
|
|
|
|
|
|
|
|
|
|
Equity in undistributed earnings of subsidiaries |
|
| (10,809 | ) |
|
| (8,422 | ) |
|
| (4,612 | ) |
Change in: |
|
|
|
|
|
|
|
|
|
|
|
|
Other assets |
|
| 81 |
|
|
| 545 |
|
|
| (19 | ) |
Other liabilities |
|
| 32 |
|
|
| - |
|
|
| (10 | ) |
|
|
|
|
|
|
|
|
|
|
|
|
|
Net cash provided by operating activities |
|
| 5,427 |
|
|
| 7,256 |
|
|
| 6,716 |
|
|
|
|
|
|
|
|
|
|
|
|
|
|
Cash flows from investing activities: |
|
|
|
|
|
|
|
|
|
|
|
|
|
|
|
|
|
|
|
|
|
|
|
|
|
Proceeds from calls and maturities of investment securities available for sale |
|
| - |
|
|
| - |
|
|
| 250 |
|
|
|
|
|
|
|
|
|
|
|
|
|
|
Net cash provided by investing activities |
|
| - |
|
|
| - |
|
|
| 250 |
|
|
|
|
|
|
|
|
|
|
|
|
|
|
Cash flows from financing activities: |
|
|
|
|
|
|
|
|
|
|
|
|
|
|
|
|
|
|
|
|
|
|
|
|
|
Repayment of junior subordinated debentures |
|
| - |
|
|
| - |
|
|
| (155 | ) |
Cash dividends paid on common stock |
|
| (4,935 | ) |
|
| (3,793 | ) |
|
| (4,392 | ) |
Stock repurchase |
|
| (710 | ) |
|
| (3,605 | ) |
|
| (2,999 | ) |
Proceeds from exercise of restricted stock units |
|
| 41 |
|
|
| 39 |
|
|
| 57 |
|
|
|
|
|
|
|
|
|
|
|
|
|
|
Net cash used by financing activities |
|
| (5,604 | ) |
|
| (7,359 | ) |
|
| (7,489 | ) |
|
|
|
|
|
|
|
|
|
|
|
|
|
Net change in cash |
|
| (177 | ) |
|
| (103 | ) |
|
| (523 | ) |
|
|
|
|
|
|
|
|
|
|
|
|
|
Cash at beginning of year |
|
| 561 |
|
|
| 664 |
|
|
| 1,187 |
|
|
|
|
|
|
|
|
|
|
|
|
|
|
Cash at end of year |
| $ | 384 |
|
|
| 561 |
|
|
| 664 |
|
(18) Quarterly Data
|
| 2022 |
|
| 2021 |
| ||||||||||||||||||||||||||
(Dollars in thousands, except per share amounts) |
| First |
|
| Second |
|
| Third |
|
| Fourth |
|
| First |
|
| Second |
|
| Third |
|
| Fourth |
| ||||||||
Total interest income |
| $ | 11,329 |
|
|
| 11,992 |
|
|
| 14,611 |
|
|
| 16,499 |
|
| $ | 11,922 |
|
|
| 12,517 |
|
|
| 11,421 |
|
|
| 11,319 |
|
Total interest expense |
|
| 663 |
|
|
| 644 |
|
|
| 818 |
|
|
| 1,198 |
|
|
| 815 |
|
|
| 842 |
|
|
| 861 |
|
|
| 687 |
|
Net interest income |
|
| 10,666 |
|
|
| 11,348 |
|
|
| 13,793 |
|
|
| 15,301 |
|
|
| 11,107 |
|
|
| 11,675 |
|
|
| 10,560 |
|
|
| 10,632 |
|
|
|
|
|
|
|
|
|
|
|
|
|
|
|
|
|
|
|
|
|
|
|
|
|
|
|
|
|
|
|
|
|
|
Provision for loan losses |
|
| 71 |
|
|
| 410 |
|
|
| 408 |
|
|
| 583 |
|
|
| (455 | ) |
|
| (226 | ) |
|
| (182 | ) |
|
| (300 | ) |
Other income |
|
| 7,046 |
|
|
| 7,328 |
|
|
| 6,793 |
|
|
| 5,522 |
|
|
| 5,873 |
|
|
| 6,040 |
|
|
| 6,040 |
|
|
| 6,966 |
|
Other expense |
|
| 13,341 |
|
|
| 14,243 |
|
|
| 13,455 |
|
|
| 14,991 |
|
|
| 12,268 |
|
|
| 12,132 |
|
|
| 12,568 |
|
|
| 14,159 |
|
Income before income taxes |
|
| 4,300 |
|
|
| 4,023 |
|
|
| 6,723 |
|
|
| 5,249 |
|
|
| 5,167 |
|
|
| 5,809 |
|
|
| 4,214 |
|
|
| 3,739 |
|
|
|
|
|
|
|
|
|
|
|
|
|
|
|
|
|
|
|
|
|
|
|
|
|
|
|
|
|
|
|
|
|
|
Income tax expense |
|
| 848 |
|
|
| 806 |
|
|
| 1,416 |
|
|
| 1,102 |
|
|
| 1,046 |
|
|
| 1,194 |
|
|
| 824 |
|
|
| 732 |
|
Net earnings |
|
| 3,452 |
|
|
| 3,217 |
|
|
| 5,307 |
|
|
| 4,147 |
|
|
| 4,121 |
|
|
| 4,615 |
|
|
| 3,390 |
|
|
| 3,007 |
|
|
|
|
|
|
|
|
|
|
|
|
|
|
|
|
|
|
|
|
|
|
|
|
|
|
|
|
|
|
|
|
|
|
Basic net earnings per share |
| $ | 0.63 |
|
|
| 0.59 |
|
|
| 0.96 |
|
|
| 0.76 |
|
| $ | 0.73 |
|
|
| 0.82 |
|
|
| 0.61 |
|
|
| 0.55 |
|
Diluted net earnings per share |
| $ | 0.61 |
|
|
| 0.57 |
|
|
| 0.93 |
|
|
| 0.74 |
|
| $ | 0.71 |
|
|
| 0.80 |
|
|
| 0.59 |
|
|
| 0.53 |
|
A-58 |
(19) Subsequent Events
The Company has reviewed and evaluated subsequent events and transactions for material subsequent events through the date the financial statements are issued. Management has concluded that there were no material subsequent events other than the event noted below.
In January and February 2023, the Bank sold securities available for sale totaling $53.5 million, which resulted in gross losses of $2.7 million and gross gains of $177,000. The transaction was intended to reduce risk in the investment portfolio provided by favorable conditions that had developed for this class of security in the first part of 2023, and to provide the Bank with more flexibility to take advantage of a higher interest rate environment in 2023.
Between March 10, 2023 and March 12, 2023, two financial institutions unrelated to the Company experienced a significant run on deposits, leading to insolvency. These institutions failed and were placed into receivership by the FDIC. These institutions also had deposit concentrations related to higher-risk customer types, such as venture capital and cryptocurrency. The Federal Reserve determined that these institutions were a systemic risk and therefore, in concert with the FDIC, have determined that all deposits held by these two institutions will be insured. These events have created market volatility for the financial sector; however, the ongoing ramifications of these events have yet to be seen. These events have not caused any significant changes in deposit balances at Peoples Bank.
| A-59 |
DIRECTORS AND OFFICERS OF THE COMPANY
DIRECTORS
Robert C. Abernethy – Chairman
Chairman of the Board, Peoples Bancorp of North Carolina, Inc. and Peoples Bank;
President, Secretary and Treasurer, Carolina Glove Company, Inc. (glove manufacturer)
Secretary and Assistant Treasurer, Midstate Contractors, Inc. (paving company)
James S. Abernethy
Vice President, Carolina Glove Company, Inc. (glove manufacturer)
President and Assistant Secretary, Midstate Contractors, Inc. (paving company)
Vice President, Secretary and Chairman of the Board of Directors, Alexander Railroad Company
Kimberly Boyd-Leaks
Executive Vice President – Chief Retail Banking Support Officer, Peoples Bank
Douglas S. Howard
Vice President and Treasurer, Denver Equipment Company of Charlotte, Inc.
John W. Lineberger, Jr.
Vice President, Lineberger Brothers, Inc. (real estate development)
Gary E. Matthews
President and Director, Matthews Construction Company, Inc. (general contractor)
Director, Conover Metal Products
Billy L. Price, Jr. MD
Practitioner of Internal Medicine, BL Price Jr. Medical Consultants, PLLC
Larry E. Robinson
Chairman of the Board and Chief Executive Officer, The Blue Ridge Distributing Co., Inc. (beer and wine distributor)
Director, United Beverages of North Carolina, LLC (beer distributor)
William Gregory (Greg) Terry
President, Clemson Legacy Designs
Director/Consultant, Drum & Willis-Reynolds Funeral Homes & Crematory
Dan Ray Timmerman, Sr.
Chairman of the Board and Chief Executive Officer, Timmerman Manufacturing, Inc. (wrought iron furniture, railings and gates manufacturer)
Benjamin I. Zachary
President, Treasurer, General Manager and Director, Alexander Railroad Company
OFFICERS
Lance A. Sellers
President and Chief Executive Officer
Jeffrey N. Hooper
Executive Vice President, Chief Financial Officer, Corporate Treasurer and Assistant Corporate Secretary
William D. Cable, Sr.
Executive Vice President, Corporate Secretary and Assistant Corporate Treasurer
A-60 |