Exhibit 99.1

Plug Power 2017 Third Quarter Update Letter
Gross Sales exceed $60M with more than 2,700 units Deployed
Highlights for Third Quarter 2017
· GAAP gross revenues of $61.4 million, an increase of 250% from prior year
· Delivered a record quarter, deploying nine GenKey sites, comprising 2,753 GenDrive units, a unit increase of over 200% from previous quarterly record
· Continued expansion of blue-chip customer base; successfully secured contracts with two large manufacturing clients in the US automotive industry and one new customer in Europe
· Substantially improved financing structure for PPA deployments; utilized to finance four PPA sites in the quarter with financing proceeds exceeding the cost of equipment by over $3.1 million
· Completed $44.0 million in new bookings, bringing the year-to-date total to nearly $160 million
· Positive service gross margins demonstrate our continued progress towards making this a consistently profitable business
· GAAP diluted loss per share of $0.18; adjusted loss per share of $0.04 (adjusted for warrant related charges plus adding cash margin related to the financing of four PPA sites)
Q3 Shipments an All-Time Record
In the quarter, Plug Power yielded strong results with the successful deployment of nine sites and 2,753 GenDrive units. Fulfillment of multi-site deals announced in Q2 and Q3 with Amazon and Walmart comprised the majority of order volume for the third quarter. These results set new sales and deployment records for the company. A record peak output of over 60 GenDrive units was achieved on many days representing a 140% increase over historical averages. This performance during the third quarter, demonstrates the Company’s capability to deliver over 15,000 units per year. With this performance, and the backlog remaining for 2017, we are on track to achieve our revenue guidance of recording approximately 70% of our forecasted revenues in the second half of the year.

Plug continues to demonstrate its commitment towards reducing costs and improving margins. This quarter represents a record level of margins on products and services deployed and a substantial improvement over the prior year. Overall margins were driven by a favorable change in revenue mix towards higher equipment sales, and product margins were helped by growth in volume, supply chain cost reductions, and ongoing design enhancements.

1
One of most significant events in the third quarter was the new financing program with our key PPA customer, which provides substantially improved cash margin on each new site deployment. Sequential improvements in all recurring revenue categories contributed to the overall performance. This was led by positive gross margins in service, which saw benefits of improved product reliability and a higher ratio of units per technician deployed. Given ongoing product design enhancements and improved service strategies currently being rolled out, we expect these Q3 trends to continue into 2018 and beyond.
Q3 Progress in On-Road Electric Vehicle Markets
Forklift trucks are the original mass market electric vehicle, and Plug Power’s success in this market is directly applicable to the fast-growing market for on-road electric vehicles. On-road applications use similar components and systems as our higher power GenDrive units, giving us a ready product to meet growing demand. The Company has been engaged in business and product development efforts directed at this market and saw significant progress in Q3.
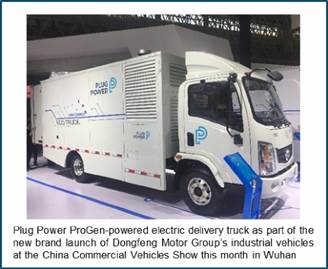
The environments in which commercial vehicles operate are typically less severe than we see in warehouses and manufacturing facilities. Our progress in other areas such as fueling infrastructure, IoT and our modular ProGen suite of stacks and systems, allows us to rapidly adapt our solutions to meet the needs of customers in these new markets. In the quarter, we saw a continuation of our trials with FedEx for next-generation hybrid electric delivery trucks, and we continued our trial with a Chinese company that has extensive nationwide reach. These projects are performing well - the trucks have passed critical lab and government tests, and have collectively accrued over 1,000 kilometers (600 miles) of on-road experience.
Financial Results Demonstrating Momentum
With this quarter’s deployment of over 2,700 GenDrive units, Plug Power has shipped nearly 19,000 GenDrive units to customers since the Company’s founding. This record quarterly deployment represents over twice the volume of orders completed from the prior largest quarter. To put this sales ramp up in perspective, consider that this one quarter’s output represents 17% of the total units deployed in the Company’s history.

2
As we think about the business, we are focused on the following key metrics to show progress commercially and operationally:
· GAAP Gross Revenue: The gross sales to our customers before any adjustments for customer warrant related accounting.
· Adjusted Gross Margin: This is gross revenue less total cost of goods sold. This measure shows the operating margin of the products and services we deploy without the inclusion of customer warrant related accounting.
· Adjusted EBITDAS: Operating loss plus the non-cash impacts of stock-based compensation, depreciation and amortization and warrants, plus the cash margin related to the financing of PPA sites. With our revised financing terms with our primary PPA customer, this financing cash margin will have a substantial impact on our financial position and we believe it is important to include for operational performance transparency.
· Adjusted EPS: The GAAP earnings or loss per share, plus non-cash warrant related charges and the financing cash margin related to the financing of PPA sites.
· Free Cash Flow: The sum of cash flows from operating and investing activities, plus inflows from project financing for PPA sites.
We believe that with the significantly better mix of non-PPA deployments combined with consistently improved margins across the main lines of business, we will be cash flow positive on quarterly revenues starting in the second half of 2018.

Full Year 2017 Update
We anticipate the momentum we saw in Q3 to continue into the fourth quarter. Plug Power’s visibility into the timing of deployments scheduled for the remainder of the year allows us to reconfirm revenue guidance of $130.0 million. The production ramp that took place over Q3 proved our ability to scale, and positions the Company to maintain a high level of output to meet increasing order volumes. At its peak of 60 units per day, this was 2.5x above the Company average.
3

We made significant progress on bookings, with a total through Q3 of nearly $160 million. During the quarter, we secured two new customers that are manufacturers in the US automotive sector. In addition, we continued to expand our presence in Europe. We continue to execute with Carrefour, deploying 80 additional units to their site during the quarter. We also announced a new agreement with Toyota Material Handling Norway (Toyota) to provide hydrogen fuel cells to Asko, a leading Norwegian grocery wholesaler.
While this is encouraging, and we reiterate our bookings target for the year, it is not without risk. We need to maintain a high level of performance with Amazon and Walmart to close additional 2018 commitments in the fourth quarter, and attract additional customers to multi-site agreements. We will need our manufacturing teams to convert the bookings we have already made to orders, by the end of the year. With the sales team maintaining its booking momentum, we are re-confirming our projected full year guidance of $325 million in bookings.
Performance in Q3 was not met without some challenges, which will translate into downward pressure on full year guidance. In order to meet the demands of our customers, expediting the necessary production ramp ultimately led to a higher level of up-front expenditures. As we adjusted manufacturing processes to accommodate the ramp we also experienced some operational inefficiencies. We now forecast that the full year adjusted gross margin will be positive, but will be approximately 5% to 6%, falling below our previous guidance of 8% to 12%. As described previously, margins will expand as we move into 2018. Supply chain management and order volumes continue to drive down costs, as we continue to see higher equipment sales. We’ll also see improvements on the service side as we identify areas to optimize both stack and service labor efficiency.
The shipment dates of a number of customer orders have been pulled into first quarter 2018. While this signals healthy growth for the business, in order to deliver on these orders, we expect higher than anticipated inventory build to take place in Q4. As a result, free cash flow use for the year will also be impacted, with our new forecast between $40 million-$45 million, although final numbers will be dependent on timing of cash conversion for Q4 deployments. Consistent with expectations, we anticipated significant cash collections to take place in the second half of the year. We maintain that we will be cash flow positive over this period, with collections in excess of $130 million. The majority of these collections will take place in Q4.
Q3 Operational Performance and Financial Results
Total GAAP gross revenue for the third quarter of 2017 was $61.4 million, compared to $17.6 million in the third quarter of 2016, a 250% year-over-year increase. The results reflected the installation of nine sites in total, including one under a PPA arrangement. Third quarter 2017 revenue represents 39.8% year-over-year growth in recurring revenue streams, showing the continued growth of our business model and contracted revenue backlog.
4
Included in our financial results is a $26.1 million provision for common stock warrants reported as a reduction of revenue. These charges are associated with accounting for warrants stemming from our customer agreements with Amazon and Walmart. Future revenue reductions will occur over time until each of the customers reaches a cumulative $600 million of qualified purchases, given the associated warrant agreements and required accounting.
Key Operating Metrics:
· 2,753 total GenDrive units deployed for the three months ended September 30, 2017, versus 950 units for the three months ended September 30, 2016
· 9 sites installed for the three months ended September 30, 2017 (including one completed as a PPA site), versus 4 sites installed for the three months ended September 30, 2016 (including three completed as PPA sites)
· Approximately 15,500 GenDrive units under service or PPA contract at September 30, 2017, versus approximately 11,000 at September 30, 2016
· 55 sites under fuel delivery contract at September 30, 2017, versus 35 sites at September 30, 2016
Excluding the Amazon and Walmart warrant charges of $26.1 million in the third quarter of 2017, adjusted gross margin represented positive 10.8% of sales. GAAP gross margin for the third quarter of 2017 including the customer warrant charges was negative $-19.4 million. GAAP gross margin for the third quarter of 2016 was $381,000, or 2.2% of sales (there were no customer warrants in prior year). The increase in adjusted gross margins versus the prior year is primarily a result of the growth in volume and continued favorable mix with higher equipment sales. Two additional highlights for the quarter were GenDrive gross margins coming in at 29.0%, and positive service margins. While service will see some variability quarter-to-quarter, this quarter’s result is consistent with the positive trend in projected service costs. The Company continues to target sustainable positive gross margins for service in 2018 and beyond.
Net loss attributable to common shareholders for the third quarter of 2017 was $41.0 million, or $0.18 loss per share on a diluted basis, or a loss of $0.04 on an adjusted basis. The adjusted loss per share excludes the warrant accounting and includes the cash positive impact on a per share basis from the four PPA bank financings completed. The net loss attributable to common shareholders in the third quarter of 2016 was $13.4 million, or $0.07 loss per share on a diluted basis.
Cash and Liquidity:
Free cash flow for the third quarter of 2017 was an outflow of $8.0 million compared to an outflow of $24.2 million in the third quarter of 2016. Free cash flow is defined as the sum of cash flows from operating and investing activities, plus inflows from project financing for PPA sites. Given timing of conversion from deployment to cash in 2017, effectively all collections for deployments in 2017 will occur in the second half, and predominantly in Q4. As of September 30, 2017, Plug Power had a total cash position of $56.5 million, including cash and cash equivalents of $8.0 million and restricted cash of $48.6 million. Also, the Company ended the
5
third quarter with accounts receivable totaling $52.9 million, of which over $20 million has already been collected in October.
Growth Outlook:
As anticipated, the third quarter was our largest to date with record shipments of GenDrive units and customer sites. The Company continues to grow the top line, expand cost reduction programs, and attract new customers for sustained growth. Plug Power proved its ability to ramp production, and we solidified our position further with our key multisite customers. Our efforts have positioned us for continued growth and margin improvements into 2018, as we continue to realize the positive benefits of our operational and commercial activities. Visibility into future deployments, continued traction on cost downs, and the positive impact from the more favorable PPA financing program provides Plug with the fundamentals to better predict and manage future growth. We are excited as we draw closer to bringing 2017 home and begin preparing for another big year in 2018.
/s/ Andrew Marsh | | /s/ Paul Middleton |
Andrew Marsh, President and CEO | | Paul Middleton, Chief Financial Officer |
Conference Call Information
The Company will host a live conference call and webcast:
Date: November 8, 2017
Time: 10:00 am ET
Toll-free: 877-407-9221
The webcast can be accessed at www.plugpower.com, selecting the conference call link on the home page, or directly at https://event.webcasts.com/starthere.jsp?ei=1167030&tp key=5ad317adde. A playback of the call will be available online for a period following the event.
About Plug Power Inc.
The architect of modern hydrogen and fuel cell technology, Plug Power is the innovator that has taken hydrogen and fuel cell technology from concept to commercialization. Plug Power has revolutionized the material handling industry with its full-service GenKey solution, which is designed to increase productivity, lower operating costs and reduce carbon footprints in a reliable, cost- effective way. The Company’s GenKey solution couples together all the necessary elements to power, fuel and serve a customer. With proven hydrogen and fuel cell products, Plug Power replaces lead acid batteries to power electric industrial vehicles, such as the lift trucks customers use in their distribution centers.
Extending its reach into the on-road electric vehicle market, Plug Power’s ProGen platform of modular fuel cell engines empowers OEMs and system integrators to rapidly adopt hydrogen fuel cell technology. ProGen engines are proven today, with thousands in service, supporting some of the most rugged operations in the world. Plug Power is the partner that customers trust to take their businesses into the future. www.plugpower.com.
6
Cautionary Note on Forward Looking Statements
This communication contains “forward-looking statements” within the meaning of the Private Securities Litigation Reform Act of 1995 that involve significant risks and uncertainties about the Company, including but not limited to statements about the Company’s expectations regarding full year 2017 revenue, shipments, gross margin, bookings and cash usage, the impact of the Amazon and Walmart relationships and the revenue to be derived from those relationships, deployment of GenKey sites and GenDrive units, improving liquidity, achieving positive cash flow in the second half of 2017, growth and profitability in 2018, future cost reductions, expansion in Europe, opportunities in the on-road electric vehicle market, higher equipment sales and positive gross service margins in 2018. Investors are cautioned that such statements should not be read as a guarantee of future performance or results, and will not necessarily be accurate indications of the times that, or by which, such performance or results will have been achieved. Such statements are subject to risks and uncertainties that could cause actual performance or results to differ materially from those expressed in these statements. In particular, the risks and uncertainties include, among other things, the risk that the Company continues to incur losses and might never achieve or maintain profitability; the risk that the Company will need to raise additional capital to fund its operations and such capital may not be available; the risk that the Company’s lack of extensive experience in manufacturing and marketing products may impact its ability to manufacture and market products on a profitable and large-scale commercial basis; the risk that unit orders will not ship, be installed and/or be converted to revenue, in whole or in part; the risk that a loss of one or more of the Company’s major customers could result in a material adverse effect on the Company’s financial condition; the risk that a sale of a significant number of shares of stock could depress the market price of the Company’s common stock; the risk of potential losses related to any product liability claims or contract disputes; the risk of loss related to an inability to maintain an effective system of internal controls; the Company’s ability to attract and maintain key personnel; the risks related to the use of flammable fuels in the Company’s products; the risk that pending orders may not convert to purchase orders, in whole or in part; the cost and timing of developing, marketing and selling the Company’s products and the Company’s ability to raise the necessary capital to fund such costs; the Company’s ability to obtain financing arrangements to support the sale or leasing of its products and services to customers; the Company’s ability to achieve the forecasted gross margin on the sale of its products; the cost and availability of fuel and fueling infrastructures for the Company’s products; the risk of elimination of government subsidies and economic incentives for alternative energy products; market acceptance of the Company’s products and services, including GenDrive units; the Company’s ability to establish and maintain relationships with third parties with respect to product development, manufacturing, distribution and servicing and the supply of key product components; the cost and availability of components and parts for the Company’s products; the Company’s ability to develop commercially viable products; the Company’s ability to reduce product and manufacturing costs; the Company’s ability to successfully market, distribute and service its products and services internationally; the Company’s ability to improve system reliability for its products; competitive factors, such as price competition and competition from other traditional and alternative energy companies; the Company’s ability to protect its intellectual property; the cost of complying with current and future federal, state and international governmental regulations; the risks associated with potential future acquisitions; the volatility of the Company’s stock price; and other risks and uncertainties referenced in the Company’s public filings with the SEC.
For additional disclosure regarding these and other risks faced by the Company, see disclosures contained in the Company’s public filings with the SEC, including the “Risk Factors” section of the Company’s Annual Report on Form 10-K for the year ended December 31, 2016. Investors should consider these factors in evaluating the forward-looking statements included in this communication and not place undue reliance on such statements. The forward-looking statements are made as of the date hereof, and the Company undertakes no obligation to update such statements as a result of new information.
Plug Power Investor Contact
John Cococcia
investors@plugpower.com
Plug Power Media Contact
Teal Vivacqua
media@plugpower.com
7
Plug Power Inc. and Subsidiaries
Consolidated Balance Sheets
(In thousands, except share and per share amounts)
(Unaudited)
| | September 30, | | December 31, | |
| | 2017 | | 2016 | |
Assets | | | | | |
Current assets: | | | | | |
Cash and cash equivalents | | $ | 7,957 | | $ | 46,014 | |
Restricted cash | | 14,902 | | 11,219 | |
Accounts receivable | | 52,869 | | 11,923 | |
Inventory | | 44,687 | | 29,940 | |
Prepaid expenses and other current assets | | 12,758 | | 11,837 | |
Total current assets | | 133,173 | | 110,933 | |
| | | | | |
Restricted cash | | 33,668 | | 43,403 | |
Property, plant, and equipment, net of accumulated depreciation of $31,075 and $29,666, respectively | | 8,657 | | 8,246 | |
Leased property, net of accumulated depreciation of $9,731 and $4,544, respectively | | 75,344 | | 54,060 | |
Goodwill | | 9,314 | | 8,291 | |
Intangible assets, net of accumulated amortization of $1,565 and $1,032, respectively | | 3,892 | | 3,933 | |
Other assets | | 11,635 | | 11,966 | |
Total assets | | $ | 275,683 | | $ | 240,832 | |
| | | | | |
Liabilities, Redeemable Preferred Stock, and Stockholders’ Equity | | | | | |
Current liabilities: | | | | | |
Accounts payable | | $ | 38,650 | | $ | 32,112 | |
Accrued expenses | | 8,912 | | 8,519 | |
Accrual for loss contracts related to service | | — | | 752 | |
Deferred revenue | | 8,262 | | 5,736 | |
Finance obligations | | 23,913 | | 14,787 | |
Current portion of long-term debt | | 22,081 | | 2,964 | |
Other current liabilities | | 1,330 | | 1,615 | |
Total current liabilities | | 103,148 | | 66,485 | |
Deferred revenue | | 25,898 | | 17,413 | |
Common stock warrant liability | | 5,657 | | 11,387 | |
Finance obligations | | 35,466 | | 29,767 | |
Long-term debt | | 17,933 | | 20,829 | |
Other liabilities | | 119 | | 241 | |
Total liabilities | | 188,221 | | 146,122 | |
| | | | | |
Redeemable preferred stock | | | | | |
Series C redeemable convertible preferred stock, $0.01 par value per share (aggregate involuntary liquidation preference $16,664); 10,431 shares authorized; Issued and outstanding: 2,620 at September 30, 2017 and 5,231 at December 31, 2016 | | 709 | | 1,153 | |
Series D redeemable convertible preferred stock, $0.01 par value per share (aggregate involuntary liquidation preference $0 at September 30, 2017 and $18,500 at December 31, 2016); 5,000,000 shares authorized; Issued and outstanding: none at September 30, 2017 and 18,500 at December 31, 2016 | | — | | 8,469 | |
Stockholders’ equity: | | | | | |
Common stock, $0.01 par value per share; 750,000,000 shares authorized; Issued (including shares in treasury): 228,120,565 at September 30, 2017 and 191,723,974 at December 31, 2016 | | 2,282 | | 1,917 | |
Additional paid-in capital | | 1,244,789 | | 1,137,482 | |
Accumulated other comprehensive income | | 1,958 | | 247 | |
Accumulated deficit | | (1,159,185 | ) | (1,051,467 | ) |
Less common stock in treasury: 582,328 at September 30, 2017 and December 31, 2016 | | (3,091 | ) | (3,091 | ) |
Total stockholders’ equity | | 86,753 | | 85,088 | |
Total liabilities, redeemable preferred stock, and stockholders’ equity | | $ | 275,683 | | $ | 240,832 | |
8
Plug Power Inc. and Subsidiaries
Consolidated Statements of Operations
(In thousands, except share and per share amounts)
(Unaudited)
| | Three Months Ended | | Nine months ended | |
| | September 30, | | September 30, | |
| | 2017 | | 2016 | | 2017 | | 2016 | |
Revenue: | | | | | | | | | |
Sales of fuel cell systems and related infrastructure | | $ | 45,179 | | $ | 5,653 | | $ | 55,936 | | $ | 19,992 | |
Services performed on fuel cell systems and related infrastructure | | 5,842 | | 4,763 | | 16,040 | | 15,396 | |
Power Purchase Agreements | | 5,428 | | 3,858 | | 14,684 | | 9,626 | |
Fuel delivered to customers | | 4,850 | | 2,909 | | 12,327 | | 7,557 | |
Other | | 128 | | 376 | | 279 | | 779 | |
Gross revenue | | 61,427 | | 17,559 | | 99,266 | | 53,350 | |
Provision for common stock warrants | | (26,057 | ) | — | | (27,877 | ) | — | |
Net revenue | | 35,370 | | 17,559 | | 71,389 | | 53,350 | |
Cost of revenue: | | | | | | | | | |
Sales of fuel cell systems and related infrastructure | | 35,671 | | 4,241 | | 44,398 | | 16,182 | |
Services performed on fuel cell systems and related infrastructure | | 5,766 | | 4,481 | | 17,400 | | 16,190 | |
Provision for loss contracts related to service | | — | | — | | — | | (1,071 | ) |
Power Purchase Agreements | | 7,395 | | 4,464 | | 21,460 | | 10,961 | |
Fuel delivered to customers | | 5,810 | | 3,679 | | 15,262 | | 9,298 | |
Other | | 138 | | 313 | | 301 | | 855 | |
Total cost of revenue | | 54,780 | | 17,178 | | 98,821 | | 52,415 | |
| | | | | | | | | |
Gross (loss) profit | | (19,410 | ) | 381 | | (27,432 | ) | 935 | |
| | | | | | | | | |
Operating expenses: | | | | | | | | | |
Research and development | | 7,436 | | 5,001 | | 20,059 | | 15,032 | |
Selling, general and administrative | | 9,535 | | 8,636 | | 36,584 | | 25,485 | |
Total operating expenses | | 16,971 | | 13,637 | | 56,643 | | 40,517 | |
| | | | | | | | | |
Operating loss | | (36,381 | ) | (13,256 | ) | (84,075 | ) | (39,582 | ) |
| | | | | | | | | |
Interest and other expense, net | | (2,724 | ) | (2,113 | ) | (7,112 | ) | (3,795 | ) |
Change in fair value of common stock warrant liability | | (1,878 | ) | 1,975 | | (16,454 | ) | 4,709 | |
| | | | | | | | | |
Loss before income taxes | | $ | (40,983 | ) | $ | (13,394 | ) | $ | (107,641 | ) | $ | (38,668 | ) |
| | | | | | | | | |
Income tax benefit | | — | | — | | — | | 392 | |
| | | | | | | | | |
Net loss attributable to the Company | | $ | (40,983 | ) | $ | (13,394 | ) | $ | (107,641 | ) | $ | (38,276 | ) |
| | | | | | | | | |
Preferred stock dividends declared and accretion of discount | | (25 | ) | (26 | ) | (3,086 | ) | (78 | ) |
Net loss attributable to common shareholders | | $ | (41,008 | ) | $ | (13,420 | ) | $ | (110,727 | ) | $ | (38,354 | ) |
Net loss per share: | | | | | | | | | |
Basic and diluted | | $ | (0.18 | ) | $ | (0.07 | ) | $ | (0.52 | ) | $ | (0.21 | ) |
Weighted average number of common shares outstanding | | 225,762,535 | | 180,375,680 | | 212,419,634 | | 180,261,449 | |
9
Plug Power Inc. and Subsidiaries
Consolidated Statements of Cash Flows
(In thousands)
(Unaudited)
| | Nine months ended | |
| | September 30, | |
| | 2017 | | 2016 | |
Cash Flows From Operating Activities: | | | | | |
Net loss attributable to the Company | | $ | (107,641 | ) | $ | (38,276 | ) |
Adjustments to reconcile net loss to net cash used in operating activities: | | | | | |
Depreciation of property, plant and equipment, and leased property | | 6,596 | | 2,912 | |
Amortization of intangible assets | | 443 | | 443 | |
Stock-based compensation | | 7,288 | | 6,745 | |
Amortization of debt issuance costs | | 496 | | 469 | |
Provision for common stock warrants | | 34,570 | | — | |
Loss on disposal of leased property | | — | | 41 | |
Provision for loss contracts related to service | | — | | (1,071 | ) |
Change in fair value of common stock warrant liability | | 16,454 | | (4,709 | ) |
Changes in operating assets and liabilities that provide (use) cash: | | | | | |
Accounts receivable | | (40,946 | ) | 10,644 | |
Inventory | | (14,747 | ) | (3,042 | ) |
Prepaid expenses and other assets | | (590 | ) | (3,549 | ) |
Accounts payable, accrued expenses, and other liabilities | | 6,524 | | 7,504 | |
Accrual for loss contracts related to service | | (752 | ) | (5,745 | ) |
Deferred revenue | | 11,011 | | (2,035 | ) |
Net cash used in operating activities | | (81,294 | ) | (29,669 | ) |
Cash Flows From Investing Activities: | | | | | |
Purchases of property, plant and equipment | | (1,820 | ) | (2,464 | ) |
Purchases for construction of leased property | | (26,471 | ) | (42,674 | ) |
Net cash used in investing activities | | (28,291 | ) | (45,138 | ) |
Cash Flows From Financing Activities: | | | | | |
Change in restricted cash | | 6,052 | | 1,908 | |
Proceeds from exercise of warrants, net of transaction costs | | 17,636 | | 111 | |
Proceeds from exercise of stock options | | 40 | | 19 | |
Payments for redemption of preferred stock | | (3,700 | ) | — | |
Proceeds from public offerings, net of transaction costs | | 20,664 | | — | |
Proceeds from short-term borrowing, net of transaction costs | | — | | 23,673 | |
Principal payments on short-term borrowing | | — | | (25,000 | ) |
Proceeds from borrowing of long-term debt, net of transaction costs | | 20,147 | | 23,407 | |
Principal payments on long-term debt | | (4,261 | ) | — | |
Increase in finance obligations | | 14,664 | | 29,242 | |
Net cash provided by financing activities | | 71,242 | | 53,360 | |
Effect of exchange rate changes on cash | | 286 | | (28 | ) |
Decrease in cash and cash equivalents | | (38,057 | ) | (21,475 | ) |
Cash and cash equivalents, beginning of period | | 46,014 | | 63,961 | |
Cash and cash equivalents, end of period | | $ | 7,957 | | $ | 42,486 | |
Other Supplemental Cash Flow Information: | | | | | |
Cash paid for interest | | $ | 2,357 | | $ | 1,563 | |
| | | | | |
Summary of noncash financing activity-conversions of preferred stock to common stock: | | $ | 8,222 | | — | |
10
Plug Power Inc.
Reconciliation of Non-GAAP Financial Measures
(Dollars in 000’s)
| | For the three months ended
September 30, | | For the nine months ended
September 30, | |
Reconciliation of Reported Operating Loss to EBITDAS and Adjusted EBITDAS | | 2017 | | 2016 | | 2017 | | 2016 | |
| | | | | | | | | |
Operating loss, as reported | | $ | (36,381 | ) | $ | (13,256 | ) | $ | (84,075 | ) | $ | (39,582 | ) |
Stock-based compensation | | 2,496 | | 2,368 | | 7,288 | | 6,745 | |
Depreciation and amortization | | 2,566 | | 1,532 | | 7,039 | | 3,355 | |
Provision for common stock warrants | | 26,057 | | — | | 34,570 | | — | |
EBITDAS | | $ | (5,262 | ) | $ | (9,356 | ) | $ | (35,178 | ) | $ | (29,482 | ) |
Walmart financing cash margin | | 3,135 | | — | | 3,135 | | — | |
Adjusted EBITDAS | | $ | (2,127 | ) | $ | (9,356 | ) | $ | (32,043 | ) | $ | (29,482 | ) |
| | For the three months ended
September 30, | | For the nine months ended
September 30, | |
Reconciliation of Reported Net Loss to Adjusted Net Loss | | 2017 | | 2016 | | 2017 | | 2016 | |
| | | | | | | | | |
Net loss attributable to common shareholders, as reported | | $ | (41,008 | ) | $ | (13,420 | ) | $ | (110,727 | ) | $ | (38,354 | ) |
Provision for common stock warrants, including legal and other related fees | | 26,057 | | — | | 34,995 | | — | |
Change in fair value of common stock warrant liability | | 1,878 | | (1,975 | ) | 16,454 | | (4,709 | ) |
Walmart financing cash margin | | 3,135 | | — | | 3,135 | | — | |
Adjusted net loss attributable to common shareholders | | $ | (9,938 | ) | $ | (15,395 | ) | $ | (56,143 | ) | $ | (43,063 | ) |
| | | | | | | | | |
Adjusted diluted net loss per share | | $ | (0.04 | ) | $ | (0.09 | ) | $ | (0.26 | ) | $ | (0.24 | ) |
| | | | | | | | | |
Diluted weighted average number of common shares outstanding | | 225,762,535 | | 180,375,680 | | 212,419,634 | | 180,261,449 | |
| | For the three months ended
September 30, | | For the nine months ended
September 30, | |
Reconciliation of Reported Gross (Loss) Profit to Adjusted Gross Profit | | 2017 | | 2016 | | 2017 | | 2016 | |
| | | | | | | | | |
Gross (loss) profit, as reported | | $ | (19,410 | ) | $ | 381 | | $ | (27,432 | ) | $ | 935 | |
Provision for common stock warrants | | 26,057 | | — | | 27,877 | | — | |
Adjusted gross profit | | $ | 6,647 | | $ | 381 | | $ | 445 | | $ | 935 | |
| | For the three months ended
September 30, | | For the nine months ended
September 30, | |
Free Cash Flow | | 2017 | | 2016 | | 2017 | | 2016 | |
| | | | | | | | | |
Net cash used in operating activities | | $ | (22,959 | ) | $ | (13,908 | ) | $ | (81,294 | ) | $ | (29,669 | ) |
Net cash used in investing activities | | (7,746 | ) | (16,296 | ) | (28,291 | ) | (45,138 | ) |
Project financing for PPA sites | | 22,667 | | 6,000 | | 26,167 | | 32,715 | |
Free cash flow | | $ | (8,038 | ) | $ | (24,204 | ) | $ | (83,418 | ) | $ | (42,092 | ) |
To supplement the Company’s unaudited financial data presented on a generally accepted accounting principles (GAAP) basis, management has used EBITDAS, adjusted EBITDAS, adjusted diluted net loss per share, adjusted net loss, adjusted gross profit and free cash flow, which are non-GAAP measures. These non-GAAP measures are among the indicators management uses as a basis for evaluating the Company’s financial performance as well as for forecasting future periods. Management establishes performance targets, annual budgets and makes operating decisions based in part upon these metrics. Accordingly, disclosure of these non-GAAP measures provides investors with the same information that management uses to understand the Company’s economic performance year over year. In addition, investors have historically requested and the Company has historically reported these non-GAAP financial measures as a means of providing consistent and comparable information with past reports of financial results. The presentation of this additional information is not meant to be considered in isolation or as a substitute for net income or other measures prepared in accordance with GAAP.
EBITDAS, adjusted EBITDAS, adjusted diluted net loss per share, adjusted net loss, adjusted gross profit and free cash flow are not measures of our liquidity or financial performance under GAAP and should not be considered as an alternative to net income or any other performance measure derived in accordance with GAAP, or as an alternative to cash flows from operating activities as a measure of our liquidity. EBITDAS is defined as net income before interest expense, provision for income taxes, depreciation and amortization expense and share related expense. Adjusted EBITDAS is defined as EBITDAS adjusted for cash margin realized on financing PPA deployments. Adjusted net loss attributable to common shareholders is defined as net loss attributable to common shareholders adjusted for warrant related charges and cash margin realized on financing PPA deployments. Adjusted gross profit is defined as gross profit adjusted for warrant related charges. Free cash flow is defined as the sum of net cash used in operating activities, net cash used in investing activities and cash proceeds from financing PPA deployments.
While management believes that the non-GAAP financial measures provide useful supplemental information to investors, there are limitations associated with the use of these measures. The measures are not prepared in accordance with GAAP and may not be directly comparable to similarly titled measures of other companies due to potential differences in the exact method of calculation. Further, EBITDAS and Adjusted EBITDAS exclude certain expenses, such as depreciation and amortization expense, which represent significant and unavoidable operating costs of our business. Management compensates for these limitations by relying primarily on our GAAP results and by using EBITDAS and Adjusted EBITDAS only supplementally and by reviewing the reconciliations of the non-GAAP financial measures to their most comparable GAAP financial measures.
Non-GAAP financial measures are not in accordance with, or an alternative for, generally accepted accounting principles in the United States. The Company’s non-GAAP financial measures are not meant to be considered in isolation or as a substitute for comparable GAAP financial measures, and should be read only in conjunction with the Company’s consolidated financial statements prepared in accordance with GAAP.
11