Exhibit 99.1

Plug Power Reports Record Gross Billings
in the Second Quarter
Completed Strategic Acquisitions in Line with its
Green Hydrogen Vertical Integration Strategy
Issued First Ever Convertible Green Bond in the US
| ● | Delivered record gross billings of $72.4M in Q2 2020 supporting our customers during the COVID-19 pandemic |
| ● | Completed acquisitions of United Hydrogen and Giner ELX, accelerating our green hydrogen strategy |
| ● | Reaffirming 2020 full year guidance and providing Q3 2020 guidance of $110M to $115M for gross billings |
| ● | Reaffirming recently increased 2024 financial targets to achieve $1.2B in revenue (up from $1B), $200M in operating income (up from $170M) and $250M in adjusted EBITDA (up from $200M) |
| ● | Engaged with multiple locations to build a center-of-excellence fuel cell and electrolyzer stack Gigafactory |
| ● | Issued first ever convertible green bond in the US |
| ● | Ongoing expansion in Europe to build a substantial presence in our core market of material handling and expand into on-road and other applications, and green hydrogen generation business with strategic partners |
| ● | Hosting second annual Plug Symposium on September 24, 2020 |
Delivered Record Gross Billings in Q2 2020 amid the COVID-19 Pandemic
The Company achieved the highest second quarter gross billings in its history during Q2 2020. This reflects year-over-year growth of 24% and 68% growth sequentially above a record Q1 2020. The Q2 2020 quarter included multiple one-time items reflecting the closing of two strategic acquisitions and the recently completed financing transactions.
| Plug Power deployed a record 2,800 GenDrive fuel cell systems and three hydrogen fueling stations/network in the Q2 2020 quarter, bringing the total historical deployments to ~35,000 GenDrive systems and 100 hydrogen fueling stations/network. With continued growth in its MEA production from its Rochester, NY operation, Plug Power is the largest producer of MEAs in the Americas and is one of the top five producers in the world. | |  |
Despite the COVID-19 global crisis, Plug Power has deployed over 5,000 fuel cell units year-to-date with customers, with over 545.1 million hours of runtime in the field and 29.4 million hydrogen fills performed. These staggering numbers underscore the importance of the impact our products are making on the global supply chain and sustainability during this pandemic. For example, as of year-end 2019, Plug Power’s products were moving 25% of the retail food and groceries through the United States as we support the needs of customers like Walmart, Amazon, Kroger, SuperValu, Wegmans, and Aryzta. In the first quarter of 2020, Plug Power reported that number had risen to approximately 30% as demand peaked with key customers and this trend continued during Q2 2020.
 | | Aryzta, a supplier in the international food business, recently quantified the benefits and value proposition of our GenDrive hydrogen fuel cells. Aryzta highlighted that our hydrogen fuel cell systems have streamlined its logistics, increasing average picks-per-hour by 100% in 2018, trending to a 133% increase in 2020. Aryzta has set ambitious goals for future productivity projections to reach a 188% increase in picks-per-hour over the baseline. This customer example presents an ideal use-case for capitalizing on productivity improvements in high-asset utilization applications as a result of Plug Power’s GenDrive hydrogen fuel cell system. |
Plug Power continues to leverage strong relationships with our supply chain. We worked diligently to manage and grow the capability of our supply chain to meet increased volumes while reducing cost. In addition, during the Q2 2020 quarter, Plug Power’s service team ensured that customer equipment availability was maintained at the highest levels given the essential nature of our product and service offerings.
Completed Acquisitions - Continuing to Execute on its Previously Laid Out Green Hydrogen Vertical Integration Strategy
| Plug Power is at the center of the paradigm shift in the energy, transportation and power industries. The continued adoption of our fuel cell products has resulted in Plug Power being the largest user of liquid hydrogen in the world. With the acquisitions of United Hydrogen and Giner ELX, Plug Power is now positioned to be a global leader in generation, liquefaction and distribution of green hydrogen fuel, further complementing its industry-leading accomplishments in the design, construction, and operation of customer-facing hydrogen fueling networks. Plug Power remains focused on the transition from low-carbon to zero-carbon hydrogen to serve our customers in our traditional markets of on-road vehicles and industrial applications, in line with our sustainability goals and focus on reducing greenhouse gas emissions. As we have previously discussed, we believe that domestically produced green hydrogen strengthens energy and national security. | | 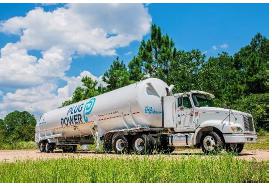 |
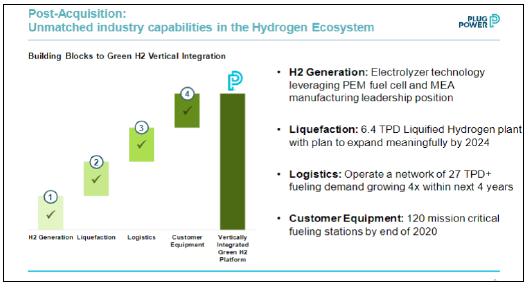
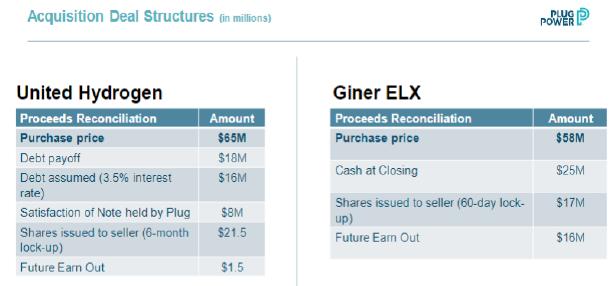
In June 2020, Plug Power closed the acquisitions of United Hydrogen and Giner ELX, solidly positioning Plug Power to transition from low-carbon to zero-carbon hydrogen solutions. These vertical integrations are in line with Plug Power’s hydrogen business strategy laid out in September of 2019 to have more than 50% of the hydrogen used to be green by 2024. Through these acquisitions, we now bring unmatched industry capabilities to participate in, as well as facilitate the anticipated rapid growth of the massive hydrogen economy. According to McKinsey, this industry is expected to be $2.5T by 2050.
Plug Power’s Giner ELX electrolyzer business is key to generating green hydrogen from renewable sources of power including solar, wind and hydro. Plug Power’s hydrogen business brings industry-leading capabilities in liquefaction and logistics. By combining these comprehensive in-house capabilities Plug Power is executing on its previously announced strategy of building a network of green liquid hydrogen generation facilities throughout the US and Europe, while continuing to work with multiple strategic partners. Over the next several years, Plug Power expects to be one of the largest green hydrogen generation companies in the US, and globally thereafter.
With low cost renewables, green hydrogen production is more economical today when compared to steam-methane reforming (SMR)-based grey hydrogen in multiple US and European locations, even before taking into consideration policy initiatives such as LCFS (low carbon fuel standard credit), carbon pricing and many other policies being contemplated on a global basis. We expect the cost of green hydrogen to continue to decline, driven by the falling levelized cost of renewable electricity and reductions we will achieve in the system CapEx costs.
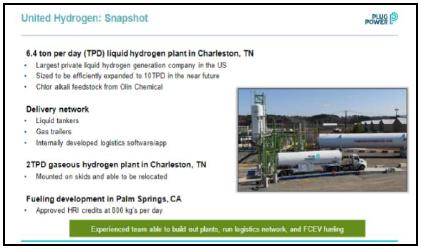 | | 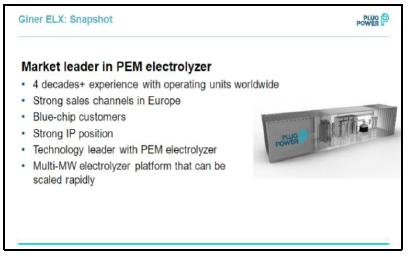 |
Since the deals closed in June, Plug Power has integrated the United Hydrogen group and developed a division of the company focused on building liquid green hydrogen plants throughout North America. We are currently executing on plans to expand the United Hydrogen generation site to 10T per day capacity. Additionally, the team from Giner ELX is at work, focusing on manufacturing scale-up of the electrolyzer business by leveraging our manufacturing and supply chain capability.
Given Plug Power’s experience as the largest manufacturer of hydrogen fuel cell systems, and a well-developed global supply chain, we can leverage these capabilities to drive costs down for both the electrolyzer and liquefaction business.
In concert with these acquisitions, the Company is in the final planning process for a strategic expansion of manufacturing capability to support our continued growth. The Company is in discussions with multiple locations for the siting of a state-of-the-art facility for fuel cell and electrolyzer production at Gigawatt scale capacity. The location is planned to be finalized during 3Q 2020 with operations beginning in 2021.
With these acquisitions and ongoing efforts, we are reaffirming our recently increased 2024 guidance to $1.2B in revenue, a 20% increase from September 2019, and adjusted EBITDA of $250M, a 25% increase. This only further underscores growth and margin leverage from the two acquisitions.
Plug Power Issues First-Ever Green Convertible Bond in the US
During the second quarter, Plug Power launched the first ever convertible green bond offering in the US. The Company raised $212M with a 3.75% coupon and a 5-year maturity. The Company also purchased ~66% of the 5.5% convertible bonds issued in 2018. As the Company highlighted during this offering, the Company intends to use a majority of the proceeds towards funding the Company’s growth in the green hydrogen business. Proceeds from this transaction were used, in part, to finance the cash portion of the acquisitions of United Hydrogen and Giner ELX.
Green Hydrogen taking a center stage in global policy and recovery discussions
Plug Power’s strategic objectives align with industry projections set by McKinsey that hydrogen could provide:
| ● | 18% of final energy demand: Avoids the consumption of more than 20 million barrels of oil per day compared to today’s energy composition. It would radically decrease the need and energy required to transport fossil fuels across the world and increase self-reliance and energy security. |
| ● | 6Gt annual CO2 abatement: In end-use applications, green hydrogen eliminates local emissions such as sulfur oxides, nitrogen oxides, and particulates, which are linked to smog formation and cause an estimated 3 million premature deaths annually. |
| ● | 30M jobs created: The application of hydrogen at this scale creates a revenue potential of more than $2.5 trillion per year. |
Plug Power’s multi-year investment in the European market has resulted in strategic and commercial partnerships, that when coupled with climate change and decarbonization goals, are accelerating demand and adoption of hydrogen technology. These trends are present in all of our markets: material handling, on-road commercial fleet vehicles, port applications and green hydrogen. Plug Power is strengthening its presence in Europe – investing in building substantial growth in the electrolyzer business and liquid hydrogen economy and deepening its relationships with key European stakeholders, including Clean Hydrogen Alliance, FCH JU and Minister of Energy, to capture the European hydrogen funding scheme.
In August of 2020, the European Commission issued a report outlining “a hydrogen strategy for a climate-neutral Europe” in support of the European Green Deal and recovery, growth and jobs. The report outlines various ways hydrogen can be produced - the most notable being, “Renewable hydrogen' is hydrogen produced through the electrolysis of water (in an electrolyzer, powered by electricity), and with the electricity stemming from renewable sources. The full life-cycle greenhouse gas emissions of the production of renewable hydrogen are close to zero.”
The report further expounds in line with Plug Power projections that the costs for renewable hydrogen will continue to decline. Even more so, “electrolyzer costs have already been reduced by 60% in the last ten years and are expected to halve in 2030 compared to today with economies of scale.”
European hotspots, including Germany, the Netherlands, France and Portugal, will provide meaningful growth opportunity for Plug Power. Here, hydrogen is considered the best (or only) choice for at-scale decarbonization of selected segments in transport, industry, and buildings. Additionally, hydrogen will play a systemic role in the transition to renewable energy sources by providing a mechanism to flexibly transfer energy across geographies, time and sectors.
In the United States, funding for the Hydrogen and Fuel Cell Technologies Office at the Department of Energy was increased by 25% for fiscal year 2020 over the previous year. As a result of this increase, more resources will be put towards the H2@Scale initiative which prioritizes research, development, and demonstration (RD&D) of affordable hydrogen production, storage, distribution and use. Additionally, the U.S. House of Representatives recently passed infrastructure legislation that includes beneficial policy and tax incentives for hydrogen infrastructure, fuel cells and zero-emission vehicles.
In Asia, many countries are looking at green hydrogen as a logical solution to meet sustainability goals and to expand growth in their overall renewable business. For example, South Korea is looking to add more than 10 GW of solar and wind generation capacity collectively to produce green hydrogen for multiple applications.
Ongoing Expansion into Adjacent Markets
Plug Power’s suite of ProGen fuel cell engines are modular building blocks designed for use in multiple end-user applications. ProGen engines provide robust and cost-effective solutions with industry-leading performance, reliability and time-to-market for OEMs looking to adopt sustainable hydrogen fuel cell solutions. ProGen engines are equipped with Plug Power’s metal plate stack and industry leading MEAs.
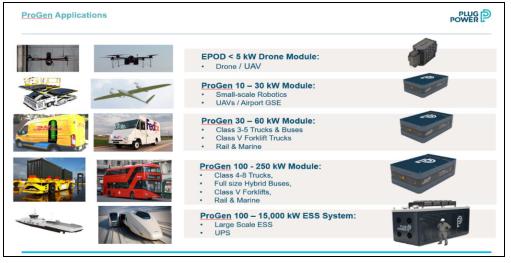
Plug Power has successfully launched its 125kW ProGen hydrogen engine and 30kW ProGen hydrogen engine to aggressively pursue markets where fuel cells can bring a significant business and environmental benefit to the end user. The 125kW ProGen engine suits heavy-duty applications, including class 6, 7 and 8 trucks, as well as transit buses, various port applications and large-scale data centers. The 30kW ProGen hydrogen engine is suited for delivery vans or light and medium-duty cargo trucks.
Trucking and hauling brands have recognized Plug Power’s ProGen stack technology as a leading solution for commercial fleet applications in transportation. Plug Power is in discussions with various OEMs on a global basis with a key focus of providing comprehensive and turnkey solutions to its existing and new customers with large captive on-road vehicles.
With increasing focus on sustainability and low-carbon energy from data center companies, our large-scale stationary fuel cell power is becoming an optimal solution to diesel power. McKinsey reports that the US currently requires nearly 40 GW of backup power capacity to support nearly 1,800 data hubs. By 2024, the solution for PEM fuel cells providing backup power in data centers will achieve cost parity with diesel engines. Today’s data centers operate on 15mW of generators - and emit a tremendous amount of noise and air pollution.
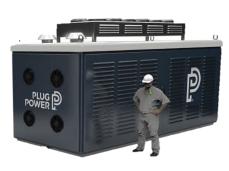 | | In response to industry data and customer demand, Plug Power recently launched the GenSure HP platform. Plug Power’s GenSure HP is a better solution to improve air quality and operational flexibility. GenSure HP hydrogen fuel cell systems are made up of Plug Power’s 125kW ProGen fuel cell engines, making them appropriate for a wide variety of high-power applications ranging from as low as 100kW to those requiring multiple megawatts. The GenSure HP platform provides, clean, cost-effective performance to meet customers’ 24x7 stationary power needs with significantly lower maintenance requirements and much higher reliability than traditional combustion generators—enabling growth and capacity expansion in all regulatory environments. |
Employee Safety and Workforce Growth
We continue to extend our thanks to our employees for their hard work and dedication as we navigate this global pandemic. As essential business employees, the Plug Power team has ensured that our grocery supply chain customers are able to move critical food and supplies with no disruption to their business. As previously mentioned, Plug Power products routinely move over 25% of the retail food and groceries through the United States.
| Employment growth at Plug Power continued – even during times of the COVID-19 pandemic. We are proud to be a leading job-creator around the world during the pandemic. Plug Power extends into eight countries and over 40 states in the US. Plug Power is also honored by our Veteran workforce – 13.4% of Plug Power employees are Veterans who find the green-collar jobs at Plug Power compliment the training and discipline learned in the military. | |  |
Our employees all share similar traits – we’re innovative, reliable, trustworthy, passionate, and driven. Everyone has an important role to play in the success of our business.
We remain on track to deliver on 2024 Targets
We are excited to announce that the second annual Plug Symposium will be held virtually on September 24, 2020. The 2020 Plug Symposium will explore the developing micro- and macro-level trends influencing the widespread adoption of hydrogen and fuel cell power to meet the world’s clean energy demands. Plug Power leaders will showcase success made against its 2024 plan to achieve $1.2B in revenue, as well as feature intimate details of Plug Power’s green hydrogen roadmap and continued market expansion in on-road and backup power applications, and European expansion. Learn more and register for the event at https://bit.ly/2DrRsPQ.
We remain focused on building the green hydrogen economy in an electrified world. This quarter’s acquisitions are in line with Plug Power’s stated plans to have more than 50% of the hydrogen used be green by 2024. We are reaffirming 2020 guidance and providing Q3 2020 guidance of $110M to $115M for gross billings. We are also reaffirming the recently raised 2024 financial targets to achieve $1.2B in revenue (up from $1B), $200 in operating income (up from $170M) and $250M in adjusted EBITDA (up from $200M).
Again, we’d like to thank our employees for their hard work, especially during these trying times. We look forward to providing you with general business updates at our upcoming Plug Symposium.
Please stay safe and healthy,
 | |  |
| Andrew Marsh, President and CEO | | Paul Middleton, Chief Financial Officer |
Conference Call Information
The Company will host a live conference call and webcast today, August 6, 2020.
● Time: 10:00 am ET
● Toll-free: 877-405-1239
The webcast can be accessed at www.plugpower.com, selecting the conference call link on the home page, or directly at https://event.webcasts.com/starthere.jsp?ei=1351078&tp_key=c7fe17e5fa.
Cautionary Note on Forward-Looking Statements
This communication contains "forward-looking statements" within the meaning of the Private Securities Litigation Reform Act of 1995 that involve significant risks and uncertainties about Plug Power Inc. ("Plug"), including but not limited to statements about Plug's expectations regarding our 2020 full-year guidance, third quarter 2020 guidance and 2024 financial targets; expectations regarding the effects of the acquisitions; expectations regarding the building of a fuel cell Gigafactory; expectations regarding our ongoing expansion in Europe and expansion into on-road and other applications, including the green hydrogen generation business; the anticipated growth of the hydrogen economy; our position and capabilities in hydrogen generation, liquefaction and distribution of green hydrogen fuel, including our ability to facilitate the growth of the hydrogen economy; the amount of hydrogen that is green by 2024; our transition from a low-carbon to zero-carbon hydrogen; our ability to become one of the largest green hydrogen generation companies; the decline in the cost of green hydrogen; our capabilities to drive costs down for the electrolyzer and liquefaction business; our plan for a state-of-the-art facility for fuel cell and electrolyzer production at Gigawatt scale capacity and the timing of its operations; growth opportunities; expectations that hydrogen will play a systemic role in the transition to renewable energy sources; expansion of United Hydrogen’s hydrogen production capacity; and Giner ELX increasing our overall green hydrogen supply capabilities and growing our servable addressable market. You are cautioned that such statements should not be read as a guarantee of future performance or results, and will not necessarily be accurate indications of the times that, or by which, such performance or results will have been achieved. Such statements are subject to risks and uncertainties that could cause actual performance or results to differ materially from those expressed in these statements. You are cautioned that such statements should not be read as a guarantee of future performance or results and will not necessarily be accurate indications of the times that, or by which, such performance or results will have been achieved. Such statements are subject to risks and uncertainties that could cause actual performance or results to differ materially from those expressed in these statements. In particular, the risks and uncertainties include, among other things, the risk that we continue to incur losses and might never achieve or maintain profitability; the risk that we will need to raise additional capital to fund our operations and such capital may not be available to us; the risk that our lack of extensive experience in manufacturing and marketing products may impact our ability to manufacture and market products on a profitable and large-scale commercial basis; the risk that unit orders will not ship, be installed and/or converted to revenue, in whole or in part; the risk that pending orders may not convert to purchase orders, in whole or in part; the risk that a loss of one or more of our major customers could result in a material adverse effect on our financial condition; the risk that a sale of a significant number of shares of stock could depress the market price of our common stock; the risk that negative publicity related to our business or stock could result in a negative impact on our stock value and profitability; the risk of potential losses related to any product liability claims or contract disputes; the risk of loss related to an inability to maintain an effective system of internal controls or key personnel; the risks related to use of flammable fuels in our products; the cost and timing of developing, marketing and selling our products and our ability to raise the necessary capital to fund such costs; the ability to achieve the forecasted gross margin on the sale of our products; the risk that our actual net cash used for operating expenses may exceed the projected net cash for operating expenses; the cost and availability of fuel and fueling infrastructures for our products; market acceptance of our products, including GenDrive, GenSure and GenKey systems; the volatility of our stock price; our ability to establish and maintain relationships with third parties with respect to product development, manufacturing, distribution and servicing and the supply of key product components; the cost and availability of components and parts for our products; our ability to develop commercially viable products; our ability to reduce product and manufacturing costs; our ability to successfully expand our product lines; our ability to successfully expand internationally; our ability to improve system reliability for our GenDrive, GenSure and GenKey systems; competitive factors, such as price competition and competition from other traditional and alternative energy companies; our ability to protect our intellectual property; the cost of complying with current and future federal, state and international governmental regulations; risks associated with potential future acquisitions; and other risks and uncertainties referenced in our public filings with the Securities and Exchange Commission (the “SEC”). For additional disclosure regarding these and other risks faced by Plug, see the disclosures contained in Plug's public filings with the SEC including the "Risk Factors" section of Plug's Annual Report on Form 10-K for the year ended December 31, 2019 and Quarterly Report on Form 10-Q for the quarter ended March 31, 2020. You should consider these factors in evaluating the forward-looking statements included in this communication and not place undue reliance on such statements. The forward-looking statements are made as of the date hereof, and Plug undertakes no obligation to update such statements as a result of new information.
Plug Power Contact
Teal Vivacqua Hoyos
plugpowerPR@bulleitgroup.com
Plug Power Inc. and Subsidiaries
Consolidated Balance Sheets
(In thousands, except share and per share amounts)
(Unaudited)
| | | June 30, | | | December 31, | |
| | | 2020 | | | 2019 | |
| Assets | | | | | | | | |
| Current assets: | | | | | | | | |
| Cash and cash equivalents | | $ | 152,492 | | | $ | 139,496 | |
| Restricted cash | | | 50,634 | | | | 54,813 | |
| Accounts receivable | | | 45,522 | | | | 25,448 | |
| Inventory | | | 114,571 | | | | 72,391 | |
| Prepaid expenses and other current assets | | | 31,436 | | | | 21,192 | |
| Total current assets | | | 394,655 | | | | 313,340 | |
| | | | | | | | | |
| Restricted cash | | | 180,127 | | | | 175,191 | |
| Property, plant, and equipment, net of accumulated depreciation of $19,203 and $17,417, respectively | | | 60,018 | | | | 14,959 | |
| Leased property, net | | | 274,721 | | | | 244,740 | |
| Goodwill | | | 70,402 | | | | 8,842 | |
| Intangible assets, net | | | 38,574 | | | | 5,539 | |
| Other assets | | | 11,817 | | | | 8,573 | |
| Total assets | | $ | 1,030,314 | | | $ | 771,184 | |
| | | | | | | | | |
| Liabilities, Redeemable Preferred Stock, and Stockholders’ Equity | | | | | | | | |
| Current liabilities: | | | | | | | | |
| Accounts payable | | $ | 39,812 | | | $ | 40,376 | |
| Accrued expenses | | | 23,320 | | | | 14,213 | |
| Deferred revenue | | | 14,902 | | | | 11,691 | |
| Finance obligations | | | 57,695 | | | | 49,507 | |
| Current portion of long-term debt | | | 50,933 | | | | 26,461 | |
| Other current liabilities | | | 21,692 | | | | 8,543 | |
| Total current liabilities | | | 208,354 | | | | 150,791 | |
| Deferred revenue | | | 25,038 | | | | 23,369 | |
| Finance obligations | | | 300,653 | | | | 265,228 | |
| Convertible senior notes, net | | | 142,704 | | | | 110,246 | |
| Long-term debt | | | 101,844 | | | | 85,708 | |
| Other liabilities | | | 11,756 | | | | 13 | |
| Total liabilities | | | 790,349 | | | | 635,355 | |
| | | | | | | | | |
| Redeemable preferred stock: | | | | | | | | |
| Series C redeemable convertible preferred stock, $0.01 par value per share (aggregate involuntary liquidation preference $16,664); 10,431 shares authorized; Issued and outstanding: zero at June 30, 2020 and 2,620 at December 31, 2019 | | | — | | | | 709 | |
| Series E redeemable preferred stock, $0.01 par value per share; Shares authorized: 35,000 at both June 30, 2020 and December 31, 2019; Issued and outstanding: zero at June 30, 2020 and 500 at December 31, 2019 | | | — | | | | 441 | |
| Stockholders’ equity: | | | | | | | | |
| Common stock, $0.01 par value per share; 750,000,000 shares authorized; Issued (including shares in treasury): 348,201,792 at June 30, 2020 and 318,637,560 at December 31, 2019 | | | 3,482 | | | | 3,186 | |
| Additional paid-in capital | | | 1,658,532 | | | | 1,507,116 | |
| Accumulated other comprehensive income | | | 1,271 | | | | 1,400 | |
| Accumulated deficit | | | (1,391,961 | ) | | | (1,345,807 | ) |
| Less common stock in treasury: 15,292,591 at June 30, 2020 and 15,259,045 at December 31, 2019 | | | (31,359 | ) | | | (31,216 | ) |
| Total stockholders’ equity | | | 239,965 | | | | 134,679 | |
| Total liabilities, redeemable preferred stock, and stockholders’ equity | | $ | 1,030,314 | | | $ | 771,184 | |
Plug Power Inc. and Subsidiaries
Consolidated Statement of Operations
(In thousands, except share and per share amounts)
(Unaudited)
| | | Three Months Ended | | | Six Months Ended | |
| | | June 30, | | | June 30, | |
| | | 2020 | | | 2019 | | | 2020 | | | 2019 | |
| Net revenue: | | | | | | | | | | | | | | | | |
| Sales of fuel cell systems and related infrastructure | | $ | 47,746 | | | $ | 38,696 | | | $ | 68,133 | | | $ | 41,240 | |
| Services performed on fuel cell systems and related infrastructure | | | 6,236 | | | | 5,341 | | | | 12,757 | | | | 11,684 | |
| Power Purchase Agreements | | | 6,654 | | | | 6,409 | | | | 13,150 | | | | 12,519 | |
| Fuel delivered to customers | | | 7,372 | | | | 7,089 | | | | 14,705 | | | | 13,671 | |
| Other | | | 62 | | | | — | | | | 138 | | | | — | |
| Net revenue | | | 68,070 | | | | 57,535 | | | | 108,883 | | | | 79,114 | |
| Cost of revenue: | | | | | | | | | | | | | | | | |
| Sales of fuel cell systems and related infrastructure | | | 33,676 | | | | 23,129 | | | | 47,420 | | | | 25,450 | |
| Services performed on fuel cell systems and related infrastructure | | | 6,491 | | | | 6,218 | | | | 14,672 | | | | 12,341 | |
| Power Purchase Agreements | | | 13,704 | | | | 8,713 | | | | 27,947 | | | | 17,711 | |
| Fuel delivered to customers | | | 9,060 | | | | 8,854 | | | | 18,095 | | | | 16,775 | |
| Other | | | 63 | | | | — | | | | 144 | | | | — | |
| Total cost of revenue | | | 62,994 | | | | 46,914 | | | | 108,278 | | | | 72,277 | |
| | | | | | | | | | | | | | | | | |
| Gross profit | | | 5,076 | | | | 10,621 | | | | 605 | | | | 6,837 | |
| | | | | | | | | | | | | | | | | |
| Operating expenses: | | | | | | | | | | | | | | | | |
| Research and development | | | 9,757 | | | | 8,933 | | | | 20,169 | | | | 16,306 | |
| Selling, general and administrative | | | 21,658 | | | | 13,627 | | | | 32,671 | | | | 22,951 | |
| Total operating expenses | | | 31,415 | | | | 22,560 | | | | 52,840 | | | | 39,257 | |
| | | | | | | | | | | | | | | | | |
| Operating loss | | | (26,339 | ) | | | (11,939 | ) | | | (52,235 | ) | | | (32,420 | ) |
| | | | | | | | | | | | | | | | | |
| Interest and other expense, net | | | (13,198 | ) | | | (7,861 | ) | | | (24,781 | ) | | | (16,206 | ) |
| Change in fair value of common stock warrant liability | | | — | | | | 1,706 | | | | — | | | | (420 | ) |
| Gain on extinguishment of debt | | | 13,222 | | | | — | | | | 13,222 | | | | — | |
| | | | | | | | | | | | | | | | | |
| Loss before income taxes | | $ | (26,315 | ) | | $ | (18,094 | ) | | $ | (63,794 | ) | | $ | (49,046 | ) |
| | | | | | | | | | | | | | | | | |
| Income tax benefit | | | 17,659 | | | | — | | | | 17,659 | | | | — | |
| | | | | | | | | | | | | | | | | |
| Net loss attributable to the Company | | $ | (8,656 | ) | | $ | (18,094 | ) | | $ | (46,135 | ) | | $ | (49,046 | ) |
| | | | | | | | | | | | | | | | | |
| Preferred stock dividends declared and accretion of discount | | | (13 | ) | | | (26 | ) | | | (19 | ) | | | (26 | ) |
| | | | | | | | | | | | | | | | | |
| Net loss attributable to common stockholders | | $ | (8,669 | ) | | $ | (18,120 | ) | | $ | (46,154 | ) | | $ | (49,072 | ) |
| | | | | | | | | | | | | | | | | |
| Net loss per share: | | | | | | | | | | | | | | | | |
| Basic and diluted | | $ | (0.03 | ) | | $ | (0.08 | ) | | $ | (0.15 | ) | | $ | (0.22 | ) |
| | | | | | | | | | | | | | | | | |
| Weighted average number of common stock outstanding | | | 316,645,050 | | | | 231,114,868 | | | | 310,918,626 | | | | 225,899,224 | |
Plug Power Inc. and Subsidiaries
Consolidated Statement of Cash Flows
(In thousands)
(Unaudited)
| | | Six months ended | |
| | | June 30, | |
| | | 2020 | | | 2019 | |
| Operating Activities | | | | | | | | |
| Net loss attributable to the Company | | $ | (46,135 | ) | | $ | (49,046 | ) |
| Adjustments to reconcile net loss to net cash used in operating activities: | | | | | | | | |
| Depreciation of property, plant and equipment, and leased property | | | 5,783 | | | | 5,496 | |
| Amortization of intangible assets | | | 398 | | | | 338 | |
| Stock-based compensation | | | 6,188 | | | | 5,123 | |
| Gain on extinguishment of debt | | | (13,222 | ) | | | — | |
| Provision for bad debts and other assets | | | — | | | | 907 | |
| Amortization of debt issuance costs and discount on convertible senior notes | | | 6,528 | | | | 4,340 | |
| Provision for common stock warrants | | | 7,983 | | | | 2,209 | |
| Loss on disposal of leased assets | | | — | | | | 212 | |
| Change in fair value of common stock warrant liability | | | — | | | | 420 | |
| Income tax benefit | | | (17,659 | ) | | | — | |
| Accounts receivable | | | (18,393 | ) | | | 9,848 | |
| Inventory | | | (37,983 | ) | | | (25,280 | ) |
| Prepaid expenses, and other assets | | | (11,817 | ) | | | (460 | ) |
| Accounts payable, accrued expenses, and other liabilities | | | 4,699 | | | | 1,232 | |
| Deferred revenue | | | 2,383 | | | | (3,827 | ) |
| Net cash used in operating activities | | | (111,247 | ) | | | (48,488 | ) |
| Investing Activities | | | | | | | | |
| Purchases of property, plant and equipment | | | (5,009 | ) | | | (2,844 | ) |
| Purchase of intangible assets | | | — | | | | (1,860 | ) |
| Purchases for construction of leased property | | | (6,256 | ) | | | (1,987 | ) |
| Net cash paid for acquisitions | | | (45,286 | ) | | | — | |
| Proceeds from sale of leased assets | | | — | | | | 375 | |
| Net cash used in investing activities | | | (56,551 | ) | | | (6,316 | ) |
| Financing Activities | | | | | | | | |
| Proceeds from issuance of preferred stock, net of transaction costs | | | — | | | | (8 | ) |
| Proceeds from public offerings, net of transaction costs | | | (269 | ) | | | 28,265 | |
| Proceeds from exercise of stock options | | | 15,798 | | | | 205 | |
| Proceeds from issuance of convertible senior notes, net | | | 205,100 | | | | — | |
| Repurchase of convertible senior notes | | | (90,238 | ) | | | — | |
| Purchase of capped calls | | | (16,253 | ) | | | — | |
| Proceeds from termination of capped calls | | | 24,158 | | | | — | |
| Principal payments on long-term debt | | | (21,626 | ) | | | (17,521 | ) |
| Proceeds from long-term debt, net | | | 49,000 | | | | 99,546 | |
| Repayments of finance obligations | | | (11,783 | ) | | | (56,070 | ) |
| Increase in finance obligations | | | 27,678 | | | | 25,609 | |
| Net cash provided by financing activities | | | 181,565 | | | | 80,026 | |
| Effect of exchange rate changes on cash | | | (14 | ) | | | (48 | ) |
| Decrease in cash, cash equivalents and restricted cash | | | 13,753 | | | | 25,174 | |
| Cash, cash equivalents, and restricted cash beginning of period | | | 369,500 | | | | 110,153 | |
| Cash, cash equivalents, and restricted cash end of period | | $ | 383,253 | | | | 135,327 | |
| | | | | | | | | |
| Supplemental disclosure of cash flow information | | | | | | | | |
| Cash paid for interest | | $ | 9,466 | | | | 8,673 | |
Plug Power Inc.
Reconciliation of Non-GAAP Financial Measures
(Dollars in 000's)
| | | For the three months ended June 30, | | | For the six months ended June 30, | |
| Reconciliation of Reported Operating Loss to Adjusted EBITDA | | 2020 | | | 2019 | | | 2020 | | | 2019 | |
| Operating loss, as reported | | $ | (26,339 | ) | | $ | (11,939 | ) | | $ | (52,235 | ) | | $ | (32,420 | ) |
| Stock-based compensation(1) | | | 3,143 | | | | 2,626 | | | | 6,188 | | | | 5,123 | |
| Depreciation and amortization(2) | | | 3,156 | | | | 2,883 | | | | 6,181 | | | | 5,834 | |
| Right-of-use asset depreciation and interest associated with PPA financings(3) | | | 12,925 | | | | 6,190 | | | | 25,531 | | | | 12,149 | |
| Costs associated with acquisitions, restructuring and other charges(4) | | | 8,331 | | | | 812 | | | | 9,429 | | | | 1,119 | |
| Adjusted EBITDA | | $ | 1,216 | | | $ | 572 | | | $ | (4,906 | ) | | $ | (8,195 | ) |
| | | For the year ended | |
| Reconciliation of Forecasted Operating Income to Adjusted EBITDA | | December 31, 2024 | |
| Operating (loss) income, as forecasted | | $ | 200,000 | |
| Stock-based compensation(1) | | | 15,000 | |
| Depreciation and amortization(2) | | | 35,000 | |
| Adjusted EBITDA | | $ | 250,000 | |
Non-GAAP Measure
To supplement the Company’s unaudited financial data presented on a generally accepted accounting principles (GAAP) basis, management has used Adjusted EBITDA which is a non-GAAP measure. Adjusted EBITDA is defined as operating income (loss), plus stock-based compensation, plus depreciation and amortization, plus right-of-use asset depreciation and interest associated with PPA financings, plus costs associated with acquisitions, restructuring and other non-recurring charges. This non-GAAP measure is an indicator management uses as a basis for evaluating the Company’s performance as well as for forecasting future periods. Management also establishes performance targets, annual budgets and makes operating decisions based in part upon adjusted EBITDA. Disclosure of this non-GAAP measure provides investors with the same information that management uses for these purposes. In addition, investors have historically requested and the Company has historically reported this non-GAAP financial measure as a means of providing consistent and comparable information with past reports of financial results. Adjusted EBITDA, is not a measure of our performance under GAAP and should not be considered in isolation or as an alternative to reported operating loss or any other measure prepared in accordance with GAAP. While management believes that Adjusted EBITDA provides useful supplemental information to investors, there are limitations associated with the use of this measure. Adjusted EBITDA is not prepared in accordance with GAAP and may not be directly comparable to a similarly titled measure of other companies due to a potential difference in the exact method of calculation. Adjusted EBITDA should be read only in conjunction with the Company’s consolidated financial statements prepared in accordance with GAAP.
Notes
(1) Represents employee compensation in the form of the Company's stock or stock-based awards.
(2) Represents depreciation and amortization expense related to the Company's fixed assets and intangibles.
(3) Represents right-of-use asset depreciation and interest associated with operating leases. The right-of-use asset depreciation and interest expense associated with operating leases is calculated in accordance with ASC Topic 842, and is equal to operating lease expense during any given reporting period.
(4) In the second quarter of 2020, predominantly represents legal fees and costs associated with acquisitions, restructuring and impact of COVID-19.