Exhibit 99.1

Plug Reports $151.3 Million in Revenue in Q2 2022,
Reaffirms $900-$925MM Full-Year Revenue Guidance,
with Several Landmark Announcements
Strong Business Outlook Provides a Clear Path to 2025 Targets,
Further Enhanced by Strong Policy Backdrop
| ● | Electrolyzer backlog already well ahead of targets at approximately 1.5GW. Backlog includes 1GW order from H2 Energy, largest to date. Growth outlook remains robust with over $15 billion sales funnel. |
| ● | Successful validation of 3MW stationary power demo unit with Microsoft represents a landmark event, opening a potential $40+ billion market opportunity. First high-power units expecting delivery in 2022 with planned shipments of 20-30MW over the next 12 months and estimated 200-250MW shipments in 2024. |
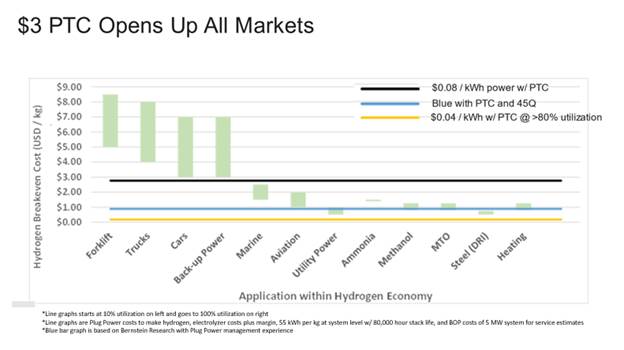
| ● | Clean energy legislation supports and reinforces Plug’s strategy of building a global green hydrogen ecosystem, resulting in meaningful competitive advantage, given Plug’s first mover position. The Clean Hydrogen Production Tax Credit (PTC) of $3/kg for green hydrogen should result in improved plant payback by 4-5 years and incremental cash flow of $500 million per year at 500 tons per day (TPD) with targeted production by YE 2025. |
| ● | Continued execution on building out first of its kind green hydrogen generation network in North America. On track to commission 70TPD of green hydrogen by year end, with 2.5 TPD Green gaseous production online at Georgia facility. |
| ● | Manufacturing buildout continues with gigafactory ramp on track, and 300,000 square foot Vista facility, starting GenDrive assembly in the fall. Evaluating multiple global locations for additional gigafactories. |
| ● | Remain focused on execution and positioning the Company on path to profitability. PTC will accelerate timeline to profitability and positive cash flows. |
Electrolyzer Business:
Booking and Backlog Ahead of Target. Robust Sales Funnel.
Business outlook remains robust within the electrolyzer business. Our current backlog of 1.5GW is already ahead of our targeted booking and backlog of 1GW for the year. Our biggest bookings include 1GW from H2 Energy, Plug’s largest order to date, and another recently announced 120MW order from New Fortress Energy, which can grow to 500MW. Our electrolyzer sales funnel now stands at over $15B.
H2 Energy will use Plug’s electrolyzer to produce green hydrogen in Denmark, the largest capacity electrolyzer installation in the world to date at 1GW. Harnessing offshore wind power, Plug’s electrolyzer technology is expected to produce up to 100,000 metric tons per year of green hydrogen to use for transportation in northern Europe, the equivalent supply for approximately 15,000 heavy duty vehicles per day.
Plug entered into an agreement with New Fortress Energy Inc. for a 120-megawatt industrial-scale green hydrogen plant near Beaumont, Texas, with the ability to produce more than 50 TPD of green hydrogen. The facility is the first investment in green hydrogen for New Fortress Energy, and the project site is strategically located near industrial end-users with access to reliable power and logistics. This agreement allows Plug to expand both the amount of electrolyzers delivered, up to 500MW, as well as our scope of business with New Fortress Energy.
It is important to note that the PTC of $3/kg for green hydrogen will dramatically expand the economics for green hydrogen, making green hydrogen economical versus grey in essentially all hydrogen markets. To put this in context, refining and ammonia industries consume almost 20,000TPD of hydrogen. This policy backdrop has created substantial potential opportunity for on-site electrolyzers in these applications. For illustrative purposes, 20% penetration of these markets represents incremental electrolyzer demand of 10GW, just in the United States.
Clean Energy Legislation and Green Hydrogen Production Tax Credit: Transformational for Plug and the Hydrogen Economy
We are very pleased with the recently passed Inflation Reduction Act (IRA) in the Senate and applaud the efforts of our political leadership. We believe that the IRA will enable the United States to become the global leader in the fuel cell and green hydrogen industry. This bill provides a trifecta effect: good for climate, good for jobs, and good for energy and national security.
The IRA bill is a tremendous catalyst for all forms of clean energy development, and we believe it is a game changer for Plug and green hydrogen. The IRA would enact a Clean Hydrogen Production Tax Credit (PTC) to incentivize the production of clean hydrogen. The PTC provides a tax credit of up to $3.00 per kilogram for green hydrogen and is available for a 10-year period for any hydrogen generation facility that begins construction prior to 2033, including the ability to receive direct pay for the first five years.
PTC for green hydrogen should further enhance Plug’s industry leadership in the green hydrogen ecosystem given its first mover advantage. We believe that the PTC will help capital formation, recycling of capital, and back leveraging. This will likely follow similar capital formation and reduction in the levelized cost of energy (LCOE) of renewable electricity in the last decade. Wind and solar became a bankable asset class with project return expectations going from mid-teens to mid-single digit. This will also help with the capital mix moving from equity financing to substantial back leverage, plus tax equity. We believe this dynamic provides access to a larger pool of capital to help accelerate the growth of the green hydrogen industry while reducing the levelized cost of green hydrogen. In addition, the IRA also extends 30% investment tax credit (ITC) for fuel cell application until 2024 and tech-neutral credit beyond 2025, which we expect will have a meaningful positive impact to our multiple fuel cell products including stationary products.
First-of-its-Kind Green Hydrogen Generation Network Build Out: Continued Execution with Clear Path to 500TPD by 2025
We remain focused on building out the green hydrogen generation network with targets of 70 TPD commissioning by the end of 2022, 500 TPD in North America by 2025 and 1,000 TPD globally by 2028. We continue to manage supply chain constraints, permitting dynamics, and the current inflationary environment as we execute on these goals.
Our path to commission 70TPD includes build out of our plant in Georgia (20TPD), St. Gabe, Louisiana (15TPD), expansion in Tennessee (10-15TD), gas plant in New York (5TPD) and additional gas plant in Texas (5-10TPD).
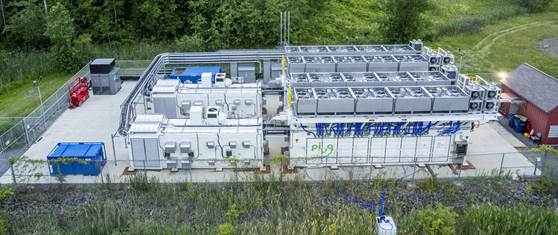
Georgia, (20TPD): We are making meaningful progress with construction of our plant in Georgia. The 2.5 TPD gaseous hydrogen plant has already been commissioned, and we are looking to double gaseous hydrogen production on-site. Foundation work is full steam ahead to receive electrolyzer, liquefier, and on-site storage this fall for the 15 TPD liquid plant. We expect to have 250 construction crew on site this fall, with plans to commission the plant before year-end.
Plug Green Hydrogen Plant, Georgia
St. Gabe, LA, (15TPD): We are also finalizing plans to break ground on our site in St. Gabriel, Louisiana in partnership with Olin. All long lead time items have been procured. This plant build out will follow a similar schedule to the expansion of our 10TPD plant in Tennessee, as it will have a very similar layout and design. This plant will utilize feed-gas from Olin, and we are targeting to commission this 15 TPD plant before year-end.
TN Expansion, (10TPD to 20-25TPD): We expanded our TN plant last fall from 6 to 10TPD and are currently in discussion with our partner Olin to expand this plant to 20-25TPD. The first phase will be adding gaseous hydrogen at the site with plans for adding a liquefier in 2023.
Plug Hydrogen Plant, Tennessee
TX Opportunity, (10TPD): We are in discussion with our partner Olin to build a 10TPD gaseous hydrogen plant in Texas. We have been evaluating land options and sourcing long-lead time items, including clean up skid and compressors to execute on this strategy. We are also looking to break ground on our 45TPD liquid green hydrogen plant in Texas, where we are planning to utilize our own liquefaction technology.
New York, (5TPD to 50TPD): We have refined our execution strategy in NY, with plans to be built in multiple phases. The first phase of the plant is expected to be 5 TPD of gaseous hydrogen leveraging an existing power line and available load. Substation build out in collaboration with the New York Power Authority (NYPA) and National Grid is expected to extend into 2023 given permitting dynamics. All other long lead time items are already in order, with the biggest gating item at this point being the timing of the completion of the substation. The second phase of the plant should be ready to energize once substation work is completed in 2023 as we continue to progress with all other construction activity. The site is currently constructing two 500,000-gallon tanks.
Plug Green Hydrogen Plant, New York
In summary, we are pleased that we on track to achieve our target of commissioning 70TPD by YE 2022.
In Europe, Plug signed a 30-year concession agreement to build a green hydrogen generation plant at the Belgian Port of Antwerp-Bruges, the second largest in Europe, with Plug’s 100MW PEM electrolyzer. The plant is expected to produce up to 12,500 tons per year of liquid and gaseous green hydrogen for the European market. Port of Antwerp-Bruges is one of the busiest logistics areas in Europe, handling 289 million tons of maritime freight, 24 million tons of rail freight, and 108.5 million tons of barge freight per year.
Sixty percent of Europe’s purchasing power is located within 300 miles of the facility. Construction of the plant will begin upon completion of the permitting process, which is anticipated in late 2023. Initial production of green hydrogen is expected in late 2024, with plant commissioning expected in 2025.
Building World Class Global Manufacturing and Supply Chain
Plug remains focused on building world class manufacturing and supply chain capabilities, to provide the highest quality offerings to end customers. We will continue to focus on reducing the cost of our product, allowing for margin expansion, and sharing of enhanced economics with customers. We are currently operating 32 facilities, including manufacturing, distribution, service centers and sales offices in nine countries, and we expect these numbers to continue to grow as we expand our operations.
Gigafactory, Rochester, NY: We are on target to be in full production by fall of 2022, having an annual run rate of 2.5GW of total capacity and 1.5GW of electrolyzer capacity. The highly optimized factory design and system automation will lead to higher quality, lower cost, and increased throughput. We believe this gigafactory provides the blueprint for global manufacturing expansion as we are evaluating multiple gigafactories on a global basis to meet anticipated demand.
VISTA Facility, Slingerlands, NY: Plug is starting to move into our new Vista facility and we expect this facility will be fully operational in January 2023. This is about 20 mins from our current facility in Latham, NY. This facility will also feature advanced automation allowing for increased scale and efficiency for the assembly of our entire fuel cell product line. Vista will initially be 300,000 square feet, with the ability to expand to 1 million square feet to meet demand for our fuel cell products.
Material Handling: Continues to Deliver Robust Growth
Plug continues to experience robust demand for our material handling business, the first commercially successful fuel cell application. Our expansion effort in Europe is gaining traction, and we expect to land two pedestal customers in Europe this year. Plug has occupied our new European service and logistics center in Duisburg, Germany at the world's largest inland port, with an initial 70,000 square feet of manufacturing. This will enable Plug to meet the rapid growth in Europe that we are seeing in material handling applications.
Our legacy customer base is creating a growing stream of sticky recurring revenue as GenDrive fuel cells are refreshed when the contract is renewed. Recurring revenues were 37% higher year over year, and we expect it to play a meaningful role in sustainable revenue growth for our material handling business unit.
Data Center: Successful Validation of 3MW Stationary Power Demo Unit for Microsoft, Opens Potential $40B+ Market Opportunity
Plug has validated its latest innovation, a 3MW fuel cell system for backup power, alongside datacenter customer Microsoft. The PEM fuel cell test in Latham, NY demonstrated the viability of this technology at three megawatts, the first ever unit at the scale of diesel generators used for backup power at a datacenter.
The system is engineered using eighteen 125-kilowatt fuel cells – resulting in the largest system and application the company has ever addressed. With the prototype testing complete and concept proven, Plug is focused on rolling out a second-generation, optimized commercial version of high-power stationary fuel cell systems. Microsoft plans to install one of these second-generation fuel cell systems at a research datacenter where engineers will learn how to work with and deploy the recent technology.
We view this as a landmark event for the industry, as large-scale stationary fuel cell applications can truly serve as a displacement for diesel powered back up, opening a potential $40B+ addressable market opportunity for Plug.
In addition, we can optimize the product for many customer needs including data center back up, peak, and prime power, with the first 1MW units scheduled for delivery in 2022. This will increase the addressable market opportunity well beyond $40 billion. Over the next twelve months, we expect to ship 20-30MW in this application with shipment of 200-250MW in 2024.
Furthermore, with a 1MW GenSure HP fuel cell stack utilizing about 65 Kg of hydrogen/per hour, we also see a sizable opportunity for Plug to supply fuel from our green hydrogen network to such customers, reinforcing our vertical integration strategy.
HYVIA JV: Meaningful Pilot Program Progressing
HYVIA has signed up over 20 customer test programs with deliveries of over 200 ProGen engines to the JV to support these pilots this year. HYVIA successfully tested the hydrogen powered Master Van in preparation for their expanded test pilot programs.
We continue to be thoughtful and patient approaching our entry into the heavy-duty vehicle mobility application, and like HYVIA, we have made a conscious decision not to be just a component supplier. We continue to evaluate a potential role that Plug could play in the heavy-duty applications and we will look to have more to communicate to the market on our long-term business strategy in the second half of 2022.
 | Fourth Annual Plug Symposium
Underway in 2022
Plug looks forward to hosting its 4th annual Plug Symposium on October 18-19 from its Rochester, NY gigafactory. This will be a hybrid event. Stay tuned for further event and registration details over the coming month. |
Summary of Second Quarter Financials
Revenue was $151.3 million in the second quarter, compared to $124.6 million for the second quarter of 2021. New product offerings represented over $56 million in revenue. We remind everyone of Plug’s historical seasonality for full year revenues which is expected to continue in 2022. Plug’s revenue in the first half of the year typically represents approximately 30% of the full year revenue with the second half representing approximately 70%.
Gross margin was negative 21% in the second quarter, up 4% sequentially and was up 11% year over year. Gross margin in the fuel cell systems and related infrastructure was 19% in the second quarter, up 1% sequentially. As a reminder, since the first half of 2021, the equipment product line now consists of a blended margin from both the mature fuel cell applications for the material handling business, as well as rapidly scaling new product lines including electrolyzers, fuel cell applications for on-road mobility and stationary power.
Plug remains focused on delivering on our previously announced target to reduce service costs on a per unit basis by approximately 30% in the next 12 months, and approximately 45% by the end of 2023. We are pleased to report 36% service margin expansion sequentially in the second quarter of 2022, and up over 141% from the second quarter of 2021. The Company remains focused on delivering improved technology for new GenDrive deployments, as well as system enhancements to the installed fleet to continue driving down service costs.
Plug’s fuel business continues to remain under pressure due to increased hydrogen molecule cost associated with historically higher natural gas prices and continued supplier disruptions. Natural gas prices at Henry Hub, on average, were up over 17% in the first quarter of 2022 versus the fourth quarter of 2021. Despite the significant increase in natural gas prices Plug had to absorb in the second quarter of 2022, we saw fuel margin expansion of 5% over the first quarter of 2022. External factors have had a significant negative impact on our fuel margin, further reinforcing our strategic move to build a green hydrogen generation network. With continued progress in the build out of our green generation network, we expect to see a step change of over 50% reduction in the cost of molecules by the second half of 2023, and another step change in 2024. PTC should accelerate our fuel margin expansion as we bring green hydrogen plants online. Today, every dollar/kg of hydrogen cost impacts gross profit by $10-$12 million.
Execution remains a Top Priority:
On Track to Deliver Previously Announced Targets
Plug remains focused on building a global green hydrogen ecosystem and delivering on margin expansion and path to profitability. Despite the numerous macro and supply chain constraints, we are working to deliver on our 2022 revenue targets of $900-$925 million with ~80% growth year over year. We believe we have the team, technology, focus and vision to become the category king in the $10T+ hydrogen economy.
We thank our employees for their dedication and our shareholders for their continued support. We look forward to updating you all on our next call. When you think about a greener world — think Plug

Conference Call Information
A conference call will be held today, August 9, 2022.
| ● | Toll-free: 877-407-9221 / 201-689-8597 |
| ● | Direct webcast: https://event.webcasts.com/starthere.jsp?ei=1546052&tp_key=43e64828c1 |
The webcast can also be accessed directly from the Plug homepage (www.plugpower.com). A playback of the call will be available online for a period of time following the call.
About Plug
Plug is building the hydrogen economy as the leading provider of comprehensive hydrogen fuel cell (HFC) turnkey solutions. The Company’s innovative technology powers electric motors with hydrogen fuel cells amid an ongoing paradigm shift in the power, energy, and transportation industries to address climate change and energy security, while providing efficiency gains and meeting sustainability goals. Plug created the first commercially viable market for hydrogen fuel cell (HFC) technology. As a result, the Company has deployed over 50,000 fuel cell systems for e-mobility, more than anyone else in the world, and has become the largest buyer of liquid hydrogen, having built and operated a hydrogen highway across North America. Plug delivers a significant value proposition to end-customers, including meaningful environmental benefits, efficiency gains, fast fueling, and lower operational costs.
Plug’s vertically integrated GenKey solution ties together all critical elements to power, fuel, and provide service to customers such as Amazon, BMW, The Southern Company, Carrefour, and Walmart. The Company is now leveraging its know-how, modular product architecture and foundational customers to rapidly expand into other key markets including zero-emission on-road vehicles, robotics, and data centers.
Cautionary Note on Forward-Looking Statements
This communication contains "forward-looking statements" within the meaning of the Private Securities Litigation Reform Act of 1995 that involve significant risks and uncertainties about Plug Power Inc. ("Plug"), including but not limited to statements about Plug’s expected revenue targets and growth; the growth outlook of Plug’s electrolyzers; the timing and expected delivery of Plug’s stationary power demo units; the expected benefits of recently passed clean energy legislation, including the Inflation Reduction Act; the expectation that Plug will successfully achieve its green hydrogen generation targets; Plug’s profitability and cash flow expectations stemming from the Clean Hydrogen Production Tax Credit; the outlook of Plug’s electrolyzer business and the related claims regarding backlog and bookings; the expected hydrogen supply output of Plug’s electrolyzer installations and green hydrogen plants; the effect of the Clean Hydrogen Production Tax Credit on the competition economics, including with respect to market penetration and opportunity; the expected capital formation benefits resulting from the Clean Hydrogen Production Tax Credit; Plug’s ability to meet its green hydrogen generation targets, expected commissioning, construction, expansion, and completion of Plug’s green hydrogen plants, including the timing and benefits thereof; Plug’s ability to leverage its existing power line and available load to extend its NYPA and National Grid into 2023; Plug’s ability to meet its target of commissioning 70TPD by year end 2022; the expected production of Plug’s generation plants in Europe; the time to reach full production at the Rochester, NY Gigafactory and the expected benefits of the Rochester, NY Gigafactory design; the expected expansion of Plug’s footprint in Europe, including its ability to obtain additional pedestal customers and leverage its Duisberg, Germany facility to meet growth needs; the anticipated market opportunity and potential for individualized optimization with respect to its stationary power demo unit with Microsoft; the potential impacts of historically higher natural gas prices and inflation; Plug’s expectations with respect to reduction in costs of molecules; Plug's expectation regarding seasonality of revenue; Plug’s expectation that it will be able to reduce service costs by approximately 30% in the next 12 months and by approximately 45% by the end of 2023; Plug’s expectation that the enhanced technology GenDrive units will support its long-term business needs; Plug’s expectation that the market will see a step change in margin profile for the fuel business in 2023 and the cost of molecules decline by more than half; that Plug will reach its long term targets through 2025, accelerate adoption of green hydrogen, drive demand across multiple industries, deliver on portfolio sale opportunities and leverage to create growth; and Plug’s belief in its vertical integration, supply chain platform and gross margin improvements. You are cautioned that such statements should not be read as a guarantee of future performance or results, and will not necessarily be accurate indications of the times that, or by which, such performance or results will have been achieved. Such statements are subject to risks and uncertainties that could cause actual performance or results to differ materially from those expressed in these statements. For a further description of the risks and uncertainties that could cause actual results to differ from those expressed in these forward-looking statements, as well as risks relating to the business of Plug in general, see Plug’s public filings with the Securities and Exchange Commission, including the “Risk Factors” section of Plug’s Annual Report on Form 10-K for the year ended December 31, 2021. Readers are cautioned not to place undue reliance on these forward-looking statements. The forward-looking statements are made as of the date hereof and are based on current expectations, estimates, forecasts and projections as well as the beliefs and assumptions of management. We disclaim any obligation to update forward-looking statements except as may be required by law.
Plug Investor Contact
Roberto Friedlander
investors@plugpower.com
Plug Media Contact
Caitlin Coffee
PlugPR@allisonpr.com
Plug Power Inc. and Subsidiaries
Consolidated Balance Sheets
(In thousands, except share and per share amounts)
(Unaudited)
| | | June 30, | | | December 31, | |
| | | 2022 | | | 2021 | |
| Assets | | | | | | | | |
| Current assets: | | | | | | | | |
| Cash and cash equivalents | | $ | 2,255,951 | | | $ | 2,481,269 | |
| Restricted cash | | | 146,013 | | | | 118,633 | |
| Available-for-sale securities, at fair value (amortized cost $736,983 and allowance for credit losses of $0 at June 30, 2022 and amortized cost $1,242,933 and allowance for credit losses of $0 at December 31, 2021) | | | 715,906 | | | | 1,240,265 | |
| Equity securities | | | 134,342 | | | | 147,995 | |
| Accounts receivable | | | 61,502 | | | | 92,675 | |
| Inventory | | | 429,549 | | | | 269,163 | |
| Contract assets | | | 38,961 | | | | 38,637 | |
| Prepaid expenses and other current assets | | | 111,846 | | | | 59,888 | |
| Total current assets | | | 3,894,070 | | | | 4,448,525 | |
| | | | | | | | | |
| Restricted cash | | | 559,713 | | | | 532,292 | |
| Property, plant, and equipment, net | | | 431,492 | | | | 255,623 | |
| Right of use assets related to finance leases, net | | | 44,201 | | | | 32,494 | |
| Right of use assets related to operating leases, net | | | 241,421 | | | | 212,537 | |
| Equipment related to power purchase agreements and fuel delivered to customers, net | | | 83,159 | | | | 72,902 | |
| Contract assets | | | 182 | | | | 120 | |
| Goodwill | | | 235,026 | | | | 220,436 | |
| Intangible assets, net | | | 204,213 | | | | 158,208 | |
| Investments in non-consolidated entities and non-marketable equity securities | | | 37,007 | | | | 12,892 | |
| Other assets | | | 3,920 | | | | 4,047 | |
| Total assets | | $ | 5,734,404 | | | $ | 5,950,076 | |
| | | | | | | | | |
| Liabilities and Stockholders’ Equity | | | | | | | | |
| Current liabilities: | | | | | | | | |
| Accounts payable | | $ | 146,166 | | | $ | 92,307 | |
| Accrued expenses | | | 98,341 | | | | 79,237 | |
| Deferred revenue and other contract liabilities | | | 60,315 | | | | 116,377 | |
| Operating lease liabilities | | | 37,214 | | | | 30,822 | |
| Finance lease liabilities | | | 6,324 | | | | 4,718 | |
| Finance obligations | | | 46,784 | | | | 42,040 | |
| Current portion of long-term debt | | | 980 | | | | 15,252 | |
| Contingent consideration, loss accrual for service contracts, and other current liabilities | | | 31,645 | | | | 39,800 | |
| Total current liabilities | | | 427,769 | | | | 420,553 | |
| | | | | | | | | |
| Deferred revenue and other contract liabilities | | | 67,390 | | | | 66,713 | |
| Operating lease liabilities | | | 193,333 | | | | 175,635 | |
| Finance lease liabilities | | | 32,972 | | | | 24,611 | |
| Finance obligations | | | 219,622 | | | | 211,644 | |
| Convertible senior notes, net | | | 193,269 | | | | 192,633 | |
| Long-term debt | | | 91,677 | | | | 112,794 | |
| Contingent consideration, loss accrual for service contracts, and other liabilities | | | 169,791 | | | | 139,797 | |
| Total liabilities | | | 1,395,823 | | | | 1,344,380 | |
| | | | | | | | | |
| Stockholders’ equity: | | | | | | | | |
| Common stock, $0.01 par value per share; 1,500,000,000 shares authorized; Issued (including shares in treasury): 595,709,539 at June 30, 2022 and 594,729,610 at December 31, 2021 | | | 5,958 | | | | 5,947 | |
| Additional paid-in capital | | | 7,163,486 | | | | 7,070,710 | |
| Accumulated other comprehensive loss | | | (28,989 | ) | | | (1,532 | ) |
| Accumulated deficit | | | (2,726,688 | ) | | | (2,396,903 | ) |
| Less common stock in treasury: 17,210,049 at June 30, 2022 and 17,074,710 at December 31, 2021 | | | (75,186 | ) | | | (72,526 | ) |
| Total stockholders’ equity | | | 4,338,581 | | | | 4,605,696 | |
| Total liabilities and stockholders’ equity | | $ | 5,734,404 | | | $ | 5,950,076 | |
Plug Power Inc. and Subsidiaries
Consolidated Statement of Operations
(In thousands, except share and per share amounts)
(Unaudited)
| | | Three Months Ended | | | Six Months Ended | |
| | | June 30, | | | June 30, | |
| | | 2022 | | | 2021 | | | 2022 | | | 2021 | |
| Net revenue: | | | | | | | | | | | | | | | | |
| Sales of fuel cell systems, related infrastructure and equipment | | $ | 116,233 | | | $ | 99,278 | | | $ | 225,080 | | | $ | 146,050 | |
| Services performed on fuel cell systems and related infrastructure | | | 8,822 | | | | 5,675 | | | | 17,062 | | | | 11,720 | |
| Power purchase agreements | | | 11,169 | | | | 8,361 | | | | 21,206 | | | | 16,187 | |
| Fuel delivered to customers and related equipment | | | 14,472 | | | | 11,121 | | | | 27,900 | | | | 22,248 | |
| Other | | | 571 | | | | 122 | | | | 822 | | | | 310 | |
| Net revenue | | | 151,267 | | | | 124,557 | | | | 292,070 | | | | 196,515 | |
| Cost of revenue: | | | | | | | | | | | | | | | | |
| Sales of fuel cell systems, related infrastructure and equipment | | | 94,153 | | | | 79,913 | | | | 182,981 | | | | 108,887 | |
| Services performed on fuel cell systems and related infrastructure | | | 11,612 | | | | 15,475 | | | | 25,487 | | | | 28,561 | |
| Provision for loss contracts related to service | | | 1,068 | | | | 6,694 | | | | 3,116 | | | | 8,179 | |
| Power purchase agreements | | | 34,892 | | | | 22,234 | | | | 66,645 | | | | 40,577 | |
| Fuel delivered to customers and related equipment | | | 41,607 | | | | 40,331 | | | | 80,879 | | | | 62,474 | |
| Other | | | 400 | | | | 208 | | | | 777 | | | | 306 | |
| Total cost of revenue | | | 183,732 | | | | 164,855 | | | | 359,885 | | | | 248,984 | |
| | | | | | | | | | | | | | | | | |
| Gross loss | | | (32,465 | ) | | | (40,298 | ) | | | (67,815 | ) | | | (52,469 | ) |
| | | | | | | | | | | | | | | | | |
| Operating expenses: | | | | | | | | | | | | | | | | |
| Research and development | | | 23,557 | | | | 11,247 | | | | 44,018 | | | | 20,989 | |
| Selling, general and administrative | | | 95,953 | | | | 38,652 | | | | 176,842 | | | | 64,231 | |
| Change in fair value of contingent consideration | | | (5,066 | ) | | | (560 | ) | | | (2,605 | ) | | | 230 | |
| Total operating expenses | | | 114,444 | | | | 49,339 | | | | 218,255 | | | | 85,450 | |
| | | | | | | | | | | | | | | | | |
| Operating loss | | | (146,909 | ) | | | (89,637 | ) | | | (286,070 | ) | | | (137,919 | ) |
| | | | | | | | | | | | | | | | | |
| Interest income | | | 3,838 | | | | 1,446 | | | | 5,892 | | | | 1,513 | |
| Interest expense | | | (11,203 | ) | | | (11,714 | ) | | | (19,851 | ) | | | (24,047 | ) |
| Other expense, net | | | (2,456 | ) | | | (70 | ) | | | (3,765 | ) | | | (268 | ) |
| Realized loss on investments, net | | | (468 | ) | | | 18 | | | | (1,315 | ) | | | 18 | |
| Change in fair value of equity securities | | | (13,484 | ) | | | 323 | | | | (18,643 | ) | | | 323 | |
| Loss on equity method investments | | | (2,191 | ) | | | — | | | | (6,024 | ) | | | — | |
| | | | | | | | | | | | | | | | | |
| Loss before income taxes | | | (172,873 | ) | | | (99,634 | ) | | | (329,776 | ) | | | (160,380 | ) |
| | | | | | | | | | | | | | | | | |
| Income tax expense | | | 423 | | | | — | | | | 9 | | | | — | |
| | | | | | | | | | | | | | | | | |
| Net loss | | $ | (173,296 | ) | | $ | (99,634 | ) | | $ | (329,785 | ) | | $ | (160,380 | ) |
| | | | | | | | | | | | | | | | | |
| Net loss per share: | | | | | | | | | | | | | | | | |
| Basic and diluted | | $ | (0.30 | ) | | | (0.18 | ) | | $ | (0.57 | ) | | $ | (0.30 | ) |
| | | | | | | | | | | | | | | | | |
| Weighted average number of common stock outstanding | | | 578,043,278 | | | | 567,033,722 | | | | 578,217,636 | | | | 540,394,003 | |
Plug Power Inc. and Subsidiaries
Consolidated Statement of Cash Flows
(In thousands)
(Unaudited)
| | | Six months ended June 30, | |
| | | 2022 | | | 2021 | |
| Operating activities | | | | | | | | |
| Net loss | | $ | (329,785 | ) | | $ | (160,380 | ) |
| Adjustments to reconcile net loss to net cash used in operating activities: | | | | | | | | |
| Depreciation of long-lived assets | | | 11,204 | | | | 9,725 | |
| Amortization of intangible assets | | | 10,374 | | | | 730 | |
| Stock-based compensation | | | 88,245 | | | | 20,815 | |
| Amortization of debt issuance costs and discount on convertible senior notes | | | 1,336 | | | | 1,726 | |
| Provision for common stock warrants | | | 3,942 | | | | 3,452 | |
| Deferred income tax benefit | | | (916 | ) | | | - | |
| (Benefit)/loss on service contracts | | | (18,131 | ) | | | 4,399 | |
| Fair value adjustment to contingent consideration | | | (2,605 | ) | | | (230 | ) |
| Net realized loss on investments | | | 1,315 | | | | (18 | ) |
| Amortization of premium on available-for-sale securities | | | 4,560 | | | | - | |
| Lease origination costs | | | (3,150 | ) | | | (4,553 | ) |
| Loss on disposal of assets | | | 268 | | | | - | |
| Change in fair value for equity securities | | | 18,643 | | | | (323 | ) |
| Loss on equity method investments | | | 6,024 | | | | - | |
| Changes in operating assets and liabilities that provide (use) cash: | | | | | | | | |
| Accounts receivable | | | 31,990 | | | | (48,318 | ) |
| Inventory | | | (159,445 | ) | | | (70,588 | ) |
| Contract assets | | | (386 | ) | | | - | |
| Prepaid expenses and other assets | | | (51,654 | ) | | | (22,967 | ) |
| Accounts payable, accrued expenses, and other liabilities | | | 38,663 | | | | 4,047 | |
| Deferred revenue and other contract liabilities | | | (55,605 | ) | | | 15,848 | |
| Net cash used in operating activities | | | (405,113 | ) | | | (246,635 | ) |
| | | | | | | | | |
| Investing activities | | | | | | | | |
| Purchases of property, plant and equipment | | | (157,838 | ) | | | (33,062 | ) |
| Purchases of equipment related to power purchase agreements and equipment related to fuel delivered to customers | | | (15,268 | ) | | | (7,598 | ) |
| Purchase of available-for-sale securities | | | (143,230 | ) | | | (1,504,891 | ) |
| Proceeds from sales of available-for-sale securities | | | 475,676 | | | | 260,313 | |
| Proceeds from maturities of available-for-sale securities | | | 167,629 | | | | - | |
| Purchase of equity securities | | | (4,990 | ) | | | (119,979 | ) |
| Net cash paid for acquisitions | | | (26,473 | ) | | | - | |
| Cash paid for non-consolidated entities and non-marketable equity securities | | | (30,139 | ) | | | - | |
| Net cash provided by (used in) investing activities | | | 265,367 | | | | (1,405,217 | ) |
| | | | | | | | | |
| Financing activities | | | | | | | | |
| Proceeds from exercise of warrants, net of transaction costs | | | - | | | | 15,450 | |
| Payments of contingent consideration | | | (2,667 | ) | | | - | |
| Proceeds from public and private offerings, net of transaction costs | | | - | | | | 3,587,825 | |
| Payments of tax withholding on behalf of employees for net stock settlement of stock-based compensation | | | (2,660 | ) | | | - | |
| Proceeds from exercise of stock options | | | 820 | | | | 4,705 | |
| Principal payments on long-term debt | | | (36,089 | ) | | | (15,564 | ) |
| Proceeds from finance obligations | | | 35,048 | | | | 32,159 | |
| Principal repayments of finance obligations and finance leases | | | (25,168 | ) | | | (17,281 | ) |
| Net cash (used in) provided by financing activities | | | (30,716 | ) | | | 3,607,294 | |
| Effect of exchange rate changes on cash | | | (55 | ) | | | (163 | ) |
| (Decrease)/increase in cash and cash equivalents | | | (225,318 | ) | | | 1,847,766 | |
| Increase in restricted cash | | | 54,801 | | | | 107,513 | |
| Cash, cash equivalents, and restricted cash beginning of period | | | 3,132,194 | | | | 1,634,284 | |
| Cash, cash equivalents, and restricted cash end of period | | $ | 2,961,677 | | | $ | 3,589,563 | |
| | | | | | | | | |
| Supplemental disclosure of cash flow information | | | | | | | | |
| Cash paid for interest, net capitalized interest of $5.8 million | | $ | 18,737 | | | $ | 11,261 | |
| | | | | | | | | |
| Summary of non-cash activity | | | | | | | | |
| Recognition of right of use asset - finance leases | | | 12,644 | | | | 11,286 | |
| Recognition of right of use asset - operating leases | | | 40,352 | | | | 39,271 | |
| Net tangible liabilities assumed in a business combination | | | (5,124 | ) | | | - | |
| Intangible assets acquired in a business combination | | | 60,522 | | | | - | |
| Conversion of convertible senior notes to common stock | | | - | | | | 15,345 | |
| Net transfers between inventory and long-lived assets | | | 916 | | | | - | |
| Accrued purchase of fixed assets, cash to be paid in subsequent period | | | 39,681 | | | | 6,124 | |