
Keefe, Bruyette & Woods
2008 Large Cap Bank Conference
12 August ■ Colorado Springs, CO

Forward-Looking Statements
This presentation contains statements that relate to the projected performance of
Zions Bancorporation and elements of or affecting such performance, including
statements with respect to the beliefs, plans, objectives, goals, guidelines,
expectations, anticipations and estimates of management. These statements
constitute forward-looking information within the meaning of the Private Securities
Litigation Reform Act. Actual facts, determinations, results or achievements may
differ materially from the statements provided in this presentation since such
statements involve significant known and unknown risks and uncertainties. Factors
that might cause such differences include, but are not limited to: competitive
pressures among financial institutions; economic, market and business conditions,
either nationally or locally in areas in which Zions Bancorporation conducts its
operations, being less favorable than expected; changes in the interest rate
environment reducing expected interest margins; changes in debt, equity and
securities markets; adverse legislation or regulatory changes and other factors
described in Zions Bancorporation’s Annual Report on Form 10-K for the year
ended December 31, 2007. In addition, the statements contained in this
presentation are based on facts and circumstances as understood by management
of the company on the date of this presentation, which may change in the future.
Zions Bancorporation disclaims any obligation to update any statements or to
publicly announce the result of any revisions to any of the forward-looking
statements included herein to reflect future events, developments, determinations or
understandings.

Today’s Agenda
Current Issues |
Credit |
Lockhart Funding |
Investment Portfolio |
Net Interest Margin |
Capital & Dividends |
Outlook Summary |
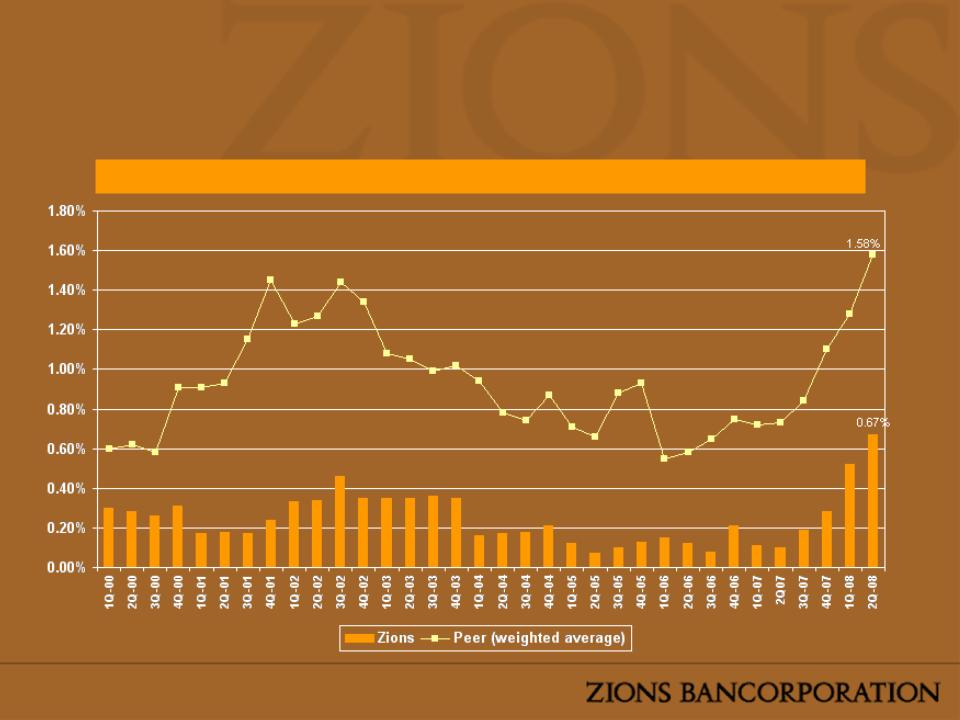
Note: Peer group defined as bank holding companies with assets >= $10 billion. At the date of this data was
not yet available for 2 of the 50 companies in the peer group.
not yet available for 2 of the 50 companies in the peer group.
Peer data source: SNL
NPAs as % of Total Assets
Strong Asset Quality
Relative to Peers
Relative to Peers
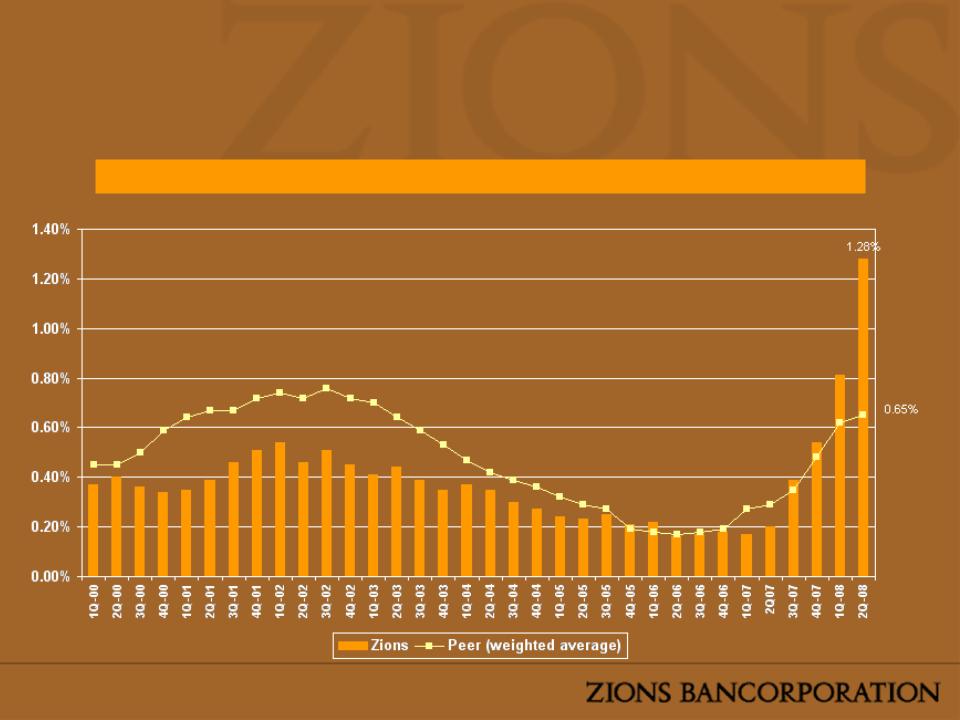
NCOs as % of Average Total Loans (Annualized)
Note: Peer group defined as bank holding companies with assets >= $10 billion.
Peer data source: SNL
Strong Asset Quality
Relative to Peers
Relative to Peers

Peers
1.5
Reserves / Net Charge Offs (Annualized)
Note: Peer group defined as bank holding companies with assets >= $10 billion.
Peer data source: SNL
Zions 2.0
Strong Asset Quality
Relative to Peers
Relative to Peers

2nd Quarter Reserves / Net Charge Offs (Annualized)
Source: SNL As Reported NIM for selected banks ($5-$20 Billion Market Cap or
Large Presence in the West)
Large Presence in the West)
Strong Asset Quality
Relative to Peers
Relative to Peers
C&I
47%
Consumer
18%
CRE
34%
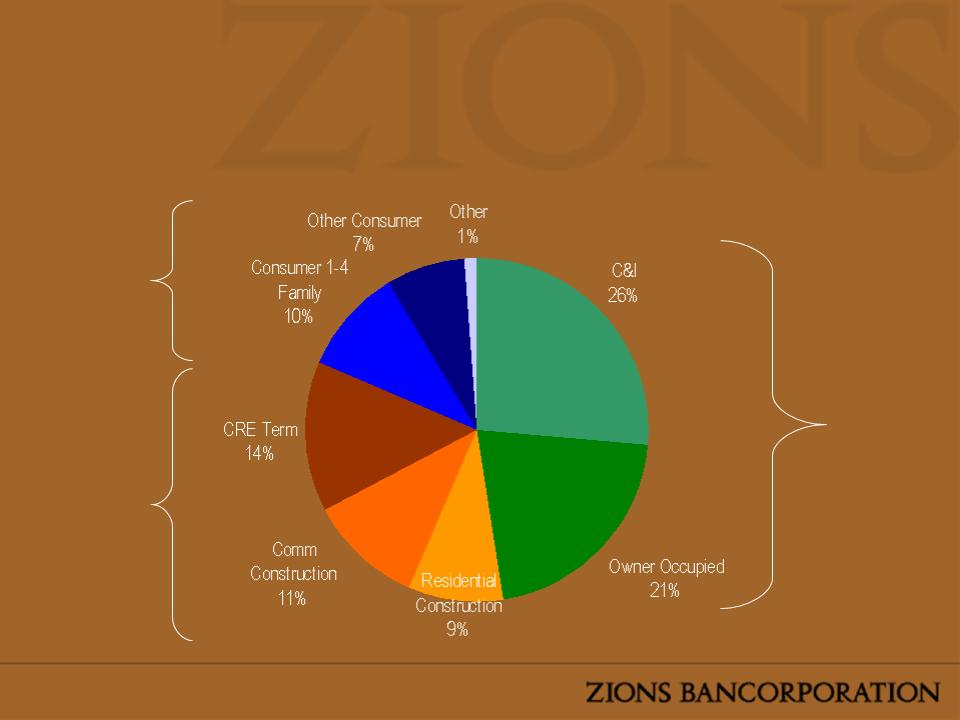
Loan Portfolio Diversification
Loans by Purpose - 6/30/2008
Loans by Purpose - 6/30/2008

Total Outstanding: $1.9 billion (6/30/08)
Residential Mortgage Loans
Total Outstanding: $0.2 billion (6/30/08)
Bankcard

Total Outstanding: $1.8 billion (6/30/08)
Average HECL FICO: 756
HECL Only
Commercial & Industrial Loans

Commercial Real Estate Loans
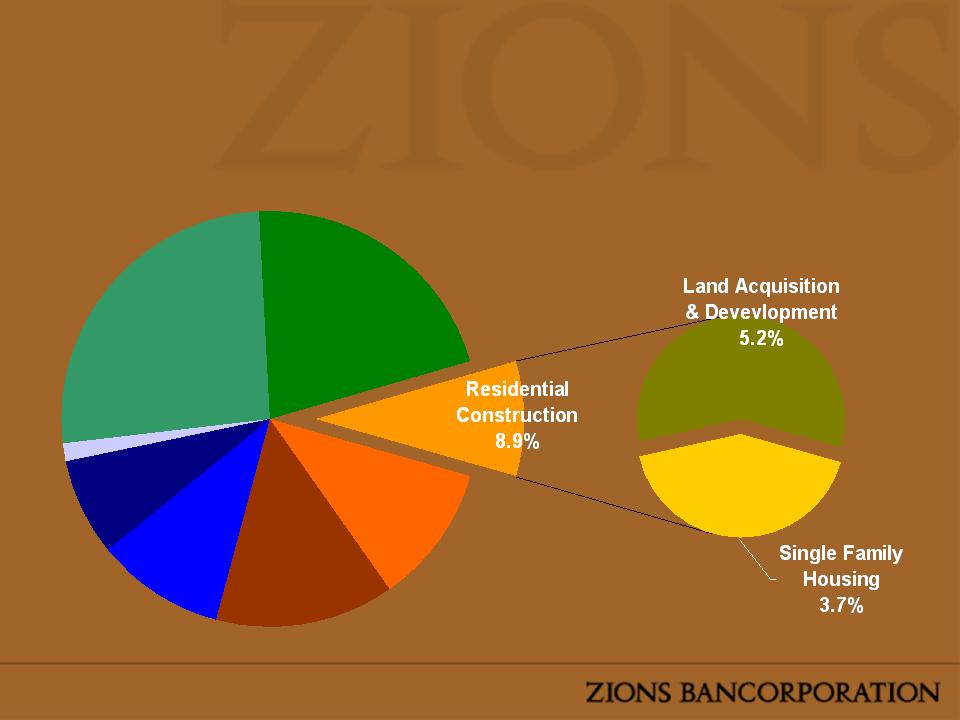
Residential Construction Components
Loans by Purpose - 6/30/2008
Loans by Purpose - 6/30/2008
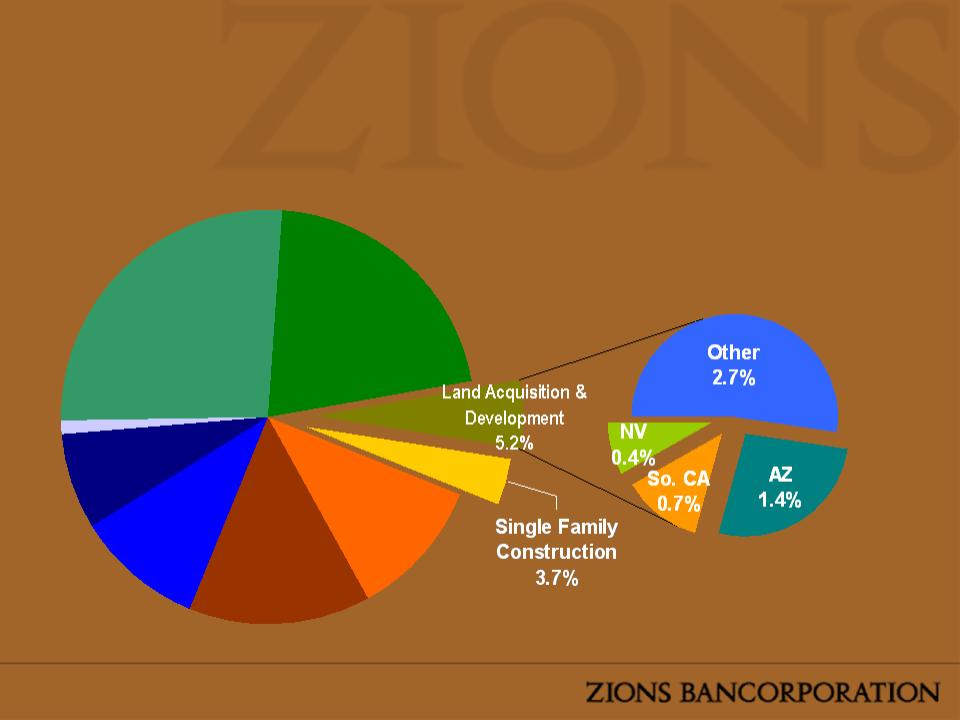
Land Acquisition & Dev. Components
Loans by Purpose by Geography - 6/30/2008
Loans by Purpose by Geography - 6/30/2008
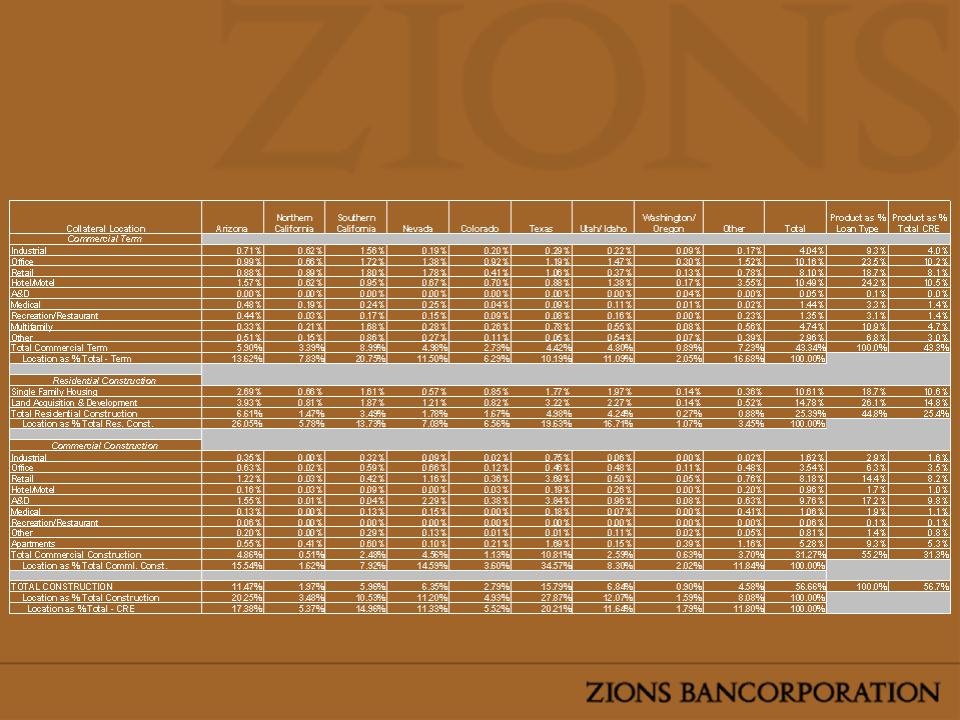
Average LTV: 55.7% (as of 6/30/2008)
Diversified CRE Portfolio
Loans by Product Type and Location - 06/30/08
Loans by Product Type and Location - 06/30/08
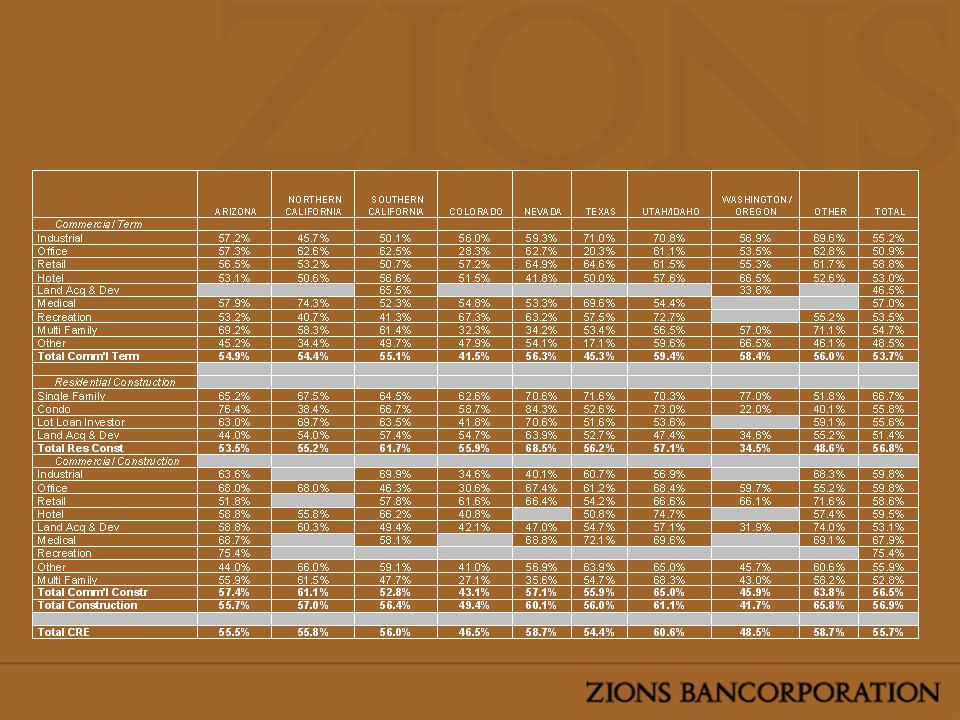
Average LTV: 55.7% (as of 6/30/2008)
*LTVs for CRE loans with a commitment amount of $1MM or greater. Appraisals as of loan
origination, or renewal (in a declining market), or upon adverse classification.
origination, or renewal (in a declining market), or upon adverse classification.
Actual CRE LTV Ratios*
Loans by Product Type and Location - 06/30/08
Loans by Product Type and Location - 06/30/08

*60 of the 216 updated appraisals come from affiliates not shown on the table above (UT, CO, and TX).
**Jan-08 LTV’s based on initial appraisal or reappraisal prior to Jan. 2008
Jun-08 LTV’s based on most recent reappraisal post Jan. 2008
Loan-to-Value Comparison
For Residential A&D & Lot Loans reappraised between Jan 08 to Jun 08
For Residential A&D & Lot Loans reappraised between Jan 08 to Jun 08

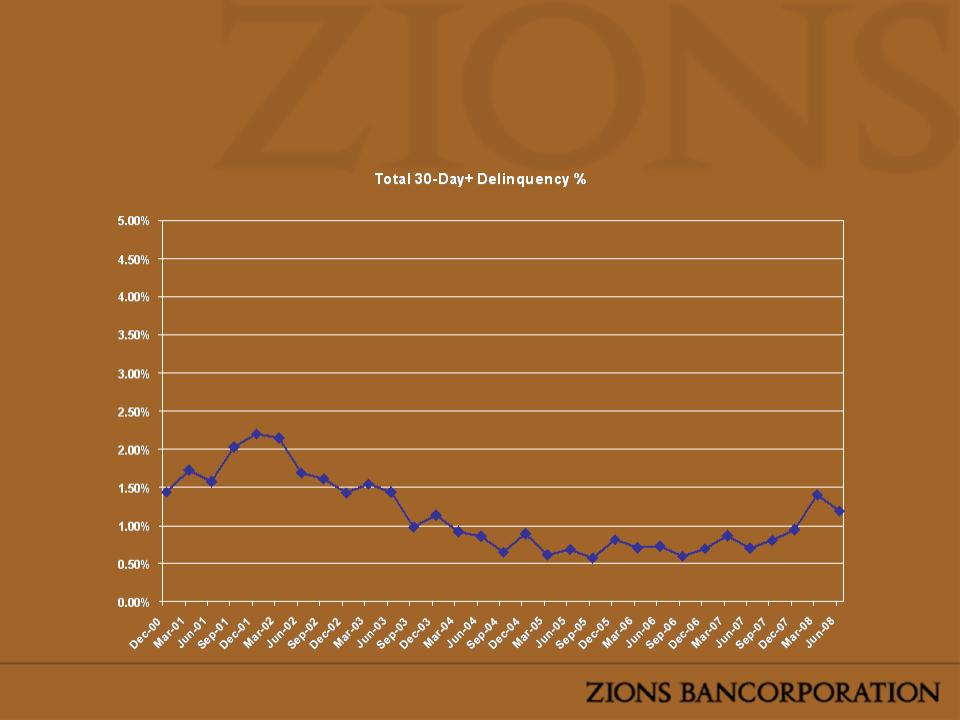
Strong underwriting and credit management
reduced losses almost by half
reduced losses almost by half
Note: Includes Top 20 substandard loans each quarter and all doubtful loans greater than $1 million.
Impact of Re-Margining
• Of the 50 largest credits classified
substandard or doubtful at any time during
the past 9 months there’s been
substandard or doubtful at any time during
the past 9 months there’s been
– $117 million in charge-offs
– $104 million in new equity through re-margining

Residential Land and
Development Loans
6/30/2008
Development Loans
6/30/2008
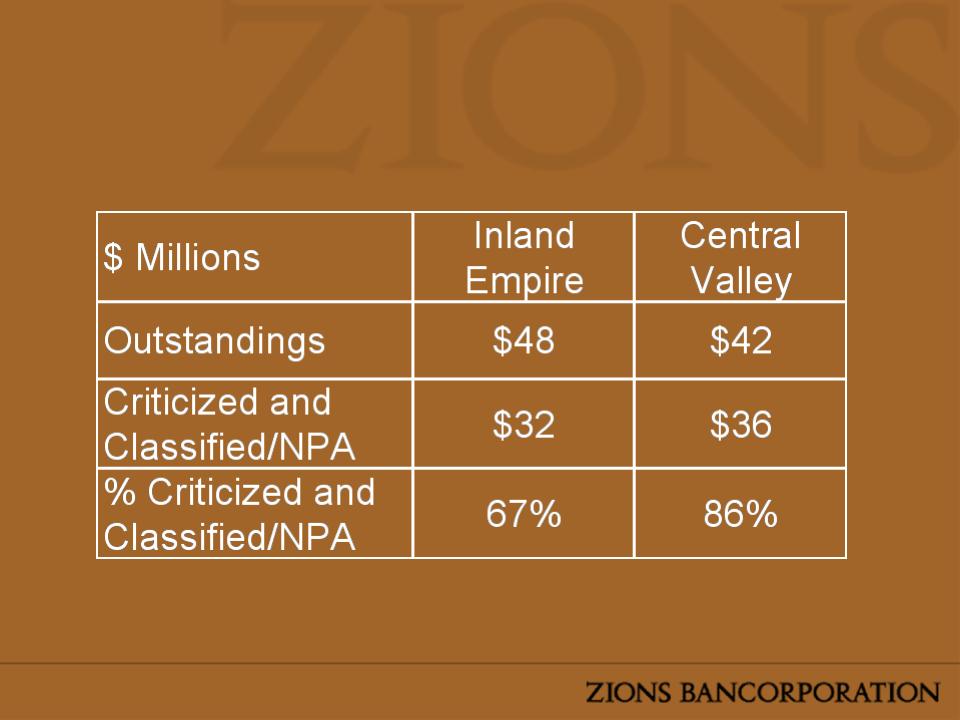
Select California Loan Views:
6/30/2008
6/30/2008

Credit Quality
Outlook
Outlook
• Weakness in residential construction activity and
land values in the Southwest expected to persist into
2009
land values in the Southwest expected to persist into
2009
• No current evidence of material spread of credit
problems to other geographies or loan categories
problems to other geographies or loan categories
• Some further increase in NPAs likely
• Provisions and Net Losses likely to remain at similar
levels to 2nd Quarter 2008
levels to 2nd Quarter 2008
• Charge-offs in California likely to decline

Loan Growth
Outlook
Outlook
• Loan demand and pricing are strong
across the footprint
across the footprint
• Managing balance sheet growth in the
context of current capital generation
and funding capabilities
context of current capital generation
and funding capabilities

Today’s Agenda
Current Issues |
Credit |
Lockhart Funding |
Investment Portfolio |
Net Interest Margin |
Capital & Dividends |
Outlook Summary |

As of 6-30-08
GAAP capital impact if remaining Net Lockhart exposure is brought on the balance sheet
(including impact of fair value marks): -12 bps
(including impact of fair value marks): -12 bps
10/31/07 | Corporate Purch. & Paydowns | 06/30/08 | |
AAA MBIA insured (small business loans originated by Zions) | $1.2B | $-1.2B | $0.0B |
AAA rated bank trust pref’d pools | $1.1B | $-0.6B | $0.5B |
US gov’t & agencies | $0.3B | $-0.1B | $0.2B |
Other insured | $0.2B | $-0.1B | $0.1B |
Other structured | $0.3B | $-0.16B | $0.04B |
Total | $3.1B | $-2.2B | $.86B |
Lockhart Funding

Today’s Agenda
Current Issues |
Credit |
Lockhart Funding |
Investment Portfolio |
Net Interest Margin |
Capital & Dividends |
Outlook Summary |
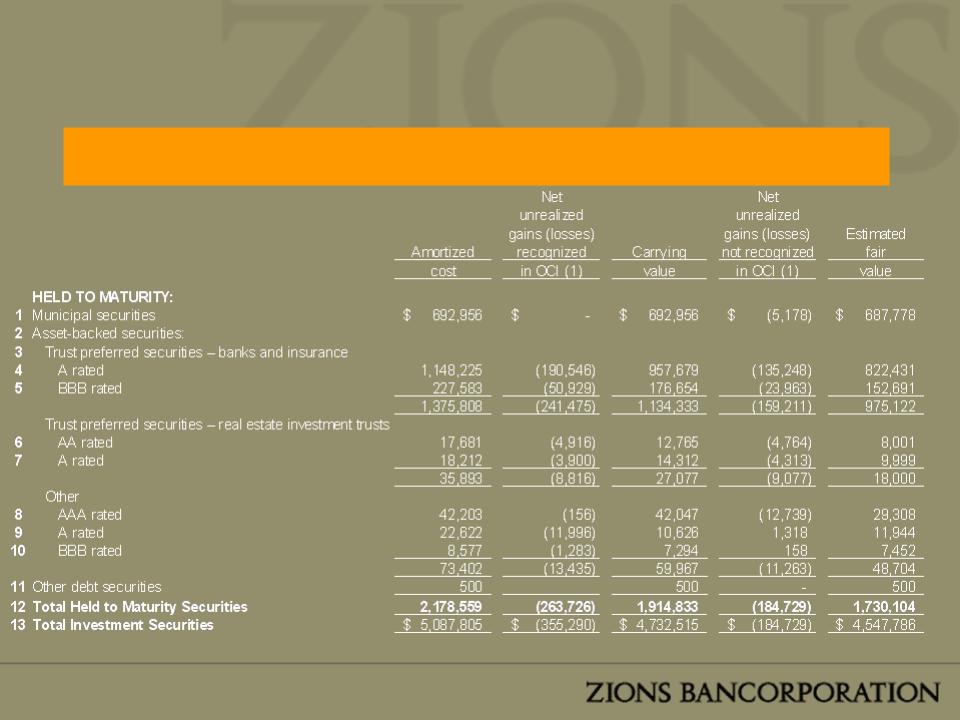
6-30-08
(in Billions)
*All fair value marks have been recognized through OCI
Held to Maturity Securities
*All fair value marks have been recognized through OCI
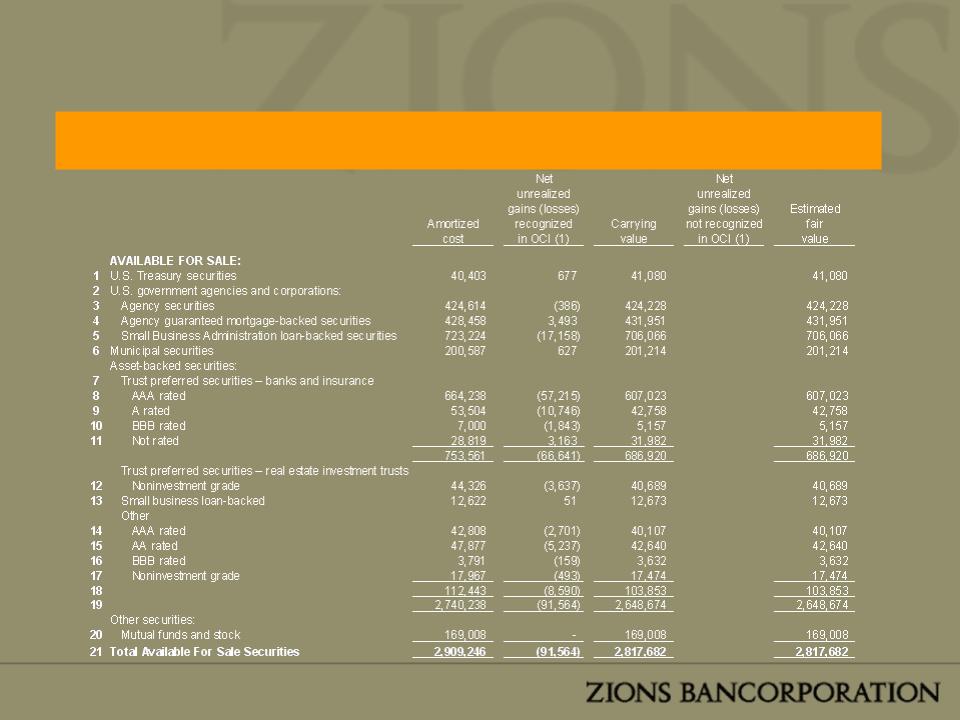
6-30-08
(in Billions)
Available for Sale Securities

Securities Transferred to Held To
Maturity
Maturity
• $1.500 billion of predominantly A-rated (or higher) Bank &
Insurance Trust Preferred CDO securities transferred from
AFS to HTM on April 30, 2008
Insurance Trust Preferred CDO securities transferred from
AFS to HTM on April 30, 2008
– $1.227 billion fair value
– $273 million unrealized pre-tax losses from marks in OCI accrete
back into tangible equity over remaining life of securities
back into tangible equity over remaining life of securities
• No other future impacts on OCI, earnings, and capital
unless a security were to become Other Than Temporarily
Impaired (OTTI)
unless a security were to become Other Than Temporarily
Impaired (OTTI)
Today’s Agenda
Current Issues |
Credit |
Lockhart Funding |
Investment Portfolio |
Net Interest Margin |
Capital & Dividends |
Outlook Summary |
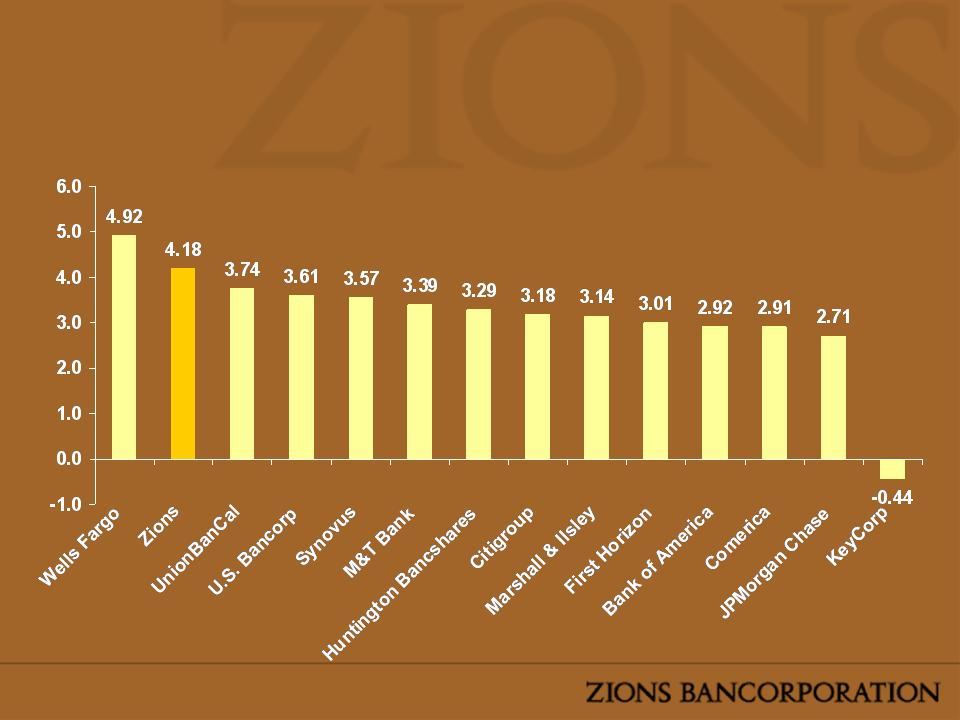
A High Net Interest Margin
2Q 2008 NIM for Selected Banks
2Q 2008 NIM for Selected Banks
Source: SNL As Reported NIM for selected banks ($5-$20 Billion Market Cap or
Large Presence in the West)
Large Presence in the West)

Zions NIM vs. 30-Day LIBOR
A Stable Net Interest Margin
in a Volatile Environment
in a Volatile Environment
Source: SNL As Reported NIM (Top 50 Banks by Assets)
LIBOR is Quarter Average

NIM Outlook
• Positives
– Loan pricing
• Pressures
– Continued strong competition for deposits
– Weak core deposit growth
– Adverse shifting of funding mix
– Increasing NPA’s
• Summary: Still some downward pressure

Today’s Agenda
Current Issues |
Credit |
Lockhart Funding |
Investment Portfolio |
Net Interest Margin |
Capital & Dividends |
Outlook Summary |

Zions Bancorporation Actual / Pro
Forma Capital Ratios
Forma Capital Ratios

Dividend Summary

Today’s Agenda
Current Issues |
Credit |
Lockhart Funding |
Investment Portfolio |
Net Interest Margin |
Capital & Dividends |
Outlook Summary |

• Managing balance sheet growth in the context of current capital
generation and funding capabilities
generation and funding capabilities
• Low cost deposit growth: Continues to be weak
• Security impairment charges may continue at 1H 2008 levels
• Credit costs: Similar to 2Q through year end, perhaps slight
increase
increase
• Net Interest Margin: Modest downward pressure
• Capital and Dividend:
– Continue to look for opportunities to raise $200-300 million of core capital
• Mitigate growth constraints and strengthen capital ratios
• We’re sensitive to dilution
– No plans to cut dividend
Outlook Summary

Keefe, Bruyette & Woods
12 August 2008