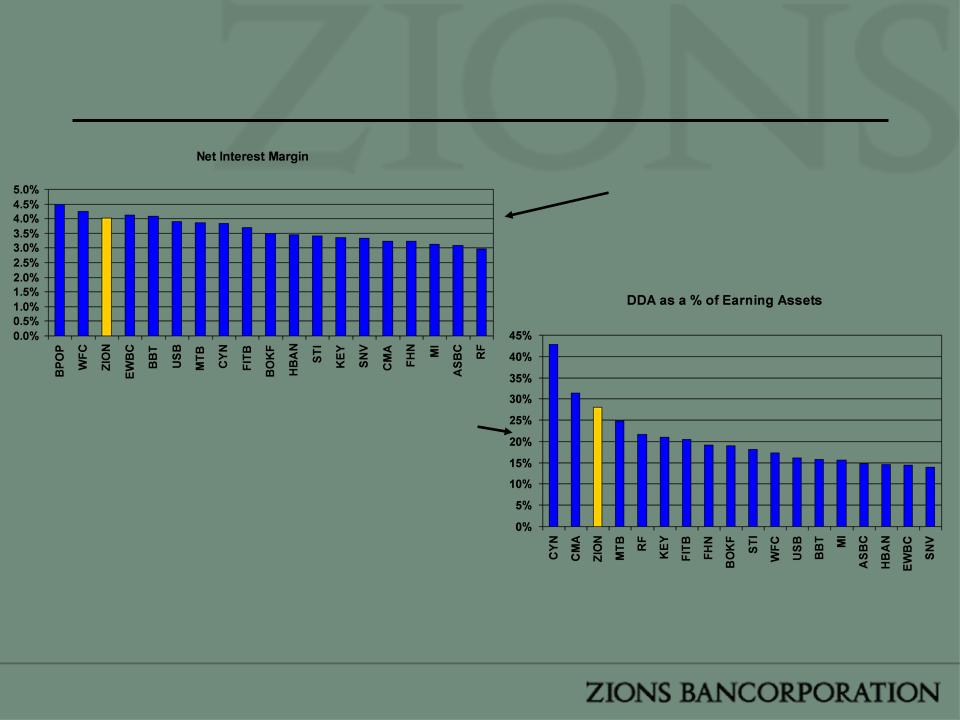
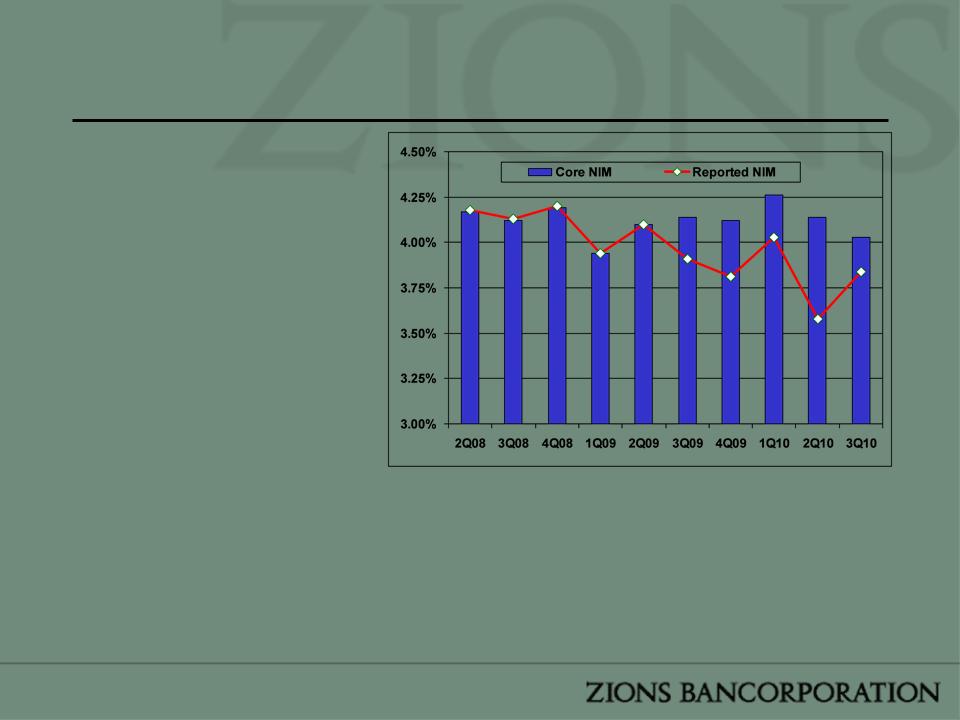
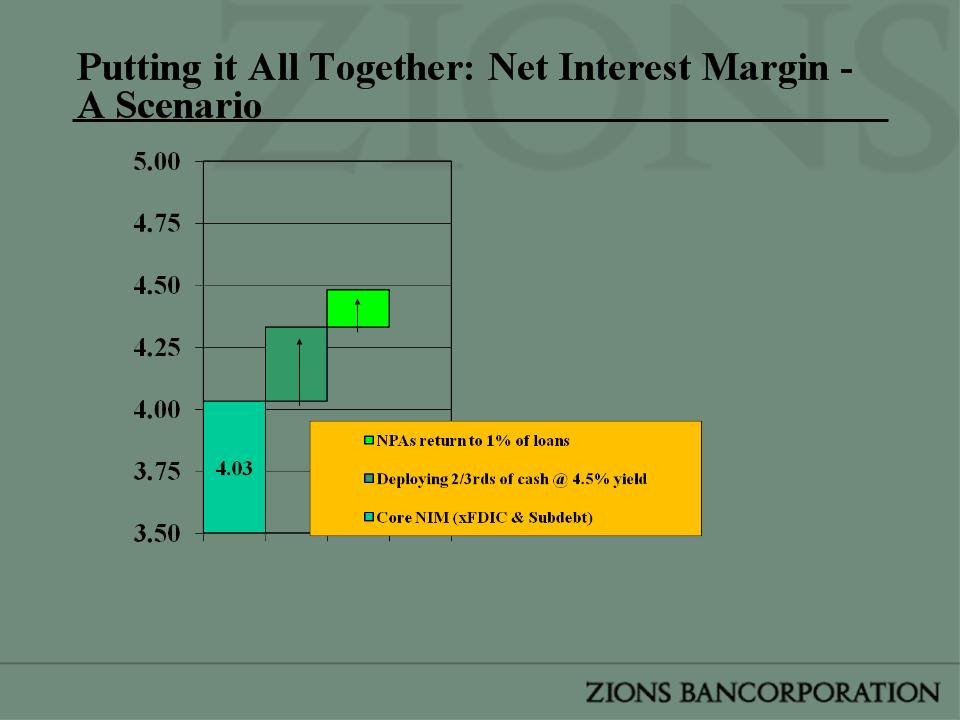
1
November 30, 2010
FBR Capital Markets
2010 Fall Investor Conference
2
Forward-Looking Statements
This presentation contains statements that relate to the projected performance of
Zions Bancorporation and elements of or affecting such performance, including
statements with respect to the beliefs, plans, objectives, goals, guidelines,
expectations, anticipations and estimates of management. These statements
constitute forward-looking information within the meaning of the Private Securities
Litigation Reform Act. Actual facts, determinations, results or achievements may
differ materially from the statements provided in this presentation since such
statements involve significant known and unknown risks and uncertainties.
Factors that might cause such differences include, but are not limited to:
competitive pressures among financial institutions; economic, market and
business conditions, either nationally or locally in areas in which Zions
Bancorporation conducts its operations, being less favorable than expected;
changes in the interest rate environment reducing expected interest margins;
changes in debt, equity and securities markets; adverse legislation or regulatory
changes; and other factors described in Zions Bancorporation’s most recent
annual and quarterly reports. In addition, the statements contained in this
presentation are based on facts and circumstances as understood by management
of the company on the date of this presentation, which may change in the future.
Zions Bancorporation disclaims any obligation to update any statements or to
publicly announce the result of any revisions to any of the forward-looking
statements included herein to reflect future events, developments, determinations
or understandings.
3
Agenda
Overview of Zions Key Performance Drivers –Capital –Credit Quality –Revenue Outlook Summary |
4
A Collection of Great Banks
Asset and deposit balances as of 3Q 2010; Deposit market share as of
2010
2010
5
Multi-Bank Business Model: Competitive
Strengths
Strengths
§ Direct customer access to local decision makers
§ Cross-pollination of ideas between banks
– CEOs & division managers meet frequently to compare best
practices, opportunities, and resolve “intramural” issues
§ Community bank feel - local marketing and branding
§ Superior lending capacity relative to community banks
§ Centralization of processing and other non-customer
facing elements of the business
§ Established market-leading small business lender
– Leading SBA Lender
• Largest SBA portfolio relative to overall size of loan book
– Superior treasury management products & services (Greenwich
survey)
survey)
§ Local “ownership” of market opportunities and
challenges
challenges
6
Small Business Banking:
National Awards:
• Overall Satisfaction
• Relationship Manager Performance
• Financial Stability
• Overall Treasury Management
Regional Awards:
• Overall Satisfaction - West
• Overall Satisfaction - Treasury
Management - West
Management - West
What Others Say About Us
2009 Greenwich Excellence Awards
in Small Business and Middle Market Banking
Middle Market Banking
National Awards:
• Overall Satisfaction
• Personal Banking
• Relationship Manager Performance
• Credit Policy
• Financial Stability
• Overall Treasury Management
• Accuracy of Operations
• Customer Service
• Treasury Product Capabilities
Regional Awards:
• Overall Satisfaction - West
• Overall Satisfaction - Treasury
Management - West
Management - West
7
*Includes FDIC supported assets
Strong Focus on Business Banking - Loan Mix
Loan Portfolio
as of 3Q10
as of 3Q10
§Commercial and
CRE Loans: 80%
CRE Loans: 80%
§Retail & Other
Loans: 20%
Loans: 20%
8
Agenda
Overview of Zions Key Performance Drivers –Capital –Credit Quality –Revenue Outlook Summary |
9
Source: SNL as of 3Q 2010
Note: Peer group includes U.S. regional banks with assets greater than $20 billion and less than $200 billion plus footprint competitors WFC and
USB
USB
10
Tier 1 + Reserves as a Percentage of Risk-Weighted
Assets
Assets
Source: SNL as of 3Q 2010
Note: Peer group includes U.S. regional banks with assets greater than $20 billion and less than $200 billion plus footprint competitors WFC and
USB
USB
11
Basel III New Capital Proposal
B3 estimated capital ratios for Zions assumes elimination of trust preferred securities and other comprehensive income from Tier 1 capital, and
adjusts for deferred tax asset limits.
Tier 1 Common
8.66%
Total RBC
16.54%
Tier 1 RBC
13.97%
7.5%
14.3%
11.8%
7.4%
8.6%
7.0%
10.5%
8.5%
11.1%
12
Agenda
Overview of Zions Key Performance Drivers –Capital –Credit Quality –Revenue Outlook Summary |
13
Credit Quality Trends
*Annualized
Zions excludes FDIC supported assets
Note: Peer group includes U.S. publicly traded regional banks with assets greater than $20 billion and less than $200 billion plus
footprint competitors WFC and USB
Source: SNL
NPAs + Greater than 90
Days Delinquent /
Loans + OREO
Days Delinquent /
Loans + OREO
Net Charge-
offs as a % of
Loans*
offs as a % of
Loans*
14
Note: Peer group includes U.S. publicly traded regional banks with assets greater than $20 billion and less than $200 billion plus footprint
competitors WFC and USB
Source: SNL. Peer data as of 3Q10. Nonaccrual inflows from Form FR Y-9C, schedule HC-N, line M.7.
Nonaccrual Inflows - Percent of Nonaccrual
Loans
Loans
15
Note: Peer group includes U.S. publicly traded regional banks with assets greater than $20 billion and less than $200 billion plus footprint
competitors WFC and USB
Source: SNL YTD 3Q10
Net Charge Offs - By Loan Type
Percentage of
Zions Total Loans
Zions Total Loans
12.6% 10.7% 6.0% 2.8% 21.4% 18.3% 22.5% 5.7%
16
Dollars in
millions
millions
17
Change in CRE Loans Outstanding
From 4Q07 to 3Q10
Note: Approximately 2/5ths of the $2.2 billion increase in CRE Term loans are the result of reclassified Commercial
Construction loans, generally when construction has been completed and the building qualified for a term loan.
$’s in billions
18
Term CRE
Updated LTV Stratification
The MIT Transaction Based Index is a national index that has been applied to Zions’ mostly regional CRE Portfolio
Zions loan data and TBI data as of 3Q10
Percentage of Loans within each bucket that are Non-Accrual | ||||||
2.2% | 1.8% | 3.5% | 3.0% | 8.3% | 5.3% | 5.3% |
• By attaching each loan to
the TBI index as of the
date of the loans last
appraisal we can see an
estimate of the updated
LTV ratios of the portfolio
the TBI index as of the
date of the loans last
appraisal we can see an
estimate of the updated
LTV ratios of the portfolio
19
Agenda
Overview of Zions Key Performance Drivers –Capital –Credit Quality –Revenue Outlook Summary |
20
Core net income excludes items that are one time or non-recurring in nature. Incorporated in the Appendix of this presentation is the detail which
supports our core net income before tax calculations. 2Q09 - 4Q09 included material gains from loan portfolio swaps. Swaps are used to manage
interest rate risk and were generally added near the peak in the rate cycle. As hedges became ineffective, gains were realized.
supports our core net income before tax calculations. 2Q09 - 4Q09 included material gains from loan portfolio swaps. Swaps are used to manage
interest rate risk and were generally added near the peak in the rate cycle. As hedges became ineffective, gains were realized.
Generally Stable Core Pre-Tax, Pre-Credit
Income
Income
21
Net Interest Margin - 3Q10
Peer group includes U.S. publicly traded regional banks with assets greater than $20 billion and less than $200 billion plus footprint competitors WFC
and USB. Peer group not adjusted for accretion of interest income on FDIC acquired loans
Source: SNL as of 3Q 2010
Strong NIM
Driven in part by Strong
Demand Deposits
Demand Deposits
22
Core NIM Trends
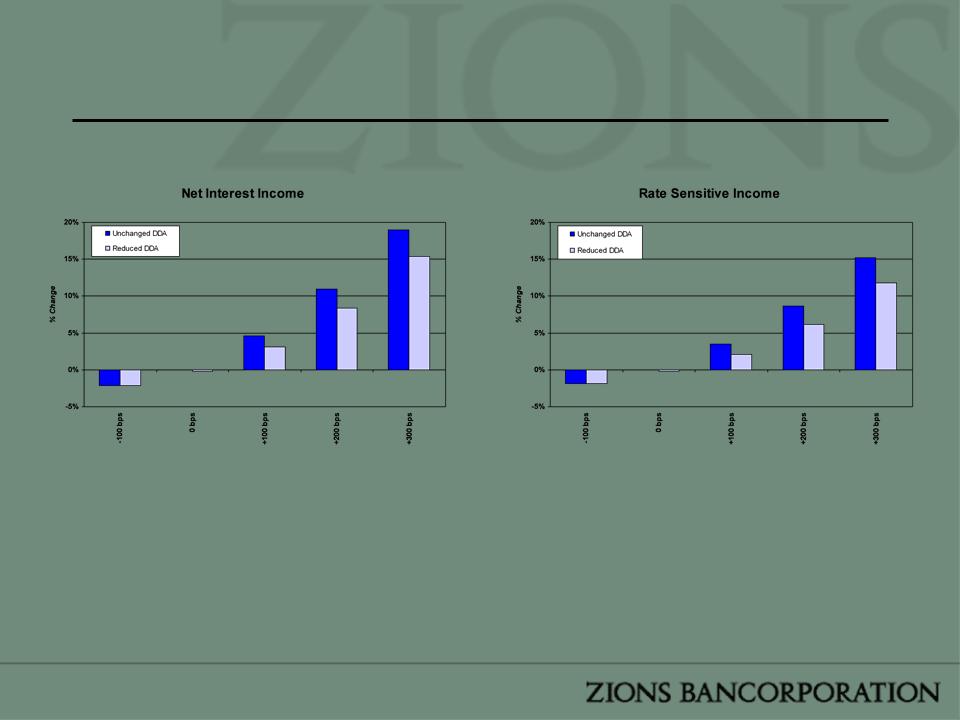
• Zions expects net interest
sensitive income to increase
between an estimated 5.4% and
8.6% if interest rates were to
rise 200 bps*
sensitive income to increase
between an estimated 5.4% and
8.6% if interest rates were to
rise 200 bps*
• Core NIM (excludes discount
accretion) has been generally
stable
accretion) has been generally
stable
– Recent core NIM compression
attributable to a greater drag from
cash balances
attributable to a greater drag from
cash balances
– 1Q09 experienced a temporary dip
partially due to an intentional build
-up of excess liquidity during the
significant turmoil during late
2008/early 2009
partially due to an intentional build
-up of excess liquidity during the
significant turmoil during late
2008/early 2009
– Large senior note issuance in
September 2009 had about 8 bps
adverse impact on the core NIM in
4Q09
September 2009 had about 8 bps
adverse impact on the core NIM in
4Q09
(1) Cash drag refers to the adverse impact on the net interest margin due to the total balance of cash held in interest-bearing accounts. Assumptions
used to compute the cash drag include investing the cash at a rate of 4.5%, similar to the rate achieved on recent loan production. Liquidity targets and
loan demand are factors that may prevent fully deploying such cash; the cash drag is shown for illustrative purposes only.
used to compute the cash drag include investing the cash at a rate of 4.5%, similar to the rate achieved on recent loan production. Liquidity targets and
loan demand are factors that may prevent fully deploying such cash; the cash drag is shown for illustrative purposes only.
*Assumes a parallel shift in the yield curve; key assumptions include a slow and a fast deposit repricing response (i.e. if deposit rates are slow to
increase Zions expects a 7.2% increase in interest sensitive income, and if deposits were to reprice quickly Zions expects a 4.2% increase in interest
sensitive income); sensitivity analysis based on 2Q10 data
increase Zions expects a 7.2% increase in interest sensitive income, and if deposits were to reprice quickly Zions expects a 4.2% increase in interest
sensitive income); sensitivity analysis based on 2Q10 data
Due to the extinguishment/ reissuance of subordinated debt in June 2009, Zions experiences non-cash discount accretion, which increases interest
expense, reducing GAAP NIM
1Q0 9 | 2Q0 9 | 3Q0 9 | 4Q0 9 | 1Q1 0 | 2Q1 0 | 3Q1 0 | ||
Cash Drag (1) | 24 bps | 17 bps | 16 bps | 24 bps | 20 bps | 35 bps | 46 bps |
23
Loans with Floors (as of 6/30/10)
§ The total amount of loans
with floors that are in-the
-money equal
approximately $7.8B
with floors that are in-the
-money equal
approximately $7.8B
§ Weighted average in-the-
money floor: 156 bps
24
Interest Rate Risk Simulation - “Slow
Response”
Response”
§ 12-month simulated impact - a static balance sheet, and is based on regression analysis comparing
deposit repricing changes against similar duration benchmark indices (e.g. Libor, U.S. Treasuries); it also
includes management input across all major geographies in which Zions does business, intended to adjust
for local market conditions(1). Assumes reduction of DDA of approximately $3 billion and a
commensurate reduction in cash balances. Change does not reflect cost savings associated with FDIC
premium expense on a lower asset base.
(1) “Slow Response” refers to an assumption that market rates on deposits will adjust at a moderate rate (i.e. supply of deposits exceeds demand for
loans)
loans)
25
Securities Portfolio Comparison
Source: SNL as of 3Q 2010
MBS securities include residential mortgage pass-through investments that are not guaranteed by the U.S. Government
Takeaway - no material NIM compression risk from
MBS repricing
MBS repricing
26
• Zions’ asset sensitivity
implies a potentially stronger
net interest margin in a
rising rate environment
implies a potentially stronger
net interest margin in a
rising rate environment
• Near term pressure on loan
pricing may adversely affect
the net interest margin
pricing may adversely affect
the net interest margin
27
Loan Growth and Production Trends
(1) Linked quarter change in gross loan balance, excluding construction, land, development and FDIC-supported loans
(2) Loan production includes originations and renewals
28
Agenda
Overview of Zions Key Performance Drivers –Capital –Credit Quality –Revenue Outlook Summary |
29
Near Term Objectives
§ Reduce problem credits
– Continued intense focus on workouts
– On the margin, increase the use of A/B note structure
§ Increase lending activity
– Additional emphasis on government guaranteed lending
programs
programs
– C&I pipelines strengthening in some markets,
particularly small and middle-market enterprises
(SMEs)
particularly small and middle-market enterprises
(SMEs)
§ Reduce excess cash balances
– Use of off-balance sheet sweep accounts for business
checking
checking
– Lower interest rates on non-relationship interest bearing
accounts
accounts
– Marginally increase investments in agency securities
30
Outlook Summary
▼ | Loans | ||
▼ | Nonperforming Assets | ||
▼ | Credit Costs | ||
Est. 3.40% - 3.50% | 4Q10 GAAP Net Interest Margin (Reference: Oct 21 8-K) (1) | ||
◄► | 4Q10 Core Net Interest Margin (1) | ||
◄► | Core Non-interest Expense | ||
◄► | OTTI | ||
◄▲ | Capital Ratios |
1) Accelerated amortization of sub debt discount in 4Q10 (~$73.3 million, or approximately 62 bps
NIM pressure) compared to 3Q10 ($27.5 million, or 23 bps NIM pressure)
Our outlook remains consistent with our earnings conference call and the
subsequent Form 8-k regarding subordinated debt conversion. Directionally, we
expect:
subsequent Form 8-k regarding subordinated debt conversion. Directionally, we
expect:
31
Appendix
32
Asset Sensitivity
§ Fixed-rate loans:
– Approximately one quarter of portfolio
– Duration of about 1.5 years
§ Variable-rate loans:
– Approximately three quarters of portfolio
– Floors on approximately 48% of variable-rate loans
– Swaps: $520 million (Pay Floating, Receive Fixed), down
from $545 million in the prior quarter
33
CDO Portfolio Summary
§ Credit-related OTTI losses in 3Q10: $23.7 million
– The increase in impairment (compared to 2Q10 OTTI of $18.1 million)
is primarily due to assumption changes in prepayment speeds on trust
preferred securities, given the adoption of the Dodd-Frank Act.
is primarily due to assumption changes in prepayment speeds on trust
preferred securities, given the adoption of the Dodd-Frank Act.
– Excluding that change, OTTI would have been approximately $12.1
million.
million.
*Table includes $2.2 billion par value of CDOs that are backed predominantly by bank trust preferred securities. The par value of all Bank &
Insurance backed CDOs is approximately $2.6 billion
34
CDO Stress Testing - OTTI
§Deterioration in PDs % means that the
default curve applied to the performing
collateral of each deal is made worse
by the percentage indicated. Thus a
deal with a default curve of 5%
stressed to a 25% “Deterioration in
PDs %” would have a 6.25% default
probability curve applied to it, a deal
with 20% would go to 25% and so
forth. A “Deterioration in PDs %”
stress of 100% would double the PD
curve being applied to a deal's
collateral.
§Moderate Stress - The PD curve that
was applied to the performing
collateral of each CDO deal in the
pricing run is increased by the %
indicated and the resultant values
were used to estimate OTTI losses.
The Moderate Stress Scenario at
100% would result in approximately
$73 million of pre-tax OTTI losses.
was applied to the performing
collateral of each CDO deal in the
pricing run is increased by the %
indicated and the resultant values
were used to estimate OTTI losses.
The Moderate Stress Scenario at
100% would result in approximately
$73 million of pre-tax OTTI losses.
§Adverse Stress - Incorporates all of
the deterioration of PDs applied to the
performing collateral, but also stresses
the PDs applied to collateral in deferral
by the same deterioration
percentages. PDs on deferring
collateral are used to estimate the
value of the potential for this collateral
to cure in the future through recovery
or re-performance.
§Extreme Stress - This is a very
severe stress scenario that uses the
“Moderate Stress” assumptions for
performing collateral, but also
immediately defaults all deferring
collateral instantly with no recovery
and no probability to re-perform in the
future.
severe stress scenario that uses the
“Moderate Stress” assumptions for
performing collateral, but also
immediately defaults all deferring
collateral instantly with no recovery
and no probability to re-perform in the
future.
35
CDO Stress Testing - Capital
§ Under various stress
scenarios, Zions’
modeling indicates
that OCI
(accumulated other
comprehensive
income) would
erode, although at a
significantly lower
amount than OTTI
(other than
temporary
impairment).
scenarios, Zions’
modeling indicates
that OCI
(accumulated other
comprehensive
income) would
erode, although at a
significantly lower
amount than OTTI
(other than
temporary
impairment).
§ Under the moderate
stress scenario at
100% greater PDs,
OTTI incurred would
be approximately $73
million pre-tax (see
previous slide).
Under that same
moderate stress
scenario at 100%
greater PDs, OCI
would only
deteriorate by
approximately $30
million after-tax.
stress scenario at
100% greater PDs,
OTTI incurred would
be approximately $73
million pre-tax (see
previous slide).
Under that same
moderate stress
scenario at 100%
greater PDs, OCI
would only
deteriorate by
approximately $30
million after-tax.
36
As of 10-28-10
37
Core Net Income Before Tax Detail
38
November 30, 2010