
May 2015 Zions Bancorporation Second Quarter Update

Forward-Looking Statements & Peer Group Abbreviations This presentation contains statements that relate to the projected or modeled performance or condition of Zions Bancorporation and elements of or affecting such performance or condition, including statements with respect to forecasts, opportunities, models, illustrations, scenarios, beliefs, plans, objectives, goals, guidance, expectations, anticipations or estimates, and similar matters. These statements constitute forward-looking information within the meaning of the Private Securities Litigation Reform Act. Actual facts, determinations, results or achievements may differ materially from the statements provided in this presentation since such statements involve significant known and unknown risks and uncertainties. Factors that might cause such differences include, but are not limited to: competitive pressures among financial institutions; economic, market and business conditions, either nationally, internationally, or locally in areas in which Zions Bancorporation conducts its operations, being less favorable than expected; changes in the interest rate environment reducing expected interest margins; changes in debt, equity and securities markets; adverse legislation or regulatory changes; Federal Reserve reviews of our annual capital plan; and other factors described in Zions Bancorporation’s most recent annual and quarterly reports. In addition, the statements contained in this presentation are based on facts and circumstances as understood by management of the company on the date of this presentation, which may change in the future. Except as required by law, Zions Bancorporation disclaims any obligation to update any statements or to publicly announce the result of any revisions to any of the forward-looking statements included herein to reflect future events, developments, determinations or understandings. 2 BAC: Bank of America Corporation BBT: BB&T Corporation CMA: Comerica Incorporated C: Citigroup Inc. FITB: Fifth Third Bancorp HBAN: Huntington Bancshares Incorporated JPM: JPMorgan Chase & Co. KEY: KeyCorp MTB: M&T Bank Corporation PNC: PNC Financial Services Group, Inc. RF: Regions Financial Corporation STI: SunTrust Banks, Inc. UB: UnionBanCal Corporation USB: U.S. Bancorp WFC: Wells Fargo & Company ZION: Zions Bancorporation

Bank Headquarters Assets % of Total Zions Bank Salt Lake City $19B 33% Amegy Houston $14B 24% CB&T San Diego $12B 20% NBA Phoenix $5B 9% NSB Las Vegas $4B 7% Vectra Denver $3B 5% Commerce Bank - WA/OR Seattle $1B 2% Zions Bancorporation Salt Lake City $58B 100% Superior lending capacity relative to community banks Superior local customer access to bank decision makers relative to big nationals Centralization of some processing and other non-customer facing elements of the business to achieve efficiencies Strategic local “ownership” of market opportunities and challenges A Collection of Great Banks More than 75% of Assets in Utah / Texas / Coastal California 3 Subsidiary information as of 1Q15

Strengths: Superior Footprint Superior Reputation Strong Capital Strong Credit Quality Strong Liquidity Superior Deposit Franchise Strong NIM Well-Positioned for Rising Rates Leader in Small Business Lending Risk Management Framework Opportunities for Improvement: Efficiency (Expense/Revenue) ratio Return on Assets / Equity Fee Income Penetration and Diversification Loan Growth Key Takeaway: Action plans are already in progress which are designed to substantially enhance and improve areas that are currently underperforming Self Assessment: Strengths & Opportunities for Improvement 4
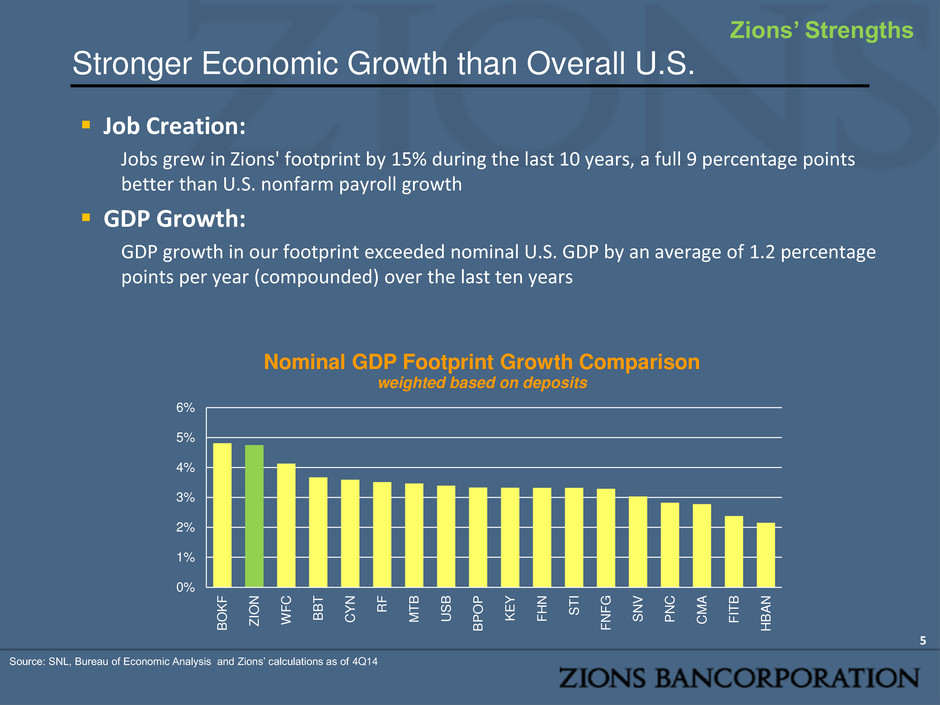
Job Creation: Jobs grew in Zions' footprint by 15% during the last 10 years, a full 9 percentage points better than U.S. nonfarm payroll growth GDP Growth: GDP growth in our footprint exceeded nominal U.S. GDP by an average of 1.2 percentage points per year (compounded) over the last ten years Stronger Economic Growth than Overall U.S. 5 Source: SNL, Bureau of Economic Analysis and Zions’ calculations as of 4Q14 0% 1% 2% 3% 4% 5% 6% B O K F Z IO N W F C B B T C Y N R F MT B U S B B P O P K E Y F H N S T I F N F G S N V P N C C M A F IT B H B A N Nominal GDP Footprint Growth Comparison weighted based on deposits Zions’ Strengths

Awards: Nationally Recognized for Excellence • Twenty Four (24) Greenwich Excellence Awards in Small Business and Middle Market Banking (2014) • Including: Excellence: Overall Satisfaction Excellence: Likelihood to Recommend Excellence: Treasury Management Excellence: Financial Stability Zions is one of only four (4) U.S. banks that have been consistently awarded more than 10 Excellence awards since 2009, when the first survey was conducted. • Nationally Ranked in the Top 10 in Small Business Loan production 1 • Top team of women bankers – American Banker2 • Amegy Bank Named Ex-Im Bank Small Business Lender of the Year3 6 1. Volume and number of loans, SBA fiscal year ended September 30, 2013 2. One of five winning teams, 2014, Zions Bank 3. exim.gov, April 24, 2014 Zions’ Strengths
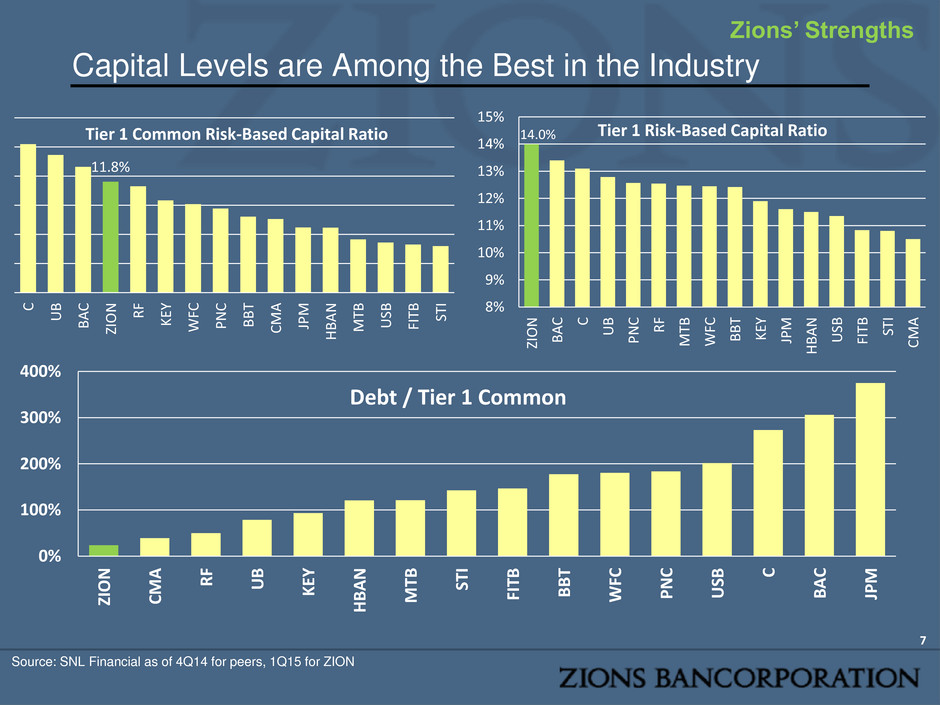
Capital Levels are Among the Best in the Industry Source: SNL Financial as of 4Q14 for peers, 1Q15 for ZION 7 11.8% C U B B A C ZIO N R F KE Y WF C P N C B B T CM A JP M H B A N M TB US B FIT B ST I Tier 1 Common Risk-Based Capital Ratio 14.0% 8% 9% 10% 11% 12% 13% 14% 15% ZIO N B A C C U B P N C R F M TB WF C B B T KE Y JP M H B A N US B FIT B ST I CM A Tier 1 Risk-Based Capital Ratio 0% 100% 200% 300% 400% ZIO N CM A R F U B KE Y H B A N MT B ST I FI TB B B T W FC PN C U SB C B A C JP M Debt / Tier 1 Common Zions’ Strengths

Zions’ Credit Quality Metrics are Strong 8 Source: SNL Financial as of 4Q14 for peers, 1Q15 for ZION; trailing 12 months net charge-offs used in the allowance / loan chart 0.0% 0.5% 1.0% 1.5% 2.0% U B C M A ZIO N M TB K EY P N C H B A N ST I WF C R F B B T B A C U SB FI TB JP M C Last 12 Month Net Charge-Offs As a percentage of loans 0.0% 0.5% 1.0% 1.5% 2.0% 2.5% 3.0% C JP M ZIO N US B P N C FI TB B A C R F WF C ST I M TB K EY H B A N C M A B B T U B Total Allowance for Credit Losses/ Loans Net Charge-Offs Allowance for Credit Losses / Loans Zions’ Strengths 0% 1% 2% 3% 4% 5% 6% M TB U B CM A ZIO N ST I P N C B B T KE Y US B H B A N R F WF C FIT B B A C JP M C Annualized Average NCO Rate of Overall Portfolio, 1990-2013
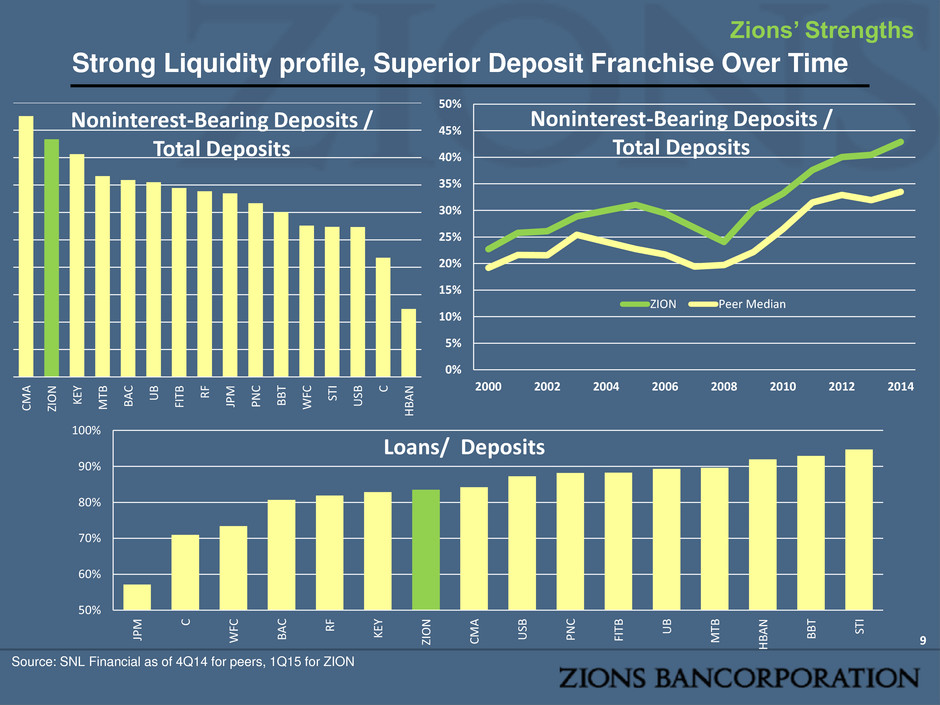
Strong Liquidity profile, Superior Deposit Franchise Over Time 9 Zions’ Strengths 0% 5% 10% 15% 20% 25% 30% 35% 40% 45% 50% 2000 2002 2004 2006 2008 2010 2012 2014 Noninterest-Bearing Deposits / Total Deposits ZION Peer Median C M A ZI O N K EY M TB B A C U B FI TB R F JP M P N C B B T WF C ST I U SB C H BA N Noninterest-Bearing Deposits / Total Deposits Source: SNL Financial as of 4Q14 for peers, 1Q15 for ZION 50% 60% 70% 80% 90% 100% JP M C WF C B A C R F K EY ZIO N C M A U SB P N C FI TB U B M TB H BA N B B T ST I Loans/ Deposits
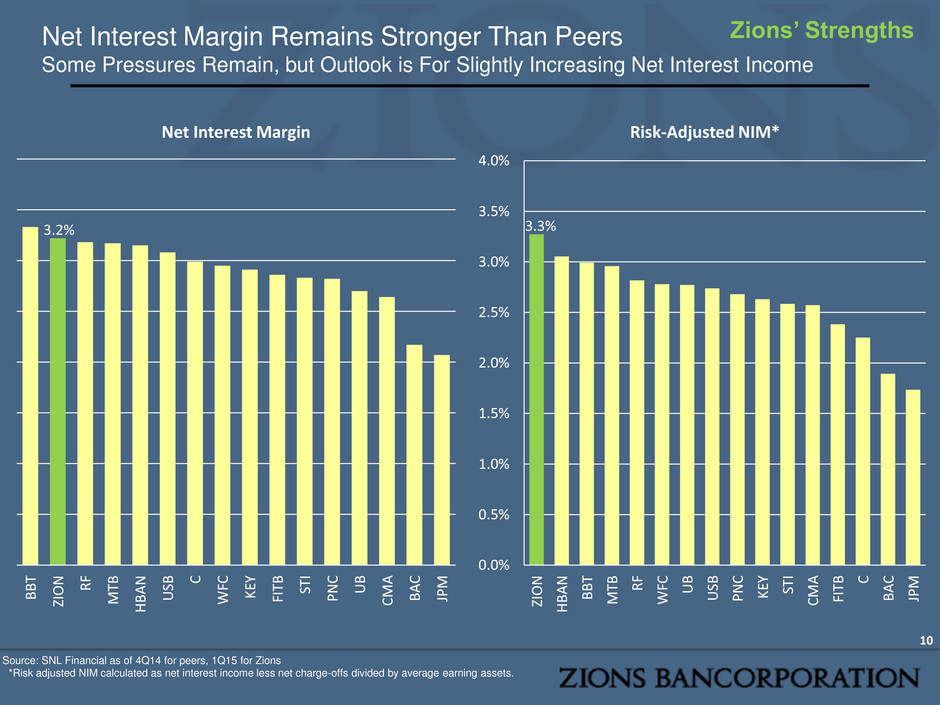
Source: SNL Financial as of 4Q14 for peers, 1Q15 for Zions *Risk adjusted NIM calculated as net interest income less net charge-offs divided by average earning assets. Net Interest Margin Remains Stronger Than Peers Some Pressures Remain, but Outlook is For Slightly Increasing Net Interest Income 10 3.3% 0.0% 0.5% 1.0% 1.5% 2.0% 2.5% 3.0% 3.5% 4.0% ZIO N H B A N B B T M TB R F WF C U B US B P N C KE Y ST I CM A FIT B C B A C JP M Risk-Adjusted NIM* 3.2% B B T ZIO N R F M TB H B A N US B C WF C KE Y FIT B ST I P N C U B CM A B A C JP M Net Interest Margin Zions’ Strengths

-5% 0% 5% 10% 15% 20% 25% - 100 bps 0 bps +100 bps +200 bpsC h an ge in N e t In terest In co m e Net Interest Income Sensitivity NII Slow NII Fast Balance Sheet Remains Asset Sensitive Zions is Positioned for Economic Recovery and Rising Rates 11 Zions estimates net interest income would increase between an estimated 14% and 20% if interest rates were to rise 200 bps* in the first year. * 12-month simulated impact using a static size balance sheet and a parallel shift in the federal funds rate and benchmark yield curves (i.e. US Treasuries and Libor/Libor swaps). “Slow Response” refers to an assumption that market rates on deposits will adjust at a more moderate rate (i.e. migration from DDA to interest-bearing deposits) than under the Fast scenario. Zions’ Asset-Liability Committee adopted a new interest rate risk model (shown here) in 1Q15, and therefore historical disclosures are not directly comparable. Effective duration has units of percentages, and estimates the change in value of a financial asset or liability relative to an incremental 100 bp change in interest rates. Effective duration is loosely comparable to Macaulay duration, which has units in years of cash flow. Data as of 1Q15 Repricing Scenario Assumptions by Deposit Product (as of 3/31/15) Effective Duration (Base) FAST SLOW Unch’d +200 bps Unch’d +200 bps Demand Deposits 2.2% 1.3% 2.7% 1.9% Money Market 1.4% 1.2% 1.8% 1.6% Savings & Int. on Checking 2.7% 1.9% 3.2% 2.7% Zions’ Strengths

$0 $5,000,000 $10,000,000 $15,000,000 $20,000,000 $25,000,000 $30,000,000 W FC B A C JP M US B B B T P N C ZIO N M TB R F C ST I H B A N FIT B KE Y CM A U B Commercial Loans Sized $100k - $1M Zions Punches Above Its Weight in Small Business Lending 12 Source: Call report data via SNL Financial, as of 1Q15 (In Thousands) 0% 5% 10% 15% 20% 25% ZIO N B B T H B A N R F M TB US B W FC JP M KE Y B A C P N C ST I CM A FIT B C U B Commercial Loans $100k-$1M, As a percent of total commercial loans Zions’ Strengths

• Risk Management • Complete overhaul of risk management infrastructure since 2009 • Exhaustive review and enhancement of policies / procedures • Complete overhaul of organization structure and staffing levels • Risk Profile • Construction & Land Development loan concentration significantly reduced • High-risk securities: Bank & Thrift CDOs reduced by 72%1, Additional Sales Possible in 2015 • Government Agency MBS purchases may reduce common stock volatility associated with Fed monetary policy changes • Risk Governance • Four new board members added to further enhance risk management • CCAR / Stress Testing: fully implemented in three years from minimal infrastructure 13 Significant Change to Risk Profile May Not Be Reflected in Stock Zions’ Strengths 1 Par value of CDO securities, relative to 3/31/2013 balance
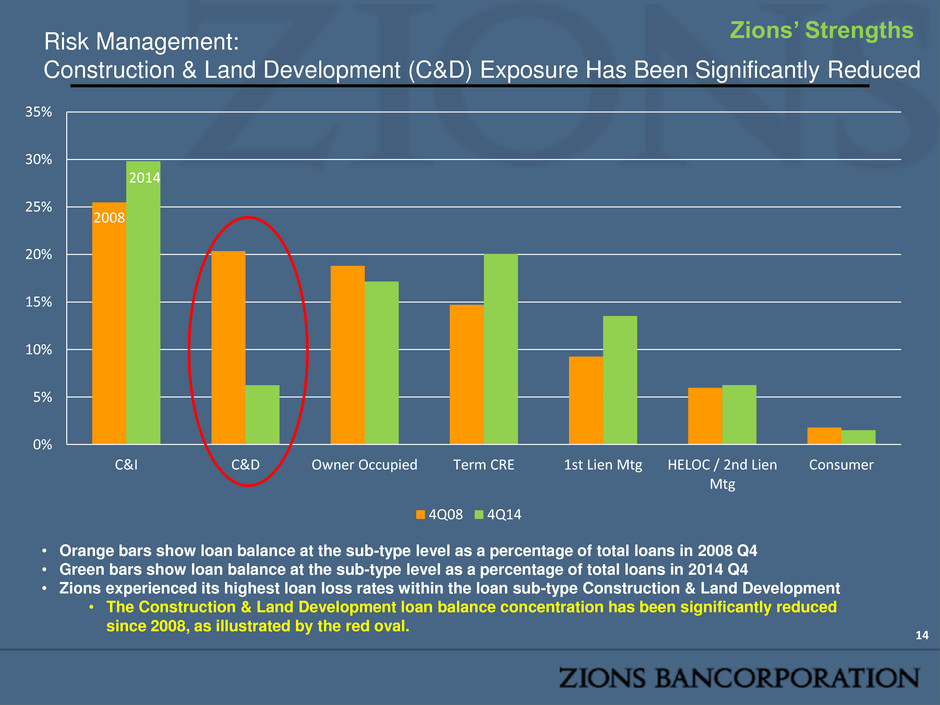
2008 2014 0% 5% 10% 15% 20% 25% 30% 35% C&I C&D Owner Occupied Term CRE 1st Lien Mtg HELOC / 2nd Lien Mtg Consumer 4Q08 4Q14 Risk Management: Construction & Land Development (C&D) Exposure Has Been Significantly Reduced 14 • Orange bars show loan balance at the sub-type level as a percentage of total loans in 2008 Q4 • Green bars show loan balance at the sub-type level as a percentage of total loans in 2014 Q4 • Zions experienced its highest loan loss rates within the loan sub-type Construction & Land Development • The Construction & Land Development loan balance concentration has been significantly reduced since 2008, as illustrated by the red oval. Zions’ Strengths
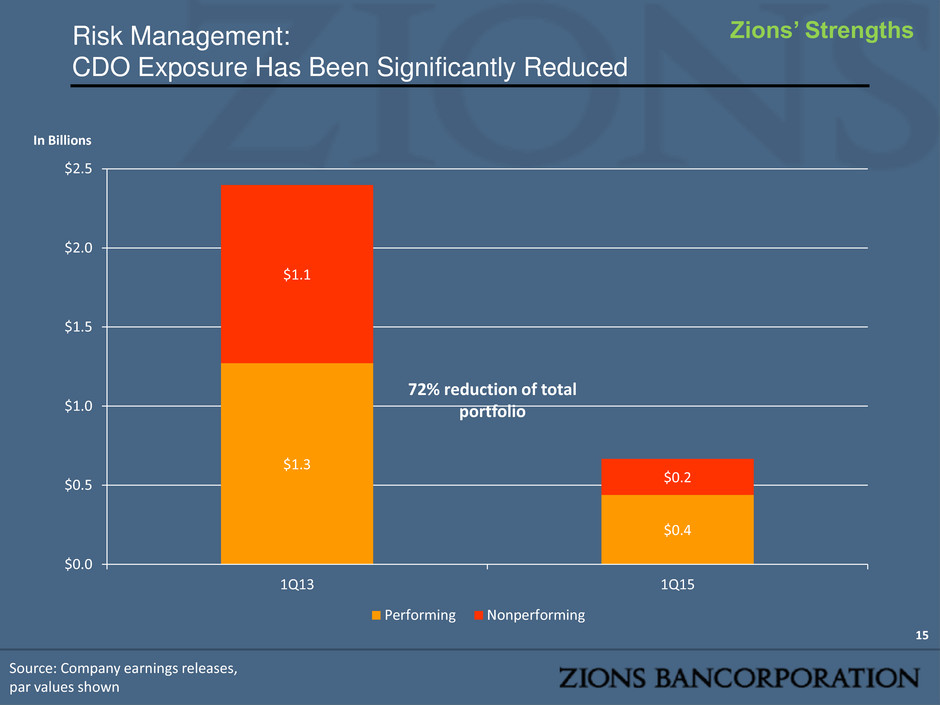
Risk Management: CDO Exposure Has Been Significantly Reduced 15 In Billions Source: Company earnings releases, par values shown $1.3 $0.4 $1.1 $0.2 $0.0 $0.5 $1.0 $1.5 $2.0 $2.5 1Q13 1Q15 Performing Nonperforming 72% reduction of total portfolio Zions’ Strengths

Noninterest Expense / Efficiency Efficiency ratio is soft relative to peers, partly a function of asset sensitivity positioning 16 Source: SNL Financial as of 1Q15 40% 50% 60% 70% 80% US B C B B T WF C FIT B JP M M TB P N C H B A N ST I CM A R F KE Y U B ZIO N B A C Efficiency Ratio 0.0% 0.5% 1.0% 1.5% 2.0% 2.5% 3.0% 3.5% CM A H B A N ZIO N U B ST I FIT B M TB US B R F KE Y P N C B B T WF C JP M C B A C Noninterest Expense / (Loans + Deposits) Zions’ Opportunities
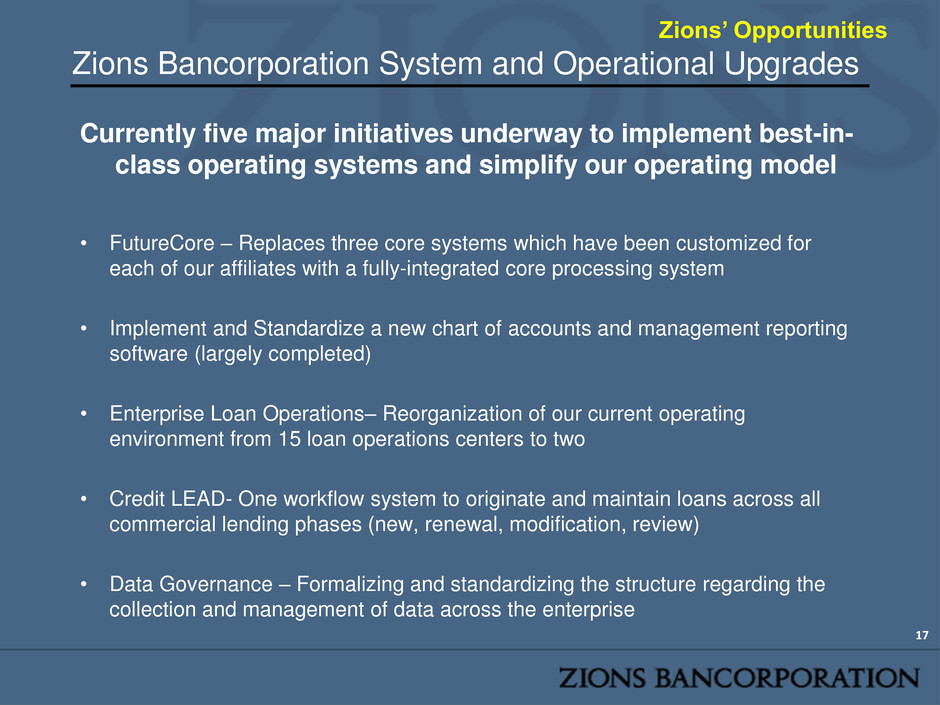
Zions Bancorporation System and Operational Upgrades Currently five major initiatives underway to implement best-in- class operating systems and simplify our operating model • FutureCore – Replaces three core systems which have been customized for each of our affiliates with a fully-integrated core processing system • Implement and Standardize a new chart of accounts and management reporting software (largely completed) • Enterprise Loan Operations– Reorganization of our current operating environment from 15 loan operations centers to two • Credit LEAD- One workflow system to originate and maintain loans across all commercial lending phases (new, renewal, modification, review) • Data Governance – Formalizing and standardizing the structure regarding the collection and management of data across the enterprise 17 Zions’ Opportunities

Systems Upgrade Overview-- FutureCore • FutureCore is a program initiated by Zions Bancorporation to replace its core operating systems into a single application • Zions managed, but 3rd party oversight reports directly to the board 18 batch batch online batch batch batch batch batch batch batch batch batch batch batch batch batch batch & online batch batch batch batch batch batch batch & online batch RCIF (Customer Information) Account Analysis Address Standardization (Code-1) Data Warehouse Norkom AML Kiting Inbound Returns (IRX) General Ledger Exceptions Express Retirement Reporting Relationship Pricing Overdraft Review (ORS) Statements, Notices & Forms Transaction Gateway batch batch batch batch & online batch & online batch & online batch & online batch & online batch batch & online batch batch & online batch batch & online batch & online batch & online batch & online Affinity Reporting Amegy Mortgage Bankcard (FDR) Chargeoffs Cash Management Combined Statements Collections ESB Web Services Card Management (Trans24) Fraudlink On-us Fraudlink Deposit Batch & Online batch & online batch & online batch batch batch batch batch Batch batch & online Batch online Flooring Leasing Mortgage Loans Internet Banking OFAC Vector 11 Safebox Zeus Service Desktop Wiresbatchbatch online online Online batch batch batch batch & online Settlement Manager batch Large Cash Reporting batch Tax Reportingbatch Voice Response Interface Details MICR batch Deposits (Checking, Savings, Money Market, OD Credit Lines) Account Recon Credit Bureaus FDIC Failed Bank ERD/ FAX ATM Mini Statements Click Tactics Dreyfuss sub-accounting Controlled Disbursements Microlink Banklink Metavante Risk Management Reg E Provider Pay Vector 3000 Finesort Treasury Internet Banking batch batch batch & online batch batch batch batch batch & online batch batch batch batch & online batch batch batch & online batch batch batch batch batch batch batch batch batch batch & online batch batch batch & online batch batch batch batch & online batch batch Consumer Loan Origination (APPRO) Collateral File Float Pricing online batch batch & online batch batch batch batch Interf c Details Time (CD’s & IRA’s) Esigna Frontier Harland Clark BaRT Retail Services NBA Amegy ACH Hart Hanks batch batch batch batch batch batch batch batch & online batch batch batch batch batch online batch batch batch batch batch batch online batch & online Interfac Details batch Base24 ATM/POS ACLS (Consumer Loans) batch & online batch batch batch batch batch batch batch batch batch batch MDM Risk Grade batch batch Patriot Officer Bar Code System Debt Cancellation Imaging Premier Insurance Tickler PMP (Experian) Payment Coupon Vendor batch batch batch batch & online Interface De il Shaw CL (Commercial Loans) batch & online batch & online batch batch batch batch batch batch batch & online batch batch Bloomberg (rate updates) batch batch batch Interface Details Online Online Online CLCS (Construction Loans) Interface Details Batch batch Dunn & Bradstreet batch batch batch batch batch Affiliate Banks Batch Common Integration Services Layer Account AnalysisAddress Standardization (Code-1) Data Warehouse Norkom AML Kiting General Ledger Retirement Reporting Statements, Notices & Formsbatch batch batch & online batch & online batch batch batch & online batch & online Affinity Reporting Amegy Mortgage Bankcard (FDR) Chargeoffs Cash Management Combined Statements Collections ESB Web Services Card Management (Trans24) Fraudlink On-us Fraudlink Deposit batch & online batch & online batch & online batch batch batch batch batch batch & online batch online Flooring Leasing Mortgage Loans Internet Banking OFAC Vector 11 Safebox Zeus Service DesktopWires batchbatch online online online batch batch batch batch batch & online Settlement Manag r batch Large Cash Reporting batch Tax Reporting batch Voice Resp se MICR batch Account ReconCredit Bureaus FDIC Failed Bank ERD/ FAX ATM Mini- Statements Click Tactics Dreyfuss sub-accounting Controlled Disbursements Microlink Banklink Metavante Risk Management Reg E Provider P y Vector 3000 Finesort Treasury Internet Banking batch batch batch batch batch batch & online batch batch batch batch & online batch batch batch batch Consumer Loan Origination (APPRO) Collateral File Float Pricing batch batch Esigna Frontier Harland Clark Retail Services NBA Amegy ACH Hart Hanks batch batch batch batch batch Base24 ATM/POS batch batch batch MDM Risk Grade batch Patriot Officer Bar Code System Debt Cancellation Imaging Premier Insurance Tickler PMP (Experian) Payment Coupon Vendor batch batch batch batch Bloom erg (rate updates) online batch batch Dunn & Bradstreet batch batch batch batch batch Affiliate Banks batch Integrated Core (CIF, Deposits, Loans) t rfa Detailsbatch Commercial Loan Origination (Capital Stream) batch Current State Future State Zions’ Opportunities
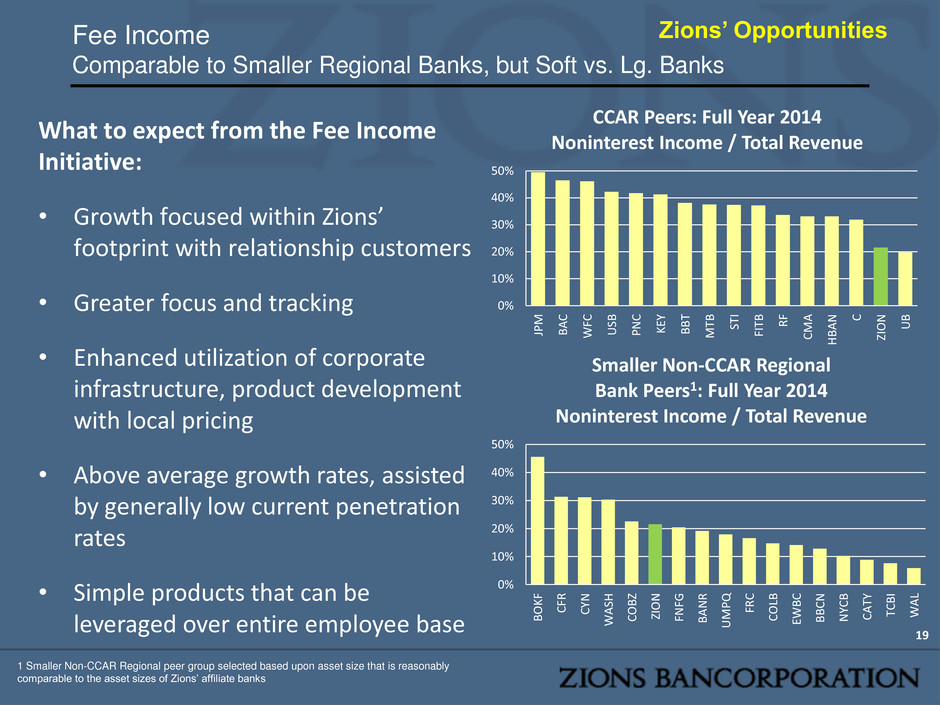
Fee Income Comparable to Smaller Regional Banks, but Soft vs. Lg. Banks 19 What to expect from the Fee Income Initiative: • Growth focused within Zions’ footprint with relationship customers • Greater focus and tracking • Enhanced utilization of corporate infrastructure, product development with local pricing • Above average growth rates, assisted by generally low current penetration rates • Simple products that can be leveraged over entire employee base Zions’ Opportunities 0% 10% 20% 30% 40% 50% JP M B A C WF C U SB P N C K EY B B T M TB ST I FI TB R F C M A H BA N C ZI O N U B CCAR Peers: Full Year 2014 Noninterest Income / Total Revenue 0% 10% 20% 30% 40% 50% B O K F C FR C YN WA SH C O B Z ZIO N FN FG B A N R U M P Q FR C C O LB EWB C B B C N N YC B C A TY TC B I WA L Smaller Non-CCAR Regional Bank Peers1: Full Year 2014 Noninterest Income / Total Revenue 1 Smaller Non-CCAR Regional peer group selected based upon asset size that is reasonably comparable to the asset sizes of Zions’ affiliate banks

Efficiency Ratio Waterfall – What If Scenario 20 74% 68% 55% 60% 65% 70% 75% 1Q15 Actua l N o rm al iza ti o n : Se cu ritie s G ai n s, FD IC -Su p p o rte d Lo an s Te ch n o lo gy P ro jec t B u ild o u t C o st Ad d $ 5 B M B S Im p ac t o f h ig h c o st d eb t Adj u ste d Ef fi ci e n cy R at io Adjusted Efficiency Ratio • Normalization adjustment eliminates gains / losses on securities and similar investments and income from FDIC-supported loans. • Tech projects adjustment reflects only the incremental cost to upgrade systems, and does not reflect potential cost savings from full implementation. • MBS investment is not a forecast, but is designed to show what Zions would look like if its MBS portfolio size and yield was more consistent with peers Zions’ Opportunities Note: Interest rate sensitivity not reflected in the above waterfall chart; yield on MBS derived from CCAR peer group median and is not reflective of yields of MBS that Zions may purchase.

Profitability Historical Improvement driven primarily by capital actions; expected improvement likely driven by positive operating leverage 21 Source: SNL Financial *Adjusted ROAA and ROTCE for ZION excludes gains/losses on securities, debt extinguishment and preferred stock redemption cost, and reserve release, which is defined as provision for credit losses net of NCOs. Peers include the CCAR peers, as reported (unadjusted for any non-core / nonrecurring items) Zions’ Opportunities 0.0% 0.2% 0.4% 0.6% 0.8% 1.0% 1Q13 2Q13 3Q13 4Q13 1Q14 2Q14 3Q14 4Q14 1Q15 Adjusted ROAA, Annualized ZION Peer Median 0% 2% 4% 6% 8% 10% 12% 1Q13 2Q13 3Q13 4Q13 1Q14 2Q14 3Q14 4Q14 1Q15 Adjusted ROTCE, Annualized ZION Peer Median
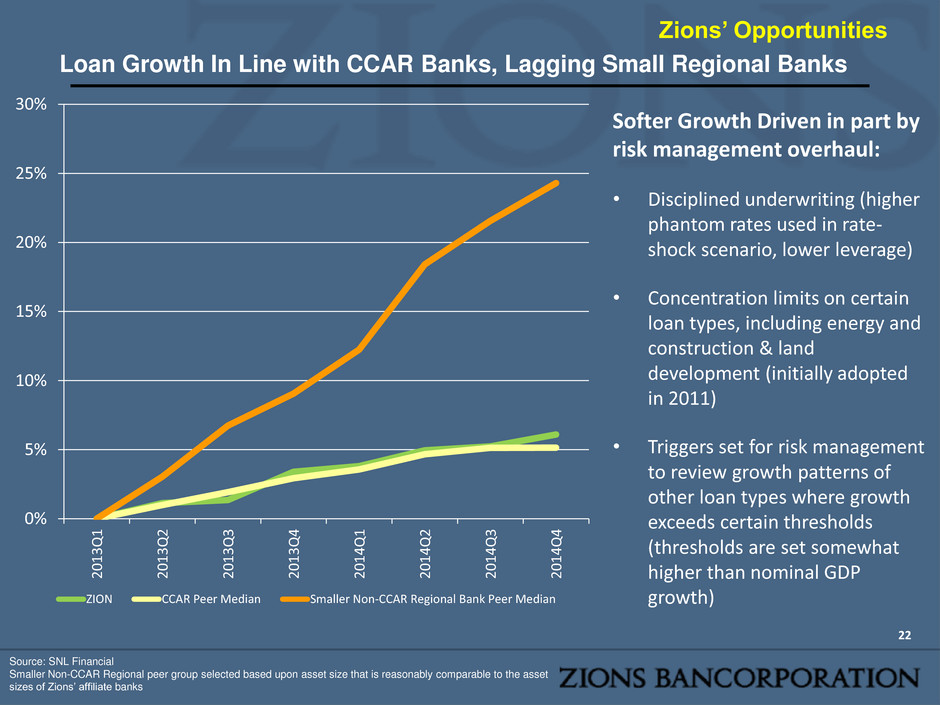
Loan Growth In Line with CCAR Banks, Lagging Small Regional Banks 22 Source: SNL Financial Smaller Non-CCAR Regional peer group selected based upon asset size that is reasonably comparable to the asset sizes of Zions’ affiliate banks Softer Growth Driven in part by risk management overhaul: • Disciplined underwriting (higher phantom rates used in rate- shock scenario, lower leverage) • Concentration limits on certain loan types, including energy and construction & land development (initially adopted in 2011) • Triggers set for risk management to review growth patterns of other loan types where growth exceeds certain thresholds (thresholds are set somewhat higher than nominal GDP growth) Zions’ Opportunities 0% 5% 10% 15% 20% 25% 30% 2 0 1 3 Q 1 2 0 1 3 Q 2 2 0 1 3 Q 3 2 0 1 3 Q 4 2 0 1 4 Q 1 2 0 1 4 Q 2 2 0 1 4 Q 3 2 0 1 4 Q 4 ZION CCAR Peer Median Smaller Non-CCAR Regional Bank Peer Median

Loan Growth By Geography and Type Growth Has Been Strongest in Texas, and in Residential Mortgage & C&I 23 Source: Company documents; VBC = Vectra Bank Colorado; NSB = Nevada State Bank; NBA = National Bank of Arizona; CBT = California Bank & Trust; Amegy = Amegy Bank (Texas); ZFNB = Zions Bank (UT/ID/WY); NRE = National Real Estate Group, a division of Zions Bank that focuses on small business loans generally underwritten using SBA 504 guidelines. Zions’ Opportunities -10% -5% 0% 5% 10% 15% 20% 1Q13 2Q13 3Q13 4Q13 1Q14 2Q14 3Q14 4Q14 1Q15 Bancorp VBC NSB NBA CBT Amegy ZFNB ZFNB ex. NRE 1Q13 2Q13 3Q13 4Q13 1Q14 2Q14 3Q14 4Q14 1Q15 C&I Owner Occupied Term 1-4 Family C&D Total

Capital Return Opportunities 24 Source: SNL Financial *UB not included as it is not a publically traded company Strong Capital Levels, but Limited Return of Capital: • Low 5.1% Tier 1 Common result on 2014 DFAST from Federal Reserve vs. Zions’ modeled 8.6%. • Further enhancement to post- stress capital ratios may be achieved through sale of certain securities, retained earnings, MBS purchases, and redemption of high-cost debt / preferred equity • With strong nominal capital levels, significant levels of capital returns should be possible as earnings normalize and CCAR results strengthen Zions’ Opportunities 0% 10% 20% 30% 40% 50% 60% 70% 80% 90% H BA N K EY B A C FI TB WF C U SB C M A P N C JP M ST I R F M TB B B T C ZI O N Dividends Paid & Common Stock Buyback as a percent of Earnings (FY 2014)

One-Year Outlook Summary Relative to 1Q15 Results Topic Outlook Comment Loan Balances Slightly to Moderately Increasing • Prepayments remain volatile, making net loan growth difficult to forecast • Line utilization rates likely to increase on energy portfolio, generally due to reducing commitments. Net Interest Income Slightly Increasing • Driven by loan growth, MBS purchases, and debt reduction late in 2H15 • Partially offset by modest yield compression on loans • Deploying ~$2 billion annually of cash into short-to- medium duration (~3.5 years), HQLA-qualifying agency MBS Provisions Positive • On average, provisions likely to be modestly positive, reflecting net charge-offs, loan growth, and expected downgrades of energy-related loans Fee Income Increasing • Fee income initiatives likely to result in moderate increase, excluding securities gains/losses Noninterest Expense Stable • We expect NIE of approximately $1.6 billion annually • Elevated spending on technology systems overhaul to continue, although substantially embedded in 1Q15 run- rate. 25

Appendix 26 • Energy Lending • CDO tables • High-Cost Debt Redemption Actions Taken

Energy Loan Portfolio 27 Key Takeaways • $3.2 billion of outstanding balances at March 31, 2015 • 8% of total loans • Diversified portfolio, primarily upstream / midstream / services (see slide 28) • No junior or second liens • Very modest growth in 2014. Growth constrained due to: • Internal concentration limits • Conservative underwriting • Underwriting of upstream includes numerous risk mitigants (see slide 31) • Underwriting of Energy Service portfolio includes low leverage and strong, stable equity sponsors (see slide 32) • Balanced production between oil and gas • Substantial hedging used by borrowers • Internal sensitivity analysis uses prices of mid-$50s for 8 quarters • Less than 1% peak annual energy loan losses in the wake of the last large energy commodity price decline Source: Company Documents

Segmentation of Energy Portfolio 03/31/15 28 Source: Company Documents Oil Gas Upstream 34% Midstream 21% Downstream 4% Other 2% Oilfield Services 30% Energy Services Manufacturing 9%
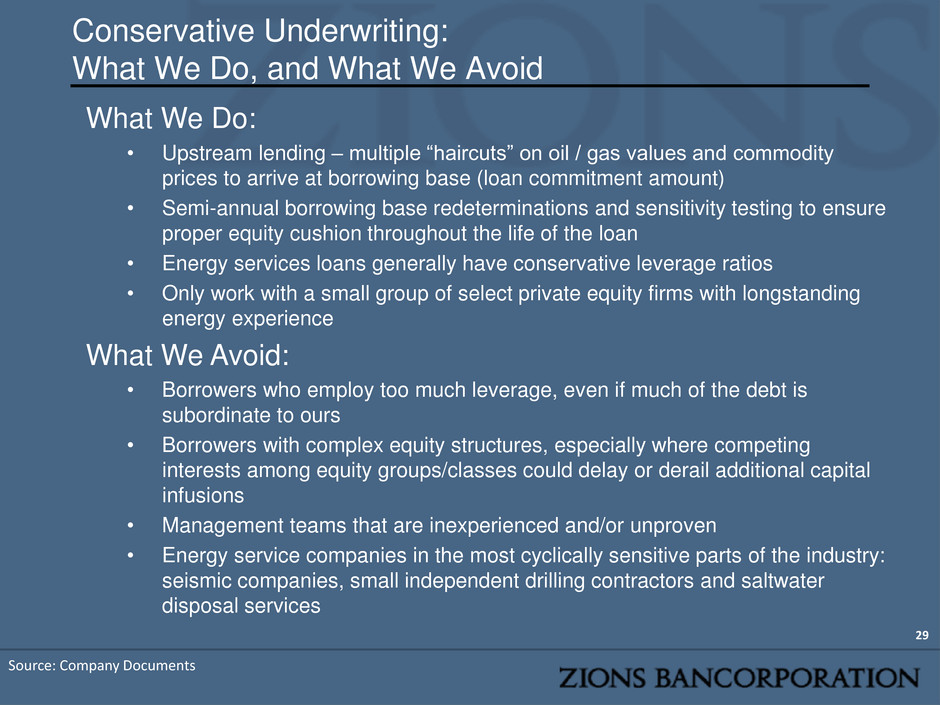
Conservative Underwriting: What We Do, and What We Avoid 29 Source: Company Documents What We Do: • Upstream lending – multiple “haircuts” on oil / gas values and commodity prices to arrive at borrowing base (loan commitment amount) • Semi-annual borrowing base redeterminations and sensitivity testing to ensure proper equity cushion throughout the life of the loan • Energy services loans generally have conservative leverage ratios • Only work with a small group of select private equity firms with longstanding energy experience What We Avoid: • Borrowers who employ too much leverage, even if much of the debt is subordinate to ours • Borrowers with complex equity structures, especially where competing interests among equity groups/classes could delay or derail additional capital infusions • Management teams that are inexperienced and/or unproven • Energy service companies in the most cyclically sensitive parts of the industry: seismic companies, small independent drilling contractors and saltwater disposal services
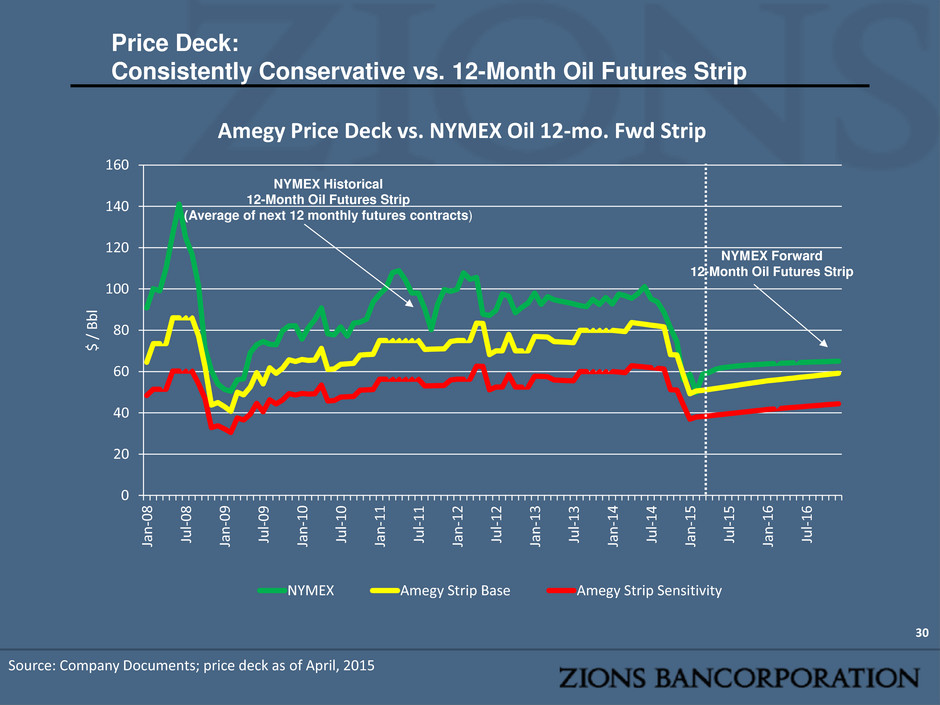
0 20 40 60 80 100 120 140 160 Jan -0 8 Ju l- 0 8 Jan -0 9 Ju l- 0 9 Jan -1 0 Ju l- 1 0 Jan -1 1 Ju l- 1 1 Jan -1 2 Ju l- 1 2 Jan -1 3 Ju l- 1 3 Jan -1 4 Ju l- 1 4 Jan -1 5 Ju l- 1 5 Jan -1 6 Ju l- 1 6 $ / B b l Amegy Price Deck vs. NYMEX Oil 12-mo. Fwd Strip NYMEX Amegy Strip Base Amegy Strip Sensitivity 30 Price Deck: Consistently Conservative vs. 12-Month Oil Futures Strip NYMEX Historical 12-Month Oil Futures Strip (Average of next 12 monthly futures contracts) NYMEX Forward 12-Month Oil Futures Strip Source: Company Documents; price deck as of April, 2015

Upstream (Reserve-Based) Underwriting 31 Typical Oil & Gas Reserve-Based Loan $100 - E&P company’s PV of oil & gas reserves using current NYMEX prices $ 85 - Zions’ risk-adjusted value of reserves (e.g. Zions applies discounts to non-producing reserves) $ 77 - Apply “bank price deck” (generally ~90% of NYMEX) to determine collateral value. $ 54 - Loan commitment amount (30% haircut if 25%+ of reserves are hedged) $ 46 - Loan commitment amount (40% haircut if less than 25% hedging) Notes: • Collateral value is based on engineering firm assessment of oil/gas reserves. For lending purposes, no more than 25% of the collateral may be comprised of non-producing reserves. Cash flows from the reserves are calculated by employing engineer’s projected volumes, bank oil/gas price deck and actual operating costs, then converted to present value using a 9% discount rate. • Utilization rates typically run near 50-60% on the loan commitment amount. Expect utilization rates to rise as commitments are reduced due to borrowing base redeterminations. Source: Company Documents In millions

Energy Services – Key Credit Metrics 32 How We Mitigate Risk in Energy Service Lending • Conservative Capital Structures • Senior Debt / EBITDA: Generally in the 1.5-to-1 area • Average Debt / Capitalization: less than 50% • Strong sponsorship / access to capital • Private Equity firms sponsor a large portion of the energy loan portfolio; PE firms are typically dedicated to the energy industry, rather than generalists. • Dedicated PE sponsors: ~80% of total sponsors • Generalist PE sponsors: all have a significant amount of capital committed to the energy industry • Large portion of portfolio consists of publicly traded companies with strong balance sheets and access to multiple sources of capital • Geographically diversified client base with operations across most major basins • Most borrowers have significant operations in both oil and gas basins • Private companies without equity sponsors are typically very well capitalized with strong management teams (many have personal recourse or sponsorship from high net worth families) Source: Company Documents
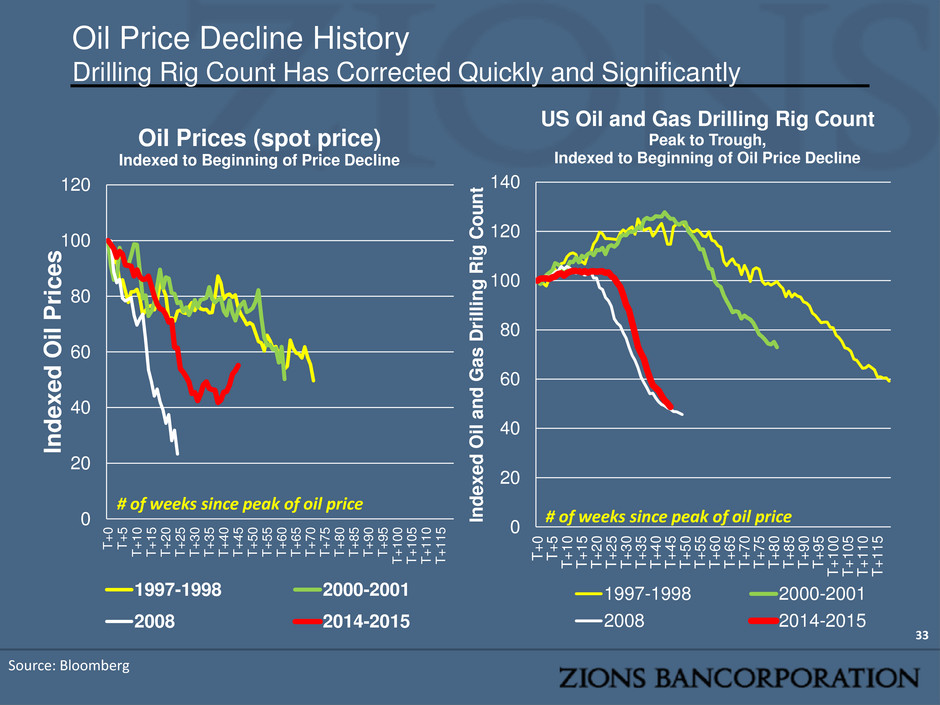
Oil Price Decline History Drilling Rig Count Has Corrected Quickly and Significantly 33 Source: Bloomberg 0 20 40 60 80 100 120 140 T+ 0 T+ 5 T+1 0 T+1 5 T+2 0 T+2 5 T+3 0 T+3 5 T +4 0 T+4 5 T+5 0 T+5 5 T+6 0 T+6 5 T+7 0 T+7 5 T+8 0 T+8 5 T+9 0 T+9 5 T+10 0 T+10 5 T+11 0 T+11 5 In d exe d O il a n d Gas D ri ll in g R ig C o u n t US Oil and Gas Drilling Rig Count Peak to Trough, Indexed to Beginning of Oil Price Decline 1997-1998 2000-2001 2008 2014-2015 # of weeks since peak of oil price 0 20 40 60 80 100 120 T + 0 T + 5 T + 1 0 T + 1 5 T + 2 0 T + 2 5 T + 3 0 T + 3 5 T + 4 0 T + 4 5 T + 5 0 T + 5 5 T + 6 0 T + 6 5 T + 7 0 T + 7 5 T + 8 0 T + 8 5 T + 9 0 T + 9 5 T + 1 0 0 T + 1 0 5 T + 1 1 0 T + 1 1 5 In de x ed O il P ri c e s Oil Prices (spot price) Indexed to Beginning of Price Decline 1997-1998 2000-2001 2008 2014-2015 # of weeks since peak of oil price

34 CDO Portfolio Composition & Values as of 2 Years Ago (1Q13) March 31, 2013 (Amounts in Millions) # of Tranches Par Amount Amortized Cost Carrying Value Net Unrealized Losses Recognized in AOCI Performing CDOs Predominantly Bank CDOs 27 $774 $694 $560 -$134 Insurance CDOs 22 447 443 331 -112 Other CDOs 6 51 40 37 -3 Total Performing CDOs 55 1,272 1,177 928 -249 Nonperforming CDOs CDOs Credit Impaired Prior to Last 12 Months 19 394 275 126 -149 CDOs Credit Impaired During Last 12 Months 39 732 432 179 -253 Total Nonperforming CDOs 58 1,126 707 305 -402 Total CDOs 113 $2,398 $1,884 $1,233 -$651
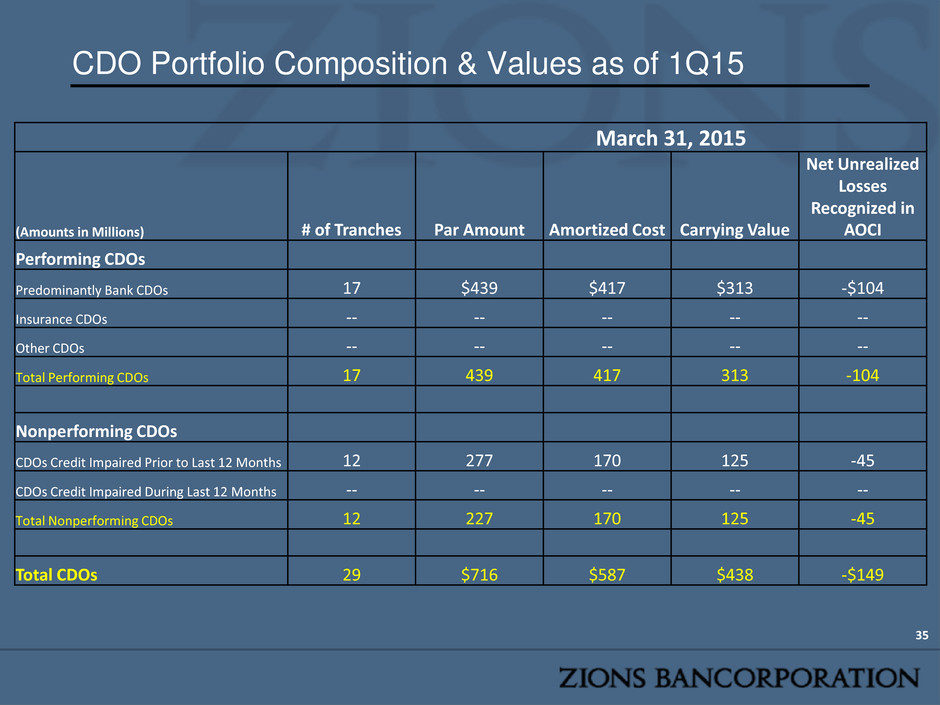
CDO Portfolio Composition & Values as of 1Q15 35 March 31, 2015 (Amounts in Millions) # of Tranches Par Amount Amortized Cost Carrying Value Net Unrealized Losses Recognized in AOCI Performing CDOs Predominantly Bank CDOs 17 $439 $417 $313 -$104 Insurance CDOs -- -- -- -- -- Other CDOs -- -- -- -- -- Total Performing CDOs 17 439 417 313 -104 Nonperforming CDOs CDOs Credit Impaired Prior to Last 12 Months 12 277 170 125 -45 CDOs Credit Impaired During Last 12 Months -- -- -- -- -- Total Nonperforming CDOs 12 227 170 125 -45 Total CDOs 29 $716 $587 $438 -$149

Significant Reductions to Interest Expense Through Debt Reduction 36 Source: company documents Total Debt Outstanding ($, in millions) Annual Interest Expense ($, in millions) • Additional very expensive sub debt expected to be retired in the second half of 2015, reducing interest expense by nearly $30 million annually (full benefit in FY16) 0 50 100 150 200 250 300 350 400 450 500 0 500 1,000 1,500 2,000 2,500 2011 2012 2013 2Q14 (Annualized) 4Q14 (Annualized) Senior Debt Subordinated Debt Total Interest Expense Interest Expense on Debt


