
July 20, 2015 Second Quarter 2015 Financial Review
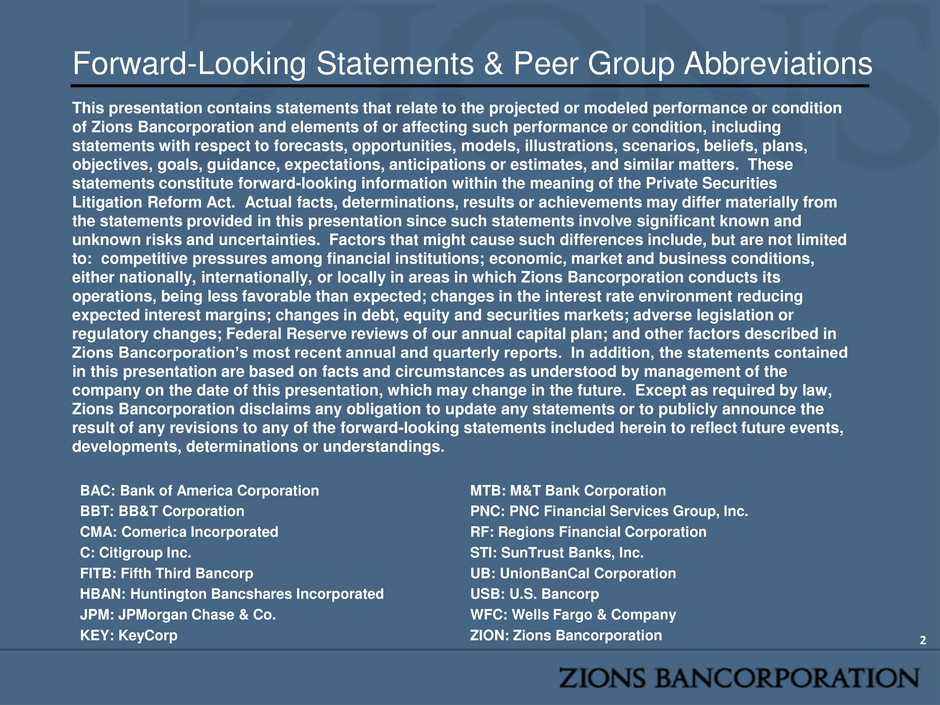
Forward-Looking Statements & Peer Group Abbreviations This presentation contains statements that relate to the projected or modeled performance or condition of Zions Bancorporation and elements of or affecting such performance or condition, including statements with respect to forecasts, opportunities, models, illustrations, scenarios, beliefs, plans, objectives, goals, guidance, expectations, anticipations or estimates, and similar matters. These statements constitute forward-looking information within the meaning of the Private Securities Litigation Reform Act. Actual facts, determinations, results or achievements may differ materially from the statements provided in this presentation since such statements involve significant known and unknown risks and uncertainties. Factors that might cause such differences include, but are not limited to: competitive pressures among financial institutions; economic, market and business conditions, either nationally, internationally, or locally in areas in which Zions Bancorporation conducts its operations, being less favorable than expected; changes in the interest rate environment reducing expected interest margins; changes in debt, equity and securities markets; adverse legislation or regulatory changes; Federal Reserve reviews of our annual capital plan; and other factors described in Zions Bancorporation’s most recent annual and quarterly reports. In addition, the statements contained in this presentation are based on facts and circumstances as understood by management of the company on the date of this presentation, which may change in the future. Except as required by law, Zions Bancorporation disclaims any obligation to update any statements or to publicly announce the result of any revisions to any of the forward-looking statements included herein to reflect future events, developments, determinations or understandings. 2 BAC: Bank of America Corporation BBT: BB&T Corporation CMA: Comerica Incorporated C: Citigroup Inc. FITB: Fifth Third Bancorp HBAN: Huntington Bancshares Incorporated JPM: JPMorgan Chase & Co. KEY: KeyCorp MTB: M&T Bank Corporation PNC: PNC Financial Services Group, Inc. RF: Regions Financial Corporation STI: SunTrust Banks, Inc. UB: UnionBanCal Corporation USB: U.S. Bancorp WFC: Wells Fargo & Company ZION: Zions Bancorporation

On June 1, 2015, Zions announced several organizational and operational changes, including: • Consolidate bank charters from seven to one while maintaining local leadership, local product pricing, and local brands • Create a Chief Banking Officer position, with responsibility for retail banking, wealth management, and residential mortgage lending • Consolidate risk functions, while emphasizing local credit decision-making • Consolidate various non-customer facing operations • Continue investment in building best-in-class technology infrastructure These changes are designed to: • Improve the customer experience (e.g., faster turnaround times) • Simplify the corporate structure and how Zions does business • Drive substantial positive operating leverage: + Increased revenue from growth in loans, deployment of cash to mortgage-backed securities, interest-rate swaps, and core fee income + Holding noninterest expense to below $1.6 billion in FY15 and FY16, slight increase in FY17 = Efficiency Ratio ≤ 70% in 2H15, ≤ 66% in FY16, and low 60s in FY171 3 Major 2Q15 Announcements: Efficiency Initiative 1 Assumes two 25 basis point fed funds rate increases by the end of 2017

Major 2Q15 Announcements: Sold the remainder of the CDOs as de-risking efforts continue 4 • As announced in mid-June, Zions sold the remaining balance of its collateralized debt obligation (CDO) portfolio. • Recognized loss of $137 million on $574 million (amortized cost) of such securities. • 2Q15 sale effectively reduced risk-weighted assets by $1.0 billion • Zions recognized approximately $2 million of interest income from CDOs in 2Q15 $0 $500 $1,000 $1,500 $2,000 $2,500 $3,000 4Q12 4Q13 4Q14 2Q15 CDOs, Par Value In Millions

Credit Quality 5 -0.5% 0.0% 0.5% 1.0% 1.5% 2.0% 2.5% 3.0% 3.5% 2Q14 3Q14 4Q14 1Q15 2Q15 Key Credit Quality Ratios Classifieds / Loans Nonperforming Assets / Loans Net Charge-offs / Loans Net Charge-offs / Loans annualized • Continued strong credit quality performance. Relative to March 31, 2015: • Classified loans increased 1.9% • NPAs declined 3.3% • Moderate increase in classified loans attributable to energy loans; loss content expected to be low • Allowance for credit loss remains strong, at 1.72% of total loans and leases • 1.9x coverage of NPAs • 15x coverage of annualized NCOs

ENERGY-RELATED EXPOSURE* % of total loans % of total loans % of total loans (In millions) June 30, 2015 March 31, 2015 December 31, 2014 Loans and leases Oil and gas-related $ 2,883 7.2 % $ 3,157 7.9 % $ 3,073 7.7 % Alternative energy 222 232 225 Total loans and leases 3,105 3,389 3,298 Unfunded lending commitments 2,403 2,451 2,731 Total credit exposure $ 5,508 $ 5,840 $ 6,029 Private equity investments $ 13 $ 20 $ 21 Energy Portfolio Detail 6 Distribution of oil and gas-related balances Upstream – exploration and production 33 % 34 % 34 % Midstream – marketing and transportation 20 % 21 % 19 % Downstream – refining 5 % 4 % 4 % Other non-services 3 % 2 % 2 % Oilfield services 30 % 30 % 31 % Energy service manufacturing 9 % 9 % 10 % Total loans and leases 100 % 100 % 100 % *Because many borrowers operate in multiple businesses, judgment has been applied in characterizing a borrower as energy-related, including a particular segment of energy-related activity, e.g., upstream or downstream. Energy loans performing better than initially expected due to a variety of factors, including strong YTD capital markets: • $13 billion common raised • $69 billion Investment Grade debt raised • $27 billion High Yield debt raised Substantial influx of capital from private equity firms Continue to expect further downgrades in 2H15, but substantial qualitative reserve should mitigate the need for substantial further provisioning Source of energy capital market data: Deutsche Bank

Financial Results 7 Three Months Ended (Dollar amounts in thousands, except per share data) June 30, 2015 March 31, 2015 June 30, 2014 Earnings Results: Diluted Earnings Per Share $ (0.01) $ 0.37 $ 0.56 Adjusted Earnings Per Share* 0.41 NA NA Net Interest Income 423,704 417,346 416,284 Provision for Loan Losses 566 (1,494) (54,416) Noninterest Income 421 121,822 124,849 Noninterest Expense 404,100 397,461 406,027 Net Earnings (Loss) Applicable to Common Shareholders (1,100) 75,279 104,490 Ratios: Return on Average Assets 0.10% 0.66% 0.87% Return on Average Common Equity (0.07)% 4.77% 7.30% Net Interest Margin 3.18% 3.22% 3.29% Yield on Loans 4.22% 4.21% 4.41% Yield on Securities 2.35% 2.49% 2.63% Average Cost of Deposits** 0.10% 0.11% 0.10% Efficiency Ratio 71.4% 72.3% 73.3% Basel III Common Equity Tier 1 11.91% 11.76% Basel I Tier 1 Common Equity 10.45% * Adjusted for the sale of remaining CDOs in 2Q2015. **Includes noninterest bearing deposits Efficiency ratio defined as noninterest expense adjusted for severance, other real estate expense, provision for unfunded lending commitments, debt extinguishment costs, amortization of core deposit intangibles, restructuring costs, expressed as a percentage of, the sum of fully-taxable equivalent net interest income, noninterest income excluding gains / losses on securities , and fair value and nonhedge derivative income.
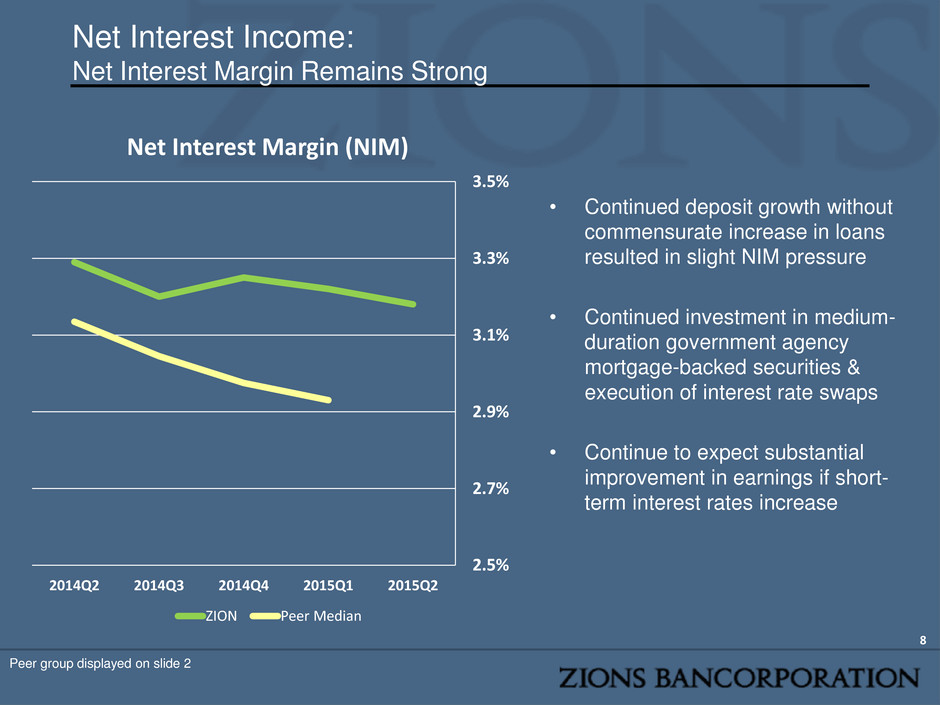
Net Interest Income: Net Interest Margin Remains Strong 8 • Continued deposit growth without commensurate increase in loans resulted in slight NIM pressure • Continued investment in medium- duration government agency mortgage-backed securities & execution of interest rate swaps • Continue to expect substantial improvement in earnings if short- term interest rates increase 2.5% 2.7% 2.9% 3.1% 3.3% 3.5% 2014Q2 2014Q3 2014Q4 2015Q1 2015Q2 Net Interest Margin (NIM) ZION Peer Median Peer group displayed on slide 2
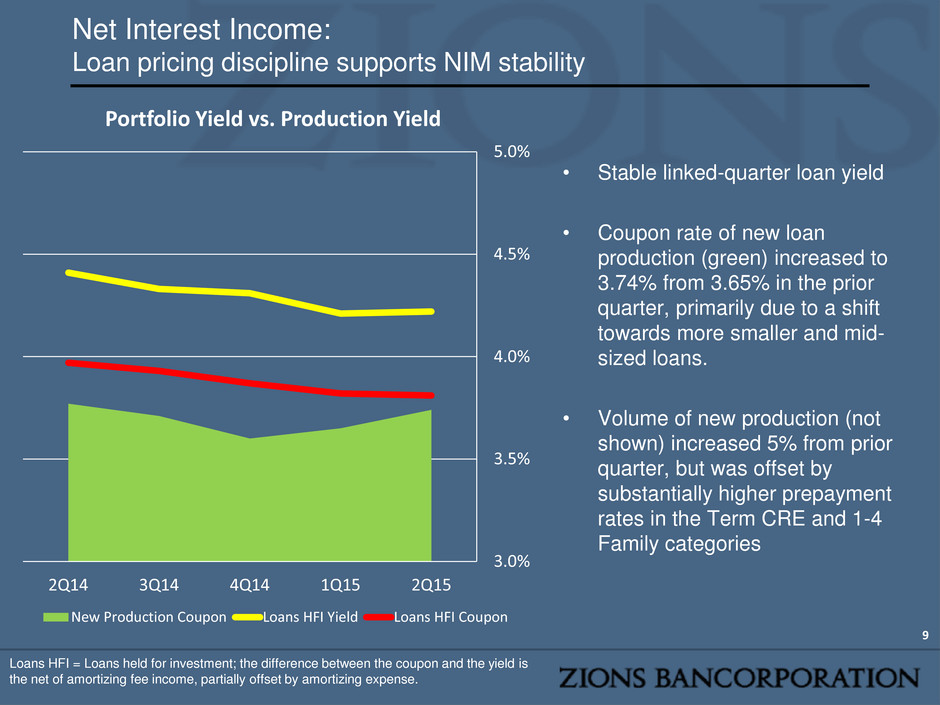
Net Interest Income: Loan pricing discipline supports NIM stability 9 3.0% 3.5% 4.0% 4.5% 5.0% 2Q14 3Q14 4Q14 1Q15 2Q15 Portfolio Yield vs. Production Yield New Production Coupon Loans HFI Yield Loans HFI Coupon • Stable linked-quarter loan yield • Coupon rate of new loan production (green) increased to 3.74% from 3.65% in the prior quarter, primarily due to a shift towards more smaller and mid- sized loans. • Volume of new production (not shown) increased 5% from prior quarter, but was offset by substantially higher prepayment rates in the Term CRE and 1-4 Family categories Loans HFI = Loans held for investment; the difference between the coupon and the yield is the net of amortizing fee income, partially offset by amortizing expense.
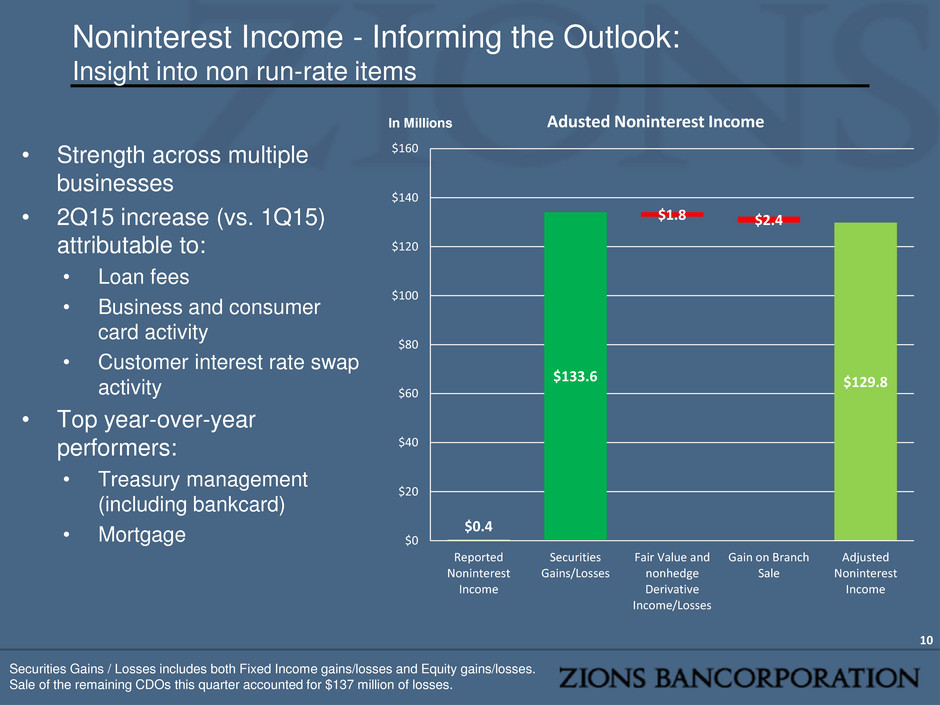
Noninterest Income - Informing the Outlook: Insight into non run-rate items 10 • Strength across multiple businesses • 2Q15 increase (vs. 1Q15) attributable to: • Loan fees • Business and consumer card activity • Customer interest rate swap activity • Top year-over-year performers: • Treasury management (including bankcard) • Mortgage $0.4 $133.6 $1.8 $2.4 $129.8 $0 $20 $40 $60 $80 $100 $120 $140 $160 Reported Noninterest Income Securities Gains/Losses Fair Value and nonhedge Derivative Income/Losses Gain on Branch Sale Adjusted Noninterest Income Adusted Noninterest Income In Millions Securities Gains / Losses includes both Fixed Income gains/losses and Equity gains/losses. Sale of the remaining CDOs this quarter accounted for $137 million of losses.
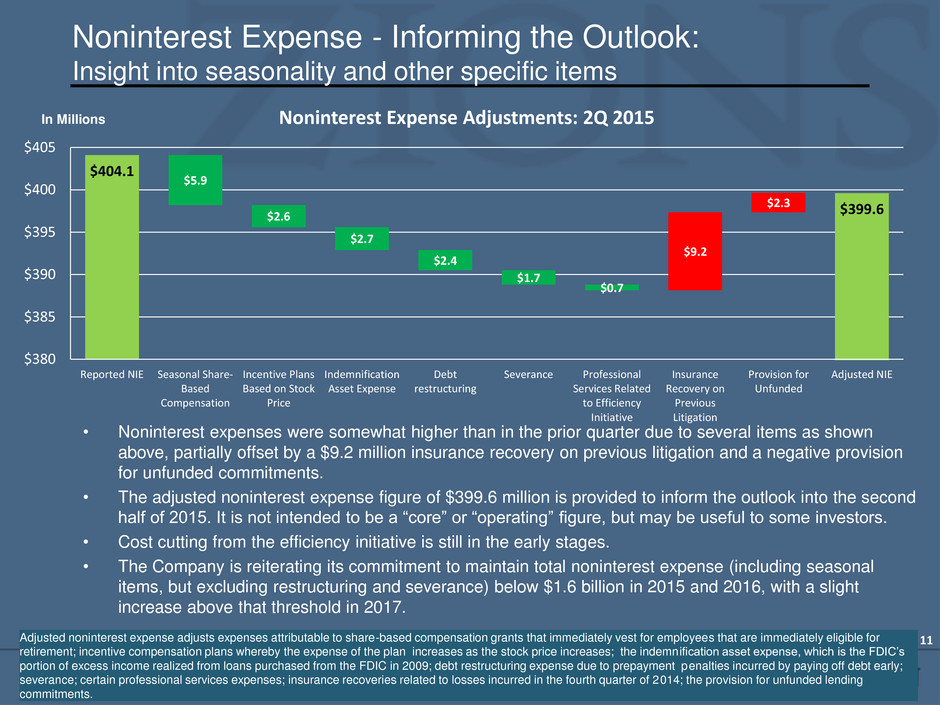
Noninterest Expense - Informing the Outlook: Insight into seasonality and other specific items 11 $404.1 $5.9 $2.6 $2.7 $2.4 $1.7 $0.7 $9.2 $2.3 $399.6 $380 $385 $390 $395 $400 $405 Reported NIE Seasonal Share- Based Compensation Incentive Plans Based on Stock Price Indemnification Asset Expense Debt restructuring Severance Professional Services Related to Efficiency Initiative Insurance Recovery on Previous Litigation Provision for Unfunded Adjusted NIE Noninterest Expense Adjustments: 2Q 2015 In Millions Adjusted noninterest expense adjusts expenses attributable to share-based compensation grants that immediately vest for employees that are immediately eligible for retirement; incentive compensation plans whereby the expense of the plan increases as the stock price increases; the indemnification asset expense, which is the FDIC’s portion of excess income realized from loans purchased from the FDIC in 2009; debt restructuring expense due to prepayment penalties incurred by paying off debt early; severance; certain professional services expenses; insurance recoveries related to losses incurred in the fourth quarter of 2014; the provision for unfunded lending commitments. • Noninterest expenses were somewhat higher than in the prior quarter due to several items as shown above, partially offset by a $9.2 million insurance recovery on previous litigation and a negative provision for unfunded commitments. • The adjusted noninterest expense figure of $399.6 million is provided to inform the outlook into the second half of 2015. It is not intended to be a “core” or “operating” figure, but may be useful to some investors. • Cost cutting from the efficiency initiative is still in the early stages. • The Company is reiterating its commitment to maintain total noninterest expense (including seasonal items, but excluding restructuring and severance) below $1.6 billion in 2015 and 2016, with a slight increase above that threshold in 2017.
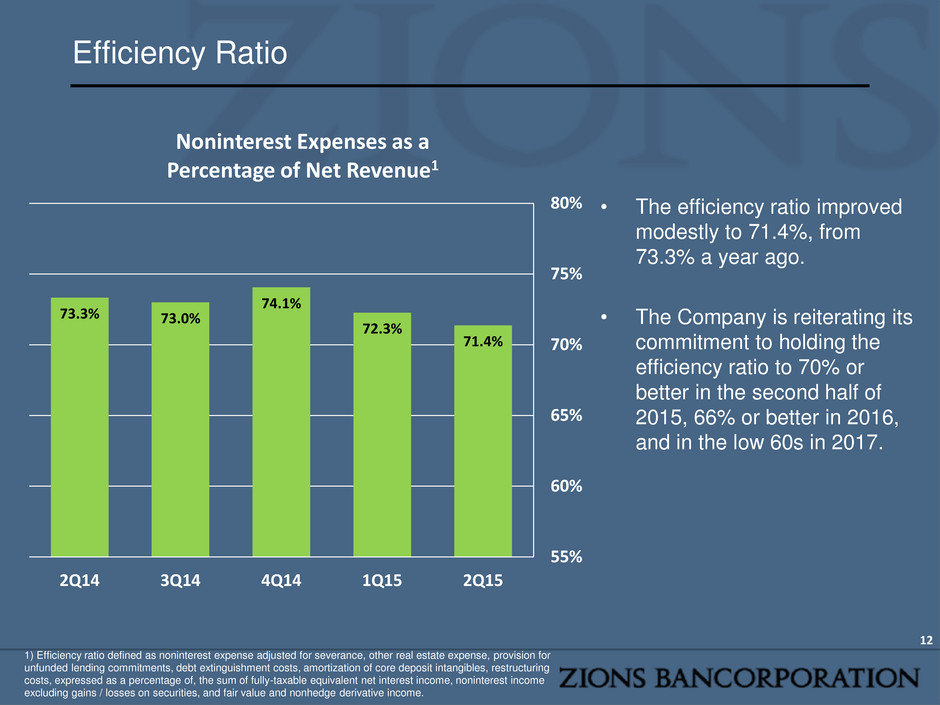
Efficiency Ratio 12 73.3% 73.0% 74.1% 72.3% 71.4% 55% 60% 65% 70% 75% 80% 2Q14 3Q14 4Q14 1Q15 2Q15 Noninterest Expenses as a Percentage of Net Revenue1 • The efficiency ratio improved modestly to 71.4%, from 73.3% a year ago. • The Company is reiterating its commitment to holding the efficiency ratio to 70% or better in the second half of 2015, 66% or better in 2016, and in the low 60s in 2017. 1) Efficiency ratio defined as noninterest expense adjusted for severance, other real estate expense, provision for unfunded lending commitments, debt extinguishment costs, amortization of core deposit intangibles, restructuring costs, expressed as a percentage of, the sum of fully-taxable equivalent net interest income, noninterest income excluding gains / losses on securities, and fair value and nonhedge derivative income.
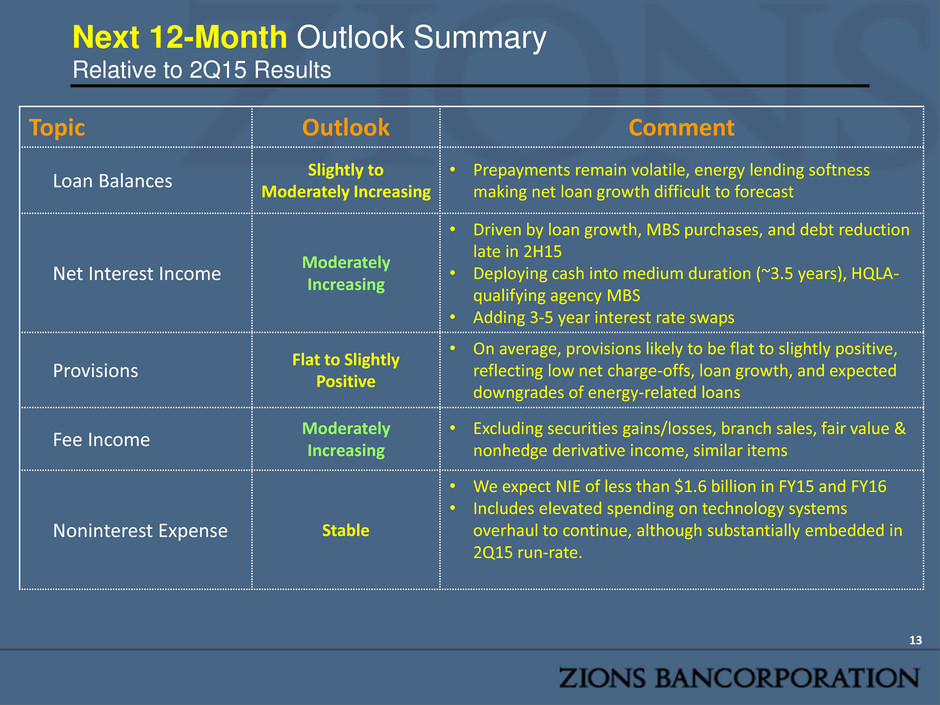
Next 12-Month Outlook Summary Relative to 2Q15 Results Topic Outlook Comment Loan Balances Slightly to Moderately Increasing • Prepayments remain volatile, energy lending softness making net loan growth difficult to forecast Net Interest Income Moderately Increasing • Driven by loan growth, MBS purchases, and debt reduction late in 2H15 • Deploying cash into medium duration (~3.5 years), HQLA- qualifying agency MBS • Adding 3-5 year interest rate swaps Provisions Flat to Slightly Positive • On average, provisions likely to be flat to slightly positive, reflecting low net charge-offs, loan growth, and expected downgrades of energy-related loans Fee Income Moderately Increasing • Excluding securities gains/losses, branch sales, fair value & nonhedge derivative income, similar items Noninterest Expense Stable • We expect NIE of less than $1.6 billion in FY15 and FY16 • Includes elevated spending on technology systems overhaul to continue, although substantially embedded in 2Q15 run-rate. 13


