Zions Bancorporation, National Association (ZION)
Filed: 26 Jul 16, 12:00am
Zions Bancorporation One South Main Salt Lake City, UT 84133 July 26, 2016 www.zionsbancorporation.com |  |
Zions Bancorporation Reports: 2Q16 Net Earnings1 of $91 million, diluted EPS of $0.44 compared to 1Q16 Net Earnings1 of $79 million, diluted EPS of $0.38, and 2Q15 Net Earnings1 of $(1.1) million, diluted EPS of $(0.01) | |||||
| $0.44 | $91 million | 6.31% | 11.9% | 3.39% | 64.5% | |||||
| Earnings per diluted common share | Net Earnings 1 | Tangible return on average tangible common equity 2 | Common Equity Tier 1 2 | Net interest margin (“NIM”) | Efficiency ratio 2 | |||||
| HIGHLIGHTS | |
| Net Interest Income and Net Interest Margin | • Net interest income was $465 million for 2Q16, up 3% from 1Q16 and up 10% from 2Q15• NIM up 4 bps to 3.39% from 3.35% in 1Q16 and up 21 bps from 3.18% in 2Q15 |
Operating Performance 3 | • Adjusted pre-provision net revenue ("PPNR")2 was $211 million for 2Q16, up 16% from 1Q16 and up 32% from 2Q15• Efficiency ratio2 of 64.5% for 2Q16, an improvement of 399 bps from 1Q16• Adjusted noninterest expense2 of $384 million in 2Q16 compared to $396 million in 1Q16• Customer-related fees in 2Q16 increased 5% from 1Q16 |
| Loans and Credit Quality | • Net loans and leases increased $1.1 billion, or 2.6%, from 1Q16 (10.5% annualized)• Nonperforming assets were 1.30% of loans and leases, down from 1.33% in 1Q16• Provision for credit losses was $30 million, compared to $36 million in 1Q16• Net charge-offs were $38 million in 2Q16, compared to $36 million in 1Q16 |
| Oil and Gas-Related Exposure | • Net charge-offs for oil and gas loans were $37 million in 2Q16, compared to $36 million in 1Q16• Oil and gas portfolio allowance continued to exceed 8% of the portfolio• Criticized oil and gas-related loans remained stable at 38% of the oil and gas-related loans |
| CEO COMMENTARY |
Harris H. Simmons, Chairman and CEO, commented, “We are pleased with the Company’s positive momentum, as evidenced most notably by the continued strong improvement in pre-provision net revenue which increased 32% in the second quarter from the same prior year period. As anticipated, the strong performance is coming from loan growth, which came from diverse geographies and product types, and well-controlled expenses. We are focused on increasing both the return on and the return of capital. Accordingly, we announced a one-third increase in our dividend, and the commencement at the earliest opportunity of a share repurchase program expected to total $180 million over the next four quarters.” |
OPERATING PERFORMANCE2 |
| Net Interest Income | ||||||||||||||||||||||||||
| 2Q16 - 1Q16 | 2Q16 - 2Q15 | |||||||||||||||||||||||||
| (In millions) | 2Q16 | 1Q16 | 2Q15 | $ | % | $ | % | |||||||||||||||||||
| Interest and fees on loans | $ | 434 | $ | 421 | $ | 421 | $ | 13 | 3 | % | $ | 13 | 3 | % | ||||||||||||
| Interest on money market investments | 6 | 7 | 6 | (1 | ) | (21 | ) | — | (4 | ) | ||||||||||||||||
| Interest on securities | 47 | 47 | 28 | — | 1 | 19 | 65 | |||||||||||||||||||
| Total interest income | 487 | 475 | 455 | 12 | 3 | 32 | 7 | |||||||||||||||||||
| Interest on deposits | 12 | 12 | 12 | — | — | — | (4 | ) | ||||||||||||||||||
| Interest on short and long-term borrowings | 10 | 10 | 19 | — | — | (9 | ) | (47 | ) | |||||||||||||||||
| Interest expense | 22 | 22 | 31 | — | — | (9 | ) | (30 | ) | |||||||||||||||||
| Net interest income | $ | 465 | $ | 453 | $ | 424 | $ | 12 | 3 | $ | 41 | 10 | ||||||||||||||
| Noninterest Income | ||||||||||||||||||||||||||
| 2Q16 - 1Q16 | 2Q16 - 2Q15 | |||||||||||||||||||||||||
| (In millions) | 2Q16 | 1Q16 | 2Q15 | $ | % | $ | % | |||||||||||||||||||
| Service charges and fees on deposit accounts | $ | 42 | $ | 41 | $ | 42 | $ | 1 | 2 | % | $ | — | 1 | % | ||||||||||||
| Other service charges, commissions and fees | 52 | 49 | 47 | 3 | 5 | 5 | 11 | |||||||||||||||||||
| Wealth management income | 9 | 8 | 8 | 1 | 10 | 1 | 8 | |||||||||||||||||||
| Loan sales and servicing income | 10 | 8 | 8 | 2 | 28 | 2 | 21 | |||||||||||||||||||
| Capital markets and foreign exchange | 5 | 6 | 7 | (1 | ) | (20 | ) | (2 | ) | (38 | ) | |||||||||||||||
| Customer-related fees | 118 | 112 | 112 | 6 | 5 | 6 | 5 | |||||||||||||||||||
| Dividends and other investment income | 6 | 5 | 9 | 1 | 34 | (3 | ) | (33 | ) | |||||||||||||||||
| Fair value and nonhedge derivative income (loss) | (2 | ) | (3 | ) | 2 | 1 | 26 | (4 | ) | (204 | ) | |||||||||||||||
| Other | 4 | 3 | (128 | ) | 1 | 63 | 132 | 103 | ||||||||||||||||||
| Total noninterest income | $ | 126 | $ | 117 | $ | (5 | ) | $ | 9 | 8 | $ | 131 | (2,785 | ) | ||||||||||||
| Noninterest Expense | ||||||||||||||||||||||||||
| 2Q16 - 1Q16 | 2Q16 - 2Q15 | |||||||||||||||||||||||||
| (In millions) | 2Q16 | 1Q16 | 2Q15 | $ | % | $ | % | |||||||||||||||||||
| Salaries and employee benefits | $ | 241 | $ | 258 | $ | 251 | $ | (17 | ) | (7 | )% | $ | (10 | ) | (4 | )% | ||||||||||
| Occupancy, net | 30 | 30 | 30 | — | (1 | ) | — | (2 | ) | |||||||||||||||||
| Furniture, equipment and software | 30 | 32 | 31 | (2 | ) | (5 | ) | (1 | ) | (2 | ) | |||||||||||||||
| Credit-related expense | 6 | 6 | 8 | — | (1 | ) | (2 | ) | (28 | ) | ||||||||||||||||
| Provision for unfunded lending commitments | (4 | ) | (6 | ) | (2 | ) | 2 | 27 | (2 | ) | (83 | ) | ||||||||||||||
| Professional and legal services | 12 | 11 | 13 | 1 | 7 | (1 | ) | (7 | ) | |||||||||||||||||
| Advertising | 5 | 6 | 7 | (1 | ) | (6 | ) | (2 | ) | (19 | ) | |||||||||||||||
| FDIC premiums | 10 | 7 | 9 | 3 | 34 | 1 | 11 | |||||||||||||||||||
| Amortization of core deposit and other intangibles | 2 | 2 | 2 | — | (2 | ) | — | (15 | ) | |||||||||||||||||
| Other | 50 | 50 | 50 | — | 1 | — | (1 | ) | ||||||||||||||||||
| Total noninterest expense | $ | 382 | $ | 396 | $ | 399 | $ | (14 | ) | (4 | ) | $ | (17 | ) | (4 | ) | ||||||||||
Adjusted noninterest expense 1 | $ | 384 | $ | 396 | $ | 395 | $ | (12 | ) | (3 | )% | $ | (11 | ) | (3 | )% | ||||||||||
1 | For information on non-GAAP financial measures see pages 15-17. |
| Loans and Leases | ||||||||||||||||||||||||||
| 2Q16 - 1Q16 | 2Q16 - 2Q15 | |||||||||||||||||||||||||
| (In millions) | 2Q16 | 1Q16 | 2Q15 | $ | % | $ | % | |||||||||||||||||||
| Loans held for sale | $ | 147 | $ | 109 | $ | 152 | $ | 38 | 35 | % | $ | (5 | ) | (4 | )% | |||||||||||
| Loans and leases, net of unearned income and fees | 42,501 | 41,418 | 40,024 | 1,083 | 3 | 2,477 | 6 | |||||||||||||||||||
| Less allowance for loan losses | 608 | 612 | 609 | (4 | ) | (1 | ) | (1 | ) | — | ||||||||||||||||
| Loans held for investment, net of allowance | $ | 41,893 | $ | 40,806 | $ | 39,415 | $ | 1,087 | 3 | $ | 2,478 | 6 | ||||||||||||||
Oil and Gas-Related Exposure1 | ||||||||||||||||||||||||||
| 2Q16 - 1Q16 | 2Q16 - 2Q15 | |||||||||||||||||||||||||
| (In millions) | 2Q16 | 1Q16 | 2Q15 | $ | % | $ | % | |||||||||||||||||||
| Loans and leases | ||||||||||||||||||||||||||
| Upstream – exploration and production | $ | 831 | $ | 859 | $ | 954 | $ | (28 | ) | (3 | )% | $ | (123 | ) | (13 | )% | ||||||||||
| Midstream – marketing and transportation | 658 | 649 | 589 | 9 | 1 | 69 | 12 | |||||||||||||||||||
| Downstream – refining | 131 | 129 | 131 | 2 | 2 | — | — | |||||||||||||||||||
| Other non-services | 45 | 43 | 75 | 2 | 5 | (30 | ) | (40 | ) | |||||||||||||||||
| Oilfield services | 712 | 734 | 879 | (22 | ) | (3 | ) | (167 | ) | (19 | ) | |||||||||||||||
| Oil and gas service manufacturing | 193 | 229 | 255 | (36 | ) | (16 | ) | (62 | ) | (24 | ) | |||||||||||||||
Total loan and lease balances 2 | 2,570 | 2,643 | 2,883 | (73 | ) | (3 | ) | (313 | ) | (11 | ) | |||||||||||||||
| Unfunded lending commitments | 1,823 | 2,021 | 2,385 | (198 | ) | (10 | ) | (562 | ) | (24 | ) | |||||||||||||||
| Total oil and gas credit exposure | $ | 4,393 | $ | 4,664 | $ | 5,268 | $ | (271 | ) | (6 | ) | $ | (875 | ) | (17 | ) | ||||||||||
| Private equity investments | $ | 6 | $ | 12 | $ | 18 | $ | (6 | ) | (50 | ) | $ | (12 | ) | (67 | ) | ||||||||||
Credit quality measures 2 | ||||||||||||||||||||||||||
| Criticized loan ratio | 37.8 | % | 37.5 | % | 20.3 | % | ||||||||||||||||||||
| Classified loan ratio | 31.5 | % | 26.9 | % | 11.3 | % | ||||||||||||||||||||
| Nonaccrual loan ratio | 11.1 | % | 10.8 | % | 2.3 | % | ||||||||||||||||||||
| Current nonaccrual loan ratio | 89.2 | % | 90.6 | % | 87.9 | % | ||||||||||||||||||||
Net charge-off ratio, annualized 3 | 5.8 | % | 5.4 | % | — | % | ||||||||||||||||||||
1 | Because many borrowers operate in multiple businesses, judgment has been applied in characterizing a borrower as oil and gas-related, including a particular segment of oil and gas-related activity, e.g., upstream or downstream; typically, 50% of revenues coming from the oil and gas sector is used as a guide. |
3 | Calculated as the ratio of annualized net charge-offs for each respective period to loan balances at each period end. |
| Asset Quality | ||||||||||||||||||||||||||
| 2Q16 - 1Q16 | 2Q16 - 2Q15 | |||||||||||||||||||||||||
| (In millions) | 2Q16 | 1Q16 | 2Q15 | bps | bps | |||||||||||||||||||||
| Ratio of nonperforming assets to loans and leases and other real estate owned | 1.30 | % | 1.33 | % | 0.96 | % | (3 | ) | 34 | |||||||||||||||||
| Annualized ratio of net loan and lease charge-offs to average loans | 0.36 | 0.35 | 0.11 | 1 | 25 | |||||||||||||||||||||
| Ratio of total allowance for credit losses to loans and leases outstanding | 1.58 | 1.64 | 1.72 | (6 | ) | (14 | ) | |||||||||||||||||||
| $ | % | $ | % | |||||||||||||||||||||||
| Classified loans | $ | 1,610 | $ | 1,532 | $ | 1,293 | $ | 78 | 5 | % | $ | 317 | 25 | % | ||||||||||||
| Provision for credit losses | 30 | 36 | (2 | ) | (6 | ) | (17 | ) | 32 | 1,818 | ||||||||||||||||
| Deposits | ||||||||||||||||||||||||||
| 2Q16 - 1Q16 | 2Q16 - 2Q15 | |||||||||||||||||||||||||
| (In millions) | 2Q16 | 1Q16 | 2Q15 | $ | % | $ | % | |||||||||||||||||||
| Noninterest-bearing demand | $ | 22,276 | $ | 21,872 | $ | 21,558 | $ | 404 | 2 | % | $ | 718 | 3 | % | ||||||||||||
| Interest-bearing: | ||||||||||||||||||||||||||
| Savings and money market | 25,541 | 25,724 | 24,744 | (183 | ) | (1 | ) | 797 | 3 | |||||||||||||||||
| Time | 2,336 | 2,072 | 2,263 | 264 | 13 | 73 | 3 | |||||||||||||||||||
| Foreign | 118 | 220 | 372 | (102 | ) | (46 | ) | (254 | ) | (68 | ) | |||||||||||||||
| Total deposits | $ | 50,271 | $ | 49,888 | $ | 48,937 | $ | 383 | 1 | $ | 1,334 | 3 | ||||||||||||||
| Shareholders’ Equity | ||||||||||||||||||||||||||
| 2Q16 - 1Q16 | 2Q16 - 2Q15 | |||||||||||||||||||||||||
| (In millions) | 2Q16 | 1Q16 | 2Q15 | $ | % | $ | % | |||||||||||||||||||
| Shareholders’ equity: | ||||||||||||||||||||||||||
| Preferred Stock | $ | 709 | $ | 828 | $ | 1,004 | $ | (119 | ) | (14 | )% | $ | (295 | ) | (29 | )% | ||||||||||
| Common Stock | 4,783 | 4,779 | 4,738 | 4 | — | 45 | 1 | |||||||||||||||||||
| Retained earnings | 2,110 | 2,031 | 1,823 | 79 | 4 | 287 | 16 | |||||||||||||||||||
| Accumulated other comprehensive income (loss) | 24 | (12 | ) | (35 | ) | 36 | 303 | 59 | 167 | |||||||||||||||||
| Total shareholders' equity | $ | 7,626 | $ | 7,626 | $ | 7,530 | $ | — | — | $ | 96 | 1 | ||||||||||||||
| • | The increase of the common dividend to $0.08 per share per quarter |
| • | Up to $180 million of common stock repurchases |
| • | Up to $144 million of preferred equity redemption |
| Three Months Ended | |||||||||||||||||||
| (In thousands, except share, per share, and ratio data) | June 30, 2016 | March 31, 2016 | December 31, 2015 | September 30, 2015 | June 30, 2015 | ||||||||||||||
BALANCE SHEET 1 | |||||||||||||||||||
| Loans held for investment, net of allowance | $ | 41,893,230 | $ | 40,806,291 | $ | 40,043,494 | $ | 39,516,683 | $ | 39,414,609 | |||||||||
| Total assets | 59,642,992 | 59,179,913 | 59,664,543 | 58,405,718 | 58,360,005 | ||||||||||||||
| Deposits | 50,270,921 | 49,887,857 | 50,374,091 | 48,920,147 | 48,937,124 | ||||||||||||||
| Total shareholders’ equity | 7,626,383 | 7,625,737 | 7,507,519 | 7,638,095 | 7,530,175 | ||||||||||||||
| STATEMENT OF INCOME | |||||||||||||||||||
| Net earnings (loss) applicable to common shareholders | 90,647 | 78,777 | 88,197 | 84,238 | (1,100 | ) | |||||||||||||
| Net interest income | $ | 464,849 | $ | 452,842 | $ | 448,833 | $ | 425,377 | $ | 423,704 | |||||||||
| Taxable-equivalent net interest income | 470,913 | 458,242 | 453,780 | 429,782 | 428,015 | ||||||||||||||
| Total noninterest income | 125,717 | 116,761 | 118,641 | 125,944 | (4,682 | ) | |||||||||||||
| Total noninterest expense | 381,894 | 395,573 | 397,353 | 391,280 | 398,997 | ||||||||||||||
Adjusted pre-provision net revenue 2 | 211,472 | 182,124 | 174,013 | 171,204 | 160,417 | ||||||||||||||
| Provision for loan losses | 34,492 | 42,145 | 22,701 | 18,262 | 566 | ||||||||||||||
| Provision for unfunded lending commitments | (4,246 | ) | (5,812 | ) | (6,551 | ) | 1,428 | (2,326 | ) | ||||||||||
| Provision for credit losses | 30,246 | 36,333 | 16,150 | 19,690 | (1,760 | ) | |||||||||||||
| PER COMMON SHARE | |||||||||||||||||||
| Net earnings (loss) per diluted common share | $ | 0.44 | $ | 0.38 | $ | 0.43 | $ | 0.41 | $ | (0.01 | ) | ||||||||
| Dividends | 0.06 | 0.06 | 0.06 | 0.06 | 0.06 | ||||||||||||||
Book value per common share 1 | 33.72 | 33.23 | 32.67 | 32.47 | 32.03 | ||||||||||||||
Tangible book value per common share 1, 2 | 28.72 | 28.20 | 27.63 | 27.42 | 26.95 | ||||||||||||||
| SELECTED RATIOS AND OTHER DATA | |||||||||||||||||||
| Return on average assets | 0.77 | % | 0.62 | % | 0.68 | % | 0.69 | % | 0.10 | % | |||||||||
| Return on average common equity | 5.30 | % | 4.67 | % | 5.17 | % | 5.02 | % | (0.07 | )% | |||||||||
Tangible return on average tangible common equity 2 | 6.31 | % | 5.59 | % | 6.20 | % | 6.05 | % | 0.03 | % | |||||||||
| Net interest margin | 3.39 | % | 3.35 | % | 3.23 | % | 3.11 | % | 3.18 | % | |||||||||
Efficiency ratio 2 | 64.5 | % | 68.5 | % | 69.6 | % | 69.1 | % | 71.1 | % | |||||||||
| Effective tax rate | 34.6 | % | 31.4 | % | 30.5 | % | 28.8 | % | 28.3 | % | |||||||||
| Ratio of nonperforming assets to loans and leases and other real estate owned | 1.30 | % | 1.33 | % | 0.87 | % | 0.92 | % | 0.96 | % | |||||||||
| Annualized ratio of net loan and lease charge-offs to average loans | 0.36 | % | 0.35 | % | 0.13 | % | 0.31 | % | 0.11 | % | |||||||||
Ratio of total allowance for credit losses to loans and leases outstanding 1 | 1.58 | % | 1.64 | % | 1.68 | % | 1.69 | % | 1.72 | % | |||||||||
| Full-time equivalent employees | 10,064 | 10,092 | 10,200 | 10,219 | 10,265 | ||||||||||||||
CAPITAL RATIOS 1 | |||||||||||||||||||
| Tangible common equity ratio | 10.05 | % | 9.92 | % | 9.63 | % | 9.76 | % | 9.58 | % | |||||||||
Basel III: 3 | |||||||||||||||||||
| Common equity tier 1 capital | 11.94 | % | 12.13 | % | 12.22 | % | 12.16 | % | 12.00 | % | |||||||||
| Tier 1 leverage | 11.25 | % | 11.44 | % | 11.26 | % | 11.63 | % | 11.65 | % | |||||||||
| Tier 1 risk-based capital | 13.39 | % | 13.87 | % | 14.08 | % | 14.41 | % | 14.26 | % | |||||||||
| Total risk-based capital | 15.47 | % | 15.97 | % | 16.12 | % | 16.46 | % | 16.32 | % | |||||||||
| Risk-weighted assets | 49,150,140 | 47,695,790 | 46,747,245 | 46,313,188 | 46,179,545 | ||||||||||||||
| Weighted average common and common-equivalent shares outstanding | 204,536,196 | 204,095,529 | 204,276,930 | 204,154,880 | 202,887,762 | ||||||||||||||
Common shares outstanding 1 | 205,103,566 | 204,543,707 | 204,417,093 | 204,278,594 | 203,740,914 | ||||||||||||||
1 | At period end. |
2 | For information on non-GAAP financial measures see pages 15-17. |
3 | Basel III capital ratios became effective January 1, 2015 and are based on the applicable phase-in periods. Current period ratios and amounts represent estimates. |
| (In thousands, except shares) | June 30, 2016 | March 31, 2016 | December 31, 2015 | September 30, 2015 | June 30, 2015 | ||||||||||||||
| (Unaudited) | (Unaudited) | (Unaudited) | (Unaudited) | ||||||||||||||||
| ASSETS | |||||||||||||||||||
| Cash and due from banks | $ | 560,262 | $ | 517,803 | $ | 798,319 | $ | 602,694 | $ | 758,238 | |||||||||
| Money market investments: | |||||||||||||||||||
| Interest-bearing deposits | 2,154,959 | 3,039,090 | 6,108,124 | 6,558,678 | 7,661,311 | ||||||||||||||
| Federal funds sold and security resell agreements | 620,469 | 1,587,212 | 619,758 | 1,325,501 | 1,404,246 | ||||||||||||||
| Investment securities: | |||||||||||||||||||
| Held-to-maturity, at adjusted cost (approximate fair value $720,991, $636,484, $552,088, $553,088, and $578,327) | 713,392 | 631,646 | 545,648 | 544,168 | 570,869 | ||||||||||||||
| Available-for-sale, at fair value | 9,477,089 | 8,701,885 | 7,643,116 | 6,000,011 | 4,652,415 | ||||||||||||||
| Trading account, at fair value | 118,775 | 65,838 | 48,168 | 73,521 | 74,519 | ||||||||||||||
| 10,309,256 | 9,399,369 | 8,236,932 | 6,617,700 | 5,297,803 | |||||||||||||||
| Loans held for sale | 146,512 | 108,764 | 149,880 | 139,122 | 152,448 | ||||||||||||||
| Loans and leases, net of unearned income and fees | 42,501,575 | 41,418,185 | 40,649,542 | 40,113,123 | 40,023,984 | ||||||||||||||
| Less allowance for loan losses | 608,345 | 611,894 | 606,048 | 596,440 | 609,375 | ||||||||||||||
| Loans held for investment, net of allowance | 41,893,230 | 40,806,291 | 40,043,494 | 39,516,683 | 39,414,609 | ||||||||||||||
| Other noninterest-bearing investments | 850,578 | 855,813 | �� | 848,144 | 851,225 | 863,443 | |||||||||||||
| Premises and equipment, net | 955,540 | 925,430 | 905,462 | 873,800 | 856,577 | ||||||||||||||
| Goodwill | 1,014,129 | 1,014,129 | 1,014,129 | 1,014,129 | 1,014,129 | ||||||||||||||
| Core deposit and other intangibles | 12,281 | 14,259 | 16,272 | 18,546 | 20,843 | ||||||||||||||
| Other real estate owned | 8,354 | 10,411 | 7,092 | 12,799 | 13,269 | ||||||||||||||
| Other assets | 1,117,422 | 901,342 | 916,937 | 874,841 | 903,089 | ||||||||||||||
| $ | 59,642,992 | $ | 59,179,913 | $ | 59,664,543 | $ | 58,405,718 | $ | 58,360,005 | ||||||||||
| LIABILITIES AND SHAREHOLDERS’ EQUITY | |||||||||||||||||||
| Deposits: | |||||||||||||||||||
| Noninterest-bearing demand | $ | 22,276,600 | $ | 21,872,274 | $ | 22,276,664 | $ | 21,572,022 | $ | 21,557,584 | |||||||||
| Interest-bearing: | |||||||||||||||||||
| Savings and money market | 25,540,525 | 25,723,996 | 25,672,356 | 24,690,359 | 24,744,288 | ||||||||||||||
| Time | 2,336,088 | 2,071,688 | 2,130,680 | 2,216,206 | 2,263,146 | ||||||||||||||
| Foreign | 117,708 | 219,899 | 294,391 | 441,560 | 372,106 | ||||||||||||||
| 50,270,921 | 49,887,857 | 50,374,091 | 48,920,147 | 48,937,124 | |||||||||||||||
| Federal funds and other short-term borrowings | 270,255 | 232,188 | 346,987 | 272,391 | 227,124 | ||||||||||||||
| Long-term debt | 698,712 | 802,448 | 812,366 | 939,543 | 1,045,484 | ||||||||||||||
| Reserve for unfunded lending commitments | 64,780 | 69,026 | 74,838 | 81,389 | 79,961 | ||||||||||||||
| Other liabilities | 711,941 | 562,657 | 548,742 | 554,153 | 540,137 | ||||||||||||||
| Total liabilities | 52,016,609 | 51,554,176 | 52,157,024 | 50,767,623 | 50,829,830 | ||||||||||||||
| Shareholders’ equity: | |||||||||||||||||||
| Preferred stock, without par value, authorized 4,400,000 shares | 709,601 | 828,490 | 828,490 | 1,004,159 | 1,004,032 | ||||||||||||||
| Common stock, without par value; authorized 350,000,000 shares; issued and outstanding 205,103,566, 204,543,707, 204,417,093, 204,278,594, and 203,740,914 shares | 4,783,061 | 4,777,630 | 4,766,731 | 4,756,288 | 4,738,272 | ||||||||||||||
| Retained earnings | 2,110,069 | 2,031,270 | 1,966,910 | 1,894,623 | 1,823,043 | ||||||||||||||
| Accumulated other comprehensive income (loss) | 23,652 | (11,653 | ) | (54,612 | ) | (16,975 | ) | (35,172 | ) | ||||||||||
| Total shareholders’ equity | 7,626,383 | 7,625,737 | 7,507,519 | 7,638,095 | 7,530,175 | ||||||||||||||
| $ | 59,642,992 | $ | 59,179,913 | $ | 59,664,543 | $ | 58,405,718 | $ | 58,360,005 | ||||||||||
| Three Months Ended | |||||||||||||||||||
| (In thousands, except per share amounts) | June 30, 2016 | March 31, 2016 | December 31, 2015 | September 30, 2015 | June 30, 2015 | ||||||||||||||
| Interest income: | |||||||||||||||||||
| Interest and fees on loans | $ | 433,743 | $ | 420,508 | $ | 429,842 | $ | 419,981 | $ | 420,642 | |||||||||
| Interest on money market investments | 5,564 | 7,029 | 6,144 | 6,018 | 5,785 | ||||||||||||||
| Interest on securities | 47,645 | 47,364 | 37,573 | 30,231 | 28,809 | ||||||||||||||
| Total interest income | 486,952 | 474,901 | 473,559 | 456,230 | 455,236 | ||||||||||||||
| Interest expense: | |||||||||||||||||||
| Interest on deposits | 11,869 | 11,845 | 12,377 | 12,542 | 12,321 | ||||||||||||||
| Interest on short- and long-term borrowings | 10,234 | 10,214 | 12,349 | 18,311 | 19,211 | ||||||||||||||
| Total interest expense | 22,103 | 22,059 | 24,726 | 30,853 | 31,532 | ||||||||||||||
| Net interest income | 464,849 | 452,842 | 448,833 | 425,377 | 423,704 | ||||||||||||||
| Provision for loan losses | 34,492 | 42,145 | 22,701 | 18,262 | 566 | ||||||||||||||
| Net interest income after provision for loan losses | 430,357 | 410,697 | 426,132 | 407,115 | 423,138 | ||||||||||||||
| Noninterest income: | |||||||||||||||||||
| Service charges and fees on deposit accounts | 42,108 | 41,261 | 42,445 | 43,196 | 41,616 | ||||||||||||||
| Other service charges, commissions and fees | 51,906 | 49,474 | 49,335 | 47,968 | 46,602 | ||||||||||||||
| Wealth management income | 8,788 | 7,954 | 7,953 | 7,496 | 8,160 | ||||||||||||||
| Loan sales and servicing income | 10,178 | 7,979 | 6,915 | 7,728 | 8,382 | ||||||||||||||
| Capital markets and foreign exchange | 4,545 | 5,667 | 6,255 | 6,624 | 7,275 | ||||||||||||||
| Dividends and other investment income | 6,226 | 4,639 | 2,986 | 8,449 | 9,343 | ||||||||||||||
| Fair value and nonhedge derivative income (loss) | (1,910 | ) | (2,585 | ) | 688 | (1,555 | ) | 1,844 | |||||||||||
| Equity securities gains (losses), net | 2,709 | (550 | ) | 53 | 3,630 | 4,839 | |||||||||||||
| Fixed income securities gains (losses), net | 25 | 28 | (7 | ) | (53 | ) | (138,436 | ) | |||||||||||
| Other | 1,142 | 2,894 | 2,018 | 2,461 | 5,693 | ||||||||||||||
| Total noninterest income | 125,717 | 116,761 | 118,641 | 125,944 | (4,682 | ) | |||||||||||||
| Noninterest expense: | |||||||||||||||||||
| Salaries and employee benefits | 241,341 | 258,338 | 236,037 | 242,023 | 251,133 | ||||||||||||||
| Occupancy, net | 29,621 | 29,779 | 30,618 | 29,477 | 30,095 | ||||||||||||||
| Furniture, equipment and software | 30,550 | 32,015 | 31,820 | 30,416 | 31,247 | ||||||||||||||
| Other real estate expense | (527 | ) | (1,329 | ) | (536 | ) | (40 | ) | (445 | ) | |||||||||
| Credit-related expense | 5,845 | 5,934 | 7,582 | 6,914 | 8,106 | ||||||||||||||
| Provision for unfunded lending commitments | (4,246 | ) | (5,812 | ) | (6,551 | ) | 1,428 | (2,326 | ) | ||||||||||
| Professional and legal services | 12,229 | 11,471 | 13,129 | 12,699 | 13,110 | ||||||||||||||
| Advertising | 5,268 | 5,628 | 5,692 | 6,136 | 6,511 | ||||||||||||||
| FDIC premiums | 9,580 | 7,154 | 9,194 | 8,500 | 8,609 | ||||||||||||||
| Amortization of core deposit and other intangibles | 1,979 | 2,014 | 2,273 | 2,298 | 2,318 | ||||||||||||||
| Debt extinguishment cost | 106 | 247 | 135 | — | 2,395 | ||||||||||||||
| Other | 50,148 | 50,134 | 67,960 | 51,429 | 48,244 | ||||||||||||||
| Total noninterest expense | 381,894 | 395,573 | 397,353 | 391,280 | 398,997 | ||||||||||||||
| Income before income taxes | 174,180 | 131,885 | 147,420 | 141,779 | 19,459 | ||||||||||||||
| Income taxes | 60,231 | 41,448 | 44,933 | 40,780 | 5,499 | ||||||||||||||
| Net income | 113,949 | 90,437 | 102,487 | 100,999 | 13,960 | ||||||||||||||
| Preferred stock dividends | (13,543 | ) | (11,660 | ) | (14,290 | ) | (16,761 | ) | (15,060 | ) | |||||||||
| Preferred stock redemption | (9,759 | ) | — | — | — | — | |||||||||||||
| Net earnings (loss) applicable to common shareholders | $ | 90,647 | $ | 78,777 | $ | 88,197 | $ | 84,238 | $ | (1,100 | ) | ||||||||
| Weighted average common shares outstanding during the period: | |||||||||||||||||||
| Basic shares | 204,236 | 203,967 | 203,884 | 203,668 | 202,888 | ||||||||||||||
| Diluted shares | 204,536 | 204,096 | 204,277 | 204,155 | 202,888 | ||||||||||||||
| Net earnings (loss) per common share: | |||||||||||||||||||
| Basic | $ | 0.44 | $ | 0.38 | $ | 0.43 | $ | 0.41 | $ | (0.01 | ) | ||||||||
| Diluted | 0.44 | 0.38 | 0.43 | 0.41 | (0.01 | ) | |||||||||||||
| (In millions) | June 30, 2016 | March 31, 2016 | December 31, 2015 | September 30, 2015 | June 30, 2015 | ||||||||||||||||||||||||
| Commercial: | |||||||||||||||||||||||||||||
| Commercial and industrial | $ | 13,757 | $ | 13,590 | $ | 13,211 | $ | 13,035 | $ | 13,111 | |||||||||||||||||||
| Leasing | 426 | 437 | 442 | 427 | 402 | ||||||||||||||||||||||||
| Owner occupied | 6,989 | 7,022 | 7,150 | 7,141 | 7,277 | ||||||||||||||||||||||||
| Municipal | 756 | 696 | 676 | 600 | 589 | ||||||||||||||||||||||||
| Total commercial | 21,928 | 21,745 | 21,479 | 21,203 | 21,379 | ||||||||||||||||||||||||
| Commercial real estate: | |||||||||||||||||||||||||||||
| Construction and land development | 2,088 | 1,968 | 1,842 | 2,214 | 2,062 | ||||||||||||||||||||||||
| Term | 9,230 | 8,826 | 8,514 | 8,089 | 8,058 | ||||||||||||||||||||||||
| Total commercial real estate | 11,318 | 10,794 | 10,356 | 10,303 | 10,120 | ||||||||||||||||||||||||
| Consumer: | |||||||||||||||||||||||||||||
| Home equity credit line | 2,507 | 2,433 | 2,417 | 2,347 | 2,348 | ||||||||||||||||||||||||
| 1-4 family residential | 5,680 | 5,418 | 5,382 | 5,269 | 5,194 | ||||||||||||||||||||||||
| Construction and other consumer real estate | 419 | 401 | 385 | 370 | 372 | ||||||||||||||||||||||||
| Bankcard and other revolving plans | 460 | 439 | 444 | 428 | 409 | ||||||||||||||||||||||||
| Other | 189 | 188 | 187 | 193 | 202 | ||||||||||||||||||||||||
| Total consumer | 9,255 | 8,879 | 8,815 | 8,607 | 8,525 | ||||||||||||||||||||||||
| Loans and leases, net of unearned income and fees | $ | 42,501 | $ | 41,418 | $ | 40,650 | $ | 40,113 | $ | 40,024 | |||||||||||||||||||
| (Amounts in thousands) | June 30, 2016 | March 31, 2016 | December 31, 2015 | September 30, 2015 | June 30, 2015 | ||||||||||||||
| Nonaccrual loans | $ | 547,402 | $ | 541,768 | $ | 349,860 | $ | 359,272 | $ | 372,830 | |||||||||
| Other real estate owned | 8,354 | 10,411 | 7,092 | 12,799 | 13,269 | ||||||||||||||
| Total nonperforming assets | $ | 555,756 | $ | 552,179 | $ | 356,952 | $ | 372,071 | $ | 386,099 | |||||||||
Ratio of nonperforming assets to loans1 and leases and other real estate owned | 1.30 | % | 1.33 | % | 0.87 | % | 0.92 | % | 0.96 | % | |||||||||
| Accruing loans past due 90 days or more | $ | 28,994 | $ | 37,202 | $ | 32,024 | $ | 34,857 | $ | 27,204 | |||||||||
Ratio of accruing loans past due 90 days or more to loans1 and leases | 0.07 | % | 0.09 | % | 0.08 | % | 0.09 | % | 0.07 | % | |||||||||
| Nonaccrual loans and accruing loans past due 90 days or more | $ | 576,396 | $ | 578,970 | $ | 381,884 | $ | 394,129 | $ | 400,034 | |||||||||
Ratio of nonaccrual loans and accruing loans past due 90 days or more to loans1 and leases | 1.35 | % | 1.39 | % | 0.94 | % | 0.98 | % | 1.00 | % | |||||||||
| Accruing loans past due 30-89 days | $ | 132,522 | $ | 100,341 | $ | 121,732 | $ | 118,361 | $ | 124,955 | |||||||||
| Restructured loans included in nonaccrual loans | 143,379 | 132,524 | 103,004 | 108,387 | 118,358 | ||||||||||||||
| Restructured loans on accrual | 171,854 | 195,482 | 194,084 | 178,136 | 180,146 | ||||||||||||||
| Classified loans | 1,610,263 | 1,532,052 | 1,368,022 | 1,322,924 | 1,292,980 | ||||||||||||||
| Three Months Ended | |||||||||||||||||||
| (Amounts in thousands) | June 30, 2016 | March 31, 2016 | December 31, 2015 | September 30, 2015 | June 30, 2015 | ||||||||||||||
| Allowance for Loan Losses | |||||||||||||||||||
| Balance at beginning of period | $ | 611,894 | $ | 606,048 | $ | 596,440 | $ | 609,375 | $ | 620,013 | |||||||||
| Add: | |||||||||||||||||||
| Provision for losses | 34,492 | 42,145 | 22,701 | 18,262 | 566 | ||||||||||||||
| Adjustment for FDIC-supported/PCI loans | — | — | 5 | — | 38 | ||||||||||||||
| Deduct: | |||||||||||||||||||
| Gross loan and lease charge-offs | (57,629 | ) | (48,110 | ) | (45,334 | ) | (42,359 | ) | (31,048 | ) | |||||||||
| Recoveries | 19,588 | 11,811 | 32,236 | 11,162 | 19,806 | ||||||||||||||
| Net loan and lease (charge-offs) recoveries | (38,041 | ) | (36,299 | ) | (13,098 | ) | (31,197 | ) | (11,242 | ) | |||||||||
| Balance at end of period | $ | 608,345 | $ | 611,894 | $ | 606,048 | $ | 596,440 | $ | 609,375 | |||||||||
| Ratio of allowance for loan losses to loans and leases, at period end | 1.43 | % | 1.48 | % | 1.49 | % | 1.49 | % | 1.52 | % | |||||||||
| Ratio of allowance for loan losses to nonperforming loans, at period end | 111 | % | 113 | % | 173 | % | 166 | % | 163 | % | |||||||||
| Annualized ratio of net loan and lease charge-offs to average loans | 0.36 | % | 0.35 | % | 0.13 | % | 0.31 | % | 0.11 | % | |||||||||
| Reserve for Unfunded Lending Commitments | |||||||||||||||||||
| Balance at beginning of period | $ | 69,026 | $ | 74,838 | $ | 81,389 | $ | 79,961 | $ | 82,287 | |||||||||
| Provision charged (credited) to earnings | (4,246 | ) | (5,812 | ) | (6,551 | ) | 1,428 | (2,326 | ) | ||||||||||
| Balance at end of period | $ | 64,780 | $ | 69,026 | $ | 74,838 | $ | 81,389 | $ | 79,961 | |||||||||
| Total Allowance for Credit Losses | |||||||||||||||||||
| Allowance for loan losses | $ | 608,345 | $ | 611,894 | $ | 606,048 | $ | 596,440 | $ | 609,375 | |||||||||
| Reserve for unfunded lending commitments | 64,780 | 69,026 | 74,838 | 81,389 | 79,961 | ||||||||||||||
| Total allowance for credit losses | $ | 673,125 | $ | 680,920 | $ | 680,886 | $ | 677,829 | $ | 689,336 | |||||||||
| Ratio of total allowance for credit losses to loans and leases outstanding, at period end | 1.58 | % | 1.64 | % | 1.68 | % | 1.69 | % | 1.72 | % | |||||||||
| (In millions) | June 30, 2016 | March 31, 2016 | December 31, 2015 | September 30, 2015 | June 30, 2015 | ||||||||||||||||||||||||
| Loans held for sale | $ | 13 | $ | — | $ | — | $ | — | $ | — | |||||||||||||||||||
| Commercial: | |||||||||||||||||||||||||||||
| Commercial and industrial | $ | 341 | $ | 356 | $ | 164 | $ | 167 | $ | 165 | |||||||||||||||||||
| Leasing | 14 | 14 | 4 | — | — | ||||||||||||||||||||||||
| Owner occupied | 69 | 74 | 74 | 77 | 89 | ||||||||||||||||||||||||
| Municipal | 1 | 1 | 1 | 1 | 1 | ||||||||||||||||||||||||
| Total commercial | 425 | 445 | 243 | 245 | 255 | ||||||||||||||||||||||||
| Commercial real estate: | |||||||||||||||||||||||||||||
| Construction and land development | 5 | 6 | 7 | 15 | 20 | ||||||||||||||||||||||||
| Term | 51 | 33 | 40 | 39 | 44 | ||||||||||||||||||||||||
| Total commercial real estate | 56 | 39 | 47 | 54 | 64 | ||||||||||||||||||||||||
| Consumer: | |||||||||||||||||||||||||||||
| Home equity credit line | 12 | 11 | 8 | 10 | 9 | ||||||||||||||||||||||||
| 1-4 family residential | 39 | 44 | 50 | 48 | 43 | ||||||||||||||||||||||||
| Construction and other consumer real estate | 1 | 1 | 1 | 1 | 1 | ||||||||||||||||||||||||
| Bankcard and other revolving plans | 1 | 2 | 1 | 1 | 1 | ||||||||||||||||||||||||
| Other | — | — | — | — | — | ||||||||||||||||||||||||
| Total consumer | 53 | 58 | 60 | 60 | 54 | ||||||||||||||||||||||||
| Total nonaccrual loans | $ | 547 | $ | 542 | $ | 350 | $ | 359 | $ | 373 | |||||||||||||||||||
| Three Months Ended | |||||||||||||||||||||||||||||
| (In millions) | June 30, 2016 | March 31, 2016 | December 31, 2015 | September 30, 2015 | June 30, 2015 | ||||||||||||||||||||||||
| Commercial: | |||||||||||||||||||||||||||||
| Commercial and industrial | $ | 32 | $ | 37 | $ | 18 | $ | 30 | $ | 13 | |||||||||||||||||||
| Leasing | — | — | — | — | — | ||||||||||||||||||||||||
| Owner occupied | — | (1 | ) | — | 3 | (3 | ) | ||||||||||||||||||||||
| Municipal | — | — | — | — | — | ||||||||||||||||||||||||
| Total commercial | 32 | 36 | 18 | 33 | 10 | ||||||||||||||||||||||||
| Commercial real estate: | |||||||||||||||||||||||||||||
| Construction and land development | (1 | ) | (2 | ) | (2 | ) | (2 | ) | (1 | ) | |||||||||||||||||||
| Term | 7 | — | (4 | ) | (1 | ) | 2 | ||||||||||||||||||||||
| Total commercial real estate | 6 | (2 | ) | (6 | ) | (3 | ) | 1 | |||||||||||||||||||||
| Consumer: | |||||||||||||||||||||||||||||
| Home equity credit line | — | 1 | (1 | ) | 1 | — | |||||||||||||||||||||||
| 1-4 family residential | (1 | ) | 1 | 1 | — | — | |||||||||||||||||||||||
| Construction and other consumer real estate | — | — | (1 | ) | (1 | ) | — | ||||||||||||||||||||||
| Bankcard and other revolving plans | 1 | — | 2 | — | 1 | ||||||||||||||||||||||||
| Other | — | — | — | 1 | (1 | ) | |||||||||||||||||||||||
| Total consumer loans | — | 2 | 1 | 1 | — | ||||||||||||||||||||||||
| Total net charge-offs (recoveries) | $ | 38 | $ | 36 | $ | 13 | $ | 31 | $ | 11 | |||||||||||||||||||
| Three Months Ended | ||||||||||||||||||||
| June 30, 2016 | March 31, 2016 | June 30, 2015 | ||||||||||||||||||
| (In thousands) | Average balance | Average yield/rate 1 | Average balance | Average yield/rate 1 | Average balance | Average yield/rate 1 | ||||||||||||||
| ASSETS | ||||||||||||||||||||
| Money market investments | $ | 4,045,333 | 0.55 | % | $ | 5,122,483 | 0.55 | % | $ | 8,414,602 | 0.28 | % | ||||||||
| Securities: | ||||||||||||||||||||
| Held-to-maturity | 669,372 | 4.46 | % | 562,040 | 4.86 | % | 583,349 | 5.06 | % | |||||||||||
| Available-for-sale | 8,852,688 | 1.93 | % | 8,108,708 | 2.11 | % | 4,585,760 | 1.99 | % | |||||||||||
| Trading account | 78,479 | 3.88 | % | 53,367 | 3.56 | % | 76,706 | 3.19 | % | |||||||||||
| Total securities | 9,600,539 | 2.13 | % | 8,724,115 | 2.30 | % | 5,245,815 | 2.35 | % | |||||||||||
| Loans held for sale | 126,045 | 3.52 | % | 140,423 | 3.95 | % | 115,377 | 3.48 | % | |||||||||||
Loans held for investment 2: | ||||||||||||||||||||
| Commercial | 21,934,114 | 4.20 | % | 21,624,134 | 4.20 | % | 21,527,723 | 4.22 | % | |||||||||||
| Commercial real estate | 11,169,157 | 4.31 | % | 10,555,869 | 4.23 | % | 10,089,092 | 4.47 | % | |||||||||||
| Consumer | 9,004,845 | 3.88 | % | 8,822,899 | 3.90 | % | 8,514,519 | 3.91 | % | |||||||||||
| Total loans held for investment | 42,108,116 | 4.16 | % | 41,002,902 | 4.14 | % | 40,131,334 | 4.22 | % | |||||||||||
| Total interest-earning assets | 55,880,033 | 3.55 | % | 54,989,923 | 3.51 | % | 53,907,128 | 3.42 | % | |||||||||||
| Cash and due from banks | 520,769 | 727,577 | 591,347 | |||||||||||||||||
| Allowance for loan losses | (606,228 | ) | (600,216 | ) | (621,348 | ) | ||||||||||||||
| Goodwill | 1,014,129 | 1,014,129 | 1,014,129 | |||||||||||||||||
| Core deposit and other intangibles | 13,527 | 15,379 | 22,135 | |||||||||||||||||
| Other assets | 2,723,529 | 2,679,525 | 2,558,514 | |||||||||||||||||
| Total assets | $ | 59,545,759 | $ | 58,826,317 | $ | 57,471,905 | ||||||||||||||
| LIABILITIES AND SHAREHOLDERS’ EQUITY | ||||||||||||||||||||
| Interest-bearing deposits: | ||||||||||||||||||||
| Savings and money market | $ | 25,779,999 | 0.14 | % | $ | 25,350,037 | 0.15 | % | $ | 24,514,516 | 0.16 | % | ||||||||
| Time | 2,192,366 | 0.46 | % | 2,087,698 | 0.44 | % | 2,300,593 | 0.43 | % | |||||||||||
| Foreign | 138,583 | 0.28 | % | 235,331 | 0.26 | % | 325,640 | 0.14 | % | |||||||||||
| Total interest-bearing deposits | 28,110,948 | 0.17 | % | 27,673,066 | 0.17 | % | 27,140,749 | 0.18 | % | |||||||||||
| Borrowed funds: | ||||||||||||||||||||
| Federal funds and other short-term borrowings | 546,707 | 0.24 | % | 267,431 | 0.18 | % | 214,287 | 0.14 | % | |||||||||||
| Long-term debt | 790,103 | 5.05 | % | 809,123 | 5.02 | % | 1,076,178 | 7.13 | % | |||||||||||
| Total borrowed funds | 1,336,810 | 3.08 | % | 1,076,554 | 3.82 | % | 1,290,465 | 5.97 | % | |||||||||||
| Total interest-bearing liabilities | 29,447,758 | 0.30 | % | 28,749,620 | 0.31 | % | 28,431,214 | 0.44 | % | |||||||||||
| Noninterest-bearing deposits | 21,839,395 | 21,881,777 | 20,984,073 | |||||||||||||||||
| Other liabilities | 596,697 | 579,453 | 559,722 | |||||||||||||||||
| Total liabilities | 51,883,850 | 51,210,850 | 49,975,009 | |||||||||||||||||
| Shareholders’ equity: | ||||||||||||||||||||
| Preferred equity | 778,844 | 828,490 | 1,004,031 | |||||||||||||||||
| Common equity | 6,883,065 | 6,786,977 | 6,492,865 | |||||||||||||||||
| Total shareholders’ equity | 7,661,909 | 7,615,467 | 7,496,896 | |||||||||||||||||
| Total liabilities and shareholders’ equity | $ | 59,545,759 | $ | 58,826,317 | $ | 57,471,905 | ||||||||||||||
| Spread on average interest-bearing funds | 3.25 | % | 3.20 | % | 2.98 | % | ||||||||||||||
| Net yield on interest-earning assets | 3.39 | % | 3.35 | % | 3.18 | % | ||||||||||||||
| (In thousands, except per share amounts) | June 30, 2016 | March 31, 2016 | December 31, 2015 | September 30, 2015 | June 30, 2015 | |||||||||||||||
| Tangible Book Value per Common Share | ||||||||||||||||||||
| Total shareholders’ equity (GAAP) | $ | 7,626,383 | $ | 7,625,737 | $ | 7,507,519 | $ | 7,638,095 | $ | 7,530,175 | ||||||||||
| Preferred stock | (709,601 | ) | (828,490 | ) | (828,490 | ) | (1,004,159 | ) | (1,004,032 | ) | ||||||||||
| Goodwill | (1,014,129 | ) | (1,014,129 | ) | (1,014,129 | ) | (1,014,129 | ) | (1,014,129 | ) | ||||||||||
| Core deposit and other intangibles | (12,281 | ) | (14,259 | ) | (16,272 | ) | (18,546 | ) | (20,843 | ) | ||||||||||
| Tangible common equity (non-GAAP) | (a) | $ | 5,890,372 | $ | 5,768,859 | $ | 5,648,628 | $ | 5,601,261 | $ | 5,491,171 | |||||||||
| Common shares outstanding | (b) | 205,104 | 204,544 | 204,417 | 204,279 | 203,741 | ||||||||||||||
| Tangible book value per common share (non-GAAP) | (a/b) | $ | 28.72 | $ | 28.20 | $ | 27.63 | $ | 27.42 | $ | 26.95 | |||||||||
| Three Months Ended | ||||||||||||||||||||
| (Dollar amounts in thousands) | June 30, 2016 | March 31, 2016 | December 31, 2015 | September 30, 2015 | June 30, 2015 | |||||||||||||||
| Tangible Return on Average Tangible Common Equity | ||||||||||||||||||||
| Net earnings (loss) applicable to common shareholders (GAAP) | $ | 90,647 | $ | 78,777 | $ | 88,197 | $ | 84,238 | $ | (1,100 | ) | |||||||||
| Adjustments, net of tax: | ||||||||||||||||||||
| Amortization of core deposit and other intangibles | 1,227 | 1,249 | 1,446 | 1,461 | 1,472 | |||||||||||||||
| Net earnings applicable to common shareholders, excluding the effects of the adjustments, net of tax (non-GAAP) | (a) | $ | 91,874 | $ | 80,026 | $ | 89,643 | $ | 85,699 | $ | 372 | |||||||||
| Average common equity (GAAP) | $ | 6,883,065 | $ | 6,786,977 | $ | 6,765,737 | $ | 6,655,513 | $ | 6,492,865 | ||||||||||
| Average goodwill | (1,014,129 | ) | (1,014,129 | ) | (1,014,129 | ) | (1,014,129 | ) | (1,014,129 | ) | ||||||||||
| Average core deposit and other intangibles | (13,527 | ) | (15,379 | ) | (17,453 | ) | (19,726 | ) | (22,135 | ) | ||||||||||
| Average tangible common equity (non-GAAP) | (b) | $ | 5,855,409 | $ | 5,757,469 | $ | 5,734,155 | $ | 5,621,658 | $ | 5,456,601 | |||||||||
| Number of days in quarter | (c) | 91 | 91 | 92 | 92 | 91 | ||||||||||||||
| Number of days in year | (d) | 366 | 366 | 365 | 365 | 365 | ||||||||||||||
| Tangible return on average tangible common equity (non-GAAP) | (a/b/c*d) | 6.31 | % | 5.59 | % | 6.20 | % | 6.05 | % | 0.03 | % | |||||||||
| Three Months Ended | ||||||||||||||||||||
| (Dollar amounts in thousands) | June 30, 2016 | March 31, 2016 | December 31, 2015 | September 30, 2015 | June 30, 2015 | |||||||||||||||
| Efficiency Ratio | ||||||||||||||||||||
Noninterest expense (GAAP) 1 | (a) | $ | 381,894 | $ | 395,573 | $ | 397,353 | $ | 391,280 | $ | 398,997 | |||||||||
| Adjustments: | ||||||||||||||||||||
| Severance costs | 201 | 3,471 | 3,581 | 3,464 | 1,707 | |||||||||||||||
| Other real estate expense | (527 | ) | (1,329 | ) | (536 | ) | (40 | ) | (445 | ) | ||||||||||
| Provision for unfunded lending commitments | (4,246 | ) | (5,812 | ) | (6,551 | ) | 1,428 | (2,326 | ) | |||||||||||
| Debt extinguishment cost | 106 | 247 | 135 | — | 2,395 | |||||||||||||||
| Amortization of core deposit and other intangibles | 1,979 | 2,014 | 2,273 | 2,298 | 2,318 | |||||||||||||||
| Restructuring costs | 47 | 996 | 777 | 1,630 | 679 | |||||||||||||||
| Total adjustments | (b) | (2,440 | ) | (413 | ) | (321 | ) | 8,780 | 4,328 | |||||||||||
| Adjusted noninterest expense (non-GAAP) | (a-b)=(c) | $ | 384,334 | $ | 395,986 | $ | 397,674 | $ | 382,500 | $ | 394,669 | |||||||||
| Taxable-equivalent net interest income (GAAP) | (d) | $ | 470,913 | $ | 458,242 | $ | 453,780 | $ | 429,782 | $ | 428,015 | |||||||||
Noninterest income (GAAP) 1 | (e) | 125,717 | 116,761 | 118,641 | 125,944 | (4,682 | ) | |||||||||||||
| Combined income | (d+e)=(f) | 596,630 | 575,003 | 572,421 | 555,726 | 423,333 | ||||||||||||||
| Adjustments: | ||||||||||||||||||||
| Fair value and nonhedge derivative income (loss) | (1,910 | ) | (2,585 | ) | 688 | (1,555 | ) | 1,844 | ||||||||||||
| Equity securities gains (losses), net | 2,709 | (550 | ) | 53 | 3,630 | 4,839 | ||||||||||||||
| Fixed income securities gains (losses), net | 25 | 28 | (7 | ) | (53 | ) | (138,436 | ) | ||||||||||||
| Total adjustments | (g) | 824 | (3,107 | ) | 734 | 2,022 | (131,753 | ) | ||||||||||||
| Adjusted taxable-equivalent revenue (non-GAAP) | (f-g)=(h) | $ | 595,806 | $ | 578,110 | $ | 571,687 | $ | 553,704 | $ | 555,086 | |||||||||
| Adjusted pre-provision net revenue (PPNR) | (h-c) | $ | 211,472 | $ | 182,124 | $ | 174,013 | $ | 171,204 | $ | 160,417 | |||||||||
Efficiency ratio 1 | (c/h) | 64.5 | % | 68.5 | % | 69.6 | % | 69.1 | % | 71.1 | % | |||||||||
| Six Months Ended | ||||||||
| (Dollar amounts in thousands) | June 30, 2016 | June 30, 2015 | ||||||
| Efficiency Ratio | ||||||||
Noninterest expense (GAAP) 1 | (a) | $ | 777,467 | $ | 791,974 | |||
| Adjustments: | ||||||||
| Severance costs | 3,672 | 3,960 | ||||||
| Other real estate expense | (1,856 | ) | (71 | ) | ||||
| Provision for unfunded lending commitments | (10,058 | ) | (1,115 | ) | ||||
| Debt extinguishment cost | 353 | 2,395 | ||||||
| Amortization of core deposit and other intangibles | 3,993 | 4,676 | ||||||
| Restructuring costs | 1,043 | 1,445 | ||||||
| Total adjustments | (b) | (2,853 | ) | 11,290 | ||||
| Adjusted noninterest expense (non-GAAP) | (a-b)=(c) | $ | 780,320 | $ | 780,684 | |||
| Taxable-equivalent net interest income (GAAP) | (d) | $ | 929,155 | $ | 849,596 | |||
Noninterest income (GAAP) 1 | (e) | 242,478 | 112,656 | |||||
| Combined income | (d+e)=(f) | 1,171,633 | 962,252 | |||||
| Adjustments: | ||||||||
| Fair value and nonhedge derivative income (loss) | (4,495 | ) | 756 | |||||
| Equity securities gains (losses), net | 2,159 | 8,192 | ||||||
| Fixed income securities gains (losses), net | 53 | (138,675 | ) | |||||
| Total adjustments | (g) | (2,283 | ) | (129,727 | ) | |||
| Adjusted taxable-equivalent revenue (non-GAAP) | (f-g)=(h) | $ | 1,173,916 | $ | 1,091,979 | |||
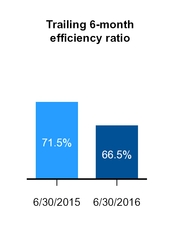
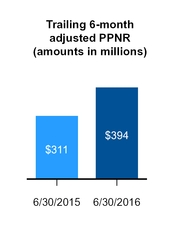
| Adjusted pre-provision net revenue (PPNR) | (h-c)=(i) | $ | 393,596 | $ | 311,295 | |||
Efficiency ratio 1 | (c/h) | 66.5 | % | 71.5 | % | |||