ZIONS BANCORPORATION
Press Release – Page 1
October 24, 2016
|
| |
Zions Bancorporation One South Main Salt Lake City, UT 84133 October 24, 2016 www.zionsbancorporation.com |
|
Third Quarter 2016 Financial Results: FOR IMMEDIATE RELEASE
Investor and Media Contact: James Abbott (801) 844-7637
|
| | | | | |
| | Zions Bancorporation Reports: 3Q16 Net Earnings1 of $117 million, diluted EPS of $0.57 compared to 2Q16 Net Earnings1 of $91 million, diluted EPS of $0.44, and 3Q15 Net Earnings1 of $84 million, diluted EPS of $0.41 |
| |
| |
THIRD QUARTER RESULTS
|
| | | | | | | | | | |
| $0.57 | | $117 million | | 7.88% | | 12.0% | | 3.36% | | 66.0% |
| Earnings per diluted common share | | Net Earnings 1 | | Tangible return on average tangible common equity 2 | | Common Equity Tier 1 | | Net interest margin (“NIM”) | | Efficiency ratio 2 |
|
| |
| HIGHLIGHTS |
| | |
| Net Interest Income and Net Interest Margin | • Net interest income was $469 million for 3Q16, up 1% from 2Q16 and up 10% from 3Q15• NIM was down 3 bps to 3.36% from 3.39% in 2Q16 and up 25 bps from 3.11% in 3Q15 |
| | |
Operating Performance 3 | • Adjusted pre-provision net revenue ("PPNR")2 was $208 million for 3Q16, down 1% from 2Q16 and up 22% from 3Q15• Customer-related fees in 3Q16 increased 7% from 2Q16 and 11% from 3Q15• Adjusted noninterest expense2 of $404 million in 3Q16 compared to $384 million in 2Q16 due to several items discussed in this earnings release• Efficiency ratio2 of 66.0% for 3Q16 compared to 64.5% for 2Q16, with a year-to-date efficiency ratio of 66.3% |
| | |
| Loans and Credit Quality | • Net loans and leases remained flat at $42.5 billion for 3Q16 compared to 2Q16• Provision for credit losses was $16 million, compared to $30 million in 2Q16, as asset quality outside of oil and gas-related loans remained strong• Nonperforming assets were 1.37% of loans and leases, compared to 1.30% in 2Q16• Net charge-offs were $30 million in 3Q16, compared to $38 million in 2Q16 |
| | |
| Oil and Gas-Related Exposure | • Net charge-offs for oil and gas loans were $41 million in 3Q16, compared to $37 million in 2Q16• Oil and gas portfolio allowance continued to exceed 8% of the portfolio• Criticized oil and gas-related loans were 42% in 3Q16, up from 38% in 2Q16 |
1 Net Earnings is net earnings applicable to common shareholders.
2 For information on non-GAAP financial measures see pages 15-17.
3 Included in these non-GAAP financial measures are the key metrics to which Zions announced it would hold itself accountable in its June 1, 2015 efficiency initiative, and to which executive compensation is tied.
|
|
| CEO COMMENTARY |
| |
Harris H. Simmons, Chairman and CEO, commented, “We are pleased with several elements of the third quarter, including the growth in consumer loans and fee income, two of our major growth initiatives. However, we experienced soft loan demand, similar to others in the industry, on the commercial side of the business.” Mr. Simmons continued “We are pleased with the continued credit quality performance of the non-oil and gas loan portfolios, which experienced net recoveries in the quarter and year-to-date; the oil and gas loan portfolio remains under stress, though the credit performance has been largely consistent with our expectations.” Mr. Simmons concluded, “We remain committed to achieving our operational and financial targets as outlined to investors in June 2015.”
|
ZIONS BANCORPORATION
Press Release – Page 2
October 24, 2016
The percent change amounts presented in the following tables are calculated on amounts in thousands rather than millions.
RESULTS OF OPERATIONS
|
| | | | | | | | | | | | | | | | | | | | | | | | | | |
| Net Interest Income |
| | | | | | | | | 3Q16 - 2Q16 | | 3Q16 - 3Q15 |
| (In millions) | | 3Q16 | | 2Q16 | | 3Q15 | | $ | | % | | $ | | % |
| Interest and fees on loans | | $ | 437 |
| | $ | 434 |
| | $ | 420 |
| | $ | 3 |
| | 1 | % | | $ | 17 |
| | 4 | % |
| Interest on money market investments | | 5 |
| | 6 |
| | 6 |
| | (1 | ) | | (11 | ) | | (1 | ) | | (18 | ) |
| Interest on securities | | 49 |
| | 47 |
| | 30 |
| | 2 |
| | 4 |
| | 19 |
| | 63 |
|
| Total interest income | | 491 |
| | 487 |
| | 456 |
| | 4 |
| | 1 |
| | 35 |
| | 8 |
|
| Interest on deposits | | 13 |
| | 12 |
| | 13 |
| | 1 |
| | 6 |
| | — |
| | — |
|
| Interest on short and long-term borrowings | | 9 |
| | 10 |
| | 18 |
| | (1 | ) | | (12 | ) | | (9 | ) | | (51 | ) |
| Interest expense | | 22 |
| | 22 |
| | 31 |
| | — |
| | (3 | ) | | (9 | ) | | (30 | ) |
| Net interest income | | $ | 469 |
| | $ | 465 |
| | $ | 425 |
| | $ | 4 |
| | 1 |
| | $ | 44 |
| | 10 |
|
Net interest income increased to $469 million in the third quarter of 2016 from $465 million in the second quarter of 2016. The increase in net interest income was due to a $3 million increase in interest and fees on loans and a $2 million increase in interest from investment securities. The net interest margin decreased to 3.36% in the third quarter of 2016, compared to 3.39% in the second quarter of 2016. The Company continues to change its mix of interest-earning assets as average money market investments declined in the third quarter of 2016 by $906 million, much of which was deployed into term investment securities. Average securities increased in the third quarter of 2016 by $884 million and average loans and leases held for investment increased by $379 million.
|
| | | | | | | | | | | | | | | | | | | | | | | | | | |
| Noninterest Income |
| | | | | | | | | 3Q16 - 2Q16 | | 3Q16 - 3Q15 |
| (In millions) | | 3Q16 | | 2Q16 | | 3Q15 | | $ | | % | | $ | | % |
| Service charges and fees on deposit accounts | | $ | 44 |
| | $ | 42 |
| | $ | 43 |
| | $ | 2 |
| | 6 | % | | $ | 1 |
| | 3 | % |
| Other service charges, commissions and fees | | 54 |
| | 52 |
| | 48 |
| | 2 |
| | 4 |
| | 6 |
| | 13 |
|
| Wealth management income | | 10 |
| | 9 |
| | 7 |
| | 1 |
| | 13 |
| | 3 |
| | 33 |
|
| Loan sales and servicing income | | 11 |
| | 10 |
| | 8 |
| | 1 |
| | 11 |
| | 3 |
| | 46 |
|
| Capital markets and foreign exchange | | 6 |
| | 5 |
| | 7 |
| | 1 |
| | 26 |
| | (1 | ) | | (14 | ) |
| Customer-related fees | | 125 |
| | 118 |
| | 113 |
| | 7 |
| | 7 |
| | 12 |
| | 11 |
|
| Dividends and other investment income | | 9 |
| | 6 |
| | 8 |
| | 3 |
| | 45 |
| | 1 |
| | 7 |
|
| Fair value and nonhedge derivative income (loss) | | — |
| | (2 | ) | | (1 | ) | | 2 |
| | 90 |
| | 1 |
| | 88 |
|
| Securities gains, net | | 9 |
| | 3 |
| | 4 |
| | 6 |
| | 210 |
| | 5 |
| | 137 |
|
| Other | | 2 |
| | 1 |
| | 2 |
| | 1 |
| | 68 |
| | — |
| | (22 | ) |
| Total noninterest income | | $ | 145 |
| | $ | 126 |
| | $ | 126 |
| | $ | 19 |
| | 15 |
| | $ | 19 |
| | 15 |
|
Total noninterest income for the third quarter of 2016 was $145 million, compared to $126 million for the second quarter of 2016. The improvement in total noninterest income during the quarter was primarily due to customer-related fees and securities gains. Customer-related fees increased by 7% in the third quarter of 2016 compared to the prior quarter and increased by 11% compared to the same prior year period. The increase in customer-related fees was generally across all fee types. Additionally, securities gains increased $6 million primarily due to an increase of
ZIONS BANCORPORATION
Press Release – Page 3
October 24, 2016
$8 million in the market value of one of the Company’s SBIC investments. Dividends and other investment income increased by $3 million due to increases in the market value of the Company’s SBIC investments.
|
| | | | | | | | | | | | | | | | | | | | | | | | | | |
| Noninterest Expense |
| | | | | | | | | 3Q16 - 2Q16 | | 3Q16 - 3Q15 |
| (In millions) | | 3Q16 | | 2Q16 | | 3Q15 | | $ | | % | | $ | | % |
| Salaries and employee benefits | | $ | 242 |
| | $ | 241 |
| | $ | 242 |
| | $ | 1 |
| | — | % | | $ | — |
| | — | % |
| Occupancy, net | | 33 |
| | 30 |
| | 29 |
| | 3 |
| | 13 |
| | 4 |
| | 14 |
|
| Furniture, equipment and software, net | | 29 |
| | 30 |
| | 31 |
| | (1 | ) | | (5 | ) | | (2 | ) | | (4 | ) |
| Credit-related expense | | 7 |
| | 6 |
| | 7 |
| | 1 |
| | 17 |
| | — |
| | (1 | ) |
| Provision for unfunded lending commitments | | (3 | ) | | (4 | ) | | 1 |
| | 1 |
| | 25 |
| | (4 | ) | | (322 | ) |
| Professional and legal services | | 14 |
| | 12 |
| | 13 |
| | 2 |
| | 18 |
| | 1 |
| | 14 |
|
| Advertising | | 6 |
| | 5 |
| | 6 |
| | 1 |
| | 14 |
| | — |
| | (2 | ) |
| FDIC premiums | | 12 |
| | 10 |
| | 9 |
| | 2 |
| | 22 |
| | 3 |
| | 37 |
|
| Amortization of core deposit and other intangibles | | 2 |
| | 2 |
| | 2 |
| | — |
| | (1 | ) | | — |
| | (15 | ) |
| Other | | 61 |
| | 50 |
| | 51 |
| | 11 |
| | 22 |
| | 10 |
| | 18 |
|
| Total noninterest expense | | $ | 403 |
| | $ | 382 |
| | $ | 391 |
| | $ | 21 |
| | 6 |
| | $ | 12 |
| | 2 |
|
Adjusted noninterest expense 1 | | $ | 404 |
| | $ | 384 |
| | $ | 383 |
| | $ | 20 |
| | 5 | % | | $ | 21 |
| | 6 | % |
| |
1 | For information on non-GAAP financial measures see pages 15-17. |
Noninterest expense for the third quarter of 2016 was $403 million, compared to $382 million for the second quarter of 2016, and $391 million for the third quarter of 2015. The increase of $21 million in total noninterest expense from the second quarter of 2016 was primarily due to a legal accrual, true-ups related to the alignment of a single back-office operating environment, and other employee benefits-related items. Despite the increases in noninterest expense during the third quarter, the Company remains committed to accomplishing its goals of maintaining noninterest expense at less than $1.58 billion and achieving an efficiency ratio of less than 66% in 2016. For more information on adjusted noninterest expense measures used to determine the Company’s efficiency ratio, see pages 15-17.
BALANCE SHEET ANALYSIS
|
| | | | | | | | | | | | | | | | | | | | | | | | | | |
| Loans and Leases |
| | | | | | | | | 3Q16 - 2Q16 | | 3Q16 - 3Q15 |
| (In millions) | | 3Q16 | | 2Q16 | | 3Q15 | | $ | | % | | $ | | % |
| Loans held for sale | | $ | 160 |
| | $ | 147 |
| | $ | 139 |
| | $ | 13 |
| | 9 | % | | $ | 21 |
| | 15 | % |
| Loans and leases, net of unearned income and fees | | 42,540 |
| | 42,501 |
| | 40,113 |
| | 39 |
| | — |
| | 2,427 |
| | 6 |
|
| Less allowance for loan losses | | 597 |
| | 608 |
| | 596 |
| | (11 | ) | | (2 | ) | | 1 |
| | — |
|
| Loans held for investment, net of allowance | | $ | 41,943 |
| | $ | 41,893 |
| | $ | 39,517 |
| | $ | 50 |
| | — |
| | $ | 2,426 |
| | 6 |
|
Loans and leases, net of unearned income and fees, remained flat at $42.5 billion at September 30, 2016. Average loans and leases held for investment of $42.5 billion during the third quarter of 2016 increased from $42.1 billion during the second quarter of 2016. The oil and gas-related portfolio declined $256 million from the prior quarter due to payoffs, paydowns, charge-offs and active management of the portfolio. This decline was offset by $211 million of growth in consumer loans, predominately in 1-4 family residential loans, and also by $132 million of growth in
ZIONS BANCORPORATION
Press Release – Page 4
October 24, 2016
commercial real estate loans. Excluding the strategic reduction in oil and gas-related loans, net loans and leases increased $294 million during the third quarter of 2016. Unfunded lending commitments were $19.1 billion at September 30, 2016, compared to $18.5 billion at June 30, 2016.
|
| | | | | | | | | | | | | | | | | | | | | | | | | | |
Oil and Gas-Related Exposure1 |
| | | | | | | | | 3Q16 - 2Q16 | | 3Q16 - 3Q15 |
| (In millions) | | 3Q16 | | 2Q16 | | 3Q15 | | $ | | % | | $ | | % |
| Loans and leases | | | | | | | |
|
| |
|
| |
|
| |
|
| Upstream – exploration and production | | $ | 752 |
| | $ | 831 |
| | $ | 924 |
| | $ | (79 | ) | | (10 | )% | | $ | (172 | ) | | (19 | )% |
| Midstream – marketing and transportation | | 623 |
| | 658 |
| | 626 |
| | (35 | ) | | (5 | ) | | (3 | ) | | — |
|
| Downstream – refining | | 123 |
| | 131 |
| | 124 |
| | (8 | ) | | (6 | ) | | (1 | ) | | (1 | ) |
| Other non-services | | 44 |
| | 45 |
| | 55 |
| | (1 | ) | | (2 | ) | | (11 | ) | | (20 | ) |
| Oilfield services | | 596 |
| | 712 |
| | 825 |
| | (116 | ) | | (16 | ) | | (229 | ) | | (28 | ) |
| Oil and gas service manufacturing | | 176 |
| | 193 |
| | 251 |
| | (17 | ) | | (9 | ) | | (75 | ) | | (30 | ) |
Total loan and lease balances 2 | | 2,314 |
| | 2,570 |
| | 2,805 |
| | (256 | ) | | (10 | ) | | (491 | ) | | (18 | ) |
| Unfunded lending commitments | | 1,784 |
| | 1,823 |
| | 2,341 |
| | (39 | ) | | (2 | ) | | (557 | ) | | (24 | ) |
| Total oil and gas credit exposure | | $ | 4,098 |
| | $ | 4,393 |
| | $ | 5,146 |
| | $ | (295 | ) | | (7 | ) | | $ | (1,048 | ) | | (20 | ) |
| | | | | | | | | | | | | | | |
| Private equity investments | | $ | 6 |
| | $ | 6 |
| | $ | 17 |
| | $ | — |
| | — |
| | $ | (11 | ) | | (65 | ) |
| | | | | | | | | | | | | | | |
Credit quality measures 2 | | | | | | | | | | | | | | |
| Criticized loan ratio | | 41.8 | % | | 37.8 | % | | 23.2 | % | | | | | | | | |
| Classified loan ratio | | 33.1 | % | | 31.5 | % | | 15.7 | % | | | | | | | | |
| Nonaccrual loan ratio | | 15.0 | % | | 11.1 | % | | 3.0 | % | | | | | | | | |
| Ratio of nonaccrual loans that are current | | 87.3 | % | | 89.2 | % | | 45.2 | % | | | | | | | | |
Net charge-off ratio, annualized 3 | | 7.1 | % | | 5.8 | % | | 2.4 | % | | | | | | | | |
| |
1 | Because many borrowers operate in multiple businesses, judgment has been applied in characterizing a borrower as oil and gas-related, including a particular segment of oil and gas-related activity, e.g., upstream or downstream; typically, 50% of revenues coming from the oil and gas sector is used as a guide. |
2 Total loan and lease balances and the credit quality measures do not include $29 million of oil and gas loans held for sale at September 30, 2016.
| |
3 | Calculated as the ratio of annualized net charge-offs for each respective period to loan balances at each period end. |
During the third quarter of 2016, oil and gas-related loans decreased $256 million, or 10%, and total oil and gas credit exposure decreased by $295 million, or 7%. Oil and gas-related loans now represent 5% of the total loan portfolio. Oil and gas services (oilfield services and oil and gas service manufacturing) decreased $133 million, or 15%, from the second quarter of 2016, and $304 million, or 28%, from the third quarter of 2015. Unfunded lending commitments decreased by $39 million, primarily in the exploration and production, oilfield services, and oil and gas service manufacturing portfolios. Consistent with management’s expectations, the majority of loan downgrades in the third quarter of 2016 reflected deterioration in the financial condition of companies in the oilfield services and the exploration and production portfolios. Oil and gas-related loan net charge-offs were $41 million in the third quarter of 2016 and were predominantly in the oilfield services portfolio, compared to $37 million in the second quarter of 2016. During the third quarter of 2016, the Company entered into contracts to sell $29 million of oil and gas-related loans and subsequently classified them as held for sale. The Company recognized $5 million of charge-offs on these loans. Approximately 87% of oil and gas-related nonaccruing loans were current as to principal and interest payments as of September 30, 2016, similar to the 89% reported as of June 30, 2016. The allowance for
ZIONS BANCORPORATION
Press Release – Page 5
October 24, 2016
credit losses related to oil and gas-related loans decreased during the quarter but continued to exceed 8% of oil and gas-related loan balances for the third quarter of 2016. The results of the recent shared national credit exam are reflected in the Company’s financial statements.
|
| | | | | | | | | | | | | | | | | | | | | | | | | | |
| Asset Quality |
| | | | | | | | | 3Q16 - 2Q16 | | 3Q16 - 3Q15 |
| (In millions) | | 3Q16 | | 2Q16 | | 3Q15 | | bps | | | | bps | | |
| Ratio of nonperforming assets to loans and leases and other real estate owned | | 1.37 | % | | 1.30 | % | | 0.92 | % | | 7 |
| |
| | 45 |
| |
|
| Annualized ratio of net loan and lease charge-offs to average loans | | 0.28 |
| | 0.36 |
| | 0.31 |
| | (8 | ) | | | | (3 | ) | | |
| Ratio of total allowance for credit losses to loans and leases outstanding | | 1.55 |
| | 1.58 |
| | 1.69 |
| | (3 | ) | |
| | (14 | ) | |
|
| | | | | | | | | $ | | % | | $ | | % |
| Classified loans | | $ | 1,615 |
| | $ | 1,610 |
| | $ | 1,323 |
| | $ | 5 |
| | — | % | | $ | 292 |
| | 22 | % |
| Provision for credit losses | | 16 |
| | 30 |
| | 20 |
| | (14 | ) | | (48 | ) | | (4 | ) | | (20 | ) |
Asset quality for the total portfolio remained strong and was generally stable when compared to the prior quarter. Nonperforming assets were $587 million at September 30, 2016, compared to $556 million at June 30, 2016. The ratio of nonperforming assets to loans and leases and other real estate owned increased to 1.37% at September 30, 2016, compared to 1.30% at June 30, 2016. Excluding oil and gas-related loans, the ratio of nonperforming assets to loans and leases and other real estate owned was 0.60% at September 30, 2016 compared to 0.67% at June 30, 2016. Classified loans for the total portfolio were $1.6 billion at September 30, 2016 and June 30, 2016.
The allowance for credit losses decreased to $659 million at September 30, 2016 from $673 million at June 30, 2016, which was 1.55% and 1.58% of loans and leases, respectively. Excluding oil and gas-related loans, the allowance for credit losses was 1.13% of loans and leases at September 30, 2016, compared to 1.15% at June 30, 2016.
Total net charge-offs were $30 million in the third quarter of 2016, or an annualized 0.28% of average loans, compared to $38 million, or an annualized 0.36% of average loans, in the second quarter of 2016. However, excluding the oil and gas-related loans, the Company had net recoveries of $11 million, or an annualized (0.11)% of average loans, in the third quarter of 2016, compared to $1 million of net charge-offs, or an annualized 0.01%, in the second quarter of 2016. The Company provided $16 million for credit losses during the third quarter of 2016, compared to $30 million during the second quarter of 2016. The decrease of $14 million in the provision for credit losses was primarily due to an $11 million decline in the allowance for loan losses reflecting continued strong credit quality for the total portfolio in addition to a change in the portfolio mix, as oil and gas-related exposures were reduced, and increasing high-quality residential real estate and commercial real estate term exposures. The reserve for unfunded lending commitments declined by $3 million as a result of improved credit quality assessments related to these obligations.
ZIONS BANCORPORATION
Press Release – Page 6
October 24, 2016
|
| | | | | | | | | | | | | | | | | | | | | | | | | | |
| Deposits |
| | | | | | | | | 3Q16 - 2Q16 | | 3Q16 - 3Q15 |
| (In millions) | | 3Q16 | | 2Q16 | | 3Q15 | | $ | | % | | $ | | % |
| Noninterest-bearing demand | | $ | 22,711 |
| | $ | 22,276 |
| | $ | 21,572 |
| | $ | 435 |
| | 2 | % | | $ | 1,139 |
| | 5 | % |
| Interest-bearing: | | | | | | | | | | | | | | |
| Savings and money market | | 25,503 |
| | 25,541 |
| | 24,690 |
| | (38 | ) | | — |
| | 813 |
| | 3 |
|
| Time | | 2,516 |
| | 2,336 |
| | 2,216 |
| | 180 |
| | 8 |
| | 300 |
| | 14 |
|
| Foreign | | 119 |
| | 118 |
| | 442 |
| | 1 |
| | 1 |
| | (323 | ) | | (73 | ) |
| Total deposits | | $ | 50,849 |
| | $ | 50,271 |
| | $ | 48,920 |
| | $ | 578 |
| | 1 |
| | $ | 1,929 |
| | 4 |
|
Total deposits increased to $50.8 billion at September 30, 2016, compared to $50.3 billion at June 30, 2016. Average total deposits increased $724 million to $50.7 billion for the third quarter of 2016, compared to $50.0 billion for the second quarter of 2016. Average noninterest bearing deposits increased to $22.5 billion for the third quarter of 2016, compared to $21.8 billion for the second quarter of 2016, and were 44% of average total deposits.
|
| | | | | | | | | | | | | | | | | | | | | | | | | | |
| Long-term Debt and Shareholders’ Equity |
| | | | | | | | | 3Q16 - 2Q16 | | 3Q16 - 3Q15 |
| (In millions) | | 3Q16 | | 2Q16 | | 3Q15 | | $ | | % | | $ | | % |
| Shareholders’ equity: | | | | | | | | | | | | | | |
| Preferred Stock | | $ | 709 |
| | $ | 709 |
| | $ | 1,004 |
| | $ | — |
| | — | % | | $ | (295 | ) | | (29 | )% |
| Common Stock | | 4,748 |
| | 4,783 |
| | 4,756 |
| | (35 | ) | | (1 | ) | | (8 | ) | | — |
|
| Retained earnings | | 2,212 |
| | 2,110 |
| | 1,895 |
| | 102 |
| | 5 |
| | 317 |
| | 17 |
|
| Accumulated other comprehensive income (loss) | | 10 |
| | 24 |
| | (17 | ) | | (14 | ) | | (58 | ) | | 27 |
| | 159 |
|
| Total shareholders' equity | | $ | 7,679 |
| | $ | 7,626 |
| | $ | 7,638 |
| | $ | 53 |
| | 1 |
| | $ | 41 |
| | 1 |
|
During the third quarter of 2016, the Company commenced its stock buyback program and repurchased $45 million of its stock during the quarter at an average price of $30.64 per share, leaving $135 million of buyback capacity remaining in the 2016 capital plan (which spans the timeframe of July 2016 to June 2017). Preferred dividends are expected to be $12.4 million for the fourth quarter of 2016 and the second quarter of 2017, and are expected to be $10.4 million for the first quarter of 2017. Additionally, the Company reduced its long-term debt by $128 million during the third quarter of 2016 by exercising its call options for junior subordinated debentures related to trust preferred securities.
Accumulated other comprehensive income (loss) decreased to $10 million from $24 million, primarily as a result of a decline in the fair value of the Company’s available-for-sale securities portfolio due largely to changes in the interest rate environment.
Tangible book value per common share increased to $29.16 at September 30, 2016, compared to $28.72 at June 30, 2016. The estimated Basel III common equity tier 1 (“CET1”) capital ratio was 12.0% at September 30, 2016 and at June 30, 2016; Basel III capital ratios are based on the applicable phase-in periods, however, the fully phased-in ratio was not substantially different.
ZIONS BANCORPORATION
Press Release – Page 7
October 24, 2016
Supplemental Presentation and Conference Call
Zions has posted a supplemental presentation to its website, which will be used to discuss these third quarter results at 5:30 p.m. ET this afternoon (October 24, 2016). Media representatives, analysts, investors, and the public are invited to join this discussion by calling 253-237-1247 (domestic and international) and entering the passcode 87814485, or via on-demand webcast. A link to the webcast will be available on the Zions Bancorporation website at zionsbancorporation.com. The webcast of the conference call will also be archived and available for 30 days. About Zions Bancorporation
Zions Bancorporation is one of the nation’s premier financial services companies with total assets of approximately $60 billion. Zions operates under local management teams and unique brands in 11 western and southwestern states: Arizona, California, Colorado, Idaho, Nevada, New Mexico, Oregon, Texas, Utah, Washington, and Wyoming. The company is a national leader in Small Business Administration lending and public finance advisory services, and is a consistent top recipient of numerous Greenwich Excellence awards in banking. In addition, Zions is included in the S&P 500 and NASDAQ Financial 100 indices. Investor information and links to local banking brands can be accessed at zionsbancorporation.com. Forward-Looking Information
Statements in this press release that are based on other than historical data or that express the Company’s expectations regarding future events or determinations are forward-looking within the meaning of the Private Securities Litigation Reform Act of 1995. Statements based on historical data are not intended and should not be understood to indicate the Company’s expectations regarding future events. Forward-looking statements provide current expectations or forecasts or intentions regarding future events or determinations. These forward-looking statements are not guarantees of future performance or determinations, nor should they be relied upon as representing management’s views as of any subsequent date. Forward-looking statements involve significant risks and uncertainties, and actual results may differ materially from those presented, either expressed or implied, in this press release. Factors that could cause actual results to differ materially from those expressed in the forward-looking statements include the actual amount and duration of declines in the price of oil and gas, our ability to meet our efficiency and noninterest expense goals, as well as other factors discussed in the Company’s most recent Annual Report on Form 10-K and Quarterly Report on Form 10-Q, filed with the Securities and Exchange Commission (“SEC”) and available at the SEC’s Internet site (http://www.sec.gov).
Except as required by law, the Company specifically disclaims any obligation to update any factors or to publicly announce the result of revisions to any of the forward-looking statements included herein to reflect future events or developments.
ZIONS BANCORPORATION
Press Release – Page 8
October 24, 2016
FINANCIAL HIGHLIGHTS
(Unaudited)
|
| | | | | | | | | | | | | | | | | | | |
| | Three Months Ended |
| (In thousands, except share, per share, and ratio data) | September 30,
2016 | | June 30,
2016 | | March 31,
2016 | | December 31,
2015 | | September 30,
2015 |
BALANCE SHEET 1 | | | | | | | | | |
| Loans held for investment, net of allowance | $ | 41,942,535 |
| | $ | 41,893,230 |
| | $ | 40,806,291 |
| | $ | 40,043,494 |
| | $ | 39,516,683 |
|
| Total assets | 61,038,860 |
| | 59,642,992 |
| | 59,179,913 |
| | 59,664,543 |
| | 58,405,718 |
|
| Deposits | 50,848,661 |
| | 50,270,921 |
| | 49,887,857 |
| | 50,374,091 |
| | 48,920,147 |
|
| Total shareholders’ equity | 7,679,307 |
| | 7,626,383 |
| | 7,625,737 |
| | 7,507,519 |
| | 7,638,095 |
|
| STATEMENT OF INCOME | | | | | | | | | |
| Net earnings applicable to common shareholders | 116,895 |
| | 90,647 |
| | 78,777 |
| | 88,197 |
| | 84,238 |
|
| Net interest income | $ | 469,187 |
| | $ | 464,849 |
| | $ | 452,842 |
| | $ | 448,833 |
| | $ | 425,377 |
|
| Taxable-equivalent net interest income | 475,699 |
| | 470,913 |
| | 458,242 |
| | 453,780 |
| | 429,782 |
|
| Total noninterest income | 144,887 |
| | 125,717 |
| | 116,761 |
| | 118,641 |
| | 125,944 |
|
| Total noninterest expense | 403,292 |
| | 381,894 |
| | 395,573 |
| | 397,353 |
| | 391,280 |
|
Adjusted pre-provision net revenue 2 | 208,484 |
| | 211,472 |
| | 182,124 |
| | 174,013 |
| | 171,204 |
|
| Provision for loan losses | 18,825 |
| | 34,492 |
| | 42,145 |
| | 22,701 |
| | 18,262 |
|
| Provision for unfunded lending commitments | (3,165 | ) | | (4,246 | ) | | (5,812 | ) | | (6,551 | ) | | 1,428 |
|
| Provision for credit losses | 15,660 |
| | 30,246 |
| | 36,333 |
| | 16,150 |
| | 19,690 |
|
| PER COMMON SHARE | | | | | | | | | |
| Net earnings per diluted common share | $ | 0.57 |
| | $ | 0.44 |
| | $ | 0.38 |
| | $ | 0.43 |
| | $ | 0.41 |
|
| Dividends | 0.08 |
| | 0.06 |
| | 0.06 |
| | 0.06 |
| | 0.06 |
|
Book value per common share 1 | 34.19 |
| | 33.72 |
| | 33.23 |
| | 32.67 |
| | 32.47 |
|
Tangible book value per common share 1, 2 | 29.16 |
| | 28.72 |
| | 28.20 |
| | 27.63 |
| | 27.42 |
|
| SELECTED RATIOS AND OTHER DATA | | | | | | | | | |
| Return on average assets | 0.84 | % | | 0.77 | % | | 0.62 | % | | 0.68 | % | | 0.69 | % |
| Return on average common equity | 6.66 | % | | 5.30 | % | | 4.67 | % | | 5.17 | % | | 5.02 | % |
Tangible return on average tangible common equity 2 | 7.88 | % | | 6.31 | % | | 5.59 | % | | 6.20 | % | | 6.05 | % |
| Net interest margin | 3.36 | % | | 3.39 | % | | 3.35 | % | | 3.23 | % | | 3.11 | % |
Efficiency ratio 2 | 66.0 | % | | 64.5 | % | | 68.5 | % | | 69.6 | % | | 69.1 | % |
| Effective tax rate | 33.7 | % | | 34.6 | % | | 31.4 | % | | 30.5 | % | | 28.8 | % |
| Ratio of nonperforming assets to loans and leases and other real estate owned | 1.37 | % | | 1.30 | % | | 1.33 | % | | 0.87 | % | | 0.92 | % |
| Annualized ratio of net loan and lease charge-offs to average loans | 0.28 | % | | 0.36 | % | | 0.35 | % | | 0.13 | % | | 0.31 | % |
Ratio of total allowance for credit losses to loans and leases outstanding 1 | 1.55 | % | | 1.58 | % | | 1.64 | % | | 1.68 | % | | 1.69 | % |
| Full-time equivalent employees | 9,968 |
| | 10,064 |
| | 10,092 |
| | 10,200 |
| | 10,219 |
|
CAPITAL RATIOS 1 | | | | | | | | | |
| Tangible common equity ratio | 9.91 | % | | 10.05 | % | | 9.92 | % | | 9.63 | % | | 9.76 | % |
Basel III: 3 | | | | | | | | | |
| Common equity tier 1 capital | 12.0 | % | | 12.0 | % | | 12.1 | % | | 12.2 | % | | 12.2 | % |
| Tier 1 leverage | 11.3 | % | | 11.3 | % | | 11.4 | % | | 11.3 | % | | 11.6 | % |
| Tier 1 risk-based capital | 13.5 | % | | 13.4 | % | | 13.9 | % | | 14.1 | % | | 14.4 | % |
| Total risk-based capital | 15.3 | % | | 15.5 | % | | 16.0 | % | | 16.1 | % | | 16.5 | % |
| Risk-weighted assets | 49,317,815 |
| | 49,016,859 |
| | 47,695,790 |
| | 46,747,245 |
| | 46,313,188 |
|
| Weighted average common and common-equivalent shares outstanding | 204,714,158 |
| | 204,536,196 |
| | 204,095,529 |
| | 204,276,930 |
| | 204,154,880 |
|
Common shares outstanding 1 | 203,850,072 |
| | 205,103,566 |
| | 204,543,707 |
| | 204,417,093 |
| | 204,278,594 |
|
| |
2 | For information on non-GAAP financial measures see pages 15-17. |
| |
3 | Basel III capital ratios became effective January 1, 2015 and are based on the applicable phase-in periods. Current period ratios and amounts represent estimates. |
ZIONS BANCORPORATION
Press Release – Page 9
October 24, 2016
CONSOLIDATED BALANCE SHEETS
|
| | | | | | | | | | | | | | | | | | | |
| (In thousands, except shares) | September 30,
2016 | | June 30,
2016 | | March 31,
2016 | | December 31,
2015 | | September 30,
2015 |
| | (Unaudited) | | (Unaudited) | | (Unaudited) | |
| | (Unaudited) |
| ASSETS | | | | | | | | | |
| Cash and due from banks | $ | 553,152 |
| | $ | 560,262 |
| | $ | 517,803 |
| | $ | 798,319 |
| | $ | 602,694 |
|
| Money market investments: | | | | | | | | | |
| Interest-bearing deposits | 1,489,134 |
| | 2,154,959 |
| | 3,039,090 |
| | 6,108,124 |
| | 6,558,678 |
|
| Federal funds sold and security resell agreements | 1,675,645 |
| | 620,469 |
| | 1,587,212 |
| | 619,758 |
| | 1,325,501 |
|
| Investment securities: | | | | | | | | | |
| Held-to-maturity, at amortized cost (approximate fair value $717,822, $720,991, $636,484, $552,088, and $553,088) | 715,279 |
| | 713,392 |
| | 631,646 |
| | 545,648 |
| | 544,168 |
|
| Available-for-sale, at fair value | 10,358,083 |
| | 9,477,089 |
| | 8,701,885 |
| | 7,643,116 |
| | 6,000,011 |
|
| Trading account, at fair value | 108,004 |
| | 118,775 |
| | 65,838 |
| | 48,168 |
| | 73,521 |
|
| | 11,181,366 |
| | 10,309,256 |
| | 9,399,369 |
| | 8,236,932 |
| | 6,617,700 |
|
| Loans held for sale | 160,287 |
| | 146,512 |
| | 108,764 |
| | 149,880 |
| | 139,122 |
|
| Loans and leases, net of unearned income and fees | 42,539,720 |
| | 42,501,575 |
| | 41,418,185 |
| | 40,649,542 |
| | 40,113,123 |
|
| Less allowance for loan losses | 597,185 |
| | 608,345 |
| | 611,894 |
| | 606,048 |
| | 596,440 |
|
| Loans held for investment, net of allowance | 41,942,535 |
| | 41,893,230 |
| | 40,806,291 |
| | 40,043,494 |
| | 39,516,683 |
|
| Other noninterest-bearing investments | 894,110 |
| | 850,578 |
| | 855,813 |
| | 848,144 |
| | 851,225 |
|
| Premises, equipment and software, net | 986,553 |
| | 955,540 |
| | 925,430 |
| | 905,462 |
| | 873,800 |
|
| Goodwill | 1,014,129 |
| | 1,014,129 |
| | 1,014,129 |
| | 1,014,129 |
| | 1,014,129 |
|
| Core deposit and other intangibles | 10,329 |
| | 12,281 |
| | 14,259 |
| | 16,272 |
| | 18,546 |
|
| Other real estate owned | 8,358 |
| | 8,354 |
| | 10,411 |
| | 7,092 |
| | 12,799 |
|
| Other assets | 1,123,262 |
| | 1,117,422 |
| | 901,342 |
| | 916,937 |
| | 874,841 |
|
| | $ | 61,038,860 |
| | $ | 59,642,992 |
| | $ | 59,179,913 |
| | $ | 59,664,543 |
| | $ | 58,405,718 |
|
| | | | | | | | | | |
| LIABILITIES AND SHAREHOLDERS’ EQUITY | | | | | | | | | |
| Deposits: | | | | | | | | | |
| Noninterest-bearing demand | $ | 22,710,778 |
| | $ | 22,276,600 |
| | $ | 21,872,274 |
| | $ | 22,276,664 |
| | $ | 21,572,022 |
|
| Interest-bearing: | | | | | | | | | |
| Savings and money market | 25,502,628 |
| | 25,540,525 |
| | 25,723,996 |
| | 25,672,356 |
| | 24,690,359 |
|
| Time | 2,516,493 |
| | 2,336,088 |
| | 2,071,688 |
| | 2,130,680 |
| | 2,216,206 |
|
| Foreign | 118,762 |
| | 117,708 |
| | 219,899 |
| | 294,391 |
| | 441,560 |
|
| | 50,848,661 |
| | 50,270,921 |
| | 49,887,857 |
| | 50,374,091 |
| | 48,920,147 |
|
| Federal funds and other short-term borrowings | 1,115,561 |
| | 270,255 |
| | 232,188 |
| | 346,987 |
| | 272,391 |
|
| Long-term debt | 570,385 |
| | 698,712 |
| | 802,448 |
| | 812,366 |
| | 939,543 |
|
| Reserve for unfunded lending commitments | 61,615 |
| | 64,780 |
| | 69,026 |
| | 74,838 |
| | 81,389 |
|
| Other liabilities | 763,331 |
| | 711,941 |
| | 562,657 |
| | 548,742 |
| | 554,153 |
|
| Total liabilities | 53,359,553 |
| | 52,016,609 |
| | 51,554,176 |
| | 52,157,024 |
| | 50,767,623 |
|
| Shareholders’ equity: | | | | | | | | | |
| Preferred stock, without par value, authorized 4,400,000 shares | 709,601 |
| | 709,601 |
| | 828,490 |
| | 828,490 |
| | 1,004,159 |
|
| Common stock, without par value; authorized 350,000,000 shares; issued and outstanding 203,850,072, 205,103,566, 204,543,707, 204,417,093 and 204,278,594 shares | 4,747,912 |
| | 4,783,061 |
| | 4,777,630 |
| | 4,766,731 |
| | 4,756,288 |
|
| Retained earnings | 2,211,793 |
| | 2,110,069 |
| | 2,031,270 |
| | 1,966,910 |
| | 1,894,623 |
|
| Accumulated other comprehensive income (loss) | 10,001 |
| | 23,652 |
| | (11,653 | ) | | (54,612 | ) | | (16,975 | ) |
| Total shareholders’ equity | 7,679,307 |
| | 7,626,383 |
| | 7,625,737 |
| | 7,507,519 |
| | 7,638,095 |
|
| | $ | 61,038,860 |
| | $ | 59,642,992 |
| | $ | 59,179,913 |
| | $ | 59,664,543 |
| | $ | 58,405,718 |
|
ZIONS BANCORPORATION
Press Release – Page 10
October 24, 2016
CONSOLIDATED STATEMENTS OF INCOME
(Unaudited)
|
| | | | | | | | | | | | | | | | | | | |
| | Three Months Ended |
| (In thousands, except per share amounts) | September 30,
2016 | | June 30,
2016 | | March 31,
2016 | | December 31,
2015 | | September 30,
2015 |
| Interest income: | | | | | | | | | |
| Interest and fees on loans | $ | 436,424 |
| | $ | 433,743 |
| | $ | 420,508 |
| | $ | 429,842 |
| | $ | 419,981 |
|
| Interest on money market investments | 4,934 |
| | 5,564 |
| | 7,029 |
| | 6,144 |
| | 6,018 |
|
| Interest on securities | 49,337 |
| | 47,645 |
| | 47,364 |
| | 37,573 |
| | 30,231 |
|
| Total interest income | 490,695 |
| | 486,952 |
| | 474,901 |
| | 473,559 |
| | 456,230 |
|
| Interest expense: | | | | | | | | | |
| Interest on deposits | 12,549 |
| | 11,869 |
| | 11,845 |
| | 12,377 |
| | 12,542 |
|
| Interest on short- and long-term borrowings | 8,959 |
| | 10,234 |
| | 10,214 |
| | 12,349 |
| | 18,311 |
|
| Total interest expense | 21,508 |
| | 22,103 |
| | 22,059 |
| | 24,726 |
| | 30,853 |
|
| Net interest income | 469,187 |
| | 464,849 |
| | 452,842 |
| | 448,833 |
| | 425,377 |
|
| Provision for loan losses | 18,825 |
| | 34,492 |
| | 42,145 |
| | 22,701 |
| | 18,262 |
|
| Net interest income after provision for loan losses | 450,362 |
| | 430,357 |
| | 410,697 |
| | 426,132 |
| | 407,115 |
|
| Noninterest income: | | | | | | | | | |
| Service charges and fees on deposit accounts | 44,490 |
| | 42,108 |
| | 41,261 |
| | 42,445 |
| | 43,196 |
|
| Other service charges, commissions and fees | 54,141 |
| | 51,906 |
| | 49,474 |
| | 49,335 |
| | 47,968 |
|
| Wealth management income | 9,973 |
| | 8,788 |
| | 7,954 |
| | 7,953 |
| | 7,496 |
|
| Loan sales and servicing income | 11,301 |
| | 10,178 |
| | 7,979 |
| | 6,915 |
| | 7,728 |
|
| Capital markets and foreign exchange | 5,726 |
| | 4,545 |
| | 5,667 |
| | 6,255 |
| | 6,624 |
|
| Dividends and other investment income | 9,045 |
| | 6,226 |
| | 4,639 |
| | 2,986 |
| | 8,449 |
|
| Fair value and nonhedge derivative income (loss) | (184 | ) | | (1,910 | ) | | (2,585 | ) | | 688 |
| | (1,555 | ) |
| Equity securities gains (losses), net | 8,441 |
| | 2,709 |
| | (550 | ) | | 53 |
| | 3,630 |
|
| Fixed income securities gains (losses), net | 39 |
| | 25 |
| | 28 |
| | (7 | ) | | (53 | ) |
| Other | 1,915 |
| | 1,142 |
| | 2,894 |
| | 2,018 |
| | 2,461 |
|
| Total noninterest income | 144,887 |
| | 125,717 |
| | 116,761 |
| | 118,641 |
| | 125,944 |
|
| Noninterest expense: | | | | | | | | | |
| Salaries and employee benefits | 242,251 |
| | 241,341 |
| | 258,338 |
| | 236,037 |
| | 242,023 |
|
| Occupancy, net | 33,536 |
| | 29,621 |
| | 29,779 |
| | 30,618 |
| | 29,477 |
|
| Furniture, equipment and software, net | 29,090 |
| | 30,550 |
| | 32,015 |
| | 31,820 |
| | 30,416 |
|
| Other real estate expense, net | (137 | ) | | (527 | ) | | (1,329 | ) | | (536 | ) | | (40 | ) |
| Credit-related expense | 6,825 |
| | 5,845 |
| | 5,934 |
| | 7,582 |
| | 6,914 |
|
| Provision for unfunded lending commitments | (3,165 | ) | | (4,246 | ) | | (5,812 | ) | | (6,551 | ) | | 1,428 |
|
| Professional and legal services | 14,473 |
| | 12,229 |
| | 11,471 |
| | 13,129 |
| | 12,699 |
|
| Advertising | 5,985 |
| | 5,268 |
| | 5,628 |
| | 5,692 |
| | 6,136 |
|
| FDIC premiums | 11,673 |
| | 9,580 |
| | 7,154 |
| | 9,194 |
| | 8,500 |
|
| Amortization of core deposit and other intangibles | 1,951 |
| | 1,979 |
| | 2,014 |
| | 2,273 |
| | 2,298 |
|
| Debt extinguishment cost | — |
| | 106 |
| | 247 |
| | 135 |
| | — |
|
| Other | 60,810 |
| | 50,148 |
| | 50,134 |
| | 67,960 |
| | 51,429 |
|
| Total noninterest expense | 403,292 |
| | 381,894 |
| | 395,573 |
| | 397,353 |
| | 391,280 |
|
| Income before income taxes | 191,957 |
| | 174,180 |
| | 131,885 |
| | 147,420 |
| | 141,779 |
|
| Income taxes | 64,694 |
| | 60,231 |
| | 41,448 |
| | 44,933 |
| | 40,780 |
|
| Net income | 127,263 |
| | 113,949 |
| | 90,437 |
| | 102,487 |
| | 100,999 |
|
| Preferred stock dividends | (10,368 | ) | | (13,543 | ) | | (11,660 | ) | | (14,290 | ) | | (16,761 | ) |
| Preferred stock redemption | — |
| | (9,759 | ) | | — |
| | — |
| | — |
|
| Net earnings applicable to common shareholders | $ | 116,895 |
| | $ | 90,647 |
| | $ | 78,777 |
| | $ | 88,197 |
| | $ | 84,238 |
|
| | | | | | | | | | |
| Weighted average common shares outstanding during the period: | | | | | | | | |
| Basic shares | 204,312 |
| | 204,236 |
| | 203,967 |
| | 203,884 |
| | 203,668 |
|
| Diluted shares | 204,714 |
| | 204,536 |
| | 204,096 |
| | 204,277 |
| | 204,155 |
|
| Net earnings per common share: | | | | | | | | | |
| Basic | $ | 0.57 |
| | $ | 0.44 |
| | $ | 0.38 |
| | $ | 0.43 |
| | $ | 0.41 |
|
| Diluted | 0.57 |
| | 0.44 |
| | 0.38 |
| | 0.43 |
| | 0.41 |
|
ZIONS BANCORPORATION
Press Release – Page 11
October 24, 2016
Loan Balances Held for Investment by Portfolio Type
(Unaudited)
|
| | | | | | | | | | | | | | | | | | | | | | | | | | | | | |
| (In millions) | September 30,
2016 | | June 30,
2016 | | March 31,
2016 | | December 31,
2015 | | September 30,
2015 |
| Commercial: | | | | | | | | | | | | | | | | | | | |
| Commercial and industrial | | $ | 13,543 |
| | | | $ | 13,757 |
| | | | $ | 13,590 |
| | | | $ | 13,211 |
| | | | $ | 13,035 |
| |
| Leasing | | 439 |
| | | | 426 |
| | | | 437 |
| | | | 442 |
| | | | 427 |
| |
| Owner occupied | | 6,889 |
| | | | 6,989 |
| | | | 7,022 |
| | | | 7,150 |
| | | | 7,141 |
| |
| Municipal | | 753 |
| | | | 756 |
| | | | 696 |
| | | | 676 |
| | | | 600 |
| |
| Total commercial | | 21,624 |
| | | | 21,928 |
| | | | 21,745 |
| | | | 21,479 |
| | | | 21,203 |
| |
| Commercial real estate: | | | | | | | | | | | | | | | | | | | |
| Construction and land development | | 2,147 |
| | | | 2,088 |
| | | | 1,968 |
| | | | 1,842 |
| | | | 2,214 |
| |
| Term | | 9,303 |
| | | | 9,230 |
| | | | 8,826 |
| | | | 8,514 |
| | | | 8,089 |
| |
| Total commercial real estate | | 11,450 |
| | | | 11,318 |
| | | | 10,794 |
| | | | 10,356 |
| | | | 10,303 |
| |
| Consumer: | | | | | | | | | | | | | | | | | | | |
| Home equity credit line | | 2,581 |
| | | | 2,507 |
| | | | 2,433 |
| | | | 2,417 |
| | | | 2,347 |
| |
| 1-4 family residential | | 5,785 |
| | | | 5,680 |
| | | | 5,418 |
| | | | 5,382 |
| | | | 5,269 |
| |
| Construction and other consumer real estate | | 453 |
| | | | 419 |
| | | | 401 |
| | | | 385 |
| | | | 370 |
| |
| Bankcard and other revolving plans | | 458 |
| | | | 460 |
| | | | 439 |
| | | | 444 |
| | | | 428 |
| |
| Other | | 189 |
| | | | 189 |
| | | | 188 |
| | | | 187 |
| | | | 193 |
| |
| Total consumer | | 9,466 |
| | | | 9,255 |
| | | | 8,879 |
| | | | 8,815 |
| | | | 8,607 |
| |
| Loans and leases, net of unearned income and fees | | $ | 42,540 |
| | | | $ | 42,501 |
| | | | $ | 41,418 |
| | | | $ | 40,650 |
| | | | $ | 40,113 |
| |
Nonperforming Assets
(Unaudited)
|
| | | | | | | | | | | | | | | | | | | |
| (In thousands) | September 30,
2016 | | June 30,
2016 | | March 31,
2016 | | December 31,
2015 | | September 30,
2015 |
| | | | | | | | | | |
| Nonaccrual loans | $ | 578,832 |
| | $ | 547,402 |
| | $ | 541,768 |
| | $ | 349,860 |
| | $ | 359,272 |
|
| Other real estate owned | 8,358 |
| | 8,354 |
| | 10,411 |
| | 7,092 |
| | 12,799 |
|
| Total nonperforming assets | $ | 587,190 |
| | $ | 555,756 |
| | $ | 552,179 |
| | $ | 356,952 |
| | $ | 372,071 |
|
Ratio of nonperforming assets to loans1 and leases and other real estate owned | 1.37 | % | | 1.30 | % | | 1.33 | % | | 0.87 | % | | 0.92 | % |
| Accruing loans past due 90 days or more | $ | 28,835 |
| | $ | 28,994 |
| | $ | 37,202 |
| | $ | 32,024 |
| | $ | 34,857 |
|
Ratio of accruing loans past due 90 days or more to loans1 and leases | 0.07 | % | | 0.07 | % | | 0.09 | % | | 0.08 | % | | 0.09 | % |
| Nonaccrual loans and accruing loans past due 90 days or more | $ | 607,667 |
| | $ | 576,396 |
| | $ | 578,970 |
| | $ | 381,884 |
| | $ | 394,129 |
|
Ratio of nonaccrual loans and accruing loans past due 90 days or more to loans1 and leases | 1.42 | % | | 1.35 | % | | 1.39 | % | | 0.94 | % | | 0.98 | % |
| Accruing loans past due 30-89 days | $ | 164,027 |
| | $ | 132,522 |
| | $ | 100,341 |
| | $ | 121,732 |
| | $ | 118,361 |
|
| Restructured loans included in nonaccrual loans | 125,323 |
| | 143,379 |
| | 132,524 |
| | 103,004 |
| | 108,387 |
|
| Restructured loans on accrual | 169,784 |
| | 171,854 |
| | 195,482 |
| | 194,084 |
| | 178,136 |
|
| Classified loans | 1,615,348 |
| | 1,610,263 |
| | 1,532,052 |
| | 1,368,022 |
| | 1,322,924 |
|
1 Includes loans held for sale.
ZIONS BANCORPORATION
Press Release – Page 12
October 24, 2016
Allowance for Credit Losses
(Unaudited)
|
| | | | | | | | | | | | | | | | | | | |
| | Three Months Ended |
| (In thousands) | September 30,
2016 | | June 30,
2016 | | March 31,
2016 | | December 31,
2015 | | September 30,
2015 |
| Allowance for Loan Losses | | | | | | | | | |
| Balance at beginning of period | $ | 608,345 |
| | $ | 611,894 |
| | $ | 606,048 |
| | $ | 596,440 |
| | $ | 609,375 |
|
| Add: | | | | | | | | | |
| Provision for losses | 18,825 |
| | 34,492 |
| | 42,145 |
| | 22,701 |
| | 18,262 |
|
| Adjustment for FDIC-supported/PCI loans | — |
| | — |
| | — |
| | 5 |
| | — |
|
| Deduct: | | | | | | | | | |
| Gross loan and lease charge-offs | (53,763 | ) | | (57,629 | ) | | (48,110 | ) | | (45,334 | ) | | (42,359 | ) |
| Recoveries | 23,778 |
| | 19,588 |
| | 11,811 |
| | 32,236 |
| | 11,162 |
|
| Net loan and lease charge-offs | (29,985 | ) | | (38,041 | ) | | (36,299 | ) | | (13,098 | ) | | (31,197 | ) |
| Balance at end of period | $ | 597,185 |
| | $ | 608,345 |
| | $ | 611,894 |
| | $ | 606,048 |
| | $ | 596,440 |
|
| Ratio of allowance for loan losses to loans and leases, at period end | 1.40 | % | | 1.43 | % | | 1.48 | % | | 1.49 | % | | 1.49 | % |
| Ratio of allowance for loan losses to nonperforming loans, at period end | 103 | % | | 111 | % | | 113 | % | | 173 | % | | 166 | % |
| Annualized ratio of net loan and lease charge-offs to average loans | 0.28 | % | | 0.36 | % | | 0.35 | % | | 0.13 | % | | 0.31 | % |
| | | | | | | | | | |
| Reserve for Unfunded Lending Commitments | | | | | | | | | |
| Balance at beginning of period | $ | 64,780 |
| | $ | 69,026 |
| | $ | 74,838 |
| | $ | 81,389 |
| | $ | 79,961 |
|
| Provision charged (credited) to earnings | (3,165 | ) | | (4,246 | ) | | (5,812 | ) | | (6,551 | ) | | 1,428 |
|
| Balance at end of period | $ | 61,615 |
| | $ | 64,780 |
| | $ | 69,026 |
| | $ | 74,838 |
| | $ | 81,389 |
|
| Total Allowance for Credit Losses | | | | | | | | | |
| Allowance for loan losses | $ | 597,185 |
| | $ | 608,345 |
| | $ | 611,894 |
| | $ | 606,048 |
| | $ | 596,440 |
|
| Reserve for unfunded lending commitments | 61,615 |
| | 64,780 |
| | 69,026 |
| | 74,838 |
| | 81,389 |
|
| Total allowance for credit losses | $ | 658,800 |
| | $ | 673,125 |
| | $ | 680,920 |
| | $ | 680,886 |
| | $ | 677,829 |
|
| Ratio of total allowance for credit losses to loans and leases outstanding, at period end | 1.55 | % | | 1.58 | % | | 1.64 | % | | 1.68 | % | | 1.69 | % |
ZIONS BANCORPORATION
Press Release – Page 13
October 24, 2016
Nonaccrual Loans by Portfolio Type
(Unaudited)
|
| | | | | | | | | | | | | | | | | | | | | | | | | | | | | |
| (In millions) | September 30,
2016 | | June 30,
2016 | | March 31,
2016 | | December 31,
2015 | | September 30,
2015 |
| | | | | | | | | | | | | | | | | | | | |
| Loans held for sale | | $ | 29 |
| | | | $ | 13 |
| | | | $ | — |
| | | | $ | — |
| | | | $ | — |
| |
| | | | | | | | | | | | | | | | | | | | |
| Commercial: | | | | | | | | | | | | | | | | | | | |
| Commercial and industrial | | $ | 387 |
| | | | $ | 341 |
| | | | $ | 356 |
| | | | $ | 164 |
| | | | $ | 167 |
| |
| Leasing | | 14 |
| | | | 14 |
| | | | 14 |
| | | | 4 |
| | | | — |
| |
| Owner occupied | | 66 |
| | | | 69 |
| | | | 74 |
| | | | 74 |
| | | | 77 |
| |
| Municipal | | 1 |
| | | | 1 |
| | | | 1 |
| | | | 1 |
| | | | 1 |
| |
| Total commercial | | 468 |
| | | | 425 |
| | | | 445 |
| | | | 243 |
| | | | 245 |
| |
| Commercial real estate: | | | | | | | | | | | | | | | | | | | |
| Construction and land development | | 4 |
| | | | 5 |
| | | | 6 |
| | | | 7 |
| | | | 15 |
| |
| Term | | 28 |
| | | | 51 |
| | | | 33 |
| | | | 40 |
| | | | 39 |
| |
| Total commercial real estate | | 32 |
| | | | 56 |
| | | | 39 |
| | | | 47 |
| | | | 54 |
| |
| Consumer: | | | | | | | | | | | | | | | | | | | |
| Home equity credit line | | 11 |
| | | | 12 |
| | | | 11 |
| | | | 8 |
| | | | 10 |
| |
| 1-4 family residential | | 36 |
| | | | 39 |
| | | | 44 |
| | | | 50 |
| | | | 48 |
| |
| Construction and other consumer real estate | | 1 |
| | | | 1 |
| | | | 1 |
| | | | 1 |
| | | | 1 |
| |
| Bankcard and other revolving plans | | 2 |
| | | | 1 |
| | | | 2 |
| | | | 1 |
| | | | 1 |
| |
| Other | | — |
| | | | — |
| | | | — |
| | | | — |
| | | | — |
| |
| Total consumer | | 50 |
| | | | 53 |
| | | | 58 |
| | | | 60 |
| | | | 60 |
| |
| Total nonaccrual loans | | $ | 579 |
| | | | $ | 547 |
| | | | $ | 542 |
| | | | $ | 350 |
| | | | $ | 359 |
| |
Net Charge-Offs by Portfolio Type
(Unaudited)
|
| | | | | | | | | | | | | | | | | | | | | | | | | | | | | |
| | Three Months Ended |
| (In millions) | September 30,
2016 | | June 30,
2016 | | March 31,
2016 | | December 31,
2015 | | September 30,
2015 |
| Commercial: | | | | | | | | | | | | | | | | | | | |
| Commercial and industrial | | $ | 33 |
| | | | $ | 32 |
| | | | $ | 37 |
| | | | $ | 18 |
| | | | $ | 30 |
| |
| Leasing | | — |
| | | | — |
| | | | — |
| | | | — |
| | | | — |
| |
| Owner occupied | | — |
| | | | — |
| | | | (1 | ) | | | | — |
| | | | 3 |
| |
| Municipal | | — |
| | | | — |
| | | | — |
| | | | — |
| | | | — |
| |
| Total commercial | | 33 |
| | | | 32 |
| | | | 36 |
| | | | 18 |
| | | | 33 |
| |
| Commercial real estate: | | | | | | | | | | | | | | | | | | | |
| Construction and land development | | (1 | ) | | | | (1 | ) | | | | (2 | ) | | | | (2 | ) | | | | (2 | ) | |
| Term | | (5 | ) | | | | 7 |
| | | | — |
| | | | (4 | ) | | | | (1 | ) | |
| Total commercial real estate | | (6 | ) | | | | 6 |
| | | | (2 | ) | | | | (6 | ) | | | | (3 | ) | |
| Consumer: | | | | | | | | | | | | | | | | | | | |
| Home equity credit line | | 1 |
| | | | — |
| | | | 1 |
| | | | (1 | ) | | | | 1 |
| |
| 1-4 family residential | | — |
| | | | (1 | ) | | | | 1 |
| | | | 1 |
| | | | — |
| |
| Construction and other consumer real estate | | — |
| | | | — |
| | | | — |
| | | | (1 | ) | | | | (1 | ) | |
| Bankcard and other revolving plans | | 2 |
| | | | 1 |
| | | | — |
| | | | 2 |
| | | | — |
| |
| Other | | — |
| | | | — |
| | | | — |
| | | | — |
| | | | 1 |
| |
| Total consumer loans | | 3 |
| | | | — |
| | | | 2 |
| | | | 1 |
| | | | 1 |
| |
| Total net charge-offs (recoveries) | | $ | 30 |
| | | | $ | 38 |
| | | | $ | 36 |
| | | | $ | 13 |
| | | | $ | 31 |
| |
ZIONS BANCORPORATION
Press Release – Page 14
October 24, 2016
CONSOLIDATED AVERAGE BALANCE SHEETS, YIELDS AND RATES
(Unaudited) |
| | | | | | | | | | | | | | | | | | | | |
| | Three Months Ended |
| | September 30, 2016 | | June 30, 2016 | | September 30, 2015 |
| (In thousands) | Average balance | | Average yield/rate 1 | | Average balance | | Average
yield/rate 1 | | Average balance | | Average
yield/rate 1 |
| ASSETS | | | | | | | | | | | |
| Money market investments | $ | 3,139,771 |
| | 0.63 | % | | $ | 4,045,333 |
| | 0.55 | % | | $ | 8,775,823 |
| | 0.27 | % |
| Securities: | | | | | | | | | | | |
| Held-to-maturity | 706,012 |
| | 4.33 | % | | 669,372 |
| | 4.46 | % | | 553,615 |
| | 5.07 | % |
| Available-for-sale | 9,697,759 |
| | 1.82 | % | | 8,852,688 |
| | 1.93 | % | | 5,254,986 |
| | 1.85 | % |
| Trading account | 80,591 |
| | 3.34 | % | | 78,479 |
| | 3.88 | % | | 47,235 |
| | 3.74 | % |
| Total securities | 10,484,362 |
| | 2.00 | % | | 9,600,539 |
| | 2.13 | % | | 5,855,836 |
| | 2.17 | % |
| Loans held for sale | 132,602 |
| | 3.34 | % | | 126,045 |
| | 3.52 | % | | 131,113 |
| | 3.70 | % |
Loans held for investment 2: | | | | | | | | | | | |
| Commercial | 21,815,443 |
| | 4.19 | % | | 21,934,114 |
| | 4.20 | % | | 21,289,641 |
| | 4.15 | % |
| Commercial real estate | 11,331,183 |
| | 4.19 | % | | 11,169,157 |
| | 4.31 | % | | 10,170,539 |
| | 4.47 | % |
| Consumer | 9,340,297 |
| | 3.81 | % | | 9,004,845 |
| | 3.88 | % | | 8,565,075 |
| | 3.90 | % |
| Total loans held for investment | 42,486,923 |
| | 4.11 | % | | 42,108,116 |
| | 4.16 | % | | 40,025,255 |
| | 4.18 | % |
| Total interest-earning assets | 56,243,658 |
| | 3.52 | % | | 55,880,033 |
| | 3.55 | % | | 54,788,027 |
| | 3.34 | % |
| Cash and due from banks | 555,945 |
| | | | 520,769 |
| | | | 583,936 |
| | |
| Allowance for loan losses | (608,948 | ) | | | | (606,228 | ) | | | | (602,677 | ) | | |
| Goodwill | 1,014,129 |
| | | | 1,014,129 |
| | | | 1,014,129 |
| | |
| Core deposit and other intangibles | 11,576 |
| | | | 13,527 |
| | | | 19,726 |
| | |
| Other assets | 2,845,876 |
| | | | 2,723,529 |
| | | | 2,597,278 |
| | |
| Total assets | $ | 60,062,236 |
| | | | $ | 59,545,759 |
| | | | $ | 58,400,419 |
| | |
| | | | | | | | | | | | |
| LIABILITIES AND SHAREHOLDERS’ EQUITY | | | | | | | | | | |
| Interest-bearing deposits: | | | | | | | | | | | |
| Savings and money market | $ | 25,682,829 |
| | 0.15 | % | | $ | 25,779,999 |
| | 0.14 | % | | $ | 24,676,897 |
| | 0.16 | % |
| Time | 2,409,092 |
| | 0.51 | % | | 2,192,366 |
| | 0.46 | % | | 2,242,064 |
| | 0.43 | % |
| Foreign | 116,678 |
| | 0.30 | % | | 138,583 |
| | 0.28 | % | | 441,670 |
| | 0.18 | % |
| Total interest-bearing deposits | 28,208,599 |
| | 0.18 | % | | 28,110,948 |
| | 0.17 | % | | 27,360,631 |
| | 0.18 | % |
| Borrowed funds: | | | | | | | | | | | |
| Federal funds and other short-term borrowings | 343,358 |
| | 0.22 | % | | 546,707 |
| | 0.24 | % | | 211,322 |
| | 0.14 | % |
| Long-term debt | 679,990 |
| | 5.13 | % | | 790,103 |
| | 5.05 | % | | 1,028,457 |
| | 7.03 | % |
| Total borrowed funds | 1,023,348 |
| | 3.48 | % | | 1,336,810 |
| | 3.08 | % | | 1,239,779 |
| | 5.86 | % |
| Total interest-bearing liabilities | 29,231,947 |
| | 0.29 | % | | 29,447,758 |
| | 0.30 | % | | 28,600,410 |
| | 0.43 | % |
| Noninterest-bearing deposits | 22,466,132 |
| | | | 21,839,395 |
| | | | 21,558,557 |
| | |
| Other liabilities | 668,180 |
| | | | 596,697 |
| | | | 581,880 |
| | |
| Total liabilities | 52,366,259 |
| | | | 51,883,850 |
| | | | 50,740,847 |
| | |
| Shareholders’ equity: | | | | | | | | | | | |
| Preferred equity | 709,601 |
| | | | 778,844 |
| | | | 1,004,059 |
| | |
| Common equity | 6,986,376 |
| | | | 6,883,065 |
| | | | 6,655,513 |
| | |
| Total shareholders’ equity | 7,695,977 |
| | | | 7,661,909 |
| | | | 7,659,572 |
| | |
| Total liabilities and shareholders’ equity | $ | 60,062,236 |
| | | | $ | 59,545,759 |
| | | | $ | 58,400,419 |
| | |
| | | | | | | | | | | | |
| Spread on average interest-bearing funds | | | 3.23 | % | | | | 3.25 | % | | | | 2.91 | % |
| | | | | | | | | | | | |
| Net yield on interest-earning assets | | | 3.36 | % | | | | 3.39 | % | | | | 3.11 | % |
1 Taxable-equivalent rates used where applicable.
2 Net of unearned income and fees, net of related costs. Loans include nonaccrual and restructured loans.
ZIONS BANCORPORATION
Press Release – Page 15
October 24, 2016
GAAP to Non-GAAP Reconciliations
(Unaudited)
|
| | | | | | | | | | | | | | | | | | | | |
| (In thousands, except per share amounts) | | September 30,
2016 | | June 30,
2016 | | March 31,
2016 | | December 31,
2015 | | September 30,
2015 |
| Tangible Book Value per Common Share | | | | | | | | |
| | | | | | | | | | | |
| Total shareholders’ equity (GAAP) | | $ | 7,679,307 |
| | $ | 7,626,383 |
| | $ | 7,625,737 |
| | $ | 7,507,519 |
| | $ | 7,638,095 |
|
| Preferred stock | | (709,601 | ) | | (709,601 | ) | | (828,490 | ) | | (828,490 | ) | | (1,004,159 | ) |
| Goodwill | | (1,014,129 | ) | | (1,014,129 | ) | | (1,014,129 | ) | | (1,014,129 | ) | | (1,014,129 | ) |
| Core deposit and other intangibles | | (10,329 | ) | | (12,281 | ) | | (14,259 | ) | | (16,272 | ) | | (18,546 | ) |
| Tangible common equity (non-GAAP) | (a) | $ | 5,945,248 |
| | $ | 5,890,372 |
| | $ | 5,768,859 |
| | $ | 5,648,628 |
| | $ | 5,601,261 |
|
| Common shares outstanding | (b) | 203,850 |
| | 205,104 |
| | 204,544 |
| | 204,417 |
| | 204,279 |
|
| Tangible book value per common share (non-GAAP) | (a/b) | $ | 29.16 |
| | $ | 28.72 |
| | $ | 28.20 |
| | $ | 27.63 |
| | $ | 27.42 |
|
| | | | | | | | | | | |
| | | Three Months Ended |
| (Dollar amounts in thousands) | | September 30,
2016 | | June 30,
2016 | | March 31,
2016 | | December 31,
2015 | | September 30,
2015 |
| Tangible Return on Average Tangible Common Equity | | | | | | | | |
| | | | | | | | | | | |
| Net earnings applicable to common shareholders (GAAP) | | $ | 116,895 |
| | $ | 90,647 |
| | $ | 78,777 |
| | $ | 88,197 |
| | $ | 84,238 |
|
| Adjustments, net of tax: | | | | | | | | | | |
| Amortization of core deposit and other intangibles | | 1,210 |
| | 1,227 |
| | 1,249 |
| | 1,446 |
| | 1,461 |
|
| Net earnings applicable to common shareholders, excluding the effects of the adjustments, net of tax (non-GAAP) | (a) | $ | 118,105 |
| | $ | 91,874 |
| | $ | 80,026 |
| | $ | 89,643 |
| | $ | 85,699 |
|
| Average common equity (GAAP) | | $ | 6,986,376 |
| | $ | 6,883,065 |
| | $ | 6,786,977 |
| | $ | 6,765,737 |
| | $ | 6,655,513 |
|
| Average goodwill | | (1,014,129 | ) | | (1,014,129 | ) | | (1,014,129 | ) | | (1,014,129 | ) | | (1,014,129 | ) |
| Average core deposit and other intangibles | | (11,576 | ) | | (13,527 | ) | | (15,379 | ) | | (17,453 | ) | | (19,726 | ) |
| Average tangible common equity (non-GAAP) | (b) | $ | 5,960,671 |
| | $ | 5,855,409 |
| | $ | 5,757,469 |
| | $ | 5,734,155 |
| | $ | 5,621,658 |
|
| Number of days in quarter | (c) | 92 |
| | 91 |
| | 91 |
| | 92 |
| | 92 |
|
| Number of days in year | (d) | 366 |
| | 366 |
| | 366 |
| | 365 |
| | 365 |
|
| Tangible return on average tangible common equity (non-GAAP) | (a/b/c)*d | 7.88 | % | | 6.31 | % | | 5.59 | % | | 6.20 | % | | 6.05 | % |
ZIONS BANCORPORATION
Press Release – Page 16
October 24, 2016
|
| | | | | | | | | | | | | | | | | | | | |
| | | Three Months Ended |
| (In thousands) | | September 30,
2016 | | June 30,
2016 | | March 31,
2016 | | December 31,
2015 | | September 30,
2015 |
| Efficiency Ratio | | | | | | | | | | |
| | | | | | | | | | | |
Noninterest expense (GAAP) 1 | (a) | $ | 403,292 |
| | $ | 381,894 |
| | $ | 395,573 |
| | $ | 397,353 |
| | $ | 391,280 |
|
| Adjustments: | | | | | | | | | | |
| Severance costs | | 481 |
| | 201 |
| | 3,471 |
| | 3,581 |
| | 3,464 |
|
| Other real estate expense, net | | (137 | ) | | (527 | ) | | (1,329 | ) | | (536 | ) | | (40 | ) |
| Provision for unfunded lending commitments | (3,165 | ) | | (4,246 | ) | | (5,812 | ) | | (6,551 | ) | | 1,428 |
|
| Debt extinguishment cost | | — |
| | 106 |
| | 247 |
| | 135 |
| | — |
|
| Amortization of core deposit and other intangibles | | 1,951 |
| | 1,979 |
| | 2,014 |
| | 2,273 |
| | 2,298 |
|
| Restructuring costs | | 356 |
| | 47 |
| | 996 |
| | 777 |
| | 1,630 |
|
| Total adjustments | (b) | (514 | ) | | (2,440 | ) | | (413 | ) | | (321 | ) | | 8,780 |
|
| Adjusted noninterest expense (non-GAAP) | (a-b)=(c) | $ | 403,806 |
|
| $ | 384,334 |
|
| $ | 395,986 |
|
| $ | 397,674 |
|
| $ | 382,500 |
|
| Taxable-equivalent net interest income (GAAP) | (d) | $ | 475,699 |
| | $ | 470,913 |
| | $ | 458,242 |
| | $ | 453,780 |
| | $ | 429,782 |
|
Noninterest income (GAAP) 1 | (e) | 144,887 |
| | 125,717 |
| | 116,761 |
| | 118,641 |
| | 125,944 |
|
| Combined income | (d+e)=(f) | 620,586 |
| | 596,630 |
| | 575,003 |
| | 572,421 |
| | 555,726 |
|
| Adjustments: | | | | | | | | | | |
| Fair value and nonhedge derivative income (loss) | (184 | ) | | (1,910 | ) | | (2,585 | ) | | 688 |
| | (1,555 | ) |
| Equity securities gains (losses), net | | 8,441 |
| | 2,709 |
| | (550 | ) | | 53 |
| | 3,630 |
|
| Fixed income securities gains (losses), net | | 39 |
| | 25 |
| | 28 |
| | (7 | ) | | (53 | ) |
| Total adjustments | (g) | 8,296 |
| | 824 |
| | (3,107 | ) | | 734 |
| | 2,022 |
|
| Adjusted taxable-equivalent revenue (non-GAAP) | (f-g)=(h) | $ | 612,290 |
|
| $ | 595,806 |
|
| $ | 578,110 |
|
| $ | 571,687 |
|
| $ | 553,704 |
|
| Adjusted pre-provision net revenue (PPNR) | (h-c) | $ | 208,484 |
| | $ | 211,472 |
| | $ | 182,124 |
| | $ | 174,013 |
| | $ | 171,204 |
|
Efficiency ratio 1 | (c/h) | 66.0 | % |
| 64.5 | % |
| 68.5 | % |
| 69.6 | % |
| 69.1 | % |
1In the first quarter of 2016, to be consistent with industry practice, the Company reclassified its bankcard rewards expense from “Other” noninterest expense to “Other service charges, commissions and fees” in noninterest income in order to offset this expense against the associated revenue. Prior period amounts have been reclassified to reflect this change.
ZIONS BANCORPORATION
Press Release – Page 17
October 24, 2016
|
| | | | | | | | | | | | |
| | | Six Months Ended | | Nine Months Ended |
| (In thousands) | | September 30,
2016 | | September 30,
2015 | | September 30,
2016 |
| Efficiency Ratio | | | | | | |
| | | | | | | |
Noninterest expense (GAAP) 1 | (a) | $ | 785,186 |
| | $ | 790,277 |
| | $ | 1,180,759 |
|
| Adjustments: | | | | | | |
| Severance costs | | 682 |
| | 5,171 |
| | 4,153 |
|
| Other real estate expense, net | | (664 | ) | | (485 | ) | | (1,993 | ) |
| Provision for unfunded lending commitments | (7,411 | ) | | (898 | ) | | (13,223 | ) |
| Debt extinguishment cost | | 106 |
| | 2,395 |
| | 353 |
|
| Amortization of core deposit and other intangibles | | 3,930 |
| | 4,616 |
| | 5,944 |
|
| Restructuring costs | | 403 |
| | 2,309 |
| | 1,399 |
|
| Total adjustments | (b) | (2,954 | ) | | 13,108 |
| | (3,367 | ) |
| Adjusted noninterest expense (non-GAAP) | (a-b)=(c) | $ | 788,140 |
| | $ | 777,169 |
| | $ | 1,184,126 |
|
| Taxable-equivalent net interest income (GAAP) | (d) | $ | 946,612 |
| | $ | 857,797 |
| | $ | 1,404,854 |
|
Noninterest income (GAAP) 1 | (e) | 270,604 |
| | 121,262 |
| | 387,365 |
|
| Combined income | (d+e)=(f) | 1,217,216 |
| | 979,059 |
| | 1,792,219 |
|
| Adjustments: | | | | | | |
| Fair value and nonhedge derivative income (loss) | (2,094 | ) | | 289 |
| | (4,679 | ) |
| Equity securities gains (losses), net | | 11,150 |
| | 8,469 |
| | 10,600 |
|
| Fixed income securities gains (losses), net | | 64 |
| | (138,489 | ) | | 92 |
|
| Total adjustments | (g) | 9,120 |
| | (129,731 | ) | | 6,013 |
|
| Adjusted taxable-equivalent revenue (non-GAAP) | (f-g)=(h) | $ | 1,208,096 |
| | $ | 1,108,790 |
| | $ | 1,786,206 |
|
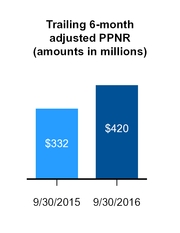
| Adjusted pre-provision net revenue (PPNR) | (h-c) | $ | 419,956 |
| | $ | 331,621 |
| | $ | 602,080 |
|
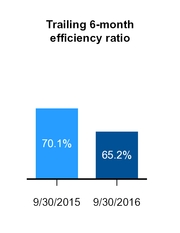
Efficiency ratio 1 | (c/h) | 65.2 | % | | 70.1 | % | | 66.3 | % |
1In the first quarter of 2016, to be consistent with industry practice, the Company reclassified its bankcard rewards expense from “Other” noninterest expense to “Other service charges, commissions and fees” in noninterest income in order to offset this expense against the associated revenue. Prior period amounts have been reclassified to reflect this change.
This press release presents the non-GAAP financial measures previously shown. The adjustments to reconcile from the applicable GAAP financial measures to the non-GAAP financial measures are included where applicable in financial results presented in accordance with GAAP. The Company considers these adjustments to be relevant to ongoing operating results.
The Company believes that excluding the amounts associated with these adjustments to present the non-GAAP financial measures provides a meaningful base for period-to-period and company-to-company comparisons, which will assist regulators, investors, and analysts in analyzing the operating results or financial position of the Company and in predicting future performance. These non-GAAP financial measures are used by management to assess the performance of the Company’s business or its financial position for evaluating bank reporting segment performance, for presentations of Company performance to investors, and for other reasons as may be requested by investors and analysts. The Company further believes that presenting these non-GAAP financial measures will permit investors and analysts to assess the performance of the Company on the same basis as that applied by management.
Non-GAAP financial measures have inherent limitations, are not required to be uniformly applied, and are not audited. Although non-GAAP financial measures are frequently used by stakeholders to evaluate a company, they have limitations as an analytical tool and should not be considered in isolation or as a substitute for analysis of results reported under GAAP.
