ZIONS BANCORPORATION
Press Release – Page 1
January 23, 2017
|
| |
Zions Bancorporation One South Main Salt Lake City, UT 84133 January 23, 2017 www.zionsbancorporation.com |
|
Fourth Quarter 2016 Financial Results: FOR IMMEDIATE RELEASE
Investor and Media Contact: James Abbott (801) 844-7637
|
| | | | | |
| | Zions Bancorporation Reports: 4Q16 Net Earnings1 of $125 million, diluted EPS of $0.60 compared to 3Q16 Net Earnings1 of $117 million, diluted EPS of $0.57, and 4Q15 Net Earnings1 of $88 million, diluted EPS of $0.43, and
2016 Annual Net Earnings1 of $411 million, diluted EPS of $1.99, compared to 2015 Annual Net Earnings1 of $247 million, diluted EPS of $1.20 |
| |
| |
| |
FOURTH QUARTER RESULTS
|
| | | | | | |
| $0.60 | | $125 million | | 3.37% | | 12.1% |
| Earnings per diluted common share | | Net Earnings 1 | | Net interest margin (“NIM”) | | Common Equity Tier 1 |
|
| |
| FOURTH QUARTER HIGHLIGHTS |
| | |
| Net Interest Income and Net Interest Margin | • Net interest income was $480 million, up 2% from 3Q16 and up 7% from 4Q15• NIM was 3.37% compared to 3.36% in 3Q16 and 3.23% in 4Q15 |
| | |
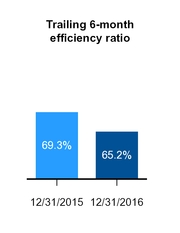
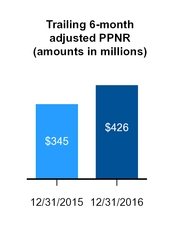
Operating Performance2 | • Pre-provision net revenue (“PPNR”) as reported was $212 million, down 3% from 3Q16 and up 21% from 4Q15• Adjusted PPNR2 was $217 million, up 4% from 3Q16 and up 25% from 4Q15• Noninterest expense as reported of $405 million, compared to $403 million in 3Q16, and $1,585 million for 2016• Adjusted noninterest expense2 of $395 million, compared to $404 million in 3Q16, and $1,579 million for 2016• Efficiency ratio2 of 64.5%, compared to 66.0% for 3Q16, with an efficiency ratio of 65.8% for 2016 |
| | |
| Loans and Credit Quality | • Net loans and leases were $42.6 billion, compared to $42.5 billion for 3Q16• Provision for credit losses was $1 million, compared to $16 million in 3Q16• Net charge-offs were $27 million, compared to $30 million in 3Q16 |
| | |
| Oil and Gas-Related Exposure | • Net charge-offs for oil and gas loans were $16 million, compared to $41 million in 3Q16• Oil and gas allowance is 9% of the portfolio• 38% of oil and gas-related loans were criticized, down from 42% in 3Q16 |
| | |
| Capital Return | • Tangible return on average tangible common equity2 of 8.40%, compared to 7.88% in 3Q16 and 6.20% in 4Q15• Common stock repurchases of $45 million during the quarter, and $90 million in 2016
|
|
|
| CEO COMMENTARY |
| |
Harris H. Simmons, Chairman and CEO, commented, “We are pleased that our full-year 2016 results reflect solid performance in revenue growth, tight expense control, and strong growth in both pre-provision net revenue and earnings per share. We are encouraged to report that we achieved all of the stated financial goals that we outlined in the spring of 2015 for this year, including holding adjusted noninterest expense to less than $1.58 billion and achieving an efficiency ratio less than 66%. We have done this while simultaneously making a very substantial investment in technology that we expect will allow Zions to be both more efficient and more competitive for years to come.” Mr. Simmons concluded, “We look forward to 2017 as a year that seems likely to experience reduced credit costs as the energy industry continues to heal and the credit metrics for non-energy loans, which constitute about 95% of our portfolio, are strong and generally stable.”
|
|
|
1 Net Earnings is net earnings applicable to common shareholders. 2 For information on non-GAAP financial measures and why the Company presents these numbers, see pages 18-21. Included in these non-GAAP financial measures are the key metrics to which Zions announced it would hold itself accountable in its June 1, 2015 efficiency initiative, and to which executive compensation is tied.
|
ZIONS BANCORPORATION
Press Release – Page 2
January 23, 2017
The percent change amounts presented in the following tables are calculated on amounts in thousands rather than millions.
RESULTS OF OPERATIONS
|
| | | | | | | | | | | | | | | | | | | | | | | | | | |
| Net Interest Income |
| | | | | | | | | 4Q16 - 3Q16 | | 4Q16 - 4Q15 |
| (In millions) | | 4Q16 | | 3Q16 | | 4Q15 | | $ | | % | | $ | | % |
| Interest and fees on loans | | $ | 438 |
| | $ | 437 |
| | $ | 430 |
| | $ | 1 |
| | — | % | | $ | 8 |
| | 2 | % |
| Interest on money market investments | | 4 |
| | 5 |
| | 6 |
| | (1 | ) | | (16 | ) | | (2 | ) | | (32 | ) |
| Interest on securities | | 59 |
| | 49 |
| | 38 |
| | 10 |
| | 21 |
| | 21 |
| | 59 |
|
| Total interest income | | 501 |
| | 491 |
| | 474 |
| | 10 |
| | 2 |
| | 27 |
| | 6 |
|
| Interest on deposits | | 13 |
| | 13 |
| | 12 |
| | — |
| | 3 |
| | 1 |
| | 5 |
|
| Interest on short and long-term borrowings | | 8 |
| | 9 |
| | 13 |
| | (1 | ) | | (7 | ) | | (5 | ) | | (33 | ) |
| Interest expense | | 21 |
| | 22 |
| | 25 |
| | (1 | ) | | (1 | ) | | (4 | ) | | (14 | ) |
| Net interest income | | $ | 480 |
| | $ | 469 |
| | $ | 449 |
| | $ | 11 |
| | 2 |
| | $ | 31 |
| | 7 |
|
Net interest income increased to $480 million in the fourth quarter of 2016 from $469 million in the third quarter of 2016. The increase in net interest income was primarily due to a $10 million increase in interest from investment securities. The Company continues to change its mix of interest-earning assets as average money market investments declined in the fourth quarter of 2016 by $773 million, much of which was deployed into term investment securities. Average securities increased in the fourth quarter of 2016 by $1.9 billion and average loans and leases held for investment increased by $152 million. The Company’s accelerated purchase of securities during the fourth quarter relative to prior quarters was driven by the repositioning of the balance sheet as the Company continues to moderately reduce its interest rate sensitivity.
The net interest margin increased to 3.37% in the fourth quarter of 2016, compared to 3.36% in the third quarter of 2016. The increase in net interest margin was driven by increased yields and growth in the investment securities portfolio.
|
| | | | | | | | | | | | | | | | | | | | | | | | | | |
| Noninterest Income |
| | | | | | | | | 4Q16 - 3Q16 | | 4Q16 - 4Q15 |
| (In millions) | | 4Q16 | | 3Q16 | | 4Q15 | | $ | | % | | $ | | % |
| Service charges and fees on deposit accounts | | $ | 43 |
| | $ | 45 |
| | $ | 42 |
| | $ | (2 | ) | | (3 | )% | | $ | 1 |
| | 2 | % |
| Other service charges, commissions and fees | | 52 |
| | 54 |
| | 49 |
| | (2 | ) | | (4 | ) | | 3 |
| | 6 |
|
| Wealth management income | | 11 |
| | 10 |
| | 8 |
| | 1 |
| | 7 |
| | 3 |
| | 35 |
|
| Loan sales and servicing income | | 6 |
| | 11 |
| | 7 |
| | (5 | ) | | (47 | ) | | (1 | ) | | (13 | ) |
| Capital markets and foreign exchange | | 6 |
| | 6 |
| | 7 |
| | — |
| | 1 |
| | (1 | ) | | (8 | ) |
| Customer-related fees | | 118 |
| | 126 |
| | 113 |
| | (8 | ) | | (6 | ) | | 5 |
| | 4 |
|
| Dividends and other investment income | | 4 |
| | 9 |
| | 3 |
| | (5 | ) | | (54 | ) | | 1 |
| | 39 |
|
| Fair value and nonhedge derivative income | | 7 |
| | — |
| | 1 |
| | 7 |
| | 3,842 |
| | 6 |
| | 901 |
|
| Securities gains (losses), net | | (4 | ) | | 8 |
| | — |
| | (12 | ) | | (140 | ) | | (4 | ) | | (7,539 | ) |
| Other | | 3 |
| | 2 |
| | 2 |
| | 1 |
| | 39 |
| | 1 |
| | 32 |
|
| Total noninterest income | | $ | 128 |
| | $ | 145 |
| | $ | 119 |
| | $ | (17 | ) | | (11 | ) | | $ | 9 |
| | 8 |
|
Total noninterest income for the fourth quarter of 2016 was $128 million, compared to $145 million for the third quarter of 2016. The $17 million decline in total noninterest income during the quarter was primarily due to net
ZIONS BANCORPORATION
Press Release – Page 3
January 23, 2017
securities gains and customer-related fees. Customer-related fees decreased by $8 million in the fourth quarter of 2016 compared to the prior quarter, which was primarily due to a $5 million decline in loan sales and servicing income resulting from valuation adjustments on the Company’s rate lock agreements and an increase in the servicing asset valuation in the third quarter of 2016 that did not recur in the current quarter. Customer-related fees increased by $5 million compared to the fourth quarter of 2015.
Another factor relating to the decline in noninterest income was a decrease in securities gains of $12 million from third quarter of 2016 primarily due to higher than normal gains in the prior quarter and a decrease of $6 million in the market value of one of the Company’s Small Business Investment Company (“SBIC”) investments. Dividends and other investment income decreased by $5 million due to a third quarter increase in the market value of the Company’s SBIC investments followed by a decline in the current quarter.
|
| | | | | | | | | | | | | | | | | | | | | | | | | | |
| Noninterest Expense |
| | | | | | | | | 4Q16 - 3Q16 | | 4Q16 - 4Q15 |
| (In millions) | | 4Q16 | | 3Q16 | | 4Q15 | | $ | | % | | $ | | % |
| Salaries and employee benefits | | $ | 241 |
| | $ | 242 |
| | $ | 236 |
| | $ | (1 | ) | | (1 | )% | | $ | 5 |
| | 2 | % |
| Occupancy, net | | 33 |
| | 33 |
| | 31 |
| | — |
| | (4 | ) | | 2 |
| | 6 |
|
| Furniture, equipment and software, net | | 33 |
| | 29 |
| | 32 |
| | 4 |
| | 14 |
| | 1 |
| | 4 |
|
| Credit-related expense | | 7 |
| | 7 |
| | 8 |
| | — |
| | 4 |
| | (1 | ) | | (7 | ) |
| Provision for unfunded lending commitments | | 3 |
| | (3 | ) | | (7 | ) | | 6 |
| | 204 |
| | 10 |
| | 150 |
|
| Professional and legal services | | 17 |
| | 14 |
| | 13 |
| | 3 |
| | 17 |
| | 4 |
| | 29 |
|
| Advertising | | 5 |
| | 6 |
| | 6 |
| | (1 | ) | | (12 | ) | | (1 | ) | | (8 | ) |
| FDIC premiums | | 11 |
| | 12 |
| | 9 |
| | (1 | ) | | (3 | ) | | 2 |
| | 23 |
|
| Amortization of core deposit and other intangibles | | 2 |
| | 2 |
| | 2 |
| | — |
| | (2 | ) | | — |
| | (16 | ) |
| Other | | 53 |
| | 61 |
| | 67 |
| | (8 | ) | | (13 | ) | | (14 | ) | | (21 | ) |
| Total noninterest expense | | $ | 405 |
| | $ | 403 |
| | $ | 397 |
| | $ | 2 |
| | — |
| | $ | 8 |
| | 2 |
|
Adjusted noninterest expense 1 | | $ | 395 |
| | $ | 404 |
| | $ | 398 |
| | $ | (9 | ) | | (2 | )% | | $ | (3 | ) | | (1 | )% |
| |
1 | For information on non-GAAP financial measures see pages 18-21. |
Noninterest expense for the fourth quarter of 2016 was $405 million, compared to $403 million for the third quarter of 2016, and $397 million for the fourth quarter of 2015. The increase in total noninterest expense from the third quarter of 2016 was primarily due to a $6 million increase in the provision for unfunded lending commitments and a $4 million increase in net furniture, equipment and software, primarily as a result of increased technology expenditures during the quarter and a $1.5 million reclassification of software maintenance expenses from other noninterest expense. The Company continues to invest in technology and make progress on its core systems upgrade. These increases were partially offset by an $8 million decline in other noninterest expense, which was higher in the prior quarter due to a legal accrual and true-ups related to the alignment of a single back-office operating environment. As previously disclosed, management’s incentive compensation is tied to its efficiency initiative and key profitability metrics. Elevated fourth quarter noninterest expenses directly resulted in management incentive compensation that was $5 million less than planned for the fourth quarter of 2016.
ZIONS BANCORPORATION
Press Release – Page 4
January 23, 2017
Despite the modest increase in total noninterest expense during the fourth quarter, the Company met its expense and efficiency ratio goals for 2016 by recognizing adjusted noninterest expense of less than $1.58 billion and achieving an efficiency ratio of 65.8%. For information on non-GAAP measures see pages 18-21.
BALANCE SHEET ANALYSIS
|
| | | | | | | | | | | | | | | | | | | | | | | | | | |
| Asset Quality |
| | | | | | | | | 4Q16 - 3Q16 | | 4Q16 - 4Q15 |
| (In millions) | | 4Q16 | | 3Q16 | | 4Q15 | | bps | | | | bps | | |
| Ratio of nonperforming assets to loans and leases and other real estate owned | | 1.34 | % | | 1.37 | % | | 0.87 | % | | (3 | ) | | | | 47 |
| | |
| Annualized ratio of net loan and lease charge-offs to average loans | | 0.25 |
| | 0.28 |
| | 0.13 |
| | (3 | ) | | | | 12 |
| | |
| Ratio of total allowance for credit losses to loans and leases outstanding | | 1.48 |
| | 1.55 |
| | 1.68 |
| | (7 | ) | | | | (20 | ) | | |
| | | | | | | | | $ | | % | | $ | | % |
| Classified loans | | $ | 1,577 |
| | $ | 1,615 |
| | $ | 1,368 |
| | $ | (38 | ) | | (2 | )% | | $ | 209 |
| | 15 | % |
| Provision for credit losses | | 1 |
| | 16 |
| | 16 |
| | (15 | ) | | (96 | ) | | (15 | ) | | (96 | ) |
Asset quality for the total portfolio remained strong and was generally stable when compared to the prior quarter. Nonperforming assets were $573 million at December 31, 2016, compared to $587 million at September 30, 2016. The ratio of nonperforming assets to loans and leases and other real estate owned decreased to 1.34% at December 31, 2016, compared to 1.37% at September 30, 2016. Classified loans for the total portfolio were $1,577 million at December 31, 2016 and $1,615 million at September 30, 2016. Total net charge-offs were $27 million in the fourth quarter of 2016, or an annualized 0.25% of average loans, compared to $30 million, or an annualized 0.28% of average loans, in the third quarter of 2016.
The Company provided $1 million for credit losses during the fourth quarter of 2016, compared to $16 million during the third quarter of 2016. The allowance for credit losses decreased to $632 million at December 31, 2016 from $659 million at September 30, 2016, which was 1.48% and 1.55% of loans and leases, respectively. The decreases in the provision and the allowance for credit losses were primarily due to continued strong credit quality for the total portfolio in addition to a change in the portfolio mix, as oil and gas-related exposures declined, and residential real estate and commercial real estate term exposures increased. The reserve for unfunded lending commitments increased by $3 million as a result of adverse credit migration on certain oil and gas-related commitments.
Asset quality for the portfolio excluding oil and gas-related loans remained strong, with slight deterioration in nonperforming and classified metrics, which was driven by a few borrowers in various portfolios. The allowance for credit losses in the portfolio excluding oil and gas-related loans slightly decreased to 1.08% of loans and leases at December 31, 2016, compared to 1.13% at September 30, 2016, primarily due to changes in portfolio mix and continued nominal charge-offs outside of the oil and gas-related portfolio.
ZIONS BANCORPORATION
Press Release – Page 5
January 23, 2017
Excluding oil and gas-related loans, net charge-offs were $11 million, or an annualized 0.11% of average loans, in the fourth quarter of 2016, compared to $11 million of net recoveries, or an annualized (0.11)%, in the third quarter of 2016. Nonperforming assets for this portfolio were $239 million at December 31, 2016, compared to $211 million at September 30, 2016; the ratio of nonperforming assets to loans and leases and other real estate owned for these same periods was 0.59% and 0.52%, respectively. At December 31, 2016 and September 30, 2016, for the portfolio excluding oil and gas-related loans, classified loans were $896 million and $849 million, and criticized loans were $1,269 million and $1,313 million, respectively.
|
| | | | | | | | | | | | | | | | | | | | | | | | | | |
| Loans and Leases |
| | | | | | | | | 4Q16 - 3Q16 | | 4Q16 - 4Q15 |
| (In millions) | | 4Q16 | | 3Q16 | | 4Q15 | | $ | | % | | $ | | % |
| Loans held for sale | | $ | 172 |
| | $ | 160 |
| | $ | 150 |
| | $ | 12 |
| | 7 | % | | $ | 22 |
| | 15 | % |
| Loans and leases: | | | | | | | | | | | | | | |
| Commercial | | 21,615 |
| | 21,624 |
| | 21,479 |
| | (9 | ) | | — |
| | 136 |
| | 1 |
|
| Commercial real estate | | 11,341 |
| | 11,450 |
| | 10,356 |
| | (109 | ) | | (1 | ) | | 985 |
| | 10 |
|
| Consumer | | 9,693 |
| | 9,466 |
| | 8,815 |
| | 227 |
| | 2 |
| | 878 |
| | 10 |
|
| Loans and leases, net of unearned income and fees | | 42,649 |
| | 42,540 |
| | 40,650 |
| | 109 |
| | — |
| | 1,999 |
| | 5 |
|
| Less allowance for loan losses | | 568 |
| | 597 |
| | 606 |
| | (29 | ) | | (5 | ) | | (38 | ) | | (6 | ) |
| Loans held for investment, net of allowance | | $ | 42,081 |
| | $ | 41,943 |
| | $ | 40,044 |
| | $ | 138 |
| | — |
| | $ | 2,037 |
| | 5 |
|
Loans and leases, net of unearned income and fees, were $42.6 billion at December 31, 2016, compared to $42.5 billion at September 30, 2016. The oil and gas-related portfolio declined $156 million from the prior quarter due to payoffs, paydowns, charge-offs and active management of the portfolio. This decline was offset by $227 million of growth in consumer loans, predominately in 1-4 family residential loans. Excluding the reduction in oil and gas-related loans, net loans and leases increased $265 million during the fourth quarter of 2016. Unfunded lending commitments were $19.3 billion at December 31, 2016, compared to $19.1 billion at September 30, 2016.
ZIONS BANCORPORATION
Press Release – Page 6
January 23, 2017
|
| | | | | | | | | | | | | | | | | | | | | | | | | | |
Oil and Gas-Related Exposure1 |
| | | | | | | | | 4Q16 - 3Q16 | | 4Q16 - 4Q15 |
| (In millions) | | 4Q16 | | 3Q16 | | 4Q15 | | $ | | % | | $ | | % |
| Loans and leases | | | | | | | |
|
| |
|
| |
|
| |
|
| Upstream – exploration and production | | $ | 733 |
| | $ | 752 |
| | $ | 817 |
| | $ | (19 | ) | | (3 | )% | | $ | (84 | ) | | (10 | )% |
| Midstream – marketing and transportation | | 598 |
| | 623 |
| | 621 |
| | (25 | ) | | (4 | ) | | (23 | ) | | (4 | ) |
| Downstream – refining | | 137 |
| | 123 |
| | 127 |
| | 14 |
| | 11 |
| | 10 |
| | 8 |
|
| Other non-services | | 38 |
| | 44 |
| | 44 |
| | (6 | ) | | (14 | ) | | (6 | ) | | (14 | ) |
| Oilfield services | | 500 |
| | 596 |
| | 784 |
| | (96 | ) | | (16 | ) | | (284 | ) | | (36 | ) |
| Oil and gas service manufacturing | | 152 |
| | 176 |
| | 229 |
| | (24 | ) | | (14 | ) | | (77 | ) | | (34 | ) |
Total loan and lease balances 2 | | 2,158 |
| | 2,314 |
| | 2,622 |
| | (156 | ) | | (7 | ) | | (464 | ) | | (18 | ) |
| Unfunded lending commitments | | 1,722 |
| | 1,784 |
| | 2,151 |
| | (62 | ) | | (3 | ) | | (429 | ) | | (20 | ) |
| Total oil and gas credit exposure | | $ | 3,880 |
| | $ | 4,098 |
| | $ | 4,773 |
| | $ | (218 | ) | | (5 | ) | | $ | (893 | ) | | (19 | ) |
| | | | | | | | | | | | | | | |
| Private equity investments | | $ | 7 |
| | $ | 6 |
| | $ | 13 |
| | $ | 1 |
| | 7 |
| | $ | (6 | ) | | (50 | ) |
| | | | | | | | | | | | | | | |
Credit quality measures 2 | | | | | | | | | | | | | | |
| Criticized loan ratio | | 37.8 | % | | 41.8 | % | | 30.3 | % | | | | | | | | |
| Classified loan ratio | | 31.6 | % | | 33.1 | % | | 19.7 | % | | | | | | | | |
| Nonaccrual loan ratio | | 13.6 | % | | 15.0 | % | | 2.5 | % | | | | | | | | |
| Ratio of nonaccrual loans that are current | | 86.1 | % | | 87.3 | % | | 71.2 | % | | | | | | | | |
Net charge-off ratio, annualized 3 | | 3.0 | % | | 7.1 | % | | 3.7 | % | | | | | | | | |
| |
1 | Because many borrowers operate in multiple businesses, judgment has been applied in characterizing a borrower as oil and gas-related, including a particular segment of oil and gas-related activity, e.g., upstream or downstream; typically, 50% of revenues coming from the oil and gas sector is used as a guide. |
2 Total loan and lease balances and the credit quality measures do not include $40 million of oil and gas loans held for sale at December 31, 2016.
| |
3 | Calculated as the ratio of annualized net charge-offs for each respective period to loan balances at each period end. |
During the fourth quarter of 2016, oil and gas-related loans decreased $156 million, or 7%, and total oil and gas credit exposure decreased by $218 million, or 5%. Oil and gas-related loans represent 5% of the total loan portfolio. Oil and gas services (oilfield services and oil and gas service manufacturing) decreased $120 million, or 16%, from the third quarter of 2016, and $361 million, or 36%, from the fourth quarter of 2015. Unfunded lending commitments decreased by $62 million during the fourth quarter of 2016, primarily in the oilfield services and oil and gas service manufacturing portfolios. Criticized oil and gas-related loans decreased $152 million, or 16%, during the fourth quarter of 2016, mainly due to payoffs and paydowns. Oil and gas-related loan net charge-offs were $16 million in the fourth quarter of 2016 and were predominantly in the oilfield services portfolio, compared to $41 million in the third quarter of 2016. As of December 31, 2016, the Company had entered into contracts to sell $40 million of oil and gas-related loans, and classified them as held for sale. The Company recognized $9 million of charge-offs in the fourth quarter on these held-for-sale loans. Approximately 86% of oil and gas-related nonaccruing loans were current as to principal and interest payments as of December 31, 2016, similar to the 87% reported as of September 30, 2016. The allowance for credit losses related to oil and gas-related loans decreased during the quarter and was 9% of such balances at the end of the fourth quarter of 2016.
ZIONS BANCORPORATION
Press Release – Page 7
January 23, 2017
|
| | | | | | | | | | | | | | | | | | | | | | | | | | |
| Deposits |
| | | | | | | | | 4Q16 - 3Q16 | | 4Q16 - 4Q15 |
| (In millions) | | 4Q16 | | 3Q16 | | 4Q15 | | $ | | % | | $ | | % |
| Noninterest-bearing demand | | $ | 24,115 |
| | $ | 22,711 |
| | $ | 22,277 |
| | $ | 1,404 |
| | 6 | % | | $ | 1,838 |
| | 8 | % |
| Interest-bearing: | | | | | | | | | | | | | | |
| Savings and money market | | 26,364 |
| | 25,503 |
| | 25,672 |
| | 861 |
| | 3 |
| | 692 |
| | 3 |
|
| Time | | 2,757 |
| | 2,516 |
| | 2,131 |
| | 241 |
| | 10 |
| | 626 |
| | 29 |
|
| Foreign | | — |
| | 119 |
| | 294 |
| | (119 | ) | | (100 | ) | | (294 | ) | | (100 | ) |
| Total deposits | | $ | 53,236 |
| | $ | 50,849 |
| | $ | 50,374 |
| | $ | 2,387 |
| | 5 |
| | $ | 2,862 |
| | 6 |
|
Total deposits increased to $53.2 billion at December 31, 2016, compared to $50.8 billion at September 30, 2016, primarily due to seasonal increases. Average total deposits increased $1.5 billion to $52.2 billion for the fourth quarter of 2016, compared to $50.7 billion for the third quarter of 2016. Average noninterest bearing deposits increased to $23.6 billion for the fourth quarter of 2016, compared to $22.5 billion for the third quarter of 2016, and were 45% of average total deposits.
|
| | | | | | | | | | | | | | | | | | | | | | | | | | |
| Long-term Debt and Shareholders’ Equity |
| | | | | | | | | 4Q16 - 3Q16 | | 4Q16 - 4Q15 |
| (In millions) | | 4Q16 | | 3Q16 | | 4Q15 | | $ | | % | | $ | | % |
| Shareholders’ equity: | | | | | | | | | | | | | | |
| Preferred Stock | | $ | 710 |
| | $ | 710 |
| | $ | 828 |
| | $ | — |
| | — | % | | $ | (118 | ) | | (14 | )% |
| Common Stock | | 4,725 |
| | 4,748 |
| | 4,768 |
| | (23 | ) | | — |
| | (43 | ) | | (1 | ) |
| Retained earnings | | 2,322 |
| | 2,211 |
| | 1,967 |
| | 111 |
| | 5 |
| | 355 |
| | 18 |
|
| Accumulated other comprehensive income (loss) | | (122 | ) | | 10 |
| | (55 | ) | | (132 | ) | | (1,316 | ) | | (67 | ) | | (123 | ) |
| Total shareholders' equity | | $ | 7,635 |
| | $ | 7,679 |
| | $ | 7,508 |
| | $ | (44 | ) | | (1 | ) | | $ | 127 |
| | 2 |
|
During the fourth quarter of 2016, the Company continued its stock buyback program and repurchased $45 million of its stock during the quarter at an average price of $31.69 per share, and has repurchased $90 million of its stock since July 1, 2016 at an average price of $31.15 per share, leaving $90 million of buyback capacity remaining in the 2016 capital plan (which spans the timeframe of July 2016 to June 2017). Despite the share repurchases during the quarter, the weighted average diluted shares increased slightly due to dilution from the average market price per share of the common stock exceeding the exercise price per share of warrants to buy common stock that have been outstanding since 2008 (“TARP” warrants - NASDAQ: ZIONZ) and 2010 (NASDAQ: ZIONW).
Preferred dividends are expected to be $10.4 million for the first quarter of 2017 and $12.4 million for the second quarter of 2017. Additionally, the Company reduced its long-term debt by $36 million during the fourth quarter of 2016 by exercising a call option for junior subordinated debentures related to trust preferred securities.
Accumulated other comprehensive income (loss) decreased to $(122) million from $10 million, primarily as a result of a decline in the fair value of the Company’s available-for-sale securities portfolio due largely to changes in the interest rate environment.
ZIONS BANCORPORATION
Press Release – Page 8
January 23, 2017
Tangible book value per common share decreased to $29.06 at December 31, 2016, compared to $29.16 at September 30, 2016, with the positive benefit of a $110 million increase of retained earnings during the quarter offset by the $132 million decline in accumulated other comprehensive income as described previously. The estimated Basel III common equity tier 1 (“CET1”) capital ratio was 12.1% at December 31, 2016 compared to 12.0% at September 30, 2016; Basel III capital ratios are based on the applicable phase-in periods, however, the fully phased-in ratio was not substantially different. For information on non-GAAP measures see pages 18-21.
ZIONS BANCORPORATION
Press Release – Page 9
January 23, 2017
Supplemental Presentation and Conference Call
Zions has posted a supplemental presentation to its website, which will be used to discuss these fourth quarter results at 5:30 p.m. ET this afternoon (January 23, 2017). Media representatives, analysts, investors, and the public are invited to join this discussion by calling 253-237-1247 (domestic and international) and entering the passcode 44706729, or via on-demand webcast. A link to the webcast will be available on the Zions Bancorporation website at zionsbancorporation.com. The webcast of the conference call will also be archived and available for 30 days. About Zions Bancorporation
Zions Bancorporation is one of the nation’s premier financial services companies with more than $60 billion of total assets. Zions operates under local management teams and unique brands in 11 western and southwestern states: Arizona, California, Colorado, Idaho, Nevada, New Mexico, Oregon, Texas, Utah, Washington, and Wyoming. The company is a national leader in Small Business Administration lending and public finance advisory services, and is a consistent top recipient of numerous Greenwich Excellence awards in banking. In addition, Zions is included in the S&P 500 and NASDAQ Financial 100 indices. Investor information and links to local banking brands can be accessed at zionsbancorporation.com. Forward-Looking Information
Statements in this press release that are based on other than historical data or that express the Company’s expectations regarding future events or determinations are forward-looking within the meaning of the Private Securities Litigation Reform Act of 1995. Statements based on historical data are not intended and should not be understood to indicate the Company’s expectations regarding future events. Forward-looking statements provide current expectations or forecasts or intentions regarding future events or determinations. These forward-looking statements are not guarantees of future performance or determinations, nor should they be relied upon as representing management’s views as of any subsequent date. Forward-looking statements involve significant risks and uncertainties, and actual results may differ materially from those presented, either expressed or implied, in this press release. Factors that could cause actual results to differ materially from those expressed in the forward-looking statements include the actual amount and duration of declines in the price of oil and gas, our ability to meet our efficiency and noninterest expense goals, as well as other factors discussed in the Company’s most recent Annual Report on Form 10-K and Quarterly Report on Form 10-Q, filed with the Securities and Exchange Commission (“SEC”) and available at the SEC’s Internet site (http://www.sec.gov).
Except as required by law, the Company specifically disclaims any obligation to update any factors or to publicly announce the result of revisions to any of the forward-looking statements included herein to reflect future events or developments.
ZIONS BANCORPORATION
Press Release – Page 10
January 23, 2017
FINANCIAL HIGHLIGHTS
(Unaudited)
|
| | | | | | | | | | | | | | | | | | | |
| | Three Months Ended |
| (In thousands, except share, per share, and ratio data) | December 31,
2016 | | September 30,
2016 | | June 30,
2016 | | March 31,
2016 | | December 31,
2015 |
BALANCE SHEET 1 | | | | | | | | | |
| Loans held for investment, net of allowance | $ | 42,081,743 |
| | $ | 41,942,535 |
| | $ | 41,893,230 |
| | $ | 40,806,291 |
| | $ | 40,043,494 |
|
| Total assets | 63,239,165 |
| | 61,038,860 |
| | 59,642,992 |
| | 59,179,913 |
| | 59,664,543 |
|
| Deposits | 53,235,830 |
| | 50,848,661 |
| | 50,270,921 |
| | 49,887,857 |
| | 50,374,091 |
|
| Total shareholders’ equity | 7,634,306 |
| | 7,679,307 |
| | 7,626,383 |
| | 7,625,737 |
| | 7,507,519 |
|
| STATEMENT OF INCOME | | | | | | | | | |
| Net earnings applicable to common shareholders | 124,990 |
| | 116,895 |
| | 90,647 |
| | 78,777 |
| | 88,197 |
|
| Net interest income | $ | 480,470 |
| | $ | 469,187 |
| | $ | 464,849 |
| | $ | 452,842 |
| | $ | 448,833 |
|
| Taxable-equivalent net interest income | 487,823 |
| | 475,699 |
| | 470,913 |
| | 458,242 |
| | 453,780 |
|
| Total noninterest income | 128,244 |
| | 144,887 |
| | 125,717 |
| | 116,761 |
| | 118,641 |
|
| Total noninterest expense | 404,515 |
| | 403,292 |
| | 381,894 |
| | 395,573 |
| | 397,353 |
|
Adjusted pre-provision net revenue 2 | 217,469 |
| | 208,484 |
| | 211,472 |
| | 182,124 |
| | 174,013 |
|
| Provision for loan losses | (2,687 | ) | | 18,825 |
| | 34,492 |
| | 42,145 |
| | 22,701 |
|
| Provision for unfunded lending commitments | 3,296 |
| | (3,165 | ) | | (4,246 | ) | | (5,812 | ) | | (6,551 | ) |
| Provision for credit losses | 609 |
| | 15,660 |
| | 30,246 |
| | 36,333 |
| | 16,150 |
|
| PER COMMON SHARE | | | | | | | | | |
| Net earnings per diluted common share | $ | 0.60 |
| | $ | 0.57 |
| | $ | 0.44 |
| | $ | 0.38 |
| | $ | 0.43 |
|
| Dividends | 0.08 |
| | 0.08 |
| | 0.06 |
| | 0.06 |
| | 0.06 |
|
Book value per common share 1 | 34.10 |
| | 34.19 |
| | 33.72 |
| | 33.23 |
| | 32.67 |
|
Tangible book value per common share 1, 2 | 29.06 |
| | 29.16 |
| | 28.72 |
| | 28.20 |
| | 27.63 |
|
| SELECTED RATIOS AND OTHER DATA | | | | | | | | | |
| Return on average assets | 0.89 | % | | 0.84 | % | | 0.77 | % | | 0.62 | % | | 0.68 | % |
| Return on average common equity | 7.10 | % | | 6.66 | % | | 5.30 | % | | 4.67 | % | | 5.17 | % |
Tangible return on average tangible common equity 2 | 8.40 | % | | 7.88 | % | | 6.31 | % | | 5.59 | % | | 6.20 | % |
| Net interest margin | 3.37 | % | | 3.36 | % | | 3.39 | % | | 3.35 | % | | 3.23 | % |
Efficiency ratio 2 | 64.5 | % | | 66.0 | % | | 64.5 | % | | 68.5 | % | | 69.6 | % |
| Effective tax rate | 33.6 | % | | 33.7 | % | | 34.6 | % | | 31.4 | % | | 30.5 | % |
| Ratio of nonperforming assets to loans and leases and other real estate owned | 1.34 | % | | 1.37 | % | | 1.30 | % | | 1.33 | % | | 0.87 | % |
| Annualized ratio of net loan and lease charge-offs to average loans | 0.25 | % | | 0.28 | % | | 0.36 | % | | 0.35 | % | | 0.13 | % |
Ratio of total allowance for credit losses to loans and leases outstanding 1 | 1.48 | % | | 1.55 | % | | 1.58 | % | | 1.64 | % | | 1.68 | % |
| Full-time equivalent employees | 10,057 |
| | 9,968 |
| | 10,064 |
| | 10,092 |
| | 10,200 |
|
CAPITAL RATIOS 1 | | | | | | | | | |
| Tangible common equity ratio | 9.49 | % | | 9.91 | % | | 10.05 | % | | 9.92 | % | | 9.63 | % |
Basel III: 3 | | | | | | | | | |
| Common equity tier 1 capital | 12.1 | % | | 12.0 | % | | 12.0 | % | | 12.1 | % | | 12.2 | % |
| Tier 1 leverage | 11.1 | % | | 11.3 | % | | 11.3 | % | | 11.4 | % | | 11.3 | % |
| Tier 1 risk-based capital | 13.5 | % | | 13.5 | % | | 13.4 | % | | 13.9 | % | | 14.1 | % |
| Total risk-based capital | 15.2 | % | | 15.3 | % | | 15.5 | % | | 16.0 | % | | 16.1 | % |
| Risk-weighted assets | 49,935,465 |
| | 49,317,815 |
| | 49,016,859 |
| | 47,695,790 |
| | 46,747,245 |
|
| Weighted average common and common-equivalent shares outstanding | 205,446,285 |
| | 204,714,158 |
| | 204,536,196 |
| | 204,095,529 |
| | 204,276,930 |
|
Common shares outstanding 1 | 203,085,100 |
| | 203,850,072 |
| | 205,103,566 |
| | 204,543,707 |
| | 204,417,093 |
|
| |
2 | For information on non-GAAP financial measures see pages 18-21. |
| |
3 | Basel III capital ratios became effective January 1, 2015 and are based on the applicable phase-in periods. Current period ratios and amounts represent estimates. |
ZIONS BANCORPORATION
Press Release – Page 11
January 23, 2017
CONSOLIDATED BALANCE SHEETS
|
| | | | | | | | | | | | | | | | | | | |
| (In thousands, except shares) | December 31,
2016 | | September 30,
2016 | | June 30,
2016 | | March 31,
2016 | | December 31,
2015 |
| | (Unaudited) | | (Unaudited) | | (Unaudited) | | (Unaudited) | |
|
| ASSETS | | | | | | | | | |
| Cash and due from banks | $ | 737,327 |
| | $ | 553,152 |
| | $ | 560,262 |
| | $ | 517,803 |
| | $ | 798,319 |
|
| Money market investments: | | | | | | | | | |
| Interest-bearing deposits | 1,410,852 |
| | 1,489,134 |
| | 2,154,959 |
| | 3,039,090 |
| | 6,108,124 |
|
| Federal funds sold and security resell agreements | 568,334 |
| | 1,675,645 |
| | 620,469 |
| | 1,587,212 |
| | 619,758 |
|
| Investment securities: | | | | | | | | | |
| Held-to-maturity, at amortized cost (approximate fair value $850,473, $717,822, $720,991, $636,484, and $552,088) | 867,904 |
| | 715,279 |
| | 713,392 |
| | 631,646 |
| | 545,648 |
|
| Available-for-sale, at fair value | 13,372,194 |
| | 10,358,083 |
| | 9,477,089 |
| | 8,701,885 |
| | 7,643,116 |
|
| Trading account, at fair value | 114,803 |
| | 108,004 |
| | 118,775 |
| | 65,838 |
| | 48,168 |
|
| | 14,354,901 |
| | 11,181,366 |
| | 10,309,256 |
| | 9,399,369 |
| | 8,236,932 |
|
| Loans held for sale | 171,934 |
| | 160,287 |
| | 146,512 |
| | 108,764 |
| | 149,880 |
|
| Loans and leases, net of unearned income and fees | 42,649,265 |
| | 42,539,720 |
| | 42,501,575 |
| | 41,418,185 |
| | 40,649,542 |
|
| Less allowance for loan losses | 567,522 |
| | 597,185 |
| | 608,345 |
| | 611,894 |
| | 606,048 |
|
| Loans held for investment, net of allowance | 42,081,743 |
| | 41,942,535 |
| | 41,893,230 |
| | 40,806,291 |
| | 40,043,494 |
|
| Other noninterest-bearing investments | 884,407 |
| | 894,110 |
| | 850,578 |
| | 855,813 |
| | 848,144 |
|
| Premises, equipment and software, net | 1,019,508 |
| | 986,553 |
| | 955,540 |
| | 925,430 |
| | 905,462 |
|
| Goodwill | 1,014,129 |
| | 1,014,129 |
| | 1,014,129 |
| | 1,014,129 |
| | 1,014,129 |
|
| Core deposit and other intangibles | 8,420 |
| | 10,329 |
| | 12,281 |
| | 14,259 |
| | 16,272 |
|
| Other real estate owned | 4,255 |
| | 8,358 |
| | 8,354 |
| | 10,411 |
| | 7,092 |
|
| Other assets | 983,355 |
| | 1,123,262 |
| | 1,117,422 |
| | 901,342 |
| | 916,937 |
|
| | $ | 63,239,165 |
| | $ | 61,038,860 |
| | $ | 59,642,992 |
| | $ | 59,179,913 |
| | $ | 59,664,543 |
|
| | | | | | | | | | |
| LIABILITIES AND SHAREHOLDERS’ EQUITY | | | | | | | | | |
| Deposits: | | | | | | | | | |
| Noninterest-bearing demand | $ | 24,115,112 |
| | $ | 22,710,778 |
| | $ | 22,276,600 |
| | $ | 21,872,274 |
| | $ | 22,276,664 |
|
| Interest-bearing: | | | | | | | | | |
| Savings and money market | 26,363,908 |
| | 25,502,628 |
| | 25,540,525 |
| | 25,723,996 |
| | 25,672,356 |
|
| Time | 2,756,810 |
| | 2,516,493 |
| | 2,336,088 |
| | 2,071,688 |
| | 2,130,680 |
|
| Foreign | — |
| | 118,762 |
| | 117,708 |
| | 219,899 |
| | 294,391 |
|
| | 53,235,830 |
| | 50,848,661 |
| | 50,270,921 |
| | 49,887,857 |
| | 50,374,091 |
|
| Federal funds and other short-term borrowings | 827,269 |
| | 1,115,561 |
| | 270,255 |
| | 232,188 |
| | 346,987 |
|
| Long-term debt | 534,850 |
| | 570,385 |
| | 698,712 |
| | 802,448 |
| | 812,366 |
|
| Reserve for unfunded lending commitments | 64,911 |
| | 61,615 |
| | 64,780 |
| | 69,026 |
| | 74,838 |
|
| Other liabilities | 941,999 |
| | 763,331 |
| | 711,941 |
| | 562,657 |
| | 548,742 |
|
| Total liabilities | 55,604,859 |
| | 53,359,553 |
| | 52,016,609 |
| | 51,554,176 |
| | 52,157,024 |
|
| Shareholders’ equity: | | | | | | | | | |
| Preferred stock, without par value, authorized 4,400,000 shares | 709,601 |
| | 709,601 |
| | 709,601 |
| | 828,490 |
| | 828,490 |
|
| Common stock, without par value; authorized 350,000,000 shares; issued and outstanding 203,085,100, 203,850,072, 205,103,566, 204,543,707 and 204,417,093 shares | 4,724,715 |
| | 4,747,912 |
| | 4,783,061 |
| | 4,777,630 |
| | 4,766,731 |
|
| Retained earnings | 2,321,571 |
| | 2,211,793 |
| | 2,110,069 |
| | 2,031,270 |
| | 1,966,910 |
|
| Accumulated other comprehensive income (loss) | (121,581 | ) | | 10,001 |
| | 23,652 |
| | (11,653 | ) | | (54,612 | ) |
| Total shareholders’ equity | 7,634,306 |
| | 7,679,307 |
| | 7,626,383 |
| | 7,625,737 |
| | 7,507,519 |
|
| | $ | 63,239,165 |
| | $ | 61,038,860 |
| | $ | 59,642,992 |
| | $ | 59,179,913 |
| | $ | 59,664,543 |
|
ZIONS BANCORPORATION
Press Release – Page 12
January 23, 2017
CONSOLIDATED STATEMENTS OF INCOME
(Unaudited)
|
| | | | | | | | | | | | | | | | | | | |
| | Three Months Ended |
| (In thousands, except per share amounts) | December 31,
2016 | | September 30,
2016 | | June 30,
2016 | | March 31,
2016 | | December 31,
2015 |
| Interest income: | | | | | | | | | |
| Interest and fees on loans | $ | 438,031 |
| | $ | 436,424 |
| | $ | 433,743 |
| | $ | 420,508 |
| | $ | 429,842 |
|
| Interest on money market investments | 4,161 |
| | 4,934 |
| | 5,564 |
| | 7,029 |
| | 6,144 |
|
| Interest on securities | 59,574 |
| | 49,337 |
| | 47,645 |
| | 47,364 |
| | 37,573 |
|
| Total interest income | 501,766 |
| | 490,695 |
| | 486,952 |
| | 474,901 |
| | 473,559 |
|
| Interest expense: | | | | | | | | | |
| Interest on deposits | 12,984 |
| | 12,549 |
| | 11,869 |
| | 11,845 |
| | 12,377 |
|
| Interest on short- and long-term borrowings | 8,312 |
| | 8,959 |
| | 10,234 |
| | 10,214 |
| | 12,349 |
|
| Total interest expense | 21,296 |
| | 21,508 |
| | 22,103 |
| | 22,059 |
| | 24,726 |
|
| Net interest income | 480,470 |
| | 469,187 |
| | 464,849 |
| | 452,842 |
| | 448,833 |
|
| Provision for loan losses | (2,687 | ) | | 18,825 |
| | 34,492 |
| | 42,145 |
| | 22,701 |
|
| Net interest income after provision for loan losses | 483,157 |
| | 450,362 |
| | 430,357 |
| | 410,697 |
| | 426,132 |
|
| Noninterest income: | | | | | | | | | |
| Service charges and fees on deposit accounts | 43,326 |
| | 44,490 |
| | 42,108 |
| | 41,261 |
| | 42,445 |
|
| Other service charges, commissions and fees | 52,145 |
| | 54,141 |
| | 51,906 |
| | 49,474 |
| | 49,335 |
|
| Wealth management income | 10,719 |
| | 9,973 |
| | 8,788 |
| | 7,954 |
| | 7,953 |
|
| Loan sales and servicing income | 6,008 |
| | 11,301 |
| | 10,178 |
| | 7,979 |
| | 6,915 |
|
| Capital markets and foreign exchange | 5,775 |
| | 5,726 |
| | 4,545 |
| | 5,667 |
| | 6,255 |
|
| Dividends and other investment income | 4,143 |
| | 9,045 |
| | 6,226 |
| | 4,639 |
| | 2,986 |
|
| Fair value and nonhedge derivative income (loss) | 6,885 |
| | (184 | ) | | (1,910 | ) | | (2,585 | ) | | 688 |
|
| Equity securities gains (losses), net | (3,432 | ) | | 8,441 |
| | 2,709 |
| | (550 | ) | | 53 |
|
| Fixed income securities gains (losses), net | 10 |
| | 39 |
| | 25 |
| | 28 |
| | (7 | ) |
| Other | 2,665 |
| | 1,915 |
| | 1,142 |
| | 2,894 |
| | 2,018 |
|
| Total noninterest income | 128,244 |
| | 144,887 |
| | 125,717 |
| | 116,761 |
| | 118,641 |
|
| Noninterest expense: | | | | | | | | | |
| Salaries and employee benefits | 240,601 |
| | 242,251 |
| | 241,341 |
| | 258,338 |
| | 236,037 |
|
| Occupancy, net | 32,337 |
| | 33,536 |
| | 29,621 |
| | 29,779 |
| | 30,618 |
|
| Furniture, equipment and software, net | 33,022 |
| | 29,090 |
| | 30,550 |
| | 32,015 |
| | 31,820 |
|
| Other real estate expense, net | 396 |
| | (137 | ) | | (527 | ) | | (1,329 | ) | | (536 | ) |
| Credit-related expense | 7,067 |
| | 6,825 |
| | 5,845 |
| | 5,934 |
| | 7,582 |
|
| Provision for unfunded lending commitments | 3,296 |
| | (3,165 | ) | | (4,246 | ) | | (5,812 | ) | | (6,551 | ) |
| Professional and legal services | 16,921 |
| | 14,473 |
| | 12,229 |
| | 11,471 |
| | 13,129 |
|
| Advertising | 5,262 |
| | 5,985 |
| | 5,268 |
| | 5,628 |
| | 5,692 |
|
| FDIC premiums | 11,268 |
| | 11,673 |
| | 9,580 |
| | 7,154 |
| | 9,194 |
|
| Amortization of core deposit and other intangibles | 1,909 |
| | 1,951 |
| | 1,979 |
| | 2,014 |
| | 2,273 |
|
| Debt extinguishment cost | — |
| | — |
| | 106 |
| | 247 |
| | 135 |
|
| Other | 52,436 |
| | 60,810 |
| | 50,148 |
| | 50,134 |
| | 67,960 |
|
| Total noninterest expense | 404,515 |
| | 403,292 |
| | 381,894 |
| | 395,573 |
| | 397,353 |
|
| Income before income taxes | 206,886 |
| | 191,957 |
| | 174,180 |
| | 131,885 |
| | 147,420 |
|
| Income taxes | 69,485 |
| | 64,694 |
| | 60,231 |
| | 41,448 |
| | 44,933 |
|
| Net income | 137,401 |
| | 127,263 |
| | 113,949 |
| | 90,437 |
| | 102,487 |
|
| Preferred stock dividends | (12,411 | ) | | (10,368 | ) | | (13,543 | ) | | (11,660 | ) | | (14,290 | ) |
| Preferred stock redemption | — |
| | — |
| | (9,759 | ) | | — |
| | — |
|
| Net earnings applicable to common shareholders | $ | 124,990 |
| | $ | 116,895 |
| | $ | 90,647 |
| | $ | 78,777 |
| | $ | 88,197 |
|
| | | | | | | | | | |
| Weighted average common shares outstanding during the period: | | | | | | | | |
| Basic shares | 202,886 |
| | 204,312 |
| | 204,236 |
| | 203,967 |
| | 203,884 |
|
| Diluted shares | 205,446 |
| | 204,714 |
| | 204,536 |
| | 204,096 |
| | 204,277 |
|
| Net earnings per common share: | | | | | | | | | |
| Basic | $ | 0.61 |
| | $ | 0.57 |
| | $ | 0.44 |
| | $ | 0.38 |
| | $ | 0.43 |
|
| Diluted | 0.60 |
| | 0.57 |
| | 0.44 |
| | 0.38 |
| | 0.43 |
|
ZIONS BANCORPORATION
Press Release – Page 13
January 23, 2017
CONSOLIDATED STATEMENTS OF INCOME
|
| | | | | | | | | | | |
| | Year Ended December 31, |
| (In thousands, except per share amounts) | 2016 | | 2015 | | 2014 |
| | (Unaudited) | | | | |
| Interest income: | | | | | |
| Interest and fees on loans | $ | 1,728,706 |
| | $ | 1,686,220 |
| | $ | 1,729,652 |
|
| Interest on money market investments | 21,688 |
| | 23,165 |
| | 21,414 |
|
| Interest on securities | 203,920 |
| | 124,086 |
| | 101,936 |
|
| Total interest income | 1,954,314 |
| | 1,833,471 |
| | 1,853,002 |
|
| Interest expense: | | | | | |
| Interest on deposits | 49,247 |
| | 49,344 |
| | 49,736 |
|
| Interest on short- and long-term borrowings | 37,719 |
| | 68,867 |
| | 123,262 |
|
| Total interest expense | 86,966 |
| | 118,211 |
| | 172,998 |
|
| Net interest income | 1,867,348 |
| | 1,715,260 |
| | 1,680,004 |
|
| Provision for loan losses | 92,775 |
| | 40,035 |
| | (98,082 | ) |
| Net interest income after provision for loan losses | 1,774,573 |
| | 1,675,225 |
| | 1,778,086 |
|
| Noninterest income: | | | | | |
| Service charges and fees on deposit accounts | 171,185 |
| | 168,451 |
| | 168,291 |
|
| Other service charges, commissions and fees | 207,666 |
| | 186,907 |
| | 178,053 |
|
| Wealth management income | 37,434 |
| | 31,224 |
| | 30,573 |
|
| Loan sales and servicing income | 35,466 |
| | 30,731 |
| | 29,154 |
|
| Capital markets and foreign exchange | 21,713 |
| | 25,655 |
| | 22,584 |
|
| Dividends and other investment income | 24,053 |
| | 30,150 |
| | 43,662 |
|
| Fair value and nonhedge derivative income (loss) | 2,206 |
| | (111 | ) | | (11,390 | ) |
| Equity securities gains, net | 7,168 |
| | 11,875 |
| | 13,471 |
|
| Fixed income securities gains (losses), net | 102 |
| | (138,735 | ) | | 10,419 |
|
| Impairment losses on investment securities: | | | | | |
| Impairment losses on investment securities | — |
| | — |
| | (27 | ) |
| Noncredit-related losses on securities not expected to be sold (recognized in other comprehensive income) | — |
| | — |
| | — |
|
| Net impairment losses on investment securities | — |
| | — |
| | (27 | ) |
| Other | 8,616 |
| | 11,094 |
| | 7,914 |
|
| Total noninterest income | 515,609 |
| | 357,241 |
| | 492,704 |
|
| Noninterest expense: | | | | | |
| Salaries and employee benefits | 982,531 |
| | 972,712 |
| | 956,411 |
|
| Occupancy, net | 125,273 |
| | 119,529 |
| | 115,701 |
|
| Furniture, equipment and software | 124,677 |
| | 123,196 |
| | 115,312 |
|
| Other real estate expense | (1,597 | ) | | (647 | ) | | (1,251 | ) |
| Credit related expense | 25,671 |
| | 28,541 |
| | 28,134 |
|
| Provision for unfunded lending commitments | (9,927 | ) | | (6,238 | ) | | (8,629 | ) |
| Professional and legal services | 55,094 |
| | 50,421 |
| | 66,011 |
|
| Advertising | 22,143 |
| | 25,314 |
| | 25,100 |
|
| FDIC premiums | 39,675 |
| | 34,422 |
| | 32,174 |
|
| Amortization of core deposit and other intangibles | 7,853 |
| | 9,247 |
| | 10,923 |
|
| Debt extinguishment cost | 353 |
| | 2,530 |
| | 44,422 |
|
| Other | 213,528 |
| | 221,580 |
| | 265,059 |
|
| Total noninterest expense | 1,585,274 |
| | 1,580,607 |
| | 1,649,367 |
|
| Income before income taxes | 704,908 |
| | 451,859 |
| | 621,423 |
|
| Income taxes | 235,858 |
| | 142,388 |
| | 222,961 |
|
| Net income | 469,050 |
| | 309,471 |
| | 398,462 |
|
| Preferred stock dividends | (47,982 | ) | | (62,857 | ) | | (71,894 | ) |
| Preferred stock redemption | (9,759 | ) | | — |
| | — |
|
| Net earnings applicable to common shareholders | $ | 411,309 |
| | $ | 246,614 |
| | $ | 326,568 |
|
| Weighted average common shares outstanding during the year: | | | | | |
| Basic shares | 203,855 |
| | 203,265 |
| | 192,207 |
|
| Diluted shares | 204,269 |
| | 203,698 |
| | 192,789 |
|
| Net earnings per common share: | | | | | |
| Basic | $ | 2.00 |
| | $ | 1.20 |
| | $ | 1.68 |
|
| Diluted | 1.99 |
| | 1.20 |
| | 1.68 |
|
ZIONS BANCORPORATION
Press Release – Page 14
January 23, 2017
Loan Balances Held for Investment by Portfolio Type
(Unaudited)
|
| | | | | | | | | | | | | | | | | | | | | | | | | | | | | |
| (In millions) | December 31,
2016 | | September 30,
2016 | | June 30,
2016 | | March 31,
2016 | | December 31,
2015 |
| Commercial: | | | | | | | | | | | | | | | | | | | |
| Commercial and industrial | | $ | 13,452 |
| | | | $ | 13,543 |
| | | | $ | 13,757 |
| | | | $ | 13,590 |
| | | | $ | 13,211 |
| |
| Leasing | | 423 |
| | | | 439 |
| | | | 426 |
| | | | 437 |
| | | | 442 |
| |
| Owner occupied | | 6,962 |
| | | | 6,889 |
| | | | 6,989 |
| | | | 7,022 |
| | | | 7,150 |
| |
| Municipal | | 778 |
| | | | 753 |
| | | | 756 |
| | | | 696 |
| | | | 676 |
| |
| Total commercial | | 21,615 |
| | | | 21,624 |
| | | | 21,928 |
| | | | 21,745 |
| | | | 21,479 |
| |
| Commercial real estate: | | | | | | | | | | | | | | | | | | | |
| Construction and land development | | 2,019 |
| | | | 2,147 |
| | | | 2,088 |
| | | | 1,968 |
| | | | 1,842 |
| |
| Term | | 9,322 |
| | | | 9,303 |
| | | | 9,230 |
| | | | 8,826 |
| | | | 8,514 |
| |
| Total commercial real estate | | 11,341 |
| | | | 11,450 |
| | | | 11,318 |
| | | | 10,794 |
| | | | 10,356 |
| |
| Consumer: | | | | | | | | | | | | | | | | | | | |
| Home equity credit line | | 2,645 |
| | | | 2,581 |
| | | | 2,507 |
| | | | 2,433 |
| | | | 2,417 |
| |
| 1-4 family residential | | 5,891 |
| | | | 5,785 |
| | | | 5,680 |
| | | | 5,418 |
| | | | 5,382 |
| |
| Construction and other consumer real estate | | 486 |
| | | | 453 |
| | | | 419 |
| | | | 401 |
| | | | 385 |
| |
| Bankcard and other revolving plans | | 481 |
| | | | 458 |
| | | | 460 |
| | | | 439 |
| | | | 444 |
| |
| Other | | 190 |
| | | | 189 |
| | | | 189 |
| | | | 188 |
| | | | 187 |
| |
| Total consumer | | 9,693 |
| | | | 9,466 |
| | | | 9,255 |
| | | | 8,879 |
| | | | 8,815 |
| |
| Loans and leases, net of unearned income and fees | | $ | 42,649 |
| | | | $ | 42,540 |
| | | | $ | 42,501 |
| | | | $ | 41,418 |
| | | | $ | 40,650 |
| |
Nonperforming Assets
(Unaudited)
|
| | | | | | | | | | | | | | | | | | | |
| (In thousands) | December 31,
2016 | | September 30,
2016 | | June 30,
2016 | | March 31,
2016 | | December 31,
2015 |
| | | | | | | | | | |
Nonaccrual loans1 | $ | 568,659 |
| | $ | 578,832 |
| | $ | 547,402 |
| | $ | 541,768 |
| | $ | 349,860 |
|
| Other real estate owned | 4,255 |
| | 8,358 |
| | 8,354 |
| | 10,411 |
| | 7,092 |
|
| Total nonperforming assets | $ | 572,914 |
| | $ | 587,190 |
| | $ | 555,756 |
| | $ | 552,179 |
| | $ | 356,952 |
|
Ratio of nonperforming assets to loans1 and leases and other real estate owned | 1.34 | % | | 1.37 | % | | 1.30 | % | | 1.33 | % | | 0.87 | % |
| Accruing loans past due 90 days or more | $ | 35,848 |
| | $ | 28,835 |
| | $ | 28,994 |
| | $ | 37,202 |
| | $ | 32,024 |
|
Ratio of accruing loans past due 90 days or more to loans1 and leases | 0.08 | % | | 0.07 | % | | 0.07 | % | | 0.09 | % | | 0.08 | % |
| Nonaccrual loans and accruing loans past due 90 days or more | $ | 604,507 |
| | $ | 607,667 |
| | $ | 576,396 |
| | $ | 578,970 |
| | $ | 381,884 |
|
Ratio of nonaccrual loans and accruing loans past due 90 days or more to loans1 and leases | 1.41 | % | | 1.42 | % | | 1.35 | % | | 1.39 | % | | 0.94 | % |
| Accruing loans past due 30-89 days | $ | 125,992 |
| | $ | 164,027 |
| | $ | 132,522 |
| | $ | 100,341 |
| | $ | 121,732 |
|
| Restructured loans included in nonaccrual loans | 111,287 |
| | 125,323 |
| | 143,379 |
| | 132,524 |
| | 103,004 |
|
| Restructured loans on accrual | 150,916 |
| | 169,784 |
| | 171,854 |
| | 195,482 |
| | 194,084 |
|
| Classified loans | 1,576,688 |
| | 1,615,348 |
| | 1,610,263 |
| | 1,532,052 |
| | 1,368,022 |
|
1 Includes loans held for sale.
ZIONS BANCORPORATION
Press Release – Page 15
January 23, 2017
Allowance for Credit Losses
(Unaudited)
|
| | | | | | | | | | | | | | | | | | | |
| | Three Months Ended |
| (In thousands) | December 31,
2016 | | September 30,
2016 | | June 30,
2016 | | March 31,
2016 | | December 31,
2015 |
| Allowance for Loan Losses | | | | | | | | | |
| Balance at beginning of period | $ | 597,185 |
| | $ | 608,345 |
| | $ | 611,894 |
| | $ | 606,048 |
| | $ | 596,440 |
|
| Add: | | | | | | | | | |
| Provision for losses | (2,687 | ) | | 18,825 |
| | 34,492 |
| | 42,145 |
| | 22,701 |
|
| Adjustment for FDIC-supported/PCI loans | — |
| | — |
| | — |
| | — |
| | 5 |
|
| Deduct: | | | | | | | | | |
| Gross loan and lease charge-offs | (37,863 | ) | | (53,763 | ) | | (57,629 | ) | | (48,110 | ) | | (45,334 | ) |
| Recoveries | 10,887 |
| | 23,778 |
| | 19,588 |
| | 11,811 |
| | 32,236 |
|
| Net loan and lease charge-offs | (26,976 | ) | | (29,985 | ) | | (38,041 | ) | | (36,299 | ) | | (13,098 | ) |
| Balance at end of period | $ | 567,522 |
| | $ | 597,185 |
| | $ | 608,345 |
| | $ | 611,894 |
| | $ | 606,048 |
|
| Ratio of allowance for loan losses to loans and leases, at period end | 1.33 | % | | 1.40 | % | | 1.43 | % | | 1.48 | % | | 1.49 | % |
| Ratio of allowance for loan losses to nonperforming loans, at period end | 100 | % | | 103 | % | | 111 | % | | 113 | % | | 173 | % |
| Annualized ratio of net loan and lease charge-offs to average loans | 0.25 | % | | 0.28 | % | | 0.36 | % | | 0.35 | % | | 0.13 | % |
| | | | | | | | | | |
| Reserve for Unfunded Lending Commitments | | | | | | | | | |
| Balance at beginning of period | $ | 61,615 |
| | $ | 64,780 |
| | $ | 69,026 |
| | $ | 74,838 |
| | $ | 81,389 |
|
| Provision charged (credited) to earnings | 3,296 |
| | (3,165 | ) | | (4,246 | ) | | (5,812 | ) | | (6,551 | ) |
| Balance at end of period | $ | 64,911 |
| | $ | 61,615 |
| | $ | 64,780 |
| | $ | 69,026 |
| | $ | 74,838 |
|
| Total Allowance for Credit Losses | | | | | | | | | |
| Allowance for loan losses | $ | 567,522 |
| | $ | 597,185 |
| | $ | 608,345 |
| | $ | 611,894 |
| | $ | 606,048 |
|
| Reserve for unfunded lending commitments | 64,911 |
| | 61,615 |
| | 64,780 |
| | 69,026 |
| | 74,838 |
|
| Total allowance for credit losses | $ | 632,433 |
| | $ | 658,800 |
| | $ | 673,125 |
| | $ | 680,920 |
| | $ | 680,886 |
|
| Ratio of total allowance for credit losses to loans and leases outstanding, at period end | 1.48 | % | | 1.55 | % | | 1.58 | % | | 1.64 | % | | 1.68 | % |
ZIONS BANCORPORATION
Press Release – Page 16
January 23, 2017
Nonaccrual Loans by Portfolio Type
(Unaudited)
|
| | | | | | | | | | | | | | | | | | | | | | | | | | | | | |
| (In millions) | December 31,
2016 | | September 30,
2016 | | June 30,
2016 | | March 31,
2016 | | December 31,
2015 |
| | | | | | | | | | | | | | | | | | | | |
| Loans held for sale | | $ | 40 |
| | | | $ | 29 |
| | | | $ | 13 |
| | | | $ | — |
| | | | $ | — |
| |
| | | | | | | | | | | | | | | | | | | | |
| Commercial: | | | | | | | | | | | | | | | | | | | |
| Commercial and industrial | | $ | 354 |
| | | | $ | 387 |
| | | | $ | 341 |
| | | | $ | 356 |
| | | | $ | 164 |
| |
| Leasing | | 14 |
| | | | 14 |
| | | | 14 |
| | | | 14 |
| | | | 4 |
| |
| Owner occupied | | 74 |
| | | | 66 |
| | | | 69 |
| | | | 74 |
| | | | 74 |
| |
| Municipal | | 1 |
| | | | 1 |
| | | | 1 |
| | | | 1 |
| | | | 1 |
| |
| Total commercial | | 443 |
| | | | 468 |
| | | | 425 |
| | | | 445 |
| | | | 243 |
| |
| Commercial real estate: | | | | | | | | | | | | | | | | | | | |
| Construction and land development | | 7 |
| | | | 4 |
| | | | 5 |
| | | | 6 |
| | | | 7 |
| |
| Term | | 29 |
| | | | 28 |
| | | | 51 |
| | | | 33 |
| | | | 40 |
| |
| Total commercial real estate | | 36 |
| | | | 32 |
| | | | 56 |
| | | | 39 |
| | | | 47 |
| |
| Consumer: | | | | | | | | | | | | | | | | | | | |
| Home equity credit line | | 11 |
| | | | 11 |
| | | | 12 |
| | | | 11 |
| | | | 8 |
| |
| 1-4 family residential | | 36 |
| | | | 36 |
| | | | 39 |
| | | | 44 |
| | | | 50 |
| |
| Construction and other consumer real estate | | 2 |
| | | | 1 |
| | | | 1 |
| | | | 1 |
| | | | 1 |
| |
| Bankcard and other revolving plans | | 1 |
| | | | 2 |
| | | | 1 |
| | | | 2 |
| | | | 1 |
| |
| Other | | — |
| | | | — |
| | | | — |
| | | | — |
| | | | — |
| |
| Total consumer | | 50 |
| | | | 50 |
| | | | 53 |
| | | | 58 |
| | | | 60 |
| |
| Total nonaccrual loans | | $ | 569 |
| | | | $ | 579 |
| | | | $ | 547 |
| | | | $ | 542 |
| | | | $ | 350 |
| |
Net Charge-Offs by Portfolio Type
(Unaudited)
|
| | | | | | | | | | | | | | | | | | | | | | | | | | | | | |
| | Three Months Ended |
| (In millions) | December 31,
2016 | | September 30,
2016 | | June 30,
2016 | | March 31,
2016 | | December 31,
2015 |
| Commercial: | | | | | | | | | | | | | | | | | | | |
| Commercial and industrial | | $ | 25 |
| | | | $ | 33 |
| | | | $ | 32 |
| | | | $ | 37 |
| | | | $ | 18 |
| |
| Leasing | | — |
| | | | — |
| | | | — |
| | | | — |
| | | | — |
| |
| Owner occupied | | (1 | ) | | | | — |
| | | | — |
| | | | (1 | ) | | | | — |
| |
| Municipal | | — |
| | | | — |
| | | | — |
| | | | — |
| | | | — |
| |
| Total commercial | | 24 |
| | | | 33 |
| | | | 32 |
| | | | 36 |
| | | | 18 |
| |
| Commercial real estate: | | | | | | | | | | | | | | | | | | | |
| Construction and land development | | — |
| | | | (1 | ) | | | | (1 | ) | | | | (2 | ) | | | | (2 | ) | |
| Term | | 1 |
| | | | (5 | ) | | | | 7 |
| | | | — |
| | | | (4 | ) | |
| Total commercial real estate | | 1 |
| | | | (6 | ) | | | | 6 |
| | | | (2 | ) | | | | (6 | ) | |
| Consumer: | | | | | | | | | | | | | | | | | | | |
| Home equity credit line | | — |
| | | | 1 |
| | | | — |
| | | | 1 |
| | | | (1 | ) | |
| 1-4 family residential | | — |
| | | | — |
| | | | (1 | ) | | | | 1 |
| | | | 1 |
| |
| Construction and other consumer real estate | | — |
| | | | — |
| | | | — |
| | | | — |
| | | | (1 | ) | |
| Bankcard and other revolving plans | | 2 |
| | | | 2 |
| | | | 1 |
| | | | — |
| | | | 2 |
| |
| Other | | — |
| | | | — |
| | | | — |
| | | | — |
| | | | — |
| |
| Total consumer loans | | 2 |
| | | | 3 |
| | | | — |
| | | | 2 |
| | | | 1 |
| |
| Total net charge-offs (recoveries) | | $ | 27 |
| | | | $ | 30 |
| | | | $ | 38 |
| | | | $ | 36 |
| | | | $ | 13 |
| |
ZIONS BANCORPORATION
Press Release – Page 17
January 23, 2017
CONSOLIDATED AVERAGE BALANCE SHEETS, YIELDS AND RATES
(Unaudited) |
| | | | | | | | | | | | | | | | | | | | |
| | Three Months Ended |
| | December 31, 2016 | | September 30, 2016 | | December 31, 2015 |
| (In thousands) | Average balance | | Average yield/rate 1 | | Average balance | | Average
yield/rate 1 | | Average balance | | Average
yield/rate 1 |
| ASSETS | | | | | | | | | | | |
| Money market investments | $ | 2,366,664 |
| | 0.70 | % | | $ | 3,139,771 |
| | 0.63 | % | | $ | 7,801,628 |
| | 0.31 | % |
| Securities: | | | | | | | | | | | |
| Held-to-maturity | 762,333 |
| | 4.09 | % | | 706,012 |
| | 4.33 | % | | 556,676 |
| | 5.06 | % |
| Available-for-sale | 11,500,712 |
| | 1.89 | % | | 9,697,759 |
| | 1.82 | % | | 6,770,548 |
| | 1.88 | % |
| Trading account | 119,819 |
| | 4.04 | % | | 80,591 |
| | 3.34 | % | | 62,372 |
| | 3.57 | % |
| Total securities | 12,382,864 |
| | 2.04 | % | | 10,484,362 |
| | 2.00 | % | | 7,389,596 |
| | 2.13 | % |
| Loans held for sale | 162,421 |
| | 2.73 | % | | 132,602 |
| | 3.34 | % | | 148,245 |
| | 3.69 | % |
Loans held for investment 2: | | | | | | | | | | | |
| Commercial | 21,617,645 |
| | 4.21 | % | | 21,815,443 |
| | 4.19 | % | | 21,287,497 |
| | 4.30 | % |
| Commercial real estate | 11,463,281 |
| | 4.24 | % | | 11,331,183 |
| | 4.19 | % | | 10,363,813 |
| | 4.42 | % |
| Consumer | 9,558,402 |
| | 3.73 | % | | 9,340,297 |
| | 3.81 | % | | 8,695,500 |
| | 3.88 | % |
| Total loans held for investment | 42,639,328 |
| | 4.11 | % | | 42,486,923 |
| | 4.11 | % | | 40,346,810 |
| | 4.24 | % |
| Total interest-earning assets | 57,551,277 |
| | 3.52 | % | | 56,243,658 |
| | 3.52 | % | | 55,686,279 |
| | 3.41 | % |
| Cash and due from banks | 894,059 |
| | | | 555,945 |
| | | | 652,201 |
| | |
| Allowance for loan losses | (589,404 | ) | | | | (608,948 | ) | | | | (595,058 | ) | | |
| Goodwill | 1,014,129 |
| | | | 1,014,129 |
| | | | 1,014,129 |
| | |
| Core deposit and other intangibles | 9,622 |
| | | | 11,576 |
| | | | 17,453 |
| | |
| Other assets | 2,866,544 |
| | | | 2,845,876 |
| | | | 2,686,049 |
| | |
| Total assets | $ | 61,746,227 |
| | | | $ | 60,062,236 |
| | | | $ | 59,461,053 |
| | |
| | | | | | | | | | | | |
| LIABILITIES AND SHAREHOLDERS’ EQUITY | | | | | | | | | | |
| Interest-bearing deposits: | | | | | | | | | | | |
| Savings and money market | $ | 25,872,814 |
| | 0.14 | % | | $ | 25,682,829 |
| | 0.15 | % | | $ | 25,058,336 |
| | 0.15 | % |
| Time | 2,637,803 |
| | 0.54 | % | | 2,409,092 |
| | 0.51 | % | | 2,183,936 |
| | 0.44 | % |
| Foreign | 21,505 |
| | 0.31 | % | | 116,678 |
| | 0.30 | % | | 395,810 |
| | 0.24 | % |
| Total interest-bearing deposits | 28,532,122 |
| | 0.18 | % | | 28,208,599 |
| | 0.18 | % | | 27,638,082 |
| | 0.18 | % |
| Borrowed funds: | | | | | | | | | | | |
| Federal funds and other short-term borrowings | 664,863 |
| | 0.36 | % | | 343,358 |
| | 0.22 | % | | 294,666 |
| | 0.14 | % |
| Long-term debt | 536,840 |
| | 5.71 | % | | 679,990 |
| | 5.13 | % | | 873,259 |
| | 5.56 | % |
| Total borrowed funds | 1,201,703 |
| | 2.75 | % | | 1,023,348 |
| | 3.48 | % | | 1,167,925 |
| | 4.19 | % |
| Total interest-bearing liabilities | 29,733,825 |
| | 0.28 | % | | 29,231,947 |
| | 0.29 | % | | 28,806,007 |
| | 0.34 | % |
| Noninterest-bearing deposits | 23,647,794 |
| | | | 22,466,132 |
| | | | 22,354,766 |
| | |
| Other liabilities | 656,488 |
| | | | 668,180 |
| | | | 614,398 |
| | |
| Total liabilities | 54,038,107 |
| | | | 52,366,259 |
| | | | 51,775,171 |
| | |
| Shareholders’ equity: | | | | | | | | | | | |
| Preferred equity | 709,601 |
| | | | 709,601 |
| | | | 920,145 |
| | |
| Common equity | 6,998,519 |
| | | | 6,986,376 |
| | | | 6,765,737 |
| | |
| Total shareholders’ equity | 7,708,120 |
| | | | 7,695,977 |
| | | | 7,685,882 |
| | |
| Total liabilities and shareholders’ equity | $ | 61,746,227 |
| | | | $ | 60,062,236 |
| | | | $ | 59,461,053 |
| | |
| | | | | | | | | | | | |
| Spread on average interest-bearing funds | | | 3.24 | % | | | | 3.23 | % | | | | 3.07 | % |
| | | | | | | | | | | | |
| Net yield on interest-earning assets | | | 3.37 | % | | | | 3.36 | % | | | | 3.23 | % |
1 Taxable-equivalent rates used where applicable.
2 Net of unearned income and fees, net of related costs. Loans include nonaccrual and restructured loans.
ZIONS BANCORPORATION
Press Release – Page 18
January 23, 2017
GAAP to Non-GAAP Reconciliations
(Unaudited)
This press release presents both GAAP and non-GAAP financial measures to provide investors with additional information. The adjustments to reconcile from the applicable GAAP financial measures to the non-GAAP financial measures are presented in the following tables. The Company considers these adjustments to be relevant to ongoing operating results. The Company believes that excluding the amounts associated with these adjustments to present the non-GAAP financial measures provides a meaningful base for period-to-period and company-to-company comparisons. These non-GAAP financial measures are used by management to assess the performance and financial position of the Company and for presentations of Company performance to investors. The Company further believes that presenting these non-GAAP financial measures will permit investors and analysts to assess the performance of the Company on the same basis as that applied by management.
Non-GAAP financial measures have inherent limitations, are not required to be uniformly applied, and are not audited. Although non-GAAP financial measures are frequently used by stakeholders to evaluate a company, they have limitations as an analytical tool and should not be considered in isolation or as a substitute for analysis of results reported under GAAP.
The following are the non-GAAP financial measures presented in this Earnings Release and a discussion of why management uses these non-GAAP measures:
| |
| • | Tangible Book Value per Common Share - this table also includes “Tangible common equity.” Tangible book value per common share is a non-GAAP financial measure that management believes provides additional useful information about the level of tangible assets in relation to outstanding shares of common stock. Management believes the use of ratios that utilize tangible equity provides additional useful information because they present measures of those assets that can generate income. |
| |
| • | Tangible Return on Average Tangible Common Equity - this table also includes “Net earnings applicable to common shareholders, excluding the effects of the adjustments, net of tax” and “Average tangible common equity.” Tangible return on average tangible common equity is a non-GAAP financial measure that management believes provides useful information about the Company’s use of equity. Management believes the use of ratios that utilize tangible equity provides additional useful information because they present measures of those assets that can generate income. |
| |
| • | Efficiency Ratio - this table also includes “Adjusted noninterest expense” and “Adjusted pre-provision net revenue (“PPNR”).” The methodology of determining the efficiency ratio may differ among companies. Management makes adjustments to exclude certain items as identified in the table below which management believes allows for more consistent comparability among periods. Management believes the efficiency ratio provides useful information regarding the cost of generating revenue. Adjusted noninterest expense provides a measure as to how well the Company is managing its expenses, and adjusted PPNR enables management and others to assess the Company’s ability to generate capital to cover credit losses through a credit cycle. The efficiency ratio and adjusted noninterest expense are the key metrics to which the Company announced it would hold itself accountable in its June 1, 2015 efficiency initiative, and to which executive compensation is tied. |
ZIONS BANCORPORATION
Press Release – Page 19
January 23, 2017
GAAP to Non-GAAP Reconciliations
(Unaudited)
|
| | | | | | | | | | | | | | | | | | | | |
| (In thousands, except per share amounts) | | December 31,
2016 | | September 30,
2016 | | June 30,
2016 | | March 31,
2016 | | December 31,
2015 |
| Tangible Book Value per Common Share | | | | | | | | |
| | | | | | | | | | | |
| Total shareholders’ equity (GAAP) | | $ | 7,634,306 |
| | $ | 7,679,307 |
| | $ | 7,626,383 |
| | $ | 7,625,737 |
| | $ | 7,507,519 |
|
| Preferred stock | | (709,601 | ) | | (709,601 | ) | | (709,601 | ) | | (828,490 | ) | | (828,490 | ) |
| Goodwill | | (1,014,129 | ) | | (1,014,129 | ) | | (1,014,129 | ) | | (1,014,129 | ) | | (1,014,129 | ) |
| Core deposit and other intangibles | | (8,420 | ) | | (10,329 | ) | | (12,281 | ) | | (14,259 | ) | | (16,272 | ) |
| Tangible common equity (non-GAAP) | (a) | $ | 5,902,156 |
| | $ | 5,945,248 |
| | $ | 5,890,372 |
| | $ | 5,768,859 |
| | $ | 5,648,628 |
|
| Common shares outstanding | (b) | 203,085 |
| | 203,850 |
| | 205,104 |
| | 204,544 |
| | 204,417 |
|
| Tangible book value per common share (non-GAAP) | (a/b) | $ | 29.06 |
| | $ | 29.16 |
| | $ | 28.72 |
| | $ | 28.20 |
| | $ | 27.63 |
|
| | | | | | | | | | | |
| | | Three Months Ended |
| (Dollar amounts in thousands) | | December 31,
2016 | | September 30,
2016 | | June 30,
2016 | | March 31,
2016 | | December 31,
2015 |
| Tangible Return on Average Tangible Common Equity | | | | | | | | |
| | | | | | | | | | | |
| Net earnings applicable to common shareholders (GAAP) | | $ | 124,990 |
| | $ | 116,895 |
| | $ | 90,647 |
| | $ | 78,777 |
| | $ | 88,197 |
|
| Adjustments, net of tax: | | | | | | | | | | |
| Amortization of core deposit and other intangibles | | 1,184 |
| | 1,210 |
| | 1,227 |
| | 1,249 |
| | 1,446 |
|
| Net earnings applicable to common shareholders, excluding the effects of the adjustments, net of tax (non-GAAP) | (a) | $ | 126,174 |
| | $ | 118,105 |
| | $ | 91,874 |
| | $ | 80,026 |
| | $ | 89,643 |
|
| Average common equity (GAAP) | | $ | 6,998,519 |
| | $ | 6,986,376 |
| | $ | 6,883,065 |
| | $ | 6,786,977 |
| | $ | 6,765,737 |
|
| Average goodwill | | (1,014,129 | ) | | (1,014,129 | ) | | (1,014,129 | ) | | (1,014,129 | ) | | (1,014,129 | ) |
| Average core deposit and other intangibles | | (9,622 | ) | | (11,576 | ) | | (13,527 | ) | | (15,379 | ) | | (17,453 | ) |
| Average tangible common equity (non-GAAP) | (b) | $ | 5,974,768 |
| | $ | 5,960,671 |
| | $ | 5,855,409 |
| | $ | 5,757,469 |
| | $ | 5,734,155 |
|
| Number of days in quarter | (c) | 92 |
| | 92 |
| | 91 |
| | 91 |
| | 92 |
|
| Number of days in year | (d) | 366 |
| | 366 |
| | 366 |
| | 366 |
| | 365 |
|
| Tangible return on average tangible common equity (non-GAAP) | (a/b/c)*d | 8.40 | % | | 7.88 | % | | 6.31 | % | | 5.59 | % | | 6.20 | % |
ZIONS BANCORPORATION
Press Release – Page 20
January 23, 2017
GAAP to Non-GAAP Reconciliations
(Unaudited)
|
| | | | | | | | | | | | | | | | | | | | |
| | | Three Months Ended |
| (In thousands) | | December 31,
2016 | | September 30,
2016 | | June 30,
2016 | | March 31,
2016 | | December 31,
2015 |
| Efficiency Ratio | | | | | | | | | | |
| | | | | | | | | | | |
Noninterest expense (GAAP) 1 | (a) | $ | 404,515 |
| | $ | 403,292 |
| | $ | 381,894 |
| | $ | 395,573 |
| | $ | 397,353 |
|
| Adjustments: | | | | | | | | | | |
| Severance costs | | 496 |
| | 481 |
| | 201 |
| | 3,471 |
| | 3,581 |
|
| Other real estate expense, net | | 396 |
| | (137 | ) | | (527 | ) | | (1,329 | ) | | (536 | ) |
| Provision for unfunded lending commitments | 3,296 |
| | (3,165 | ) | | (4,246 | ) | | (5,812 | ) | | (6,551 | ) |
| Debt extinguishment cost | | — |
| | — |
| | 106 |
| | 247 |
| | 135 |
|
| Amortization of core deposit and other intangibles | | 1,909 |
| | 1,951 |
| | 1,979 |
| | 2,014 |
| | 2,273 |
|
Restructuring costs 2 | | 3,283 |
| | 356 |
| | 47 |
| | 996 |
| | 777 |
|
| Total adjustments | (b) | 9,380 |
| | (514 | ) | | (2,440 | ) | | (413 | ) | | (321 | ) |
| Adjusted noninterest expense (non-GAAP) | (a-b)=(c) | $ | 395,135 |
| | $ | 403,806 |
| | $ | 384,334 |
| | $ | 395,986 |
| | $ | 397,674 |
|
| Taxable-equivalent net interest income (GAAP) | (d) | $ | 487,823 |
| | $ | 475,699 |
| | $ | 470,913 |
| | $ | 458,242 |
| | $ | 453,780 |
|
Noninterest income (GAAP) 1 | (e) | 128,244 |
| | 144,887 |
| | 125,717 |
| | 116,761 |
| | 118,641 |
|
| Combined income | (d+e)=(f) | 616,067 |
| | 620,586 |
| | 596,630 |
| | 575,003 |
| | 572,421 |
|
| Adjustments: | | | | | | | | | | |
| Fair value and nonhedge derivative income (loss) | 6,885 |
| | (184 | ) | | (1,910 | ) | | (2,585 | ) | | 688 |
|
| Equity securities gains (losses), net | | (3,432 | ) | | 8,441 |
| | 2,709 |
| | (550 | ) | | 53 |
|
| Fixed income securities gains (losses), net | | 10 |
| | 39 |
| | 25 |
| | 28 |
| | (7 | ) |
| Total adjustments | (g) | 3,463 |
| | 8,296 |
| | 824 |
| | (3,107 | ) | | 734 |
|
| Adjusted taxable-equivalent revenue (non-GAAP) | (f-g)=(h) | $ | 612,604 |
| | $ | 612,290 |
| | $ | 595,806 |
| | $ | 578,110 |
| | $ | 571,687 |
|
| Pre-provision net revenue (PPNR) as reported | (f)-(a) | $ | 211,552 |
| | $ | 217,294 |
| | $ | 214,736 |
| | $ | 179,430 |
| | $ | 175,068 |
|
| Adjusted PPNR | (h-c) | 217,469 |
| | 208,484 |
| | 211,472 |
| | 182,124 |
| | 174,013 |
|
| Efficiency ratio | (c/h) | 64.5 | % | | 66.0 | % | | 64.5 | % | | 68.5 | % | | 69.6 | % |
1In the first quarter of 2016, to be consistent with industry practice, the Company reclassified its bankcard rewards expense from “Other” noninterest expense to “Other service charges, commissions and fees” in noninterest income in order to offset this expense against the associated revenue. Prior period amounts have been reclassified to reflect this change.
2 The restructuring costs in the fourth quarter of 2016 are primarily related to the termination of the Zions Direct auction platform and changes to create a simplified lending approach for our business banking customers.
ZIONS BANCORPORATION
Press Release – Page 21
January 23, 2017
GAAP to Non-GAAP Reconciliations
(Unaudited)
|
| | | | | | | | | | | | |
| | | Six Months Ended | | Year-to-date |
| (In thousands) | | December 31,
2016 | | December 31,
2015 | | December 31,
2016 |
| Efficiency Ratio | | | | | | |
| | | | | | | |
Noninterest expense (GAAP) 1 | (a) | $ | 807,807 |
| | $ | 788,633 |
| | $ | 1,585,274 |
|
| Adjustments: | | | | | | |
| Severance costs | | 977 |
| | 7,045 |
| | 4,649 |
|
| Other real estate expense, net | | 259 |
| | (576 | ) | | (1,597 | ) |
| Provision for unfunded lending commitments | 131 |
| | (5,123 | ) | | (9,927 | ) |
| Debt extinguishment cost | | — |
| | 135 |
| | 353 |
|
| Amortization of core deposit and other intangibles | | 3,860 |
| | 4,571 |
| | 7,853 |
|
Restructuring costs 2 | | 3,639 |
| | 2,407 |
| | 4,682 |
|
| Total adjustments | (b) | 8,866 |
| | 8,459 |
| | 6,013 |
|
| Adjusted noninterest expense (non-GAAP) | (a-b)=(c) | $ | 798,941 |
| | $ | 780,174 |
| | $ | 1,579,261 |
|
| Taxable-equivalent net interest income (GAAP) | (d) | $ | 963,522 |
| | $ | 883,562 |
| | $ | 1,892,677 |
|
Noninterest income (GAAP) 1 | (e) | 273,131 |
| | 244,585 |
| | 515,609 |
|
| Combined income | (d+e)=(f) | 1,236,653 |
| | 1,128,147 |
| | 2,408,286 |
|
| Adjustments: | | | | | | |
| Fair value and nonhedge derivative income (loss) | 6,701 |
| | (867 | ) | | 2,206 |
|
| Equity securities gains, net | | 5,009 |
| | 3,683 |
| | 7,168 |
|
| Fixed income securities gains (losses), net | | 49 |
| | (60 | ) | | 102 |
|
| Total adjustments | (g) | 11,759 |
| | 2,756 |
| | 9,476 |
|
| Adjusted taxable-equivalent revenue (non-GAAP) | (f-g)=(h) | $ | 1,224,894 |
| | $ | 1,125,391 |
| | $ | 2,398,810 |
|
| Pre-provision net revenue (PPNR) as reported | (f)-(a) | $ | 428,846 |
| | $ | 339,514 |
| | $ | 823,012 |
|
| Adjusted PPNR | (h-c) | 425,953 |
| | 345,217 |
| | 819,549 |
|
| Efficiency ratio | (c/h) | 65.2 | % | | 69.3 | % | | 65.8 | % |
1In the first quarter of 2016, to be consistent with industry practice, the Company reclassified its bankcard rewards expense from “Other” noninterest expense to “Other service charges, commissions and fees” in noninterest income in order to offset this expense against the associated revenue. Prior period amounts have been reclassified to reflect this change.
2 The restructuring costs in the fourth quarter of 2016 are primarily related to the termination of the Zions Direct auction platform and changes to create a simplified lending approach for our business banking customers.
