
Second Quarter 2017 Financial Update May 8, 2017
2 Forward-Looking Statements; Use of Non-GAAP Financial Measures; Peer Group Key ASB: Associated Banc-Corp BAC: Bank of America BBT: BB&T Corporation BOKF: BOK Financial Corporation C: Citigroup, Inc. CBSH: Commerce Bancshares, Inc. CFG: Citizens Financial Group, Inc. CMA: Comerica Incorporated EWBC: East West Bancorp, Inc. FHN: First Horizon National Corporation FITB: Fifth Third Bancorp FRC: First Republic Bank HBAN: Huntington Bancshares Incorporated JPM: JPMorgan Chase & Co. KEY: KeyCorp MTB: M&T Bank Corporation PBCT: People’s United Financial, Inc. PNC: PNC Financial Services Group RF: Regions Financial Corporation SNV: Synovus Financial Corp. STI: SunTrust Banks, Inc. UB: Union Bank USB: US Bank WBS: Webster Financial WFC: Wells Fargo & Co. ZION: Zions Bancorporation Statements in this presentation that are based on other than historical data or that express the Company’s expectations regarding future events or determinations are forward-looking within the meaning of the Private Securities Litigation Reform Act of 1995. Statements based on historical data are not intended and should not be understood to indicate the Company’s expectations regarding future events. Forward-looking statements provide current expectations or forecasts or intentions regarding future events or determinations. These forward-looking statements are not guarantees of future performance or determinations, nor should they be relied upon as representing management’s views as of any subsequent date. Forward-looking statements involve significant risks and uncertainties, and actual results may differ materially from those presented, either expressed or implied, in this presentation. Factors that could cause actual results to differ materially from those expressed in the forward-looking statements include the actual amount and duration of declines in the price of oil and gas, our ability to meet our efficiency and noninterest expense goals, the rate of change of interest sensitive assets and liabilities relative to changes in benchmark interest rates as well as other factors discussed in the Company’s most recent Annual Report on Form 10-K and Quarterly Report on Form 10-Q, filed with the Securities and Exchange Commission (“SEC”) and available at the SEC’s Internet site (http://www.sec.gov). Except as required by law, the Company specifically disclaims any obligation to update any factors or to publicly announce the result of revisions to any of the forward-looking statements included herein to reflect future events or developments. This document contains several references to non-GAAP measures, including pre-provision net revenue and the “efficiency ratio,” which are common industry terms used by investors and financial services analysts. Certain of these non-GAAP measures are key inputs into Zions’ management compensation and are used in Zions’ strategic goals that have been and may continue to be articulated to investors. Therefore, the use of such non-GAAP measures are believed by management to be of substantial interest to the consumers of these financial disclosures and are used prominently throughout the disclosures. A full reconciliation of the difference between such measures and GAAP financials is provided within the document, and users of this document are encouraged to carefully review this reconciliation.
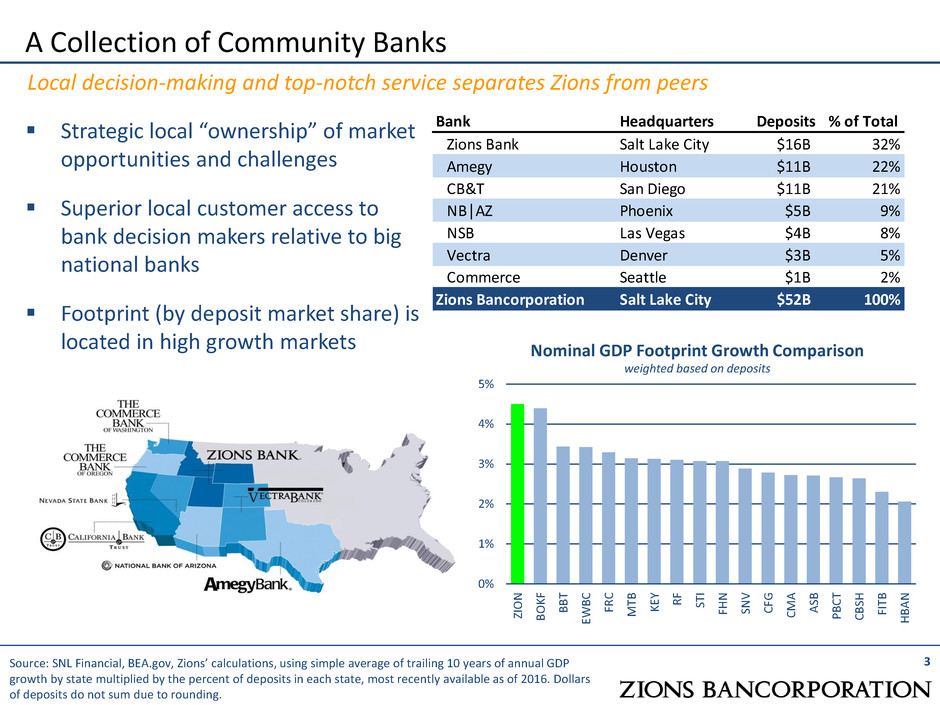
3 A Collection of Community Banks Local decision-making and top-notch service separates Zions from peers Source: SNL Financial, BEA.gov, Zions’ calculations, using simple average of trailing 10 years of annual GDP growth by state multiplied by the percent of deposits in each state, most recently available as of 2016. Dollars of deposits do not sum due to rounding. Strategic local “ownership” of market opportunities and challenges Superior local customer access to bank decision makers relative to big national banks Footprint (by deposit market share) is located in high growth markets 0% 1% 2% 3% 4% 5% ZI O N B O K F B B T EWB C FR C M TB K EY R F ST I FH N SN V C FG C M A A SB PB C T C B SH FI TB H BA N Nominal GDP Footprint Growth Comparison weighted based on deposits Bank Headquarters Deposits % of Total Zions Bank Salt Lake City $16B 32% Amegy Houston $11B 22% CB&T San Diego $11B 21% NB│AZ Phoenix $5B 9% NSB Las Vegas $4B 8% Vectra Denver $3B 5% Commerce Seattle $1B 2% Zions Bancorporation Salt Lake City $52B 100%
4 Superior Brand: Nationally Recognized for Excellence (1) One of five winning teams, 2015, Zions Bank. (2) Readers of the San Diego Union-Tribune, August 2016, for six consecutive years; Orange County Register, for three consecutive years. (3) Ranking Arizona Magazine, 2016. Strong reputation in small business and middle market banking Has averaged 16 Greenwich Excellence Awards annually since 2009 (survey inception) Only 10 banks have averaged more than 10 awards since 2009 Top team of women bankers – American Banker (1) California Bank & Trust consistently voted Best Bank in San Diego and Orange Counties (2) National Bank of Arizona voted #1 Bank in Arizona 14 straight years (3)
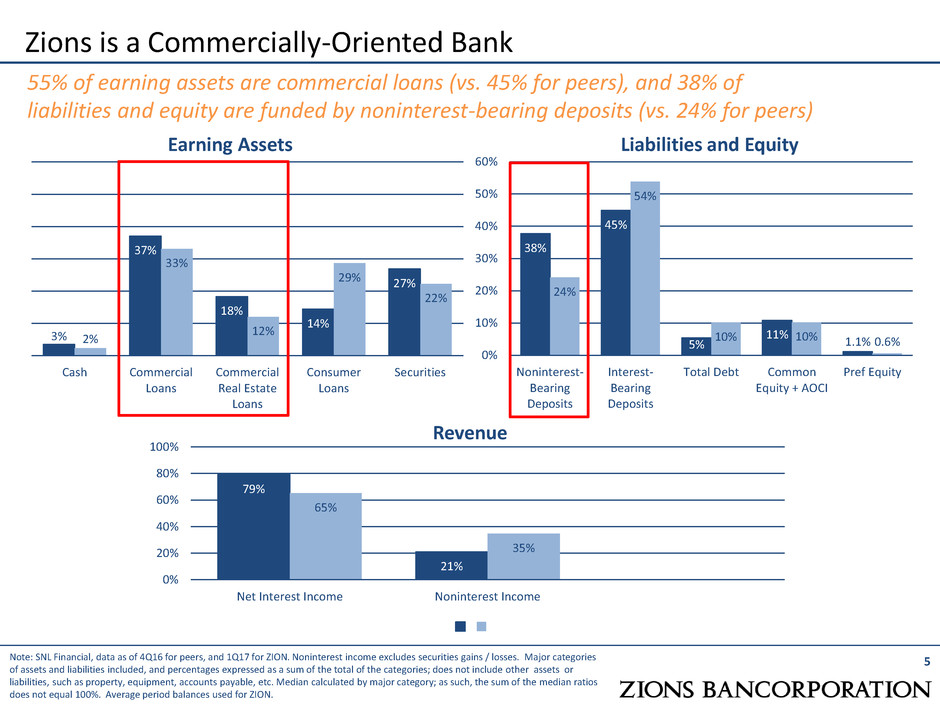
Zions is a Commercially-Oriented Bank Earning Assets Liabilities and Equity 5 55% of earning assets are commercial loans (vs. 45% for peers), and 38% of liabilities and equity are funded by noninterest-bearing deposits (vs. 24% for peers) 3% 37% 18% 14% 27% 2% 33% 12% 29% 22% Cash Commercial Loans Commercial Real Estate Loans Consumer Loans Securities 38% 45% 5% 11% 1.1% 24% 54% 10% 10% 0.6% 0% 10% 20% 30% 40% 50% 60% Noninterest- Bearing Deposits Interest- Bearing Deposits Total Debt Common Equity + AOCI Pref Equity Revenue 79% 21% 65% 35% 0% 20% 40% 60% 80% 100% Net Interest Income Noninterest Income Note: SNL Financial, data as of 4Q16 for peers, and 1Q17 for ZION. Noninterest income excludes securities gains / losses. Major categories of assets and liabilities included, and percentages expressed as a sum of the total of the categories; does not include other assets or liabilities, such as property, equipment, accounts payable, etc. Median calculated by major category; as such, the sum of the median ratios does not equal 100%. Average period balances used for ZION.
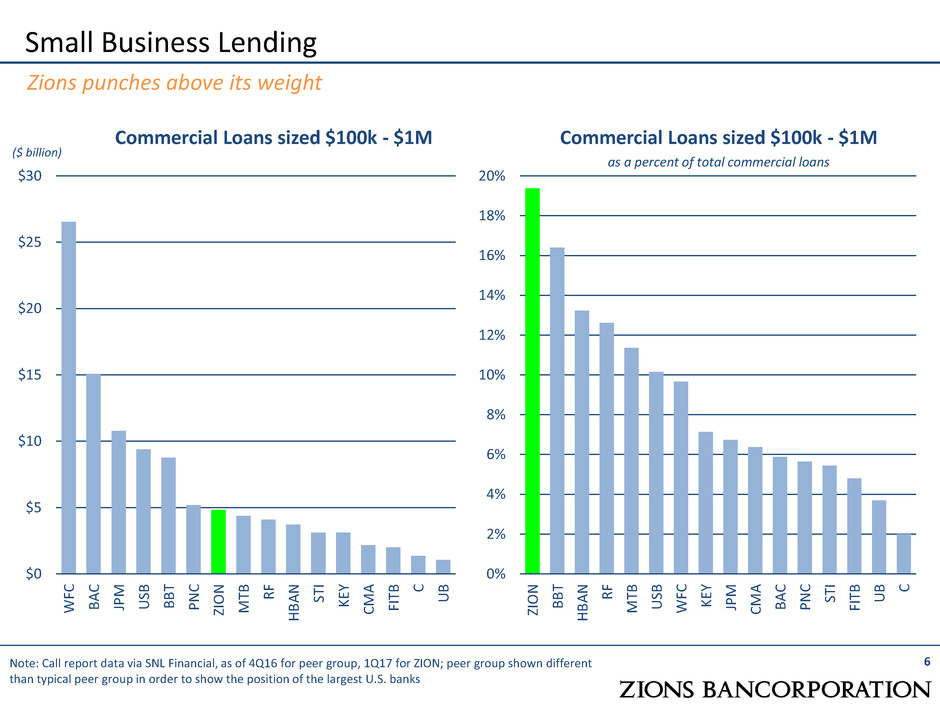
Small Business Lending Commercial Loans sized $100k - $1M Commercial Loans sized $100k - $1M as a percent of total commercial loans 6 0% 2% 4% 6% 8% 10% 12% 14% 16% 18% 20% ZIO N B B T H B A N R F M TB US B WF C KE Y JP M CM A B A C P N C ST I FIT B U B C Note: Call report data via SNL Financial, as of 4Q16 for peer group, 1Q17 for ZION; peer group shown different than typical peer group in order to show the position of the largest U.S. banks $0 $5 $10 $15 $20 $25 $30 WF C B A C JP M US B B B T P N C ZIO N M TB R F H B A N ST I KE Y CM A FIT B C U B Zions punches above its weight ($ billion)
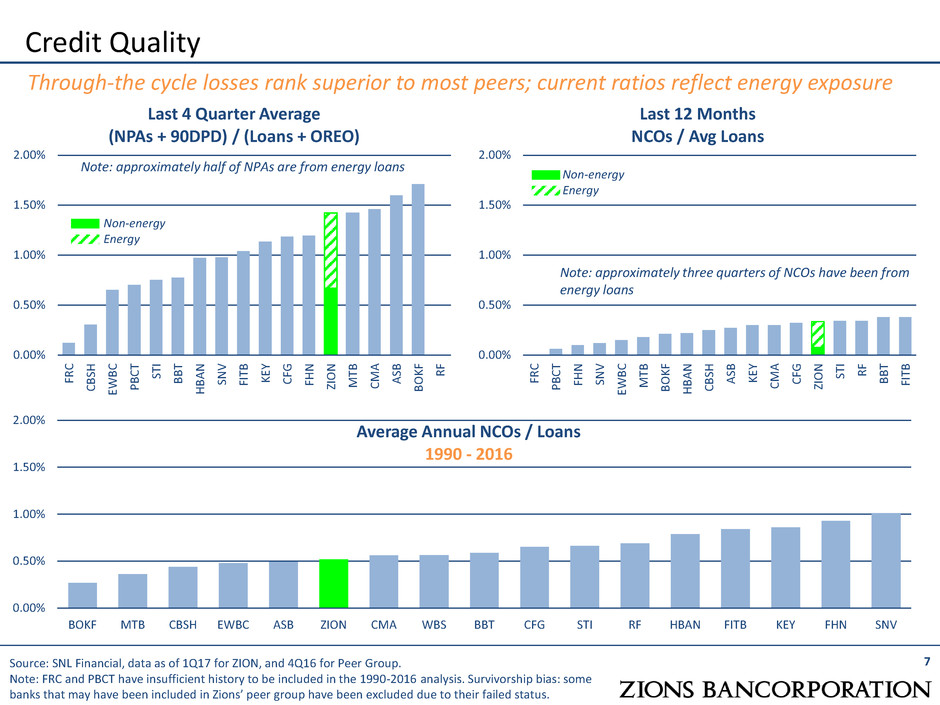
0.00% 0.50% 1.00% 1.50% 2.00% BOKF MTB CBSH EWBC ASB ZION CMA WBS BBT CFG STI RF HBAN FITB KEY FHN SNV 0.00% 0.50% 1.00% 1.50% 2.00% FR C C B SH EWB C PB C T ST I B B T H BA N SN V FI TB K EY C FG FH N ZI O N M TB C M A A SB B O K F R F Credit Quality Last 4 Quarter Average (NPAs + 90DPD) / (Loans + OREO) Last 12 Months NCOs / Avg Loans 7 0.00% 0.50% 1.00% 1.50% 2.00% FR C PB C T FH N SN V EWB C M TB B O K F H BA N C B SH A SB K EY C M A C FG ZI O N ST I R F B B T FI TB Non-energy Energy Note: approximately three quarters of NCOs have been from energy loans Source: SNL Financial, data as of 1Q17 for ZION, and 4Q16 for Peer Group. Note: FRC and PBCT have insufficient history to be included in the 1990-2016 analysis. Survivorship bias: some banks that may have been included in Zions’ peer group have been excluded due to their failed status. Through-the cycle losses rank superior to most peers; current ratios reflect energy exposure Average Annual NCOs / Loans 1990 - 2016 Note: approximately half of NPAs are from energy loans Non-energy Energy
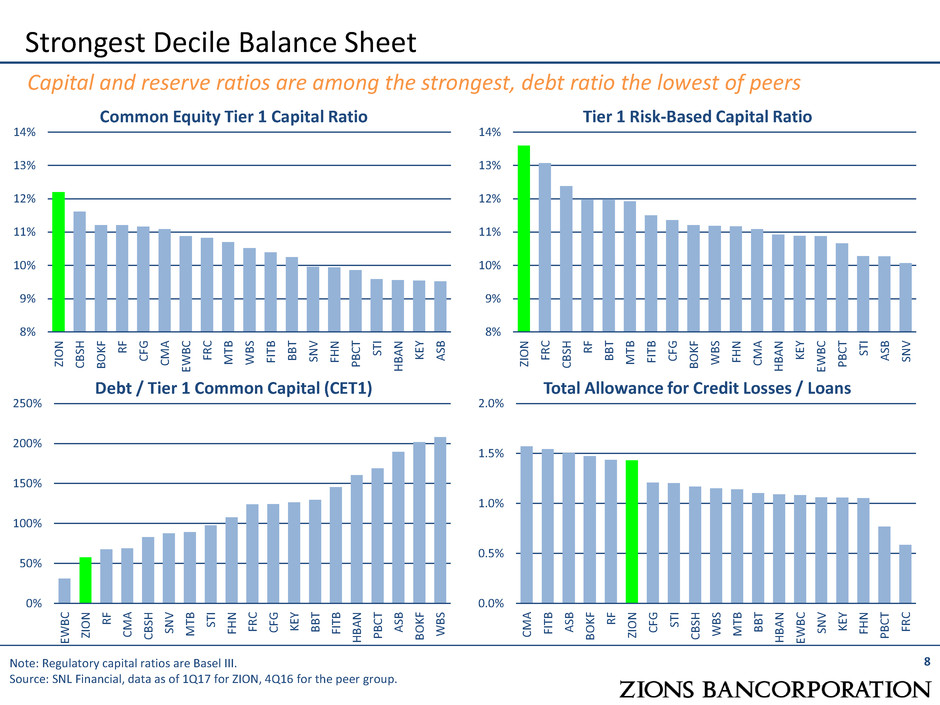
Strongest Decile Balance Sheet Common Equity Tier 1 Capital Ratio Tier 1 Risk-Based Capital Ratio 8% 9% 10% 11% 12% 13% 14% ZI O N FR C C B SH R F B B T M TB FI TB C FG B O K F WB S FH N C M A H BA N K EY EWB C PB C T ST I A SB SN V Note: Regulatory capital ratios are Basel III. Source: SNL Financial, data as of 1Q17 for ZION, 4Q16 for the peer group. 8% 9% 10% 11% 12% 13% 14% ZI O N C B SH B O K F R F C FG C M A EWB C FR C M TB WB S FI TB B B T SN V FH N PB C T ST I H BA N K EY A SB Capital and reserve ratios are among the strongest, debt ratio the lowest of peers Debt / Tier 1 Common Capital (CET1) Total Allowance for Credit Losses / Loans 0.0% 0.5% 1.0% 1.5% 2.0% C M A FI TB A SB B O K F R F ZI O N C FG ST I C B SH WB S M TB B B T H BA N EWB C SN V K EY FH N PB C T FR C 0% 50% 100% 150% 200% 250% EWB C ZI O N R F C M A C B SH SN V M TB ST I FH N FR C C FG K EY B B T FI TB H BA N PB C T A SB B O K F WB S 8
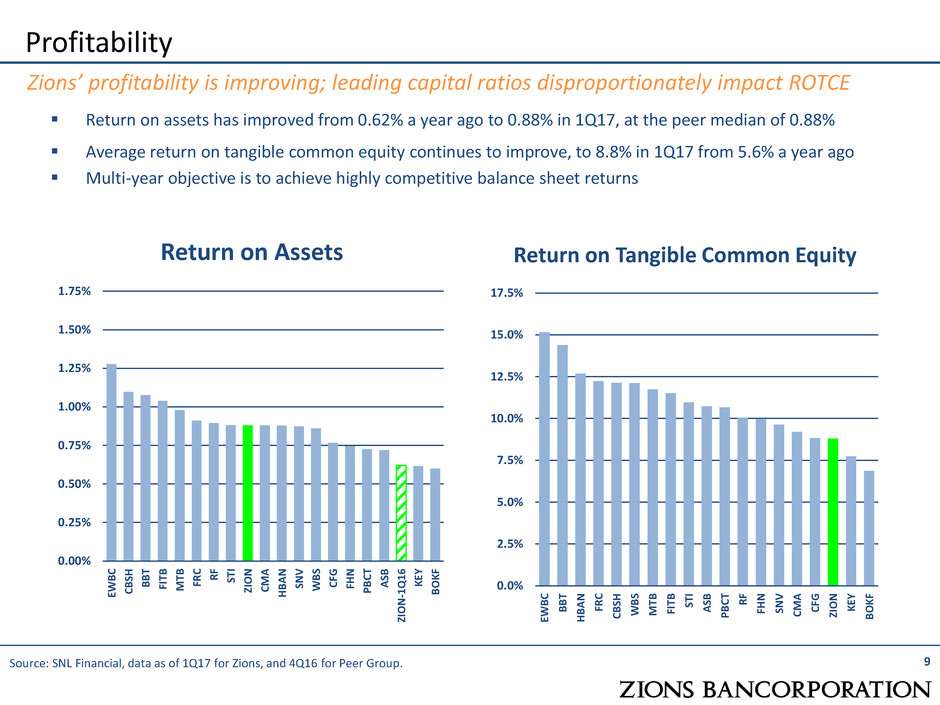
Profitability 9 Zions’ profitability is improving; leading capital ratios disproportionately impact ROTCE 0.00% 0.25% 0.50% 0.75% 1.00% 1.25% 1.50% 1.75% EWB C C B SH B B T FI T B M TB FR C R F ST I ZI O N C M A H B A N SN V WB S C FG FH N PB C T A SB ZI O N -1 Q 1 6 K EY B O K F Return on Assets 0.0% 2.5% 5.0% 7.5% 10.0% 12.5% 15.0% 17.5% EWB C B B T H B A N FR C C B SH WB S M TB FI T B ST I A SB PB C T R F FH N SN V C M A C FG ZI O N K EY B O K F Return on Tangible Common Equity Source: SNL Financial, data as of 1Q17 for Zions, and 4Q16 for Peer Group. Return on assets has improved from 0.62% a year ago to 0.88% in 1Q17, at the peer median of 0.88% Average return on tangible common equity continues to improve, to 8.8% in 1Q17 from 5.6% a year ago Multi-year objective is to achieve highly competitive balance sheet returns
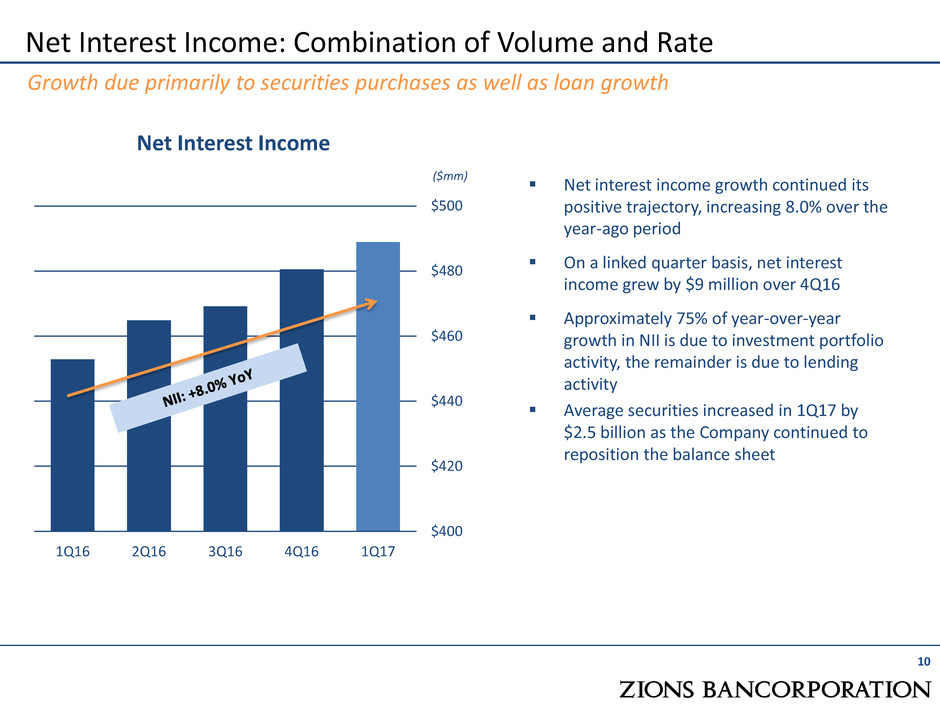
Net interest income growth continued its positive trajectory, increasing 8.0% over the year-ago period On a linked quarter basis, net interest income grew by $9 million over 4Q16 Approximately 75% of year-over-year growth in NII is due to investment portfolio activity, the remainder is due to lending activity Average securities increased in 1Q17 by $2.5 billion as the Company continued to reposition the balance sheet Net Interest Income: Combination of Volume and Rate Net Interest Income 10 Growth due primarily to securities purchases as well as loan growth ($mm) $400 $420 $440 $460 $480 $500 1Q16 2Q16 3Q16 4Q16 1Q17
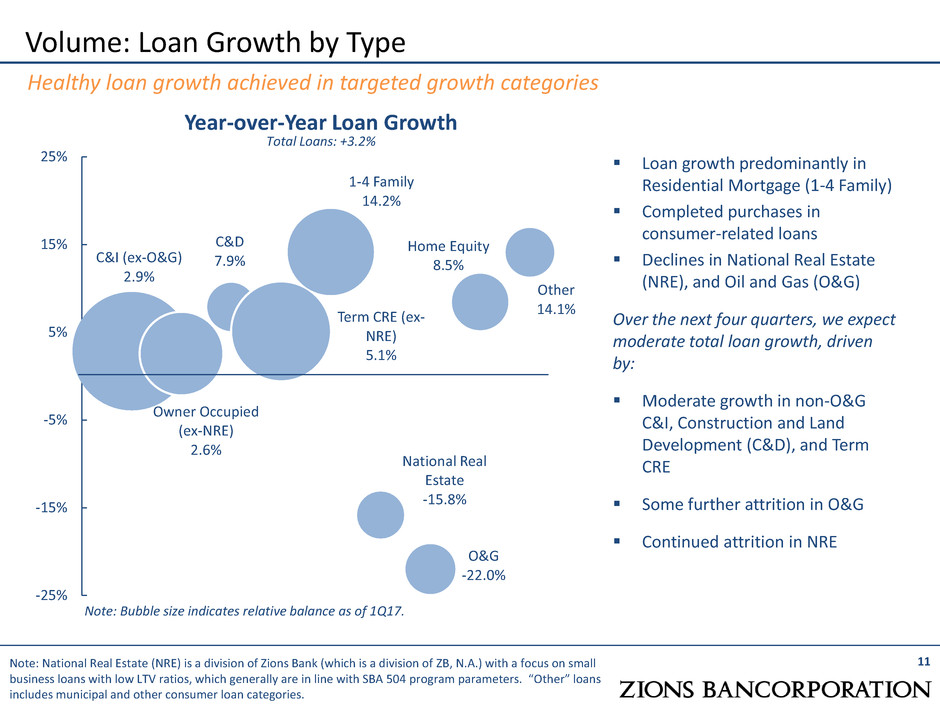
C&I (ex-O&G) 2.9% Owner Occupied (ex-NRE) 2.6% C&D 7.9% Term CRE (ex- NRE) 5.1% 1-4 Family 14.2% National Real Estate -15.8% O&G -22.0% Home Equity 8.5% Other 14.1% -25% -15% -5% 5% 15% 25% Volume: Loan Growth by Type 11 Healthy loan growth achieved in targeted growth categories Year-over-Year Loan Growth Total Loans: +3.2% Loan growth predominantly in Residential Mortgage (1-4 Family) Completed purchases in consumer-related loans Declines in National Real Estate (NRE), and Oil and Gas (O&G) Over the next four quarters, we expect moderate total loan growth, driven by: Moderate growth in non-O&G C&I, Construction and Land Development (C&D), and Term CRE Some further attrition in O&G Continued attrition in NRE Note: National Real Estate (NRE) is a division of Zions Bank (which is a division of ZB, N.A.) with a focus on small business loans with low LTV ratios, which generally are in line with SBA 504 program parameters. “Other” loans includes municipal and other consumer loan categories. Note: Bubble size indicates relative balance as of 1Q17.
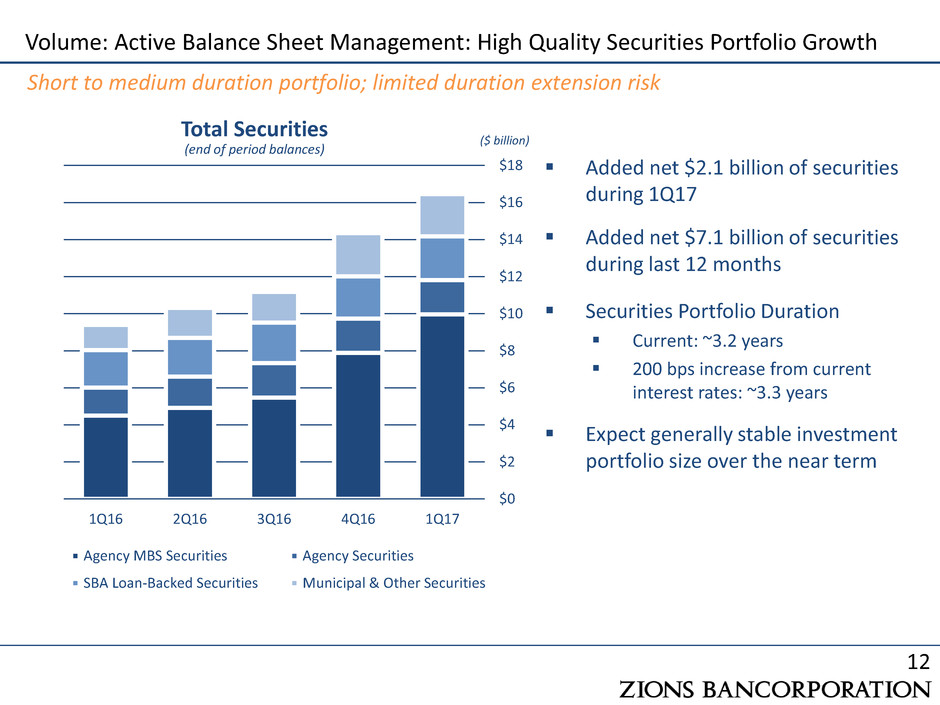
Volume: Active Balance Sheet Management: High Quality Securities Portfolio Growth 12 Short to medium duration portfolio; limited duration extension risk Total Securities (end of period balances) ($ billion) $0 $2 $4 $6 $8 $10 $12 $14 $16 $18 1Q16 2Q16 3Q16 4Q16 1Q17 Agency MBS Securities Agency Securities SBA Loan-Backed Securities Municipal & Other Securities Added net $2.1 billion of securities during 1Q17 Added net $7.1 billion of securities during last 12 months Securities Portfolio Duration Current: ~3.2 years 200 bps increase from current interest rates: ~3.3 years Expect generally stable investment portfolio size over the near term
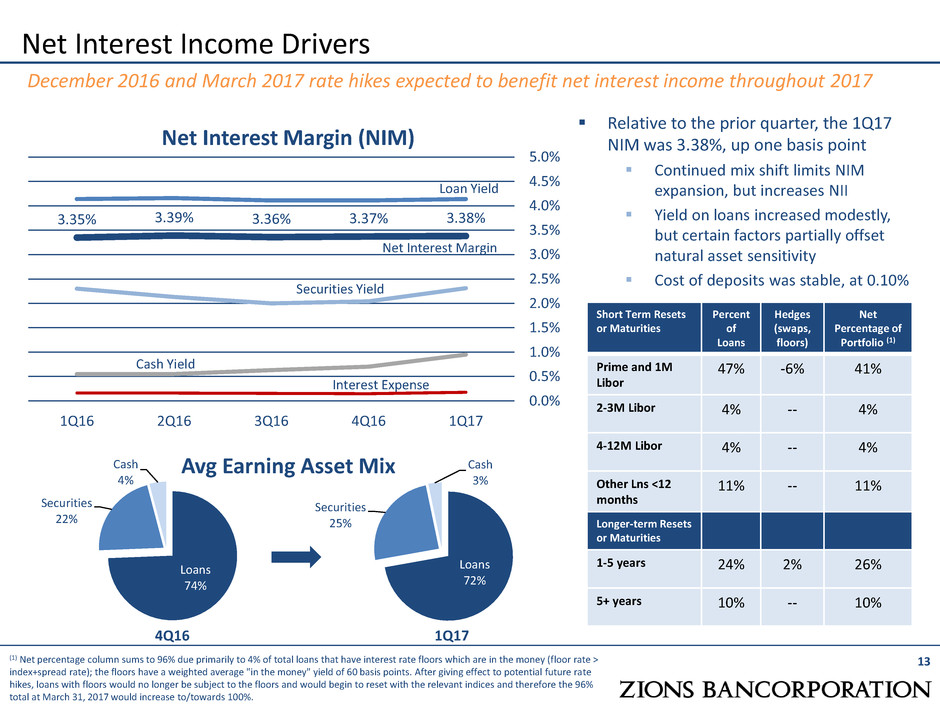
Loans 72% Securities 25% Cash 3% Net Interest Income Drivers 13 December 2016 and March 2017 rate hikes expected to benefit net interest income throughout 2017 Net Interest Margin (NIM) Avg Earning Asset Mix Relative to the prior quarter, the 1Q17 NIM was 3.38%, up one basis point Continued mix shift limits NIM expansion, but increases NII Yield on loans increased modestly, but certain factors partially offset natural asset sensitivity Cost of deposits was stable, at 0.10% 3.35% 3.39% 3.36% 3.37% 3.38% 0.0% 0.5% 1.0% 1.5% 2.0% 2.5% 3.0% 3.5% 4.0% 4.5% 5.0% 1Q16 2Q16 3Q16 4Q16 1Q17 Loan Yield Securities Yield Interest Expense Net Interest Margin Cash Yield 4Q16 Loans 74% Securities 22% Cash 4% 1Q17 Short Term Resets or Maturities Percent of Loans Hedges (swaps, floors) Net Percentage of Portfolio (1) Prime and 1M Libor 47% -6% 41% 2-3M Libor 4% -- 4% 4-12M Libor 4% -- 4% Other Lns <12 months 11% -- 11% Longer-term Resets or Maturities 1-5 years 24% 2% 26% 5+ years 10% -- 10% (1) Net percentage column sums to 96% due primarily to 4% of total loans that have interest rate floors which are in the money (floor rate > index+spread rate); the floors have a weighted average "in the money" yield of 60 basis points. After giving effect to potential future rate hikes, loans with floors would no longer be subject to the floors and would begin to reset with the relevant indices and therefore the 96% total at March 31, 2017 would increase to/towards 100%.
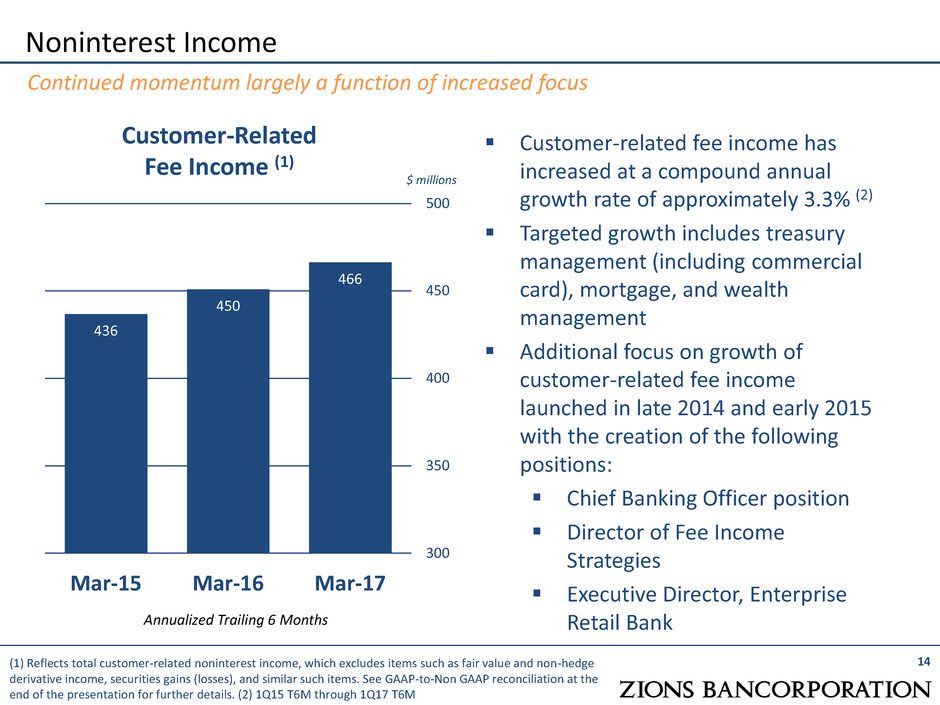
436 450 466 300 350 400 450 500 Mar-15 Mar-16 Mar-17 Customer-related fee income has increased at a compound annual growth rate of approximately 3.3% (2) Targeted growth includes treasury management (including commercial card), mortgage, and wealth management Additional focus on growth of customer-related fee income launched in late 2014 and early 2015 with the creation of the following positions: Chief Banking Officer position Director of Fee Income Strategies Executive Director, Enterprise Retail Bank Noninterest Income 14 Continued momentum largely a function of increased focus (1) Reflects total customer-related noninterest income, which excludes items such as fair value and non-hedge derivative income, securities gains (losses), and similar such items. See GAAP-to-Non GAAP reconciliation at the end of the presentation for further details. (2) 1Q15 T6M through 1Q17 T6M Customer-Related Fee Income (1) $ millions Annualized Trailing 6 Months
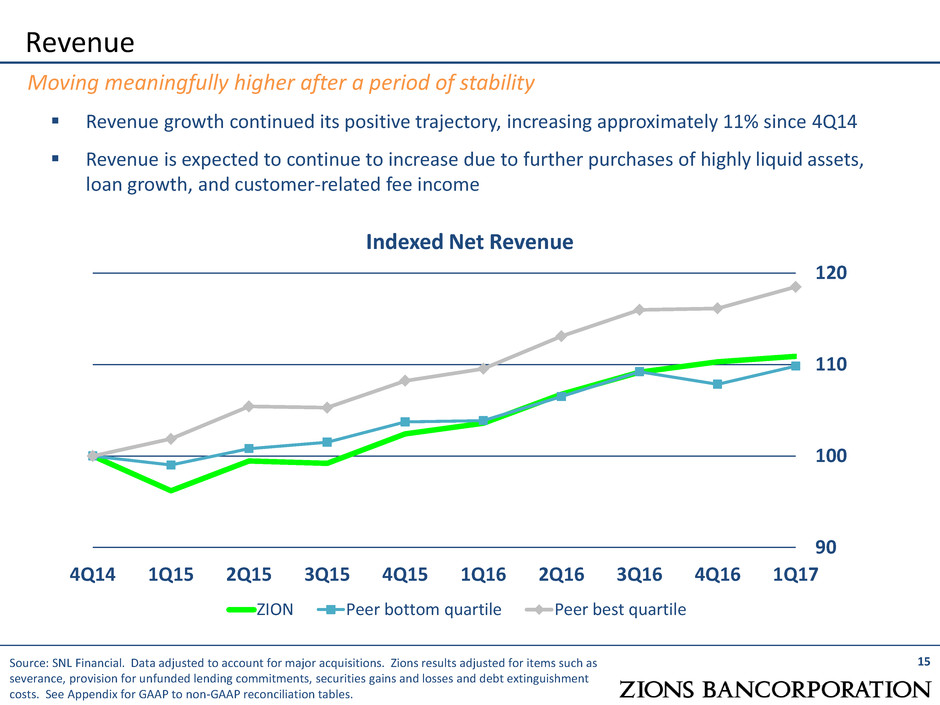
Revenue growth continued its positive trajectory, increasing approximately 11% since 4Q14 Revenue is expected to continue to increase due to further purchases of highly liquid assets, loan growth, and customer-related fee income Revenue 15 Moving meaningfully higher after a period of stability 90 100 110 120 4Q14 1Q15 2Q15 3Q15 4Q15 1Q16 2Q16 3Q16 4Q16 1Q17 ZION Peer bottom quartile Peer best quartile Indexed Net Revenue Source: SNL Financial. Data adjusted to account for major acquisitions. Zions results adjusted for items such as severance, provision for unfunded lending commitments, securities gains and losses and debt extinguishment costs. See Appendix for GAAP to non-GAAP reconciliation tables.
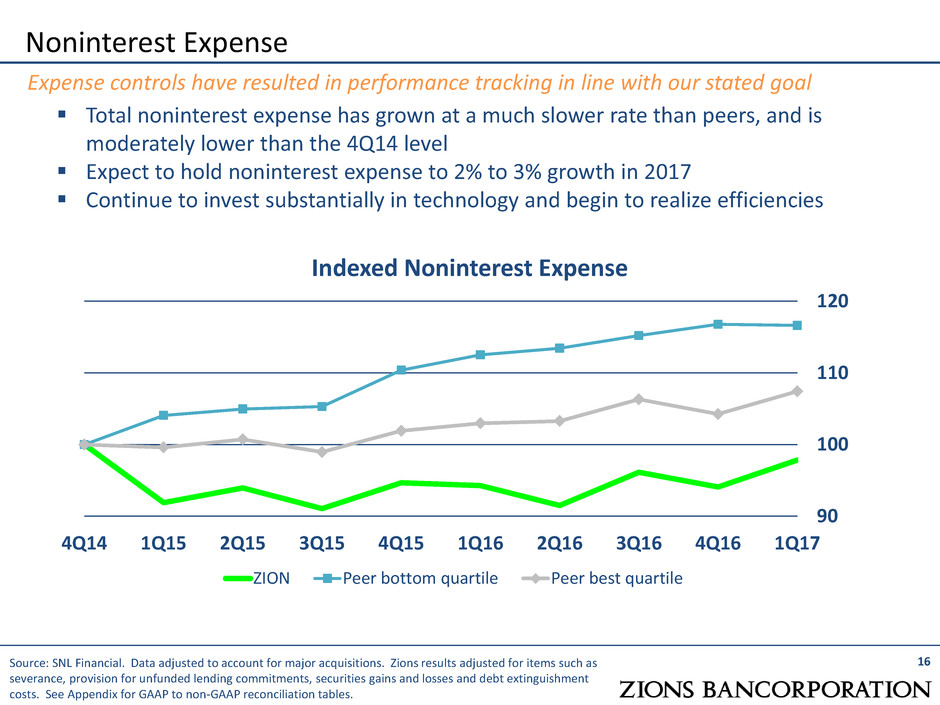
Total noninterest expense has grown at a much slower rate than peers, and is moderately lower than the 4Q14 level Expect to hold noninterest expense to 2% to 3% growth in 2017 Continue to invest substantially in technology and begin to realize efficiencies Indexed Noninterest Expense 90 100 110 120 4Q14 1Q15 2Q15 3Q15 4Q15 1Q16 2Q16 3Q16 4Q16 1Q17 ZION Peer bottom quartile Peer best quartile 16 Expense controls have resulted in performance tracking in line with our stated goal Source: SNL Financial. Data adjusted to account for major acquisitions. Zions results adjusted for items such as severance, provision for unfunded lending commitments, securities gains and losses and debt extinguishment costs. See Appendix for GAAP to non-GAAP reconciliation tables. Noninterest Expense
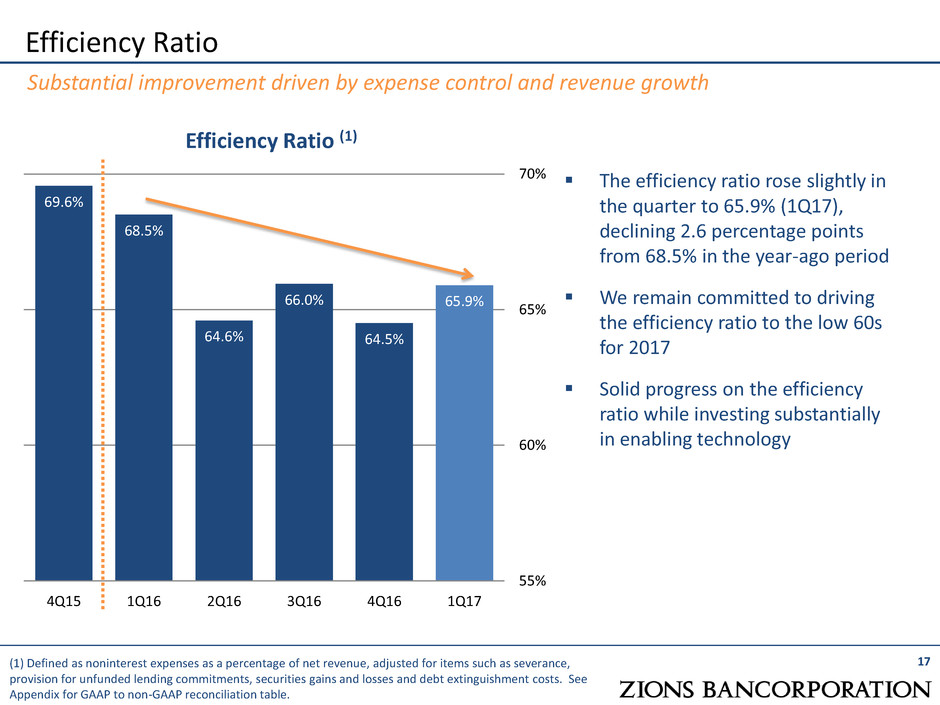
Efficiency Ratio Efficiency Ratio (1) 17 Substantial improvement driven by expense control and revenue growth (1) Defined as noninterest expenses as a percentage of net revenue, adjusted for items such as severance, provision for unfunded lending commitments, securities gains and losses and debt extinguishment costs. See Appendix for GAAP to non-GAAP reconciliation table. The efficiency ratio rose slightly in the quarter to 65.9% (1Q17), declining 2.6 percentage points from 68.5% in the year-ago period We remain committed to driving the efficiency ratio to the low 60s for 2017 Solid progress on the efficiency ratio while investing substantially in enabling technology 69.6% 68.5% 64.6% 66.0% 64.5% 65.9% 55% 60% 65% 70% 4Q15 1Q16 2Q16 3Q16 4Q16 1Q17
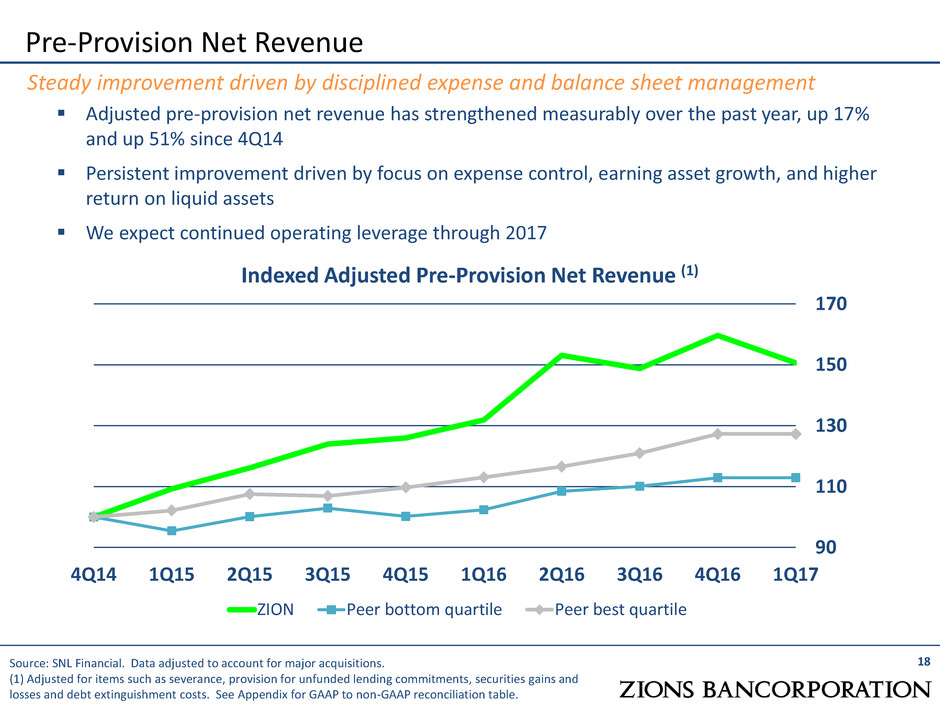
Pre-Provision Net Revenue 18 Steady improvement driven by disciplined expense and balance sheet management Source: SNL Financial. Data adjusted to account for major acquisitions. (1) Adjusted for items such as severance, provision for unfunded lending commitments, securities gains and losses and debt extinguishment costs. See Appendix for GAAP to non-GAAP reconciliation table. Indexed Adjusted Pre-Provision Net Revenue (1) 90 110 130 150 170 4Q14 1Q15 2Q15 3Q15 4Q15 1Q16 2Q16 3Q16 4Q16 1Q17 ZION Peer bottom quartile Peer best quartile Adjusted pre-provision net revenue has strengthened measurably over the past year, up 17% and up 51% since 4Q14 Persistent improvement driven by focus on expense control, earning asset growth, and higher return on liquid assets We expect continued operating leverage through 2017
Continue to Achieve Positive Operating Leverage Maintain annual mid-single digit loan growth rates while holding strong CRE concentration limits Moderately reduce the Company’s interest rate sensitivity by: Active investment portfolio management Continue to increase market share in residential mortgage Target mid-single digit growth rates in customer-related fee income Maintain expense controls: expect noninterest expense to increase between 2% and 3% in FY17 vs. FY16, while continuing to invest in substantial technology overhaul Maintain continued alignment of incentive compensation to profitability improvement objectives Implement Technology Upgrade Strategies Increase the Return on and of Capital Improvements in operating leverage lead to stronger returns on capital Improvements to risk profile and risk management expected to lead to increasing returns of capital Target: repurchase up to $180 million of common equity from 3Q16 to 2Q17 Completed $135 million through 1Q17 Shares repurchased equaled 4 million, or approximately 1.9% of shares outstanding in since June 30, 2016 Execute on our Community Bank Model – doing business on a “Local” basis 19 2017-2018 Objectives: Growth Through Simplification and Focus
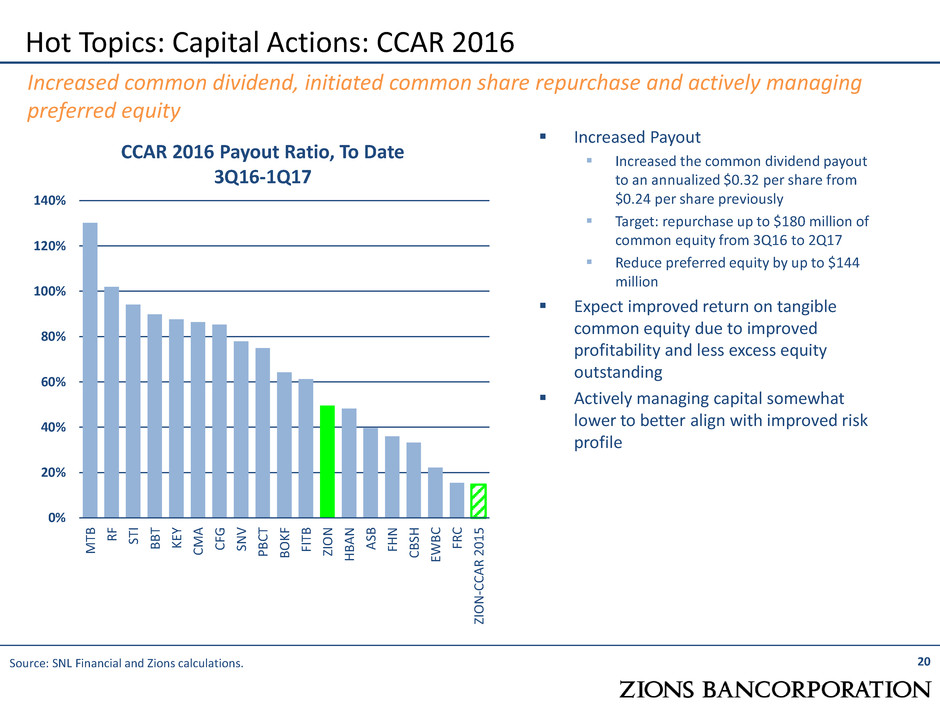
Increased Payout Increased the common dividend payout to an annualized $0.32 per share from $0.24 per share previously Target: repurchase up to $180 million of common equity from 3Q16 to 2Q17 Reduce preferred equity by up to $144 million Expect improved return on tangible common equity due to improved profitability and less excess equity outstanding Actively managing capital somewhat lower to better align with improved risk profile 20 Hot Topics: Capital Actions: CCAR 2016 Increased common dividend, initiated common share repurchase and actively managing preferred equity CCAR 2016 Payout Ratio, To Date 3Q16-1Q17 0% 20% 40% 60% 80% 100% 120% 140% M TB R F ST I B B T K EY C M A CF G SN V P BC T BO K F FI TB ZIO N H B A N A SB FH N CB SH EW B C FR C ZIO N -CC A R 2 01 5 Source: SNL Financial and Zions calculations.
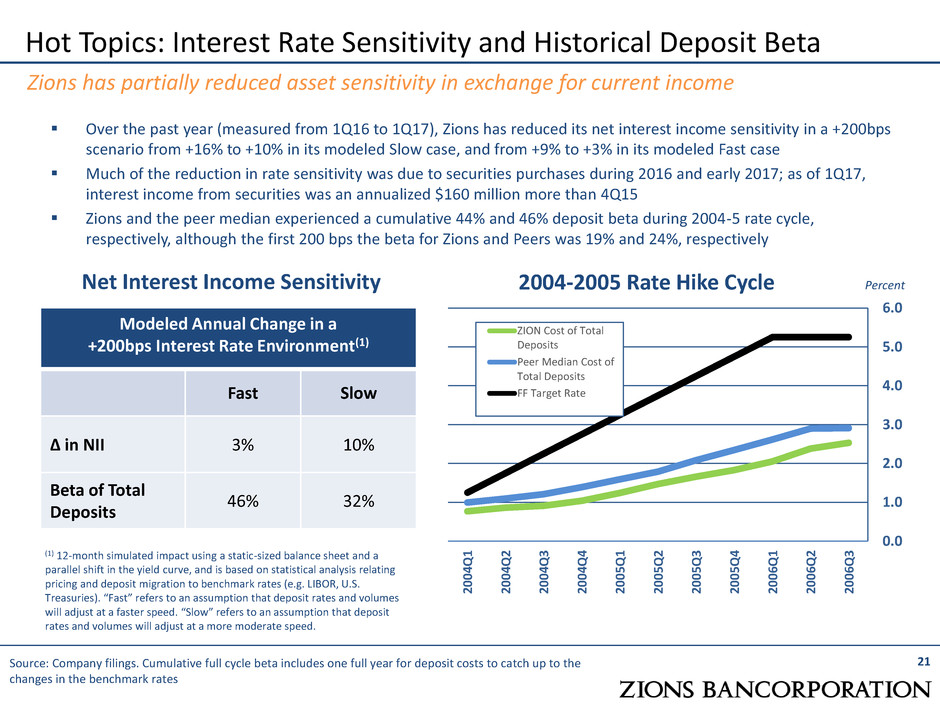
Over the past year (measured from 1Q16 to 1Q17), Zions has reduced its net interest income sensitivity in a +200bps scenario from +16% to +10% in its modeled Slow case, and from +9% to +3% in its modeled Fast case Much of the reduction in rate sensitivity was due to securities purchases during 2016 and early 2017; as of 1Q17, interest income from securities was an annualized $160 million more than 4Q15 Zions and the peer median experienced a cumulative 44% and 46% deposit beta during 2004-5 rate cycle, respectively, although the first 200 bps the beta for Zions and Peers was 19% and 24%, respectively Hot Topics: Interest Rate Sensitivity and Historical Deposit Beta 21 Zions has partially reduced asset sensitivity in exchange for current income Source: Company filings. Cumulative full cycle beta includes one full year for deposit costs to catch up to the changes in the benchmark rates Modeled Annual Change in a +200bps Interest Rate Environment(1) Fast Slow ∆ in NII 3% 10% Beta of Total Deposits 46% 32% (1) 12-month simulated impact using a static-sized balance sheet and a parallel shift in the yield curve, and is based on statistical analysis relating pricing and deposit migration to benchmark rates (e.g. LIBOR, U.S. Treasuries). “Fast” refers to an assumption that deposit rates and volumes will adjust at a faster speed. “Slow” refers to an assumption that deposit rates and volumes will adjust at a more moderate speed. Net Interest Income Sensitivity 0.0 1.0 2.0 3.0 4.0 5.0 6.0 20 04 Q 1 20 04 Q 2 20 04 Q 3 20 04 Q 4 20 05 Q 1 20 05 Q 2 20 05 Q 3 20 05 Q 4 20 06 Q 1 20 06 Q 2 20 06 Q 3 ZION Cost of Total Deposits Peer Median Cost of Total Deposits FF Target Rate 2004-2005 Rate Hike Cycle Percent
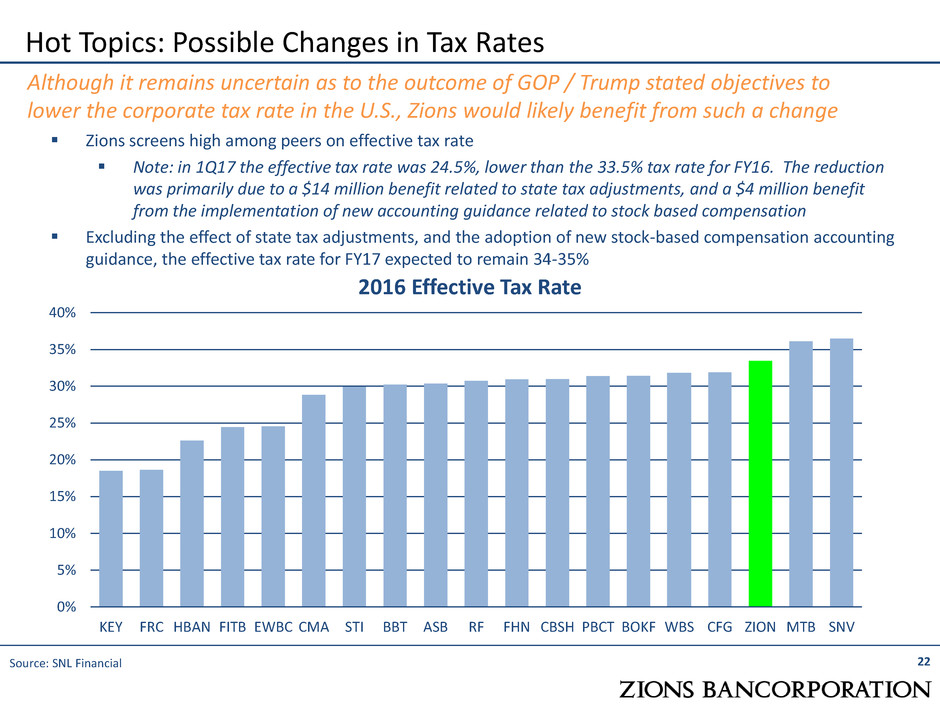
22 Hot Topics: Possible Changes in Tax Rates Although it remains uncertain as to the outcome of GOP / Trump stated objectives to lower the corporate tax rate in the U.S., Zions would likely benefit from such a change 0% 5% 10% 15% 20% 25% 30% 35% 40% KEY FRC HBAN FITB EWBC CMA STI BBT ASB RF FHN CBSH PBCT BOKF WBS CFG ZION MTB SNV 2016 Effective Tax Rate Zions screens high among peers on effective tax rate Note: in 1Q17 the effective tax rate was 24.5%, lower than the 33.5% tax rate for FY16. The reduction was primarily due to a $14 million benefit related to state tax adjustments, and a $4 million benefit from the implementation of new accounting guidance related to stock based compensation Excluding the effect of state tax adjustments, and the adoption of new stock-based compensation accounting guidance, the effective tax rate for FY17 expected to remain 34-35% Source: SNL Financial
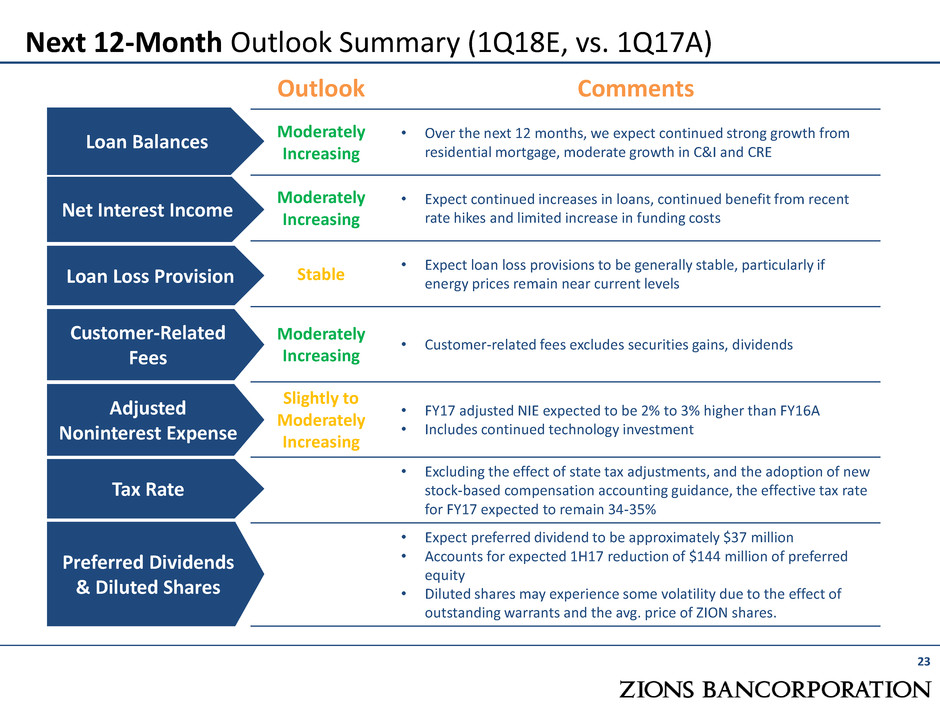
Next 12-Month Outlook Summary (1Q18E, vs. 1Q17A) 23 Outlook Comments Moderately Increasing • Over the next 12 months, we expect continued strong growth from residential mortgage, moderate growth in C&I and CRE Moderately Increasing • Expect continued increases in loans, continued benefit from recent rate hikes and limited increase in funding costs Stable • Expect loan loss provisions to be generally stable, particularly if energy prices remain near current levels Moderately Increasing • Customer-related fees excludes securities gains, dividends Slightly to Moderately Increasing • FY17 adjusted NIE expected to be 2% to 3% higher than FY16A • Includes continued technology investment • Excluding the effect of state tax adjustments, and the adoption of new stock-based compensation accounting guidance, the effective tax rate for FY17 expected to remain 34-35% • Expect preferred dividend to be approximately $37 million • Accounts for expected 1H17 reduction of $144 million of preferred equity • Diluted shares may experience some volatility due to the effect of outstanding warrants and the avg. price of ZION shares. Customer-Related Fees Loan Balances Net Interest Income Loan Loss Provision Tax Rate Preferred Dividends & Diluted Shares Adjusted Noninterest Expense

Summary Financial Results Table First Quarter 2017 Key Performance Indicators Zions Announced Financial Targets Impact of Warrants Oil & Gas (O&G) Portfolio Detail Deep Dive Retail Commercial Real Estate High O&G Employment Counties: Consumer Credit Scores Loan Growth by Bank Brand and Loan Type GAAP to Non-GAAP Reconciliation 24 Appendix
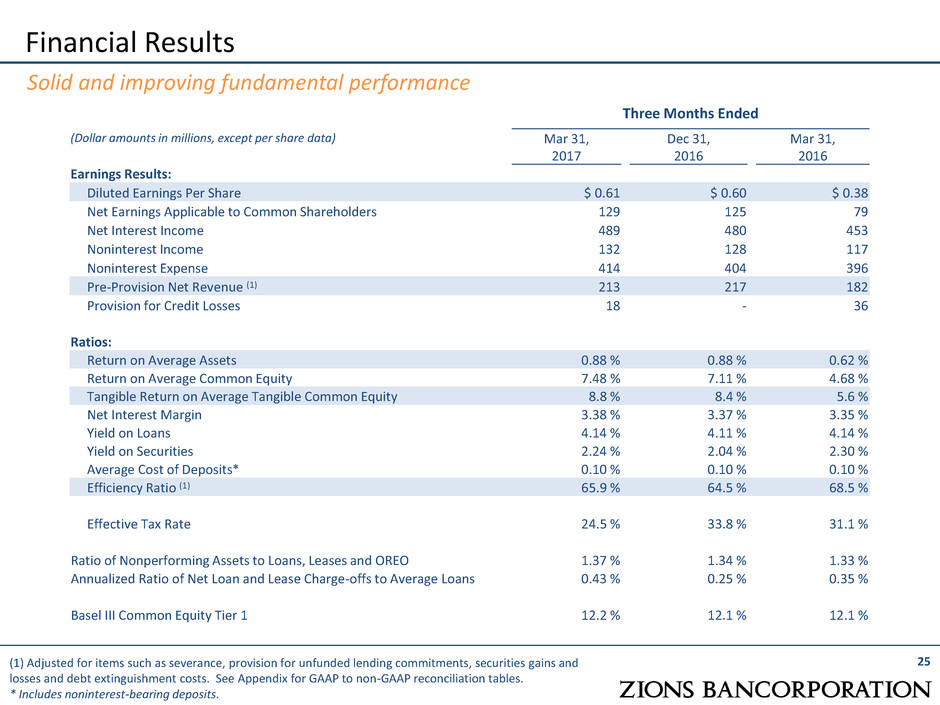
Financial Results 25 Solid and improving fundamental performance Three Months Ended (Dollar amounts in millions, except per share data) Mar 31, 2017 Dec 31, 2016 Mar 31, 2016 Earnings Results: Diluted Earnings Per Share $ 0.61 $ 0.60 $ 0.38 Net Earnings Applicable to Common Shareholders 129 125 79 Net Interest Income 489 480 453 Noninterest Income 132 128 117 Noninterest Expense 414 404 396 Pre-Provision Net Revenue (1) 213 217 182 Provision for Credit Losses 18 - 36 Ratios: Return on Average Assets 0.88 % 0.88 % 0.62 % Return on Average Common Equity 7.48 % 7.11 % 4.68 % Tangible Return on Average Tangible Common Equity 8.8 % 8.4 % 5.6 % Net Interest Margin 3.38 % 3.37 % 3.35 % Yield on Loans 4.14 % 4.11 % 4.14 % Yield on Securities 2.24 % 2.04 % 2.30 % Average Cost of Deposits* 0.10 % 0.10 % 0.10 % Efficiency Ratio (1) 65.9 % 64.5 % 68.5 % Effective Tax Rate 24.5 % 33.8 % 31.1 % Ratio of Nonperforming Assets to Loans, Leases and OREO 1.37 % 1.34 % 1.33 % Annualized Ratio of Net Loan and Lease Charge-offs to Average Loans 0.43 % 0.25 % 0.35 % Basel III Common Equity Tier 1 12.2 % 12.1 % 12.1 % (1) Adjusted for items such as severance, provision for unfunded lending commitments, securities gains and losses and debt extinguishment costs. See Appendix for GAAP to non-GAAP reconciliation tables. * Includes noninterest-bearing deposits.
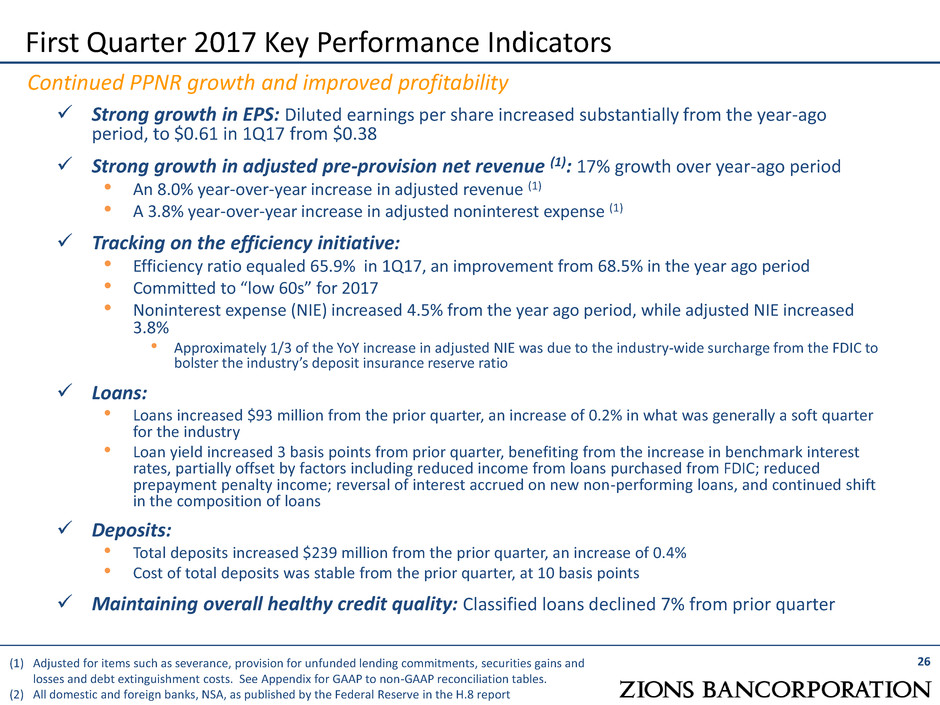
Strong growth in EPS: Diluted earnings per share increased substantially from the year-ago period, to $0.61 in 1Q17 from $0.38 Strong growth in adjusted pre-provision net revenue (1): 17% growth over year-ago period • An 8.0% year-over-year increase in adjusted revenue (1) • A 3.8% year-over-year increase in adjusted noninterest expense (1) Tracking on the efficiency initiative: • Efficiency ratio equaled 65.9% in 1Q17, an improvement from 68.5% in the year ago period • Committed to “low 60s” for 2017 • Noninterest expense (NIE) increased 4.5% from the year ago period, while adjusted NIE increased 3.8% • Approximately 1/3 of the YoY increase in adjusted NIE was due to the industry-wide surcharge from the FDIC to bolster the industry’s deposit insurance reserve ratio Loans: • Loans increased $93 million from the prior quarter, an increase of 0.2% in what was generally a soft quarter for the industry • Loan yield increased 3 basis points from prior quarter, benefiting from the increase in benchmark interest rates, partially offset by factors including reduced income from loans purchased from FDIC; reduced prepayment penalty income; reversal of interest accrued on new non-performing loans, and continued shift in the composition of loans Deposits: • Total deposits increased $239 million from the prior quarter, an increase of 0.4% • Cost of total deposits was stable from the prior quarter, at 10 basis points Maintaining overall healthy credit quality: Classified loans declined 7% from prior quarter 26 First Quarter 2017 Key Performance Indicators Continued PPNR growth and improved profitability (1) Adjusted for items such as severance, provision for unfunded lending commitments, securities gains and losses and debt extinguishment costs. See Appendix for GAAP to non-GAAP reconciliation tables. (2) All domestic and foreign banks, NSA, as published by the Federal Reserve in the H.8 report
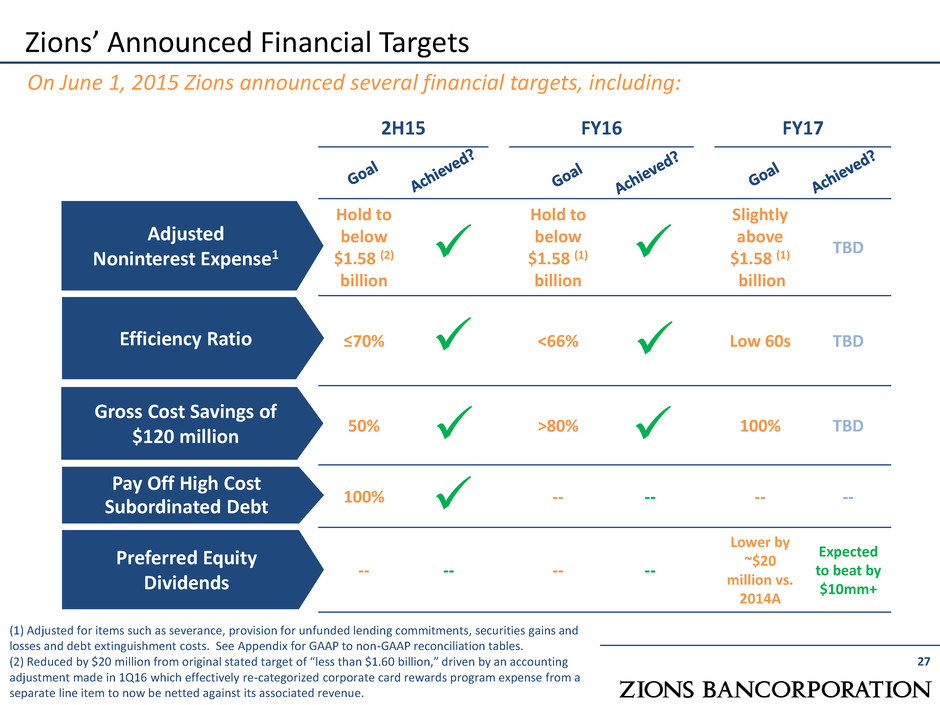
Zions’ Announced Financial Targets 27 On June 1, 2015 Zions announced several financial targets, including: 2H15 FY16 FY17 Hold to below $1.58 (2) billion Hold to below $1.58 (1) billion Slightly above $1.58 (1) billion TBD ≤70% <66% Low 60s TBD 50% >80% 100% TBD 100% -- -- -- -- -- -- -- -- Lower by ~$20 million vs. 2014A Expected to beat by $10mm+ Adjusted Noninterest Expense1 Gross Cost Savings of $120 million Pay Off High Cost Subordinated Debt Preferred Equity Dividends Efficiency Ratio (1) Adjusted for items such as severance, provision for unfunded lending commitments, securities gains and losses and debt extinguishment costs. See Appendix for GAAP to non-GAAP reconciliation tables. (2) Reduced by $20 million from original stated target of “less than $1.60 billion,” driven by an accounting adjustment made in 1Q16 which effectively re-categorized corporate card rewards program expense from a separate line item to now be netted against its associated revenue.
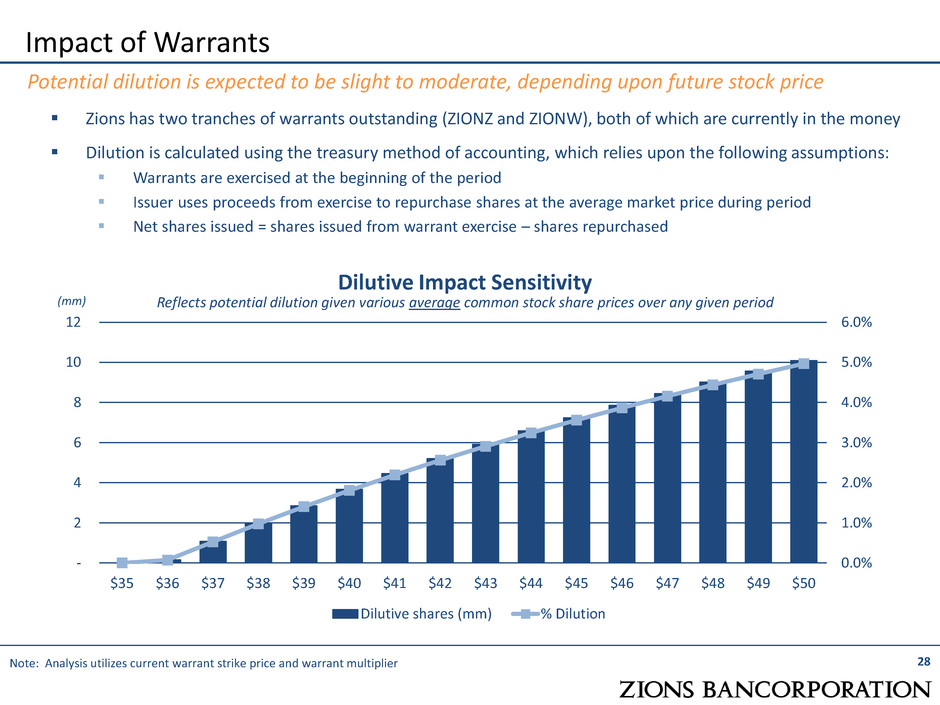
Zions has two tranches of warrants outstanding (ZIONZ and ZIONW), both of which are currently in the money Dilution is calculated using the treasury method of accounting, which relies upon the following assumptions: Warrants are exercised at the beginning of the period Issuer uses proceeds from exercise to repurchase shares at the average market price during period Net shares issued = shares issued from warrant exercise – shares repurchased Impact of Warrants Dilutive Impact Sensitivity Reflects potential dilution given various average common stock share prices over any given period 28 Potential dilution is expected to be slight to moderate, depending upon future stock price (mm) 0.0% 1.0% 2.0% 3.0% 4.0% 5.0% 6.0% - 2 4 6 8 10 12 $35 $36 $37 $38 $39 $40 $41 $42 $43 $44 $45 $46 $47 $48 $49 $50 Dilutive shares (mm) % Dilution Note: Analysis utilizes current warrant strike price and warrant multiplier
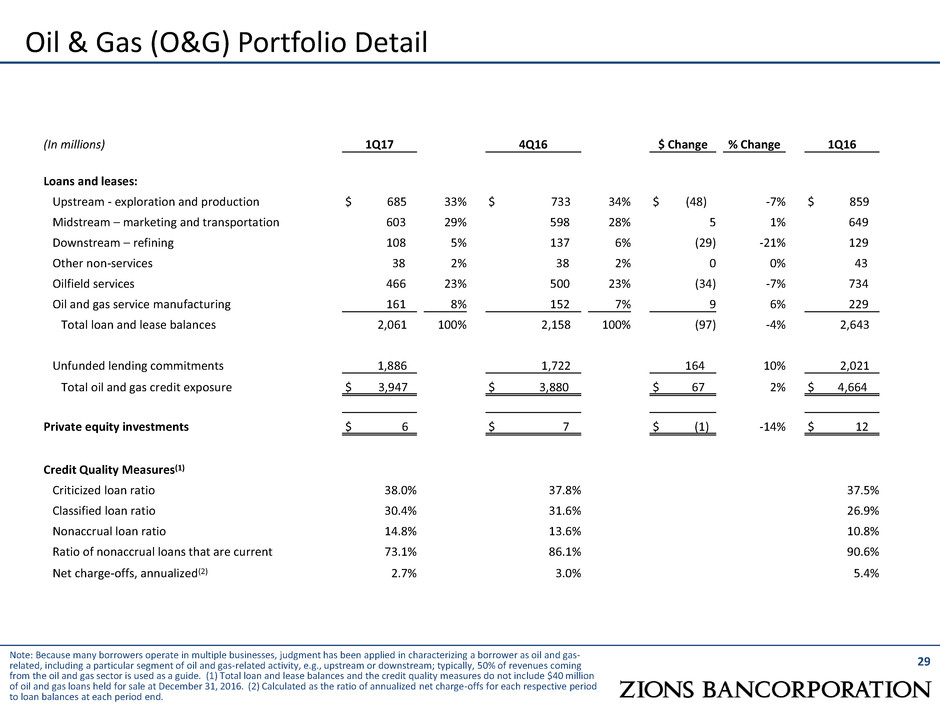
29 Note: Because many borrowers operate in multiple businesses, judgment has been applied in characterizing a borrower as oil and gas- related, including a particular segment of oil and gas-related activity, e.g., upstream or downstream; typically, 50% of revenues coming from the oil and gas sector is used as a guide. (1) Total loan and lease balances and the credit quality measures do not include $40 million of oil and gas loans held for sale at December 31, 2016. (2) Calculated as the ratio of annualized net charge-offs for each respective period to loan balances at each period end. Oil & Gas (O&G) Portfolio Detail (In millions) 1Q17 4Q16 $ Change % Change 1Q16 Loans and leases: Upstream - exploration and production $ 685 33% $ 733 34% $ (48) -7% $ 859 Midstream – marketing and transportation 603 29% 598 28% 5 1% 649 Downstream – refining 108 5% 137 6% (29) -21% 129 Other non-services 38 2% 38 2% 0 0% 43 Oilfield services 466 23% 500 23% (34) -7% 734 Oil and gas service manufacturing 161 8% 152 7% 9 6% 229 Total loan and lease balances 2,061 100% 2,158 100% (97) -4% 2,643 Unfunded lending commitments 1,886 1,722 164 10% 2,021 Total oil and gas credit exposure $ 3,947 $ 3,880 $ 67 2% $ 4,664 Private equity investments $ 6 $ 7 $ (1) -14% $ 12 Credit Quality Measures(1) Criticized loan ratio 38.0% 37.8% 37.5% Classified loan ratio 30.4% 31.6% 26.9% Nonaccrual loan ratio 14.8% 13.6% 10.8% Ratio of nonaccrual loans that are current 73.1% 86.1% 90.6% Net charge-offs, annualized(2) 2.7% 3.0% 5.4%
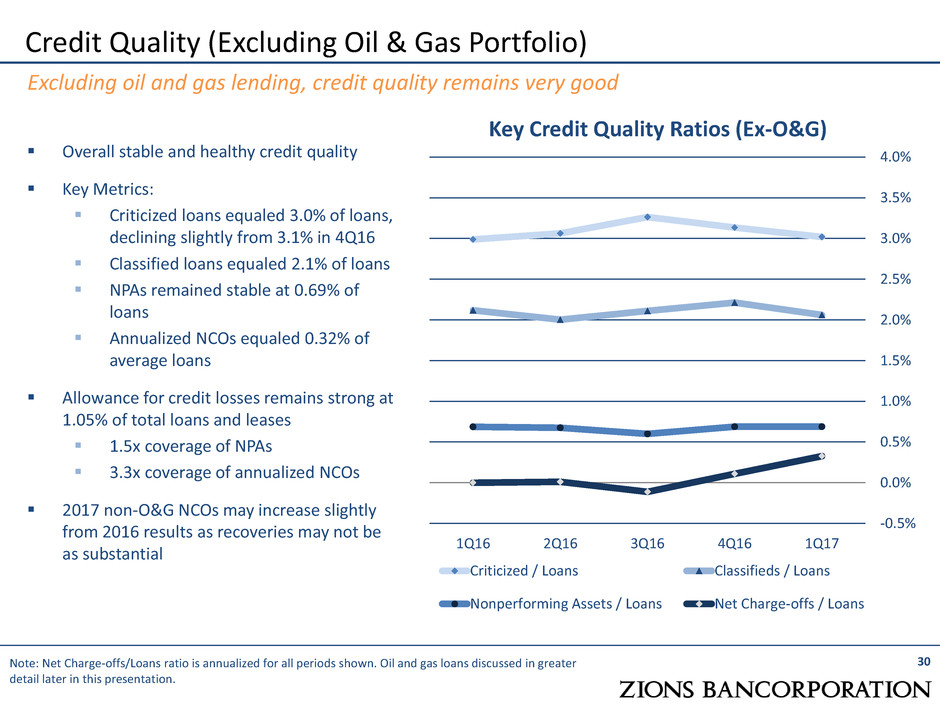
Credit Quality (Excluding Oil & Gas Portfolio) 30 Key Credit Quality Ratios (Ex-O&G) Excluding oil and gas lending, credit quality remains very good Overall stable and healthy credit quality Key Metrics: Criticized loans equaled 3.0% of loans, declining slightly from 3.1% in 4Q16 Classified loans equaled 2.1% of loans NPAs remained stable at 0.69% of loans Annualized NCOs equaled 0.32% of average loans Allowance for credit losses remains strong at 1.05% of total loans and leases 1.5x coverage of NPAs 3.3x coverage of annualized NCOs 2017 non-O&G NCOs may increase slightly from 2016 results as recoveries may not be as substantial -0.5% 0.0% 0.5% 1.0% 1.5% 2.0% 2.5% 3.0% 3.5% 4.0% 1Q16 2Q16 3Q16 4Q16 1Q17 Criticized / Loans Classifieds / Loans Nonperforming Assets / Loans Net Charge-offs / Loans Note: Net Charge-offs/Loans ratio is annualized for all periods shown. Oil and gas loans discussed in greater detail later in this presentation.
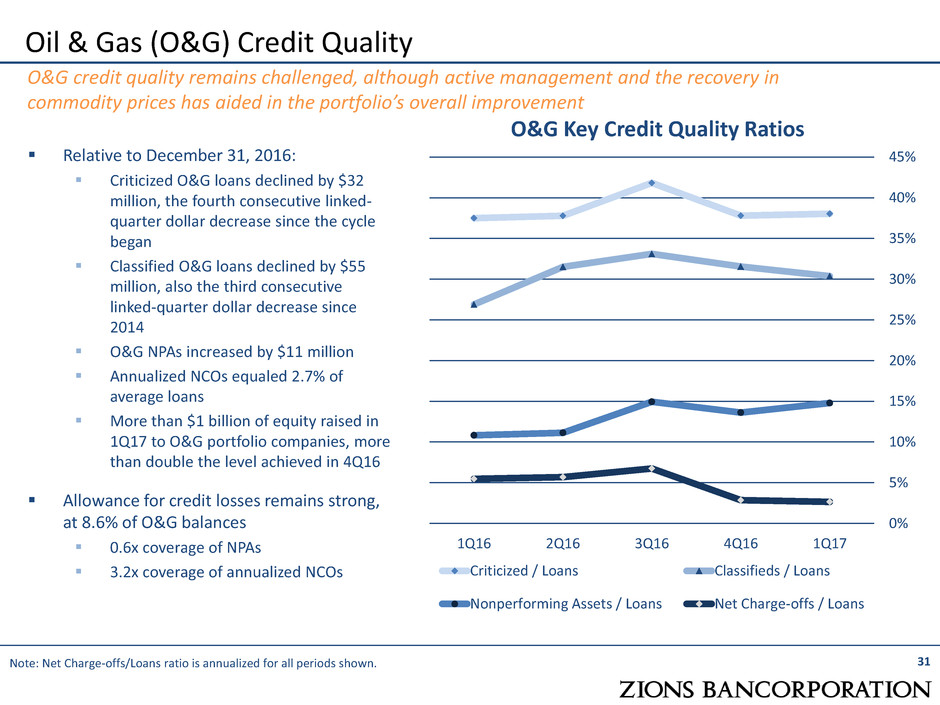
Oil & Gas (O&G) Credit Quality 31 O&G Key Credit Quality Ratios O&G credit quality remains challenged, although active management and the recovery in commodity prices has aided in the portfolio’s overall improvement Relative to December 31, 2016: Criticized O&G loans declined by $32 million, the fourth consecutive linked- quarter dollar decrease since the cycle began Classified O&G loans declined by $55 million, also the third consecutive linked-quarter dollar decrease since 2014 O&G NPAs increased by $11 million Annualized NCOs equaled 2.7% of average loans More than $1 billion of equity raised in 1Q17 to O&G portfolio companies, more than double the level achieved in 4Q16 Allowance for credit losses remains strong, at 8.6% of O&G balances 0.6x coverage of NPAs 3.2x coverage of annualized NCOs 0% 5% 10% 15% 20% 25% 30% 35% 40% 45% 1Q16 2Q16 3Q16 4Q16 1Q17 Criticized / Loans Classifieds / Loans Nonperforming Assets / Loans Net Charge-offs / Loans Note: Net Charge-offs/Loans ratio is annualized for all periods shown.
O&G Loan Loss Expectation O&G loan losses are expected to decline substantially over the next 12 months as compared to the last 12 months (1) Most of the expected loss is likely to come from services loans 57% of classified O&G loans are from services loans 75% of O&G losses incurred since Sep 30, 2014 are from services loans Healthy sponsor support has resulted in loss levels that were lower than otherwise would have been experienced Improved borrower and sponsor sentiment in late 2016 and early 2017 vs early 2016 Strong Reserve Against O&G Loans Zions’ O&G allowance for credit losses is: 9% of O&G loan balances 23% of criticized O&G loan balances 32 Oil & Gas Loss Outlook and Reserve The outlook is improving for the O&G portfolio (1) Assuming oil and gas commodity prices remain relatively stable; LTM NCOs were $108 million.
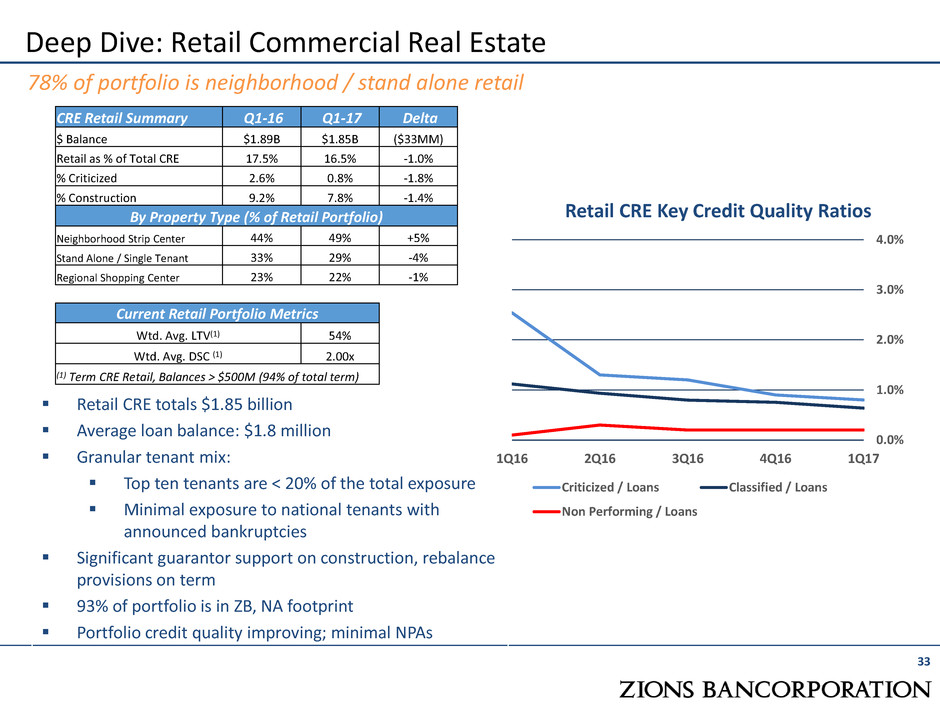
Deep Dive: Retail Commercial Real Estate 33 78% of portfolio is neighborhood / stand alone retail Retail CRE totals $1.85 billion Average loan balance: $1.8 million Granular tenant mix: Top ten tenants are < 20% of the total exposure Minimal exposure to national tenants with announced bankruptcies Significant guarantor support on construction, rebalance provisions on term 93% of portfolio is in ZB, NA footprint Portfolio credit quality improving; minimal NPAs CRE Retail Summary Q1-16 Q1-17 Delta $ Balance $1.89B $1.85B ($33MM) Retail as % of Total CRE 17.5% 16.5% -1.0% % Criticized 2.6% 0.8% -1.8% % Construction 9.2% 7.8% -1.4% By Property Type (% of Retail Portfolio) Neighborhood Strip Center 44% 49% +5% Stand Alone / Single Tenant 33% 29% -4% Regional Shopping Center 23% 22% -1% Current Retail Portfolio Metrics Wtd. Avg. LTV(1) 54% Wtd. Avg. DSC (1) 2.00x (1) Term CRE Retail, Balances > $500M (94% of total term) 0.0% 1.0% 2.0% 3.0% 4.0% 1Q16 2Q16 3Q16 4Q16 1Q17 Retail CRE Key Credit Quality Ratios Criticized / Loans Classified / Loans Non Performing / Loans
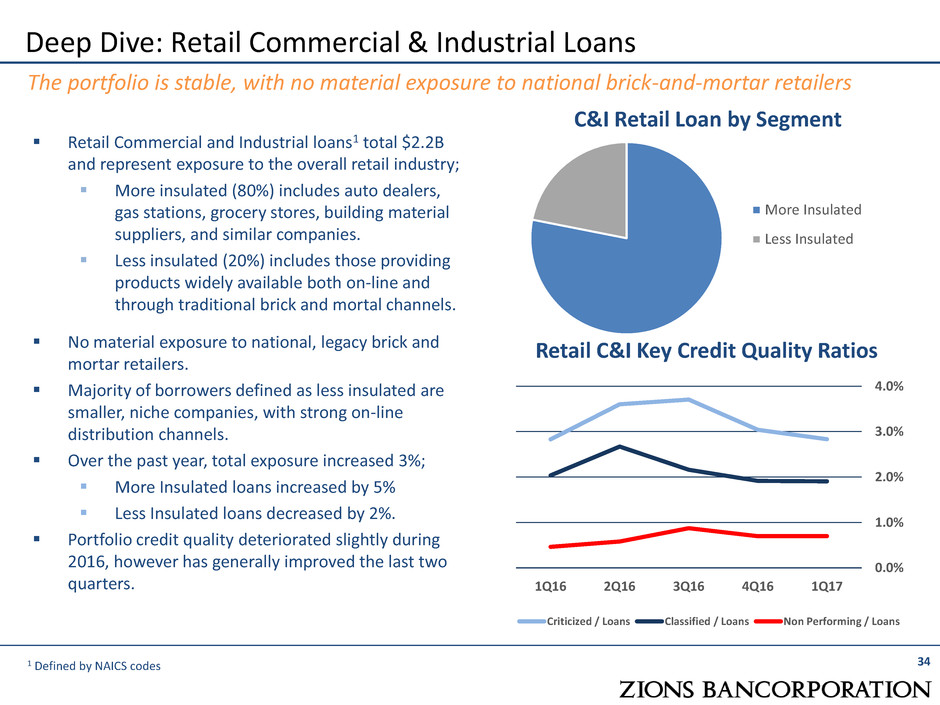
Deep Dive: Retail Commercial & Industrial Loans 34 The portfolio is stable, with no material exposure to national brick-and-mortar retailers Retail Commercial and Industrial loans1 total $2.2B and represent exposure to the overall retail industry; More insulated (80%) includes auto dealers, gas stations, grocery stores, building material suppliers, and similar companies. Less insulated (20%) includes those providing products widely available both on-line and through traditional brick and mortal channels. No material exposure to national, legacy brick and mortar retailers. Majority of borrowers defined as less insulated are smaller, niche companies, with strong on-line distribution channels. Over the past year, total exposure increased 3%; More Insulated loans increased by 5% Less Insulated loans decreased by 2%. Portfolio credit quality deteriorated slightly during 2016, however has generally improved the last two quarters. C&I Retail Loan by Segment 0.0% 1.0% 2.0% 3.0% 4.0% 1Q16 2Q16 3Q16 4Q16 1Q17 Criticized / Loans Classified / Loans Non Performing / Loans Retail C&I Key Credit Quality Ratios More Insulated Less Insulated 1 Defined by NAICS codes
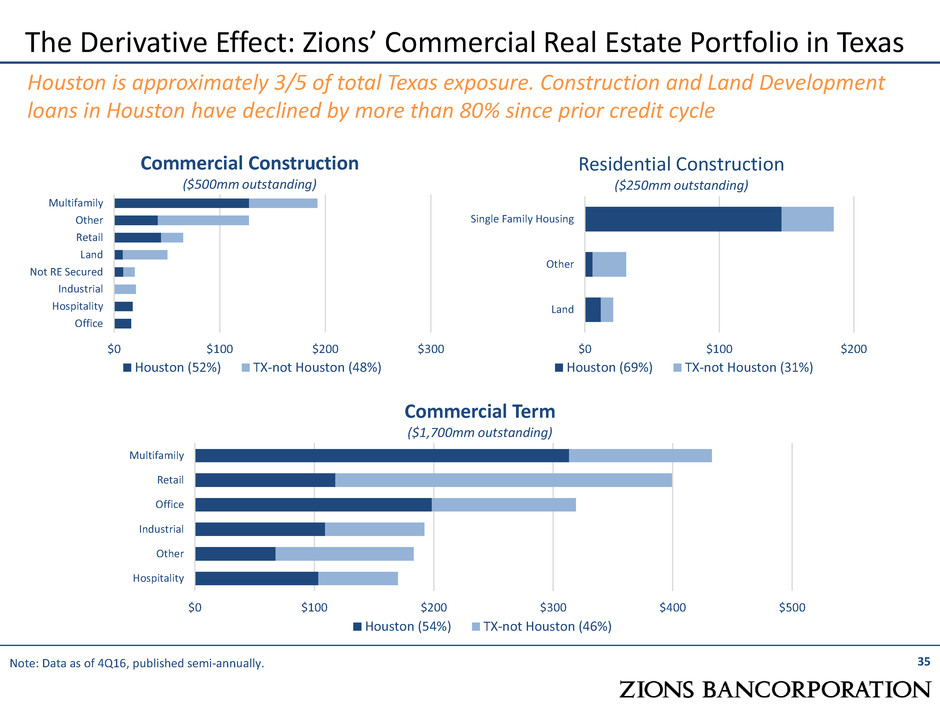
35 Note: Data as of 4Q16, published semi-annually. The Derivative Effect: Zions’ Commercial Real Estate Portfolio in Texas Houston is approximately 3/5 of total Texas exposure. Construction and Land Development loans in Houston have declined by more than 80% since prior credit cycle $0 $100 $200 $300 Office Hospitality Industrial Not RE Secured Land Retail Other Multifamily Commercial Construction ($500mm outstanding) Houston (52%) TX-not Houston (48%) $0 $100 $200 Land Other Single Family Housing Residential Construction ($250mm outstanding) Houston (69%) TX-not Houston (31%) $0 $100 $200 $300 $400 $500 Hospitality Other Industrial Office Retail Multifamily Commercial Term ($1,700mm outstanding) Houston (54%) TX-not Houston (46%)
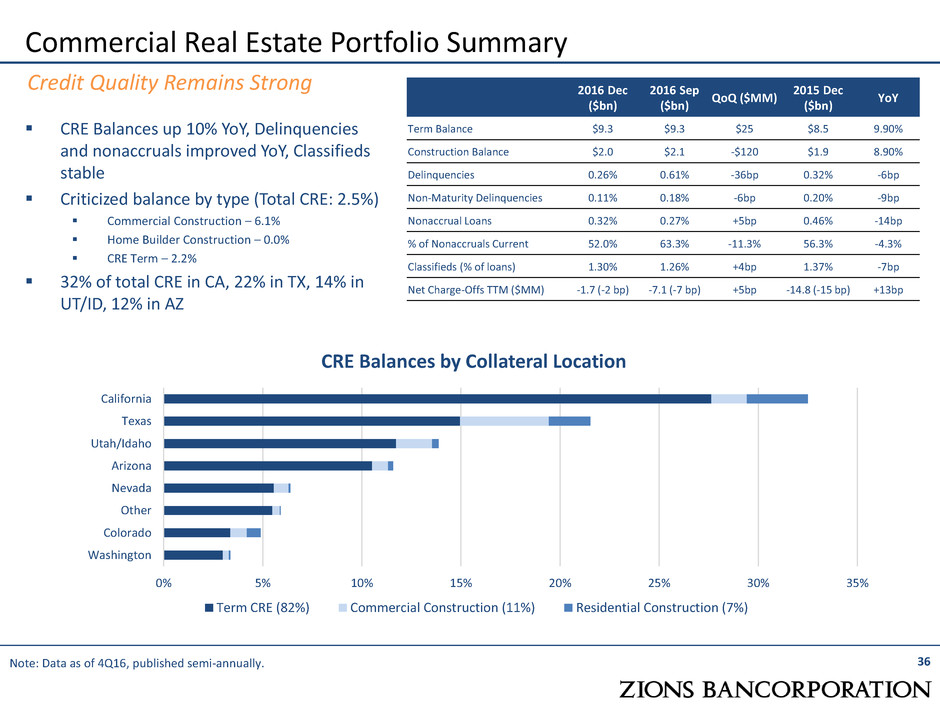
Commercial Real Estate Portfolio Summary 36 Credit Quality Remains Strong Note: Data as of 4Q16, published semi-annually. CRE Balances up 10% YoY, Delinquencies and nonaccruals improved YoY, Classifieds stable Criticized balance by type (Total CRE: 2.5%) Commercial Construction – 6.1% Home Builder Construction – 0.0% CRE Term – 2.2% 32% of total CRE in CA, 22% in TX, 14% in UT/ID, 12% in AZ 2016 Dec ($bn) 2016 Sep ($bn) QoQ ($MM) 2015 Dec ($bn) YoY Term Balance $9.3 $9.3 $25 $8.5 9.90% Construction Balance $2.0 $2.1 -$120 $1.9 8.90% Delinquencies 0.26% 0.61% -36bp 0.32% -6bp Non-Maturity Delinquencies 0.11% 0.18% -6bp 0.20% -9bp Nonaccrual Loans 0.32% 0.27% +5bp 0.46% -14bp % of Nonaccruals Current 52.0% 63.3% -11.3% 56.3% -4.3% Classifieds (% of loans) 1.30% 1.26% +4bp 1.37% -7bp Net Charge-Offs TTM ($MM) -1.7 (-2 bp) -7.1 (-7 bp) +5bp -14.8 (-15 bp) +13bp 0% 5% 10% 15% 20% 25% 30% 35% Washington Colorado Other Nevada Arizona Utah/Idaho Texas California CRE Balances by Collateral Location Term CRE (82%) Commercial Construction (11%) Residential Construction (7%)
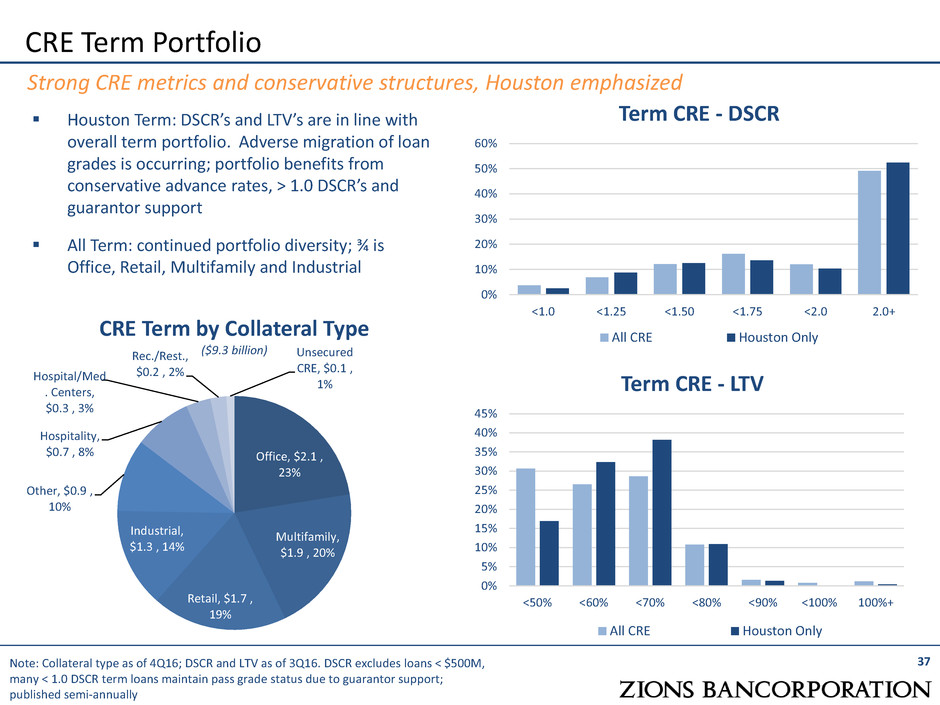
CRE Term Portfolio 37 Strong CRE metrics and conservative structures, Houston emphasized Houston Term: DSCR’s and LTV’s are in line with overall term portfolio. Adverse migration of loan grades is occurring; portfolio benefits from conservative advance rates, > 1.0 DSCR’s and guarantor support All Term: continued portfolio diversity; ¾ is Office, Retail, Multifamily and Industrial Note: Collateral type as of 4Q16; DSCR and LTV as of 3Q16. DSCR excludes loans < $500M, many < 1.0 DSCR term loans maintain pass grade status due to guarantor support; published semi-annually CRE Term by Collateral Type ($9.3 billion) 0% 10% 20% 30% 40% 50% 60% <1.0 <1.25 <1.50 <1.75 <2.0 2.0+ Term CRE - DSCR All CRE Houston Only 0% 5% 10% 15% 20% 25% 30% 35% 40% 45% <50% <60% <70% <80% <90% <100% 100%+ Term CRE - LTV All CRE Houston Only Office, $2.1 , 23% Multifamily, $1.9 , 20% Retail, $1.7 , 19% Industrial, $1.3 , 14% Other, $0.9 , 10% Hospitality, $0.7 , 8% Hospital/Med . Centers, $0.3 , 3% Rec./Rest., $0.2 , 2% Unsecured CRE, $0.1 , 1%
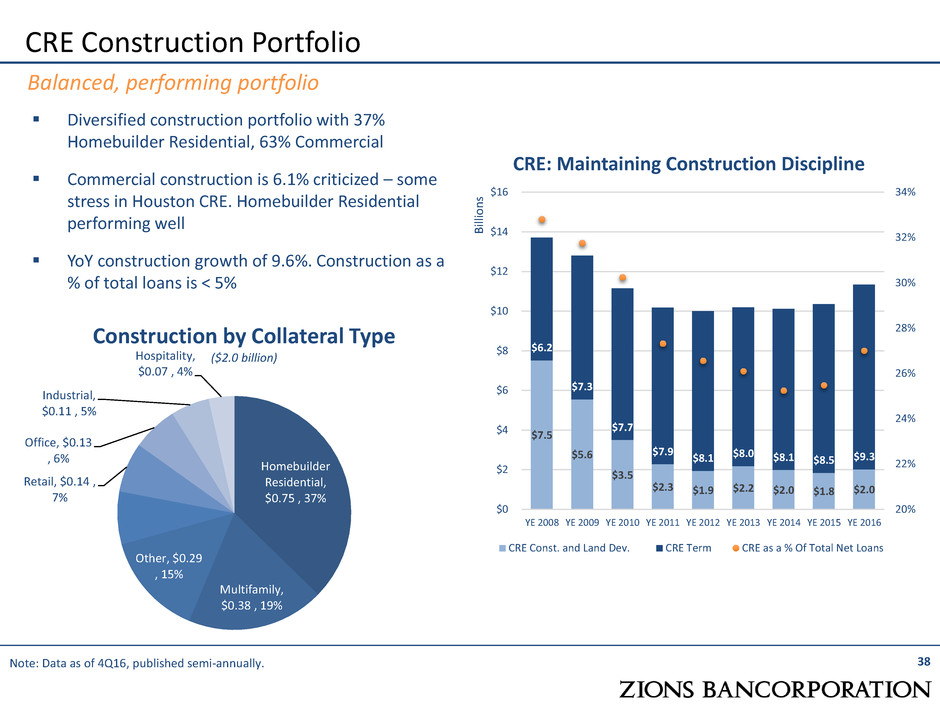
CRE Construction Portfolio 38 Balanced, performing portfolio Note: Data as of 4Q16, published semi-annually. Diversified construction portfolio with 37% Homebuilder Residential, 63% Commercial Commercial construction is 6.1% criticized – some stress in Houston CRE. Homebuilder Residential performing well YoY construction growth of 9.6%. Construction as a % of total loans is < 5% Construction by Collateral Type ($2.0 billion) $7.5 $5.6 $3.5 $2.3 $1.9 $2.2 $2.0 $1.8 $2.0 $6.2 $7.3 $7.7 $7.9 $8.1 $8.0 $8.1 $8.5 $9.3 20% 22% 24% 26% 28% 30% 32% 34% $0 $2 $4 $6 $8 $10 $12 $14 $16 YE 2008 YE 2009 YE 2010 YE 2011 YE 2012 YE 2013 YE 2014 YE 2015 YE 2016 Bi llio n s CRE: Maintaining Construction Discipline CRE Const. and Land Dev. CRE Term CRE as a % Of Total Net Loans Homebuilder Residential, $0.75 , 37% Multifamily, $0.38 , 19% Other, $0.29 , 15% Land, $0.15 , 7% Retail, $0.14 , 7% Office, $0.13 , 6% Industrial, $0.11 , 5% Hospitality, $0.07 , 4%
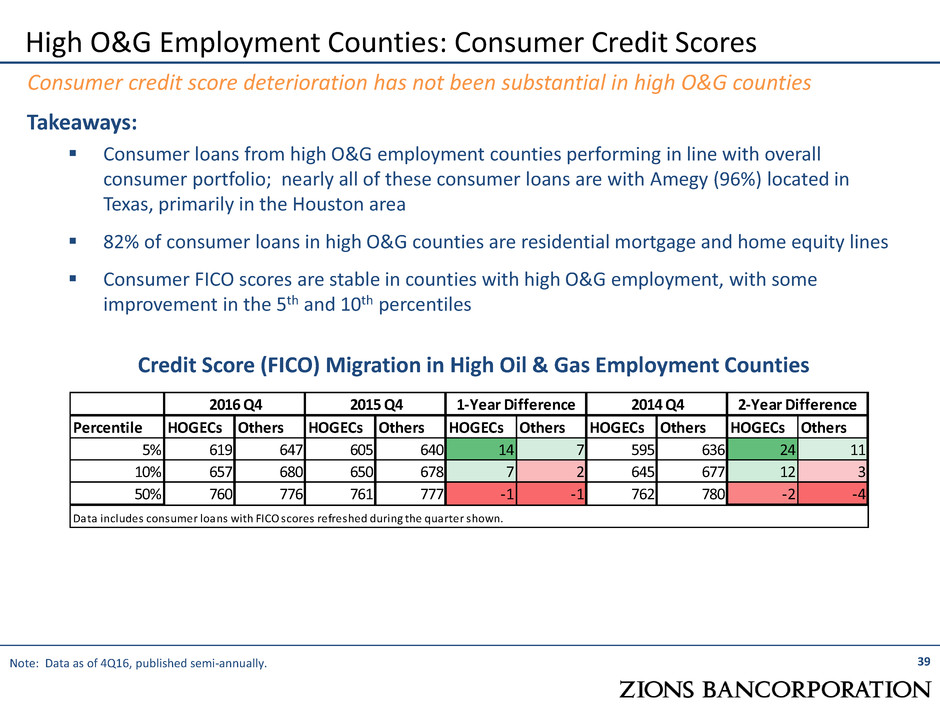
Takeaways: Consumer loans from high O&G employment counties performing in line with overall consumer portfolio; nearly all of these consumer loans are with Amegy (96%) located in Texas, primarily in the Houston area 82% of consumer loans in high O&G counties are residential mortgage and home equity lines Consumer FICO scores are stable in counties with high O&G employment, with some improvement in the 5th and 10th percentiles 39 High O&G Employment Counties: Consumer Credit Scores Consumer credit score deterioration has not been substantial in high O&G counties Credit Score (FICO) Migration in High Oil & Gas Employment Counties Note: Data as of 4Q16, published semi-annually. Percentile HOGECs Others HOGECs Others HOGECs Others HOGECs Others HOGECs Others 5% 619 647 605 640 14 7 595 636 24 11 10 657 680 650 678 7 2 645 677 12 3 50% 760 776 761 777 -1 -1 762 780 -2 -4 Data includes consumer loans with FICO scores refreshed during the quarter shown. 2016 Q4 2015 Q4 1-Year Difference 2014 Q4 2-Year Difference
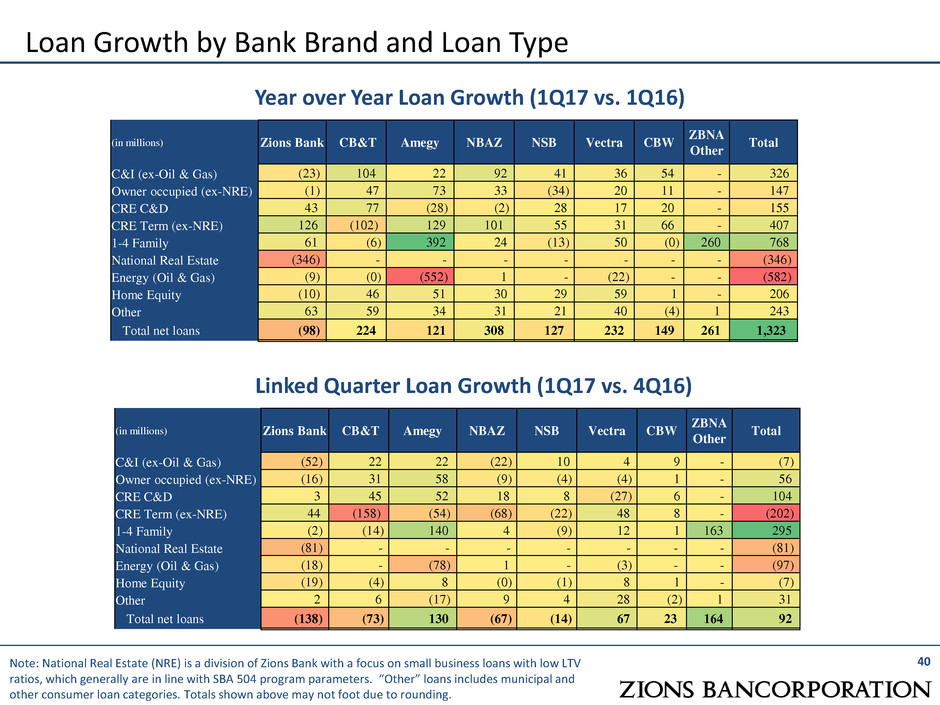
40 Loan Growth by Bank Brand and Loan Type Note: National Real Estate (NRE) is a division of Zions Bank with a focus on small business loans with low LTV ratios, which generally are in line with SBA 504 program parameters. “Other” loans includes municipal and other consumer loan categories. Totals shown above may not foot due to rounding. Year over Year Loan Growth (1Q17 vs. 1Q16) (in millions) Zions Bank CB&T Amegy NBAZ NSB Vectra CBW ZBNA Other Total C&I (ex-Oil & Gas) (23) 104 22 92 41 36 54 - 326 Owner occupied (ex-NRE) (1) 47 73 33 (34) 20 11 - 147 CRE C&D 43 77 (28) (2) 28 17 20 - 155 CRE Term (ex-NRE) 126 (102) 129 101 55 31 66 - 407 1-4 Family 61 (6) 392 24 (13) 50 (0) 260 768 National Real Estate (346) - - - - - - - (346) Energy (Oil & Gas) (9) (0) (552) 1 - (22) - - (582) Home Equity (10) 46 51 30 29 59 1 - 206 Other 63 59 34 31 21 40 (4) 1 243 Total net loans (98) 224 121 308 127 232 149 261 1,323 (in millions) Zions Bank CB&T Amegy NBAZ NSB Vectra CBW ZBNA Other Total C&I (ex-Oil & Gas) (52) 22 22 (22) 10 4 9 - (7) Owner occupied (ex-NRE) (16) 31 58 (9) (4) (4) 1 - 56 CRE C&D 3 45 52 18 8 (27) 6 - 104 CRE Term (ex-NRE) 44 (158) (54) (68) (22) 48 8 - (202) 1-4 Family (2) (14) 140 4 (9) 12 1 163 295 National Real Estate (81) - - - - - - - (81) Energy (Oil & Gas) (18) - (78) 1 - (3) - - (97) Home Equity (19) (4) 8 (0) (1) 8 1 - (7) Other 2 6 (17) 9 4 28 (2) 1 31 Total net loans (138) (73) 130 (67) (14) 67 23 164 92 Linked Quarter Loan Growth (1Q17 vs. 4Q16)
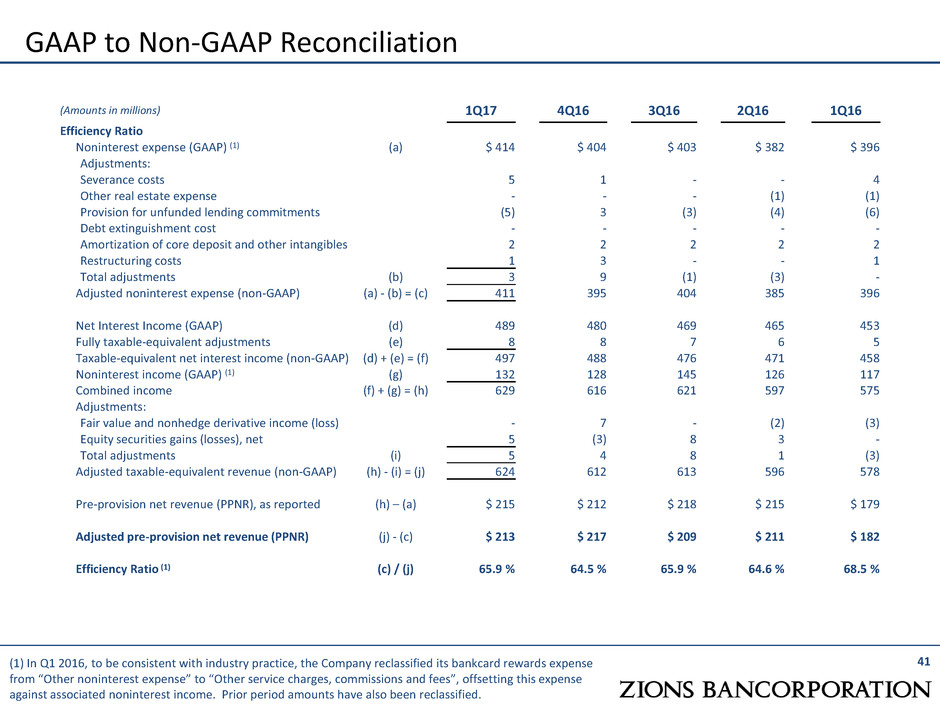
41 (1) In Q1 2016, to be consistent with industry practice, the Company reclassified its bankcard rewards expense from “Other noninterest expense” to “Other service charges, commissions and fees”, offsetting this expense against associated noninterest income. Prior period amounts have also been reclassified. GAAP to Non-GAAP Reconciliation (Amounts in millions) 1Q17 4Q16 3Q16 2Q16 1Q16 Efficiency Ratio Noninterest expense (GAAP) (1) (a) $ 414 $ 404 $ 403 $ 382 $ 396 Adjustments: Severance costs 5 1 - - 4 Other real estate expense - - - (1) (1) Provision for unfunded lending commitments (5) 3 (3) (4) (6) Debt extinguishment cost - - - - - Amortization of core deposit and other intangibles 2 2 2 2 2 Restructuring costs 1 3 - - 1 Total adjustments (b) 3 9 (1) (3) - Adjusted noninterest expense (non-GAAP) (a) - (b) = (c) 411 395 404 385 396 Net Interest Income (GAAP) (d) 489 480 469 465 453 Fully taxable-equivalent adjustments (e) 8 8 7 6 5 Taxable-equivalent net interest income (non-GAAP) (d) + (e) = (f) 497 488 476 471 458 Noninterest income (GAAP) (1) (g) 132 128 145 126 117 Combined income (f) + (g) = (h) 629 616 621 597 575 Adjustments: Fair value and nonhedge derivative income (loss) - 7 - (2) (3) Equity securities gains (losses), net 5 (3) 8 3 - Total adjustments (i) 5 4 8 1 (3) Adjusted taxable-equivalent revenue (non-GAAP) (h) - (i) = (j) 624 612 613 596 578 Pre-provision net revenue (PPNR), as reported (h) – (a) $ 215 $ 212 $ 218 $ 215 $ 179 Adjusted pre-provision net revenue (PPNR) (j) - (c) $ 213 $ 217 $ 209 $ 211 $ 182 Efficiency Ratio (1) (c) / (j) 65.9 % 64.5 % 65.9 % 64.6 % 68.5 %


