Zions Bancorporation, National Association (ZION)
Filed: 25 Jul 17, 12:00am
Zions Bancorporation One South Main Salt Lake City, UT 84133 July 25, 2017 www.zionsbancorporation.com |  |
| Zions Bancorporation Reports: 2Q17 Net Earnings¹ of $154 million, diluted EPS of $0.73 |
| compared with 1Q17 Net Earnings¹ of $129 million, diluted EPS of $0.61, and 2Q16 Net Earnings¹ of $91 million, diluted EPS of $0.44 |
| $0.73 | $154 million | 3.52% | 12.3% | |||
| Earnings per diluted common share | Net Earnings 1 | Net interest margin (“NIM”) | Common Equity Tier 1 | |||
| SECOND QUARTER HIGHLIGHTS | ||
| Net Interest Income and Net Interest Margin | • | Net interest income was $528 million, up 14% from 2Q16 |
• | NIM was 3.52% compared with 3.39% in 2Q16 | |
Operating Performance2 | • | Pre-provision net revenue ("PPNR") was $264 million, up 23% from 2Q16 |
• | Adjusted PPNR² was $268 million, up 27% from 2Q16 | |
• | Noninterest expense was $405 million, compared with $382 million in 2Q16 | |
• | Adjusted noninterest expense² was $399 million, compared with $385 million in 2Q16 | |
• | Efficiency ratio² was 59.8%, compared with 64.6% for 2Q16 | |
| Loans and Credit Quality | • | Net loans and leases were $43.7 billion, compared with $42.5 billion at June 30, 2016 |
• | Provision for credit losses was $10 million, compared with $31 million in 2Q16 | |
• | Net charge-offs were $7 million, compared with $39 million in 2Q16 | |
| Capital Returns | • | Tangible return on average tangible common equity² was 10.2%, compared with 6.3% in 2Q16 |
• | Common stock repurchases of $45 million during the quarter | |
• | Diluted common shares were 208.2 million, compared with 204.5 million in 2Q16 | |
| Notable Items | • | Interest income recoveries of $16 million from four loans in 2Q17 |
• | The tax rate in 2Q17 was 32.3% and is expected to be 34% to 35% for the rest of 2017 | |
• | Preferred stock redemption of $144 million resulted in a $2 million reduction to net earnings applicable to common shareholders | |
| CEO COMMENTARY |
| Harris H. Simmons, Chairman and CEO, commented, "We are encouraged with the solid results of the second quarter. Loan growth exceeded expectations and was diversified across commercial and consumer categories and also by geography. We experienced continued strong revenue growth, and expenses – both interest expense from deposits and operating expense – were well-controlled, resulting in a solid increase in pre-provision net revenue. Credit costs improved substantially over prior periods, and we expect such costs to remain low for the foreseeable future." Mr. Simmons concluded, "We are particularly enthusiastic about our ability to return substantial capital to shareholders over the next several quarters, which should contribute to further improvement in return on equity." |
OPERATING PERFORMANCE2 |
| ¹ Net Earnings is net earnings applicable to common shareholders. ² For information on non-GAAP financial measures and why the Company presents these numbers, see pages 16-19. Included in these non-GAAP financial measures are the key metrics to which Zions announced it would hold itself accountable in its June 1, 2015 efficiency initiative, and to which executive compensation is tied. |
| Net Interest Income | |||||||||||||||||||||||||
| 2Q17 - 1Q17 | 2Q17 - 2Q16 | ||||||||||||||||||||||||
| (In millions) | 2Q17 | 1Q17 | 2Q16 | $ | % | $ | % | ||||||||||||||||||
| Interest and fees on loans | $ | 469 | $ | 433 | $ | 434 | $ | 36 | 8.3 | % | $ | 35 | 8.1 | % | |||||||||||
| Interest on money market investments | 5 | 4 | 5 | 1 | 25.0 | — | — | ||||||||||||||||||
| Interest on securities | 84 | 78 | 48 | 6 | 7.7 | 36 | 75.0 | ||||||||||||||||||
| Total interest income | 558 | 515 | 487 | 43 | 8.3 | 71 | 14.6 | ||||||||||||||||||
| Interest on deposits | 14 | 13 | 12 | 1 | 7.7 | 2 | 16.7 | ||||||||||||||||||
| Interest on short and long-term borrowings | 16 | 13 | 10 | 3 | 23.1 | 6 | 60.0 | ||||||||||||||||||
| Total interest expense | 30 | 26 | 22 | 4 | 15.4 | 8 | 36.4 | ||||||||||||||||||
| Net interest income | $ | 528 | $ | 489 | $ | 465 | $ | 39 | 8.0 | $ | 63 | 13.5 | |||||||||||||
| Noninterest Income | |||||||||||||||||||||||||
| 2Q17 - 1Q17 | 2Q17 - 2Q16 | ||||||||||||||||||||||||
| (In millions) | 2Q17 | 1Q17 | 2Q16 | $ | % | $ | % | ||||||||||||||||||
| Service charges and fees on deposit accounts | $ | 43 | $ | 42 | $ | 42 | $ | 1 | 2.4 | % | $ | 1 | 2.4 | % | |||||||||||
| Other service charges, commissions and fees | 56 | 49 | 52 | 7 | 14.3 | 4 | 7.7 | ||||||||||||||||||
| Wealth management income | 10 | 10 | 9 | — | — | 1 | 11.1 | ||||||||||||||||||
| Loan sales and servicing income | 6 | 7 | 10 | (1 | ) | (14.3 | ) | (4 | ) | (40.0 | ) | ||||||||||||||
| Capital markets and foreign exchange | 6 | 7 | 5 | (1 | ) | (14.3 | ) | 1 | 20.0 | ||||||||||||||||
| Customer-related fees | 121 | 115 | 118 | 6 | 5.2 | 3 | 2.5 | ||||||||||||||||||
| Dividends and other investment income | 10 | 12 | 6 | (2 | ) | (16.7 | ) | 4 | 66.7 | ||||||||||||||||
| Securities gains, net | 2 | 5 | 3 | (3 | ) | (60.0 | ) | (1 | ) | (33.3 | ) | ||||||||||||||
| Other | (1 | ) | — | (1 | ) | (1 | ) | NM | — | — | |||||||||||||||
| Total noninterest income | $ | 132 | $ | 132 | $ | 126 | $ | — | — | $ | 6 | 4.8 | |||||||||||||
| Noninterest Expense | |||||||||||||||||||||||||
| 2Q17 - 1Q17 | 2Q17 - 2Q16 | ||||||||||||||||||||||||
| (In millions) | 2Q17 | 1Q17 | 2Q16 | $ | % | $ | % | ||||||||||||||||||
| Salaries and employee benefits | $ | 242 | $ | 262 | $ | 241 | $ | (20 | ) | (7.6 | )% | $ | 1 | 0.4 | % | ||||||||||
| Occupancy, net | 32 | 33 | 30 | (1 | ) | (3.0 | ) | 2 | 6.7 | ||||||||||||||||
| Furniture, equipment and software, net | 32 | 32 | 31 | — | — | 1 | 3.2 | ||||||||||||||||||
| Other real estate expense, net | — | — | (1 | ) | — | NM | 1 | 100.0 | |||||||||||||||||
| Credit-related expense | 8 | 8 | 6 | — | — | 2 | 33.3 | ||||||||||||||||||
| Provision for unfunded lending commitments | 3 | (5 | ) | (4 | ) | 8 | 160.0 | 7 | 175.0 | ||||||||||||||||
| Professional and legal services | 13 | 14 | 12 | (1 | ) | (7.1 | ) | 1 | 8.3 | ||||||||||||||||
| Advertising | 6 | 5 | 5 | 1 | 20.0 | 1 | 20.0 | ||||||||||||||||||
| FDIC premiums | 13 | 12 | 10 | 1 | 8.3 | 3 | 30.0 | ||||||||||||||||||
| Amortization of core deposit and other intangibles | 2 | 2 | 2 | — | — | — | — | ||||||||||||||||||
| Other | 54 | 51 | 50 | 3 | 5.9 | 4 | 8.0 | ||||||||||||||||||
| Total noninterest expense | $ | 405 | $ | 414 | $ | 382 | $ | (9 | ) | (2.2 | ) | $ | 23 | 6.0 | |||||||||||
Adjusted noninterest expense 1 | $ | 399 | $ | 411 | $ | 385 | $ | (12 | ) | (2.9 | )% | $ | 14 | 3.6 | % | ||||||||||
1 | For information on non-GAAP financial measures see pages 16-19. |
| • | The decline in salaries and employee benefits during the second quarter relative to the prior quarter was primarily due to factors that are seasonally high in the first quarter, such as payroll tax expense, stock-based compensation, retirement plan contribution matching and $5 million of severance in the first quarter of 2017 that did not recur in the second quarter. |
| • | Healthcare costs increased $2 million from the prior quarter and are expected to remain higher throughout the year, consistent with the current quarter level. |
| • | Other noninterest expense increased $3 million from the prior quarter, primarily attributable to the sharing of revenue with the FDIC from previously discussed interest income recoveries on loans purchased from the FDIC, per the company’s 2009 agreement. |
| Asset Quality | |||||||||||||||||||||||||
| 2Q17 - 1Q17 | 2Q17 - 2Q16 | ||||||||||||||||||||||||
| (In millions) | 2Q17 | 1Q17 | 2Q16 | bps | bps | ||||||||||||||||||||
| Ratio of nonperforming assets to loans and leases and other real estate owned | 1.12 | % | 1.37 | % | 1.30 | % | (25 | ) | (18 | ) | |||||||||||||||
| Annualized ratio of net loan and lease charge-offs to average loans | 0.06 | 0.43 | 0.37 | (37 | ) | (31 | ) | ||||||||||||||||||
| Ratio of total allowance for credit losses to loans and leases outstanding | 1.39 | 1.41 | 1.58 | (2 | ) | (19 | ) | ||||||||||||||||||
| $ | % | $ | % | ||||||||||||||||||||||
| Classified loans | $ | 1,317 | $ | 1,464 | $ | 1,610 | $ | (147 | ) | (10.0 | )% | $ | (293 | ) | (18.2 | )% | |||||||||
| Nonperforming assets | $ | 490 | $ | 588 | $ | 555 | $ | (98 | ) | (16.7 | )% | $ | (65 | ) | (11.7 | )% | |||||||||
| Provision for credit losses | $ | 10 | $ | 18 | $ | 31 | $ | (8 | ) | (44.4 | )% | $ | (21 | ) | (67.7 | )% | |||||||||
| Loans and Leases | |||||||||||||||||||||||||
| 2Q17 - 1Q17 | 2Q17 - 2Q16 | ||||||||||||||||||||||||
| (In millions) | 2Q17 | 1Q17 | 2Q16 | $ | % | $ | % | ||||||||||||||||||
| Loans held for sale | $ | 53 | $ | 128 | $ | 147 | $ | (75 | ) | (58.6 | )% | $ | (94 | ) | (63.9 | ) | |||||||||
| Loans and leases: | |||||||||||||||||||||||||
| Commercial | 22,203 | 21,556 | 21,928 | 647 | 3.0 | 275 | 1.3 | ||||||||||||||||||
| Commercial real estate | 11,198 | 11,206 | 11,318 | (8 | ) | (0.1 | ) | (120 | ) | (1.1 | ) | ||||||||||||||
| Consumer | 10,282 | 9,980 | 9,255 | 302 | 3.0 | 1,027 | 11.1 | ||||||||||||||||||
| Loans and leases, net of unearned income and fees | 43,683 | 42,742 | 42,501 | 941 | 2.2 | 1,182 | 2.8 | ||||||||||||||||||
| Less allowance for loan losses | 544 | 544 | 608 | — | — | (64 | ) | (10.5 | ) | ||||||||||||||||
| Loans held for investment, net of allowance | $ | 43,139 | $ | 42,198 | $ | 41,893 | $ | 941 | 2.2 | $ | 1,246 | 3.0 | |||||||||||||
| Deposits | |||||||||||||||||||||||||
| 2Q17 - 1Q17 | 2Q17 - 2Q16 | ||||||||||||||||||||||||
| (In millions) | 2Q17 | 1Q17 | 2Q16 | $ | % | $ | % | ||||||||||||||||||
| Noninterest-bearing demand | $ | 24,172 | $ | 24,410 | $ | 22,277 | $ | (238 | ) | (1.0 | )% | $ | 1,895 | 8.5 | % | ||||||||||
| Interest-bearing: | |||||||||||||||||||||||||
| Savings and money market | 25,165 | 26,071 | 25,540 | (906 | ) | (3.5 | ) | (375 | ) | (1.5 | ) | ||||||||||||||
| Time | 3,041 | 2,994 | 2,336 | 47 | 1.6 | 705 | 30.2 | ||||||||||||||||||
| Foreign | — | — | 118 | — | NM | (118 | ) | (100.0 | ) | ||||||||||||||||
| Total deposits | $ | 52,378 | $ | 53,475 | $ | 50,271 | $ | (1,097 | ) | (2.1 | ) | $ | 2,107 | 4.2 | |||||||||||
| Shareholders’ Equity | |||||||||||||||||||||||||
| 2Q17 - 1Q17 | 2Q17 - 2Q16 | ||||||||||||||||||||||||
| (In millions) | 2Q17 | 1Q17 | 2Q16 | $ | % | $ | % | ||||||||||||||||||
| Shareholders’ equity: | |||||||||||||||||||||||||
| Preferred Stock | $ | 566 | $ | 710 | $ | 710 | $ | (144 | ) | (20.3 | )% | $ | (144 | ) | (20.3 | )% | |||||||||
| Common Stock | 4,660 | 4,696 | 4,783 | (36 | ) | (0.8 | ) | (123 | ) | (2.6 | ) | ||||||||||||||
| Retained earnings | 2,572 | 2,435 | 2,110 | 137 | 5.6 | 462 | 21.9 | ||||||||||||||||||
| Accumulated other comprehensive income (loss) | (49 | ) | (111 | ) | 23 | 62 | 55.9 | (72 | ) | (313.0 | ) | ||||||||||||||
| Total shareholders' equity | $ | 7,749 | $ | 7,730 | $ | 7,626 | $ | 19 | 0.2 | $ | 123 | 1.6 | |||||||||||||
| • | Increasing the common dividend to $0.24 per share by Q2 2018, following the path of: |
| ◦ | $0.12 per share in Q3 2017 |
| ◦ | $0.16 per share in Q4 2017 |
| ◦ | $0.20 per share in Q1 2018 |
| ◦ | $0.24 per share in Q2 2018 |
| ◦ | The schedule above is indicative of approximately $140 million in total common dividends over the four-quarter period. |
| • | Up to $465 million of common stock redemption. |
| Three Months Ended | |||||||||||||||||||
| (In millions, except share, per share, and ratio data) | June 30, 2017 | March 31, 2017 | December 31, 2016 | September 30, 2016 | June 30, 2016 | ||||||||||||||
BALANCE SHEET 1 | |||||||||||||||||||
| Loans held for investment, net of allowance | $ | 43,139 | $ | 42,198 | $ | 42,082 | $ | 41,943 | $ | 41,893 | |||||||||
| Total assets | 65,446 | 65,463 | 63,239 | 61,039 | 59,643 | ||||||||||||||
| Deposits | 52,378 | 53,475 | 53,236 | 50,849 | 50,271 | ||||||||||||||
| Total shareholders’ equity | 7,749 | 7,730 | 7,634 | 7,679 | 7,626 | ||||||||||||||
| STATEMENT OF INCOME | |||||||||||||||||||
| Net earnings applicable to common shareholders | $ | 154 | $ | 129 | $ | 125 | $ | 117 | $ | 91 | |||||||||
| Net interest income | 528 | 489 | 480 | 469 | 465 | ||||||||||||||
Taxable-equivalent net interest income 2 | 537 | 497 | 488 | 476 | 471 | ||||||||||||||
| Total noninterest income | 132 | 132 | 128 | 145 | 126 | ||||||||||||||
| Total noninterest expense | 405 | 414 | 404 | 403 | 382 | ||||||||||||||
Adjusted pre-provision net revenue 2 | 268 | 213 | 217 | 209 | 211 | ||||||||||||||
| Provision for loan losses | 7 | 23 | (3 | ) | 19 | 35 | |||||||||||||
| Provision for unfunded lending commitments | 3 | (5 | ) | 3 | (3 | ) | (4 | ) | |||||||||||
| Provision for credit losses | 10 | 18 | — | 16 | 31 | ||||||||||||||
| PER COMMON SHARE | |||||||||||||||||||
| Net earnings per diluted common share | $ | 0.73 | $ | 0.61 | $ | 0.60 | $ | 0.57 | $ | 0.44 | |||||||||
| Dividends | 0.08 | 0.08 | 0.08 | 0.08 | 0.06 | ||||||||||||||
Book value per common share 1 | 35.54 | 34.65 | 34.09 | 34.19 | 33.72 | ||||||||||||||
Tangible book value per common share 1, 2 | 30.50 | 29.61 | 29.06 | 29.16 | 28.72 | ||||||||||||||
| SELECTED RATIOS AND OTHER DATA | |||||||||||||||||||
| Return on average assets | 1.03 | % | 0.88 | % | 0.88 | % | 0.84 | % | 0.77 | % | |||||||||
| Return on average common equity | 8.65 | % | 7.48 | % | 7.11 | % | 6.66 | % | 5.32 | % | |||||||||
Tangible return on average tangible common equity 2 | 10.2 | % | 8.8 | % | 8.4 | % | 7.9 | % | 6.3 | % | |||||||||
| Net interest margin | 3.52 | % | 3.38 | % | 3.37 | % | 3.36 | % | 3.39 | % | |||||||||
Efficiency ratio 2 | 59.8 | % | 65.9 | % | 64.5 | % | 65.9 | % | 64.6 | % | |||||||||
| Effective tax rate | 32.3 | % | 24.5 | % | 33.8 | % | 33.9 | % | 34.5 | % | |||||||||
| Ratio of nonperforming assets to loans and leases and other real estate owned | 1.12 | % | 1.37 | % | 1.34 | % | 1.37 | % | 1.30 | % | |||||||||
| Annualized ratio of net loan and lease charge-offs to average loans | 0.06 | % | 0.43 | % | 0.25 | % | 0.28 | % | 0.37 | % | |||||||||
Ratio of total allowance for credit losses to loans and leases outstanding 1 | 1.39 | % | 1.41 | % | 1.48 | % | 1.55 | % | 1.58 | % | |||||||||
| Full-time equivalent employees | 10,074 | 10,004 | 10,057 | 9,968 | 10,064 | ||||||||||||||
CAPITAL RATIOS 1 | |||||||||||||||||||
| Tangible common equity ratio | 9.57 | % | 9.31 | % | 9.49 | % | 9.91 | % | 10.05 | % | |||||||||
Basel III: 3 | |||||||||||||||||||
| Common equity tier 1 capital | 12.3 | % | 12.2 | % | 12.1 | % | 12.0 | % | 12.0 | % | |||||||||
| Tier 1 leverage | 10.5 | % | 10.8 | % | 11.1 | % | 11.3 | % | 11.3 | % | |||||||||
| Tier 1 risk-based capital | 13.4 | % | 13.6 | % | 13.5 | % | 13.5 | % | 13.4 | % | |||||||||
| Total risk-based capital | 15.1 | % | 15.3 | % | 15.2 | % | 15.3 | % | 15.5 | % | |||||||||
| Risk-weighted assets | 50,599 | 50,016 | 49,937 | 49,318 | 49,017 | ||||||||||||||
| Weighted average common and common-equivalent shares outstanding (in thousands) | 208,183 | 210,405 | 205,446 | 204,714 | 204,536 | ||||||||||||||
Common shares outstanding (in thousands) 1 | 202,131 | 202,595 | 203,085 | 203,850 | 205,104 | ||||||||||||||
1 | At period end. |
2 | For information on non-GAAP financial measures see pages 16-19. |
3 | Basel III capital ratios became effective January 1, 2015 and are based on the applicable phase-in periods. Current period ratios and amounts represent estimates. |
| (In millions, shares in thousands) | June 30, 2017 | March 31, 2017 | December 31, 2016 | September 30, 2016 | June 30, 2016 | ||||||||||||||
| (Unaudited) | (Unaudited) | (Unaudited) | (Unaudited) | ||||||||||||||||
| ASSETS | |||||||||||||||||||
| Cash and due from banks | $ | 481 | $ | 566 | $ | 737 | $ | 553 | $ | 560 | |||||||||
| Money market investments: | |||||||||||||||||||
| Interest-bearing deposits | 1,167 | 1,761 | 1,411 | 1,489 | 2,155 | ||||||||||||||
| Federal funds sold and security resell agreements | 427 | 363 | 568 | 1,676 | 620 | ||||||||||||||
| Investment securities: | |||||||||||||||||||
| Held-to-maturity, at amortized cost (approximate fair value $774, $803, $850, $718, and $721) | 775 | 815 | 868 | 715 | 713 | ||||||||||||||
| Available-for-sale, at fair value | 15,341 | 15,606 | 13,372 | 10,358 | 9,477 | ||||||||||||||
| Trading account, at fair value | 61 | 40 | 115 | 108 | 119 | ||||||||||||||
| 16,177 | 16,461 | 14,355 | 11,181 | 10,309 | |||||||||||||||
| Loans held for sale | 53 | 128 | 172 | 160 | 147 | ||||||||||||||
| Loans and leases, net of unearned income and fees | 43,683 | 42,742 | 42,649 | 42,540 | 42,501 | ||||||||||||||
| Less allowance for loan losses | 544 | 544 | 567 | 597 | 608 | ||||||||||||||
| Loans held for investment, net of allowance | 43,139 | 42,198 | 42,082 | 41,943 | 41,893 | ||||||||||||||
| Other noninterest-bearing investments | 1,012 | 973 | 884 | 894 | 851 | ||||||||||||||
| Premises, equipment and software, net | 1,069 | 1,047 | 1,020 | 987 | 956 | ||||||||||||||
| Goodwill | 1,014 | 1,014 | 1,014 | 1,014 | 1,014 | ||||||||||||||
| Core deposit and other intangibles | 5 | 7 | 8 | 10 | 12 | ||||||||||||||
| Other real estate owned | 4 | 3 | 4 | 8 | 8 | ||||||||||||||
| Other assets | 898 | 942 | 984 | 1,124 | 1,118 | ||||||||||||||
| $ | 65,446 | $ | 65,463 | $ | 63,239 | $ | 61,039 | $ | 59,643 | ||||||||||
| LIABILITIES AND SHAREHOLDERS’ EQUITY | |||||||||||||||||||
| Deposits: | |||||||||||||||||||
| Noninterest-bearing demand | $ | 24,172 | $ | 24,410 | $ | 24,115 | $ | 22,711 | $ | 22,277 | |||||||||
| Interest-bearing: | |||||||||||||||||||
| Savings and money market | 25,165 | 26,071 | 26,364 | 25,503 | 25,540 | ||||||||||||||
| Time | 3,041 | 2,994 | 2,757 | 2,516 | 2,336 | ||||||||||||||
| Foreign | — | — | — | 119 | 118 | ||||||||||||||
| 52,378 | 53,475 | 53,236 | 50,849 | 50,271 | |||||||||||||||
| Federal funds and other short-term borrowings | 4,342 | 3,137 | 827 | 1,116 | 271 | ||||||||||||||
| Long-term debt | 383 | 383 | 535 | 570 | 699 | ||||||||||||||
| Reserve for unfunded lending commitments | 63 | 60 | 65 | 62 | 65 | ||||||||||||||
| Other liabilities | 531 | 678 | 942 | 763 | 711 | ||||||||||||||
| Total liabilities | 57,697 | 57,733 | 55,605 | 53,360 | 52,017 | ||||||||||||||
| Shareholders’ equity: | |||||||||||||||||||
| Preferred stock, without par value, authorized 4,400 shares | 566 | 710 | 710 | 710 | 710 | ||||||||||||||
| Common stock, without par value; authorized 350,000 shares; issued and outstanding 202,131, 202,595, 203,085, 203,850, and 205,104 shares | 4,660 | 4,696 | 4,725 | 4,748 | 4,783 | ||||||||||||||
| Retained earnings | 2,572 | 2,435 | 2,321 | 2,212 | 2,110 | ||||||||||||||
| Accumulated other comprehensive income (loss) | (49 | ) | (111 | ) | (122 | ) | 9 | 23 | |||||||||||
| Total shareholders’ equity | 7,749 | 7,730 | 7,634 | 7,679 | 7,626 | ||||||||||||||
| $ | 65,446 | $ | 65,463 | $ | 63,239 | $ | 61,039 | $ | 59,643 | ||||||||||
| Three Months Ended | |||||||||||||||||||
| (In millions, except share and per share amounts) | June 30, 2017 | March 31, 2017 | December 31, 2016 | September 30, 2016 | June 30, 2016 | ||||||||||||||
| Interest income: | |||||||||||||||||||
| Interest and fees on loans | $ | 469 | $ | 433 | $ | 438 | $ | 437 | $ | 434 | |||||||||
| Interest on money market investments | 5 | 4 | 4 | 5 | 5 | ||||||||||||||
| Interest on securities | 84 | 78 | 59 | 49 | 48 | ||||||||||||||
| Total interest income | 558 | 515 | 501 | 491 | 487 | ||||||||||||||
| Interest expense: | |||||||||||||||||||
| Interest on deposits | 14 | 13 | 13 | 13 | 12 | ||||||||||||||
| Interest on short- and long-term borrowings | 16 | 13 | 8 | 9 | 10 | ||||||||||||||
| Total interest expense | 30 | 26 | 21 | 22 | 22 | ||||||||||||||
| Net interest income | 528 | 489 | 480 | 469 | 465 | ||||||||||||||
| Provision for loan losses | 7 | 23 | (3 | ) | 19 | 35 | |||||||||||||
| Net interest income after provision for loan losses | 521 | 466 | 483 | 450 | 430 | ||||||||||||||
| Noninterest income: | |||||||||||||||||||
| Service charges and fees on deposit accounts | 43 | 42 | 43 | 45 | 42 | ||||||||||||||
| Other service charges, commissions and fees | 56 | 49 | 52 | 54 | 52 | ||||||||||||||
| Wealth management income | 10 | 10 | 11 | 10 | 9 | ||||||||||||||
| Loan sales and servicing income | 6 | 7 | 6 | 11 | 10 | ||||||||||||||
| Capital markets and foreign exchange | 6 | 7 | 6 | 6 | 5 | ||||||||||||||
| Customer-related fees | 121 | 115 | 118 | 126 | 118 | ||||||||||||||
| Dividends and other investment income | 10 | 12 | 4 | 9 | 6 | ||||||||||||||
| Securities gains (losses), net | 2 | 5 | (3 | ) | 8 | 3 | |||||||||||||
| Other | (1 | ) | — | 9 | 2 | (1 | ) | ||||||||||||
| Total noninterest income | 132 | 132 | 128 | 145 | 126 | ||||||||||||||
| Noninterest expense: | |||||||||||||||||||
| Salaries and employee benefits | 242 | 262 | 241 | 242 | 241 | ||||||||||||||
| Occupancy, net | 32 | 33 | 32 | 33 | 30 | ||||||||||||||
| Furniture, equipment and software, net | 32 | 32 | 33 | 29 | 31 | ||||||||||||||
| Other real estate expense, net | — | — | — | — | (1 | ) | |||||||||||||
| Credit-related expense | 8 | 8 | 7 | 7 | 6 | ||||||||||||||
| Provision for unfunded lending commitments | 3 | (5 | ) | 3 | (3 | ) | (4 | ) | |||||||||||
| Professional and legal services | 13 | 14 | 17 | 14 | 12 | ||||||||||||||
| Advertising | 6 | 5 | 5 | 6 | 5 | ||||||||||||||
| FDIC premiums | 13 | 12 | 11 | 12 | 10 | ||||||||||||||
| Amortization of core deposit and other intangibles | 2 | 2 | 2 | 2 | 2 | ||||||||||||||
| Other | 54 | 51 | 53 | 61 | 50 | ||||||||||||||
| Total noninterest expense | 405 | 414 | 404 | 403 | 382 | ||||||||||||||
| Income before income taxes | 248 | 184 | 207 | 192 | 174 | ||||||||||||||
| Income taxes | 80 | 45 | 70 | 65 | 60 | ||||||||||||||
| Net income | 168 | 139 | 137 | 127 | 114 | ||||||||||||||
| Preferred stock dividends | (12 | ) | (10 | ) | (12 | ) | (10 | ) | (13 | ) | |||||||||
| Preferred stock redemption | (2 | ) | — | — | — | (10 | ) | ||||||||||||
| Net earnings applicable to common shareholders | $ | 154 | $ | 129 | $ | 125 | $ | 117 | $ | 91 | |||||||||
| Weighted average common shares outstanding during the period: | |||||||||||||||||||
| Basic shares (in thousands) | 201,822 | 202,347 | 202,886 | 204,312 | 204,236 | ||||||||||||||
| Diluted shares (in thousands) | 208,183 | 210,405 | 205,446 | 204,714 | 204,536 | ||||||||||||||
| Net earnings per common share: | |||||||||||||||||||
| Basic | $ | 0.76 | $ | 0.63 | $ | 0.61 | $ | 0.57 | $ | 0.44 | |||||||||
| Diluted | 0.73 | 0.61 | 0.60 | 0.57 | 0.44 | ||||||||||||||
| (In millions) | June 30, 2017 | March 31, 2017 | December 31, 2016 | September 30, 2016 | June 30, 2016 | ||||||||||||||
| Commercial: | |||||||||||||||||||
| Commercial and industrial | $ | 13,850 | $ | 13,368 | $ | 13,452 | $ | 13,543 | $ | 13,757 | |||||||||
| Leasing | 387 | 404 | 423 | 439 | 426 | ||||||||||||||
| Owner occupied | 7,095 | 6,973 | 6,962 | 6,889 | 6,989 | ||||||||||||||
| Municipal | 871 | 811 | 778 | 753 | 756 | ||||||||||||||
| Total commercial | 22,203 | 21,556 | 21,615 | 21,624 | 21,928 | ||||||||||||||
| Commercial real estate: | |||||||||||||||||||
| Construction and land development | 2,186 | 2,123 | 2,019 | 2,147 | 2,088 | ||||||||||||||
| Term | 9,012 | 9,083 | 9,322 | 9,303 | 9,230 | ||||||||||||||
| Total commercial real estate | 11,198 | 11,206 | 11,341 | 11,450 | 11,318 | ||||||||||||||
| Consumer: | |||||||||||||||||||
| Home equity credit line | 2,697 | 2,638 | 2,645 | 2,581 | 2,507 | ||||||||||||||
| 1-4 family residential | 6,359 | 6,185 | 5,891 | 5,785 | 5,680 | ||||||||||||||
| Construction and other consumer real estate | 560 | 517 | 486 | 453 | 419 | ||||||||||||||
| Bankcard and other revolving plans | 478 | 459 | 481 | 458 | 460 | ||||||||||||||
| Other | 188 | 181 | 190 | 189 | 189 | ||||||||||||||
| Total consumer | 10,282 | 9,980 | 9,693 | 9,466 | 9,255 | ||||||||||||||
| Loans and leases, net of unearned income and fees | $ | 43,683 | $ | 42,742 | $ | 42,649 | $ | 42,540 | $ | 42,501 | |||||||||
| (In millions) | June 30, 2017 | March 31, 2017 | December 31, 2016 | September 30, 2016 | June 30, 2016 | ||||||||||||||
Nonaccrual loans1 | $ | 486 | $ | 585 | $ | 569 | $ | 579 | $ | 547 | |||||||||
| Other real estate owned | 4 | 3 | 4 | 8 | 8 | ||||||||||||||
| Total nonperforming assets | $ | 490 | $ | 588 | $ | 573 | $ | 587 | $ | 555 | |||||||||
Ratio of nonperforming assets to loans1 and leases and other real estate owned | 1.12 | % | 1.37 | % | 1.34 | % | 1.37 | % | 1.30 | % | |||||||||
| Accruing loans past due 90 days or more | $ | 19 | $ | 30 | $ | 36 | $ | 29 | $ | 29 | |||||||||
Ratio of accruing loans past due 90 days or more to loans1 and leases | 0.04 | % | 0.07 | % | 0.08 | % | 0.07 | % | 0.07 | % | |||||||||
| Nonaccrual loans and accruing loans past due 90 days or more | $ | 505 | $ | 615 | $ | 605 | $ | 608 | $ | 576 | |||||||||
Ratio of nonaccrual loans and accruing loans past due 90 days or more to loans1 and leases | 1.15 | % | 1.43 | % | 1.41 | % | 1.42 | % | 1.35 | % | |||||||||
| Accruing loans past due 30-89 days | $ | 98 | $ | 137 | $ | 126 | $ | 164 | $ | 133 | |||||||||
| Restructured loans included in nonaccrual loans | 137 | 131 | 100 | 125 | 143 | ||||||||||||||
| Restructured loans on accrual | 167 | 167 | 151 | 170 | 172 | ||||||||||||||
| Classified loans | 1,317 | 1,464 | 1,577 | 1,615 | 1,610 | ||||||||||||||
| Three Months Ended | |||||||||||||||||||
| (In millions) | June 30, 2017 | March 31, 2017 | December 31, 2016 | September 30, 2016 | June 30, 2016 | ||||||||||||||
| Allowance for Loan Losses | |||||||||||||||||||
| Balance at beginning of period | $ | 544 | $ | 567 | $ | 597 | $ | 608 | $ | 612 | |||||||||
| Add: | |||||||||||||||||||
| Provision for losses | 7 | 23 | (3 | ) | 19 | 35 | |||||||||||||
| Deduct: | |||||||||||||||||||
| Gross loan and lease charge-offs | (35 | ) | (57 | ) | (38 | ) | (54 | ) | (58 | ) | |||||||||
| Recoveries | 28 | 11 | 11 | 24 | 19 | ||||||||||||||
| Net loan and lease charge-offs | (7 | ) | (46 | ) | (27 | ) | (30 | ) | (39 | ) | |||||||||
| Balance at end of period | $ | 544 | $ | 544 | $ | 567 | $ | 597 | $ | 608 | |||||||||
Ratio of allowance for loan losses to loans1 and leases, at period end | 1.25 | % | 1.27 | % | 1.33 | % | 1.40 | % | 1.43 | % | |||||||||
Ratio of allowance for loan losses to nonaccrual loans1 at period end | 115 | % | 99 | % | 107 | % | 109 | % | 114 | % | |||||||||
| Annualized ratio of net loan and lease charge-offs to average loans | 0.06 | % | 0.43 | % | 0.25 | % | 0.28 | % | 0.37 | % | |||||||||
| Reserve for Unfunded Lending Commitments | |||||||||||||||||||
| Balance at beginning of period | $ | 60 | $ | 65 | $ | 62 | $ | 65 | $ | 69 | |||||||||
| Provision charged (credited) to earnings | 3 | (5 | ) | 3 | (3 | ) | (4 | ) | |||||||||||
| Balance at end of period | $ | 63 | $ | 60 | $ | 65 | $ | 62 | $ | 65 | |||||||||
| Total Allowance for Credit Losses | |||||||||||||||||||
| Allowance for loan losses | $ | 544 | $ | 544 | $ | 567 | $ | 597 | $ | 608 | |||||||||
| Reserve for unfunded lending commitments | 63 | 60 | 65 | 62 | 65 | ||||||||||||||
| Total allowance for credit losses | $ | 607 | $ | 604 | $ | 632 | $ | 659 | $ | 673 | |||||||||
Ratio of total allowance for credit losses to loans1 and leases outstanding, at period end | 1.39 | % | 1.41 | % | 1.48 | % | 1.55 | % | 1.58 | % | |||||||||
| (In millions) | June 30, 2017 | March 31, 2017 | December 31, 2016 | September 30, 2016 | June 30, 2016 | ||||||||||||||
| Loans held for sale | $ | 12 | $ | 34 | $ | 40 | $ | 29 | $ | 13 | |||||||||
| Commercial: | |||||||||||||||||||
| Commercial and industrial | $ | 278 | $ | 358 | $ | 354 | $ | 387 | $ | 341 | |||||||||
| Leasing | 10 | 13 | 14 | 14 | 14 | ||||||||||||||
| Owner occupied | 86 | 89 | 74 | 66 | 69 | ||||||||||||||
| Municipal | 1 | 1 | 1 | 1 | 1 | ||||||||||||||
| Total commercial | 375 | 461 | 443 | 468 | 425 | ||||||||||||||
| Commercial real estate: | |||||||||||||||||||
| Construction and land development | 6 | 7 | 7 | 4 | 5 | ||||||||||||||
| Term | 37 | 38 | 29 | 28 | 51 | ||||||||||||||
| Total commercial real estate | 43 | 45 | 36 | 32 | 56 | ||||||||||||||
| Consumer: | |||||||||||||||||||
| Home equity credit line | 11 | 9 | 11 | 11 | 12 | ||||||||||||||
| 1-4 family residential | 43 | 35 | 36 | 36 | 39 | ||||||||||||||
| Construction and other consumer real estate | 1 | 1 | 2 | 1 | 1 | ||||||||||||||
| Bankcard and other revolving plans | — | — | 1 | 2 | 1 | ||||||||||||||
| Other | 1 | — | — | — | — | ||||||||||||||
| Total consumer | 56 | 45 | 50 | 50 | 53 | ||||||||||||||
| Total nonaccrual loans | $ | 486 | $ | 585 | $ | 569 | $ | 579 | $ | 547 | |||||||||
| (In millions) | June 30, 2017 | March 31, 2017 | December 31, 2016 | September 30, 2016 | June 30, 2016 | ||||||||||||||
| Commercial: | |||||||||||||||||||
| Commercial and industrial | $ | 11 | $ | 45 | $ | 25 | $ | 33 | $ | 32 | |||||||||
| Leasing | — | — | — | — | — | ||||||||||||||
| Owner occupied | 2 | 1 | (1 | ) | — | — | |||||||||||||
| Municipal | — | — | — | — | — | ||||||||||||||
| Total commercial | 13 | 46 | 24 | 33 | 32 | ||||||||||||||
| Commercial real estate: | |||||||||||||||||||
| Construction and land development | (8 | ) | (2 | ) | — | (1 | ) | (1 | ) | ||||||||||
| Term | — | 1 | 1 | (5 | ) | 7 | |||||||||||||
| Total commercial real estate | (8 | ) | (1 | ) | 1 | (6 | ) | 6 | |||||||||||
| Consumer: | |||||||||||||||||||
| Home equity credit line | 1 | (1 | ) | — | 1 | — | |||||||||||||
| 1-4 family residential | — | (1 | ) | — | — | (1 | ) | ||||||||||||
| Construction and other consumer real estate | — | — | — | — | — | ||||||||||||||
| Bankcard and other revolving plans | 1 | 3 | 2 | 2 | 2 | ||||||||||||||
| Other | — | — | — | — | — | ||||||||||||||
| Total consumer loans | 2 | 1 | 2 | 3 | 1 | ||||||||||||||
| Total net charge-offs (recoveries) | $ | 7 | $ | 46 | $ | 27 | $ | 30 | $ | 39 | |||||||||
| June 30, 2017 | March 31, 2017 | June 30, 2016 | 2Q17 - 1Q17 | 2Q17 - 2Q16 | |||||||||||||||||||||
| (In millions) | $ | % | $ | % | |||||||||||||||||||||
| Loans and leases | |||||||||||||||||||||||||
| Upstream – exploration and production | $ | 709 | $ | 685 | $ | 831 | $ | 24 | 4 | % | $ | (122 | ) | (15 | )% | ||||||||||
| Midstream – marketing and transportation | 622 | 603 | 658 | 19 | 3 | (36 | ) | (5 | ) | ||||||||||||||||
| Downstream – refining | 103 | 108 | 131 | (5 | ) | (5 | ) | (28 | ) | (21 | ) | ||||||||||||||
| Other non-services | 37 | 38 | 45 | (1 | ) | (3 | ) | (8 | ) | (18 | ) | ||||||||||||||
| Oilfield services | 455 | 466 | 712 | (11 | ) | (2 | ) | (257 | ) | (36 | ) | ||||||||||||||
| Oil and gas service manufacturing | 136 | 161 | 193 | (25 | ) | (16 | ) | (57 | ) | (30 | ) | ||||||||||||||
Total loan and lease balances 2 | 2,062 | 2,061 | 2,570 | 1 | — | (508 | ) | (20 | ) | ||||||||||||||||
| Unfunded lending commitments | 1,855 | 1,886 | 1,823 | (31 | ) | (2 | ) | 32 | 2 | ||||||||||||||||
| Total oil and gas credit exposure | $ | 3,917 | $ | 3,947 | $ | 4,393 | $ | (30 | ) | (1 | ) | $ | (476 | ) | (11 | ) | |||||||||
| Private equity investments | $ | 4 | $ | 6 | $ | 6 | $ | (2 | ) | (33 | ) | $ | (2 | ) | (33 | ) | |||||||||
Credit quality measures 2 | |||||||||||||||||||||||||
| Criticized loan ratio | 33.1 | % | 38.0 | % | 37.8 | % | |||||||||||||||||||
| Classified loan ratio | 27.2 | % | 30.4 | % | 31.5 | % | |||||||||||||||||||
| Nonaccrual loan ratio | 12.1 | % | 14.8 | % | 11.1 | % | |||||||||||||||||||
| Ratio of nonaccrual loans that are current | 84.7 | % | 73.1 | % | 89.2 | % | |||||||||||||||||||
Net charge-off ratio, annualized 3 | 3.1 | % | 2.6 | % | 5.6 | % | |||||||||||||||||||
1 | Because many borrowers operate in multiple businesses, judgment has been applied in characterizing a borrower as oil and gas-related, including a particular segment of oil and gas-related activity, e.g., upstream or downstream; typically, 50% of revenues coming from the oil and gas sector is used as a guide. |
3 | Calculated as the ratio of annualized net charge-offs to the beginning loan balances for each respective period. |
| Three Months Ended | ||||||||||||||||||||
| June 30, 2017 | March 31, 2017 | June 30, 2016 | ||||||||||||||||||
| (In millions) | Average balance | Average yield/rate 1 | Average balance | Average yield/rate 1 | Average balance | Average yield/rate 1 | ||||||||||||||
| ASSETS | ||||||||||||||||||||
| Money market investments | $ | 1,572 | 1.20 | % | $ | 1,983 | 0.93 | % | $ | 4,045 | 0.55 | % | ||||||||
| Securities: | ||||||||||||||||||||
| Held-to-maturity | 788 | 3.97 | % | 847 | 3.90 | % | 669 | 4.46 | % | |||||||||||
| Available-for-sale | 15,386 | 2.11 | % | 14,024 | 2.14 | % | 8,853 | 1.93 | % | |||||||||||
| Trading account | 79 | 3.43 | % | 61 | 3.75 | % | 78 | 3.88 | % | |||||||||||
| Total securities | 16,253 | 2.20 | % | 14,932 | 2.24 | % | 9,600 | 2.13 | % | |||||||||||
| Loans held for sale | 100 | 3.23 | % | 132 | 3.22 | % | 126 | 3.52 | % | |||||||||||
Loans held for investment 2: | ||||||||||||||||||||
| Commercial | 21,885 | 4.44 | % | 21,606 | 4.22 | % | 21,934 | 4.20 | % | |||||||||||
| Commercial real estate | 11,236 | 4.74 | % | 11,241 | 4.27 | % | 11,169 | 4.31 | % | |||||||||||
| Consumer | 10,122 | 3.83 | % | 9,719 | 3.82 | % | 9,005 | 3.88 | % | |||||||||||
| Total loans held for investment | 43,243 | 4.38 | % | 42,566 | 4.14 | % | 42,108 | 4.16 | % | |||||||||||
| Total interest-earning assets | 61,168 | 3.72 | % | 59,613 | 3.56 | % | 55,879 | 3.55 | % | |||||||||||
| Cash and due from banks | 795 | 974 | 521 | |||||||||||||||||
| Allowance for loan losses | (546 | ) | (566 | ) | (606 | ) | ||||||||||||||
| Goodwill | 1,014 | 1,014 | 1,014 | |||||||||||||||||
| Core deposit and other intangibles | 6 | 8 | 14 | |||||||||||||||||
| Other assets | 2,974 | 2,952 | 2,724 | |||||||||||||||||
| Total assets | $ | 65,411 | $ | 63,995 | $ | 59,546 | ||||||||||||||
| LIABILITIES AND SHAREHOLDERS’ EQUITY | ||||||||||||||||||||
| Interest-bearing deposits: | ||||||||||||||||||||
| Savings and money market | $ | 25,467 | 0.14 | % | $ | 25,896 | 0.14 | % | $ | 25,780 | 0.14 | % | ||||||||
| Time | 3,048 | 0.66 | % | 2,856 | 0.59 | % | 2,192 | 0.46 | % | |||||||||||
| Foreign | — | — | — | % | 139 | 0.28 | % | |||||||||||||
| Total interest-bearing deposits | 28,515 | 0.20 | % | 28,752 | 0.19 | % | 28,111 | 0.17 | % | |||||||||||
| Borrowed funds: | ||||||||||||||||||||
| Federal funds and other short-term borrowings | 4,302 | 0.94 | % | 2,924 | 0.71 | % | 547 | 0.24 | % | |||||||||||
| Long-term debt | 383 | 5.77 | % | 521 | 5.92 | % | 790 | 5.05 | % | |||||||||||
| Total borrowed funds | 4,685 | 1.34 | % | 3,445 | 1.50 | % | 1,337 | 3.08 | % | |||||||||||
| Total interest-bearing liabilities | 33,200 | 0.36 | % | 32,197 | 0.33 | % | 29,448 | 0.30 | % | |||||||||||
| Noninterest-bearing deposits | 23,819 | 23,460 | 21,839 | |||||||||||||||||
| Other liabilities | 565 | 632 | 597 | |||||||||||||||||
| Total liabilities | 57,584 | 56,289 | 51,884 | |||||||||||||||||
| Shareholders’ equity: | ||||||||||||||||||||
| Preferred equity | 684 | 710 | 779 | |||||||||||||||||
| Common equity | 7,143 | 6,996 | 6,883 | |||||||||||||||||
| Total shareholders’ equity | 7,827 | 7,706 | 7,662 | |||||||||||||||||
| Total liabilities and shareholders’ equity | $ | 65,411 | $ | 63,995 | $ | 59,546 | ||||||||||||||
| Spread on average interest-bearing funds | 3.36 | % | 3.23 | % | 3.25 | % | ||||||||||||||
| Net yield on interest-earning assets | 3.52 | % | 3.38 | % | 3.39 | % | ||||||||||||||
| (In millions, except shares and per share amounts) | June 30, 2017 | March 31, 2017 | December 31, 2016 | September 30, 2016 | June 30, 2016 | |||||||||||||||
| Tangible Book Value per Common Share | ||||||||||||||||||||
| Total shareholders’ equity (GAAP) | $ | 7,749 | $ | 7,730 | $ | 7,634 | $ | 7,679 | $ | 7,626 | ||||||||||
| Preferred stock | (566 | ) | (710 | ) | (710 | ) | (710 | ) | (710 | ) | ||||||||||
| Goodwill | (1,014 | ) | (1,014 | ) | (1,014 | ) | (1,014 | ) | (1,014 | ) | ||||||||||
| Core deposit and other intangibles | (5 | ) | (7 | ) | (8 | ) | (10 | ) | (12 | ) | ||||||||||
| Tangible common equity (non-GAAP) | (a) | $ | 6,164 | $ | 5,999 | $ | 5,902 | $ | 5,945 | $ | 5,890 | |||||||||
| Common shares outstanding (in thousands) | (b) | 202,131 | 202,595 | 203,085 | 203,850 | 205,104 | ||||||||||||||
| Tangible book value per common share (non-GAAP) | (a/b) | $ | 30.50 | $ | 29.61 | $ | 29.06 | $ | 29.16 | $ | 28.72 | |||||||||
| Three Months Ended | ||||||||||||||||||||
| (Dollar amounts in millions) | June 30, 2017 | March 31, 2017 | December 31, 2016 | September 30, 2016 | June 30, 2016 | |||||||||||||||
| Tangible Return on Average Tangible Common Equity | ||||||||||||||||||||
| Net earnings applicable to common shareholders (GAAP) | $ | 154 | $ | 129 | $ | 125 | $ | 117 | $ | 91 | ||||||||||
| Adjustments, net of tax: | ||||||||||||||||||||
| Amortization of core deposit and other intangibles | 1 | 1 | 1 | 1 | 1 | |||||||||||||||
| Net earnings applicable to common shareholders, excluding the effects of the adjustments, net of tax (non-GAAP) | (a) | $ | 155 | $ | 130 | $ | 126 | $ | 118 | $ | 92 | |||||||||
| Average common equity (GAAP) | $ | 7,143 | $ | 6,996 | $ | 6,998 | $ | 6,986 | $ | 6,883 | ||||||||||
| Average goodwill | (1,014 | ) | (1,014 | ) | (1,014 | ) | (1,014 | ) | (1,014 | ) | ||||||||||
| Average core deposit and other intangibles | (6 | ) | (8 | ) | (10 | ) | (11 | ) | (14 | ) | ||||||||||
| Average tangible common equity (non-GAAP) | (b) | $ | 6,123 | $ | 5,974 | $ | 5,974 | $ | 5,961 | $ | 5,855 | |||||||||
| Number of days in quarter | (c) | 91 | 90 | 92 | 92 | 91 | ||||||||||||||
| Number of days in year | (d) | 365 | 365 | 366 | 366 | 366 | ||||||||||||||
| Tangible return on average tangible common equity (non-GAAP) | (a/b/c)*d | 10.2 | % | 8.8 | % | 8.4 | % | 7.9 | % | 6.3 | % | |||||||||
| Three Months Ended | ||||||||||||||||||||
| (In millions) | June 30, 2017 | March 31, 2017 | December 31, 2016 | September 30, 2016 | June 30, 2016 | |||||||||||||||
| Efficiency Ratio | ||||||||||||||||||||
| Noninterest expense (GAAP) | (a) | $ | 405 | $ | 414 | $ | 404 | $ | 403 | $ | 382 | |||||||||
| Adjustments: | ||||||||||||||||||||
| Severance costs | — | 5 | 1 | — | — | |||||||||||||||
| Other real estate expense | — | — | — | — | (1 | ) | ||||||||||||||
| Provision for unfunded lending commitments | 3 | (5 | ) | 3 | (3 | ) | (4 | ) | ||||||||||||
| Debt extinguishment cost | — | — | — | — | — | |||||||||||||||
| Amortization of core deposit and other intangibles | 2 | 2 | 2 | 2 | 2 | |||||||||||||||
Restructuring costs 1 | 1 | 1 | 3 | — | — | |||||||||||||||
| Total adjustments | (b) | 6 | 3 | 9 | (1 | ) | (3 | ) | ||||||||||||
| Adjusted noninterest expense (non-GAAP) | (a-b)=(c) | $ | 399 | $ | 411 | $ | 395 | $ | 404 | $ | 385 | |||||||||
| Net interest income (GAAP) | (d) | $ | 528 | $ | 489 | $ | 480 | $ | 469 | $ | 465 | |||||||||
| Fully taxable-equivalent adjustments | (e) | 9 | 8 | 8 | 7 | 6 | ||||||||||||||
| Taxable-equivalent net interest income (non-GAAP) | (d+e)=(f) | 537 | 497 | 488 | 476 | 471 | ||||||||||||||
| Noninterest income (GAAP) | (g) | 132 | 132 | 128 | 145 | 126 | ||||||||||||||
| Combined income | (f+g)=(h) | 669 | 629 | 616 | 621 | 597 | ||||||||||||||
| Adjustments: | ||||||||||||||||||||
| Fair value and nonhedge derivative income (loss) | — | — | 7 | — | (2 | ) | ||||||||||||||
| Securities gains (losses), net | 2 | 5 | (3 | ) | 8 | 3 | ||||||||||||||
| Total adjustments | (i) | 2 | 5 | 4 | 8 | 1 | ||||||||||||||
| Adjusted taxable-equivalent revenue (non-GAAP) | (h-i)=(j) | $ | 667 | $ | 624 | $ | 612 | $ | 613 | $ | 596 | |||||||||
| Pre-provision net revenue (PPNR) | (h)-(a) | $ | 264 | $ | 215 | $ | 212 | $ | 218 | $ | 215 | |||||||||
| Adjusted PPNR (non-GAAP) | (j-c) | 268 | 213 | 217 | 209 | 211 | ||||||||||||||
| Efficiency ratio (non-GAAP) | (c/j) | 59.8 | % | 65.9 | % | 64.5 | % | 65.9 | % | 64.6 | % | |||||||||
| Six Months Ended | |||||||||
| (In millions) | June 30, 2017 | June 30, 2016 | |||||||
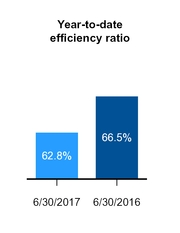
| Efficiency Ratio | |||||||||
| Noninterest expense (GAAP) | (a) | $ | 819 | $ | 777 | ||||
| Adjustments: | |||||||||
| Severance costs | 5 | 7 | 4 | ||||||
| Other real estate expense | — | (2 | ) | ||||||
| Provision for unfunded lending commitments | (2 | ) | (10 | ) | |||||
| Debt extinguishment cost | — | — | |||||||
| Amortization of core deposit and other intangibles | 3 | 4 | 4 | ||||||
Restructuring costs 1 | 2 | 2 | 1 | ||||||
| Total adjustments | (b) | 8 | (3 | ) | |||||
| Adjusted noninterest expense (non-GAAP) | (a-b)=(c) | $ | 811 | $ | 780 | ||||
| Net interest income (GAAP) | (d) | $ | 1,017 | $ | 918 | ||||
| Fully taxable-equivalent adjustments | (e) | 17 | 11 | ||||||
| Taxable-equivalent net interest income (non-GAAP) | (d+e)=(f) | 1,034 | 929 | ||||||
| Noninterest income (GAAP) | (g) | 264 | 242 | ||||||
| Combined income | (f+g)=(h) | 1,298 | 1,171 | ||||||
| Adjustments: | |||||||||
| Fair value and nonhedge derivative income (loss) | (1 | ) | (4 | ) | |||||
| Securities gains (losses), net | 7 | 2 | |||||||
| Total adjustments | (i) | 6 | (2 | ) | |||||
| Adjusted taxable-equivalent revenue (non-GAAP) | (h-i)=(j) | $ | 1,292 | $ | 1,173 | ||||
| Pre-provision net revenue (PPNR) | (h)-(a) | $ | 479 | $ | 394 | ||||
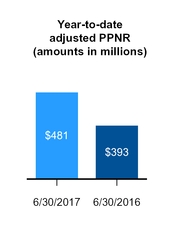
| Adjusted PPNR (non-GAAP) | (j-c) | 481 | 393 | ||||||
| Efficiency ratio (non-GAAP) | (c/j) | 62.8 | % | 66.5 | % | ||||