Zions Bancorporation, National Association (ZION)
Filed: 23 Oct 17, 12:00am
| Zions Bancorporation One South Main Salt Lake City, UT 84133 October 23, 2017 |  |
| www.zionsbancorporation.com | |
| Zions Bancorporation Reports: 3Q17 Net Earnings¹ of $152 million, diluted EPS of $0.72 |
| compared with 2Q17 Net Earnings¹ of $154 million, diluted EPS of $0.73, and 3Q16 Net Earnings¹ of $117 million, diluted EPS of $0.57 |
| $0.72 | $152 million | 3.45% | 12.2% | |||
| Earnings per diluted common share | Net Earnings 1 | Net interest margin (“NIM”) | Common Equity Tier 1 | |||
| THIRD QUARTER HIGHLIGHTS² | ||
| Net Interest Income and NIM | • | Net interest income was $522 million, up 11% |
• | NIM was 3.45% compared with 3.36% | |
Operating Performance2 | • | Pre-provision net revenue ("PPNR") was $257 million, up 18% |
• | Adjusted PPNR³ was $251 million, up 20% | |
• | Noninterest expense was $413 million, compared with $403 million | |
• | Adjusted noninterest expense³ was $414 million, compared with $404 million | |
• | Efficiency ratio³ was 62.3%, compared with 65.9% | |
| Loans and Credit Quality | • | Net loans and leases were $44.2 billion, compared with $42.5 billion |
• | Provision for credit losses was $1 million, compared with $16 million | |
• | Net charge-offs were $8 million, compared with $30 million | |
| Capital Returns | • | Tangible return on average tangible common equity³ was 9.8%, compared with 7.9% |
• | Common stock repurchases of $115 million, 2.5 million shares, or 1.3% of shares outstanding as of June 30, 2017, during the quarter | |
• | Common dividend increased to $0.12 per share from $0.08 per share | |
| Notable Items | • | Hurricane Harvey non-credit related impact of $6 million recognized in noninterest expense |
| CEO COMMENTARY |
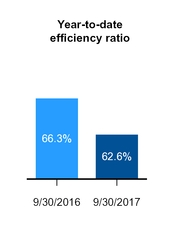
Harris H. Simmons, Chairman and CEO, commented, “Our third quarter earnings reflect moderate loan growth and continued improvement in credit quality. Furthermore, the year-to-date efficiency ratio, at 62.6%, is on track to meet the cost objective we established for 2017. The quarterly results were impacted by Hurricane Harvey, which led us to provide financial relief to affected employees in Texas, and to set aside additional reserves for any credit-related impact from the storm.” Mr. Simmons continued, “We are pleased with the quarterly earnings result, and look forward to continued progress in simplifying our business, meeting our customers’ needs and improving our profitability in the year ahead.” |
OPERATING PERFORMANCE3 |
| ¹ Net Earnings is net earnings applicable to common shareholders. ² Comparisons noted in the bullet points are calculated for the current quarter versus the same prior-year period, unless otherwise specified. ³ For information on non-GAAP financial measures and why the Company presents these numbers, see pages 16-19. Included in these non-GAAP financial measures are the key metrics to which Zions announced it would hold itself accountable in its June 1, 2015 efficiency initiative, and to which executive compensation is tied. |
| Net Interest Income and Margin | |||||||||||||||||||||||||
| 3Q17 - 2Q17 | 3Q17 - 3Q16 | ||||||||||||||||||||||||
| (In millions) | 3Q17 | 2Q17 | 3Q16 | $ | % | $ | % | ||||||||||||||||||
| Interest and fees on loans | $ | 468 | $ | 469 | $ | 437 | $ | (1 | ) | (0.2 | )% | $ | 31 | 7.1 | % | ||||||||||
| Interest on money market investments | 5 | 5 | 5 | — | — | — | — | ||||||||||||||||||
| Interest on securities | 84 | 84 | 49 | — | — | 35 | 71.4 | ||||||||||||||||||
| Total interest income | 557 | 558 | 491 | (1 | ) | (0.2 | ) | 66 | 13.4 | ||||||||||||||||
| Interest on deposits | 15 | 14 | 13 | 1 | 7.1 | 2 | 15.4 | ||||||||||||||||||
| Interest on short and long-term borrowings | 20 | 16 | 9 | 4 | 25.0 | 11 | 122.2 | ||||||||||||||||||
| Total interest expense | 35 | 30 | 22 | 5 | 16.7 | 13 | 59.1 | ||||||||||||||||||
| Net interest income | $ | 522 | $ | 528 | $ | 469 | $ | (6 | ) | (1.1 | ) | $ | 53 | 11.3 | |||||||||||
| bps | bps | ||||||||||||||||||||||||
| Net interest margin | 3.45 | % | 3.52 | % | 3.36 | % | (0.07 | ) | 0.09 | ||||||||||||||||
| Noninterest Income | |||||||||||||||||||||||||
| 3Q17 - 2Q17 | 3Q17 - 3Q16 | ||||||||||||||||||||||||
| (In millions) | 3Q17 | 2Q17 | 3Q16 | $ | % | $ | % | ||||||||||||||||||
| Service charges and fees on deposit accounts | $ | 42 | $ | 43 | $ | 45 | $ | (1 | ) | (2.3 | )% | $ | (3 | ) | (6.7 | )% | |||||||||
| Other service charges, commissions and fees | 55 | 56 | 54 | (1 | ) | (1.8 | ) | 1 | 1.9 | ||||||||||||||||
| Wealth management income | 11 | 10 | 10 | 1 | 10.0 | 1 | 10.0 | ||||||||||||||||||
| Loan sales and servicing income | 6 | 6 | 11 | — | — | (5 | ) | (45.5 | ) | ||||||||||||||||
| Capital markets and foreign exchange | 8 | 6 | 6 | 2 | 33.3 | 2 | 33.3 | ||||||||||||||||||
| Customer-related fees | 122 | 121 | 126 | 1 | 0.8 | (4 | ) | (3.2 | ) | ||||||||||||||||
| Dividends and other investment income | 9 | 10 | 9 | (1 | ) | (10.0 | ) | — | — | ||||||||||||||||
| Securities gains, net | 5 | 2 | 8 | 3 | 150.0 | (3 | ) | (37.5 | ) | ||||||||||||||||
| Other | 3 | (1 | ) | 2 | 4 | 400.0 | 1 | 50.0 | |||||||||||||||||
| Total noninterest income | $ | 139 | $ | 132 | $ | 145 | $ | 7 | 5.3 | $ | (6 | ) | (4.1 | ) | |||||||||||
| Noninterest Expense | |||||||||||||||||||||||||
| 3Q17 - 2Q17 | 3Q17 - 3Q16 | ||||||||||||||||||||||||
| (In millions) | 3Q17 | 2Q17 | 3Q16 | $ | % | $ | % | ||||||||||||||||||
| Salaries and employee benefits | $ | 253 | $ | 242 | $ | 242 | $ | 11 | 4.5 | % | $ | 11 | 4.5 | % | |||||||||||
| Occupancy, net | 35 | 32 | 33 | 3 | 9.4 | 2 | 6.1 | ||||||||||||||||||
| Furniture, equipment and software, net | 32 | 32 | 29 | — | — | 3 | 10.3 | ||||||||||||||||||
| Other real estate expense, net | (1 | ) | — | — | (1 | ) | NM | (1 | ) | NM | |||||||||||||||
| Credit-related expense | 7 | 8 | 7 | (1 | ) | (12.5 | ) | — | — | ||||||||||||||||
| Provision for unfunded lending commitments | (4 | ) | 3 | (3 | ) | (7 | ) | (233.3 | ) | (1 | ) | (33.3 | ) | ||||||||||||
| Professional and legal services | 14 | 13 | 14 | 1 | 7.7 | — | — | ||||||||||||||||||
| Advertising | 6 | 6 | 6 | — | — | — | — | ||||||||||||||||||
| FDIC premiums | 15 | 13 | 12 | 2 | 15.4 | 3 | 25.0 | ||||||||||||||||||
| Amortization of core deposit and other intangibles | 2 | 2 | 2 | — | — | — | — | ||||||||||||||||||
| Other | 54 | 54 | 61 | — | — | (7 | ) | (11.5 | ) | ||||||||||||||||
| Total noninterest expense | $ | 413 | $ | 405 | $ | 403 | $ | 8 | 2.0 | $ | 10 | 2.5 | |||||||||||||
Adjusted noninterest expense 1 | $ | 414 | $ | 399 | $ | 404 | $ | 15 | 3.8 | % | $ | 10 | 2.5 | % | |||||||||||
1 | For information on non-GAAP financial measures, see pages 16-19. |
| Asset Quality | |||||||||||||||||||||||||
| 3Q17 - 2Q17 | 3Q17 - 3Q16 | ||||||||||||||||||||||||
| (In millions) | 3Q17 | 2Q17 | 3Q16 | bps | bps | ||||||||||||||||||||
| Ratio of nonperforming assets to loans and leases and other real estate owned | 1.06 | % | 1.12 | % | 1.37 | % | (6 | ) | (31 | ) | |||||||||||||||
| Annualized ratio of net loan and lease charge-offs to average loans | 0.07 | % | 0.06 | % | 0.28 | % | 1 | (21 | ) | ||||||||||||||||
| Ratio of total allowance for credit losses to loans and leases outstanding | 1.36 | % | 1.39 | % | 1.55 | % | (3 | ) | (19 | ) | |||||||||||||||
| $ | % | $ | % | ||||||||||||||||||||||
| Classified loans | $ | 1,248 | $ | 1,317 | $ | 1,615 | $ | (69 | ) | (5.2 | )% | $ | (367 | ) | (22.7 | )% | |||||||||
| Nonperforming assets | 468 | 490 | 587 | (22 | ) | (4.5 | )% | (119 | ) | (20.3 | )% | ||||||||||||||
| Net loan and lease charge-offs | 8 | 7 | 30 | 1 | 14.3 | % | (22 | ) | (73.3 | )% | |||||||||||||||
| Provision for credit losses | 1 | 10 | 16 | (9 | ) | (90.0 | )% | (15 | ) | (93.8 | )% | ||||||||||||||
| Loans and Leases | |||||||||||||||||||||||||
| 3Q17 - 2Q17 | 3Q17 - 3Q16 | ||||||||||||||||||||||||
| (In millions) | 3Q17 | 2Q17 | 3Q16 | $ | % | $ | % | ||||||||||||||||||
| Loans held for sale | $ | 71 | $ | 53 | $ | 160 | $ | 18 | 34.0 | % | $ | (89 | ) | (55.6 | ) | ||||||||||
| Loans and leases: | |||||||||||||||||||||||||
| Commercial | 22,539 | 22,203 | 21,624 | 336 | 1.5 | 915 | 4.2 | ||||||||||||||||||
| Commercial real estate | 11,114 | 11,198 | 11,450 | (84 | ) | (0.8 | ) | (336 | ) | (2.9 | ) | ||||||||||||||
| Consumer | 10,503 | 10,282 | 9,466 | 221 | 2.1 | 1,037 | 11.0 | ||||||||||||||||||
| Loans and leases, net of unearned income and fees | 44,156 | 43,683 | 42,540 | 473 | 1.1 | 1,616 | 3.8 | ||||||||||||||||||
| Less allowance for loan losses | 541 | 544 | 597 | (3 | ) | (0.6 | ) | (56 | ) | (9.4 | ) | ||||||||||||||
| Loans held for investment, net of allowance | $ | 43,615 | $ | 43,139 | $ | 41,943 | $ | 476 | 1.1 | $ | 1,672 | 4.0 | |||||||||||||
| Deposits | |||||||||||||||||||||||||
| 3Q17 - 2Q17 | 3Q17 - 3Q16 | ||||||||||||||||||||||||
| (In millions) | 3Q17 | 2Q17 | 3Q16 | $ | % | $ | % | ||||||||||||||||||
| Noninterest-bearing demand | $ | 24,011 | $ | 24,172 | $ | 22,711 | $ | (161 | ) | (0.7 | )% | $ | 1,300 | 5.7 | % | ||||||||||
| Interest-bearing: | |||||||||||||||||||||||||
| Savings and money market | 25,179 | 25,165 | 25,503 | 14 | 0.1 | (324 | ) | (1.3 | ) | ||||||||||||||||
| Time | 2,909 | 3,041 | 2,516 | (132 | ) | (4.3 | ) | 393 | 15.6 | ||||||||||||||||
| Foreign | — | — | 119 | — | NM | (119 | ) | (100.0 | ) | ||||||||||||||||
| Total deposits | $ | 52,099 | $ | 52,378 | $ | 50,849 | $ | (279 | ) | (0.5 | ) | $ | 1,250 | 2.5 | |||||||||||
| Shareholders’ Equity | |||||||||||||||||||||||||
| 3Q17 - 2Q17 | 3Q17 - 3Q16 | ||||||||||||||||||||||||
| (In millions) | 3Q17 | 2Q17 | 3Q16 | $ | % | $ | % | ||||||||||||||||||
| Shareholders’ equity: | |||||||||||||||||||||||||
| Preferred Stock | $ | 566 | $ | 566 | $ | 710 | $ | — | — | % | $ | (144 | ) | (20.3 | )% | ||||||||||
| Common Stock | 4,552 | 4,660 | 4,748 | (108 | ) | (2.3 | ) | (196 | ) | (4.1 | ) | ||||||||||||||
| Retained earnings | 2,700 | 2,572 | 2,212 | 128 | 5.0 | 488 | 22.1 | ||||||||||||||||||
| Accumulated other comprehensive income (loss) | (57 | ) | (49 | ) | 9 | (8 | ) | (16.3 | ) | (66 | ) | (733.3 | ) | ||||||||||||
| Total shareholders' equity | $ | 7,761 | $ | 7,749 | $ | 7,679 | $ | 12 | 0.2 | $ | 82 | 1.1 | |||||||||||||
| Three Months Ended | |||||||||||||||||||
| (In millions, except share, per share, and ratio data) | September 30, 2017 | June 30, 2017 | March 31, 2017 | December 31, 2016 | September 30, 2016 | ||||||||||||||
BALANCE SHEET 1 | |||||||||||||||||||
| Loans held for investment, net of allowance | $ | 43,615 | $ | 43,139 | $ | 42,198 | $ | 42,082 | $ | 41,943 | |||||||||
| Total assets | 65,564 | 65,446 | 65,463 | 63,239 | 61,039 | ||||||||||||||
| Deposits | 52,099 | 52,378 | 53,475 | 53,236 | 50,849 | ||||||||||||||
| Total shareholders’ equity | 7,761 | 7,749 | 7,730 | 7,634 | 7,679 | ||||||||||||||
| STATEMENT OF INCOME | |||||||||||||||||||
| Net earnings applicable to common shareholders | $ | 152 | $ | 154 | $ | 129 | $ | 125 | $ | 117 | |||||||||
| Net interest income | 522 | 528 | 489 | 480 | 469 | ||||||||||||||
Taxable-equivalent net interest income 2 | 531 | 537 | 497 | 488 | 476 | ||||||||||||||
| Total noninterest income | 139 | 132 | 132 | 128 | 145 | ||||||||||||||
| Total noninterest expense | 413 | 405 | 414 | 404 | 403 | ||||||||||||||
Adjusted pre-provision net revenue 2 | 251 | 268 | 213 | 217 | 209 | ||||||||||||||
| Provision for loan losses | 5 | 7 | 23 | (3 | ) | 19 | |||||||||||||
| Provision for unfunded lending commitments | (4 | ) | 3 | (5 | ) | 3 | (3 | ) | |||||||||||
| Provision for credit losses | 1 | 10 | 18 | — | 16 | ||||||||||||||
| PER COMMON SHARE | |||||||||||||||||||
| Net earnings per diluted common share | $ | 0.72 | $ | 0.73 | $ | 0.61 | $ | 0.60 | $ | 0.57 | |||||||||
| Dividends | 0.12 | 0.08 | 0.08 | 0.08 | 0.08 | ||||||||||||||
Book value per common share 1 | 36.03 | 35.54 | 34.65 | 34.09 | 34.19 | ||||||||||||||
Tangible book value per common share 1, 2 | 30.93 | 30.50 | 29.61 | 29.06 | 29.16 | ||||||||||||||
| SELECTED RATIOS AND OTHER DATA | |||||||||||||||||||
| Return on average assets | 0.97 | % | 1.03 | % | 0.88 | % | 0.88 | % | 0.84 | % | |||||||||
| Return on average common equity | 8.3 | % | 8.6 | % | 7.5 | % | 7.1 | % | 6.7 | % | |||||||||
Tangible return on average tangible common equity 2 | 9.8 | % | 10.2 | % | 8.8 | % | 8.4 | % | 7.9 | % | |||||||||
| Net interest margin | 3.45 | % | 3.52 | % | 3.38 | % | 3.37 | % | 3.36 | % | |||||||||
Efficiency ratio 2 | 62.3 | % | 59.8 | % | 65.9 | % | 64.5 | % | 65.9 | % | |||||||||
| Effective tax rate | 34.2 | % | 32.3 | % | 24.5 | % | 33.8 | % | 33.9 | % | |||||||||
| Ratio of nonperforming assets to loans and leases and other real estate owned | 1.06 | % | 1.12 | % | 1.37 | % | 1.34 | % | 1.37 | % | |||||||||
| Annualized ratio of net loan and lease charge-offs to average loans | 0.07 | % | 0.06 | % | 0.43 | % | 0.25 | % | 0.28 | % | |||||||||
Ratio of total allowance for credit losses to loans and leases outstanding 1 | 1.36 | % | 1.39 | % | 1.41 | % | 1.48 | % | 1.55 | % | |||||||||
| Full-time equivalent employees | 10,041 | 10,074 | 10,004 | 10,057 | 9,968 | ||||||||||||||
CAPITAL RATIOS 1 | |||||||||||||||||||
| Tangible common equity ratio | 9.57 | % | 9.57 | % | 9.31 | % | 9.49 | % | 9.91 | % | |||||||||
Basel III: 3 | |||||||||||||||||||
| Common equity tier 1 capital | 12.2 | % | 12.3 | % | 12.2 | % | 12.1 | % | 12.0 | % | |||||||||
| Tier 1 leverage | 10.6 | % | 10.5 | % | 10.8 | % | 11.1 | % | 11.3 | % | |||||||||
| Tier 1 risk-based capital | 13.3 | % | 13.4 | % | 13.6 | % | 13.5 | % | 13.5 | % | |||||||||
| Total risk-based capital | 15.0 | % | 15.1 | % | 15.3 | % | 15.2 | % | 15.3 | % | |||||||||
| Risk-weighted assets | $ | 51,044 | $ | 50,575 | $ | 50,016 | $ | 49,937 | $ | 49,318 | |||||||||
| Weighted average common and common-equivalent shares outstanding (in thousands) | 209,106 | 208,183 | 210,405 | 205,446 | 204,714 | ||||||||||||||
Common shares outstanding (in thousands) 1 | 199,712 | 202,131 | 202,595 | 203,085 | 203,850 | ||||||||||||||
1 | At period end. |
2 | For information on non-GAAP financial measures, see pages 16-19. |
3 | Basel III capital ratios became effective January 1, 2015 and are based on the applicable phase-in periods. Current period ratios and amounts represent estimates. |
| (In millions, shares in thousands) | September 30, 2017 | June 30, 2017 | March 31, 2017 | December 31, 2016 | September 30, 2016 | ||||||||||||||
| (Unaudited) | (Unaudited) | (Unaudited) | (Unaudited) | ||||||||||||||||
| ASSETS | |||||||||||||||||||
| Cash and due from banks | $ | 541 | $ | 481 | $ | 566 | $ | 737 | $ | 553 | |||||||||
| Money market investments: | |||||||||||||||||||
| Interest-bearing deposits | 765 | 1,167 | 1,761 | 1,411 | 1,489 | ||||||||||||||
| Federal funds sold and security resell agreements | 467 | 427 | 363 | 568 | 1,676 | ||||||||||||||
| Investment securities: | |||||||||||||||||||
| Held-to-maturity, at amortized cost (approximate fair value $743, $774, $803, $850 and $718) | 746 | 775 | 815 | 868 | 715 | ||||||||||||||
| Available-for-sale, at fair value | 15,242 | 15,341 | 15,606 | 13,372 | 10,358 | ||||||||||||||
| Trading account, at fair value | 56 | 61 | 40 | 115 | 108 | ||||||||||||||
| Total investment securities | 16,044 | 16,177 | 16,461 | 14,355 | 11,181 | ||||||||||||||
| Loans held for sale | 71 | 53 | 128 | 172 | 160 | ||||||||||||||
| Loans and leases, net of unearned income and fees | 44,156 | 43,683 | 42,742 | 42,649 | 42,540 | ||||||||||||||
| Less allowance for loan losses | 541 | 544 | 544 | 567 | 597 | ||||||||||||||
| Loans held for investment, net of allowance | 43,615 | 43,139 | 42,198 | 42,082 | 41,943 | ||||||||||||||
| Other noninterest-bearing investments | 1,008 | 1,012 | 973 | 884 | 894 | ||||||||||||||
| Premises, equipment and software, net | 1,083 | 1,069 | 1,047 | 1,020 | 987 | ||||||||||||||
| Goodwill | 1,014 | 1,014 | 1,014 | 1,014 | 1,014 | ||||||||||||||
| Core deposit and other intangibles | 3 | 5 | 7 | 8 | 10 | ||||||||||||||
| Other real estate owned | 3 | 4 | 3 | 4 | 8 | ||||||||||||||
| Other assets | 950 | 898 | 942 | 984 | 1,124 | ||||||||||||||
| Total assets | $ | 65,564 | $ | 65,446 | $ | 65,463 | $ | 63,239 | $ | 61,039 | |||||||||
| LIABILITIES AND SHAREHOLDERS’ EQUITY | |||||||||||||||||||
| Deposits: | |||||||||||||||||||
| Noninterest-bearing demand | $ | 24,011 | $ | 24,172 | $ | 24,410 | $ | 24,115 | $ | 22,711 | |||||||||
| Interest-bearing: | |||||||||||||||||||
| Savings and money market | 25,179 | 25,165 | 26,071 | 26,364 | 25,503 | ||||||||||||||
| Time | 2,909 | 3,041 | 2,994 | 2,757 | 2,516 | ||||||||||||||
| Foreign | — | — | — | — | 119 | ||||||||||||||
| Total deposits | 52,099 | 52,378 | 53,475 | 53,236 | 50,849 | ||||||||||||||
| Federal funds and other short-term borrowings | 4,624 | 4,342 | 3,137 | 827 | 1,116 | ||||||||||||||
| Long-term debt | 383 | 383 | 383 | 535 | 570 | ||||||||||||||
| Reserve for unfunded lending commitments | 59 | 63 | 60 | 65 | 62 | ||||||||||||||
| Other liabilities | 638 | 531 | 678 | 942 | 763 | ||||||||||||||
| Total liabilities | 57,803 | 57,697 | 57,733 | 55,605 | 53,360 | ||||||||||||||
| Shareholders’ equity: | |||||||||||||||||||
| Preferred stock, without par value, authorized 4,400 shares | 566 | 566 | 710 | 710 | 710 | ||||||||||||||
| Common stock, without par value; authorized 350,000 shares; issued and outstanding 199,712, 202,131, 202,595, 203,085, and 203,850 shares | 4,552 | 4,660 | 4,696 | 4,725 | 4,748 | ||||||||||||||
| Retained earnings | 2,700 | 2,572 | 2,435 | 2,321 | 2,212 | ||||||||||||||
| Accumulated other comprehensive income (loss) | (57 | ) | (49 | ) | (111 | ) | (122 | ) | 9 | ||||||||||
| Total shareholders’ equity | 7,761 | 7,749 | 7,730 | 7,634 | 7,679 | ||||||||||||||
| Total liabilities and shareholders’ equity | $ | 65,564 | $ | 65,446 | $ | 65,463 | $ | 63,239 | $ | 61,039 | |||||||||
| Three Months Ended | |||||||||||||||||||
| (In millions, except share and per share amounts) | September 30, 2017 | June 30, 2017 | March 31, 2017 | December 31, 2016 | September 30, 2016 | ||||||||||||||
| Interest income: | |||||||||||||||||||
| Interest and fees on loans | $ | 468 | $ | 469 | $ | 433 | $ | 438 | $ | 437 | |||||||||
| Interest on money market investments | 5 | 5 | 4 | 4 | 5 | ||||||||||||||
| Interest on securities | 84 | 84 | 78 | 59 | 49 | ||||||||||||||
| Total interest income | 557 | 558 | 515 | 501 | 491 | ||||||||||||||
| Interest expense: | |||||||||||||||||||
| Interest on deposits | 15 | 14 | 13 | 13 | 13 | ||||||||||||||
| Interest on short- and long-term borrowings | 20 | 16 | 13 | 8 | 9 | ||||||||||||||
| Total interest expense | 35 | 30 | 26 | 21 | 22 | ||||||||||||||
| Net interest income | 522 | 528 | 489 | 480 | 469 | ||||||||||||||
| Provision for loan losses | 5 | 7 | 23 | (3 | ) | 19 | |||||||||||||
| Net interest income after provision for loan losses | 517 | 521 | 466 | 483 | 450 | ||||||||||||||
| Noninterest income: | |||||||||||||||||||
| Service charges and fees on deposit accounts | 42 | 43 | 42 | 43 | 45 | ||||||||||||||
| Other service charges, commissions and fees | 55 | 56 | 49 | 52 | 54 | ||||||||||||||
| Wealth management income | 11 | 10 | 10 | 11 | 10 | ||||||||||||||
| Loan sales and servicing income | 6 | 6 | 7 | 6 | 11 | ||||||||||||||
| Capital markets and foreign exchange | 8 | 6 | 7 | 6 | 6 | ||||||||||||||
| Customer-related fees | 122 | 121 | 115 | 118 | 126 | ||||||||||||||
| Dividends and other investment income | 9 | 10 | 12 | 4 | 9 | ||||||||||||||
| Securities gains (losses), net | 5 | 2 | 5 | (3 | ) | 8 | |||||||||||||
| Other | 3 | (1 | ) | — | 9 | 2 | |||||||||||||
| Total noninterest income | 139 | 132 | 132 | 128 | 145 | ||||||||||||||
| Noninterest expense: | |||||||||||||||||||
| Salaries and employee benefits | 253 | 242 | 262 | 241 | 242 | ||||||||||||||
| Occupancy, net | 35 | 32 | 33 | 32 | 33 | ||||||||||||||
| Furniture, equipment and software, net | 32 | 32 | 32 | 33 | 29 | ||||||||||||||
| Other real estate expense, net | (1 | ) | — | — | — | — | |||||||||||||
| Credit-related expense | 7 | 8 | 8 | 7 | 7 | ||||||||||||||
| Provision for unfunded lending commitments | (4 | ) | 3 | (5 | ) | 3 | (3 | ) | |||||||||||
| Professional and legal services | 14 | 13 | 14 | 17 | 14 | ||||||||||||||
| Advertising | 6 | 6 | 5 | 5 | 6 | ||||||||||||||
| FDIC premiums | 15 | 13 | 12 | 11 | 12 | ||||||||||||||
| Amortization of core deposit and other intangibles | 2 | 2 | 2 | 2 | 2 | ||||||||||||||
| Other | 54 | 54 | 51 | 53 | 61 | ||||||||||||||
| Total noninterest expense | 413 | 405 | 414 | 404 | 403 | ||||||||||||||
| Income before income taxes | 243 | 248 | 184 | 207 | 192 | ||||||||||||||
| Income taxes | 83 | 80 | 45 | 70 | 65 | ||||||||||||||
| Net income | 160 | 168 | 139 | 137 | 127 | ||||||||||||||
| Preferred stock dividends | (8 | ) | (12 | ) | (10 | ) | (12 | ) | (10 | ) | |||||||||
| Preferred stock redemption | — | (2 | ) | — | — | — | |||||||||||||
| Net earnings applicable to common shareholders | $ | 152 | $ | 154 | $ | 129 | $ | 125 | $ | 117 | |||||||||
| Weighted average common shares outstanding during the period: | |||||||||||||||||||
| Basic shares (in thousands) | 200,332 | 201,822 | 202,347 | 202,886 | 204,312 | ||||||||||||||
| Diluted shares (in thousands) | 209,106 | 208,183 | 210,405 | 205,446 | 204,714 | ||||||||||||||
| Net earnings per common share: | |||||||||||||||||||
| Basic | $ | 0.75 | $ | 0.76 | $ | 0.63 | $ | 0.61 | $ | 0.57 | |||||||||
| Diluted | 0.72 | 0.73 | 0.61 | 0.60 | 0.57 | ||||||||||||||
| (In millions) | September 30, 2017 | June 30, 2017 | March 31, 2017 | December 31, 2016 | September 30, 2016 | ||||||||||||||
| Commercial: | |||||||||||||||||||
| Commercial and industrial | $ | 14,041 | $ | 13,850 | $ | 13,368 | $ | 13,452 | $ | 13,543 | |||||||||
| Leasing | 343 | 387 | 404 | 423 | 439 | ||||||||||||||
| Owner occupied | 7,082 | 7,095 | 6,973 | 6,962 | 6,889 | ||||||||||||||
| Municipal | 1,073 | 871 | 811 | 778 | 753 | ||||||||||||||
| Total commercial | 22,539 | 22,203 | 21,556 | 21,615 | 21,624 | ||||||||||||||
| Commercial real estate: | |||||||||||||||||||
| Construction and land development | 2,170 | 2,186 | 2,123 | 2,019 | 2,147 | ||||||||||||||
| Term | 8,944 | 9,012 | 9,083 | 9,322 | 9,303 | ||||||||||||||
| Total commercial real estate | 11,114 | 11,198 | 11,206 | 11,341 | 11,450 | ||||||||||||||
| Consumer: | |||||||||||||||||||
| Home equity credit line | 2,745 | 2,697 | 2,638 | 2,645 | 2,581 | ||||||||||||||
| 1-4 family residential | 6,522 | 6,359 | 6,185 | 5,891 | 5,785 | ||||||||||||||
| Construction and other consumer real estate | 558 | 560 | 517 | 486 | 453 | ||||||||||||||
| Bankcard and other revolving plans | 490 | 478 | 459 | 481 | 458 | ||||||||||||||
| Other | 188 | 188 | 181 | 190 | 189 | ||||||||||||||
| Total consumer | 10,503 | 10,282 | 9,980 | 9,693 | 9,466 | ||||||||||||||
| Loans and leases, net of unearned income and fees | $ | 44,156 | $ | 43,683 | $ | 42,742 | $ | 42,649 | $ | 42,540 | |||||||||
| (In millions) | September 30, 2017 | June 30, 2017 | March 31, 2017 | December 31, 2016 | September 30, 2016 | ||||||||||||||
Nonaccrual loans1 | $ | 465 | $ | 486 | $ | 585 | $ | 569 | $ | 579 | |||||||||
| Other real estate owned | 3 | 4 | 3 | 4 | 8 | ||||||||||||||
| Total nonperforming assets | $ | 468 | $ | 490 | $ | 588 | $ | 573 | $ | 587 | |||||||||
Ratio of nonperforming assets to loans1 and leases and other real estate owned | 1.06 | % | 1.12 | % | 1.37 | % | 1.34 | % | 1.37 | % | |||||||||
| Accruing loans past due 90 days or more | $ | 30 | $ | 19 | $ | 30 | $ | 36 | $ | 29 | |||||||||
Ratio of accruing loans past due 90 days or more to loans1 and leases | 0.07 | % | 0.04 | % | 0.07 | % | 0.08 | % | 0.07 | % | |||||||||
| Nonaccrual loans and accruing loans past due 90 days or more | $ | 495 | $ | 505 | $ | 615 | $ | 605 | $ | 608 | |||||||||
Ratio of nonaccrual loans and accruing loans past due 90 days or more to loans1 and leases | 1.12 | % | 1.15 | % | 1.43 | % | 1.41 | % | 1.42 | % | |||||||||
| Accruing loans past due 30-89 days | $ | 99 | $ | 98 | $ | 137 | $ | 126 | $ | 164 | |||||||||
| Restructured loans included in nonaccrual loans | 115 | 137 | 131 | 100 | 125 | ||||||||||||||
| Restructured loans on accrual | 133 | 167 | 167 | 151 | 170 | ||||||||||||||
| Classified loans | 1,248 | 1,317 | 1,464 | 1,577 | 1,615 | ||||||||||||||
| Three Months Ended | |||||||||||||||||||
| (In millions) | September 30, 2017 | June 30, 2017 | March 31, 2017 | December 31, 2016 | September 30, 2016 | ||||||||||||||
| Allowance for Loan Losses | |||||||||||||||||||
| Balance at beginning of period | $ | 544 | $ | 544 | $ | 567 | $ | 597 | $ | 608 | |||||||||
| Add: | |||||||||||||||||||
| Provision for losses | 5 | 7 | 23 | (3 | ) | 19 | |||||||||||||
| Deduct: | |||||||||||||||||||
| Gross loan and lease charge-offs | (25 | ) | (35 | ) | (57 | ) | (38 | ) | (54 | ) | |||||||||
| Recoveries | 17 | 28 | 11 | 11 | 24 | ||||||||||||||
| Net loan and lease charge-offs | (8 | ) | (7 | ) | (46 | ) | (27 | ) | (30 | ) | |||||||||
| Balance at end of period | $ | 541 | $ | 544 | $ | 544 | $ | 567 | $ | 597 | |||||||||
Ratio of allowance for loan losses to loans1 and leases, at period end | 1.23 | % | 1.25 | % | 1.27 | % | 1.33 | % | 1.40 | % | |||||||||
Ratio of allowance for loan losses to nonaccrual loans1 at period end | 120 | % | 115 | % | 99 | % | 107 | % | 109 | % | |||||||||
| Annualized ratio of net loan and lease charge-offs to average loans | 0.07 | % | 0.06 | % | 0.43 | % | 0.25 | % | 0.28 | % | |||||||||
| Reserve for Unfunded Lending Commitments | |||||||||||||||||||
| Balance at beginning of period | $ | 63 | $ | 60 | $ | 65 | $ | 62 | $ | 65 | |||||||||
| Provision charged (credited) to earnings | (4 | ) | 3 | (5 | ) | 3 | (3 | ) | |||||||||||
| Balance at end of period | $ | 59 | $ | 63 | $ | 60 | $ | 65 | $ | 62 | |||||||||
| Total Allowance for Credit Losses | |||||||||||||||||||
| Allowance for loan losses | $ | 541 | $ | 544 | $ | 544 | $ | 567 | $ | 597 | |||||||||
| Reserve for unfunded lending commitments | 59 | 63 | 60 | 65 | 62 | ||||||||||||||
| Total allowance for credit losses | $ | 600 | $ | 607 | $ | 604 | $ | 632 | $ | 659 | |||||||||
Ratio of total allowance for credit losses to loans1 and leases outstanding, at period end | 1.36 | % | 1.39 | % | 1.41 | % | 1.48 | % | 1.55 | % | |||||||||
| (In millions) | September 30, 2017 | June 30, 2017 | March 31, 2017 | December 31, 2016 | September 30, 2016 | ||||||||||||||
| Loans held for sale | $ | 13 | $ | 12 | $ | 34 | $ | 40 | $ | 29 | |||||||||
| Commercial: | |||||||||||||||||||
| Commercial and industrial | $ | 257 | $ | 278 | $ | 358 | $ | 354 | $ | 387 | |||||||||
| Leasing | 8 | 10 | 13 | 14 | 14 | ||||||||||||||
| Owner occupied | 85 | 86 | 89 | 74 | 66 | ||||||||||||||
| Municipal | 1 | 1 | 1 | 1 | 1 | ||||||||||||||
| Total commercial | 351 | 375 | 461 | 443 | 468 | ||||||||||||||
| Commercial real estate: | |||||||||||||||||||
| Construction and land development | 6 | 6 | 7 | 7 | 4 | ||||||||||||||
| Term | 41 | 37 | 38 | 29 | 28 | ||||||||||||||
| Total commercial real estate | 47 | 43 | 45 | 36 | 32 | ||||||||||||||
| Consumer: | |||||||||||||||||||
| Home equity credit line | 11 | 11 | 9 | 11 | 11 | ||||||||||||||
| 1-4 family residential | 40 | 43 | 35 | 36 | 36 | ||||||||||||||
| Construction and other consumer real estate | 1 | 1 | 1 | 2 | 1 | ||||||||||||||
| Bankcard and other revolving plans | 1 | — | — | 1 | 2 | ||||||||||||||
| Other | 1 | 1 | — | — | — | ||||||||||||||
| Total consumer | 54 | 56 | 45 | 50 | 50 | ||||||||||||||
| Total nonaccrual loans | $ | 465 | $ | 486 | $ | 585 | $ | 569 | $ | 579 | |||||||||
| (In millions) | September 30, 2017 | June 30, 2017 | March 31, 2017 | December 31, 2016 | September 30, 2016 | ||||||||||||||
| Commercial: | |||||||||||||||||||
| Commercial and industrial | $ | 4 | $ | 11 | $ | 45 | $ | 25 | $ | 33 | |||||||||
| Leasing | — | — | — | — | — | ||||||||||||||
| Owner occupied | — | 2 | 1 | (1 | ) | — | |||||||||||||
| Municipal | — | — | — | — | — | ||||||||||||||
| Total commercial | 4 | 13 | 46 | 24 | 33 | ||||||||||||||
| Commercial real estate: | |||||||||||||||||||
| Construction and land development | — | (8 | ) | (2 | ) | — | (1 | ) | |||||||||||
| Term | 2 | — | 1 | 1 | (5 | ) | |||||||||||||
| Total commercial real estate | 2 | (8 | ) | (1 | ) | 1 | (6 | ) | |||||||||||
| Consumer: | |||||||||||||||||||
| Home equity credit line | — | 1 | (1 | ) | — | 1 | |||||||||||||
| 1-4 family residential | 1 | — | (1 | ) | — | — | |||||||||||||
| Construction and other consumer real estate | — | — | — | — | — | ||||||||||||||
| Bankcard and other revolving plans | — | 1 | 3 | 2 | 2 | ||||||||||||||
| Other | 1 | — | — | — | — | ||||||||||||||
| Total consumer loans | 2 | 2 | 1 | 2 | 3 | ||||||||||||||
| Total net charge-offs | $ | 8 | $ | 7 | $ | 46 | $ | 27 | $ | 30 | |||||||||
| September 30, 2017 | June 30, 2017 | September 30, 2016 | 3Q17 - 2Q17 | 3Q17 - 3Q16 | |||||||||||||||||||||
| (In millions) | $ | % | $ | % | |||||||||||||||||||||
| Loans and leases | |||||||||||||||||||||||||
| Upstream – exploration and production | $ | 784 | $ | 709 | $ | 752 | $ | 75 | 10.6 | % | $ | 32 | 4.3 | % | |||||||||||
| Midstream – marketing and transportation | 601 | 622 | 623 | (21 | ) | (3.4 | ) | (22 | ) | (3.5 | ) | ||||||||||||||
| Downstream – refining | 100 | 103 | 123 | (3 | ) | (2.9 | ) | (23 | ) | (18.7 | ) | ||||||||||||||
| Other non-services | 40 | 37 | 44 | 3 | 8.1 | (4 | ) | (9.1 | ) | ||||||||||||||||
| Oilfield services | 412 | 455 | 596 | (43 | ) | (9.5 | ) | (184 | ) | (30.9 | ) | ||||||||||||||
| Oil and gas service manufacturing | 109 | 136 | 176 | (27 | ) | (19.9 | ) | (67 | ) | (38.1 | ) | ||||||||||||||
Total loan and lease balances 2 | 2,046 | 2,062 | 2,314 | (16 | ) | (0.8 | ) | (268 | ) | (11.6 | ) | ||||||||||||||
| Unfunded lending commitments | 1,799 | 1,855 | 1,784 | (56 | ) | (3.0 | ) | 15 | 0.8 | ||||||||||||||||
| Total oil and gas credit exposure | $ | 3,845 | $ | 3,917 | $ | 4,098 | $ | (72 | ) | (1.8 | ) | $ | (253 | ) | (6.2 | ) | |||||||||
| Private equity investments | $ | 4 | $ | 4 | $ | 6 | $ | — | — | $ | (2 | ) | (33.3 | ) | |||||||||||
Credit quality measures 2 | |||||||||||||||||||||||||
| Criticized loan ratio | 29.8 | % | 33.1 | % | 41.8 | % | |||||||||||||||||||
| Classified loan ratio | 24.0 | % | 27.2 | % | 33.1 | % | |||||||||||||||||||
| Nonaccrual loan ratio | 10.2 | % | 12.1 | % | 15.0 | % | |||||||||||||||||||
| Ratio of nonaccrual loans that are current | 67.9 | % | 84.7 | % | 87.3 | % | |||||||||||||||||||
Net charge-off ratio, annualized 3 | 1.2 | % | 3.1 | % | 7.1 | % | |||||||||||||||||||
1 | Because many borrowers operate in multiple businesses, judgment has been applied in characterizing a borrower as oil and gas-related, including a particular segment of oil and gas-related activity, e.g., upstream or downstream; typically, 50% of revenues coming from the oil and gas sector is used as a guide. |
3 | Calculated as the ratio of annualized net charge-offs to the beginning loan balances for each respective period. |
| Three Months Ended | ||||||||||||||||||||
| September 30, 2017 | June 30, 2017 | September 30, 2016 | ||||||||||||||||||
| (In millions) | Average balance | Average yield/rate 1 | Average balance | Average yield/rate 1 | Average balance | Average yield/rate 1 | ||||||||||||||
| ASSETS | ||||||||||||||||||||
| Money market investments | $ | 1,246 | 1.44 | % | $ | 1,572 | 1.20 | % | $ | 3,140 | 0.63 | % | ||||||||
| Securities: | ||||||||||||||||||||
| Held-to-maturity | 750 | 3.96 | % | 788 | 3.97 | % | 706 | 4.33 | % | |||||||||||
| Available-for-sale | 15,197 | 2.12 | % | 15,386 | 2.11 | % | 9,698 | 1.82 | % | |||||||||||
| Trading account | 43 | 3.73 | % | 79 | 3.43 | % | 80 | 3.34 | % | |||||||||||
| Total securities | 15,990 | 2.21 | % | 16,253 | 2.20 | % | 10,484 | 2.00 | % | |||||||||||
| Loans held for sale | 52 | 4.29 | % | 100 | 3.23 | % | 133 | 3.34 | % | |||||||||||
Loans held for investment 2: | ||||||||||||||||||||
| Commercial | 22,261 | 4.36 | % | 21,885 | 4.44 | % | 21,816 | 4.19 | % | |||||||||||
| Commercial real estate | 11,192 | 4.46 | % | 11,236 | 4.74 | % | 11,331 | 4.19 | % | |||||||||||
| Consumer | 10,379 | 3.86 | % | 10,122 | 3.83 | % | 9,340 | 3.81 | % | |||||||||||
| Total loans held for investment | 43,832 | 4.27 | % | 43,243 | 4.38 | % | 42,487 | 4.11 | % | |||||||||||
| Total interest-earning assets | 61,120 | 3.67 | % | 61,168 | 3.72 | % | 56,244 | 3.52 | % | |||||||||||
| Cash and due from banks | 767 | 795 | 556 | |||||||||||||||||
| Allowance for loan losses | (540 | ) | (546 | ) | (609 | ) | ||||||||||||||
| Goodwill | 1,014 | 1,014 | 1,014 | |||||||||||||||||
| Core deposit and other intangibles | 4 | 6 | 11 | |||||||||||||||||
| Other assets | 2,974 | 2,974 | 2,846 | |||||||||||||||||
| Total assets | $ | 65,339 | $ | 65,411 | $ | 60,062 | ||||||||||||||
| LIABILITIES AND SHAREHOLDERS’ EQUITY | ||||||||||||||||||||
| Interest-bearing deposits: | ||||||||||||||||||||
| Savings and money market | $ | 25,190 | 0.16 | % | $ | 25,467 | 0.14 | % | $ | 25,683 | 0.15 | % | ||||||||
| Time | 2,933 | 0.70 | % | 3,048 | 0.66 | % | 2,409 | 0.51 | % | |||||||||||
| Foreign | — | — | 117 | 0.30 | % | |||||||||||||||
| Total interest-bearing deposits | 28,123 | 0.21 | % | 28,515 | 0.20 | % | 28,209 | 0.18 | % | |||||||||||
| Borrowed funds: | ||||||||||||||||||||
| Federal funds and other short-term borrowings | 4,609 | 1.17 | % | 4,302 | 0.94 | % | 343 | 0.22 | % | |||||||||||
| Long-term debt | 383 | 5.71 | % | 383 | 5.77 | % | 680 | 5.13 | % | |||||||||||
| Total borrowed funds | 4,992 | 1.52 | % | 4,685 | 1.34 | % | 1,023 | 3.48 | % | |||||||||||
| Total interest-bearing liabilities | 33,115 | 0.41 | % | 33,200 | 0.36 | % | 29,232 | 0.29 | % | |||||||||||
| Noninterest-bearing deposits | 23,798 | 23,819 | 22,466 | |||||||||||||||||
| Other liabilities | 630 | 565 | 668 | |||||||||||||||||
| Total liabilities | 57,543 | 57,584 | 52,366 | |||||||||||||||||
| Shareholders’ equity: | ||||||||||||||||||||
| Preferred equity | 566 | 684 | 710 | |||||||||||||||||
| Common equity | 7,230 | 7,143 | 6,986 | |||||||||||||||||
| Total shareholders’ equity | 7,796 | 7,827 | 7,696 | |||||||||||||||||
| Total liabilities and shareholders’ equity | $ | 65,339 | $ | 65,411 | $ | 60,062 | ||||||||||||||
| Spread on average interest-bearing funds | 3.26 | % | 3.36 | % | 3.23 | % | ||||||||||||||
| Net yield on interest-earning assets | 3.45 | % | 3.52 | % | 3.36 | % | ||||||||||||||
| (In millions, except shares and per share amounts) | September 30, 2017 | June 30, 2017 | March 31, 2017 | December 31, 2016 | September 30, 2016 | |||||||||||||||
| Tangible Book Value per Common Share | ||||||||||||||||||||
| Total shareholders’ equity (GAAP) | $ | 7,761 | $ | 7,749 | $ | 7,730 | $ | 7,634 | $ | 7,679 | ||||||||||
| Preferred stock | (566 | ) | (566 | ) | (710 | ) | (710 | ) | (710 | ) | ||||||||||
| Goodwill | (1,014 | ) | (1,014 | ) | (1,014 | ) | (1,014 | ) | (1,014 | ) | ||||||||||
| Core deposit and other intangibles | (3 | ) | (5 | ) | (7 | ) | (8 | ) | (10 | ) | ||||||||||
| Tangible common equity (non-GAAP) | (a) | $ | 6,178 | $ | 6,164 | $ | 5,999 | $ | 5,902 | $ | 5,945 | |||||||||
| Common shares outstanding (in thousands) | (b) | 199,712 | 202,131 | 202,595 | 203,085 | 203,850 | ||||||||||||||
| Tangible book value per common share (non-GAAP) | (a/b) | $ | 30.93 | $ | 30.50 | $ | 29.61 | $ | 29.06 | $ | 29.16 | |||||||||
| Three Months Ended | ||||||||||||||||||||
| (Dollar amounts in millions) | September 30, 2017 | June 30, 2017 | March 31, 2017 | December 31, 2016 | September 30, 2016 | |||||||||||||||
| Tangible Return on Average Tangible Common Equity | ||||||||||||||||||||
| Net earnings applicable to common shareholders (GAAP) | $ | 152 | $ | 154 | $ | 129 | $ | 125 | $ | 117 | ||||||||||
| Adjustments, net of tax: | ||||||||||||||||||||
| Amortization of core deposit and other intangibles | 1 | 1 | 1 | 1 | 1 | |||||||||||||||
| Net earnings applicable to common shareholders, excluding the effects of the adjustments, net of tax (non-GAAP) | (a) | $ | 153 | $ | 155 | $ | 130 | $ | 126 | $ | 118 | |||||||||
| Average common equity (GAAP) | $ | 7,230 | $ | 7,143 | $ | 6,996 | $ | 6,998 | $ | 6,986 | ||||||||||
| Average goodwill | (1,014 | ) | (1,014 | ) | (1,014 | ) | (1,014 | ) | (1,014 | ) | ||||||||||
| Average core deposit and other intangibles | (4 | ) | (6 | ) | (8 | ) | (10 | ) | (11 | ) | ||||||||||
| Average tangible common equity (non-GAAP) | (b) | $ | 6,212 | $ | 6,123 | $ | 5,974 | $ | 5,974 | $ | 5,961 | |||||||||
| Number of days in quarter | (c) | 92 | 91 | 90 | 92 | 92 | ||||||||||||||
| Number of days in year | (d) | 365 | 365 | 365 | 366 | 366 | ||||||||||||||
| Tangible return on average tangible common equity (non-GAAP) | (a/b/c)*d | 9.8 | % | 10.2 | % | 8.8 | % | 8.4 | % | 7.9 | % | |||||||||
| Three Months Ended | ||||||||||||||||||||
| (In millions) | September 30, 2017 | June 30, 2017 | March 31, 2017 | December 31, 2016 | September 30, 2016 | |||||||||||||||
| Efficiency Ratio | ||||||||||||||||||||
| Noninterest expense (GAAP) | (a) | $ | 413 | $ | 405 | $ | 414 | $ | 404 | $ | 403 | |||||||||
| Adjustments: | ||||||||||||||||||||
| Severance costs | 1 | — | 5 | 1 | — | |||||||||||||||
| Other real estate expense | (1 | ) | — | — | — | — | ||||||||||||||
| Provision for unfunded lending commitments | (4 | ) | 3 | (5 | ) | 3 | (3 | ) | ||||||||||||
| Amortization of core deposit and other intangibles | 2 | 2 | 2 | 2 | 2 | |||||||||||||||
Restructuring costs 1 | 1 | 1 | 1 | 3 | — | |||||||||||||||
| Total adjustments | (b) | (1 | ) | 6 | 3 | 9 | (1 | ) | ||||||||||||
| Adjusted noninterest expense (non-GAAP) | (a-b)=(c) | $ | 414 | $ | 399 | $ | 411 | $ | 395 | $ | 404 | |||||||||
| Net interest income (GAAP) | (d) | $ | 522 | $ | 528 | $ | 489 | $ | 480 | $ | 469 | |||||||||
| Fully taxable-equivalent adjustments | (e) | 9 | 9 | 8 | 8 | 7 | ||||||||||||||
| Taxable-equivalent net interest income (non-GAAP) | (d+e)=(f) | 531 | 537 | 497 | 488 | 476 | ||||||||||||||
| Noninterest income (GAAP) | (g) | 139 | 132 | 132 | 128 | 145 | ||||||||||||||
| Combined income (non-GAAP) | (f+g)=(h) | 670 | 669 | 629 | 616 | 621 | ||||||||||||||
| Adjustments: | ||||||||||||||||||||
| Fair value and nonhedge derivative income | — | — | — | 7 | — | |||||||||||||||
| Securities gains (losses), net | 5 | 2 | 5 | (3 | ) | 8 | ||||||||||||||
| Total adjustments | (i) | 5 | 2 | 5 | 4 | 8 | ||||||||||||||
| Adjusted taxable-equivalent revenue (non-GAAP) | (h-i)=(j) | $ | 665 | $ | 667 | $ | 624 | $ | 612 | $ | 613 | |||||||||
| Pre-provision net revenue (PPNR) | (h)-(a) | $ | 257 | $ | 264 | $ | 215 | $ | 212 | $ | 218 | |||||||||
| Adjusted PPNR (non-GAAP) | (j-c) | 251 | 268 | 213 | 217 | 209 | ||||||||||||||
| Efficiency ratio (non-GAAP) | (c/j) | 62.3 | % | 59.8 | % | 65.9 | % | 64.5 | % | 65.9 | % | |||||||||
| Nine Months Ended | |||||||||
| (In millions) | September 30, 2017 | September 30, 2016 | |||||||
| Efficiency Ratio | |||||||||
| Noninterest expense (GAAP) | (a) | $ | 1,232 | $ | 1,181 | ||||
| Adjustments: | |||||||||
| Severance costs | 6 | 7 | 4 | ||||||
| Other real estate expense | (1 | ) | (2 | ) | |||||
| Provision for unfunded lending commitments | (6 | ) | (13 | ) | |||||
| Amortization of core deposit and other intangibles | 5 | 4 | 6 | ||||||
| Restructuring costs | 3 | 2 | 1 | ||||||
| Total adjustments | (b) | 7 | (4 | ) | |||||
| Adjusted noninterest expense (non-GAAP) | (a-b)=(c) | $ | 1,225 | $ | 1,185 | ||||
| Net interest income (GAAP) | (d) | $ | 1,539 | $ | 1,386 | ||||
| Fully taxable-equivalent adjustments | (e) | 26 | 19 | ||||||
| Taxable-equivalent net interest income (non-GAAP) | (d+e)=(f) | 1,565 | 1,405 | ||||||
| Noninterest income (GAAP) | (g) | 404 | 388 | ||||||
| Combined income (non-GAAP) | (f+g)=(h) | 1,969 | 1,793 | ||||||
| Adjustments: | |||||||||
| Fair value and nonhedge derivative loss | (1 | ) | (5 | ) | |||||
| Securities gains, net | 13 | 11 | |||||||
| Total adjustments | (i) | 12 | 6 | ||||||
| Adjusted taxable-equivalent revenue (non-GAAP) | (h-i)=(j) | $ | 1,957 | $ | 1,787 | ||||
| Pre-provision net revenue (PPNR) | (h)-(a) | $ | 737 | $ | 612 | ||||
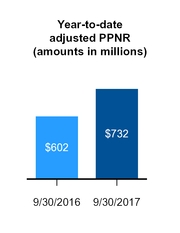
| Adjusted PPNR (non-GAAP) | (j-c) | 732 | 602 | ||||||
| Efficiency ratio (non-GAAP) | (c/j) | 62.6 | % | 66.3 | % | ||||