
Fourth Quarter 2017 Financial Update November 29, 2017
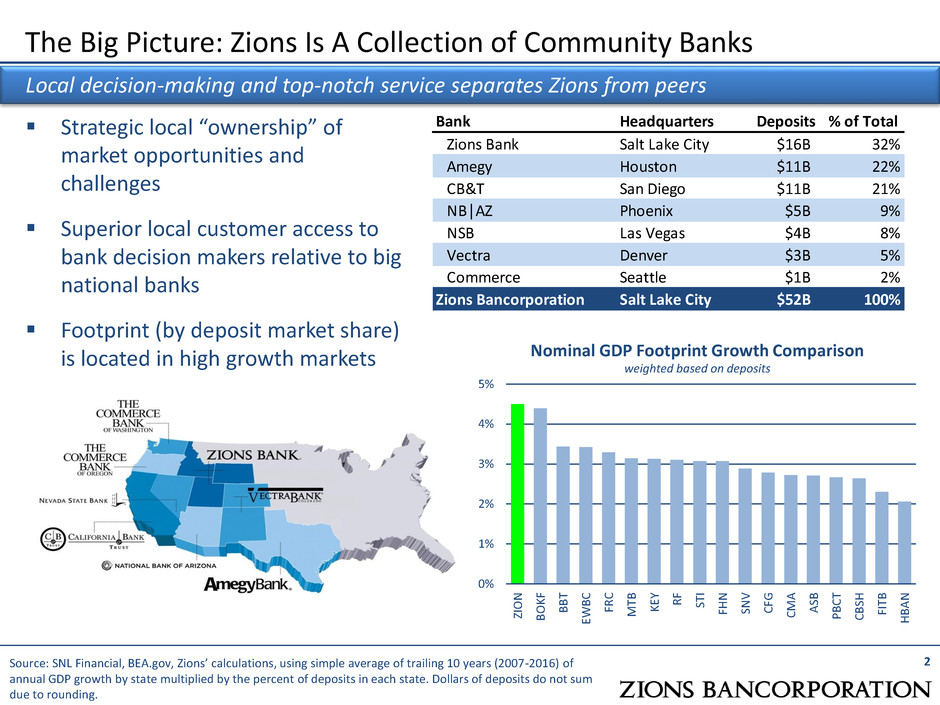
2 Local decision-making and top-notch service separates Zions from peers Source: SNL Financial, BEA.gov, Zions’ calculations, using simple average of trailing 10 years (2007-2016) of annual GDP growth by state multiplied by the percent of deposits in each state. Dollars of deposits do not sum due to rounding. Strategic local “ownership” of market opportunities and challenges Superior local customer access to bank decision makers relative to big national banks Footprint (by deposit market share) is located in high growth markets 0% 1% 2% 3% 4% 5% ZI O N B O K F B B T EWB C FR C M TB K EY R F ST I FH N SN V C FG C M A A SB PB C T C B SH FI TB H BA N Nominal GDP Footprint Growth Comparison weighted based on deposits Bank Headquarters Deposits % of Total Zions Bank Salt Lake City $16B 32% Amegy Houston $11B 22% CB&T San Diego $11B 21% NB│AZ Phoenix $5B 9% NSB Las Vegas $4B 8% Vectra Denver $3B 5% Commerce Seattle $1B 2% Zions Bancorporation Salt Lake City $52B 100% The Big Picture: Zions Is A Collection of Community Banks
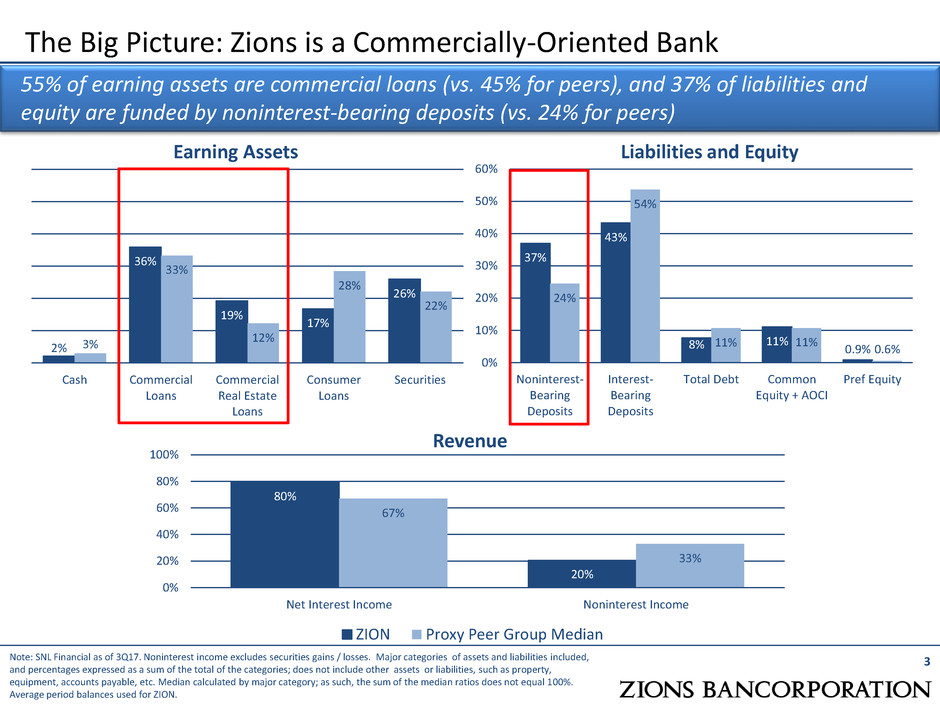
The Big Picture: Zions is a Commercially-Oriented Bank Earning Assets Liabilities and Equity 3 55% of earning assets are commercial loans (vs. 45% for peers), and 37% of liabilities and equity are funded by noninterest-bearing deposits (vs. 24% for peers) 2% 36% 19% 17% 26% 3% 33% 12% 28% 22% Cash Commercial Loans Commercial Real Estate Loans Consumer Loans Securities 37% 43% 8% 11% 0.9% 24% 54% 11% 11% 0.6% 0% 10% 20% 30% 40% 50% 60% Noninterest- Bearing Deposits Interest- Bearing Deposits Total Debt Common Equity + AOCI Pref Equity Revenue 80% 20% 67% 33% 0% 20% 40% 60% 80% 100% Net Interest Income Noninterest Income ZION Proxy Peer Group Median Note: SNL Financial as of 3Q17. Noninterest income excludes securities gains / losses. Major categories of assets and liabilities included, and percentages expressed as a sum of the total of the categories; does not include other assets or liabilities, such as property, equipment, accounts payable, etc. Median calculated by major category; as such, the sum of the median ratios does not equal 100%. Average period balances used for ZION.
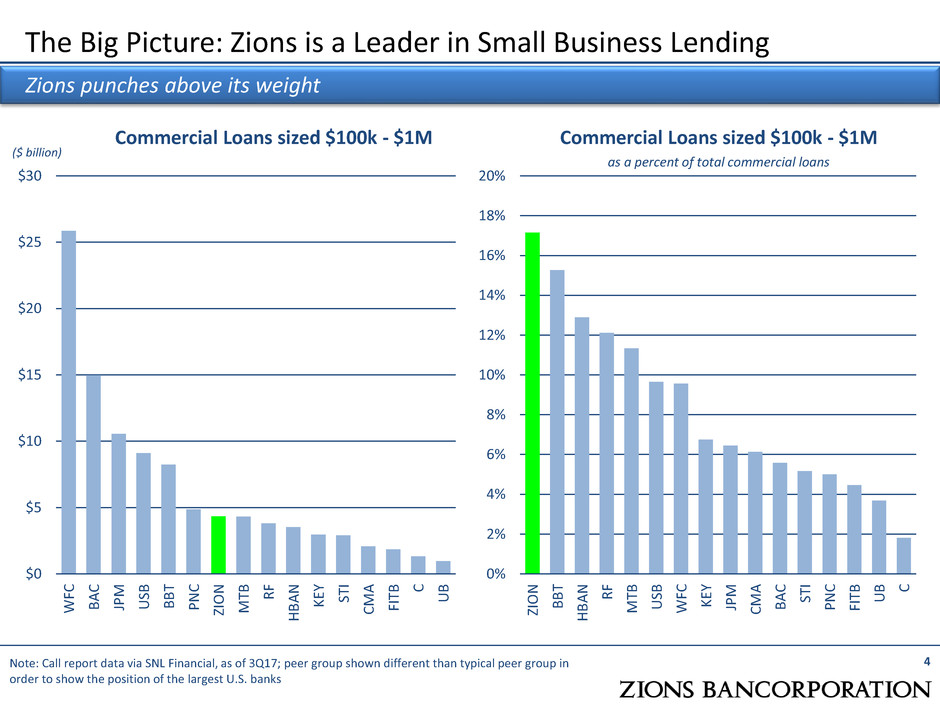
The Big Picture: Zions is a Leader in Small Business Lending Commercial Loans sized $100k - $1M Commercial Loans sized $100k - $1M as a percent of total commercial loans 4 0% 2% 4% 6% 8% 10% 12% 14% 16% 18% 20% ZIO N B B T H B A N R F M TB US B WF C KE Y JP M CM A B A C ST I P N C FIT B U B C Note: Call report data via SNL Financial, as of 3Q17; peer group shown different than typical peer group in order to show the position of the largest U.S. banks $0 $5 $10 $15 $20 $25 $30 WF C B A C JP M US B B B T P N C ZIO N M TB R F H B A N KE Y ST I CM A FIT B C U B Zions punches above its weight ($ billion)
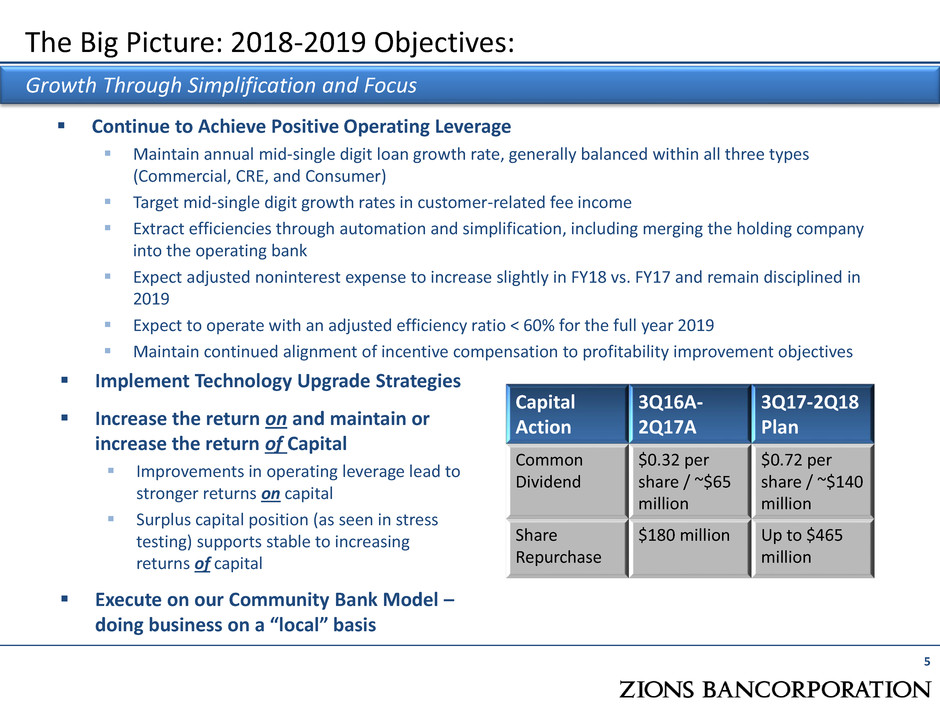
Continue to Achieve Positive Operating Leverage Maintain annual mid-single digit loan growth rate, generally balanced within all three types (Commercial, CRE, and Consumer) Target mid-single digit growth rates in customer-related fee income Extract efficiencies through automation and simplification, including merging the holding company into the operating bank Expect adjusted noninterest expense to increase slightly in FY18 vs. FY17 and remain disciplined in 2019 Expect to operate with an adjusted efficiency ratio < 60% for the full year 2019 Maintain continued alignment of incentive compensation to profitability improvement objectives 5 The Big Picture: 2018-2019 Objectives: Growth Through Simplification and Focus Implement Technology Upgrade Strategies Increase the return on and maintain or increase the return of Capital Improvements in operating leverage lead to stronger returns on capital Surplus capital position (as seen in stress testing) supports stable to increasing returns of capital Execute on our Community Bank Model – doing business on a “local” basis Capital Action 3Q16A- 2Q17A 3Q17-2Q18 Plan Common Dividend $0.32 per share / ~$65 million $0.72 per share / ~$140 million Share Repurchase $180 million Up to $465 million
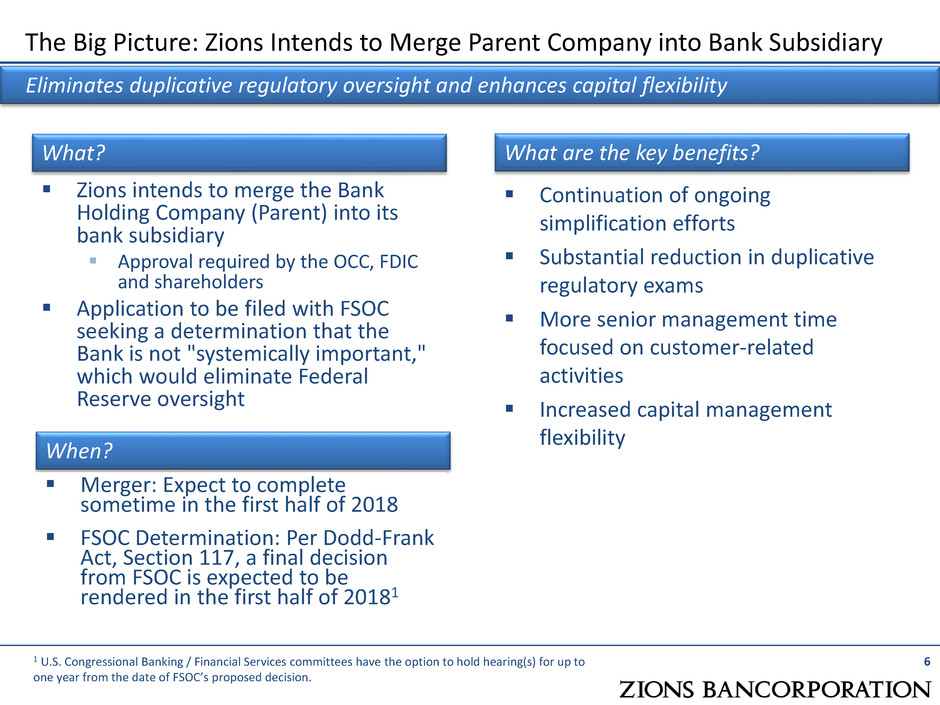
6 The Big Picture: Zions Intends to Merge Parent Company into Bank Subsidiary Eliminates duplicative regulatory oversight and enhances capital flexibility Zions intends to merge the Bank Holding Company (Parent) into its bank subsidiary Approval required by the OCC, FDIC and shareholders Application to be filed with FSOC seeking a determination that the Bank is not "systemically important," which would eliminate Federal Reserve oversight Continuation of ongoing simplification efforts Substantial reduction in duplicative regulatory exams More senior management time focused on customer-related activities Increased capital management flexibility 1 U.S. Congressional Banking / Financial Services committees have the option to hold hearing(s) for up to one year from the date of FSOC’s proposed decision. What? When? Merger: Expect to complete sometime in the first half of 2018 FSOC Determination: Per Dodd-Frank Act, Section 117, a final decision from FSOC is expected to be rendered in the first half of 20181 What are the key benefits?
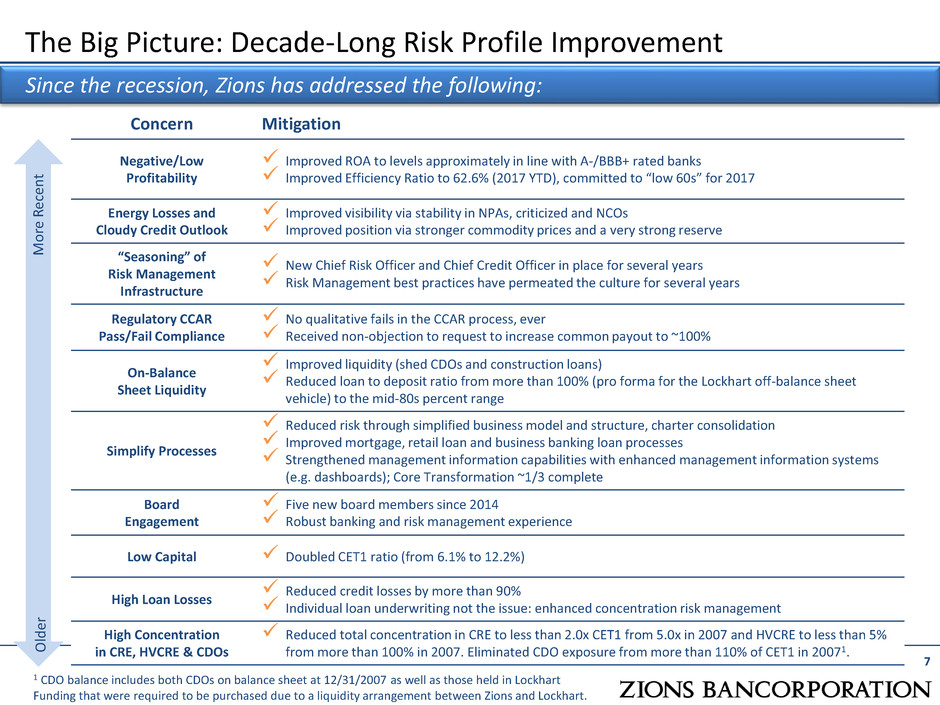
The Big Picture: Decade-Long Risk Profile Improvement 7 Since the recession, Zions has addressed the following: Concern Mitigation Negative/Low Profitability Improved ROA to levels approximately in line with A-/BBB+ rated banks Improved Efficiency Ratio to 62.6% (2017 YTD), committed to “low 60s” for 2017 Energy Losses and Cloudy Credit Outlook Improved visibility via stability in NPAs, criticized and NCOs Improved position via stronger commodity prices and a very strong reserve “Seasoning” of Risk Management Infrastructure New Chief Risk Officer and Chief Credit Officer in place for several years Risk Management best practices have permeated the culture for several years Regulatory CCAR Pass/Fail Compliance No qualitative fails in the CCAR process, ever Received non-objection to request to increase common payout to ~100% On-Balance Sheet Liquidity Improved liquidity (shed CDOs and construction loans) Reduced loan to deposit ratio from more than 100% (pro forma for the Lockhart off-balance sheet vehicle) to the mid-80s percent range Simplify Processes Reduced risk through simplified business model and structure, charter consolidation Improved mortgage, retail loan and business banking loan processes Strengthened management information capabilities with enhanced management information systems (e.g. dashboards); Core Transformation ~1/3 complete Board Engagement Five new board members since 2014 Robust banking and risk management experience Low Capital Doubled CET1 ratio (from 6.1% to 12.2%) High Loan Losses Reduced credit losses by more than 90% Individual loan underwriting not the issue: enhanced concentration risk management High Concentration in CRE, HVCRE & CDOs Reduced total concentration in CRE to less than 2.0x CET1 from 5.0x in 2007 and HVCRE to less than 5% from more than 100% in 2007. Eliminated CDO exposure from more than 110% of CET1 in 20071. Ol d er M o re R ece n t 1 CDO balance includes both CDOs on balance sheet at 12/31/2007 as well as those held in Lockhart Funding that were required to be purchased due to a liquidity arrangement between Zions and Lockhart.
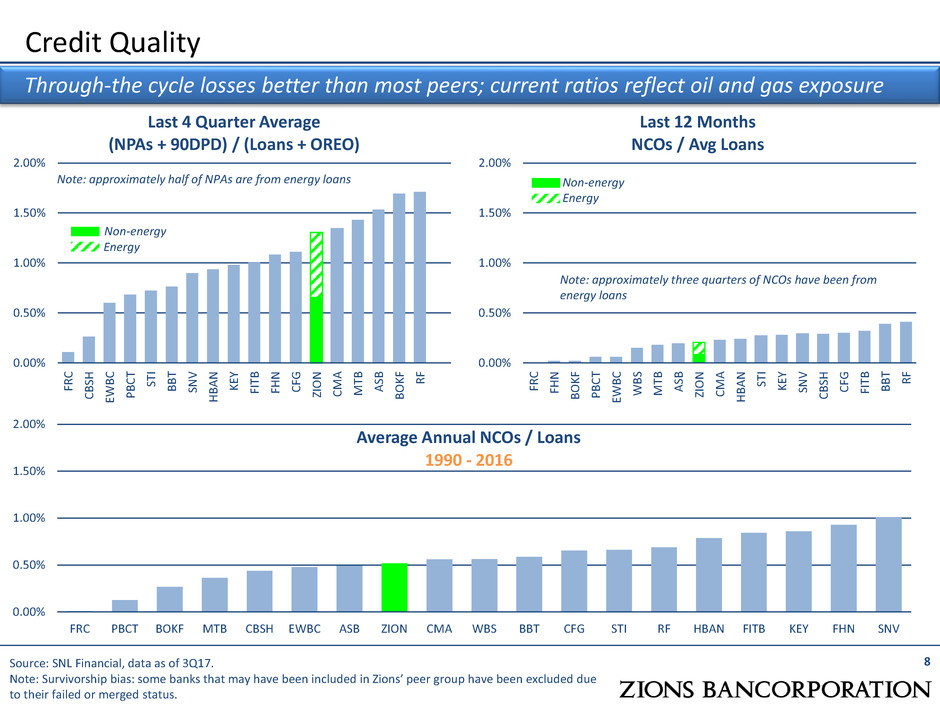
0.00% 0.50% 1.00% 1.50% 2.00% FRC PBCT BOKF MTB CBSH EWBC ASB ZION CMA WBS BBT CFG STI RF HBAN FITB KEY FHN SNV 0.00% 0.50% 1.00% 1.50% 2.00% FR C C B SH EWB C PB C T ST I B B T SN V H BA N K EY FI TB FH N C FG ZI O N C M A M TB A SB B O K F R F Credit Quality Last 4 Quarter Average (NPAs + 90DPD) / (Loans + OREO) Last 12 Months NCOs / Avg Loans 8 0.00% 0.50% 1.00% 1.50% 2.00% FR C FH N B O K F PB C T EWB C W B S M TB A SB ZI O N C M A H BA N ST I K EY SN V C B SH C FG FI TB B B T R F Non-energy Energy Note: approximately three quarters of NCOs have been from energy loans Source: SNL Financial, data as of 3Q17. Note: Survivorship bias: some banks that may have been included in Zions’ peer group have been excluded due to their failed or merged status. Through-the cycle losses better than most peers; current ratios reflect oil and gas exposure Average Annual NCOs / Loans 1990 - 2016 Note: approximately half of NPAs are from energy loans Non-energy Energy
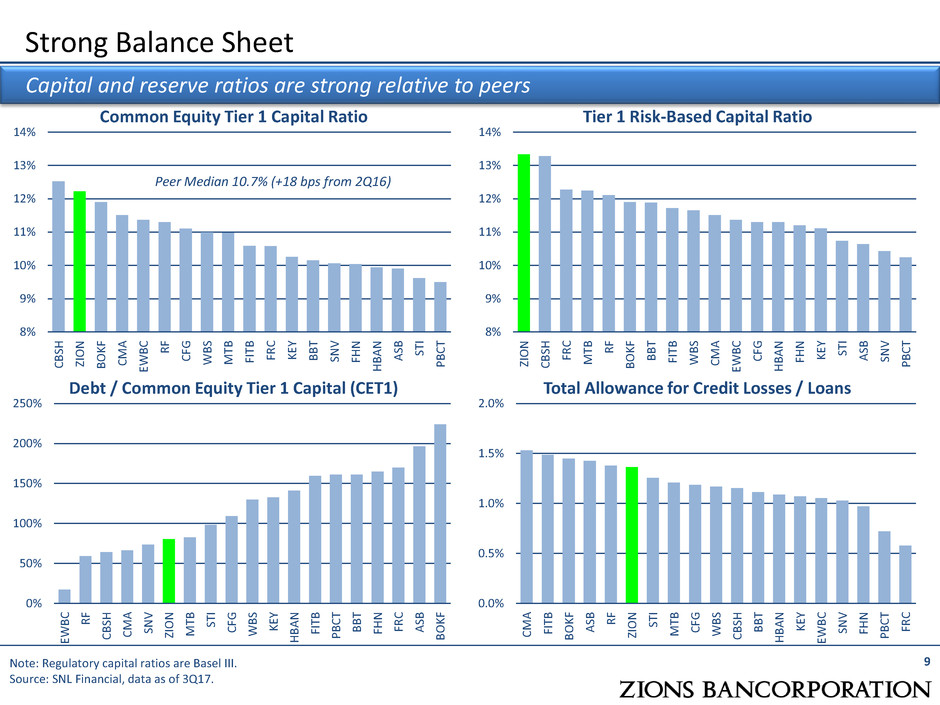
Strong Balance Sheet Common Equity Tier 1 Capital Ratio Tier 1 Risk-Based Capital Ratio 8% 9% 10% 11% 12% 13% 14% ZI O N C B SH FR C M TB R F B O K F B B T FI TB WB S C M A EWB C C FG H BA N FH N K EY ST I A SB SN V PB C T Note: Regulatory capital ratios are Basel III. Source: SNL Financial, data as of 3Q17. 8% 9% 10% 11% 12% 13% 14% C B SH ZI O N B O K F C M A EWB C R F C FG WB S M TB FI TB FR C K EY B B T SN V FH N H BA N A SB ST I PB C T Capital and reserve ratios are strong relative to peers Debt / Common Equity Tier 1 Capital (CET1) Total Allowance for Credit Losses / Loans 0.0% 0.5% 1.0% 1.5% 2.0% C M A FI TB B O K F A SB R F ZI O N ST I M TB C FG WB S C B SH B B T H BA N K EY EWB C SN V FH N PB C T FR C 0% 50% 100% 150% 200% 250% EWB C R F C B SH C M A SN V ZI O N M TB ST I C FG WB S K EY H BA N FI TB PB C T B B T FH N FR C A SB B O K F 9 Peer Median 10.7% (+18 bps from 2Q16)
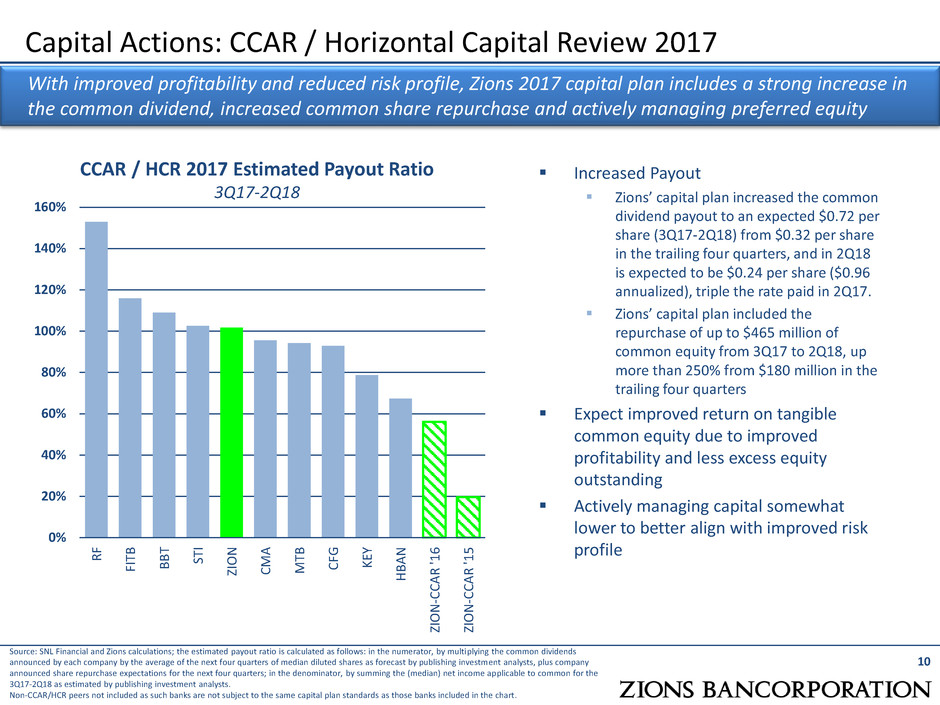
Increased Payout Zions’ capital plan increased the common dividend payout to an expected $0.72 per share (3Q17-2Q18) from $0.32 per share in the trailing four quarters, and in 2Q18 is expected to be $0.24 per share ($0.96 annualized), triple the rate paid in 2Q17. Zions’ capital plan included the repurchase of up to $465 million of common equity from 3Q17 to 2Q18, up more than 250% from $180 million in the trailing four quarters Expect improved return on tangible common equity due to improved profitability and less excess equity outstanding Actively managing capital somewhat lower to better align with improved risk profile 10 Capital Actions: CCAR / Horizontal Capital Review 2017 With improved profitability and reduced risk profile, Zions 2017 capital plan includes a strong increase in the common dividend, increased common share repurchase and actively managing preferred equity CCAR / HCR 2017 Estimated Payout Ratio 3Q17-2Q18 0% 20% 40% 60% 80% 100% 120% 140% 160% R F FI TB B B T ST I ZIO N C M A M TB CF G K EY H B A N ZIO N -CC A R '1 6 ZIO N -CC A R '1 5 Source: SNL Financial and Zions calculations; the estimated payout ratio is calculated as follows: in the numerator, by multiplying the common dividends announced by each company by the average of the next four quarters of median diluted shares as forecast by publishing investment analysts, plus company announced share repurchase expectations for the next four quarters; in the denominator, by summing the (median) net income applicable to common for the 3Q17-2Q18 as estimated by publishing investment analysts. Non-CCAR/HCR peers not included as such banks are not subject to the same capital plan standards as those banks included in the chart.
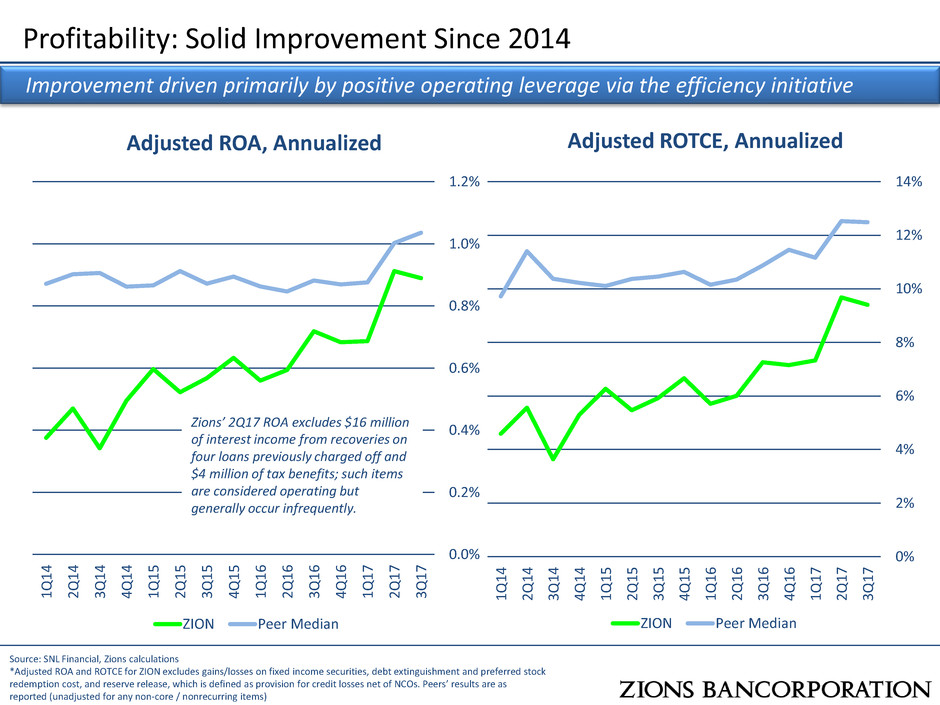
Profitability: Solid Improvement Since 2014 Source: SNL Financial, Zions calculations *Adjusted ROA and ROTCE for ZION excludes gains/losses on fixed income securities, debt extinguishment and preferred stock redemption cost, and reserve release, which is defined as provision for credit losses net of NCOs. Peers’ results are as reported (unadjusted for any non-core / nonrecurring items) 0.0% 0.2% 0.4% 0.6% 0.8% 1.0% 1.2% 1Q1 4 2Q1 4 3Q1 4 4Q1 4 1Q1 5 2Q1 5 3Q1 5 4Q1 5 1Q1 6 2Q1 6 3Q1 6 4Q1 6 1Q1 7 2Q1 7 3Q1 7 Adjusted ROA, Annualized ZION Peer Median 0% 2% 4% 6% 8% 10% 12% 14% 1Q1 4 2Q1 4 3Q1 4 4Q1 4 1Q1 5 2Q1 5 3Q1 5 4Q1 5 1Q1 6 2Q1 6 3Q1 6 4Q1 6 1Q1 7 2Q1 7 3Q1 7 Adjusted ROTCE, Annualized ZION Peer Median Improvement driven primarily by positive operating leverage via the efficiency initiative Zions’ 2Q17 ROA excludes $16 million of interest income from recoveries on four loans previously charged off and $4 million of tax benefits; such items are considered operating but generally occur infrequently.
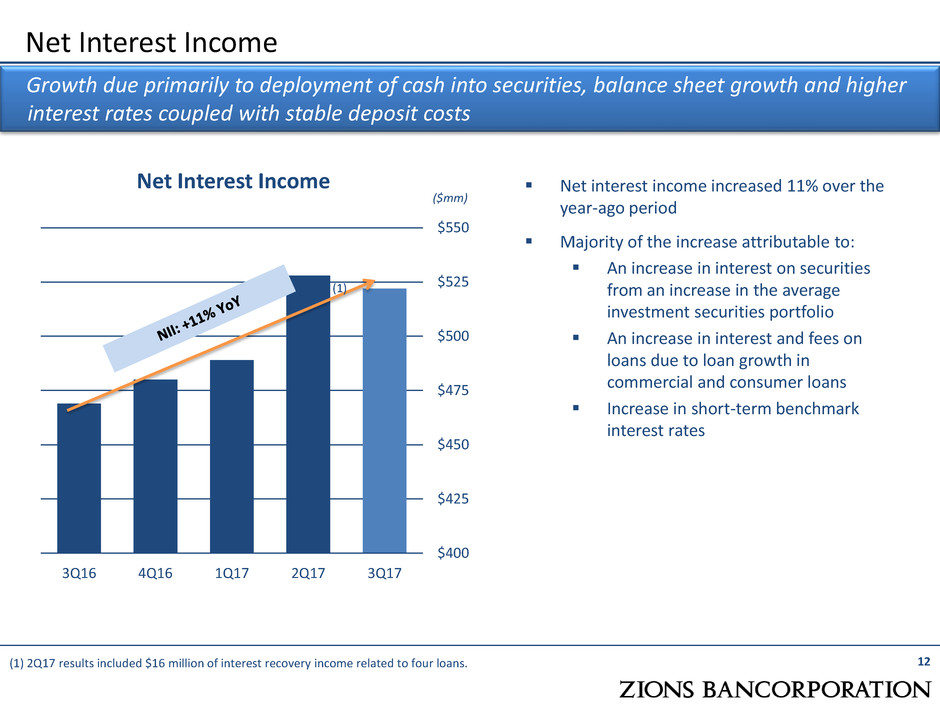
Net interest income increased 11% over the year-ago period Majority of the increase attributable to: An increase in interest on securities from an increase in the average investment securities portfolio An increase in interest and fees on loans due to loan growth in commercial and consumer loans Increase in short-term benchmark interest rates Net Interest Income Net Interest Income 12 Growth due primarily to deployment of cash into securities, balance sheet growth and higher interest rates coupled with stable deposit costs ($mm) $400 $425 $450 $475 $500 $525 $550 3Q16 4Q16 1Q17 2Q17 3Q17 (1) 2Q17 results included $16 million of interest recovery income related to four loans. (1)
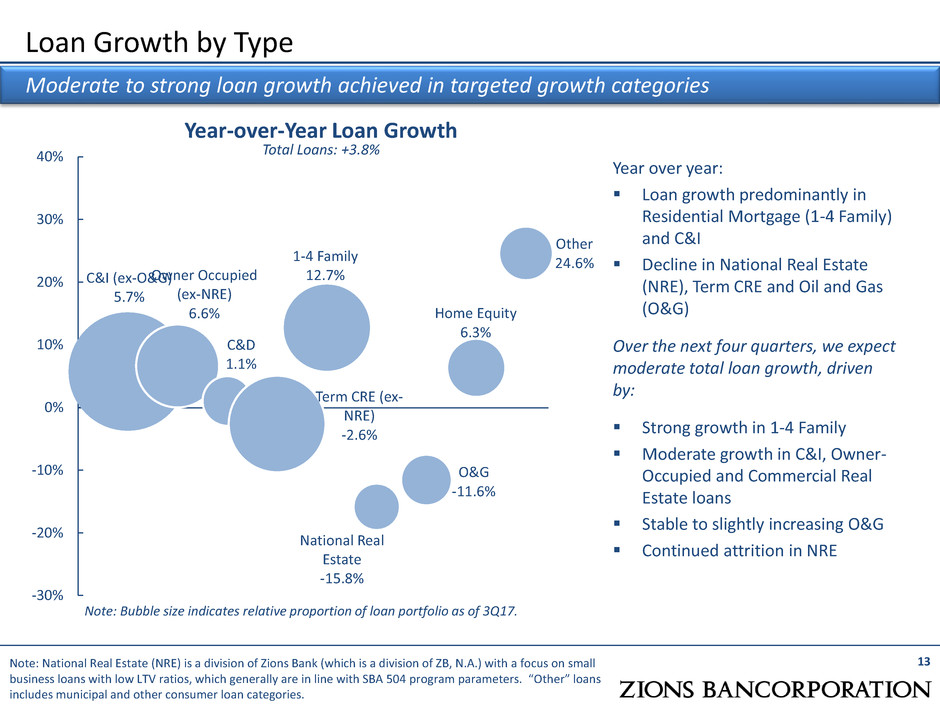
C&I (ex-O&G) 5.7% Owner Occupied (ex-NRE) 6.6% C&D 1.1% Term CRE (ex- NRE) -2.6% 1-4 Family 12.7% National Real Estate -15.8% O&G -11.6% Home Equity 6.3% Other 24.6% -30% -20% -10% 0% 10% 20% 30% 40% Loan Growth by Type 13 Moderate to strong loan growth achieved in targeted growth categories Year-over-Year Loan Growth Total Loans: +3.8% Year over year: Loan growth predominantly in Residential Mortgage (1-4 Family) and C&I Decline in National Real Estate (NRE), Term CRE and Oil and Gas (O&G) Over the next four quarters, we expect moderate total loan growth, driven by: Strong growth in 1-4 Family Moderate growth in C&I, Owner- Occupied and Commercial Real Estate loans Stable to slightly increasing O&G Continued attrition in NRE Note: National Real Estate (NRE) is a division of Zions Bank (which is a division of ZB, N.A.) with a focus on small business loans with low LTV ratios, which generally are in line with SBA 504 program parameters. “Other” loans includes municipal and other consumer loan categories. Note: Bubble size indicates relative proportion of loan portfolio as of 3Q17.
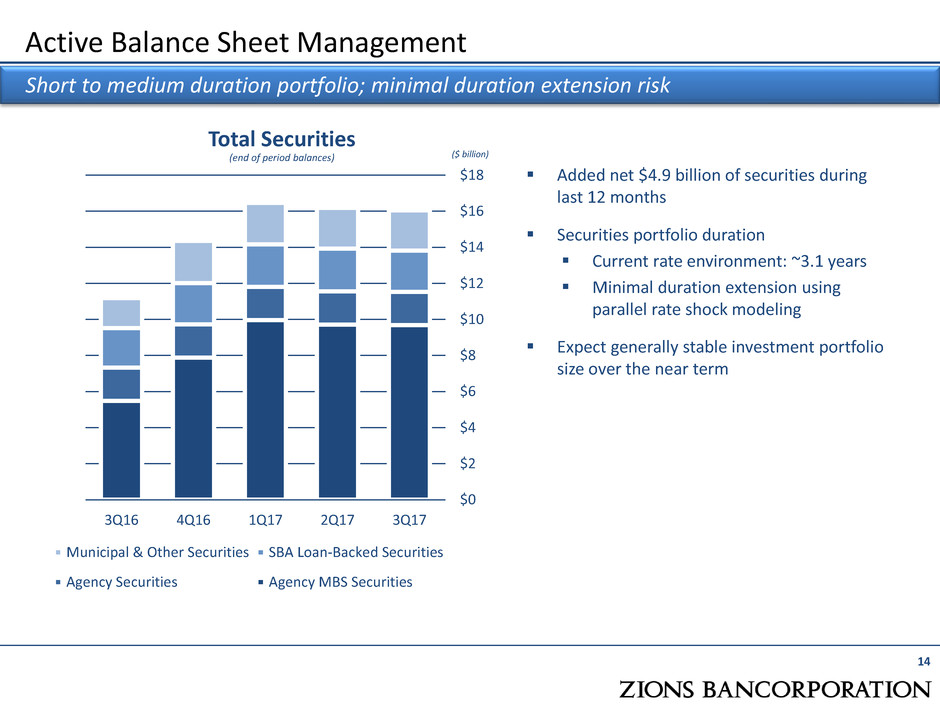
Active Balance Sheet Management Short to medium duration portfolio; minimal duration extension risk Total Securities (end of period balances) ($ billion) $0 $2 $4 $6 $8 $10 $12 $14 $16 $18 3Q16 4Q16 1Q17 2Q17 3Q17 Municipal & Other Securities SBA Loan-Backed Securities Agency Securities Agency MBS Securities Added net $4.9 billion of securities during last 12 months Securities portfolio duration Current rate environment: ~3.1 years Minimal duration extension using parallel rate shock modeling Expect generally stable investment portfolio size over the near term 14
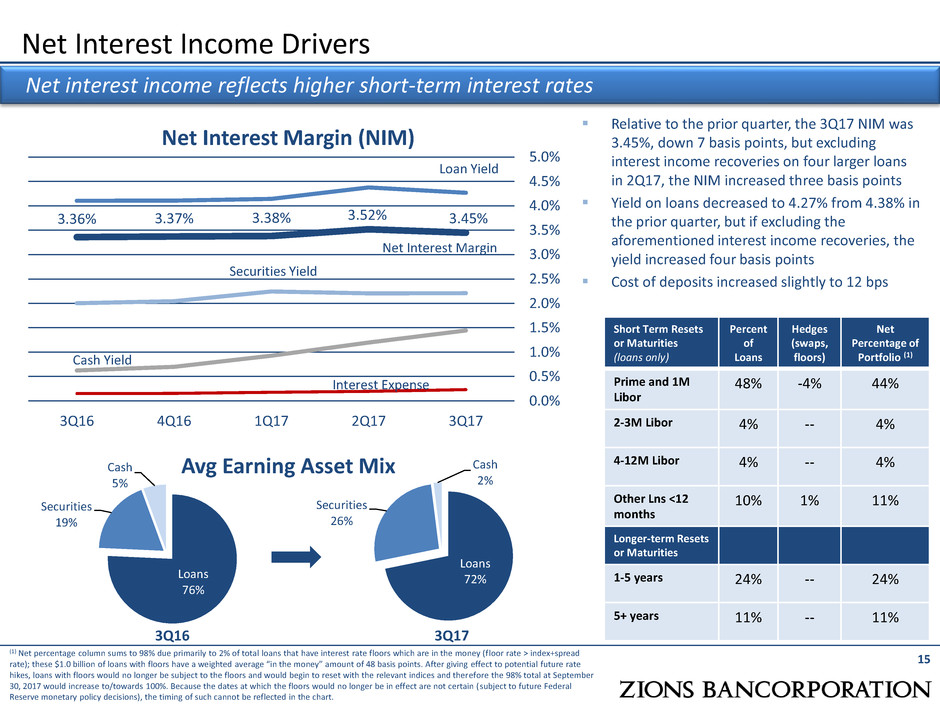
Loans 76% Securities 19% Cash 5% Loans 72% Securities 26% Cash 2% Net Interest Income Drivers 15 Net interest income reflects higher short-term interest rates Net Interest Margin (NIM) Avg Earning Asset Mix Relative to the prior quarter, the 3Q17 NIM was 3.45%, down 7 basis points, but excluding interest income recoveries on four larger loans in 2Q17, the NIM increased three basis points Yield on loans decreased to 4.27% from 4.38% in the prior quarter, but if excluding the aforementioned interest income recoveries, the yield increased four basis points Cost of deposits increased slightly to 12 bps 3.36% 3.37% 3.38% 3.52% 3.45% 0.0% 0.5% 1.0% 1.5% 2.0% 2.5% 3.0% 3.5% 4.0% 4.5% 5.0% 3Q16 4Q16 1Q17 2Q17 3Q17 Loan Yield Securities Yield Interest Expense Net Interest Margin Cash Yield 3Q16 3Q17 Short Term Resets or Maturities (loans only) Percent of Loans Hedges (swaps, floors) Net Percentage of Portfolio (1) Prime and 1M Libor 48% -4% 44% 2-3M Libor 4% -- 4% 4-12M Libor 4% -- 4% Other Lns <12 months 10% 1% 11% Longer-term Resets or Maturities 1-5 years 24% -- 24% 5+ years 11% -- 11% (1) Net percentage column sums to 98% due primarily to 2% of total loans that have interest rate floors which are in the money (floor rate > index+spread rate); these $1.0 billion of loans with floors have a weighted average “in the money” amount of 48 basis points. After giving effect to potential future rate hikes, loans with floors would no longer be subject to the floors and would begin to reset with the relevant indices and therefore the 98% total at September 30, 2017 would increase to/towards 100%. Because the dates at which the floors would no longer be in effect are not certain (subject to future Federal Reserve monetary policy decisions), the timing of such cannot be reflected in the chart.
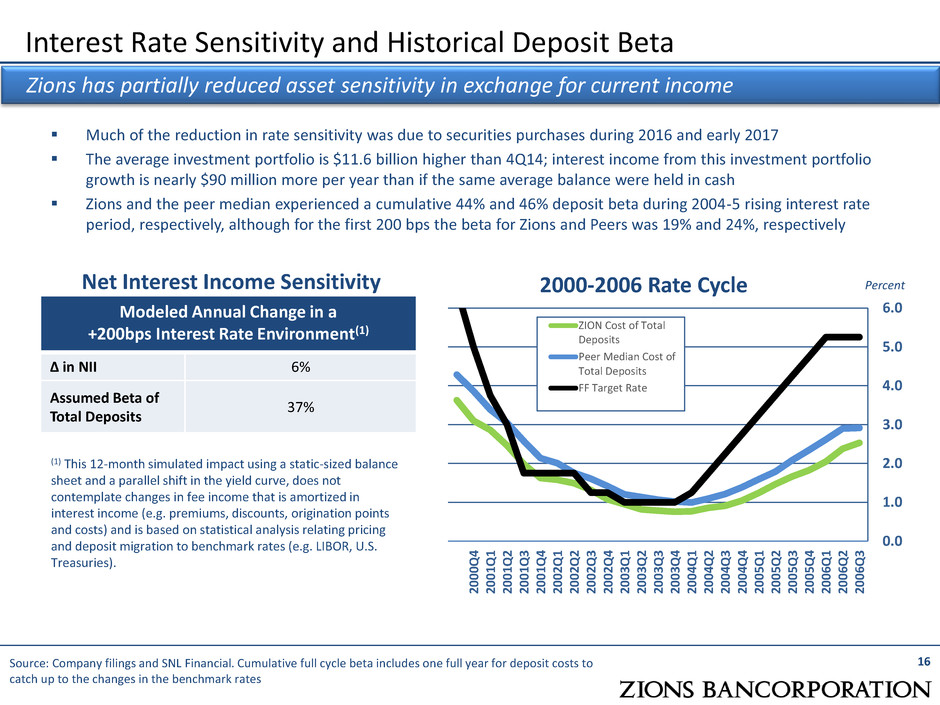
Much of the reduction in rate sensitivity was due to securities purchases during 2016 and early 2017 The average investment portfolio is $11.6 billion higher than 4Q14; interest income from this investment portfolio growth is nearly $90 million more per year than if the same average balance were held in cash Zions and the peer median experienced a cumulative 44% and 46% deposit beta during 2004-5 rising interest rate period, respectively, although for the first 200 bps the beta for Zions and Peers was 19% and 24%, respectively Interest Rate Sensitivity and Historical Deposit Beta 16 Zions has partially reduced asset sensitivity in exchange for current income Source: Company filings and SNL Financial. Cumulative full cycle beta includes one full year for deposit costs to catch up to the changes in the benchmark rates Modeled Annual Change in a +200bps Interest Rate Environment(1) ∆ in NII [5]% Beta of Total Deposits [37]% (1) This 12-month simulated impact using a static-sized balance sheet and a parallel shift in the yield curve, does not contemplate changes in fee income that is amortized in interest income (e.g. premiums, discounts, origination points and costs) and is based on statistical analysis relating pricing and deposit migration to benchmark rates (e.g. LIBOR, U.S. Treasuries). Net Interest Income Sensitivity 0.0 1.0 2.0 3.0 4.0 5.0 6.0 20 00 Q 4 20 01 Q 1 20 01 Q 2 20 01 Q 3 20 01 Q 4 20 02 Q 1 20 02 Q 2 20 02 Q 3 20 02 Q 4 20 03 Q 1 20 03 Q 2 20 03 Q 3 20 03 Q 4 20 04 Q 1 20 04 Q 2 20 04 Q 3 20 04 Q 4 20 05 Q 1 20 05 Q 2 20 05 Q 3 20 05 Q 4 20 06 Q 1 20 06 Q 2 20 06 Q 3 ZION Cost of Total Deposits Peer Median Cost of Total Deposits FF Target Rate 2000-2006 Rate Cycle Percent n NI 6% Assumed Beta of Total Deposits %
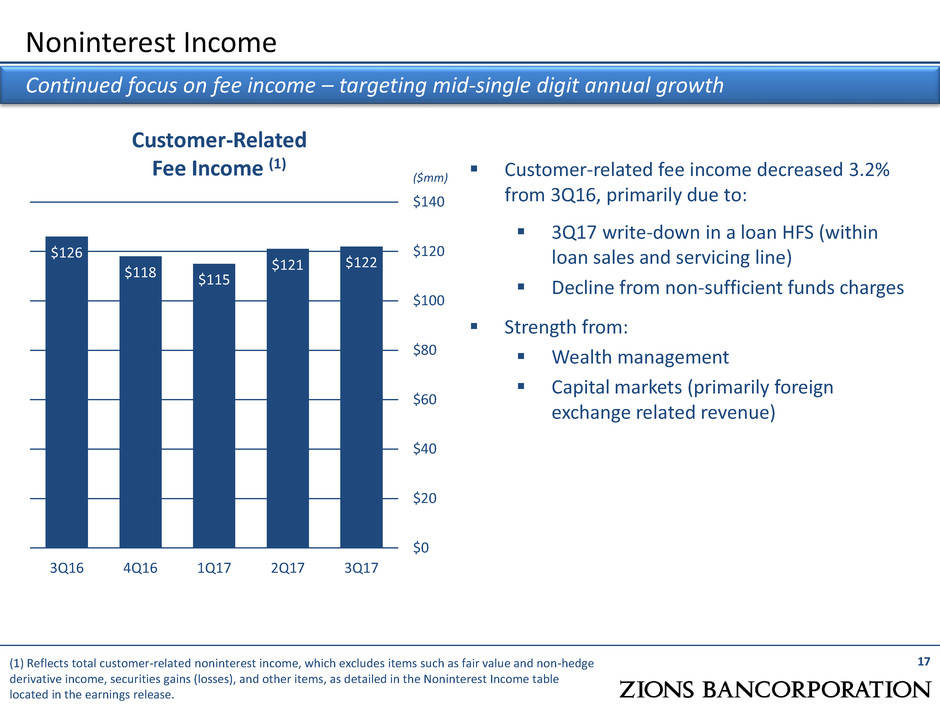
Customer-related fee income decreased 3.2% from 3Q16, primarily due to: 3Q17 write-down in a loan HFS (within loan sales and servicing line) Decline from non-sufficient funds charges Strength from: Wealth management Capital markets (primarily foreign exchange related revenue) Noninterest Income 17 Continued focus on fee income – targeting mid-single digit annual growth (1) Reflects total customer-related noninterest income, which excludes items such as fair value and non-hedge derivative income, securities gains (losses), and other items, as detailed in the Noninterest Income table located in the earnings release. Customer-Related Fee Income (1) ($mm) $126 $118 $115 $121 $122 $0 $20 $40 $60 $80 $100 $120 $140 3Q16 4Q16 1Q17 2Q17 3Q17
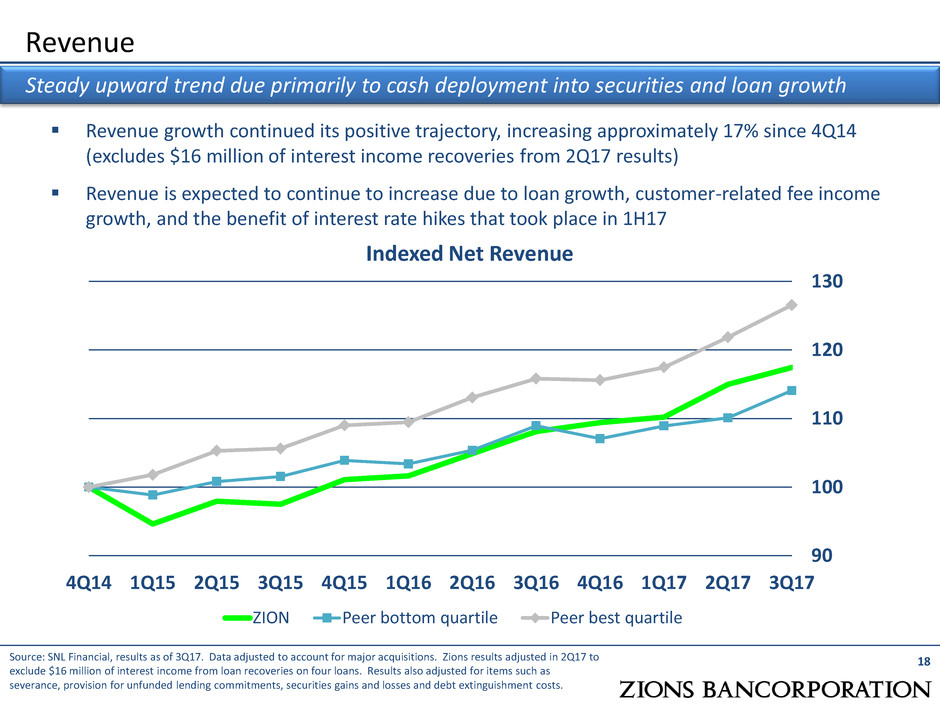
Revenue growth continued its positive trajectory, increasing approximately 17% since 4Q14 (excludes $16 million of interest income recoveries from 2Q17 results) Revenue is expected to continue to increase due to loan growth, customer-related fee income growth, and the benefit of interest rate hikes that took place in 1H17 Revenue 18 Steady upward trend due primarily to cash deployment into securities and loan growth 90 100 110 120 130 4Q14 1Q15 2Q15 3Q15 4Q15 1Q16 2Q16 3Q16 4Q16 1Q17 2Q17 3Q17 ZION Peer bottom quartile Peer best quartile Indexed Net Revenue Source: SNL Financial, results as of 3Q17. Data adjusted to account for major acquisitions. Zions results adjusted in 2Q17 to exclude $16 million of interest income from loan recoveries on four loans. Results also adjusted for items such as severance, provision for unfunded lending commitments, securities gains and losses and debt extinguishment costs.
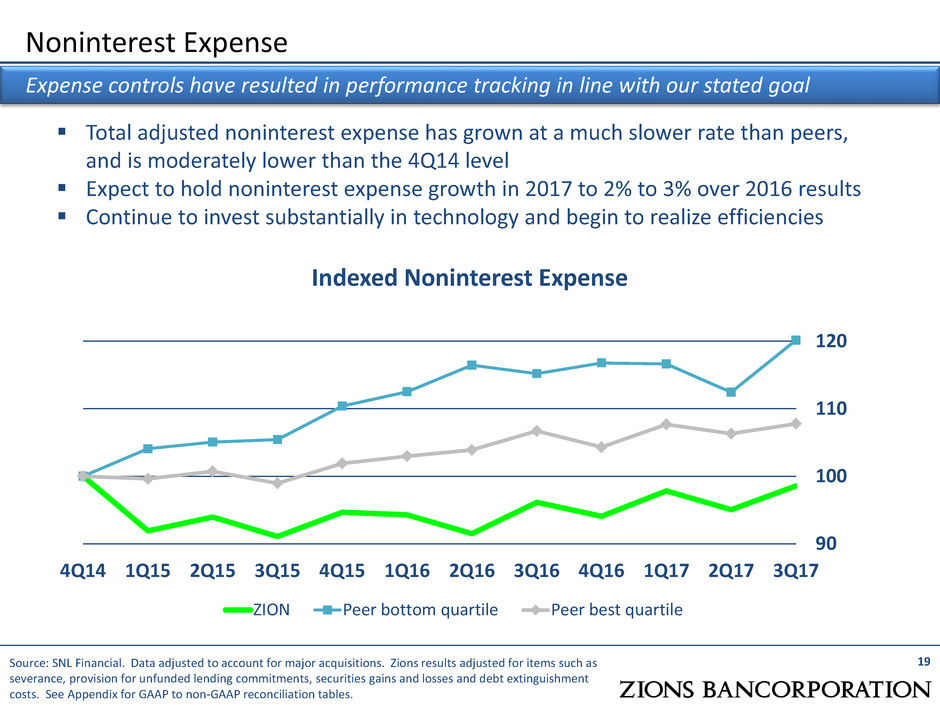
Total adjusted noninterest expense has grown at a much slower rate than peers, and is moderately lower than the 4Q14 level Expect to hold noninterest expense growth in 2017 to 2% to 3% over 2016 results Continue to invest substantially in technology and begin to realize efficiencies Indexed Noninterest Expense 90 100 110 120 4Q14 1Q15 2Q15 3Q15 4Q15 1Q16 2Q16 3Q16 4Q16 1Q17 2Q17 3Q17 ZION Peer bottom quartile Peer best quartile 19 Expense controls have resulted in performance tracking in line with our stated goal Source: SNL Financial. Data adjusted to account for major acquisitions. Zions results adjusted for items such as severance, provision for unfunded lending commitments, securities gains and losses and debt extinguishment costs. See Appendix for GAAP to non-GAAP reconciliation tables. Noninterest Expense
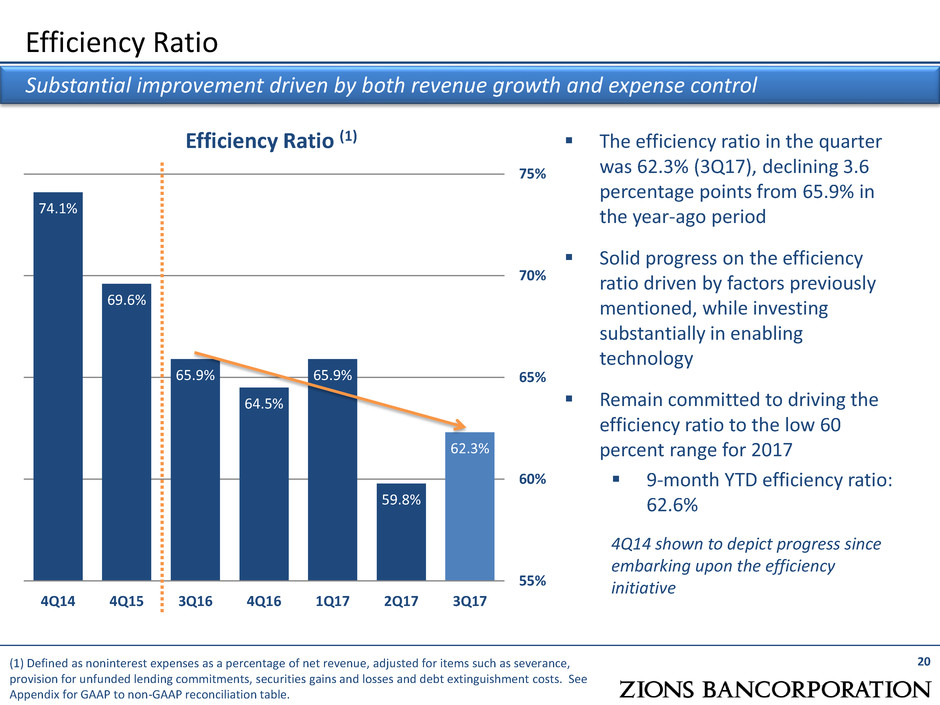
The efficiency ratio in the quarter was 62.3% (3Q17), declining 3.6 percentage points from 65.9% in the year-ago period Solid progress on the efficiency ratio driven by factors previously mentioned, while investing substantially in enabling technology Remain committed to driving the efficiency ratio to the low 60 percent range for 2017 9-month YTD efficiency ratio: 62.6% 4Q14 shown to depict progress since embarking upon the efficiency initiative 74.1% 69.6% 65.9% 64.5% 65.9% 59.8% 62.3% 55% 60% 65% 70% 75% 4Q14 4Q15 3Q16 4Q16 1Q17 2Q17 3Q17 Efficiency Ratio Efficiency Ratio (1) 20 Substantial improvement driven by both revenue growth and expense control (1) Defined as noninterest expenses as a percentage of net revenue, adjusted for items such as severance, provision for unfunded lending commitments, securities gains and losses and debt extinguishment costs. See Appendix for GAAP to non-GAAP reconciliation table.
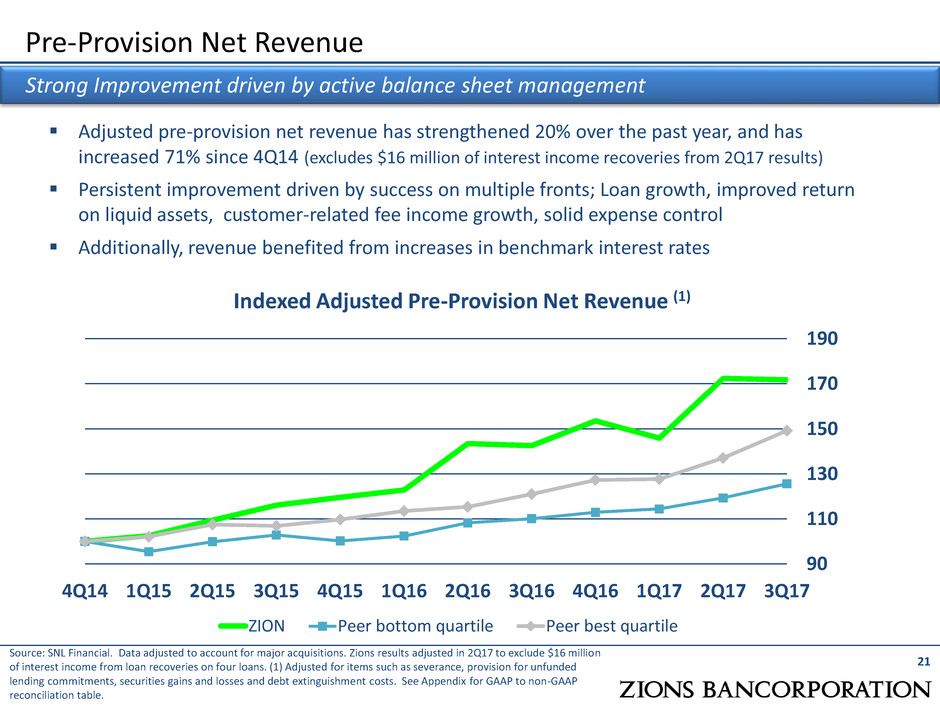
Pre-Provision Net Revenue 21 Strong Improvement driven by active balance sheet management Source: SNL Financial. Data adjusted to account for major acquisitions. Zions results adjusted in 2Q17 to exclude $16 million of interest income from loan recoveries on four loans. (1) Adjusted for items such as severance, provision for unfunded lending commitments, securities gains and losses and debt extinguishment costs. See Appendix for GAAP to non-GAAP reconciliation table. Indexed Adjusted Pre-Provision Net Revenue (1) 90 110 130 150 170 190 4Q14 1Q15 2Q15 3Q15 4Q15 1Q16 2Q16 3Q16 4Q16 1Q17 2Q17 3Q17 ZION Peer bottom quartile Peer best quartile Adjusted pre-provision net revenue has strengthened 20% over the past year, and has increased 71% since 4Q14 (excludes $16 million of interest income recoveries from 2Q17 results) Persistent improvement driven by success on multiple fronts; Loan growth, improved return on liquid assets, customer-related fee income growth, solid expense control Additionally, revenue benefited from increases in benchmark interest rates
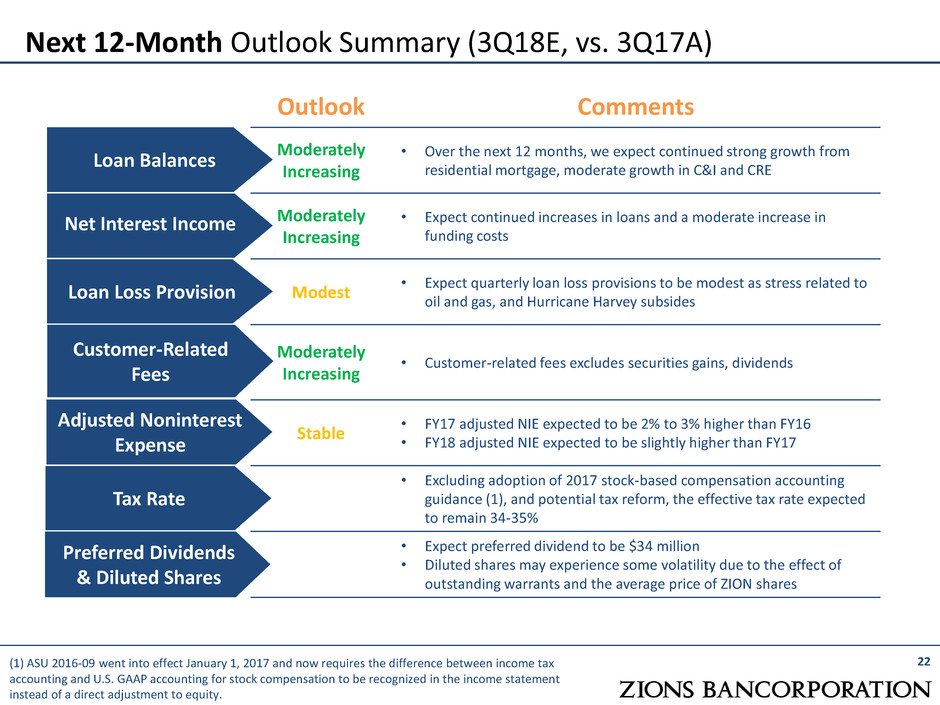
Next 12-Month Outlook Summary (3Q18E, vs. 3Q17A) 22 Outlook Comments Moderately Increasing • Over the next 12 months, we expect continued strong growth from residential mortgage, moderate growth in C&I and CRE Moderately Increasing • Expect continued increases in loans and a moderate increase in funding costs Modest • Expect quarterly loan loss provisions to be modest as stress related to oil and gas, and Hurricane Harvey subsides Moderately Increasing • Customer-related fees excludes securities gains, dividends Stable • FY17 adjusted NIE expected to be 2% to 3% higher than FY16 • FY18 adjusted NIE expected to be slightly higher than FY17 • Excluding adoption of 2017 stock-based compensation accounting guidance (1), and potential tax reform, the effective tax rate expected to remain 34-35% • Expect preferred dividend to be $34 million • Diluted shares may experience some volatility due to the effect of outstanding warrants and the average price of ZION shares Customer-Related Fees Loan Balances Net Interest Income Loan Loss Provision Tax Rate Preferred Dividends & Diluted Shares Adjusted Noninterest Expense (1) ASU 2016-09 went into effect January 1, 2017 and now requires the difference between income tax accounting and U.S. GAAP accounting for stock compensation to be recognized in the income statement instead of a direct adjustment to equity.
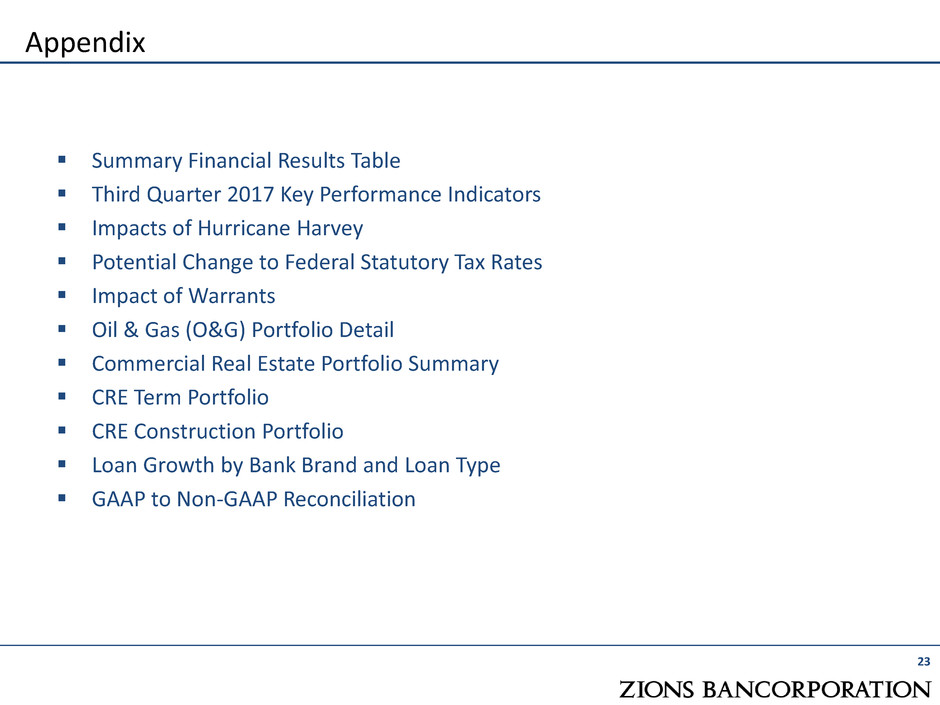
Summary Financial Results Table Third Quarter 2017 Key Performance Indicators Impacts of Hurricane Harvey Potential Change to Federal Statutory Tax Rates Impact of Warrants Oil & Gas (O&G) Portfolio Detail Commercial Real Estate Portfolio Summary CRE Term Portfolio CRE Construction Portfolio Loan Growth by Bank Brand and Loan Type GAAP to Non-GAAP Reconciliation 23 Appendix
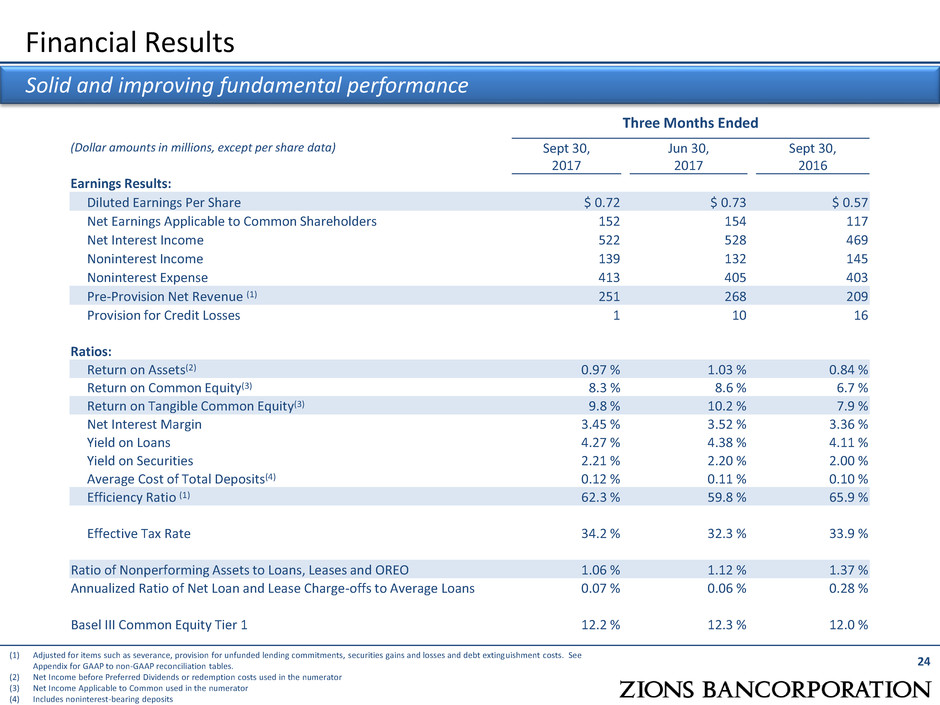
Financial Results 24 Solid and improving fundamental performance Three Months Ended (Dollar amounts in millions, except per share data) Sept 30, 2017 Jun 30, 2017 Sept 30, 2016 Earnings Results: Diluted Earnings Per Share $ 0.72 $ 0.73 $ 0.57 Net Earnings Applicable to Common Shareholders 152 154 117 Net Interest Income 522 528 469 Noninterest Income 139 132 145 Noninterest Expense 413 405 403 Pre-Provision Net Revenue (1) 251 268 209 Provision for Credit Losses 1 10 16 Ratios: Return on Assets(2) 0.97 % 1.03 % 0.84 % Return on Common Equity(3) 8.3 % 8.6 % 6.7 % Return on Tangible Common Equity(3) 9.8 % 10.2 % 7.9 % Net Interest Margin 3.45 % 3.52 % 3.36 % Yield on Loans 4.27 % 4.38 % 4.11 % Yield on Securities 2.21 % 2.20 % 2.00 % Average Cost of Total Deposits(4) 0.12 % 0.11 % 0.10 % Efficiency Ratio (1) 62.3 % 59.8 % 65.9 % Effective Tax Rate 34.2 % 32.3 % 33.9 % Ratio of Nonperforming Assets to Loans, Leases and OREO 1.06 % 1.12 % 1.37 % Annualized Ratio of Net Loan and Lease Charge-offs to Average Loans 0.07 % 0.06 % 0.28 % Basel III Common Equity Tier 1 12.2 % 12.3 % 12.0 % (1) Adjusted for items such as severance, provision for unfunded lending commitments, securities gains and losses and debt extinguishment costs. See Appendix for GAAP to non-GAAP reconciliation tables. (2) Net Income before Preferred Dividends or redemption costs used in the numerator (3) Net Income Applicable to Common used in the numerator (4) Includes noninterest-bearing deposits
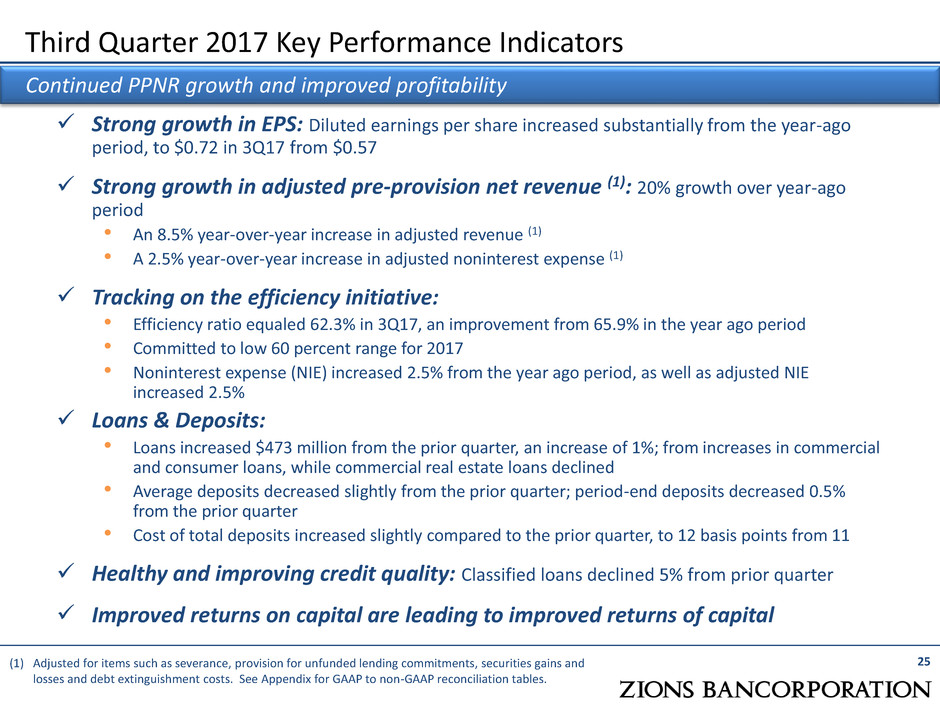
Strong growth in EPS: Diluted earnings per share increased substantially from the year-ago period, to $0.72 in 3Q17 from $0.57 Strong growth in adjusted pre-provision net revenue (1): 20% growth over year-ago period • An 8.5% year-over-year increase in adjusted revenue (1) • A 2.5% year-over-year increase in adjusted noninterest expense (1) Tracking on the efficiency initiative: • Efficiency ratio equaled 62.3% in 3Q17, an improvement from 65.9% in the year ago period • Committed to low 60 percent range for 2017 • Noninterest expense (NIE) increased 2.5% from the year ago period, as well as adjusted NIE increased 2.5% Loans & Deposits: • Loans increased $473 million from the prior quarter, an increase of 1%; from increases in commercial and consumer loans, while commercial real estate loans declined • Average deposits decreased slightly from the prior quarter; period-end deposits decreased 0.5% from the prior quarter • Cost of total deposits increased slightly compared to the prior quarter, to 12 basis points from 11 Healthy and improving credit quality: Classified loans declined 5% from prior quarter Improved returns on capital are leading to improved returns of capital 25 Third Quarter 2017 Key Performance Indicators Continued PPNR growth and improved profitability (1) Adjusted for items such as severance, provision for unfunded lending commitments, securities gains and losses and debt extinguishment costs. See Appendix for GAAP to non-GAAP reconciliation tables.
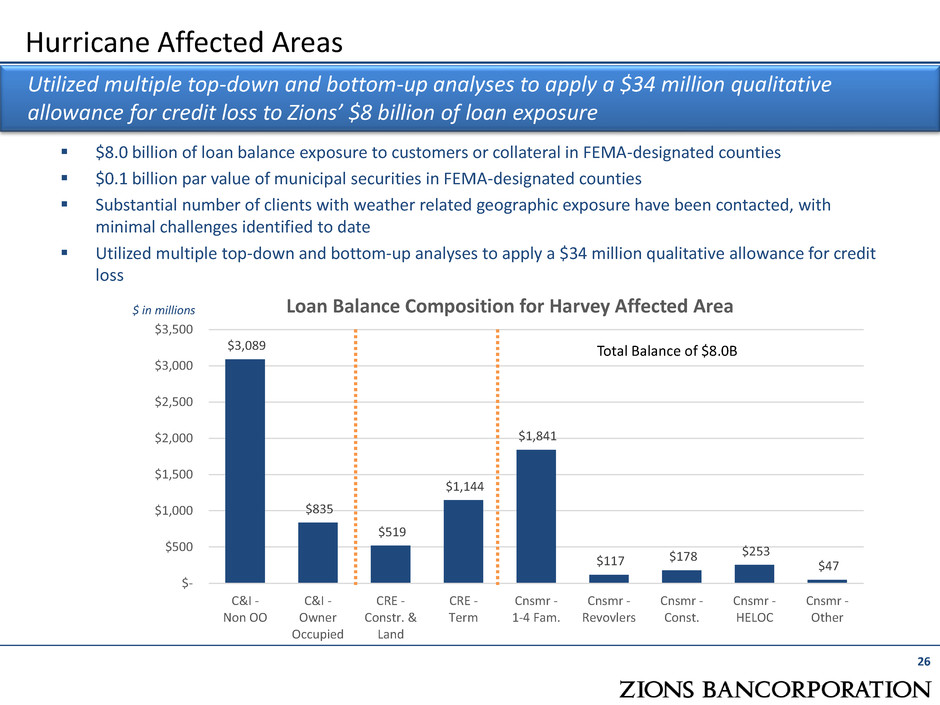
$3,089 $835 $519 $1,144 $1,841 $117 $178 $253 $47 $- $500 $1,000 $1,500 $2,000 $2,500 $3,000 $3,500 C&I - Non OO C&I - Owner Occupied CRE - Constr. & Land CRE - Term Cnsmr - 1-4 Fam. Cnsmr - Revovlers Cnsmr - Const. Cnsmr - HELOC Cnsmr - Other Loan Balance Composition for Harvey Affected Area 26 Hurricane Affected Areas $8.0 billion of loan balance exposure to customers or collateral in FEMA-designated counties $0.1 billion par value of municipal securities in FEMA-designated counties Substantial number of clients with weather related geographic exposure have been contacted, with minimal challenges identified to date Utilized multiple top-down and bottom-up analyses to apply a $34 million qualitative allowance for credit loss $ in millions Total Balance of $8.0B Utilized multiple top-down and bottom-up analyses to apply a $34 million qualitative allowance for credit loss to Zions’ $8 billion of loan exposure
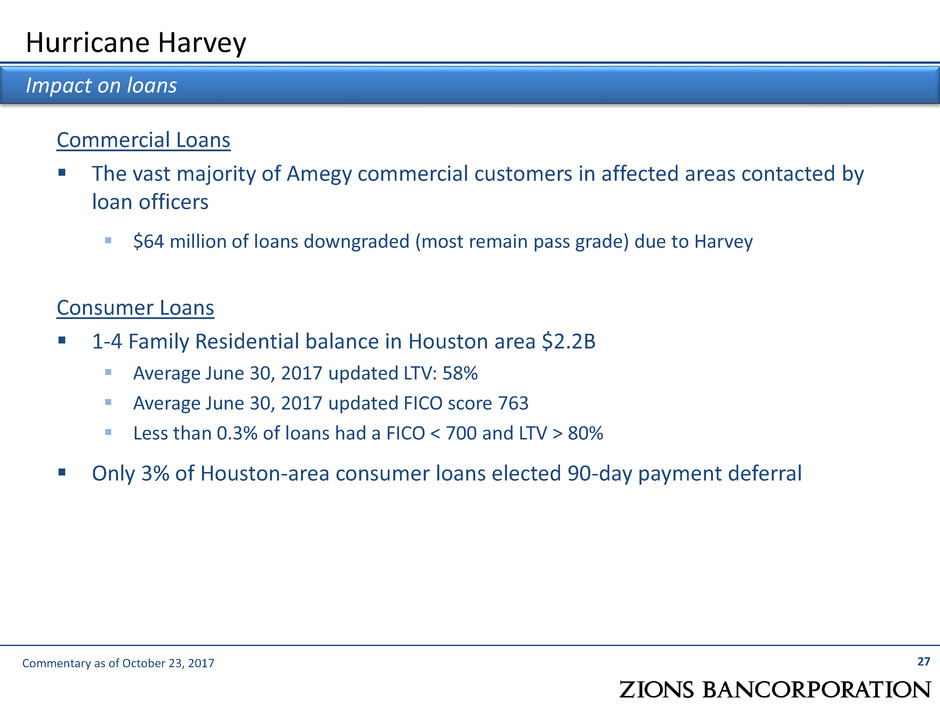
27 Hurricane Harvey Commercial Loans The vast majority of Amegy commercial customers in affected areas contacted by loan officers $64 million of loans downgraded (most remain pass grade) due to Harvey Consumer Loans 1-4 Family Residential balance in Houston area $2.2B Average June 30, 2017 updated LTV: 58% Average June 30, 2017 updated FICO score 763 Less than 0.3% of loans had a FICO < 700 and LTV > 80% Only 3% of Houston-area consumer loans elected 90-day payment deferral Impact on loans Commentary as of October 23, 2017
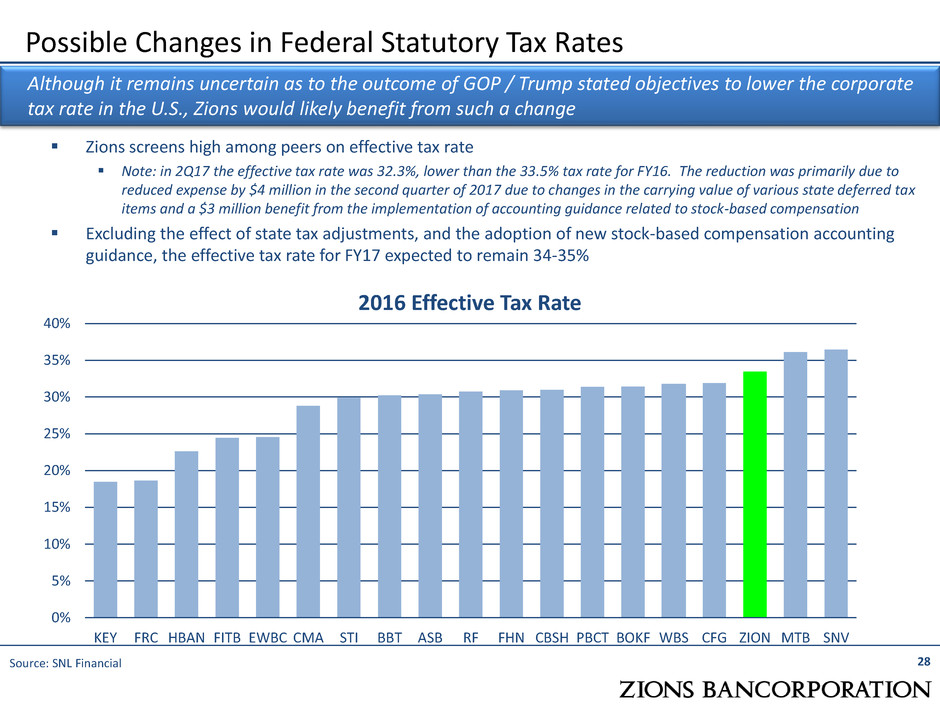
28 Possible Changes in Federal Statutory Tax Rates Although it remains uncertain as to the outcome of GOP / Trump stated objectives to lower the corporate tax rate in the U.S., Zions would likely benefit from such a change 0% 5% 10% 15% 20% 25% 30% 35% 40% KEY FRC HBAN FITB EWBC CMA STI BBT ASB RF FHN CBSH PBCT BOKF WBS CFG ZION MTB SNV 2016 Effective Tax Rate Zions screens high among peers on effective tax rate Note: in 2Q17 the effective tax rate was 32.3%, lower than the 33.5% tax rate for FY16. The reduction was primarily due to reduced expense by $4 million in the second quarter of 2017 due to changes in the carrying value of various state deferred tax items and a $3 million benefit from the implementation of accounting guidance related to stock-based compensation Excluding the effect of state tax adjustments, and the adoption of new stock-based compensation accounting guidance, the effective tax rate for FY17 expected to remain 34-35% Source: SNL Financial
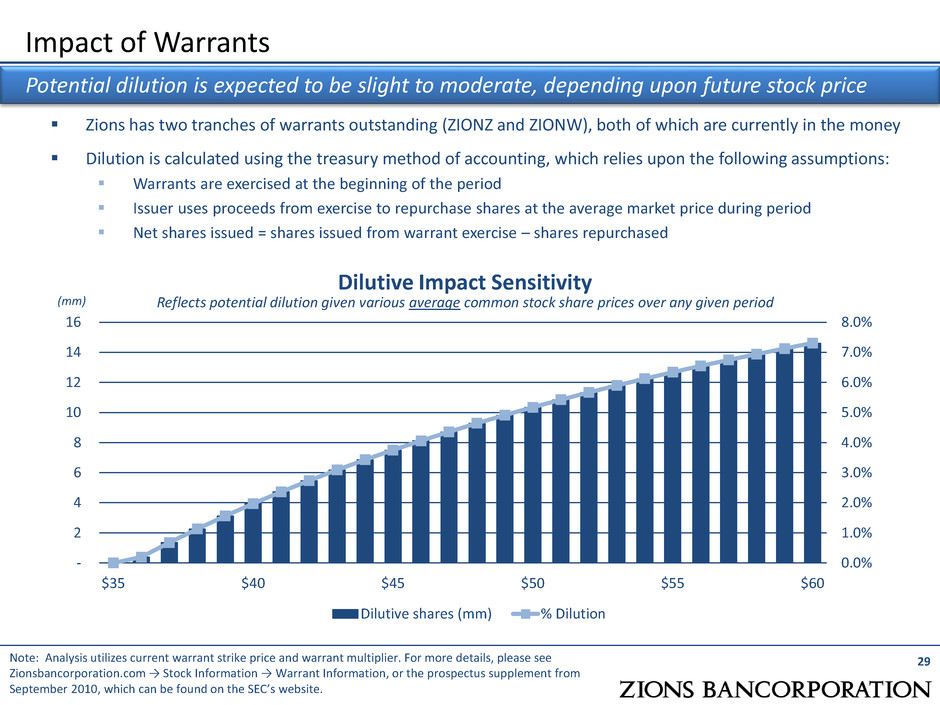
Zions has two tranches of warrants outstanding (ZIONZ and ZIONW), both of which are currently in the money Dilution is calculated using the treasury method of accounting, which relies upon the following assumptions: Warrants are exercised at the beginning of the period Issuer uses proceeds from exercise to repurchase shares at the average market price during period Net shares issued = shares issued from warrant exercise – shares repurchased Impact of Warrants Dilutive Impact Sensitivity Reflects potential dilution given various average common stock share prices over any given period 29 Potential dilution is expected to be slight to moderate, depending upon future stock price (mm) 0.0% 1.0% 2.0% 3.0% 4.0% 5.0% 6.0% 7.0% 8.0% - 2 4 6 8 10 12 14 16 $35 $40 $45 $50 $55 $60 Dilutive shares (mm) % Dilution Note: Analysis utilizes current warrant strike price and warrant multiplier. For more details, please see Zionsbancorporation.com → Stock Information → Warrant Information, or the prospectus supplement from September 2010, which can be found on the SEC’s website.
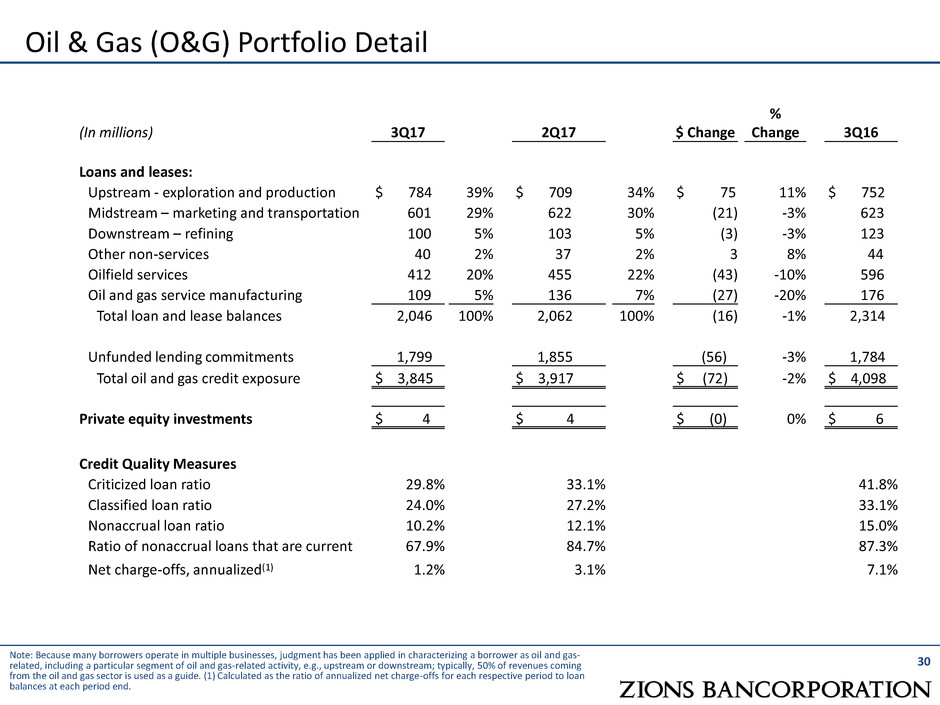
30 Note: Because many borrowers operate in multiple businesses, judgment has been applied in characterizing a borrower as oil and gas- related, including a particular segment of oil and gas-related activity, e.g., upstream or downstream; typically, 50% of revenues coming from the oil and gas sector is used as a guide. (1) Calculated as the ratio of annualized net charge-offs for each respective period to loan balances at each period end. Oil & Gas (O&G) Portfolio Detail (In millions) 3Q17 2Q17 $ Change % Change 3Q16 Loans and leases: Upstream - exploration and production $ 784 39% $ 709 34% $ 75 11% $ 752 Midstream – marketing and transportation 601 29% 622 30% (21) -3% 623 Downstream – refining 100 5% 103 5% (3) -3% 123 Other non-services 40 2% 37 2% 3 8% 44 Oilfield services 412 20% 455 22% (43) -10% 596 Oil and gas service manufacturing 109 5% 136 7% (27) -20% 176 Total loan and lease balances 2,046 100% 2,062 100% (16) -1% 2,314 Unfunded lending commitments 1,799 1,855 (56) -3% 1,784 Total oil and gas credit exposure $ 3,845 $ 3,917 $ (72) -2% $ 4,098 Private equity investments $ 4 $ 4 $ (0) 0% $ 6 Credit Quality Measures Criticized loan ratio 29.8% 33.1% 41.8% Classified loan ratio 24.0% 27.2% 33.1% Nonaccrual loan ratio 10.2% 12.1% 15.0% Ratio of nonaccrual loans that are current 67.9% 84.7% 87.3% Net charge-offs, annualized(1) 1.2% 3.1% 7.1%
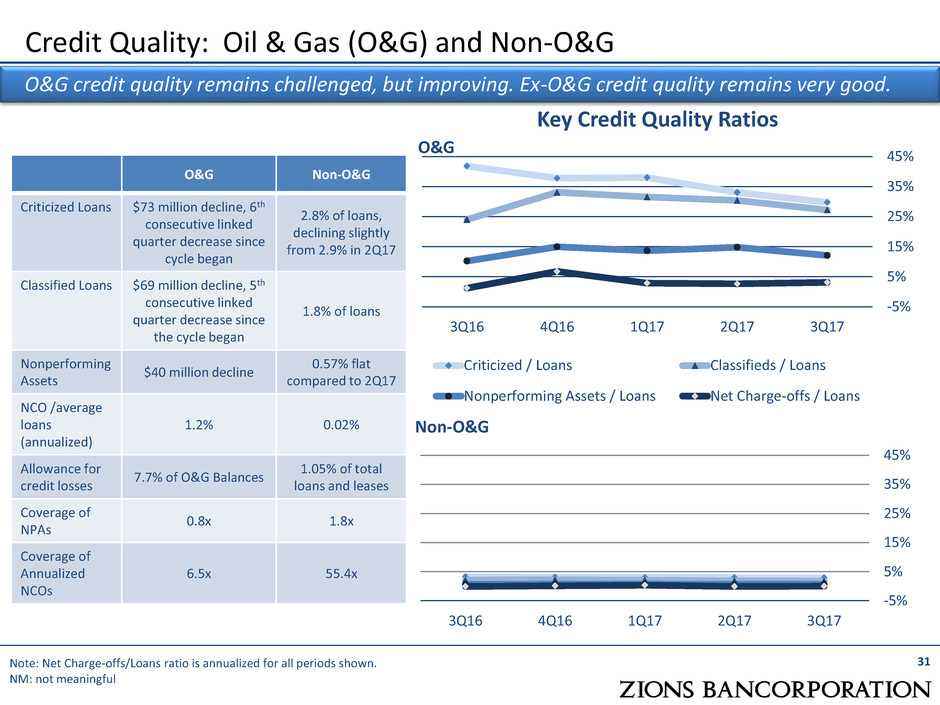
Credit Quality: Oil & Gas (O&G) and Non-O&G 31 Key Credit Quality Ratios O&G credit quality remains challenged, but improving. Ex-O&G credit quality remains very good. Note: Net Charge-offs/Loans ratio is annualized for all periods shown. NM: not meaningful -5% 5% 15% 25% 35% 45% 3Q16 4Q16 1Q17 2Q17 3Q17 Criticized / Loans Classifieds / Loans Nonperforming Assets / Loans Net Charge-offs / Loans O&G Non-O&G Criticized Loans $73 million decline, 6th consecutive linked quarter decrease since cycle began 2.8% of loans, declining slightly from 2.9% in 2Q17 Classified Loans $69 million decline, 5th consecutive linked quarter decrease since the cycle began 1.8% of loans Nonperforming Assets $40 million decline 0.57% flat compared to 2Q17 NCO /average loans (annualized) 1.2% 0.02% Allowance for credit losses 7.7% of O&G Balances 1.05% of total loans and leases Coverage of NPAs 0.8x 1.8x Coverage of Annualized NCOs 6.5x 55.4x O&G Non-O&G -5% 5% 15% 25% 35% 45% 3Q16 4Q16 1Q17 2Q17 3Q17
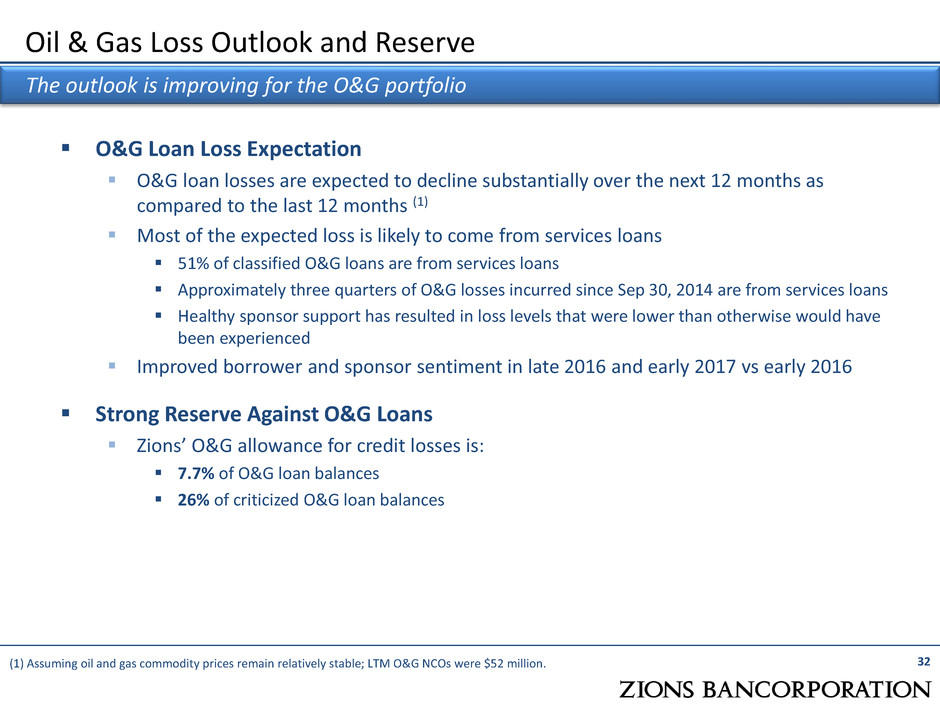
O&G Loan Loss Expectation O&G loan losses are expected to decline substantially over the next 12 months as compared to the last 12 months (1) Most of the expected loss is likely to come from services loans 51% of classified O&G loans are from services loans Approximately three quarters of O&G losses incurred since Sep 30, 2014 are from services loans Healthy sponsor support has resulted in loss levels that were lower than otherwise would have been experienced Improved borrower and sponsor sentiment in late 2016 and early 2017 vs early 2016 Strong Reserve Against O&G Loans Zions’ O&G allowance for credit losses is: 7.7% of O&G loan balances 26% of criticized O&G loan balances 32 Oil & Gas Loss Outlook and Reserve The outlook is improving for the O&G portfolio (1) Assuming oil and gas commodity prices remain relatively stable; LTM O&G NCOs were $52 million.
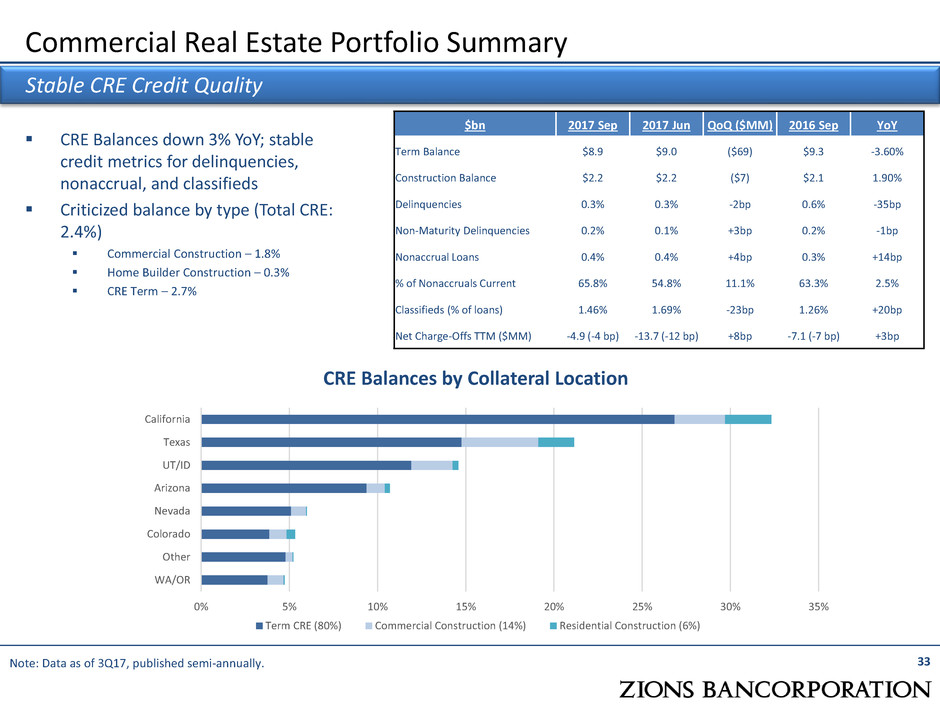
Commercial Real Estate Portfolio Summary 33 Stable CRE Credit Quality Note: Data as of 3Q17, published semi-annually. CRE Balances down 3% YoY; stable credit metrics for delinquencies, nonaccrual, and classifieds Criticized balance by type (Total CRE: 2.4%) Commercial Construction – 1.8% Home Builder Construction – 0.3% CRE Term – 2.7% 0% 5% 10% 15% 20% 25% 30% 35% WA/OR Other Colorado Nevada Arizona UT/ID Texas California CRE Balances by Collateral Location Term CRE (80%) Commercial Construction (14%) Residential Construction (6%) $bn 2017 Sep 2017 Jun QoQ ($MM) 2016 Sep YoY Term Balance $8.9 $9.0 ($69) $9.3 -3.60% Construction Balance $2.2 $2.2 ($7) $2.1 1.90% Delinquencies 0.3% 0.3% -2bp 0.6% -35bp Non-Maturity Delinquencies 0.2% 0.1% +3bp 0.2% -1bp Nonaccrual Loans 0.4% 0.4% +4bp 0.3% +14bp % of Nonaccruals Current 65.8% 54.8% 11.1% 63.3% 2.5% Classifieds (% of loans) 1.46% 1.69% -23bp 1.26% +20bp Net Charge-Offs TTM ($MM) -4.9 (-4 bp) -13.7 (-12 bp) +8bp -7.1 (-7 bp) +3bp
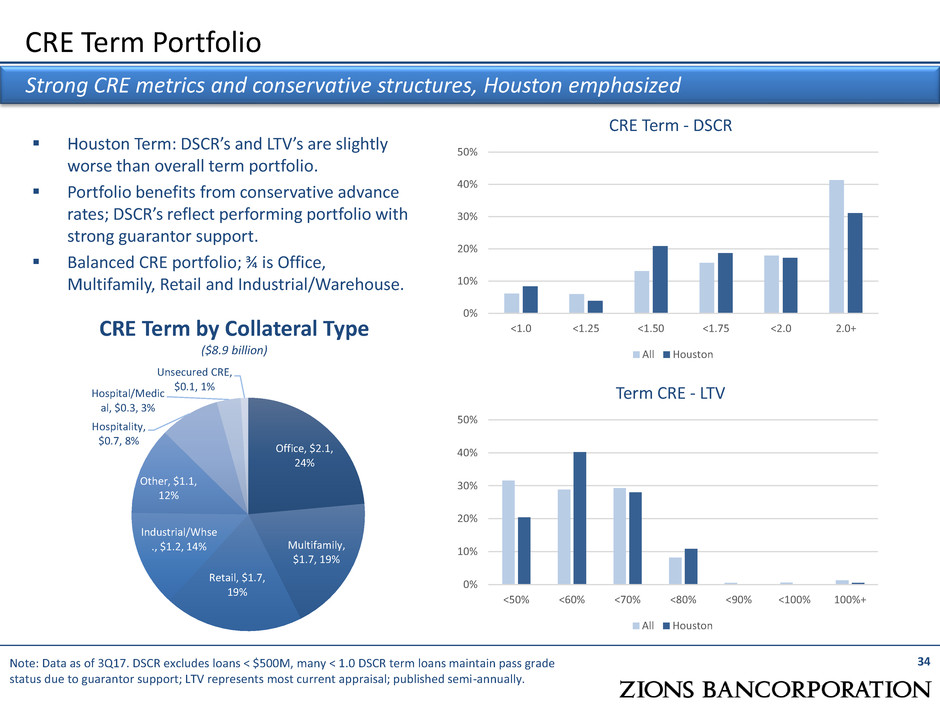
CRE Term Portfolio 34 Strong CRE metrics and conservative structures, Houston emphasized Houston Term: DSCR’s and LTV’s are slightly worse than overall term portfolio. Portfolio benefits from conservative advance rates; DSCR’s reflect performing portfolio with strong guarantor support. Balanced CRE portfolio; ¾ is Office, Multifamily, Retail and Industrial/Warehouse. Note: Data as of 3Q17. DSCR excludes loans < $500M, many < 1.0 DSCR term loans maintain pass grade status due to guarantor support; LTV represents most current appraisal; published semi-annually. CRE Term by Collateral Type ($8.9 billion) Office, $2.1, 24% Multifamily, $1.7, 19% Retail, $1.7, 19% Industrial/Whse ., $1.2, 14% Other, $1.1, 12% Hospitality, $0.7, 8% Hospital/Medic al, $0.3, 3% Unsecured CRE, $0.1, 1% 0% 10% 20% 30% 40% 50% <50% <60% <70% <80% <90% <100% 100%+ Term CRE - LTV All Houston 0% 10% 20% 30% 40% 50% <1.0 <1.25 <1.50 <1.75 <2.0 2.0+ CRE Term - DSCR All Houston

CRE Construction Portfolio 35 Balanced, performing portfolio Note: Data as of 3Q17, published semi-annually. Diversified construction portfolio with 30% Homebuilder Residential, 70% Commercial Homebuilder Residential performing well; ~75% of portfolio in CA and TX YoY construction growth of 2%; Construction as a % of total net loans is < 5% Construction by Collateral Type ($2.2 billion) $7.5 $5.6 $3.5 $2.3 $1.9 $2.2 $2.0 $1.8 $2.0 $2.2 $6.2 $7.3 $7.7 $7.9 $8.1 $8.0 $8.1 $8.5 $9.3 $8.9 20% 22% 24% 26% 28% 30% 32% 34% $0 $2 $4 $6 $8 $10 $12 $14 $16 YE 2008 YE 2009 YE 2010 YE 2011 YE 2012 YE 2013 YE 2014 YE 2015 YE 2016 Q3 2017 Bi llio n s Limited Growth in CRE CRE Const. and Land Dev. CRE Term CRE as a % Of Total Net Loans Homebuilder Residential, $0.65, 30% Multifamily, $0.64, 29% Office, $0.23, 11% Other, $0.23, 10% Land, $0.13, 6% Retail, $0.12, 6% Industrial, $0.12, 6% Hospitality, $0.04, 2%
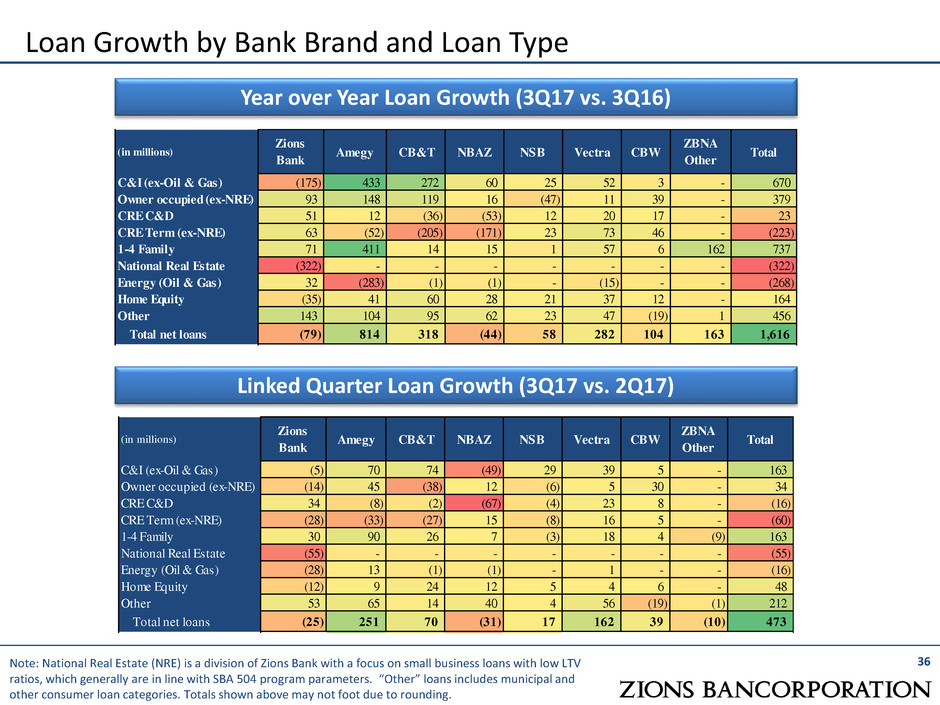
36 Loan Growth by Bank Brand and Loan Type Note: National Real Estate (NRE) is a division of Zions Bank with a focus on small business loans with low LTV ratios, which generally are in line with SBA 504 program parameters. “Other” loans includes municipal and other consumer loan categories. Totals shown above may not foot due to rounding. Year over Year Loan Growth (3Q17 vs. 3Q16) Linked Quarter Loan Growth (3Q17 vs. 2Q17) (in millions) Zions Bank Amegy CB&T NBAZ NSB Vectra CBW ZBNA Other Total C&I (ex-Oil & Gas) (175) 433 272 60 25 52 3 - 670 Owner occupied (ex-NRE) 93 148 119 16 (47) 11 39 - 379 CRE C&D 51 12 (36) (53) 12 20 17 - 23 CRE Term (ex-NRE) 63 (52) (205) (171) 23 73 46 - (223) 1-4 Family 71 411 14 15 1 57 6 162 737 National Real Estate (322) - - - - - - - (322) Energy (Oil & Gas) 32 (283) (1) (1) - (15) - - (268) Home Equity (35) 41 60 28 21 37 12 - 164 Other 143 104 95 62 23 47 (19) 1 456 Total net loans (79) 814 318 (44) 58 282 104 163 1,616 (in millions) Zions Bank Amegy CB&T NBAZ NSB Vectra CBW ZBNA Other Total C&I (ex-Oil & Gas) (5) 70 74 (49) 29 39 5 - 163 wner occupied (ex-NRE) (14) 45 (38) 12 (6) 5 30 - 34 CRE C&D 34 (8) (2) (67) (4) 3 8 - (1 ) CRE Term (ex-NRE) (28) (33) (27) 15 (8) 16 5 - (60) 1-4 Family 30 90 26 7 (3) 18 4 (9) 163 National Real Estate (55) - - - - - - - (55) Energy (Oil & Gas) (28) 13 (1) (1) - 1 - - (16) Home Equity (12) 9 24 12 5 4 6 - 48 Other 53 65 14 40 4 56 (19) (1) 212 Total net loans (25) 251 70 (31) 17 162 39 (10) 473
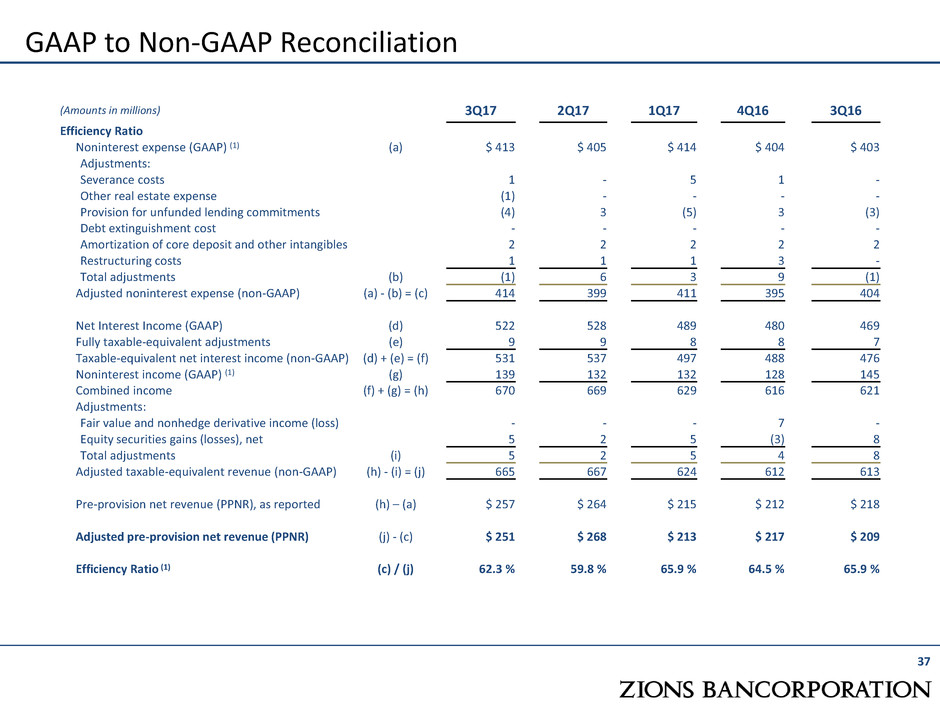
37 GAAP to Non-GAAP Reconciliation (Amounts in millions) 3Q17 2Q17 1Q17 4Q16 3Q16 Efficiency Ratio Noninterest expense (GAAP) (1) (a) $ 413 $ 405 $ 414 $ 404 $ 403 Adjustments: Severance costs 1 - 5 1 - Other real estate expense (1) - - - - Provision for unfunded lending commitments (4) 3 (5) 3 (3) Debt extinguishment cost - - - - - Amortization of core deposit and other intangibles 2 2 2 2 2 Restructuring costs 1 1 1 3 - Total adjustments (b) (1) 6 3 9 (1) Adjusted noninterest expense (non-GAAP) (a) - (b) = (c) 414 399 411 395 404 Net Interest Income (GAAP) (d) 522 528 489 480 469 Fully taxable-equivalent adjustments (e) 9 9 8 8 7 Taxable-equivalent net interest income (non-GAAP) (d) + (e) = (f) 531 537 497 488 476 Noninterest income (GAAP) (1) (g) 139 132 132 128 145 Combined income (f) + (g) = (h) 670 669 629 616 621 Adjustments: Fair value and nonhedge derivative income (loss) - - - 7 - Equity securities gains (losses), net 5 2 5 (3) 8 Total adjustments (i) 5 2 5 4 8 Adjusted taxable-equivalent revenue (non-GAAP) (h) - (i) = (j) 665 667 624 612 613 Pre-provision net revenue (PPNR), as reported (h) – (a) $ 257 $ 264 $ 215 $ 212 $ 218 Adjusted pre-provision net revenue (PPNR) (j) - (c) $ 251 $ 268 $ 213 $ 217 $ 209 Efficiency Ratio (1) (c) / (j) 62.3 % 59.8 % 65.9 % 64.5 % 65.9 %
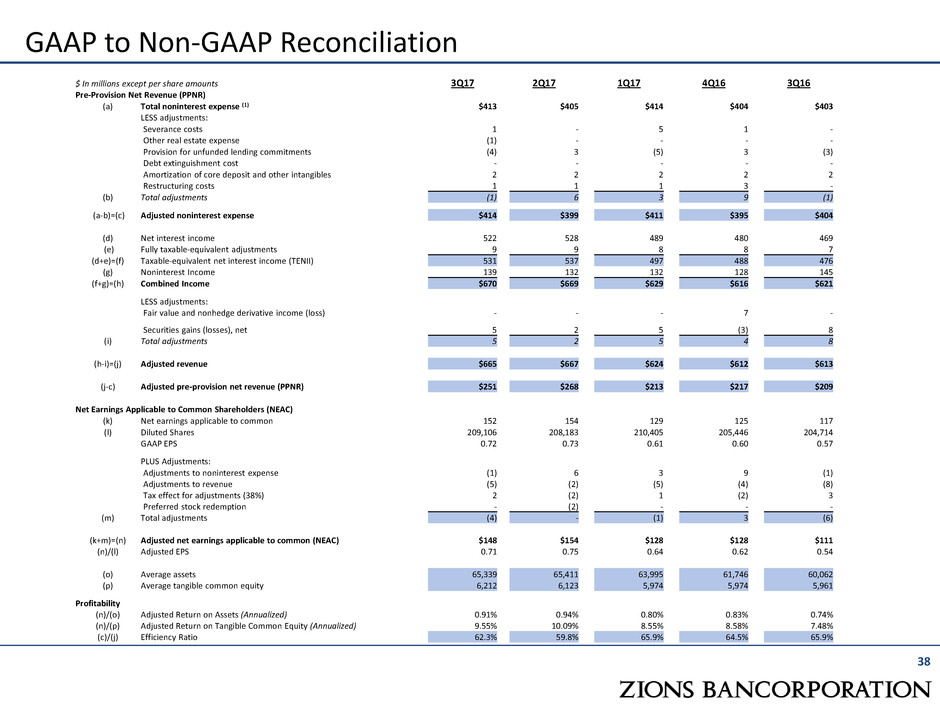
38 GAAP to Non-GAAP Reconciliation $ In millions except per share amounts 3Q17 2Q17 1Q17 4Q16 3Q16 Pre-Provision Net Revenue (PPNR) (a) Total noninterest expense (1) $413 $405 $414 $404 $403 LESS adjustments: Severance costs 1 - 5 1 - Other real estate expense (1) - - - - Provision for unfunded lending commitments (4) 3 (5) 3 (3) Debt extinguishment cost - - - - - Amortization of core deposit and other intangibles 2 2 2 2 2 Restructuring costs 1 1 1 3 - (b) Total adjustments (1) 6 3 9 (1) (a-b)=(c) Adjusted noninterest expense $414 $399 $411 $395 $404 (d) Net interest income 522 528 489 480 469 (e) Fully taxable-equivalent adjustments 9 9 8 8 7 (d+e)=(f) Taxable-equivalent net interest income (TENII) 531 537 497 488 476 (g) Noninterest Income 139 132 132 128 145 (f+g)=(h) Combined Income $670 $669 $629 $616 $621 LESS adjustments: Fair value and nonhedge derivative income (loss) - - - 7 - Securities gains (losses), net 5 2 5 (3) 8 (i) Total adjustments 5 2 5 4 8 (h-i)=(j) Adjusted revenue $665 $667 $624 $612 $613 (j-c) Adjusted pre-provision net revenue (PPNR) $251 $268 $213 $217 $209 Net Earnings Applicable to Common Shareholders (NEAC) (k) Net earnings applicable to common 152 154 129 125 117 (l) Diluted Shares 209,106 208,183 210,405 205,446 204,714 GAAP EPS 0.72 0.73 0.61 0.60 0.57 PLUS Adjustments: Adjustments to noninterest expense (1) 6 3 9 (1) Adjustments to revenue (5) (2) (5) (4) (8) Tax effect for adjustments (38%) 2 (2) 1 (2) 3 Preferred stock redemption - (2) - - - (m) Total adjustments (4) - (1) 3 (6) (k+m)=(n) Adjusted net earnings applicable to common (NEAC) $148 $154 $128 $128 $111 (n)/(l) Adjusted EPS 0.71 0.75 0.64 0.62 0.54 (o) Average assets 65,339 65,411 63,995 61,746 60,062 (p) Average tangible common equity 6,212 6,123 5,974 5,974 5,961 Profitability (n)/(o) Adjusted Return on Assets (Annualized) 0.91% 0.94% 0.80% 0.83% 0.74% (n)/(p) Adjusted Return on Tangible Common Equity (Annualized) 9.55% 10.09% 8.55% 8.58% 7.48% (c)/(j) Efficiency Ratio 62.3% 59.8% 65.9% 64.5% 65.9%
39 Forward-Looking Statements Forward Looking Information The attached presentation includes forward-looking statements within the meaning of Section 21E of the Securities Exchange Act of 1934, as amended, or the Exchange Act. Statements in the attached presentation that are based on other than historical information or that express Zions Bancorporation’s expectations regarding future events or determinations are forward-looking within the meaning of the Private Securities Litigation Reform Act of 1995. Forward-looking statements reflect, among other things, our current expectations, all of which are subject to known and unknown risks, uncertainties and other factors that may cause our actual results, performance or achievements, market trends, industry results or regulatory outcomes to differ materially from those expressed or implied by such forward-looking statements. Without limiting the foregoing, the words “anticipates,” “believes,” “can,” “continue,” “could,” “estimates,” “expects,” “intends,” “may,” “might,” “plans,” “projects,” “should,” “would,” “targets,” “will” and the negative thereof and similar words and expressions are intended to identify forward-looking statements. Forward-looking statements by their nature address matters that are, to different degrees, uncertain, such as statements about future financial and operating results, the potential timing or consummation of the proposed transaction described in the presentation and receipt of regulatory approvals or determinations, or the anticipated benefits thereof, including, without limitation, future financial and operating results. Actual results and outcomes may differ materially from those presented, either expressed or implied, in the presentation. Important risk factors that may cause such material differences include, but are not limited to, the actual amount and duration of declines in the price of oil and gas; Zions’ ability to meet efficiency and noninterest expense goals; the rate of change of interest sensitive assets and liabilities relative to changes in benchmark interest rates; risks and uncertainties related to the ability to obtain shareholder and regulatory approvals or determinations, or the possibility that such approvals or determinations may be delayed; the imposition by regulators of conditions or requirements that are not favorable to Zions; the ability of Zions Bancorporation to achieve anticipated benefits from the consolidation and regulatory determinations; and legislative, regulatory and economic developments that may diminish or eliminate the anticipated benefits of the consolidation. These risks, as well as other factors, are discussed in Zions Bancorporation’s most recent Annual Report on Form 10-K and Quarterly Report on Form 10-Q, filed with the Securities and Exchange Commission (SEC) and available at the SEC’s Internet site (http://www.sec.gov), and other risks associated with the proposed transaction will be more fully discussed in the proxy statement that will be filed with the Securities and Exchange Commission in connection with the proposed transaction. Except as required by law, Zions Bancorporation specifically disclaims any obligation to update any factors or to publicly announce the result of revisions to any of the forward-looking statements included herein to reflect future events or developments. Important Additional Information and Where to Find It Zions Bancorporation will file a proxy statement and other relevant documents concerning the proposed transaction with the Securities and Exchange Commission (SEC). INVESTORS ARE URGED TO READ THE PROXY STATEMENT WHEN IT BECOMES AVAILABLE AND ANY OTHER RELEVANT DOCUMENTS FILED WITH THE SEC BECAUSE THEY WILL CONTAIN IMPORTANT INFORMATION. You will be able to obtain the documents free of charge at the website maintained by the SEC at www.sec.gov. In addition, you may obtain documents filed with the SEC by Zions free of charge by contacting: Investor Relations, Zions Bancorporation, One South Main Street, 15th Floor, Salt Lake City, Utah 84133, (801) 844-7637. Participants in Proxy Solicitation Zions Bancorporation, and its respective directors and executive officers, may be deemed to be participants in the solicitation of proxies from Zions’ shareholders in connection with the proposed transaction. Information about the directors and executive officers of Zions and their ownership of Zions stock is set forth in the proxy statement for Zions’ 2017 Annual Meeting of Shareholders. Investors may obtain additional information regarding the interests of such participants by reading the proxy statement for the proposed transaction when it becomes available.
40 Use of Non-GAAP Financial Measures; Peer Group Key ASB: Associated Banc-Corp BAC: Bank of America BBT: BB&T Corporation BOKF: BOK Financial Corporation C: Citigroup, Inc. CBSH: Commerce Bancshares, Inc. CFG: Citizens Financial Group, Inc. CMA: Comerica Incorporated EWBC: East West Bancorp, Inc. FHN: First Horizon National Corporation FITB: Fifth Third Bancorp FRC: First Republic Bank HBAN: Huntington Bancshares Incorporated JPM: JPMorgan Chase & Co. KEY: KeyCorp MTB: M&T Bank Corporation PBCT: People’s United Financial, Inc. PNC: PNC Financial Services Group RF: Regions Financial Corporation SNV: Synovus Financial Corp. STI: SunTrust Banks, Inc. UB: Union Bank USB: US Bank WBS: Webster Financial WFC: Wells Fargo & Co. ZION: Zions Bancorporation This document contains several references to non-GAAP measures, including pre-provision net revenue and the “efficiency ratio,” which are common industry terms used by investors and financial services analysts. Certain of these non-GAAP measures are key inputs into Zions’ management compensation and are used in Zions’ strategic goals that have been and may continue to be articulated to investors. Therefore, the use of such non-GAAP measures are believed by management to be of substantial interest to the consumers of these financial disclosures and are used prominently throughout the disclosures. A full reconciliation of the difference between such measures and GAAP financials is provided within the document, and users of this document are encouraged to carefully review this reconciliation.


