ZIONS BANCORPORATION, N.A.
Press Release – Page 1
April 22, 2019
|
| |
Zions Bancorporation, N.A.
One South Main
Salt Lake City, UT 84133
April 22, 2019 | |
| www.zionsbancorporation.com |
First Quarter 2019 Financial Results: FOR IMMEDIATE RELEASE
Investor and Media Contact: James Abbott (801) 844-7637
|
|
| Zions Bancorporation, N.A. Reports: 1Q19 Net Earnings¹ of $205 million, diluted EPS of $1.04 |
compared with 1Q18 Net Earnings¹ of $231 million, diluted EPS of $1.09,
and 4Q18 Net Earnings¹ of $217 million, diluted EPS of $1.08 |
FIRST QUARTER RESULTS
|
| | | | | | |
| $1.04 | | $205 million | | 3.68% | | 11.3% |
| Earnings per diluted common share | | Net Earnings 1 | | Net interest margin (“NIM”) | | Common Equity Tier 1 |
|
| | |
| FIRST QUARTER HIGHLIGHTS² |
| | | |
| Net Interest Income and NIM | | Net interest income was $576 million, up 6% |
| NIM was 3.68%, compared with 3.56% |
| Average noninterest-bearing deposits were generally stable at $23.2 billion, compared with $23.4 billion |
| | | |
| Operating Performance | | Pre-provision net revenue ("PPNR") was $284 million, up 7% |
| Adjusted PPNR³ was $285 million, up 8% |
| Noninterest expense was $430 million, up 3% |
| Adjusted noninterest expense³ was $431 million, up 3% |
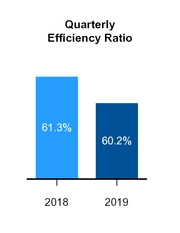
| Efficiency ratio³ was 60.2%, compared with 61.3% |
| | | |
| Loans and Credit Quality | | Net loans and leases were $47.6 billion, up $2.5 billion, or 6% |
| Classified loans were $729 million, down 29%; and nonperforming assets were $240 million, down 39% |
| Provision for credit losses was $4 million, compared with $(47) million |
| Zero net charge-offs in the current quarter, compared with 0.05% of average loans |
| | | |
| Capital Returns | | Return on average tangible common equity³ was 13.9%, compared with 15.5% |
| Common stock repurchases of $275 million, 5.5 million shares, or 2.9% of shares outstanding as of December 31, 2018 |
| Common dividend increased to $0.30 per share from $0.20 per share |
| | | |
| Notable Items | | Successful implementation of core system upgrade for commercial loans in February |
|
|
| CEO COMMENTARY |
| |
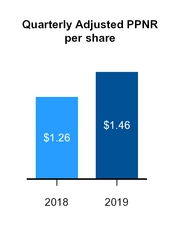
Harris H. Simmons, Chairman and CEO, commented, “First quarter results were fundamentally strong, with earnings per share of $1.04 as compared to $1.09 a year ago. However, the prior year’s first quarter included interest recoveries on several large loans equal to $0.04 per share and a negative provision for credit losses equal to $0.17 per share. Adjusted pre-provision net revenue per share increased 16%; at the same time, credit quality remained strong, with net charged-off loans, as a percentage of average loans and leases, of zero, compared to 0.05% a year ago. Average deposits increased 4% - with noninterest-bearing deposits declining less than 1% - and average loans and leases increased 5% over the prior year period. Economic conditions remain strong throughout the Bank’s market area and we are encouraged by the opportunities we’re seeing for continued healthy growth.”
Mr. Simmons continued, “During the quarter we celebrated the successful completion of the second stage of our three-stage multi-year project to replace the Bank’s core loan and deposit systems. With this milestone reached, Zions now has all its retail, commercial and commercial real estate loans on a new modern core platform.” |
OPERATING PERFORMANCE3 |
|
|
¹ Net Earnings is net earnings applicable to common shareholders.
² Comparisons noted in the bullet points are calculated for the current quarter versus the same prior-year period, unless otherwise specified.
³ For information on non-GAAP financial measures and the reasons for which the Bank presents these numbers, see pages 16-18. |
ZIONS BANCORPORATION, N.A.
Press Release – Page 2
April 22, 2019
Comparisons noted in the sections below are calculated for the current quarter versus the same prior-year period, unless otherwise specified. Growth rates of 100% or more are rendered as not meaningful as they are generally reflective of a low initial starting point.
RESULTS OF OPERATIONS
|
| | | | | | | | | | | | | | | | | | | | | | | | | |
| Net Interest Income and Margin |
| | | | | | | | 1Q19 - 4Q18 | | 1Q19 - 1Q18 |
| (In millions) | 1Q19 | | 4Q18 | | 1Q18 | | $ | | % | | $ | | % |
| Interest and fees on loans | $ | 570 |
| | $ | 555 |
| | $ | 497 |
| | $ | 15 |
| | 3 | % | | $ | 73 |
| | 15 | % |
| Interest on money market investments | 9 |
| | 8 |
| | 6 |
| | 1 |
| | 13 |
| | 3 |
| | 50 |
|
| Interest on securities | 96 |
| | 93 |
| | 86 |
| | 3 |
| | 3 |
| | 10 |
| | 12 |
|
| Total interest income | 675 |
| | 656 |
| | 589 |
| | 19 |
| | 3 |
| | 86 |
| | 15 |
|
| Interest on deposits | 57 |
| | 48 |
| | 20 |
| | 9 |
| | 19 |
| | 37 |
| | NM |
|
| Interest on short and long-term borrowings | 42 |
| | 32 |
| | 27 |
| | 10 |
| | 31 |
| | 15 |
| | 56 |
|
| Total interest expense | 99 |
| | 80 |
| | 47 |
| | 19 |
| | 24 |
| | 52 |
| | NM |
|
| Net interest income | $ | 576 |
| | $ | 576 |
| | $ | 542 |
| | $ | — |
| | — |
| | $ | 34 |
| | 6 |
|
| | | | | | | | bps | | | | bps | | |
| Yield on interest-earning assets | 4.31 | % | | 4.17 | % | | 3.87 | % | | 14 |
| | | | 44 |
| | |
| Rate paid on total deposits and interest-bearing liabilities | 0.67 | % | | 0.54 | % | | 0.33 | % | | 13 |
| | | | 34 |
| | |
| Cost of total deposits, annualized | 0.43 | % | | 0.35 | % | | 0.15 | % | | 8 |
| | | | 28 |
| | |
| Net interest margin | 3.68 | % | | 3.67 | % | | 3.56 | % | | 1 |
| | | | 12 |
| | |
Net interest income increased $34 million, or 6%, to $576 million in the first quarter of 2019 from $542 million in the first quarter of 2018. Total interest income increased $86 million primarily due to a $73 million increase in interest and fees on loans, resulting from increases in consumer and commercial loans and short-term interest rates. Interest expense increased $52 million primarily due to the increase in short-term interest rates, as the Bank’s cost of interest-bearing funding increased from 0.33% to 0.67%.
The yield on interest earning assets was 4.31%, an increase of 14 basis points, compared with the fourth quarter of 2018, and 44 basis points, compared with the first quarter of 2018. When adjusted for interest recoveries of $11 million in the first quarter of 2018, using $1 million per loan as the reporting threshold, the yield on interest earning assets increased 51 basis points from that period. During the first quarter of 2019 and the fourth quarter of 2018, the Bank did not experience any interest income recoveries of at least $1 million per loan.
The rate paid on total deposits and interest-bearing liabilities increased to 0.67% for the first quarter of 2019, from 0.54% for the fourth quarter of 2018, and 0.33% for the first quarter of 2018, primarily as a result of increases in short-term interest rates. The total annualized cost of total deposits for the first quarter of 2019 was 0.43%, compared with 0.35% for the fourth quarter of 2018, and 0.15% for the first quarter of 2018.
The net interest margin increased to 3.68% in the first quarter of 2019, compared with 3.67% in the fourth quarter of 2018, and 3.56% in the same prior year period due to the aforementioned items. Excluding the previously mentioned interest income recoveries in the first quarter of 2018, the net interest margin increased 19 basis points.
ZIONS BANCORPORATION, N.A.
Press Release – Page 3
April 22, 2019
|
| | | | | | | | | | | | | | | | | | | | | | | | | |
| Noninterest Income |
| | | | | | | | 1Q19 - 4Q18 | | 1Q19 - 1Q18 |
| (In millions) | 1Q19 | | 4Q18 | | 1Q18 | | $ | | % | | $ | | % |
| Service charges and fees on deposit accounts | $ | 40 |
| | $ | 41 |
| | $ | 42 |
| | $ | (1 | ) | | (2 | )% | | $ | (2 | ) | | (5 | )% |
| Other service charges, commissions and fees | 54 |
| | 59 |
| | 55 |
| | (5 | ) | | (8 | ) | | (1 | ) | | (2 | ) |
| Wealth management and trust income | 13 |
| | 13 |
| | 12 |
| | — |
| | — |
| | 1 |
| | 8 |
|
| Loan sales and servicing income | 5 |
| | 6 |
| | 6 |
| | (1 | ) | | (17 | ) | | (1 | ) | | (17 | ) |
| Capital markets and foreign exchange | 8 |
| | 9 |
| | 8 |
| | (1 | ) | | (11 | ) | | — |
| | — |
|
| Customer-related fees | 120 |
| | 128 |
| | 123 |
| | (8 | ) | | (6 | ) | | (3 | ) | | (2 | ) |
| Dividends and other investment income | 9 |
| | 10 |
| | 11 |
| | (1 | ) | | (10 | ) | | (2 | ) | | (18 | ) |
| Securities gains (losses), net | 1 |
| | 2 |
| | — |
| | (1 | ) | | (50 | ) | | 1 |
| | NM |
|
| Other | 2 |
| | — |
| | 4 |
| | 2 |
| | NM |
| | (2 | ) | | (50 | ) |
| Total noninterest income | $ | 132 |
| | $ | 140 |
| | $ | 138 |
| | $ | (8 | ) | | (6 | ) | | $ | (6 | ) | | (4 | ) |
Total noninterest income for the first quarter of 2019 decreased by $6 million, or 4%, to $132 million from $138 million for the first quarter of 2018. Customer-related fees decreased $3 million, which was largely attributable to an unfavorable impact from the earnings credit rate associated with noninterest bearing demand deposits and softness in retail and small business service charges.
Dividends and other investment income decreased $2 million primarily as a result of increases in the market values of the Company’s Small Business Investment Company (“SBIC”) investments in the first quarter of 2018 that did not reoccur in the first quarter of 2019. Other noninterest income decreased $2 million primarily due to a decrease in credit valuation adjustments on client-related derivatives, partially offset by a gain on the sale of a minor business line.
|
| | | | | | | | | | | | | | | | | | | | | | | | | |
| Noninterest Expense |
| | | | | | | | 1Q19 - 4Q18 | | 1Q19 - 1Q18 |
| (In millions) | 1Q19 | | 4Q18 | | 1Q18 | | $ | | % | | $ | | % |
| Salaries and employee benefits | $ | 287 |
| | $ | 270 |
| | $ | 269 |
| | $ | 17 |
| | 6 | % | | $ | 18 |
| | 7 | % |
| Occupancy, net | 33 |
| | 35 |
| | 31 |
| | (2 | ) | | (6 | ) | | 2 |
| | 6 |
|
| Furniture, equipment and software, net | 32 |
| | 31 |
| | 33 |
| | 1 |
| | 3 |
| | (1 | ) | | (3 | ) |
| Other real estate expense, net | (1 | ) | | — |
| | — |
| | (1 | ) | | NM |
| | (1 | ) | | NM |
|
| Credit-related expense | 6 |
| | 6 |
| | 7 |
| | — |
| | — |
| | (1 | ) | | (14 | ) |
| Professional and legal services | 11 |
| | 15 |
| | 12 |
| | (4 | ) | | (27 | ) | | (1 | ) | | (8 | ) |
| Advertising | 5 |
| | 6 |
| | 5 |
| | (1 | ) | | (17 | ) | | — |
| | — |
|
| FDIC premiums | 6 |
| | 6 |
| | 13 |
| | — |
| | — |
| | (7 | ) | | (54 | ) |
| Other | 51 |
| | 51 |
| | 49 |
| | — |
| | — |
| | 2 |
| | 4 |
|
| Total noninterest expense | $ | 430 |
| | $ | 420 |
| | $ | 419 |
| | $ | 10 |
| | 2 |
| | $ | 11 |
| | 3 |
|
Adjusted noninterest expense 1 | $ | 431 |
| | $ | 418 |
| | $ | 419 |
| | $ | 13 |
| | 3 |
| | $ | 12 |
| | 3 |
|
| |
1 | For information on non-GAAP financial measures, see pages 16-18. |
Noninterest expense for the first quarter of 2019 was $430 million, an increase of 3%, when compared with $419 million for the first quarter of 2018. Salaries and employee benefits increased $18 million, primarily due to a $6 million increase in base salaries resulting from annual salary merit increases and employee headcount, a $3 million increase in the Bank’s contribution to the employee 401(k) plan as a result of an increased matching contribution and
ZIONS BANCORPORATION, N.A.
Press Release – Page 4
April 22, 2019
higher profit sharing as a result of improved profitability, and a $2 million increase in incentive compensation. The remaining $7 million increase was primarily a result of an increase in share-based compensation and employee medical expenses, and a decline in deferred salaries.
The increase in the aforementioned salaries and employee benefits were partially offset by a $7 million decrease in FDIC premiums. The decrease in FDIC premiums is primarily due to the elimination of the FDIC surcharge for large banks because the required Deposit Insurance Fund reserve ratio has been met.
Our efficiency ratio was 60.2% in the first quarter of 2019, compared with 57.8% in the fourth quarter of 2018, and 61.3% in the first quarter of 2018. Adjusted noninterest expense for the first quarter of 2019 increased $12 million to $431 million, compared with $419 million for the same prior year period. For information on non-GAAP financial measures, including differences between noninterest expense and adjusted noninterest expense, see pages 16-18.
Our effective income tax rate was 22.3% for the first quarter of 2019, compared with 22.1% for the fourth quarter of 2018 and 22.7% for the first quarter of 2018.
BALANCE SHEET ANALYSIS
|
| | | | | | | | | | | | | | | | | | | | | | | | | |
| Asset Quality |
| | | | | | | | 1Q19 - 4Q18 | | 1Q19 - 1Q18 |
| (In millions) | 1Q19 | | 4Q18 | | 1Q18 | | bps | | | | bps | | |
| Ratio of nonperforming assets to loans and leases and other real estate owned | 0.50 | % | | 0.55 | % | | 0.87 | % | | (5 | ) | | | | (37 | ) |
| |
| Annualized ratio of net loan and lease charge-offs (recoveries) to average loans | — | % | | (0.07 | )% | | 0.05 | % | | 7 |
| | | | (5 | ) | | |
| Ratio of allowance for loan losses to loans and leases, at period end | 1.04 | % | | 1.06 | % | | 1.05 | % | | (2 | ) | | | | (1 | ) | | |
| | | | | | | | $ | | % | | $ | | % |
| Classified loans | $ | 729 |
| | $ | 698 |
| | $ | 1,023 |
| | $ | 31 |
| | 4 | % | | $ | (294 | ) | | (29 | )% |
| Nonperforming assets | 240 |
| | 256 |
| | 392 |
| | (16 | ) | | (6 | ) | | (152 | ) | | (39 | ) |
| Net loan and lease charge-offs (recoveries) | — |
| | (8 | ) | | 5 |
| | 8 |
| | NM |
| | (5 | ) | | NM |
|
| Provision for credit losses | 4 |
| | 6 |
| | (47 | ) | | (2 | ) | | (33 | ) | | 51 |
| | NM |
|
Asset quality improved when compared with the same prior year period. Nonperforming assets declined 6% compared with the fourth quarter of 2018, and 39% from the first quarter of 2018 largely due to improvements in the oil and gas-related portfolio. The ratio of nonaccrual loans and accruing loans past due 90 days or more to loans and leases was 0.51%, a reflection of a relatively benign credit environment and disciplined underwriting.
The Bank recorded a $4 million provision for credit losses during the first quarter of 2019, compared with $6 million during the fourth quarter of 2018, and $(47) million for the first quarter of 2018. The provision for credit losses reflects improved loan growth and generally stable asset quality. The allowance for loan losses was $497 million at
ZIONS BANCORPORATION, N.A.
Press Release – Page 5
April 22, 2019
March 31, 2019, compared with $473 million at March 31, 2018, or 1.04% and 1.05% of loans and leases, respectively.
|
| | | | | | | | | | | | | | | | | | | | | | | | | |
| Loans and Leases |
| | | | | | | | 1Q19 - 4Q18 | | 1Q19 - 1Q18 |
| (In millions) | 1Q19 | | 4Q18 | | 1Q18 | | $ | | % | | $ | | % |
| Loans held for sale | $ | 69 |
| | $ | 93 |
| | $ | 90 |
| | $ | (24 | ) | | (26 | )% | | $ | (21 | ) | | (23 | )% |
| Loans and leases: | | | | | | | | | | | | | |
| Commercial | 24,598 |
| | 24,162 |
| | 23,140 |
| | 436 |
| | 2 |
| | 1,458 |
| | 6 |
|
| Commercial real estate | 11,530 |
| | 11,125 |
| | 11,122 |
| | 405 |
| | 4 |
| | 408 |
| | 4 |
|
| Consumer | 11,478 |
| | 11,427 |
| | 10,821 |
| | 51 |
| | — |
| | 657 |
| | 6 |
|
| Loans and leases, net of unearned income and fees | 47,606 |
| | 46,714 |
| | 45,083 |
| | 892 |
| | 2 |
| | 2,523 |
| | 6 |
|
| Less allowance for loan losses | 497 |
| | 495 |
| | 473 |
| | 2 |
| | — |
| | 24 |
| | 5 |
|
| Loans held for investment, net of allowance | $ | 47,109 |
| | $ | 46,219 |
| | $ | 44,610 |
| | $ | 890 |
| | 2 |
| | $ | 2,499 |
| | 6 |
|
Loans and leases, net of unearned income and fees, increased $2.5 billion, or 6%, to $47.6 billion at March 31, 2019 from $45.1 billion at March 31, 2018. Within commercial loans, municipal and owner-occupied loans increased $475 million and $409 million, respectively. Approximately $244 million of the increase in commercial real estate loans was primarily related to draws on existing construction loan commitments. The growth in consumer loans was primarily due to a $526 million increase in 1-4 family residential loans. Unfunded lending commitments and letters of credit increased to $22.4 billion at March 31, 2019, compared with $21.0 billion at March 31, 2018.
|
| | | | | | | | | | | | | | | | | | | | | | | | | |
| Deposits |
| | | | | | | | 1Q19 - 4Q18 | | 1Q19 - 1Q18 |
| (In millions) | 1Q19 | | 4Q18 | | 1Q18 | | $ | | % | | $ | | % |
| Noninterest-bearing demand | $ | 23,259 |
| | $ | 23,645 |
| | $ | 23,909 |
| | $ | (386 | ) | | (2 | )% | | $ | (650 | ) | | (3 | )% |
| Interest-bearing: | | | | | | | | | | | | | |
| Savings and money market | 26,348 |
| | 26,120 |
| | 25,473 |
| | 228 |
| | 1 |
| | 875 |
| | 3 |
|
| Time | 4,928 |
| | 4,336 |
| | 3,581 |
| | 592 |
| | 14 |
| | 1,347 |
| | 38 |
|
| Total deposits | $ | 54,535 |
| | $ | 54,101 |
| | $ | 52,963 |
| | $ | 434 |
| | 1 |
| | $ | 1,572 |
| | 3 |
|
Total deposits increased by $1.6 billion, or 3%, to $54.5 billion from $53.0 billion. Average total deposits increased to $53.9 billion for the first quarter of 2019, compared with $52.0 billion for the first quarter of 2018. Average noninterest bearing deposits were generally stable at $23.2 billion for the first quarter of 2019, compared with $23.4 billion for the first quarter of 2018, and were 43% and 45% of average total deposits, respectively, for the same periods.
ZIONS BANCORPORATION, N.A.
Press Release – Page 6
April 22, 2019
|
| | | | | | | | | | | | | | | | | | | | | | | | | |
| Shareholders’ Equity |
| | | | | | | | 1Q19 - 4Q18 | | 1Q19 - 1Q18 |
| (In millions) | 1Q19 | | 4Q18 | | 1Q18 | | $ | | % | | $ | | % |
| Shareholders’ equity: | | | | | | | | | | | | | |
| Preferred stock | $ | 566 |
| | $ | 566 |
| | $ | 566 |
| | $ | — |
| | — | % | | $ | — |
| | — | % |
| Common stock | — |
| | — |
| | 4,346 |
| | — |
| | NM |
| | (4,346 | ) | | NM |
|
| Additional paid-in capital | 3,541 |
| | 3,806 |
| | — |
| | (265 | ) | | (7 | ) | | 3,541 |
| | NM |
|
| Retained earnings | 3,603 |
| | 3,456 |
| | 2,999 |
| | 147 |
| | 4 |
| | 604 |
| | 20 |
|
| Accumulated other comprehensive income (loss) | (122 | ) | | (250 | ) | | (267 | ) | | 128 |
| | 51 |
| | 145 |
| | 54 |
|
| Total shareholders' equity | $ | 7,588 |
| | $ | 7,578 |
| | $ | 7,644 |
| | $ | 10 |
| | — |
| | $ | (56 | ) | | (1 | ) |
| | | | | | | | | | | | | | |
| Capital distributions: | | | | | | | | | | | | | |
| Common dividends paid | 56 |
| | 57 |
| | 40 |
| | (1 | ) | | (2 | ) | | 16 |
| | 40 |
|
| Bank common stock repurchased | 275 |
| | 250 |
| | 115 |
| | 25 |
| | 10 |
| | 160 |
| | NM |
|
| Total capital distributed to common shareholders | 331 |
| | 307 |
| | 155 |
| | 24 |
| | 8 |
| | 176 |
| | NM |
|
| | | | | | | | | | | | | | |
| Capital distributed as a percentage of net earnings applicable to common shareholders | 161 | % | | 141 | % | | 67 | % | |
| |
| |
| |
|
|
During the first quarter of 2019, the Bank’s common stock dividend was $0.30 per share, compared with $0.20 per share in the first quarter of 2018. Common stock repurchases during the current quarter totaled $275 million, or 5.5 million shares, which is equivalent to 2.9% of common stock outstanding as of December 31, 2018. During the last four quarters, the Bank repurchased $830 million, or 16.3 million shares, of common stock which is equivalent to 8.3% of common stock outstanding as of March 31, 2018. As of March 31, 2019, the Bank had 29.3 million ZIONW warrants outstanding that expire on May 22, 2020.
Tangible book value per common share increased to $32.92 at March 31, 2019, compared with $30.76 at March 31, 2018. Basel III common equity tier 1 (“CET1”) capital was $6.1 billion at March 31, 2019 and $6.3 billion at March 31, 2018. The estimated Basel III CET1 capital ratio was 11.3% at March 31, 2019 compared with 12.2% at March 31, 2018. For information on non-GAAP financial measures, see pages 16-18.
ZIONS BANCORPORATION, N.A.
Press Release – Page 7
April 22, 2019
Supplemental Presentation and Conference Call
Zions has posted a supplemental presentation to its website, which will be used to discuss these first quarter results at 5:30 p.m. ET this afternoon (April 22, 2019). Media representatives, analysts, investors and the public are invited to join this discussion by calling (253) 237-1247 (domestic and international) and entering the passcode 7691657 or via on-demand webcast. A link to the webcast will be available on the Zions Bancorporation website at zionsbancorporation.com. The webcast of the conference call will also be archived and available for 30 days. About Zions Bancorporation, N.A.
Zions Bancorporation, N.A. is one of the nation's premier financial services companies with total assets of approximately $70 billion. Zions operates under local management teams and distinct brands in 11 western states: Arizona, California, Colorado, Idaho, Nevada, New Mexico, Oregon, Texas, Utah, Washington and Wyoming. The Bank is a national leader in Small Business Administration lending and public finance advisory services. The Bank has been the recipient of many local and national awards, primarily reflecting its strong customer service and products. The Bank has a strong commitment to the communities in which it operates. In addition, Zions is included in the S&P 500 and NASDAQ Financial 100 indices. Investor information and links to local banking brands can be accessed at zionsbancorporation.com. Forward-Looking Information
This earnings release includes forward-looking statements within the meaning of Section 21E of the Securities Exchange Act of 1934, as amended, or the Exchange Act. Statements in the earnings release that are based on other than historical information, or that express the Bank’s expectations regarding future events or determinations, are forward-looking within the meaning of the Private Securities Litigation Reform Act of 1995. Forward-looking statements reflect, among other things, our current expectations, all of which are subject to known and unknown risks, uncertainties and other factors that may cause our actual results, performance or achievements, market trends, industry results or regulatory outcomes to differ materially from those expressed or implied by such forward-looking statements.
Without limiting the foregoing, the words “anticipates,” “believes,” “can,” “continue,” “could,” “estimates,” “expects,” “intends,” “may,” “might,” “plans,” “projects,” “should,” “would,” “targets,” “will” and the negative thereof and similar words and expressions are intended to identify forward-looking statements. Forward-looking statements by their nature address matters that are, to different degrees, uncertain, such as statements about future financial and operating results. Actual results and outcomes may differ materially from those presented, either expressed or implied, in the release. Important risk factors that may cause such material differences include, but are not limited to, Zions’ ability to meet operating leverage goals; the rate of change of interest-sensitive assets and liabilities relative to changes in benchmark interest rates; the ability of the Bank to achieve anticipated benefits from its recently completed merger; the ability of the Bank to upgrade its core deposit system and implement new digital products in order to remain competitive with large national banks; and legislative, regulatory and economic
ZIONS BANCORPORATION, N.A.
Press Release – Page 8
April 22, 2019
developments. These risks, as well as other factors, are discussed in the Bank’s most recent Annual Report on Form 10-K and Quarterly Report on Form 10-Q, filed with the Securities and Exchange Commission (SEC) and available at the SEC’s Internet site (https://www.sec.gov/). In addition, you may obtain documents filed with the SEC by the Bank free of charge by contacting: Investor Relations, Zions Bancorporation, N.A., One South Main Street, 11th Floor, Salt Lake City, Utah 84133, (801) 844-7637.
Except as required by law, Zions Bancorporation, N.A. specifically disclaims any obligation to update any factors or to publicly announce the result of revisions to any of the forward-looking statements included herein to reflect future events or developments.
ZIONS BANCORPORATION, N.A.
Press Release – Page 9
April 22, 2019
FINANCIAL HIGHLIGHTS
(Unaudited)
|
| | | | | | | | | | | | | | | | | | | |
| | Three Months Ended |
| (In millions, except share, per share, and ratio data) | March 31,
2019 | | December 31,
2018 | | September 30,
2018 | | June 30,
2018 | | March 31,
2018 |
BALANCE SHEET 1 | | | | | | | | | |
| Loans held for investment, net of allowance | $ | 47,109 |
| | $ | 46,219 |
| | $ | 45,330 |
| | $ | 44,740 |
| | $ | 44,610 |
|
| Total assets | 69,195 |
| | 68,746 |
| | 66,731 |
| | 66,457 |
| | 66,481 |
|
| Deposits | 54,535 |
| | 54,101 |
| | 53,785 |
| | 53,580 |
| | 52,963 |
|
| Total shareholders’ equity | 7,588 |
| | 7,578 |
| | 7,553 |
| | 7,621 |
| | 7,644 |
|
| STATEMENT OF INCOME | | | | | | | | | |
| Net earnings applicable to common shareholders | $ | 205 |
| | $ | 217 |
| | $ | 215 |
| | $ | 187 |
| | $ | 231 |
|
| Net interest income | 576 |
| | 576 |
| | 565 |
| | 548 |
| | 542 |
|
Taxable-equivalent net interest income 2 | 582 |
| | 582 |
| | 570 |
| | 553 |
| | 547 |
|
| Total noninterest income | 132 |
| | 140 |
| | 136 |
| | 138 |
| | 138 |
|
| Total noninterest expense | 430 |
| | 420 |
| | 420 |
| | 421 |
| | 419 |
|
Adjusted pre-provision net revenue 2 | 285 |
| | 305 |
| | 291 |
| | 270 |
| | 265 |
|
| Provision for credit losses | 4 |
| | 6 |
| | (11 | ) | | 12 |
| | (47 | ) |
| SHARE AND PER COMMON SHARE AMOUNTS | | | | | | | | | |
| Net earnings per diluted common share | $ | 1.04 |
| | $ | 1.08 |
| | $ | 1.04 |
| | $ | 0.89 |
| | $ | 1.09 |
|
| Dividends | 0.30 |
| | 0.30 |
| | 0.30 |
| | 0.24 |
| | 0.20 |
|
Book value per common share 1 | 38.47 |
| | 37.39 |
| | 36.36 |
| | 36.11 |
| | 35.92 |
|
Tangible book value per common share 1, 2 | 32.92 |
| | 31.97 |
| | 31.08 |
| | 30.91 |
| | 30.76 |
|
| Weighted average share price | 47.71 |
| | 46.61 |
| | 52.80 |
| | 55.19 |
| | 53.82 |
|
| Weighted average common and common-equivalent shares outstanding (in thousands) | 195,241 |
| | 199,048 |
| | 205,765 |
| | 209,247 |
| | 210,243 |
|
Common shares outstanding (in thousands) 1 | 182,513 |
| | 187,554 |
| | 192,169 |
| | 195,392 |
| | 197,050 |
|
| SELECTED RATIOS AND OTHER DATA | | | | | | | | | |
| Return on average assets | 1.26 | % | | 1.34 | % | | 1.33 | % | | 1.19 | % | | 1.45 | % |
| Return on average common equity | 11.9 | % | | 12.4 | % | | 12.1 | % | | 10.6 | % | | 13.3 | % |
Return on average tangible common equity 2 | 13.9 | % | | 14.5 | % | | 14.2 | % | | 12.4 | % | | 15.5 | % |
| Net interest margin | 3.68 | % | | 3.67 | % | | 3.63 | % | | 3.56 | % | | 3.56 | % |
| Cost of total deposits, annualized | 0.43 | % | | 0.35 | % | | 0.28 | % | | 0.22 | % | | 0.15 | % |
Efficiency ratio 2 | 60.2 | % | | 57.8 | % | | 58.8 | % | | 60.9 | % | | 61.3 | % |
| Effective tax rate | 22.3 | % | | 22.1 | % | | 23.6 | % | | 22.1 | % | | 22.7 | % |
| Ratio of nonperforming assets to loans and leases and other real estate owned | 0.50 | % | | 0.55 | % | | 0.64 | % | | 0.77 | % | | 0.87 | % |
| Annualized ratio of net loan and lease charge-offs (recoveries) to average loans | — | % | | (0.07 | )% | | (0.01 | )% | | (0.11 | )% | | 0.05 | % |
Ratio of total allowance for credit losses to loans and leases outstanding 1 | 1.17 | % | | 1.18 | % | | 1.17 | % | | 1.21 | % | | 1.16 | % |
| Full-time equivalent employees | 10,204 |
| | 10,201 |
| | 10,143 |
| | 10,217 |
| | 10,122 |
|
CAPITAL RATIOS AND DATA 1 | | | | | | | | | |
| Common equity tier 1 capital | $ | 6,124 |
| | $ | 6,245 |
| | $ | 6,331 |
| | $ | 6,360 |
| | $ | 6,333 |
|
| Risk-weighted assets | 54,404 |
| | 53,591 |
| | 52,493 |
| | 52,012 |
| | 51,779 |
|
| Tangible common equity ratio | 8.8 | % | | 8.9 | % | | 9.1 | % | | 9.2 | % | | 9.3 | % |
| Common equity tier 1 capital ratio | 11.3 | % | | 11.7 | % | | 12.1 | % | | 12.2 | % | | 12.2 | % |
| Tier 1 leverage ratio | 9.9 | % | | 10.3 | % | | 10.5 | % | | 10.5 | % | | 10.5 | % |
| Tier 1 risk-based capital ratio | 12.3 | % | | 12.7 | % | | 13.1 | % | | 13.3 | % | | 13.3 | % |
| Total risk-based capital ratio | 13.5 | % | | 13.9 | % | | 14.6 | % | | 14.8 | % | | 14.8 | % |
| |
2 | For information on non-GAAP financial measures, see pages 16-18. |
ZIONS BANCORPORATION, N.A.
Press Release – Page 10
April 22, 2019
CONSOLIDATED BALANCE SHEETS
(Unaudited)
|
| | | | | | | | | | | | | | | | | | | |
| (In millions, shares in thousands) | March 31,
2019 | | December 31,
2018 | | September 30,
2018 | | June 30,
2018 | | March 31,
2018 |
| | (Unaudited) | | | | (Unaudited) | | (Unaudited) | | (Unaudited) |
| ASSETS | | | | | | | | | |
| Cash and due from banks | $ | 536 |
| | $ | 614 |
| | $ | 517 |
| | $ | 468 |
| | $ | 470 |
|
| Money market investments: | | | | | | | | | |
| Interest-bearing deposits | 702 |
| | 619 |
| | 590 |
| | 698 |
| | 717 |
|
| Federal funds sold and security resell agreements | 438 |
| | 1,461 |
| | 560 |
| | 558 |
| | 696 |
|
| Investment securities: | | | | | | | | | |
| Held-to-maturity, at amortized cost (approximate fair value $762, $767, $734, $866 and $752) | 764 |
| | 774 |
| | 751 |
| | 878 |
| | 768 |
|
| Available-for-sale, at fair value | 14,904 |
| | 14,737 |
| | 14,625 |
| | 14,627 |
| | 14,896 |
|
| Trading account, at fair value | 316 |
| | 106 |
| | 176 |
| | 207 |
| | 143 |
|
| Total investment securities | 15,984 |
| | 15,617 |
| | 15,552 |
| | 15,712 |
| | 15,807 |
|
| Loans held for sale | 69 |
| | 93 |
| | 61 |
| | 84 |
| | 90 |
|
| Loans and leases, net of unearned income and fees | 47,606 |
| | 46,714 |
| | 45,810 |
| | 45,230 |
| | 45,083 |
|
| Less allowance for loan losses | 497 |
| | 495 |
| | 480 |
| | 490 |
| | 473 |
|
| Loans held for investment, net of allowance | 47,109 |
| | 46,219 |
| | 45,330 |
| | 44,740 |
| | 44,610 |
|
| Other noninterest-bearing investments | 993 |
| | 1,046 |
| | 1,027 |
| | 1,054 |
| | 1,073 |
|
| Premises, equipment and software, net | 1,125 |
| | 1,124 |
| | 1,111 |
| | 1,099 |
| | 1,098 |
|
| Goodwill and intangibles | 1,014 |
| | 1,015 |
| | 1,015 |
| | 1,015 |
| | 1,016 |
|
| Other real estate owned | 6 |
| | 4 |
| | 4 |
| | 5 |
| | 5 |
|
| Other assets | 1,219 |
| | 934 |
| | 964 |
| | 1,024 |
| | 899 |
|
| Total assets | $ | 69,195 |
| | $ | 68,746 |
| | $ | 66,731 |
| | $ | 66,457 |
| | $ | 66,481 |
|
| LIABILITIES AND SHAREHOLDERS’ EQUITY | | | | | | | | | |
| Deposits: | | | | | | | | | |
| Noninterest-bearing demand | $ | 23,259 |
| | $ | 23,645 |
| | $ | 24,067 |
| | $ | 24,007 |
| | $ | 23,909 |
|
| Interest-bearing: | | | | | | | | | |
| Savings and money market | 26,348 |
| | 26,120 |
| | 25,462 |
| | 25,562 |
| | 25,473 |
|
| Time | 4,928 |
| | 4,336 |
| | 4,256 |
| | 4,011 |
| | 3,581 |
|
| Total deposits | 54,535 |
| | 54,101 |
| | 53,785 |
| | 53,580 |
| | 52,963 |
|
| Federal funds purchased and other short-term borrowings | 4,944 |
| | 5,653 |
| | 3,780 |
| | 4,158 |
| | 4,867 |
|
| Long-term debt | 1,228 |
| | 724 |
| | 879 |
| | 383 |
| | 383 |
|
| Reserve for unfunded lending commitments | 59 |
| | 57 |
| | 58 |
| | 58 |
| | 51 |
|
| Other liabilities | 841 |
| | 633 |
| | 676 |
| | 657 |
| | 573 |
|
| Total liabilities | 61,607 |
| | 61,168 |
| | 59,178 |
| | 58,836 |
| | 58,837 |
|
| Shareholders’ equity: | | | | | | | | | |
| Preferred stock, without par value; authorized 4,400 shares | 566 |
| | 566 |
| | 566 |
| | 566 |
| | 566 |
|
| Common stock ($0.001 par value; authorized 350,000 shares; issued and outstanding 182,513, 187,554, 192,169, 195,392, and 197,050 shares) | — |
| | — |
| | — |
| | 4,231 |
| | 4,346 |
|
| Additional paid-in-capital | 3,541 |
| | 3,806 |
| | 4,052 |
| | — |
| | — |
|
| Retained earnings | 3,603 |
| | 3,456 |
| | 3,296 |
| | 3,139 |
| | 2,999 |
|
| Accumulated other comprehensive income (loss) | (122 | ) | | (250 | ) | | (361 | ) | | (315 | ) | | (267 | ) |
| Total shareholders’ equity | 7,588 |
| | 7,578 |
| | 7,553 |
| | 7,621 |
| | 7,644 |
|
| Total liabilities and shareholders’ equity | $ | 69,195 |
| | $ | 68,746 |
| | $ | 66,731 |
| | $ | 66,457 |
| | $ | 66,481 |
|
ZIONS BANCORPORATION, N.A.
Press Release – Page 11
April 22, 2019
CONSOLIDATED STATEMENTS OF INCOME
(Unaudited) |
| | | | | | | | | | | | | | | | | | | |
| | Three Months Ended |
| (In millions, except share and per share amounts) | March 31,
2019 | | December 31,
2018 | | September 30,
2018 | | June 30,
2018 | | March 31,
2018 |
| Interest income: | | | | | | | | | |
| Interest and fees on loans | $ | 570 |
| | $ | 555 |
| | $ | 537 |
| | $ | 514 |
| | $ | 497 |
|
| Interest on money market investments | 9 |
| | 8 |
| | 8 |
| | 7 |
| | 6 |
|
| Interest on securities | 96 |
| | 93 |
| | 86 |
| | 85 |
| | 86 |
|
| Total interest income | 675 |
| | 656 |
| | 631 |
| | 606 |
| | 589 |
|
| Interest expense: | | | | | | | | | |
| Interest on deposits | 57 |
| | 48 |
| | 38 |
| | 29 |
| | 20 |
|
| Interest on short- and long-term borrowings | 42 |
| | 32 |
| | 28 |
| | 29 |
| | 27 |
|
| Total interest expense | 99 |
| | 80 |
| | 66 |
| | 58 |
| | 47 |
|
| Net interest income | 576 |
| | 576 |
| | 565 |
| | 548 |
| | 542 |
|
| Provision for credit losses: | | | | | | | | | |
| Provision for loan losses | 2 |
| | 7 |
| | (11 | ) | | 5 |
| | (40 | ) |
| Provision for unfunded lending commitments | 2 |
| | (1 | ) | | — |
| | 7 |
| | (7 | ) |
| Total provision for credit losses | 4 |
| | 6 |
| | (11 | ) | | 12 |
| | (47 | ) |
| Net interest income after provision for loan losses | 572 |
| | 570 |
| | 576 |
| | 536 |
| | 589 |
|
| Noninterest income: | | | | | | | | | |
| Service charges and fees on deposit accounts | 40 |
| | 41 |
| | 42 |
| | 42 |
| | 42 |
|
| Other service charges, commissions and fees | 54 |
| | 59 |
| | 59 |
| | 55 |
| | 55 |
|
| Wealth management and trust income | 13 |
| | 13 |
| | 12 |
| | 14 |
| | 12 |
|
| Loan sales and servicing income | 5 |
| | 6 |
| | 5 |
| | 7 |
| | 6 |
|
| Capital markets and foreign exchange | 8 |
| | 9 |
| | 7 |
| | 7 |
| | 8 |
|
| Customer-related fees | 120 |
| | 128 |
|
| 125 |
| | 125 |
| | 123 |
|
| Dividends and other investment income | 9 |
| | 10 |
| | 11 |
| | 11 |
| | 11 |
|
| Securities gains (losses), net | 1 |
| | 2 |
| | (1 | ) | | 1 |
| | — |
|
| Other | 2 |
| | — |
| | 1 |
| | 1 |
| | 4 |
|
| Total noninterest income | 132 |
| | 140 |
| | 136 |
| | 138 |
| | 138 |
|
| Noninterest expense: | | | | | | | | | |
| Salaries and employee benefits | 287 |
| | 270 |
| | 264 |
| | 266 |
| | 269 |
|
| Occupancy, net | 33 |
| | 35 |
| | 33 |
| | 32 |
| | 31 |
|
| Furniture, equipment and software, net | 32 |
| | 31 |
| | 30 |
| | 32 |
| | 33 |
|
| Other real estate expense, net | (1 | ) | | — |
| | 1 |
| | — |
| | — |
|
| Credit-related expense | 6 |
| | 6 |
| | 5 |
| | 7 |
| | 7 |
|
| Professional and legal services | 11 |
| | 15 |
| | 12 |
| | 14 |
| | 12 |
|
| Advertising | 5 |
| | 6 |
| | 8 |
| | 7 |
| | 5 |
|
| FDIC premiums | 6 |
| | 6 |
| | 18 |
| | 14 |
| | 13 |
|
| Other | 51 |
| | 51 |
| | 49 |
| | 49 |
| | 49 |
|
| Total noninterest expense | 430 |
| | 420 |
| | 420 |
| | 421 |
| | 419 |
|
| Income before income taxes | 274 |
| | 290 |
| | 292 |
| | 253 |
| | 308 |
|
| Income taxes | 61 |
| | 64 |
| | 69 |
| | 56 |
| | 70 |
|
| Net income | 213 |
| | 226 |
| | 223 |
| | 197 |
| | 238 |
|
| Preferred stock dividends | (8 | ) | | (9 | ) | | (8 | ) | | (10 | ) | | (7 | ) |
| Net earnings applicable to common shareholders | $ | 205 |
| | $ | 217 |
| | $ | 215 |
| | $ | 187 |
| | $ | 231 |
|
| Weighted average common shares outstanding during the period: | | | | | | | | |
| Basic shares (in thousands) | 184,767 |
| | 189,169 |
| | 192,973 |
| | 195,583 |
| | 196,722 |
|
| Diluted shares (in thousands) | 195,241 |
| | 199,048 |
| | 205,765 |
| | 209,247 |
| | 210,243 |
|
| Net earnings per common share: | | | | | | | | | |
| Basic | $ | 1.10 |
| | $ | 1.14 |
| | $ | 1.11 |
| | $ | 0.95 |
| | $ | 1.16 |
|
| Diluted | 1.04 |
| | 1.08 |
| | 1.04 |
| | 0.89 |
| | 1.09 |
|
ZIONS BANCORPORATION, N.A.
Press Release – Page 12
April 22, 2019
Loan Balances Held for Investment by Portfolio Type
(Unaudited)
|
| | | | | | | | | | | | | | | | | | | |
| (In millions) | March 31,
2019 | | December 31,
2018 | | September 30,
2018 | | June 30,
2018 | | March 31,
2018 |
| Commercial: | | | | | | | | | |
| Commercial and industrial | $ | 14,758 |
| | $ | 14,513 |
| | $ | 14,096 |
| | $ | 14,134 |
| | $ | 14,125 |
|
| Leasing | 312 |
| | 327 |
| | 332 |
| | 358 |
| | 371 |
|
| Owner occupied | 7,754 |
| | 7,661 |
| | 7,548 |
| | 7,365 |
| | 7,345 |
|
| Municipal | 1,774 |
| | 1,661 |
| | 1,563 |
| | 1,388 |
| | 1,299 |
|
| Total commercial | 24,598 |
| | 24,162 |
| | 23,539 |
| | 23,245 |
| | 23,140 |
|
| Commercial real estate: | | | | | | | | | |
| Construction and land development | 2,343 |
| | 2,186 |
| | 2,295 |
| | 2,202 |
| | 2,099 |
|
| Term | 9,187 |
| | 8,939 |
| | 8,752 |
| | 8,771 |
| | 9,023 |
|
| Total commercial real estate | 11,530 |
| | 11,125 |
| | 11,047 |
| | 10,973 |
| | 11,122 |
|
| Consumer: | | | | | | | | | |
| Home equity credit line | 2,884 |
| | 2,937 |
| | 2,884 |
| | 2,825 |
| | 2,792 |
|
| 1-4 family residential | 7,294 |
| | 7,176 |
| | 7,039 |
| | 6,861 |
| | 6,768 |
|
| Construction and other consumer real estate | 636 |
| | 643 |
| | 644 |
| | 661 |
| | 599 |
|
| Bankcard and other revolving plans | 489 |
| | 491 |
| | 483 |
| | 490 |
| | 488 |
|
| Other | 175 |
| | 180 |
| | 174 |
| | 175 |
| | 174 |
|
| Total consumer | 11,478 |
| | 11,427 |
| | 11,224 |
| | 11,012 |
| | 10,821 |
|
| Loans and leases, net of unearned income and fees | $ | 47,606 |
| | $ | 46,714 |
| | $ | 45,810 |
| | $ | 45,230 |
| | $ | 45,083 |
|
Nonperforming Assets
(Unaudited)
|
| | | | | | | | | | | | | | | | | | | |
| (In millions) | March 31,
2019 | | December 31,
2018 | | September 30,
2018 | | June 30,
2018 | | March 31,
2018 |
| | | | | | | | | | |
Nonaccrual loans1 | $ | 234 |
| | $ | 252 |
| | $ | 288 |
| | $ | 342 |
| | $ | 387 |
|
| Other real estate owned | 6 |
| | 4 |
| | 4 |
| | 5 |
| | 5 |
|
| Total nonperforming assets | $ | 240 |
| | $ | 256 |
| | $ | 292 |
| | $ | 347 |
| | $ | 392 |
|
Ratio of nonperforming assets to loans1 and leases and other real estate owned | 0.50 | % | | 0.55 | % | | 0.64 | % | | 0.77 | % | | 0.87 | % |
| Accruing loans past due 90 days or more | $ | 8 |
| | $ | 10 |
| | $ | 12 |
| | $ | 5 |
| | $ | 16 |
|
Ratio of accruing loans past due 90 days or more to loans1 and leases | 0.02 | % | | 0.02 | % | | 0.03 | % | | 0.01 | % | | 0.04 | % |
| Nonaccrual loans and accruing loans past due 90 days or more | $ | 242 |
| | $ | 262 |
| | $ | 300 |
| | $ | 347 |
| | $ | 403 |
|
Ratio of nonaccrual loans and accruing loans past due 90 days or more to loans1 and leases | 0.51 | % | | 0.56 | % | | 0.65 | % | | 0.77 | % | | 0.89 | % |
| Accruing loans past due 30-89 days | $ | 142 |
| | $ | 65 |
| | $ | 87 |
| | $ | 119 |
| | $ | 98 |
|
| Restructured loans included in nonaccrual loans | 76 |
| | 90 |
| | 90 |
| | 77 |
| | 86 |
|
| Restructured loans on accrual | 98 |
| | 112 |
| | 114 |
| | 104 |
| | 143 |
|
| Classified loans | 729 |
| | 698 |
| | 784 |
| | 947 |
| | 1,023 |
|
1 Includes loans held for sale.
ZIONS BANCORPORATION, N.A.
Press Release – Page 13
April 22, 2019
Allowance for Credit Losses
(Unaudited)
|
| | | | | | | | | | | | | | | | | | | |
| | Three Months Ended |
| (In millions) | March 31,
2019 | | December 31,
2018 | | September 30,
2018 | | June 30,
2018 | | March 31,
2018 |
| Allowance for Loan Losses | | | | | | | | | |
| Balance at beginning of period | $ | 495 |
| | $ | 480 |
| | $ | 490 |
| | $ | 473 |
| | $ | 518 |
|
| Provision for loan losses | 2 |
| | 7 |
| | (11 | ) | | 5 |
| | (40 | ) |
| Loan and lease charge-offs | 12 |
| | 13 |
| | 17 |
| | 13 |
| | 26 |
|
| Less: Recoveries | 12 |
| | 21 |
| | 18 |
| | 25 |
| | 21 |
|
| Net loan and lease charge-offs (recoveries) | — |
| | (8 | ) | | (1 | ) | | (12 | ) | | 5 |
|
| Balance at end of period | $ | 497 |
| | $ | 495 |
| | $ | 480 |
| | $ | 490 |
| | $ | 473 |
|
Ratio of allowance for loan losses to loans1 and leases, at period end | 1.04 | % | | 1.06 | % | | 1.05 | % | | 1.08 | % | | 1.05 | % |
Ratio of allowance for loan losses to nonaccrual loans1 at period end | 212 | % | | 201 | % | | 167 | % | | 143 | % | | 131 | % |
| Annualized ratio of net loan and lease charge-offs (recoveries) to average loans | — | % | | (0.07 | )% | | (0.01 | )% | | (0.11 | )% | | 0.05 | % |
| | | | | | | | | | |
| Reserve for Unfunded Lending Commitments | | | | | | | | | |
| Balance at beginning of period | $ | 57 |
| | $ | 58 |
| | $ | 58 |
| | $ | 51 |
| | $ | 58 |
|
| Provision for unfunded lending commitments | 2 |
| | (1 | ) | | — |
| | 7 |
| | (7 | ) |
| Balance at end of period | $ | 59 |
| | $ | 57 |
| | $ | 58 |
| | $ | 58 |
| | $ | 51 |
|
| | | | | | | | | | |
| Allowance for Credit Losses | | | | | | | | | |
| Allowance for loan losses | $ | 497 |
| | $ | 495 |
| | $ | 480 |
| | $ | 490 |
| | $ | 473 |
|
| Reserve for unfunded lending commitments | 59 |
| | 57 |
| | 58 |
| | 58 |
| | 51 |
|
| Total allowance for credit losses | $ | 556 |
| | $ | 552 |
| | $ | 538 |
| | $ | 548 |
| | $ | 524 |
|
Ratio of total allowance for credit losses to loans1 and leases outstanding, at period end | 1.17 | % | | 1.18 | % | | 1.17 | % | | 1.21 | % | | 1.16 | % |
1 Does not include loans held for sale.
ZIONS BANCORPORATION, N.A.
Press Release – Page 14
April 22, 2019
Nonaccrual Loans by Portfolio Type
(Unaudited)
|
| | | | | | | | | | | | | | | | | | | |
| (In millions) | March 31,
2019 | | December 31,
2018 | | September 30,
2018 | | June 30,
2018 | | March 31,
2018 |
| | | | | | | | | | |
| Loans held for sale | $ | — |
| | $ | 6 |
| | $ | — |
| | $ | — |
| | $ | 26 |
|
| Commercial: | | | | | | | | | |
| Commercial and industrial | $ | 72 |
| | $ | 82 |
| | $ | 112 |
| | $ | 142 |
| | $ | 140 |
|
| Leasing | 1 |
| | 2 |
| | 2 |
| | 7 |
| | 8 |
|
| Owner occupied | 69 |
| | 67 |
| | 66 |
| | 63 |
| | 80 |
|
| Municipal | 1 |
| | 1 |
| | 1 |
| | 1 |
| | 1 |
|
| Total commercial | 143 |
| | 152 |
| | 181 |
| | 213 |
| | 229 |
|
| Commercial real estate: | | | | | | | | | |
| Construction and land development | 1 |
| | — |
| | — |
| | 5 |
| | 5 |
|
| Term | 32 |
| | 38 |
| | 46 |
| | 53 |
| | 57 |
|
| Total commercial real estate | 33 |
| | 38 |
| | 46 |
| | 58 |
| | 62 |
|
| Consumer: | | | | | | | | | |
| Home equity credit line | 11 |
| | 13 |
| | 13 |
| | 14 |
| | 14 |
|
| 1-4 family residential | 45 |
| | 42 |
| | 47 |
| | 56 |
| | 54 |
|
| Construction and other consumer real estate | 2 |
| | — |
| | — |
| | 1 |
| | 1 |
|
| Bankcard and other revolving plans | — |
| | 1 |
| | 1 |
| | — |
| | 1 |
|
| Other | — |
| | — |
| | — |
| | — |
| | — |
|
| Total consumer | 58 |
| | 56 |
| | 61 |
| | 71 |
| | 70 |
|
| Total nonaccrual loans | $ | 234 |
| | $ | 252 |
| | $ | 288 |
| | $ | 342 |
| | $ | 387 |
|
Net Charge-Offs by Portfolio Type
(Unaudited)
|
| | | | | | | | | | | | | | | | | | | |
| (In millions) | March 31,
2019 | | December 31,
2018 | | September 30,
2018 | | June 30,
2018 | | March 31,
2018 |
| Commercial: | | | | | | | | | |
| Commercial and industrial | $ | 1 |
| | $ | (10 | ) | | $ | (3 | ) | | $ | (10 | ) | | $ | — |
|
| Leasing | — |
| | — |
| | — |
| | — |
| | 1 |
|
| Owner occupied | 1 |
| | — |
| | (1 | ) | | — |
| | 1 |
|
| Municipal | — |
| | — |
| | — |
| | — |
| | — |
|
| Total commercial | 2 |
| | (10 | ) | | (4 | ) | | (10 | ) | | 2 |
|
| Commercial real estate: | | | | | | | | | |
| Construction and land development | — |
| | (1 | ) | | (2 | ) | | (1 | ) | | (2 | ) |
| Term | (2 | ) | | — |
| | 4 |
| | (2 | ) | | — |
|
| Total commercial real estate | (2 | ) | | (1 | ) | | 2 |
| | (3 | ) | | (2 | ) |
| Consumer: | | | | | | | | | |
| Home equity credit line | (1 | ) | | — |
| | (1 | ) | | (1 | ) | | 1 |
|
| 1-4 family residential | (1 | ) | | — |
| | — |
| | — |
| | 2 |
|
| Construction and other consumer real estate | — |
| | — |
| | — |
| | — |
| | — |
|
| Bankcard and other revolving plans | 1 |
| | 2 |
| | 2 |
| | 2 |
| | 2 |
|
| Other | 1 |
| | 1 |
| | — |
| | — |
| | — |
|
| Total consumer loans | — |
| | 3 |
| | 1 |
| | 1 |
| | 5 |
|
| Total net charge-offs (recoveries) | $ | — |
| | $ | (8 | ) | | $ | (1 | ) | | $ | (12 | ) | | $ | 5 |
|
ZIONS BANCORPORATION, N.A.
Press Release – Page 15
April 22, 2019
CONSOLIDATED AVERAGE BALANCE SHEETS, YIELDS AND RATES
(Unaudited) |
| | | | | | | | | | | | | | | | | | | | |
| | Three Months Ended |
| | March 31, 2019 | | December 31, 2018 | | March 31, 2018 |
| (In millions) | Average balance | | Average yield/rate 1 | | Average balance | | Average
yield/rate 1 | | Average balance | | Average
yield/rate 1 |
| ASSETS | | | | | | | | | | | |
| Money market investments | $ | 1,268 |
| | 2.73 | % | | $ | 1,302 |
| | 2.53 | % | | $ | 1,495 |
| | 1.70 | % |
| Securities: | | | | | | | | | | | |
| Held-to-maturity | 829 |
| | 3.72 | % | | 709 |
| | 3.59 | % | | 789 |
| | 3.54 | % |
| Available-for-sale | 14,724 |
| | 2.49 | % | | 14,567 |
| | 2.40 | % | | 14,948 |
| | 2.18 | % |
| Trading account | 107 |
| | 4.52 | % | | 89 |
| | 4.15 | % | | 102 |
| | 4.00 | % |
| Total securities | 15,660 |
| | 2.57 | % | | 15,365 |
| | 2.46 | % | | 15,839 |
| | 2.25 | % |
| Loans held for sale | 63 |
| | 1.70 | % | | 37 |
| | 6.16 | % | | 51 |
| | 3.94 | % |
Loans held for investment:2 | | | | | | | | | | | |
| Commercial | 24,427 |
| | 5.05 | % | | 23,745 |
| | 4.90 | % | | 23,040 |
| | 4.70 | % |
| Commercial real estate | 11,335 |
| | 5.31 | % | | 11,168 |
| | 5.17 | % | | 11,065 |
| | 4.67 | % |
| Consumer | 11,409 |
| | 4.30 | % | | 11,299 |
| | 4.17 | % | | 10,759 |
| | 3.94 | % |
| Total loans held for investment | 47,171 |
| | 4.93 | % | | 46,212 |
| | 4.79 | % | | 44,864 |
| | 4.51 | % |
| Total interest-earning assets | 64,162 |
| | 4.31 | % | | 62,916 |
| | 4.17 | % | | 62,249 |
| | 3.87 | % |
| Cash and due from banks | 554 |
| | | | 542 |
| | | | 592 |
| | |
| Allowance for loan losses | (499 | ) | | | | (488 | ) | | | | (523 | ) | | |
| Goodwill and intangibles | 1,014 |
| | | | 1,015 |
| | | | 1,016 |
| | |
| Other assets | 3,353 |
| | | | 3,040 |
| | | | 3,032 |
| | |
| Total assets | $ | 68,584 |
| | | | $ | 67,025 |
| | | | $ | 66,366 |
| | |
| LIABILITIES AND SHAREHOLDERS’ EQUITY | | | | | | | | | | |
| Interest-bearing deposits: | | | | | | | | | | | |
| Savings and money market | $ | 26,021 |
| | 0.54 | % | | $ | 25,658 |
| | 0.46 | % | | $ | 25,296 |
| | 0.19 | % |
| Time | 4,674 |
| | 1.90 | % | | 4,286 |
| | 1.67 | % | | 3,280 |
| | 1.00 | % |
| Total interest-bearing deposits | 30,695 |
| | 0.75 | % | | 29,944 |
| | 0.63 | % | | 28,576 |
| | 0.28 | % |
| Borrowed funds: | | | | | | | | | | | |
| Federal funds purchased and other short-term borrowings | 5,289 |
| | 2.57 | % | | 3,728 |
| | 2.36 | % | | 5,707 |
| | 1.54 | % |
| Long-term debt | 880 |
| | 4.08 | % | | 795 |
| | 4.86 | % | | 383 |
| | 5.83 | % |
| Total borrowed funds | 6,169 |
| | 2.78 | % | | 4,523 |
| | 2.80 | % | | 6,090 |
| | 1.81 | % |
| Total interest-bearing liabilities | 36,864 |
| | 1.09 | % | | 34,467 |
| | 0.92 | % | | 34,666 |
| | 0.55 | % |
| Noninterest-bearing deposits | 23,221 |
| | | | 24,295 |
| | | | 23,417 |
| | |
| Total deposits and interest-bearing liabilities | 60,085 |
| | 0.67 | % | | 58,762 |
| | 0.54 | % | | 58,083 |
| | 0.33 | % |
| Other liabilities | 928 |
| | | | 759 |
| | | | 656 |
| | |
| Total liabilities | 61,013 |
| | | | 59,521 |
| | | | 58,739 |
| | |
| Shareholders’ equity: | | | | | | | | | | | |
| Preferred equity | 566 |
| | | | 566 |
| | | | 566 |
| | |
| Common equity | 7,005 |
| | | | 6,938 |
| | | | 7,061 |
| | |
| Total shareholders’ equity | 7,571 |
| | | | 7,504 |
| | | | 7,627 |
| | |
| Total liabilities and shareholders’ equity | $ | 68,584 |
| | | | $ | 67,025 |
| | | | $ | 66,366 |
| | |
| Spread on average interest-bearing funds | | | 3.22 | % | | | | 3.25 | % | | | | 3.32 | % |
| Net yield on interest-earning assets | | | 3.68 | % | | | | 3.67 | % | | | | 3.56 | % |
| Memo: total cost of deposits, annualized | | | 0.43 | % | | | | 0.35 | % | | | | 0.15 | % |
1 Rates are calculated using amounts in thousands and taxable-equivalent rates used where applicable.
2 Net of unearned income and fees, net of related costs. Loans include nonaccrual and restructured loans.
ZIONS BANCORPORATION, N.A.
Press Release – Page 16
April 22, 2019
GAAP to Non-GAAP Reconciliations
(Unaudited)
This press release presents non-GAAP financial measures, in addition to GAAP financial measures, to provide investors with additional information. The adjustments to reconcile from the applicable GAAP financial measures to the non-GAAP financial measures are presented in the following schedules. The Bank considers these adjustments to be relevant to ongoing operating results and provide a meaningful base for period-to-period and company-to-company comparisons. These non-GAAP financial measures are used by management to assess the performance and financial position of the Bank and for presentations of Bank performance to investors. The Bank further believes that presenting these non-GAAP financial measures will permit investors to assess the performance of the Bank on the same basis as that applied by management.
Non-GAAP financial measures have inherent limitations, and are not required to be uniformly applied by individual entities. Although non-GAAP financial measures are frequently used by stakeholders to evaluate a company, they have limitations as an analytical tool and should not be considered in isolation or as a substitute for analysis of results reported under GAAP.
The following are non-GAAP financial measures presented in this press release and a discussion of the reasons for which management uses these non-GAAP measures:
Tangible Book Value per Common Share – this schedule also includes “tangible common equity.” Tangible book value per common share is a non-GAAP financial measure that management believes provides additional useful information about the level of tangible equity in relation to outstanding shares of common stock. Management believes the use of ratios that utilize tangible equity provides additional useful information because they present measures of those assets that can generate income.
Return on Average Tangible Common Equity – this schedule also includes “net earnings applicable to common shareholders, excluding the effects of the adjustments, net of tax” and “average tangible common equity.” Return on average tangible common equity is a non-GAAP financial measure that management believes provides useful information about the Bank’s use of shareholders’ equity. Management believes the use of ratios that utilize tangible equity provides additional useful information because they present measures of those assets that can generate income.
Efficiency Ratio – this schedule also includes “adjusted noninterest expense,” “taxable-equivalent net interest income,” “adjusted taxable-equivalent revenue,” and “adjusted pre-provision net revenue (PPNR).” The methodology of determining the efficiency ratio may differ among companies. Management makes adjustments to exclude certain items as identified in the subsequent schedules which it believes allows for more consistent comparability among periods. Management believes the efficiency ratio provides useful information regarding the cost of generating revenue. Adjusted noninterest expense provides a measure as to how well the Bank is managing its expenses, and adjusted PPNR enables management and others to assess the Bank’s ability to generate capital to cover credit losses through a credit cycle. Taxable-equivalent net interest income allows management to assess the comparability of revenue arising from both taxable and tax-exempt sources.
Adjusted Pre-Tax Pre Provision Net Revenue per Share – this schedule uses “adjusted pre-provision net revenue (PPNR)” as calculated in the efficiency ratio, which is divided by the weighted average diluted shares for the period. As mentioned previously, Management believes that adjusted PPNR enables management and others to assess the Bank’s ability to generate capital to cover credit losses through a credit cycle. Dividing this amount by the weighted average diluted shares outstanding provides a shareholder’s perspective of PPNR growth.
ZIONS BANCORPORATION, N.A.
Press Release – Page 17
April 22, 2019
GAAP to Non-GAAP Reconciliations
(Unaudited)
|
| | | | | | | | | | | | | | | | | | | | |
| (In millions, except shares and per share amounts) | | March 31,
2019 | | December 31,
2018 | | September 30,
2018 | | June 30,
2018 | | March 31,
2018 |
| Tangible Book Value per Common Share | | | | | | | | |
| Total shareholders’ equity (GAAP) | | $ | 7,588 |
| | $ | 7,578 |
| | $ | 7,553 |
| | $ | 7,621 |
| | $ | 7,644 |
|
| Preferred stock | | (566 | ) | | (566 | ) | | (566 | ) | | (566 | ) | | (566 | ) |
| Goodwill and intangibles | | (1,014 | ) | | (1,015 | ) | | (1,015 | ) | | (1,015 | ) | | (1,016 | ) |
| Tangible common equity (non-GAAP) | (a) | $ | 6,008 |
| | $ | 5,997 |
| | $ | 5,972 |
| | $ | 6,040 |
| | $ | 6,062 |
|
| Common shares outstanding (in thousands) | (b) | 182,513 |
| | 187,554 |
| | 192,169 |
| | 195,392 |
| | 197,050 |
|
| Tangible book value per common share (non-GAAP) | (a/b) | $ | 32.92 |
| | $ | 31.97 |
| | $ | 31.08 |
| | $ | 30.91 |
| | $ | 30.76 |
|
| | | | | | | | | | | |
| | | Three Months Ended |
| (Dollar amounts in millions) | | March 31,
2019 | | December 31,
2018 | | September 30,
2018 | | June 30,
2018 | | March 31,
2018 |
| Return on Average Tangible Common Equity | | | | | | | | |
| Net earnings applicable to common shareholders (GAAP) | | $ | 205 |
| | $ | 217 |
| | $ | 215 |
| | $ | 187 |
| | $ | 231 |
|
| Adjustments, net of tax: | | | | | | | | | | |
| Amortization of core deposit and other intangibles | | — |
| | — |
| | — |
| | — |
| | — |
|
| Net earnings applicable to common shareholders, excluding the effects of the adjustments, net of tax (non-GAAP) | (a) | $ | 205 |
| | $ | 217 |
| | $ | 215 |
| | $ | 187 |
| | $ | 231 |
|
| Average common equity (GAAP) | | $ | 7,005 |
| | $ | 6,938 |
| | $ | 7,024 |
| | $ | 7,072 |
| | $ | 7,061 |
|
| Average goodwill and intangibles | | (1,014 | ) | | (1,015 | ) | | (1,015 | ) | | (1,016 | ) | | (1,016 | ) |
Average tangible common equity (non-GAAP) | (b) | $ | 5,991 |
| | $ | 5,923 |
| | $ | 6,009 |
| | $ | 6,056 |
| | $ | 6,045 |
|
| Number of days in quarter | (c) | 90 |
| | 92 |
| | 92 |
| | 91 |
| | 90 |
|
| Number of days in year | (d) | 365 |
| | 365 |
| | 365 |
| | 365 |
| | 365 |
|
| Return on average tangible common equity (non-GAAP) | (a/b/c)*d | 13.9 | % | | 14.5 | % | | 14.2 | % | | 12.4 | % | | 15.5 | % |
ZIONS BANCORPORATION, N.A.
Press Release – Page 18
April 22, 2019
GAAP to Non-GAAP Reconciliations
(Unaudited)
|
| | | | | | | | | | | | | | | | | | | | |
| | | Three Months Ended |
| (In millions) | | March 31,
2019 | | December 31,
2018 | | September 30,
2018 | | June 30,
2018 | | March 31,
2018 |
| Efficiency Ratio | | | | | | | | | | |
| Noninterest expense (GAAP) | (a) | $ | 430 |
| | $ | 420 |
| | $ | 420 |
| | $ | 421 |
| | $ | 419 |
|
| Adjustments: | | | | | | | | | | |
| Severance costs | | — |
| | 2 |
| | 2 |
| | 1 |
| | — |
|
| Other real estate expense, net | | (1 | ) | | — |
| | 1 |
| | — |
| | — |
|
| Restructuring costs | | — |
| | — |
| | 1 |
| | — |
| | — |
|
| Total adjustments | (b) | (1 | ) | | 2 |
| | 4 |
| | 1 |
| | — |
|
| Adjusted noninterest expense (non-GAAP) | (a-b)=(c) | $ | 431 |
| | $ | 418 |
| | $ | 416 |
| | $ | 420 |
| | $ | 419 |
|
| Net interest income (GAAP) | (d) | $ | 576 |
| | $ | 576 |
| | $ | 565 |
| | $ | 548 |
| | $ | 542 |
|
| Fully taxable-equivalent adjustments | (e) | 6 |
| | 6 |
| | 5 |
| | 5 |
| | 5 |
|
| Taxable-equivalent net interest income (non-GAAP) | (d+e)=(f) | 582 |
| | 582 |
| | 570 |
| | 553 |
| | 547 |
|
| Noninterest income (GAAP) | (g) | 132 |
| | 140 |
| | 136 |
| | 138 |
| | 138 |
|
| Combined income (non-GAAP) | (f+g)=(h) | 714 |
| | 722 |
| | 706 |
| | 691 |
| | 685 |
|
| Adjustments: | | | | | | | | | | |
| Fair value and nonhedge derivative income | | (3 | ) | | (3 | ) | | — |
| | — |
| | 1 |
|
| Securities gains (losses), net | | 1 |
| | 2 |
| | (1 | ) | | 1 |
| | — |
|
| Total adjustments | (i) | (2 | ) | | (1 | ) | | (1 | ) | | 1 |
| | 1 |
|
Adjusted taxable-equivalent revenue (non-GAAP) | (h-i)=(j) | $ | 716 |
| | $ | 723 |
| | $ | 707 |
| | $ | 690 |
| | $ | 684 |
|
| Pre-provision net revenue (PPNR) (non-GAAP) | (h)-(a) | $ | 284 |
| | $ | 302 |
| | $ | 286 |
| | $ | 270 |
| | $ | 266 |
|
| Adjusted PPNR (non-GAAP) | (j-c)=(k) | 285 |
| | 305 |
| | 291 |
| | 270 |
| | 265 |
|
| Efficiency ratio (non-GAAP) | (c/j) | 60.2 | % | | 57.8 | % | | 58.8 | % | | 60.9 | % | | 61.3 | % |
| | | | | | | | | | | |
| Adjusted PPNR per share | | | | | | | | | | |
| Adjusted PPNR (non-GAAP) | (k) | 285 |
| | 305 |
| | 291 |
| | 270 |
| | 265 |
|
| Diluted shares (in thousands) | (l) | 195,241 |
| | 199,048 |
| | 205,765 |
| | 209,247 |
| | 210,243 |
|
| Adjusted PPNR per share (non-GAAP) | (k)/(l) | 1.46 |
| | 1.53 |
| | 1.41 |
| | 1.29 |
| | 1.26 |
|
