| | | | | |
Zions Bancorporation, N.A.
One South Main
Salt Lake City, UT 84133
April 25, 2022 | |
| www.zionsbancorporation.com |
First Quarter 2022 Financial Results: FOR IMMEDIATE RELEASE
Investor and Media Contact: James Abbott (801) 844-7637
| | |
| Zions Bancorporation, N.A. reports: 1Q22 Net Earnings of $195 million, diluted EPS of $1.27 |
compared with 1Q21 Net Earnings of $314 million, diluted EPS of $1.90,
and 4Q21 Net Earnings of $207 million, diluted EPS of $1.34 |
|
FIRST QUARTER RESULTS
| | | | | | | | | | | | | | | | | | | | |
| $1.27 | | $195 million | | 2.60% | | 10.0% |
Net earnings per diluted common share | | Net Earnings | | Net interest margin (“NIM”) | | Common Equity
Tier 1 ratio |
| | | | | | | | |
| FIRST QUARTER HIGHLIGHTS¹ |
| | |
| Net Interest Income and NIM | • | Net interest income was $544 million, compared with $545 million |
| • | NIM was 2.60%, compared with 2.86%, and was impacted by significant deposit growth and an accompanying change in the composition of interest-earning assets |
| | |
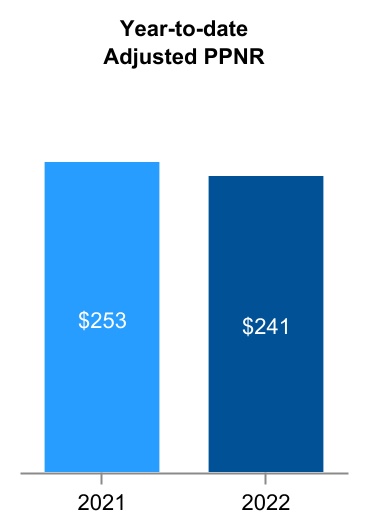
| Operating Performance | • | Pre-provision net revenue ("PPNR") was $230 million, down $57 million, or 20%; adjusted PPNR² was $241 million, down $12 million, or 5% |
| • | PPP loans contributed $24 million in interest income, compared with $60 million |
| • | Noninterest expense was $464 million, up 7%; adjusted noninterest expense² was also $464 million, up 5% |
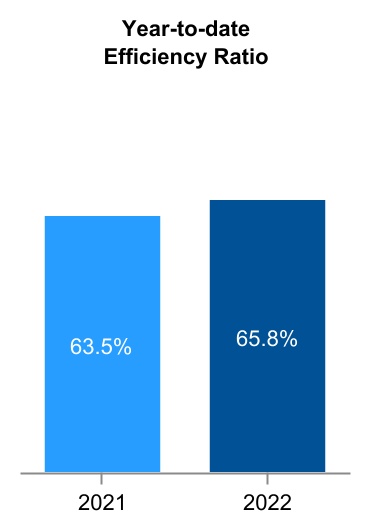
| • | The efficiency ratio² was 65.8%, compared with 63.5% |
| | |
| Loans and Credit Quality | • | Loans and leases were $51.2 billion, down $2.2 billion, or 4%; excluding PPP, loans and leases were $50.2 billion, up $3.2 billion, or 7% |
| • | The provision for credit losses was negative $33 million, compared with negative $132 million |
| • | The allowance for credit losses was 1.02% of loans (ex-PPP), compared with 1.48% of loans (ex-PPP) |
| • | Nonperforming assets3 were $250 million, or 0.5%, of loans (ex-PPP), compared with $327 million, or 0.7%, of loans (ex-PPP) |
| |
| Capital | • | The CET1 capital ratio was 10.0%, compared with 11.2% |
| • | Repurchased 0.8 million shares of common stock during the quarter for $50 million |
| | |
| Notable items | • | Redeemed $290 million of senior notes |
| • | Net unrealized securities loss of $17 million, primarily related to SBIC investment in Recursion |
| • | Deposits were $82.4 billion, up $8.5 billion, or 12%, and the loan-to-deposit ratio was 62% |
| | |
| CEO COMMENTARY |
|
Harris H. Simmons, Chairman and CEO of Zions Bancorporation, commented, “The first quarter results included $1.2 billion of growth in average non-PPP loans relative to the prior quarter, or an annualized growth rate of over 10%, and annualized growth rate of net interest income excluding PPP income of over 17%. Credit quality continued to show strength, with net charge-offs equaling an annualized 0.05% of average loans and a sequential quarter decline in nonaccrual loans of 7%, which were contributing factors in the reduction of the allowance for credit losses.”
Mr. Simmons continued, “Higher operating costs were primarily the product of both a higher level of compensation increases resulting from a tight labor market and related inflationary pressures, together with increased incentive compensation accruals as a result of higher interest rates and stronger loan growth that are expected to produce improved performance through the remainder of the year. Our balance sheet is well positioned to generate stronger earnings in the higher interest rate environment we expect in coming quarters.” |
|
|
OPERATING PERFORMANCE2 |
1 Comparisons noted in the bullet points are calculated for the current quarter versus the same prior-year period unless otherwise specified.
2 For information on non-GAAP financial measures, see pages 15-16.
3 Does not include banking premises held for sale.
ZIONS BANCORPORATION, N.A.
Press Release – Page 2
April 25, 2022
Comparisons noted in the sections below are calculated for the current quarter versus the same prior-year period unless otherwise specified. Growth rates of 100% or more are considered not meaningful (“NM”) as they generally reflect a low starting point.
RESULTS OF OPERATIONS
| | | | | | | | | | | | | | | | | | | | | | | | | | | | | | | | | | | | | | | | | |
| Net Interest Income and Margin |
| | | | | | | 1Q22 - 4Q21 | | 1Q22 - 1Q21 |
| (In millions) | 1Q22 | | 4Q21 | | 1Q21 | | $ | | % | | $ | | % |
| Interest and fees on loans | $ | 437 | | $ | 471 | | $ | 488 | | $ | (34) | | | (7) | % | | $ | (51) | | | (10) | % |
| Interest on money market investments | 6 | | 7 | | 3 | | (1) | | | (14) | | | 3 | | | NM |
| Interest on securities | 112 | | 88 | | 71 | | 24 | | | 27 | | | 41 | | | 58 | |
| Total interest income | 555 | | 566 | | 562 | | (11) | | | (2) | | | (7) | | | (1) | |
| Interest on deposits | 6 | | 7 | | 9 | | (1) | | | (14) | | | (3) | | | (33) | |
| Interest on short- and long-term borrowings | 5 | | 6 | | 8 | | (1) | | | (17) | | | (3) | | | (38) | |
| Total interest expense | 11 | | 13 | | 17 | | (2) | | | (15) | | | (6) | | | (35) | |
| Net interest income | $ | 544 | | $ | 553 | | $ | 545 | | $ | (9) | | | (2) | | | $ | (1) | | | — | |
| | | | | | | bps | | | | bps | | |
Yield on interest-earning assets1 | 2.65 | % | | 2.64 | % | | 2.95 | % | | 1 | | | | | (30) | | | |
Rate paid on total deposits and interest-bearing liabilities1 | 0.06 | % | | 0.06 | % | | 0.09 | % | | — | | | | | (3) | | | |
Cost of total deposits1 | 0.03 | % | | 0.03 | % | | 0.05 | % | | — | | | | | (2) | | | |
Net interest margin1 | 2.60 | % | | 2.58 | % | | 2.86 | % | | 2 | | | | | (26) | | | |
1 Rates are calculated using amounts in thousands and a tax rate of 21% for the periods presented.
Net interest income remained relatively stable at $544 million in the first quarter of 2022, as significant growth in average interest-earning assets was partially offset by NIM compression arising from an increased concentration in cash and securities and the low interest rate environment.
Average interest-earning assets increased $7.8 billion, or 10%, driven by growth in available-for-sale securities, commercial loans (ex-PPP), and money market investments. These increases were partially offset by a $4.7 billion decline in average PPP loans. Average securities increased to 30% of average interest-earning assets, compared with 21%, as we actively deployed excess liquidity into short-to-medium duration securities. Average money market investments, including short-term deposits held at the Federal Reserve, increased $1.2 billion, or 16%.
The net interest margin was 2.60%, compared with 2.86%. The yield on average interest-earning assets was 2.65% in the first quarter of 2022, a decrease of 30 basis points. The yield on total loans decreased 21 basis points to 3.52%. The yield on non-PPP loans decreased 26 basis points, primarily driven by (1) lower yields on loans originated during the past year, compared with yields on loans maturing and amortizing during the same period, and (2) promotional rates on commercial owner-occupied loans and home equity credit lines. The yield on securities remained relatively stable at 1.78%.
The annualized cost of total deposits for the first quarter of 2022 was 0.03%, compared with 0.05%. The rate paid on total deposits and interest-bearing liabilities was 0.06%, a decrease from 0.09% during the first quarter of 2021, which was primarily due to low deposit rates and $7.2 billion in average noninterest bearing deposit growth. Average noninterest bearing deposits as a percentage of total deposits were 50%, compared with 47% for the same prior year period.
In the first quarter of 2022, approximately 4,000 PPP loans, totaling $0.8 billion, were forgiven by the SBA. PPP loans contributed $24 million in interest income during the quarter, compared with $60 million. During the same time periods, approximately $16 million and $31 million of the interest income from PPP loans was related to accelerated
ZIONS BANCORPORATION, N.A.
Press Release – Page 3
April 25, 2022
recognition of net unamortized deferred fees due to forgiveness, respectively. At March 31, 2022, the remaining net unamortized deferred fees on PPP loans totaled $24 million.
| | | | | | | | | | | | | | | | | | | | | | | | | | | | | | | | | | | | | | | | | |
| Noninterest Income |
| | | | | | | 1Q22 - 4Q21 | | 1Q22 - 1Q21 |
| (In millions) | 1Q22 | | 4Q21 | | 1Q21 | | $ | | % | | $ | | % |
| Commercial account fees | $ | 41 | | | $ | 34 | | | $ | 32 | | | $ | 7 | | | 21 | % | | $ | 9 | | | 28 | % |
| Card fees | 25 | | | 25 | | | 21 | | | — | | | — | | | 4 | | | 19 | |
| Retail and business banking fees | 20 | | | 19 | | | 17 | | | 1 | | | 5 | | | 3 | | | 18 | |
| Loan-related fees and income | 22 | | | 22 | | | 25 | | | — | | | — | | | (3) | | | (12) | |
| Capital markets and foreign exchange fees | 15 | | | 24 | | | 15 | | | (9) | | | (38) | | | — | | | — | |
| Wealth management fees | 14 | | | 13 | | | 12 | | | 1 | | | 8 | | | 2 | | | 17 | |
| Other customer-related fees | 14 | | | 15 | | | 11 | | | (1) | | | (7) | | | 3 | | | 27 | |
| Customer-related fees | 151 | | | 152 | | | 133 | | | (1) | | | (1) | | | 18 | | | 14 | |
| Fair value and nonhedge derivative income (loss) | 6 | | | (1) | | | 18 | | | 7 | | | NM | | (12) | | | (67) | |
| Dividends and other income | 2 | | | 19 | | | 7 | | | (17) | | | (89) | | | (5) | | | (71) | |
| Securities gains (losses), net | (17) | | | 20 | | | 11 | | | (37) | | | NM | | (28) | | | NM |
| Total noninterest income | $ | 142 | | | $ | 190 | | | $ | 169 | | | $ | (48) | | | (25) | | | $ | (27) | | | (16) | |
Total customer-related fees increased $18 million, or 14%, to $151 million, driven by increased card, retail and business banking, and wealth management activity, partially offset by a decrease in loan-related fees and income. Results for the first quarter of 2022 benefited from a one-time adjustment of approximately $6 million in commercial account fees.
Net securities gains and losses decreased $28 million, due to $17 million of negative mark-to-market adjustments during the quarter primarily related to our SBIC investment in Recursion Pharmaceuticals, Inc., and an $11 million gain on the sale of Farmer Mac Class C stock recognized during the prior year period.
Fair value and nonhedge derivative income decreased $12 million from the prior year period. We recognized a $6 million gain during the quarter related to a credit valuation adjustment (“CVA”) on client-related interest rate swaps, compared with an $18 million CVA gain in the prior year period. The CVA may fluctuate from period to period based on the credit quality of our clients and changes in interest rates, which impacts the value of, and our credit exposure to, the client-related interest rate swaps.
| | | | | | | | | | | | | | | | | | | | | | | | | | | | | | | | | | | | | | | | | |
| Noninterest Expense |
| | | | | | | 1Q22 - 4Q21 | | 1Q22 - 1Q21 |
| (In millions) | 1Q22 | | 4Q21 | | 1Q21 | | $ | | % | | $ | | % |
| Salaries and employee benefits | $ | 312 | | | $ | 282 | | | $ | 288 | | | $ | 30 | | | 11 | % | | $ | 24 | | | 8 | % |
| Technology, telecom, and information processing | 52 | | | 51 | | | 49 | | | 1 | | | 2 | | | 3 | | | 6 | |
| Occupancy and equipment, net | 38 | | | 38 | | | 39 | | | — | | | — | | | (1) | | | (3) | |
| Professional and legal services | 14 | | | 16 | | | 21 | | | (2) | | | (13) | | | (7) | | | (33) | |
| Marketing and business development | 8 | | | 20 | | | 7 | | | (12) | | | (60) | | | 1 | | | 14 | |
| Deposit insurance and regulatory expense | 10 | | | 9 | | | 10 | | | 1 | | | 11 | | | — | | | — | |
| Credit-related expense | 7 | | | 7 | | | 6 | | | — | | | — | | | 1 | | | 17 | |
| Other real estate expense, net | 1 | | | — | | | — | | | 1 | | | NM | | 1 | | | NM |
| Other | 22 | | | 26 | | | 15 | | | (4) | | | (15) | | | 7 | | | 47 | |
| Total noninterest expense | $ | 464 | | | $ | 449 | | | $ | 435 | | | $ | 15 | | | 3 | | | $ | 29 | | | 7 | |
Adjusted noninterest expense 1 | $ | 464 | | | $ | 446 | | | $ | 440 | | | $ | 18 | | | 4 | | | $ | 24 | | | 5 | |
1 For information on non-GAAP financial measures, see pages 15-16.
ZIONS BANCORPORATION, N.A.
Press Release – Page 4
April 25, 2022
During the first quarter of 2022, we made certain financial reporting reclassifications to noninterest expense, primarily to improve the presentation and disclosure of certain expenses related to our ongoing technology investments. Other expense line items were also impacted by these reclassifications, which were adopted retrospectively to January 1, 2020.
Total noninterest expense increased $29 million, or 7%, relative to the prior year quarter. Salaries and benefits expense increased $24 million, or 8%, due to (1) the impact of inflationary and competitive labor market pressures on wages, (2) increases in commissions, (3) increases in incentive compensation accruals arising from improvements in anticipated full-year profitability, and (4) declines in deferred salaries primarily associated with PPP loans originated in the prior year period.
Other noninterest expense increased $7 million, or 47%, primarily due to lower expenses in the prior year period, which benefited from a $5 million valuation adjustment related to the termination of our defined benefit pension plan. Professional and legal services expense decreased $7 million, or 33%, due to third-party assistance associated with PPP loan forgiveness as well as various technology-related and other outsourced services incurred in the prior year period.
Adjusted noninterest expense increased $24 million, or 5%, to $464 million, compared with $440 million for the prior year period, driven primarily by the increase in salaries and benefits expense described previously. The efficiency ratio was 65.8%, compared with 63.5%. For information on non-GAAP financial measures, including differences between noninterest expense and adjusted noninterest expense, see pages 15-16.
BALANCE SHEET ANALYSIS
| | | | | | | | | | | | | | | | | | | | | | | | | | | | | | | | | | | | | | | | | |
| Loans and Leases |
| | | | | | | 1Q22 - 4Q21 | | 1Q22 - 1Q21 |
| (In millions) | 1Q22 | | 4Q21 | | 1Q21 | | $ | | % | | $ | | % |
| Loans held for sale | $ | 43 | | | $ | 83 | | | $ | 77 | | | $ | (40) | | | (48) | % | | $ | (34) | | | (44) | % |
| Loans and leases: | | | | | | | | | | | | | |
Commercial – excluding PPP loans | $ | 27,644 | | | $ | 26,585 | | | $ | 24,499 | | | $ | 1,059 | | | 4 | | | $ | 3,145 | | | 13 | |
Commercial – PPP loans | 1,081 | | | 1,855 | | | 6,465 | | | (774) | | | (42) | | | (5,384) | | | (83) | |
| Commercial real estate | 12,094 | | | 12,198 | | | 12,060 | | | (104) | | | (1) | | | 34 | | | — | |
| Consumer | 10,423 | | | 10,213 | | | 10,448 | | | 210 | | | 2 | | | (25) | | | — | |
| Loans and leases, net of unearned income and fees | 51,242 | | | 50,851 | | | 53,472 | | | 391 | | | 1 | | | (2,230) | | | (4) | |
| Less allowance for loan losses | 478 | | | 513 | | | 646 | | | (35) | | | (7) | | | (168) | | | (26) | |
| Loans and leases held for investment, net of allowance | $ | 50,764 | | | $ | 50,338 | | | $ | 52,826 | | | $ | 426 | | | 1 | | | $ | (2,062) | | | (4) | |
| | | | | | | | | | | | | |
| Unfunded lending commitments and letters of credit | $ | 27,253 | | | $ | 26,661 | | | $ | 25,487 | | | $ | 592 | | | 2 | | | $ | 1,766 | | | 7 | |
Loans and leases, net of unearned income and fees, decreased $2.2 billion, or 4%, to $51.2 billion at March 31, 2022, primarily due to the forgiveness of PPP loans. Excluding PPP loans, total loans and leases increased $3.2 billion, or 7%, to $50.2 billion. Commercial and industrial loans, owner occupied loans, and municipal loans increased $1.5 billion, $0.9 billion, and $0.7 billion, respectively. Consumer 1-4 family residential mortgage loans decreased $0.5 billion, primarily due to continued refinancing activity, while home equity credit lines increased $0.4 billion.
Unfunded lending commitments and letters of credit increased $1.8 billion, or 7%, to $27.3 billion at March 31, 2022, primarily due to growth in our home equity and commercial credit line portfolios.
ZIONS BANCORPORATION, N.A.
Press Release – Page 5
April 25, 2022
| | | | | | | | | | | | | | | | | | | | | | | | | | | | | | | | | | | | | | | | | |
| Credit Quality |
| | | | | | | 1Q22 - 4Q21 | | 1Q22 - 1Q21 |
| (In millions) | 1Q22 | | 4Q21 | | 1Q21 | | $ | | % | | $ | | % |
| Provision for credit losses | $ | (33) | | $ | 25 | | $ | (132) | | $ | (58) | | | NM | | $ | 99 | | | 75 | % |
| Allowance for credit losses | 514 | | 553 | | 695 | | (39) | | | (7) | % | | (181) | | | (26) | |
| Net loan and lease charge-offs (recoveries) | 6 | | 1 | | 8 | | 5 | | | NM | | (2) | | | (25) | |
Nonperforming assets2 | 252 | | 272 | | 327 | | (20) | | | (7) | | | (75) | | | (23) | |
| Classified loans | 1,148 | | 1,236 | | 1,660 | | (88) | | | (7) | | | (512) | | | (31) | |
| 1Q22 | | 4Q21 | | 1Q21 | | bps | | | | bps | | |
Ratio of ACL to loans1 and leases outstanding, at period end | 1.00 | % | | 1.09 | % | | 1.30 | % | | (9) | | | | | (30) | | | |
Ratio of ACL to loans1 and leases outstanding (ex-PPP), at period end | 1.02 | % | | 1.13 | % | | 1.48 | % | | (11) | | | | | (46) | | | |
| Annualized ratio of net loan and lease charge-offs to average loans | 0.05 | % | | 0.01 | % | | 0.06 | % | | 4 | | | | | (1) | | | |
| Ratio of classified loans to total loans and leases (ex-PPP) | 2.29 | % | | 2.52 | % | | 3.53 | % | | (23) | | | | | (124) | | | |
Ratio of nonperforming assets1 and accruing loans 90 days or more past due to loans and leases and other real estate owned | 0.50 | % | | 0.55 | % | | 0.63 | % | | (5) | | | | | (13) | | | |
1 Does not include loans held for sale.
2 Does not include banking premises held for sale.
Net loan and lease charge-offs were $6 million, compared with $8 million in the prior year quarter, reflecting strong credit performance. During the first quarter of 2022, we recorded a negative $33 million provision for credit losses, compared with a negative $132 million provision during the prior year period. The allowance for credit losses (“ACL”) was $514 million at March 31, 2022, compared with $695 million at March 31, 2021. The decrease in the ACL was due largely to improvements in economic forecasts and overall credit quality, partially offset by economic uncertainty caused by inflation, supply chain disruptions, and the conflict in Eastern Europe. The ratio of ACL to total loans and leases (ex-PPP) was 1.02% at March 31, 2022, compared with 1.48% at March 31, 2021.
| | | | | | | | | | | | | | | | | | | | | | | | | | | | | | | | | | | | | | | | | |
| Deposits and Borrowed Funds |
| | | | | | | 1Q22 - 4Q21 | | 1Q22 - 1Q21 |
| (In millions) | 1Q22 | | 4Q21 | | 1Q21 | | $ | | % | | $ | | % |
| Noninterest-bearing demand | $ | 41,937 | | | $ | 41,053 | | | $ | 35,882 | | | $ | 884 | | | 2 | % | | $ | 6,055 | | | 17 | % |
| Interest-bearing: | | | | | | | | | | | | | |
| Savings and money market | 38,864 | | | 40,114 | | | 35,762 | | | (1,250) | | | (3) | | | 3,102 | | | 9 | |
| Time | 1,550 | | | 1,622 | | | 2,209 | | | (72) | | | (4) | | | (659) | | | (30) | |
| | | | | | | | | | | | | |
| Total deposits | $ | 82,351 | | | $ | 82,789 | | | $ | 73,853 | | | $ | (438) | | | (1) | | | $ | 8,498 | | | 12 | |
| Borrowed funds: | | | | | | | | | | | | | |
| Federal funds purchased and other short-term borrowings | $ | 638 | | | $ | 903 | | | $ | 1,032 | | | $ | (265) | | | (29) | | | $ | (394) | | | (38) | |
| Long-term debt | 689 | | | 1,012 | | | 1,299 | | | (323) | | | (32) | | | (610) | | | (47) | |
| Total borrowed funds | $ | 1,327 | | | $ | 1,915 | | | $ | 2,331 | | | $ | (588) | | | (31) | | | $ | (1,004) | | | (43) | |
Total deposits increased $8.5 billion, or 12%, to $82.4 billion, primarily due to a $6.1 billion increase in noninterest-bearing deposits. Average total deposits increased $10.2 billion, or 14%, to $81.6 billion, for the first quarter of 2021. Average noninterest-bearing deposits increased $7.2 billion, or 21%, to $40.9 billion, and were 50% and 47% of average total deposits for the respective time periods.
ZIONS BANCORPORATION, N.A.
Press Release – Page 6
April 25, 2022
Total borrowed funds decreased $1.0 billion, or 43%, to $1.3 billion, from the prior year quarter. The decrease in long-term debt was primarily due to the redemption of $290 million of senior notes during the first quarter of 2022, and the maturity of $281 million of senior notes during the third quarter of 2021. The decrease in overall borrowed funds continues to reflect strong deposit growth.
| | | | | | | | | | | | | | | | | | | | | | | | | | | | | | | | | | | | | | | | | |
| Shareholders’ Equity |
| | | | | | | 1Q22 - 4Q21 | | 1Q22 - 1Q21 |
| (In millions, except share data) | 1Q22 | | 4Q21 | | 1Q21 | | $ | | % | | $ | | % |
| Shareholders’ equity: | | | | | | | | | | | | | |
| Preferred stock | $ | 440 | | $ | 440 | | $ | 566 | | $ | — | | | — | % | | $ | (126) | | | (22) | % |
| Common stock and additional paid-in capital | 1,889 | | 1,928 | | 2,653 | | (39) | | | (2) | | | (764) | | | (29) | |
| Retained earnings | 5,311 | | 5,175 | | 4,566 | | 136 | | | 3 | | | 745 | | | 16 | |
| Accumulated other comprehensive income (loss) | (1,346) | | (80) | | 148 | | (1,266) | | | NM | | (1,494) | | | NM |
| Total shareholders’ equity | $ | 6,294 | | $ | 7,463 | | $ | 7,933 | | $ | (1,169) | | | (16) | | | $ | (1,639) | | | (21) | |
| Capital distributions: | | | | | | | | | | | | | |
| Common dividends paid | $ | 58 | | $ | 58 | | $ | 56 | | $ | — | | | — | | | $ | 2 | | | 4 | |
| Bank common stock repurchased | 50 | | 325 | | 50 | | (275) | | | (85) | | | — | | | — | |
| Total capital distributed to common shareholders | $ | 108 | | $ | 383 | | $ | 106 | | $ | (275) | | | (72) | | | $ | 2 | | | 2 | |
| | | | | | | | | | | | | |
| | | | | | | shares | | % | | shares | | % |
| Weighted average diluted common shares outstanding (in thousands) | 151,687 | | 153,635 | | 163,887 | | (1,948) | | (1) | % | | (12,200) | | (7) | % |
| Common shares outstanding, at period end (in thousands) | 151,348 | | 151,625 | | 163,800 | | (277) | | — | | | (12,452) | | (8) | |
| | | | | | | | | | | | | |
| | | | | | | | | | | | | |
The common stock dividend was $0.38 per share, compared with $0.34 during the prior year quarter. Weighted average diluted shares outstanding decreased 12.2 million, or 7%, from the first quarter of 2021, primarily due to share repurchases. During the first quarter of 2022, we repurchased 0.8 million common shares outstanding for $50 million.
Preferred stock decreased $126 million due to the redemption of our 5.75% Series H Non-Cumulative Perpetual Preferred Stock at par value during the second quarter of 2021. Accumulated other comprehensive income decreased to a loss of $1.3 billion at March 31, 2022, primarily due to decreases in the fair value of fixed-rate available-for-sale securities as a result of changes in interest rates.
Tangible book value per common share decreased to $31.97, compared with $38.77, primarily due to the decrease in accumulated other comprehensive income previously described. Estimated common equity tier 1 (“CET1”) capital remained flat at $6.2 billion, and the estimated CET1 capital ratio was 10.0%, compared with 11.2%.
Recent deposit-driven balance sheet growth has resulted in a modest reduction in our risk-weighted regulatory capital ratios, and a larger reduction in our Tier 1 leverage ratio, as the denominator for this ratio is not adjusted for risk. As a result, our Tier 1 leverage ratio declined to 7.3% from 8.3% in the prior year period.
ZIONS BANCORPORATION, N.A.
Press Release – Page 7
April 25, 2022
Supplemental Presentation and Conference Call
Zions has posted a supplemental presentation to its website, which will be used to discuss the first quarter results at 5:30 p.m. ET on April 25, 2022. Media representatives, analysts, investors, and the public are invited to join this discussion by calling (877) 709-8150 (domestic and international) and entering the passcode 13728972, or via on-demand webcast. A link to the webcast will be available on the Zions Bancorporation website at zionsbancorporation.com. The webcast of the conference call will also be archived and available for 30 days.
About Zions Bancorporation, N.A.
Zions Bancorporation, N.A. is one of the nation's premier financial services companies with annual net revenue of $2.9 billion in 2021 and more than $90 billion of total assets. Zions operates under local management teams and distinct brands in 11 western states: Arizona, California, Colorado, Idaho, Nevada, New Mexico, Oregon, Texas, Utah, Washington, and Wyoming. The Bank is a consistent recipient of national and state-wide customer survey awards in small- and middle-market banking, as well as a leader in public finance advisory services and Small Business Administration lending. In addition, Zions is included in the S&P 500 and NASDAQ Financial 100 indices. Investor information and links to local banking brands can be accessed at zionsbancorporation.com.
Forward-Looking Information
This earnings release includes “forward-looking statements” as that term is defined in the Private Securities Litigation Reform Act of 1995. These statements, often accompanied by words such as “may,” “might,” “could,” “anticipate,” “expect,” and similar terms, are based on management’s current expectations and assumptions regarding future events or determinations, all of which are subject to known and unknown risks and uncertainties.
Forward-looking statements are not guarantees, nor should they be relied upon as representing management’s views as of any subsequent date. Factors that could cause our actual results, performance or achievements, industry trends, and results or regulatory outcomes to differ materially from those expressed or implied in the forward-looking statements are discussed in our 2021 Form 10-K and subsequent filings with the Securities and Exchange Commission (SEC), and are available on our website (www.zionsbancorporation.com) and from the SEC (www.sec.gov).
Except to the extent required by law, we specifically disclaim any obligation to update any factors or to publicly announce the revisions to any forward-looking statements to reflect future events or developments.
ZIONS BANCORPORATION, N.A.
Press Release – Page 8
April 25, 2022
FINANCIAL HIGHLIGHTS
(Unaudited)
| | | | | | | | | | | | | | | | | | | | | | | | | | | | | |
| Three Months Ended |
| (In millions, except share, per share, and ratio data) | March 31,
2022 | | December 31,
2021 | | September 30,
2021 | | June 30,
2021 | | March 31,
2021 |
BALANCE SHEET 1 | | | | | | | | | |
| Loans held for investment, net of allowance | $ | 50,764 | | $ | 50,338 | | $ | 50,187 | | $ | 50,863 | | $ | 52,826 |
| Total assets | 91,126 | | 93,200 | | 88,306 | | 87,208 | | 85,121 |
| Deposits | 82,351 | | 82,789 | | 77,884 | | 76,105 | | 73,853 |
| Total shareholders’ equity | 6,294 | | 7,463 | | 7,774 | | 8,033 | | 7,933 |
| STATEMENT OF INCOME | | | | | | | | | |
| Net earnings applicable to common shareholders | $ | 195 | | $ | 207 | | $ | 234 | | $ | 345 | | $ | 314 |
| Net interest income | 544 | | 553 | | 555 | | 555 | | 545 |
Taxable-equivalent net interest income 2 | 552 | | 563 | | 562 | | 562 | | 553 |
| Total noninterest income | 142 | | 190 | | 139 | | 205 | | 169 |
| Total noninterest expense | 464 | | 449 | | 429 | | 428 | | 435 |
Adjusted pre-provision net revenue 2 | 241 | | 288 | | 290 | | 290 | | 253 |
| Provision for credit losses | (33) | | 25 | | (46) | | (123) | | (132) |
| SHARE AND PER COMMON SHARE AMOUNTS | | | | | | | | | |
| Net earnings per diluted common share | $ | 1.27 | | $ | 1.34 | | $ | 1.45 | | $ | 2.08 | | $ | 1.90 |
| Dividends | 0.38 | | 0.38 | | 0.38 | | 0.34 | | 0.34 |
Book value per common share 1 | 38.68 | | 46.32 | | 46.85 | | 46.80 | | 44.98 |
Tangible book value per common share 1, 2 | 31.97 | | 39.62 | | 40.37 | | 40.54 | | 38.77 |
| Weighted average share price | 68.23 | | 63.69 | | 54.78 | | 55.86 | | 51.34 |
| Weighted average diluted common shares outstanding (in thousands) | 151,687 | | 153,635 | | 160,480 | | 163,054 | | 163,887 |
Common shares outstanding (in thousands) 1 | 151,348 | | 151,625 | | 156,530 | | 162,248 | | 163,800 |
| SELECTED RATIOS AND OTHER DATA | | | | | | | | | |
| Return on average assets | 0.90 | % | | 0.92 | % | | 1.08 | % | | 1.65 | % | | 1.57 | % |
| Return on average common equity | 11.8 | % | | 11.5 | % | | 12.3 | % | | 18.6 | % | | 17.4 | % |
Return on average tangible common equity 2 | 13.9 | % | | 13.4 | % | | 14.2 | % | | 21.6 | % | | 20.2 | % |
| Net interest margin | 2.60 | % | | 2.58 | % | | 2.68 | % | | 2.79 | % | | 2.86 | % |
| Cost of total deposits, annualized | 0.03 | % | | 0.03 | % | | 0.03 | % | | 0.04 | % | | 0.05 | % |
Efficiency ratio 2 | 65.8 | % | | 60.8 | % | | 59.8 | % | | 59.1 | % | | 63.5 | % |
| Effective tax rate | 20.4 | % | | 20.8 | % | | 22.8 | % | | 22.2 | % | | 21.7 | % |
| Ratio of nonperforming assets to loans and leases and other real estate owned | 0.49 | % | | 0.53 | % | | 0.64 | % | | 0.60 | % | | 0.61 | % |
| Annualized ratio of net loan and lease charge-offs to average loans | 0.05 | % | | 0.01 | % | | (0.01) | % | | (0.02) | % | | 0.06 | % |
Ratio of total allowance for credit losses to loans and leases outstanding 1 | 1.00 | % | | 1.09 | % | | 1.04 | % | | 1.12 | % | | 1.30 | % |
| Full-time equivalent employees | 9,724 | | 9,685 | | 9,641 | | 9,727 | | 9,682 |
CAPITAL RATIOS AND DATA 1 | | | | | | | | | |
Common equity tier 1 capital 3 | $ | 6,166 | | $ | 6,068 | | $ | 6,236 | | $ | 6,383 | | $ | 6,206 |
Risk-weighted assets 3 | 61,427 | | 59,600 | | 57,459 | | 56,339 | | 55,402 |
| Tangible common equity ratio | 5.4 | % | | 6.5 | % | | 7.2 | % | | 7.6 | % | | 7.6 | % |
Common equity tier 1 capital ratio 3 | 10.0 | % | | 10.2 | % | | 10.9 | % | | 11.3 | % | | 11.2 | % |
Tier 1 leverage ratio 3 | 7.3 | % | | 7.2 | % | | 7.6 | % | | 8.0 | % | | 8.3 | % |
Tier 1 risk-based capital ratio 3 | 10.8 | % | | 10.9 | % | | 11.6 | % | | 12.1 | % | | 12.2 | % |
Total risk-based capital ratio 3 | 12.5 | % | | 12.8 | % | | 13.6 | % | | 14.2 | % | | 14.5 | % |
1 At period end.
2 For information on non-GAAP financial measures, see pages 15-16.
3 Current period ratios and amounts represent estimates.
ZIONS BANCORPORATION, N.A.
Press Release – Page 9
April 25, 2022
CONSOLIDATED BALANCE SHEETS
| | | | | | | | | | | | | | | | | | | | | | | | | | | | | |
| (In millions, shares in thousands) | March 31,
2022 | | December 31,
2021 | | September 30,
2021 | | June 30,
2021 | | March 31,
2021 |
| (Unaudited) | | | | (Unaudited) | | (Unaudited) | | (Unaudited) |
| ASSETS | | | | | | | | | |
| Cash and due from banks | $ | 700 | | | $ | 595 | | | $ | 597 | | | $ | 525 | | | $ | 576 | |
| Money market investments: | | | | | | | | | |
| Interest-bearing deposits | 5,093 | | | 10,283 | | | 9,442 | | | 10,086 | | | 8,427 | |
| Federal funds sold and security resell agreements | 2,345 | | | 2,133 | | | 1,858 | | | 1,714 | | | 1,315 | |
| Investment securities: | | | | | | | | | |
Held-to-maturity1, at amortized cost | 439 | | | 441 | | | 459 | | | 620 | | | 583 | |
| Available-for-sale, at fair value | 26,145 | | | 24,048 | | | 20,461 | | | 18,170 | | | 16,644 | |
| Trading account, at fair value | 382 | | | 372 | | | 305 | | | 181 | | | 189 | |
| | | | | | | | | |
| Total securities, net of allowance | 26,966 | | | 24,861 | | | 21,225 | | | 18,971 | | | 17,416 | |
| Loans held for sale | 43 | | | 83 | | | 67 | | | 66 | | | 77 | |
| Loans and leases, net of unearned income and fees | 51,242 | | | 50,851 | | | 50,678 | | | 51,398 | | | 53,472 | |
| Less allowance for loan losses | 478 | | | 513 | | | 491 | | | 535 | | | 646 | |
| Loans held for investment, net of allowance | 50,764 | | | 50,338 | | | 50,187 | | | 50,863 | | | 52,826 | |
| Other noninterest-bearing investments | 829 | | | 851 | | | 868 | | | 895 | | | 815 | |
| Premises, equipment and software, net | 1,346 | | | 1,319 | | | 1,282 | | | 1,239 | | | 1,236 | |
| Goodwill and intangibles | 1,015 | | | 1,015 | | | 1,015 | | | 1,015 | | | 1,016 | |
| Other real estate owned | 4 | | | 8 | | | 21 | | | 23 | | | 3 | |
| Other assets | 2,021 | | | 1,714 | | | 1,744 | | | 1,811 | | | 1,414 | |
| Total assets | $ | 91,126 | | | $ | 93,200 | | | $ | 88,306 | | | $ | 87,208 | | | $ | 85,121 | |
| LIABILITIES AND SHAREHOLDERS’ EQUITY | | | | | | | | | |
| Deposits: | | | | | | | | | |
| Noninterest-bearing demand | $ | 41,937 | | | $ | 41,053 | | | $ | 39,150 | | | $ | 38,128 | | | $ | 35,882 | |
| Interest-bearing: | | | | | | | | | |
| Savings and money market | 38,864 | | | 40,114 | | | 37,046 | | | 36,037 | | | 35,762 | |
| Time | 1,550 | | | 1,622 | | | 1,688 | | | 1,940 | | | 2,209 | |
| | | | | | | | | |
| Total deposits | 82,351 | | | 82,789 | | | 77,884 | | | 76,105 | | | 73,853 | |
| Federal funds purchased and other short-term borrowings | 638 | | | 903 | | | 579 | | | 741 | | | 1,032 | |
| Long-term debt | 689 | | | 1,012 | | | 1,020 | | | 1,308 | | | 1,299 | |
| Reserve for unfunded lending commitments | 36 | | | 40 | | | 38 | | | 39 | | | 49 | |
| Other liabilities | 1,118 | | | 993 | | | 1,011 | | | 982 | | | 955 | |
| Total liabilities | 84,832 | | | 85,737 | | | 80,532 | | | 79,175 | | | 77,188 | |
| Shareholders’ equity: | | | | | | | | | |
| Preferred stock, without par value; authorized 4,400 shares | 440 | | | 440 | | | 440 | | | 440 | | | 566 | |
Common stock2 ($0.001 par value; authorized 350,000 shares) and additional paid-in capital | 1,889 | | | 1,928 | | | 2,245 | | | 2,565 | | | 2,653 | |
| Retained earnings | 5,311 | | | 5,175 | | | 5,025 | | | 4,853 | | | 4,566 | |
| Accumulated other comprehensive income (loss) | (1,346) | | | (80) | | | 64 | | | 175 | | | 148 | |
| | | | | | | | | |
| | | | | | | | | |
| Total shareholders’ equity | 6,294 | | | 7,463 | | | 7,774 | | | 8,033 | | | 7,933 | |
| Total liabilities and shareholders’ equity | $ | 91,126 | | | $ | 93,200 | | | $ | 88,306 | | | $ | 87,208 | | | $ | 85,121 | |
1 Held-to-maturity (fair value) | $ | 414 | | | $ | 443 | | | $ | 461 | | | $ | 622 | | | $ | 584 | |
2 Common shares (issued and outstanding) | 151,348 | | | 151,625 | | | 156,530 | | | 162,248 | | | 163,800 | |
ZIONS BANCORPORATION, N.A.
Press Release – Page 10
April 25, 2022
CONSOLIDATED STATEMENTS OF INCOME
| | | | | | | | | | | | | | | | | | | | | | | | | | | | | |
| (Unaudited) | Three Months Ended |
| (In millions, except share and per share amounts) | March 31,
2022 | | December 31,
2021 | | September 30,
2021 | | June 30,
2021 | | March 31,
2021 |
| Interest income: | | | | | | | | | |
| Interest and fees on loans | $ | 437 | | | $ | 471 | | | $ | 484 | | | $ | 492 | | | $ | 488 | |
| Interest on money market investments | 6 | | | 7 | | | 7 | | | 4 | | | 3 | |
| Interest on securities | 112 | | | 88 | | | 78 | | | 74 | | | 71 | |
| Total interest income | 555 | | | 566 | | | 569 | | | 570 | | | 562 | |
| Interest expense: | | | | | | | | | |
| Interest on deposits | 6 | | | 7 | | | 7 | | | 7 | | | 9 | |
| Interest on short- and long-term borrowings | 5 | | | 6 | | | 7 | | | 8 | | | 8 | |
| Total interest expense | 11 | | | 13 | | | 14 | | | 15 | | | 17 | |
| Net interest income | 544 | | | 553 | | | 555 | | | 555 | | | 545 | |
| Provision for credit losses: | | | | | | | | | |
| Provision for loan losses | (29) | | | 23 | | | (45) | | | (113) | | | (123) | |
| Provision for unfunded lending commitments | (4) | | | 2 | | | (1) | | | (10) | | | (9) | |
| | | | | | | | | |
| Total provision for credit losses | (33) | | | 25 | | | (46) | | | (123) | | | (132) | |
| Net interest income after provision for credit losses | 577 | | | 528 | | | 601 | | | 678 | | | 677 | |
| Noninterest income: | | | | | | | | | |
| Commercial account fees | 41 | | | 34 | | | 34 | | | 34 | | | 32 | |
| Card fees | 25 | | | 25 | | | 25 | | | 24 | | | 21 | |
| Retail and business banking fees | 20 | | | 19 | | | 20 | | | 18 | | | 17 | |
| Loan-related fees and income | 22 | | | 22 | | | 27 | | | 21 | | | 25 | |
| Capital markets and foreign exchange fees | 15 | | | 24 | | | 17 | | | 17 | | | 15 | |
| Wealth management fees | 14 | | | 13 | | | 13 | | | 12 | | | 12 | |
| Other customer-related fees | 14 | | | 15 | | | 15 | | | 13 | | | 11 | |
| Customer-related fees | 151 | | | 152 | | | 151 | | | 139 | | | 133 | |
| Fair value and nonhedge derivative income (loss) | 6 | | | (1) | | | 2 | | | (5) | | | 18 | |
| Dividends and other income | 2 | | | 19 | | | 9 | | | 8 | | | 7 | |
| Securities gains (losses), net | (17) | | | 20 | | | (23) | | | 63 | | | 11 | |
| Total noninterest income | 142 | | | 190 | | | 139 | | | 205 | | | 169 | |
| Noninterest expense: | | | | | | | | | |
| Salaries and employee benefits | 312 | | | 282 | | | 285 | | | 272 | | | 288 | |
| Technology, telecom, and information processing | 52 | | | 51 | | | 50 | | | 49 | | | 49 | |
| Occupancy and equipment, net | 38 | | | 38 | | | 37 | | | 39 | | | 39 | |
| Professional and legal services | 14 | | | 16 | | | 17 | | | 18 | | | 21 | |
| Marketing and business development | 8 | | | 20 | | | 9 | | | 7 | | | 7 | |
| Deposit insurance and regulatory expense | 10 | | | 9 | | | 8 | | | 7 | | | 10 | |
| Credit-related expense | 7 | | | 7 | | | 7 | | | 6 | | | 6 | |
| Other real estate expense, net | 1 | | | — | | | — | | | — | | | — | |
| Other | 22 | | | 26 | | | 16 | | | 30 | | | 15 | |
| Total noninterest expense | 464 | | | 449 | | | 429 | | | 428 | | | 435 | |
| Income before income taxes | 255 | | | 269 | | | 311 | | | 455 | | | 411 | |
| Income taxes | 52 | | | 56 | | | 71 | | | 101 | | | 89 | |
| Net income | 203 | | | 213 | | | 240 | | | 354 | | | 322 | |
| | | | | | | | | |
| | | | | | | | | |
| Preferred stock dividends | (8) | | | (6) | | | (6) | | | (9) | | | (8) | |
| | | | | | | | | |
| Net earnings applicable to common shareholders | $ | 195 | | | $ | 207 | | | $ | 234 | | | $ | 345 | | | $ | 314 | |
| Weighted average common shares outstanding during the period: | | | | | | | | |
| Basic shares (in thousands) | 151,285 | | | 153,248 | | | 160,221 | | | 162,742 | | | 163,551 | |
| Diluted shares (in thousands) | 151,687 | | | 153,635 | | | 160,480 | | | 163,054 | | | 163,887 | |
| Net earnings per common share: | | | | | | | | | |
| Basic | $ | 1.27 | | | $ | 1.34 | | | $ | 1.45 | | | $ | 2.08 | | | $ | 1.90 | |
| Diluted | 1.27 | | | 1.34 | | | 1.45 | | | 2.08 | | | 1.90 | |
ZIONS BANCORPORATION, N.A.
Press Release – Page 11
April 25, 2022
Loan Balances Held for Investment by Portfolio Type
(Unaudited)
| | | | | | | | | | | | | | | | | | | | | | | | | | | | | |
| (In millions) | March 31,
2022 | | December 31,
2021 | | September 30,
2021 | | June 30,
2021 | | March 31,
2021 |
| Commercial: | | | | | | | | | |
| Commercial and industrial | $ | 14,356 | | | $ | 13,867 | | | $ | 13,230 | | | $ | 12,947 | | | $ | 12,843 | |
| PPP | 1,081 | | | 1,855 | | | 3,080 | | | 4,461 | | | 6,465 | |
| Leasing | 318 | | | 327 | | | 293 | | | 307 | | | 310 | |
| Owner occupied | 9,026 | | | 8,733 | | | 8,446 | | | 8,231 | | | 8,112 | |
| Municipal | 3,944 | | | 3,658 | | | 3,400 | | | 3,215 | | | 3,234 | |
| Total commercial | 28,725 | | | 28,440 | | | 28,449 | | | 29,161 | | | 30,964 | |
| Commercial real estate: | | | | | | | | | |
| Construction and land development | 2,769 | | | 2,757 | | | 2,843 | | | 2,576 | | | 2,443 | |
| Term | 9,325 | | | 9,441 | | | 9,310 | | | 9,532 | | | 9,617 | |
| Total commercial real estate | 12,094 | | | 12,198 | | | 12,153 | | | 12,108 | | | 12,060 | |
| Consumer: | | | | | | | | | |
| Home equity credit line | 3,089 | | | 3,016 | | | 2,834 | | | 2,727 | | | 2,695 | |
| 1-4 family residential | 6,122 | | | 6,050 | | | 6,140 | | | 6,269 | | | 6,630 | |
| Construction and other consumer real estate | 692 | | | 638 | | | 584 | | | 593 | | | 589 | |
| Bankcard and other revolving plans | 410 | | | 396 | | | 395 | | | 415 | | | 409 | |
| Other | 110 | | | 113 | | | 123 | | | 125 | | | 125 | |
| Total consumer | 10,423 | | | 10,213 | | | 10,076 | | | 10,129 | | | 10,448 | |
| Total loans and leases | $ | 51,242 | | | $ | 50,851 | | | $ | 50,678 | | | $ | 51,398 | | | $ | 53,472 | |
Nonperforming Assets
(Unaudited)
| | | | | | | | | | | | | | | | | | | | | | | | | | | | | |
| (In millions) | March 31,
2022 | | December 31,
2021 | | September 30,
2021 | | June 30,
2021 | | March 31,
2021 |
| | | | | | | | | |
Nonaccrual loans 1 | $ | 252 | | | $ | 271 | | | $ | 323 | | | $ | 307 | | | $ | 324 | |
Other real estate owned 2 | — | | | 1 | | | 1 | | | 1 | | | 3 | |
| Total nonperforming assets | $ | 252 | | | $ | 272 | | | $ | 324 | | | $ | 308 | | | $ | 327 | |
Ratio of nonperforming assets to loans1 and leases and other real estate owned 2 | 0.49 | % | | 0.53 | % | | 0.64 | % | | 0.60 | % | | 0.61 | % |
| Accruing loans past due 90 days or more | $ | 3 | | | $ | 8 | | | $ | 4 | | | $ | 6 | | | $ | 9 | |
Ratio of accruing loans past due 90 days or more to loans1 and leases | 0.01 | % | | 0.02 | % | | 0.01 | % | | 0.01 | % | | 0.02 | % |
| Nonaccrual loans and accruing loans past due 90 days or more | $ | 255 | | | $ | 279 | | | $ | 327 | | | $ | 313 | | | $ | 333 | |
Ratio of nonperforming assets1 and accruing loans 90 days or more past due to loans and leases and other real estate owned | 0.50 | % | | 0.55 | % | | 0.65 | % | | 0.61 | % | | 0.63 | % |
Accruing loans past due 30-89 days 3 | $ | 93 | | | $ | 70 | | | $ | 114 | | | $ | 29 | | | $ | 100 | |
| Restructured loans included in nonaccrual loans | 100 | | | 105 | | | 121 | | | 128 | | | 134 | |
| Restructured loans on accrual | 216 | | | 221 | | | 231 | | | 330 | | | 280 | |
| Classified loans | 1,148 | | | 1,236 | | | 1,397 | | | 1,557 | | | 1,660 | |
1 Includes loans held for sale.
2 Does not include banking premises held for sale.
3 Includes $26 million of PPP loans at March 31, 2022, which we expect will be paid in full by either the borrower or the SBA.
ZIONS BANCORPORATION, N.A.
Press Release – Page 12
April 25, 2022
Allowance for Credit Losses
(Unaudited)
| | | | | | | | | | | | | | | | | | | | | | | | | | | | | |
| Three Months Ended |
| (In millions) | March 31,
2022 | | December 31,
2021 | | September 30,
2021 | | June 30,
2021 | | March 31,
2021 |
| Allowance for Loan Losses | | | | | | | | | |
| Balance at beginning of period | $ | 513 | | | $ | 491 | | | $ | 535 | | | $ | 646 | | | $ | 777 | |
| | | | | | | | | |
| Provision for loan losses | (29) | | | 23 | | | (45) | | | (113) | | | (123) | |
| | | | | | | | | |
| Loan and lease charge-offs | 17 | | | 11 | | | 8 | | | 8 | | | 21 | |
| Less: Recoveries | 11 | | | 10 | | | 9 | | | 10 | | | 13 | |
| Net loan and lease charge-offs | 6 | | | 1 | | | (1) | | | (2) | | | 8 | |
| Balance at end of period | $ | 478 | | | $ | 513 | | | $ | 491 | | | $ | 535 | | | $ | 646 | |
Ratio of allowance for loan losses to loans1 and leases, at period end | 0.93 | % | | 1.01 | % | | 0.97 | % | | 1.04 | % | | 1.21 | % |
Ratio of allowance for loan losses to nonaccrual loans1 at period end | 190 | % | | 189 | % | | 152 | % | | 175 | % | | 199 | % |
| Annualized ratio of net loan and lease charge-offs to average loans | 0.05 | % | | 0.01 | % | | (0.01) | % | | (0.02) | % | | 0.06 | % |
| Annualized ratio of net loan and lease charge-offs to average loans (excluding PPP loans) | 0.05 | % | | 0.01 | % | | (0.01) | % | | (0.02) | % | | 0.07 | % |
| Reserve for Unfunded Lending Commitments | | | | | | | | | |
| Balance at beginning of period | $ | 40 | | | $ | 38 | | | $ | 39 | | | $ | 49 | | | $ | 58 | |
| Provision for unfunded lending commitments | (4) | | | 2 | | | (1) | | | (10) | | | (9) | |
| Balance at end of period | $ | 36 | | | $ | 40 | | | $ | 38 | | | $ | 39 | | | $ | 49 | |
| Allowance for Credit Losses | | | | | | | | | |
| Allowance for loan losses | $ | 478 | | | $ | 513 | | | $ | 491 | | | $ | 535 | | | $ | 646 | |
| Reserve for unfunded lending commitments | 36 | | | 40 | | | 38 | | | 39 | | | 49 | |
| Total allowance for credit losses | $ | 514 | | | $ | 553 | | | $ | 529 | | | $ | 574 | | | $ | 695 | |
Ratio of total allowance for credit losses to loans1 and leases outstanding, at period end | 1.00 | % | | 1.09 | % | | 1.04 | % | | 1.12 | % | | 1.30 | % |
Ratio of total allowance for credit losses to loans1 and leases outstanding (excluding PPP loans), at period end | 1.02 | % | | 1.13 | % | | 1.11 | % | | 1.22 | % | | 1.48 | % |
1 Does not include loans held for sale.
ZIONS BANCORPORATION, N.A.
Press Release – Page 13
April 25, 2022
Nonaccrual Loans by Portfolio Type
(Unaudited)
| | | | | | | | | | | | | | | | | | | | | | | | | | | | | |
| (In millions) | March 31,
2022 | | December 31,
2021 | | September 30,
2021 | | June 30,
2021 | | March 31,
2021 |
| | | | | | | | | |
| Loans held for sale | $ | — | | | $ | — | | | $ | — | | | $ | 1 | | | $ | — | |
| Commercial: | | | | | | | | | |
| Commercial and industrial | $ | 112 | | | $ | 124 | | | $ | 157 | | | $ | 111 | | | $ | 119 | |
| PPP | 2 | | | 3 | | | — | | | 1 | | | — | |
| Leasing | — | | | — | | | — | | | — | | | — | |
| Owner occupied | 53 | | | 57 | | | 67 | | | 69 | | | 74 | |
| Municipal | — | | | — | | | — | | | — | | | — | |
| Total commercial | 167 | | | 184 | | | 224 | | | 181 | | | 193 | |
| Commercial real estate: | | | | | | | | | |
| Construction and land development | — | | | — | | | — | | | — | | | — | |
| Term | 20 | | | 20 | | | 25 | | | 28 | | | 31 | |
| Total commercial real estate | 20 | | | 20 | | | 25 | | | 28 | | | 31 | |
| Consumer: | | | | | | | | | |
| Home equity credit line | 13 | | | 14 | | | 15 | | | 18 | | | 19 | |
| 1-4 family residential | 51 | | | 52 | | | 58 | | | 78 | | | 80 | |
| Construction and other consumer real estate | — | | | — | | | — | | | — | | | — | |
| Bankcard and other revolving plans | 1 | | | 1 | | | 1 | | | 1 | | | 1 | |
| Other | — | | | — | | | — | | | — | | | — | |
| Total consumer | 65 | | | 67 | | | 74 | | | 97 | | | 100 | |
| | | | | | | | | |
| Total nonaccrual loans | $ | 252 | | | $ | 271 | | | $ | 323 | | | $ | 307 | | | $ | 324 | |
Net Charge-Offs by Portfolio Type
(Unaudited)
| | | | | | | | | | | | | | | | | | | | | | | | | | | | | |
| (In millions) | March 31,
2022 | | December 31,
2021 | | September 30,
2021 | | June 30,
2021 | | March 31,
2021 |
| Commercial: | | | | | | | | | |
| Commercial and industrial | $ | 6 | | | $ | 3 | | | $ | (2) | | | $ | (2) | | | $ | 8 | |
| PPP | — | | | — | | | — | | | — | | | — | |
| Leasing | — | | | — | | | — | | | — | | | — | |
| Owner occupied | (1) | | | — | | | (1) | | | — | | | — | |
| Municipal | — | | | — | | | — | | | — | | | — | |
| Total commercial | 5 | | | 3 | | | (3) | | | (2) | | | 8 | |
| Commercial real estate: | | | | | | | | | |
| Construction and land development | — | | | (3) | | | — | | | — | | | — | |
| Term | — | | | — | | | — | | | — | | | — | |
| Total commercial real estate | — | | | (3) | | | — | | | — | | | — | |
| Consumer: | | | | | | | | | |
| Home equity credit line | (1) | | | — | | | 1 | | | (1) | | | (1) | |
| 1-4 family residential | 1 | | | — | | | 1 | | | — | | | (1) | |
| Construction and other consumer real estate | — | | | — | | | — | | | — | | | — | |
| Bankcard and other revolving plans | 1 | | | — | | | — | | | 1 | | | 1 | |
| Other | — | | | 1 | | | — | | | — | | | 1 | |
| Total consumer loans | 1 | | | 1 | | | 2 | | | — | | | — | |
| Total net charge-offs (recoveries) | $ | 6 | | | $ | 1 | | | $ | (1) | | | $ | (2) | | | $ | 8 | |
ZIONS BANCORPORATION, N.A.
Press Release – Page 14
April 25, 2022
CONSOLIDATED AVERAGE BALANCE SHEETS, YIELDS AND RATES
| | | | | | | | | | | | | | | | | | | | | | | | | | | | | | | | | | | |
| (Unaudited) | Three Months Ended |
| March 31, 2022 | | December 31, 2021 | | March 31, 2021 |
| (In millions) | Average balance | | Average
yield/rate 1 | | Average balance | | Average
yield/rate 1 | | Average balance | | Average
yield/rate 1 |
| ASSETS | | | | | | | | | | | |
| Money market investments: | | | | | | | | | | | |
| Interest-bearing deposits | $ | 6,735 | | | 0.19 | % | | $ | 11,155 | | | 0.15 | % | | $ | 4,592 | | | 0.11 | % |
| Federal funds sold and security resell agreements | 2,300 | | | 0.52 | % | | 2,189 | | | 0.49 | % | | 3,199 | | | 0.24 | % |
| Total money market investments | 9,035 | | | 0.27 | % | | 13,344 | | | 0.21 | % | | 7,791 | | | 0.16 | % |
| Securities: | | | | | | | | | | | |
| Held-to-maturity | 438 | | | 3.12 | % | | 451 | | | 3.18 | % | | 663 | | | 2.98 | % |
| Available-for-sale | 25,246 | | | 1.71 | % | | 21,661 | | | 1.52 | % | | 15,876 | | | 1.69 | % |
| Trading account | 384 | | | 4.76 | % | | 342 | | | 4.76 | % | | 231 | | | 3.96 | % |
| Total securities | 26,068 | | | 1.78 | % | | 22,454 | | | 1.61 | % | | 16,770 | | | 1.77 | % |
| Loans held for sale | 57 | | | 1.92 | % | | 79 | | | 1.39 | % | | 68 | | | 2.81 | % |
Loans and leases:2 | | | | | | | | | | | |
| Commercial - excluding PPP loans | 27,037 | | | 3.54 | % | | 25,899 | | | 3.75 | % | | 24,732 | | | 3.83 | % |
| Commercial - PPP loans | 1,459 | | | 6.64 | % | | 2,439 | | | 7.16 | % | | 6,135 | | | 3.98 | % |
| Commercial real estate | 12,171 | | | 3.37 | % | | 12,228 | | | 3.39 | % | | 12,133 | | | 3.50 | % |
| Consumer | 10,266 | | | 3.23 | % | | 10,125 | | | 3.29 | % | | 10,665 | | | 3.59 | % |
| Total loans and leases | 50,933 | | | 3.52 | % | | 50,691 | | | 3.73 | % | | 53,665 | | | 3.73 | % |
| Total interest-earning assets | 86,093 | | | 2.65 | % | | 86,568 | | | 2.64 | % | | 78,294 | | | 2.95 | % |
| Cash and due from banks | 625 | | | | | 629 | | | | | 614 | | | |
| Allowance for credit losses on loans and debt securities | (515) | | | | | (495) | | | | | (774) | | | |
| Goodwill and intangibles | 1,015 | | | | | 1,015 | | | | | 1,016 | | | |
| Other assets | 4,211 | | | | | 4,168 | | | | | 3,930 | | | |
| Total assets | $ | 91,429 | | | | | $ | 91,885 | | | | | $ | 83,080 | | | |
| LIABILITIES AND SHAREHOLDERS’ EQUITY | | | | | | | | | | |
| Interest-bearing deposits: | | | | | | | | | | | |
| Savings and money market | $ | 39,132 | | | 0.05 | % | | $ | 38,349 | | | 0.05 | % | | $ | 35,232 | | | 0.07 | % |
| Time | 1,587 | | | 0.26 | % | | 1,662 | | | 0.29 | % | | 2,491 | | | 0.55 | % |
| | | | | | | | | | | |
| Total interest-bearing deposits | 40,719 | | | 0.06 | % | | 40,011 | | | 0.06 | % | | 37,723 | | | 0.10 | % |
| Borrowed funds: | | | | | | | | | | | |
| Federal funds purchased and other short-term borrowings | 594 | | | 0.08 | % | | 641 | | | 0.07 | % | | 1,110 | | | 0.07 | % |
| Long-term debt | 823 | | | 2.66 | % | | 1,017 | | | 2.54 | % | | 1,324 | | | 2.30 | % |
| Total borrowed funds | 1,417 | | | 1.58 | % | | 1,658 | | | 1.59 | % | | 2,434 | | | 1.28 | % |
| Total interest-bearing funds | 42,136 | | | 0.11 | % | | 41,669 | | | 0.12 | % | | 40,157 | | | 0.17 | % |
| Noninterest-bearing demand deposits | 40,886 | | | | | 41,397 | | | | | 33,723 | | | |
| Other liabilities | 1,267 | | | | | 1,233 | | | | | 1,301 | | | |
| Total liabilities | 84,289 | | | | | 84,299 | | | | | 75,181 | | | |
| Shareholders’ equity: | | | | | | | | | | | |
| Preferred equity | 440 | | | | | 440 | | | | | 566 | | | |
| Common equity | 6,700 | | | | | 7,146 | | | | | 7,333 | | | |
| | | | | | | | | | | |
| | | | | | | | | | | |
| Total shareholders’ equity | 7,140 | | | | | 7,586 | | | | | 7,899 | | | |
| Total liabilities and shareholders’ equity | $ | 91,429 | | | | | $ | 91,885 | | | | | $ | 83,080 | | | |
| Spread on average interest-bearing funds | | | 2.54 | % | | | | 2.52 | % | | | | 2.78 | % |
| Impact of net noninterest-bearing sources of funds | | | 0.06 | % | | | | 0.06 | % | | | | 0.08 | % |
| Net interest margin | | | 2.60 | % | | | | 2.58 | % | | | | 2.86 | % |
| Memo: total loans and leases, excluding PPP loans | 49,474 | | | 3.43 | % | | 48,252 | | | 3.56 | % | | 47,530 | | | 3.69 | % |
| | | | | | | | | | | |
| Memo: total cost of deposits | | | 0.03 | % | | | | 0.03 | % | | | | 0.05 | % |
| Memo: total deposits and interest-bearing liabilities | 83,022 | | | 0.06 | % | | 83,066 | | | 0.06 | % | | 73,880 | | | 0.09 | % |
1 Rates are calculated using amounts in thousands and a tax rate of 21% for the periods presented.
2 Net of unamortized purchase premiums, discounts, and deferred loan fees and costs.
ZIONS BANCORPORATION, N.A.
Press Release – Page 15
April 25, 2022
GAAP to Non-GAAP Reconciliations
(Unaudited)
This press release presents non-GAAP financial measures, in addition to GAAP financial measures, to provide investors with additional information. The adjustments to reconcile from the applicable GAAP financial measures to the non-GAAP financial measures are presented in the following schedules. We consider these adjustments to be relevant to ongoing operating results and to provide a meaningful base for period-to-period and company-to-company comparisons. We use these non-GAAP financial measures to assess our performance, financial position, and for presentations of our performance to investors. We believe that presenting these non-GAAP financial measures permits investors to assess our performance on the same basis as that applied by our management and the financial services industry.
Non-GAAP financial measures have inherent limitations and are not necessarily comparable to similar financial measures that may be presented by other financial services companies. Although non-GAAP financial measures are frequently used by stakeholders to evaluate a company, they have limitations as an analytical tool and should not be considered in isolation or as a substitute for analysis of results reported under GAAP.
Tangible Common Equity and Related Measures
Tangible common equity and related measures are non-GAAP measures that exclude the impact of intangible assets and their related amortization. We believe these non-GAAP measures provide useful information about our use of shareholders’ equity and provide a basis for evaluating the performance of a business more consistently, whether acquired or developed internally.
| | | | | | | | | | | | | | | | | | | | | | | | | | | | | | | | |
| | Three Months Ended |
| (Dollar amounts in millions) | | March 31,
2022 | | December 31,
2021 | | September 30,
2021 | | June 30,
2021 | | March 31,
2021 |
| Return on Average Tangible Common Equity | | | | | | | | | |
| | | | | | | | | | |
| | | | | | | | | | |
| | | | | | | | | | |
| | | | | | | | | | |
| Net earnings applicable to common shareholders, net of tax | (a) | $ | 195 | | | $ | 207 | | | $ | 234 | | | $ | 345 | | | $ | 314 | |
| Average common equity (GAAP) | | $ | 6,700 | | | $ | 7,146 | | | $ | 7,569 | | | $ | 7,436 | | | $ | 7,333 | |
| Average goodwill and intangibles | | (1,015) | | | (1,015) | | | (1,015) | | | (1,015) | | | (1,016) | |
| Average tangible common equity (non-GAAP) | (b) | $ | 5,685 | | | $ | 6,131 | | | $ | 6,554 | | | $ | 6,421 | | | $ | 6,317 | |
| Number of days in quarter | (c) | 90 | | | 92 | | | 92 | | | 91 | | | 90 | |
| Number of days in year | (d) | 365 | | | 365 | | | 365 | | | 365 | | | 365 | |
| Return on average tangible common equity (non-GAAP) | (a/b/c)*d | 13.9 | % | | 13.4 | % | | 14.2 | % | | 21.6 | % | | 20.2 | % |
| | | | | | | | | | | | | | | | | | | | | | | | | | | | | | | | |
| (In millions, except shares and per share amounts) | | March 31,
2022 | | December 31,
2021 | | September 30,
2021 | | June 30,
2021 | | March 31,
2021 |
| Tangible Book Value per Common Share | | | | | | | | | | |
| Total shareholders’ equity (GAAP) | | $ | 6,294 | | | $ | 7,463 | | | $ | 7,774 | | | $ | 8,033 | | | $ | 7,933 | |
| Preferred stock | | (440) | | | (440) | | | (440) | | | (440) | | | (566) | |
| Goodwill and intangibles | | (1,015) | | | (1,015) | | | (1,015) | | | (1,015) | | | (1,016) | |
| Tangible common equity (non-GAAP) | (a) | $ | 4,839 | | | $ | 6,008 | | | $ | 6,319 | | | $ | 6,578 | | | $ | 6,351 | |
| Common shares outstanding (in thousands) | (b) | 151,348 | | | 151,625 | | | 156,530 | | | 162,248 | | | 163,800 | |
| Tangible book value per common share (non-GAAP) | (a/b) | $ | 31.97 | | | $ | 39.62 | | | $ | 40.37 | | | $ | 40.54 | | | $ | 38.77 | |
ZIONS BANCORPORATION, N.A.
Press Release – Page 16
April 25, 2022
Efficiency Ratio and Adjusted Pre-Provision Net Revenue
The efficiency ratio is a measure of operating expense relative to revenue. We believe the efficiency ratio provides useful information regarding the cost of generating revenue. The methodology of determining the efficiency ratio may differ among companies. We make adjustments to exclude certain items that are not generally expected to recur frequently, as identified in the subsequent schedule, which we believe allow for more consistent comparability across periods. Adjusted noninterest expense provides a measure as to how well we are managing our expenses; adjusted pre-provision net revenue (“PPNR”) enables management and others to assess our ability to generate capital. Taxable-equivalent net interest income allows us to assess the comparability of revenue arising from both taxable and tax-exempt sources.
| | | | | | | | | | | | | | | | | | | | | | | | | | | | | | | | |
| | Three Months Ended |
| (In millions) | | March 31,
2022 | | December 31,
2021 | | September 30,
2021 | | June 30,
2021 | | March 31,
2021 |
| Efficiency Ratio | | | | | | | | | | |
| Noninterest expense (GAAP) | (a) | $ | 464 | | | $ | 449 | | | $ | 429 | | | $ | 428 | | | $ | 435 | |
| Adjustments: | | | | | | | | | | |
| Severance costs | | — | | | — | | | 1 | | | — | | | — | |
| Other real estate expense, net | | 1 | | | — | | | — | | | — | | | — | |
| | | | | | | | | | |
| Amortization of core deposit and other intangibles | | — | | | 1 | | | — | | | — | | | — | |
| | | | | | | | | | |
| Pension termination-related expense | | — | | | — | | | — | | | — | | | (5) | |
| | | | | | | | | | |
SBIC investment success fee accrual 1 | | (1) | | | 2 | | | (4) | | | 9 | | | — | |
| Total adjustments | (b) | — | | | 3 | | | (3) | | | 9 | | | (5) | |
| Adjusted noninterest expense (non-GAAP) | (a-b)=(c) | $ | 464 | | | $ | 446 | | | $ | 432 | | | $ | 419 | | | $ | 440 | |
| | | | | | | | | | |
| Net interest income (GAAP) | (d) | $ | 544 | | | $ | 553 | | | $ | 555 | | | $ | 555 | | | $ | 545 | |
| Fully taxable-equivalent adjustments | (e) | 8 | | | 10 | | | 7 | | | 7 | | | 8 | |
| Taxable-equivalent net interest income (non-GAAP) | (d+e)=(f) | 552 | | | 563 | | | 562 | | | 562 | | | 553 | |
| Noninterest income (GAAP) | (g) | 142 | | | 190 | | | 139 | | | 205 | | | 169 | |
| Combined income (non-GAAP) | (f+g)=(h) | 694 | | | 753 | | | 701 | | | 767 | | | 722 | |
| Adjustments: | | | | | | | | | | |
| Fair value and nonhedge derivative income (loss) | | 6 | | | (1) | | | 2 | | | (5) | | | 18 | |
| Securities gains (losses), net | | (17) | | | 20 | | | (23) | | | 63 | | | 11 | |
| Total adjustments | (i) | (11) | | | 19 | | | (21) | | | 58 | | | 29 | |
Adjusted taxable-equivalent revenue (non-GAAP) | (h-i)=(j) | $ | 705 | | | $ | 734 | | | $ | 722 | | | $ | 709 | | | $ | 693 | |
| | | | | | | | | | |
| Pre-provision net revenue (PPNR) (non-GAAP) | (h)-(a) | $ | 230 | | | $ | 304 | | | $ | 272 | | | $ | 339 | | | $ | 287 | |
| Adjusted PPNR (non-GAAP) | (j)-(c) | 241 | | | 288 | | | 290 | | | 290 | | | 253 | |
| Efficiency ratio (non-GAAP) | (c/j) | 65.8 | % | | 60.8 | % | | 59.8 | % | | 59.1 | % | | 63.5 | % |
1 The success fee accrual is associated with the gains/(losses) from our SBIC investments. The gains/(losses) related to these investments are excluded from the efficiency ratio through securities gains, net.
