
January 23, 2023 Fourth Quarter 2022 Financial Review

2 Forward-Looking Statements; Use of Non-GAAP Financial Measures Forward Looking Information This earnings presentation includes “forward-looking statements” as that term is defined in the Private Securities Litigation Reform Act of 1995. These statements, often accompanied by words such as “may,” “might,” “could,” “anticipate,” “expect,” and similar terms, are based on management’s current expectations and assumptions regarding future events or determinations, all of which are subject to known and unknown risks and uncertainties. Forward-looking statements are not guarantees, nor should they be relied upon as representing management’s views as of any subsequent date. Factors that could cause our actual results, performance or achievements, industry trends, and results or regulatory outcomes to differ materially from those expressed or implied in the forward-looking statements are discussed in our 2021 Form 10-K and subsequent filings with the Securities and Exchange Commission (SEC) and are available on our website (www.zionsbancorporation.com) and from the SEC (www.sec.gov). Except to the extent required by law, we specifically disclaim any obligation to update any factors or to publicly announce the revisions to any forward-looking statements to reflect future events or developments. Use of Non-GAAP Financial Measures: This document contains several references to non-GAAP measures, including but not limited to, pre-provision net revenue and the “efficiency ratio,” which are common industry terms used by investors and financial services analysts. Certain of these non-GAAP measures are key inputs into Zions’ management compensation and are used in Zions’ strategic goals that have been and may continue to be articulated to investors. Therefore, the use of such non-GAAP measures are believed by management to be of substantial interest to the consumers of these financial disclosures and are used prominently throughout the disclosures. A full reconciliation of the difference between such measures and GAAP financials is provided within the document, and users of this document are encouraged to carefully review this reconciliation.

▪ The value of our deposit base contributed to a strong increase in net interest income ▪ Our low-cost deposits have been a catalyst for growth in our quarterly net interest income (excl. PPP) of 41% over the year-ago quarter, and of pre- provision net revenue (excl. PPP), which increased 71% ▪ Deposit attrition has primarily been the result of “surge” deposit attrition; our particularly strong liquidity profile going into 2022 positioned Zions to allow for deposit runoff. Deposit pricing will likely increase at a faster rate in the near term ▪ We generated strong loan growth ▪ We generated $1.8 billion of loan growth in the fourth quarter (13.8% annualized, excl. PPP) and $6.4 billion of net growth in 2022 (13.2%, excl. PPP) while using underwriting standards and concentration limits that have produced superior credit performance ▪ A substantial 36% of our 2022 loan growth (excl. PPP) was in lower-risk categories including 1-4 family and municipal loans ▪ Commercial and industrial loans accounted for another 36% of the loan growth in 2022, increasing 17% over the prior year’s level ▪ Our balance sheet composition allows for a great deal of flexibility ▪ Our loan-to-deposit ratio of 78% continues to provide a cushion to absorb future loan growth and deposit migration ▪ Our deposit strategy includes optimizing the size of the balance sheet and the cost of funding; rate cycle-to-date total deposit cost beta1 of just 5% ▪ We are prepared for a recession ▪ We have a strong stream of earnings (4Q22 annualized PPNR of $1.6 billion), significant loss-absorbing regulatory capital and allowance for credit losses ▪ We have well-managed concentrations and smaller hold limits in higher-risk categories; we have very little unsecured consumer exposure; our loans are underwritten to withstand the effects of moderately higher interest rates 3 Select Themes The high quality, low-cost nature of our deposits, along with strong loan growth helped to drive a significant increase in PPNR (1) Deposit beta is calculated as the change in the cost of total average deposits (including both interest and noninterest bearing) from 4Q21 to 4Q22 which was 17 basis points, relative to the change in the target (high) federal funds rate for the same period, which increased 360 basis points to a quarterly average of 3.85% in 4Q22 from 0.25% in 4Q21.
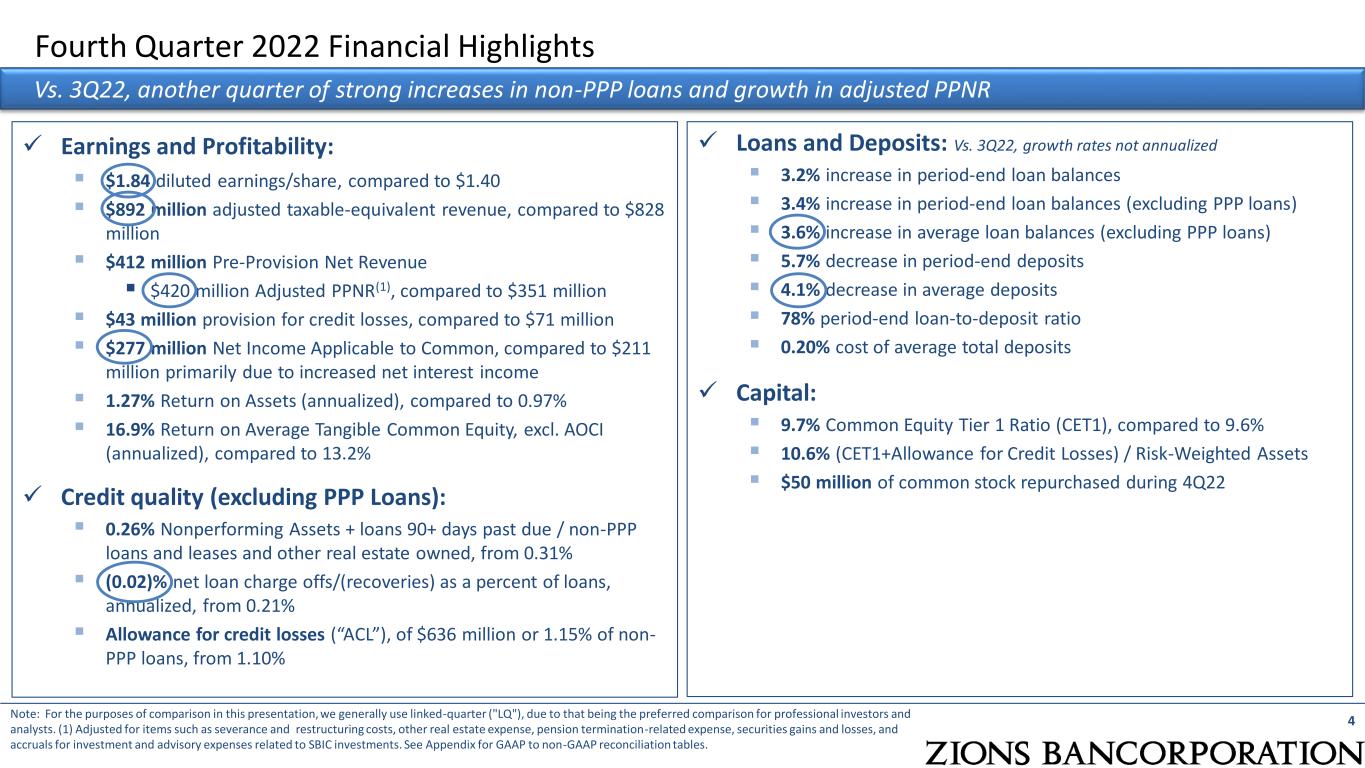
✓ Earnings and Profitability: ▪ $1.84 diluted earnings/share, compared to $1.40 ▪ $892 million adjusted taxable-equivalent revenue, compared to $828 million ▪ $412 million Pre-Provision Net Revenue ▪ $420 million Adjusted PPNR(1), compared to $351 million ▪ $43 million provision for credit losses, compared to $71 million ▪ $277 million Net Income Applicable to Common, compared to $211 million primarily due to increased net interest income ▪ 1.27% Return on Assets (annualized), compared to 0.97% ▪ 16.9% Return on Average Tangible Common Equity, excl. AOCI (annualized), compared to 13.2% ✓ Credit quality (excluding PPP Loans): ▪ 0.26% Nonperforming Assets + loans 90+ days past due / non-PPP loans and leases and other real estate owned, from 0.31% ▪ (0.02)% net loan charge offs/(recoveries) as a percent of loans, annualized, from 0.21% ▪ Allowance for credit losses (“ACL”), of $636 million or 1.15% of non- PPP loans, from 1.10% 4 Fourth Quarter 2022 Financial Highlights Vs. 3Q22, another quarter of strong increases in non-PPP loans and growth in adjusted PPNR Note: For the purposes of comparison in this presentation, we generally use linked-quarter ("LQ"), due to that being the preferred comparison for professional investors and analysts. (1) Adjusted for items such as severance and restructuring costs, other real estate expense, pension termination-related expense, securities gains and losses, and accruals for investment and advisory expenses related to SBIC investments. See Appendix for GAAP to non-GAAP reconciliation tables. ✓ Loans and Deposits: Vs. 3Q22, growth rates not annualized ▪ 3.2% increase in period-end loan balances ▪ 3.4% increase in period-end loan balances (excluding PPP loans) ▪ 3.6% increase in average loan balances (excluding PPP loans) ▪ 5.7% decrease in period-end deposits ▪ 4.1% decrease in average deposits ▪ 78% period-end loan-to-deposit ratio ▪ 0.20% cost of average total deposits ✓ Capital: ▪ 9.7% Common Equity Tier 1 Ratio (CET1), compared to 9.6% ▪ 10.6% (CET1+Allowance for Credit Losses) / Risk-Weighted Assets ▪ $50 million of common stock repurchased during 4Q22
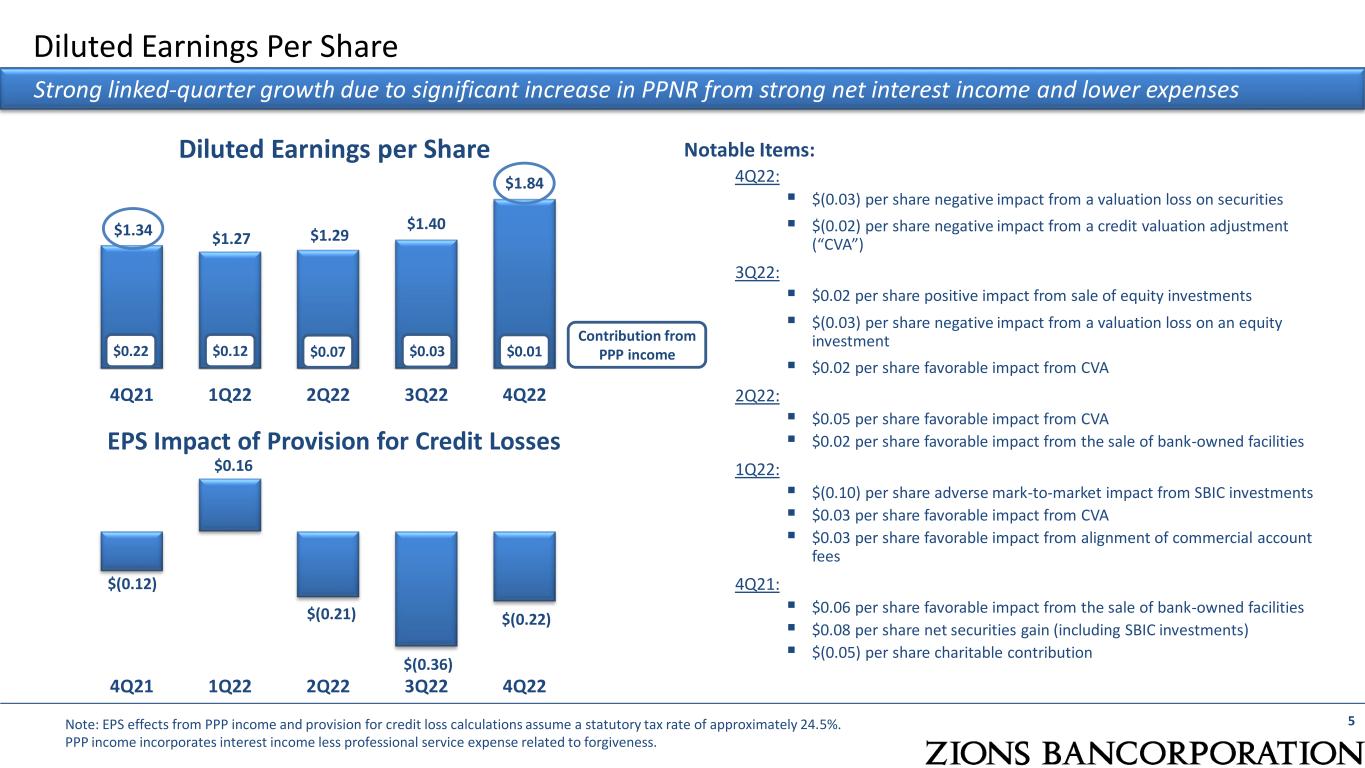
$1.34 $1.27 $1.29 $1.40 $1.84 4Q21 1Q22 2Q22 3Q22 4Q22 Diluted Earnings Per Share Notable Items: 4Q22: ▪ $(0.03) per share negative impact from a valuation loss on securities ▪ $(0.02) per share negative impact from a credit valuation adjustment (“CVA”) 3Q22: ▪ $0.02 per share positive impact from sale of equity investments ▪ $(0.03) per share negative impact from a valuation loss on an equity investment ▪ $0.02 per share favorable impact from CVA 2Q22: ▪ $0.05 per share favorable impact from CVA ▪ $0.02 per share favorable impact from the sale of bank-owned facilities 1Q22: ▪ $(0.10) per share adverse mark-to-market impact from SBIC investments ▪ $0.03 per share favorable impact from CVA ▪ $0.03 per share favorable impact from alignment of commercial account fees 4Q21: ▪ $0.06 per share favorable impact from the sale of bank-owned facilities ▪ $0.08 per share net securities gain (including SBIC investments) ▪ $(0.05) per share charitable contribution 5 Strong linked-quarter growth due to significant increase in PPNR from strong net interest income and lower expenses Diluted Earnings per Share Note: EPS effects from PPP income and provision for credit loss calculations assume a statutory tax rate of approximately 24.5%. PPP income incorporates interest income less professional service expense related to forgiveness. $(0.12) $0.16 $(0.21) $(0.36) $(0.22) 4Q21 1Q22 2Q22 3Q22 4Q22 EPS Impact of Provision for Credit Losses $0.22 $0.12 $0.07 $0.03 Contribution from PPP income$0.01

44 24 15 6 2 288 241 300 351 420 4Q21 1Q22 2Q22 3Q22 4Q22 Adjusted PPNR, excluding PPP (non-GAAP) Interest Income from PPP Loans Adjusted Pre-Provision Net Revenue (“PPNR”) Adjusted PPNR increased 20% from the prior quarter, primarily due to the benefit of higher rates (1) Adjusted for items such as severance costs, restructuring costs, other real estate expense, pension termination-related expense, securities gains and losses, and accruals for investment and advisory expenses related to the unrealized gains/(losses) on SBIC investments. See Appendix for GAAP to non-GAAP reconciliation table. (2) Interest income from PPP, as shown, is net of professional services expense associated with forgiveness. Adjusted PPNR(1) ($ millions) 6 Linked quarter: ▪ Adjusted PPNR increased 20% primarily from ▪ An 8% increase in adjusted revenue ▪ Significantly higher yields on all major asset categories from rising interest rates combined with modest change in funding costs ▪ Growth of higher yield assets (e.g., loans vs. money market) ▪ A 1% decrease in adjusted noninterest expense Year-over-year: ▪ Adjusted PPNR increased 46% ▪ Loan yields, excluding PPP, grew by 126 basis points; loan balances increased $4.8 billion (9.4%), or $6.5 billion (13.2%) if excluding PPP loans ▪ Taxable-equivalent net interest income increased 30% ▪ Stable level of customer-related noninterest income ▪ Net revenue growth partially offset by a 6% increase in adjusted noninterest expense (2)

$48.3 $49.5 $51.0 $52.5 $54.4$2.4 $1.5 $0.8 $0.4 $0.3 3.73% 3.52% 3.67% 4.17% 4.81% $0.0 $25.0 $50.0 $75.0 $100.0 4Q21 1Q22 2Q22 3Q22 4Q22 Average Total Loans Excluding PPP Loans, Yield: 4.82% in 4Q22 Average PPP Loans Average Loan and Deposit Balances Average Total Loans Yield on Total Loans Average Total Deposits Cost of Total Deposits 7 Vs. 3Q22, average non-PPP loans increased 3.6% in 4Q22; average deposits decreased 4.1% $40.0 $40.7 $39.8 $37.8 $36.2 $41.4 $40.9 $41.1 $39.6 $38.0 0.03% 0.03% 0.03% 0.10% 0.20% $0.0 $25.0 $50.0 $75.0 $100.0 4Q21 1Q22 2Q22 3Q22 4Q22 Average Noninterest-bearing Deposits Average Interest-bearing Deposits ($ billions) ($ billions)

Deposit Trends 8 Deposit attrition is primarily from larger and less operational accounts; 47% has moved to off-balance sheet sweep accounts $0 $10 $20 $30 $40 $50 $60 $10MM+ $10MM and below B ill io n s Deposits by Balance Tier (excl. Brokered & Select Trust Accounts) 12/31/21 12/31/22 $8.0 billion of attrition $1 .6 b ill io n o f at tr it io n $2.9 billion f attrition Notes: (1) This analysis contains customer deposits only, excluding brokered and certain deposit accounts such as select omnibus trust accounts and certain internal operational accounts (2) For purposes of categorizing into tiers, balances are grouped into relationships which are potentially multiple related TIN-aligned customers (3) Tier categorization is based on the greater of balances at 12/31/21 and 12/31/22 Deposit attrition composition and destination: ▪ Attrition in 2022 was concentrated in larger balance, more rate sensitive / non-operating deposits ▪ The most active / operating accounts remained relatively steady during the year ▪ Off-balance sheet money market sweep balances increased to $11.2 billion at December 31, 2022 from $9.2 billion at September 30, 2022 and $6.0 billion at December 31, 2021 Additional Deposit Data ▪ At 78%, our loan-to-deposit ratio is low relative to historical levels ▪ Our deposit beta is just 5% thus far this cycle ▪ Our commercial deposit customer satisfaction scores rank among the very best in the industry ▪ Our median commercial relationship balance is less than $20,000, with the average balance less than $250,000 ▪ Our median consumer relationship balance is less than $5,000, with the average balance less than $40,000
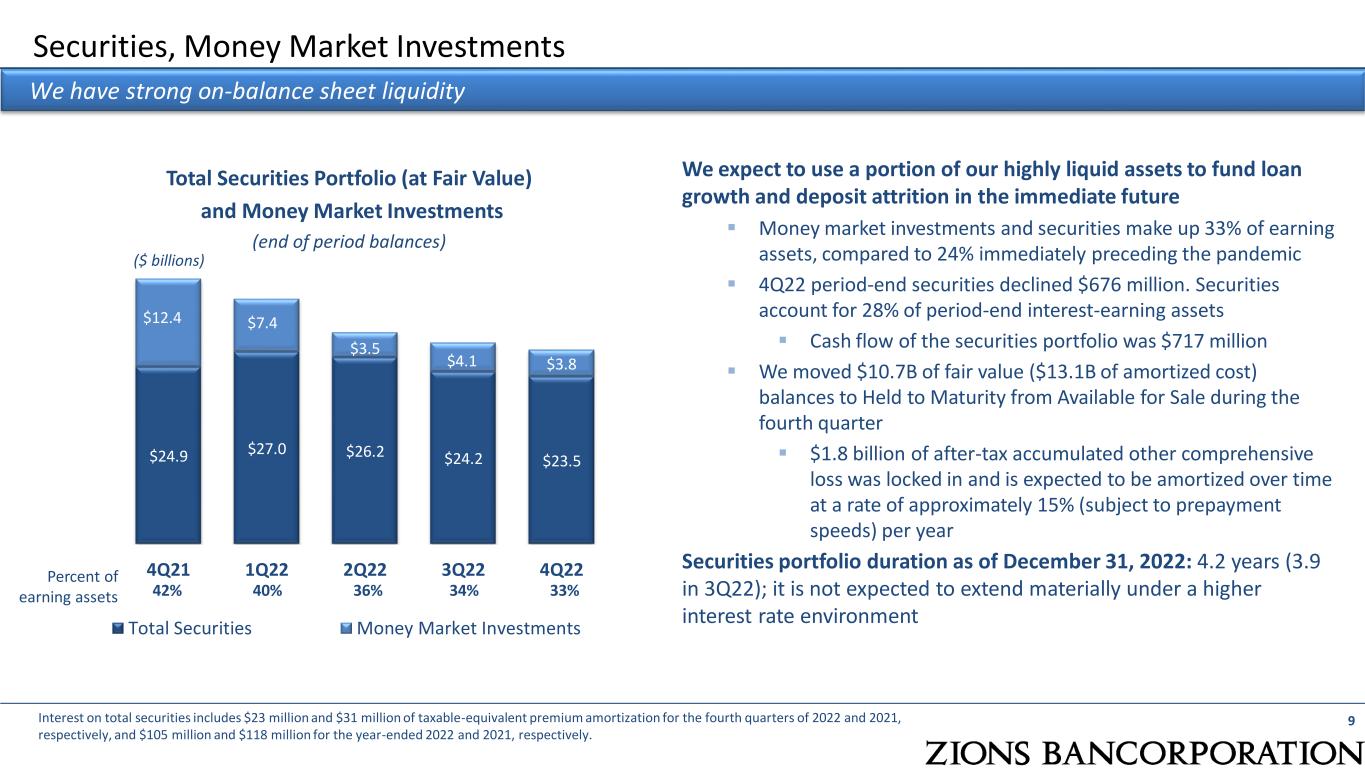
Securities, Money Market Investments 9 Total Securities Portfolio (at Fair Value) and Money Market Investments (end of period balances) $24.9 $27.0 $26.2 $24.2 $23.5 $12.4 $7.4 $3.5 $4.1 $3.8 4Q21 1Q22 2Q22 3Q22 4Q22 Total Securities Money Market Investments ($ billions) We have strong on-balance sheet liquidity We expect to use a portion of our highly liquid assets to fund loan growth and deposit attrition in the immediate future ▪ Money market investments and securities make up 33% of earning assets, compared to 24% immediately preceding the pandemic ▪ 4Q22 period-end securities declined $676 million. Securities account for 28% of period-end interest-earning assets ▪ Cash flow of the securities portfolio was $717 million ▪ We moved $10.7B of fair value ($13.1B of amortized cost) balances to Held to Maturity from Available for Sale during the fourth quarter ▪ $1.8 billion of after-tax accumulated other comprehensive loss was locked in and is expected to be amortized over time at a rate of approximately 15% (subject to prepayment speeds) per year 42% 40% 36% 34% 33% Percent of earning assets Securities portfolio duration as of December 31, 2022: 4.2 years (3.9 in 3Q22); it is not expected to extend materially under a higher interest rate environment Interest on total securities includes $23 million and $31 million of taxable-equivalent premium amortization for the fourth quarters of 2022 and 2021, respectively, and $105 million and $118 million for the year-ended 2022 and 2021, respectively.

509 520 578 657 718 44 24 15 6 2 $553 $544 $593 $663 $720 2.58% 2.60% 2.87% 3.24% 3.53% 2.45% 2.53% 2.83% 3.22% 3.53% 2.35% 2.55% 2.75% 2.95% 3.15% 3.35% 3.55% 3.75% 3.95% $0 4Q21 1Q22 2Q22 3Q22 4Q22 Net interest income, excluding PPP Net Interest Income associated with PPP Net Interest Income (“NII”) and Net Interest Margin (“NIM”) Net Interest Income Net Interest Margin Net Interest Margin, excl. PPP 10 Vs. 3Q22, net interest income increase driven by continued rate increases and loan growth ($ millions) Net Interest Margin 3Q22 4Q22 Impact of noninterest- bearing sources of funds Interest- bearing liability costs As of December 31, 2022, unamortized net origination fees related to the PPP loans totaled $2 million, to be amortized over the remaining life or as forgiven by the SBA. Net interest income from PPP loans assumes a funding cost equal to each period’s total cost of deposits and debt. 1 Loan Yields includes the effect of swaps. Zions’ strong base of noninterest bearing deposits and rising interest rates combined to result in an expansion of the NIM. Earning assets1 Asset sensitive positioning during rising rates has led to increasing margin

Interest Rate Sensitivity 11 With slowing rate hikes and funding costs expected to increase, NII may decline slightly on a static balance sheet; however, with loan growth, we expect a further slight increase in NII in 4Q23 vs. 4Q22 (1) 12-month forward simulated impact of an instantaneous and parallel change in interest rates and assumes no change in the size or composition of the earning assets, while it assumes a change in composition of deposits (a lesser proportion of noninterest bearing relative to total deposits). Latent interest rate sensitivity refers to future changes in Net Interest Income (“NII”) based upon past rate movements that have yet to be fully realized in revenue Latent sensitivity is modeled to reduce NII by approximately 1% in 4Q23 when compared to 4Q22 (excluding PPP revenues) ▪ This reflects primarily a higher modeled deposit beta (18% through 4Q23 in both latent and emergent) than in recent history (5%) Emergent interest rate sensitivity refers to changes to NII based upon future rate movements Forward curve-driven (as of 12/31) emergent sensitivity is modeled to reduce NII by approximately 2% in 4Q23 when compared to 4Q22 (excluding PPP revenues) ▪ Higher NII starting point with fewer rate increases than before ▪ Adversely affected by the market’s expected reduction in the fed funds rate in 2H23 and lower rates on medium and long maturities (i.e. more inverted curve) This simulation does not include any changes to the size or composition of earning assets; it reflects existing swap maturities and forward-starting swaps The linked-quarter reduction in interest rate sensitivity is primarily attributable to a reduction of deposits -9% -4% 4% 8% -5% -2% 2% 5% −200 bps −100 bps +100 bps +200 bps Simulated Net Interest Income Sensitivity (1) as of 9/30/2022 as of 12/31/2022
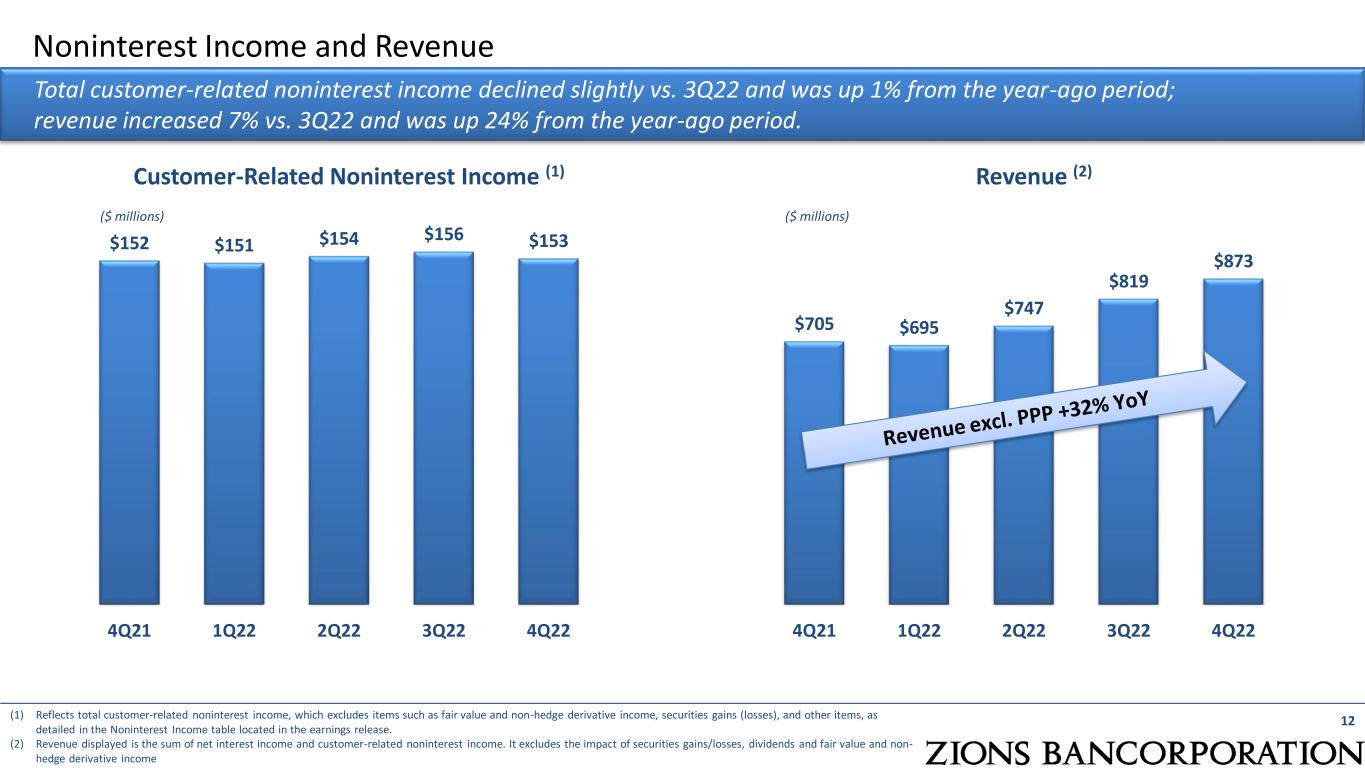
$152 $151 $154 $156 $153 4Q21 1Q22 2Q22 3Q22 4Q22 Noninterest Income and Revenue 12 Customer-Related Noninterest Income (1) Total customer-related noninterest income declined slightly vs. 3Q22 and was up 1% from the year-ago period; revenue increased 7% vs. 3Q22 and was up 24% from the year-ago period. (1) Reflects total customer-related noninterest income, which excludes items such as fair value and non-hedge derivative income, securities gains (losses), and other items, as detailed in the Noninterest Income table located in the earnings release. (2) Revenue displayed is the sum of net interest income and customer-related noninterest income. It excludes the impact of securities gains/losses, dividends and fair value and non- hedge derivative income ($ millions) $705 $695 $747 $819 $873 4Q21 1Q22 2Q22 3Q22 4Q22 Revenue (2) ($ millions)

$4 49 $4 64 $4 64 $4 79 $4 71 $4 46 $4 64 $4 63 $4 77 $4 72 4Q21 1Q22 2Q22 3Q22 4Q22 NIE (GAAP) Adjusted NIE (Non-GAAP) ($ millions) Noninterest Expense 13 Noninterest expense decreased 2% vs. 3Q22 and was up 5% from the year-ago period Total noninterest expense decreased $8 million, compared to the prior quarter, primarily due to a net decrease of certain incentive compensation items Notable items in: ▪ 3Q22: $5 million higher salaries and benefits ▪ 2Q22: $3 million higher deposit insurance ▪ 1Q22: $13 million of seasonal share-based compensation ▪ 4Q21: $10 million donation to Zions Foundation; $2 million success fee related to net gains on SBIC investments (1) Adjusted for items such as severance, provision for unfunded lending commitments, and accruals for investment and advisory expenses related to the unrealized gain on an SBIC investment. See Appendix for GAAP to non-GAAP reconciliation table. Noninterest Expense (NIE) (1)
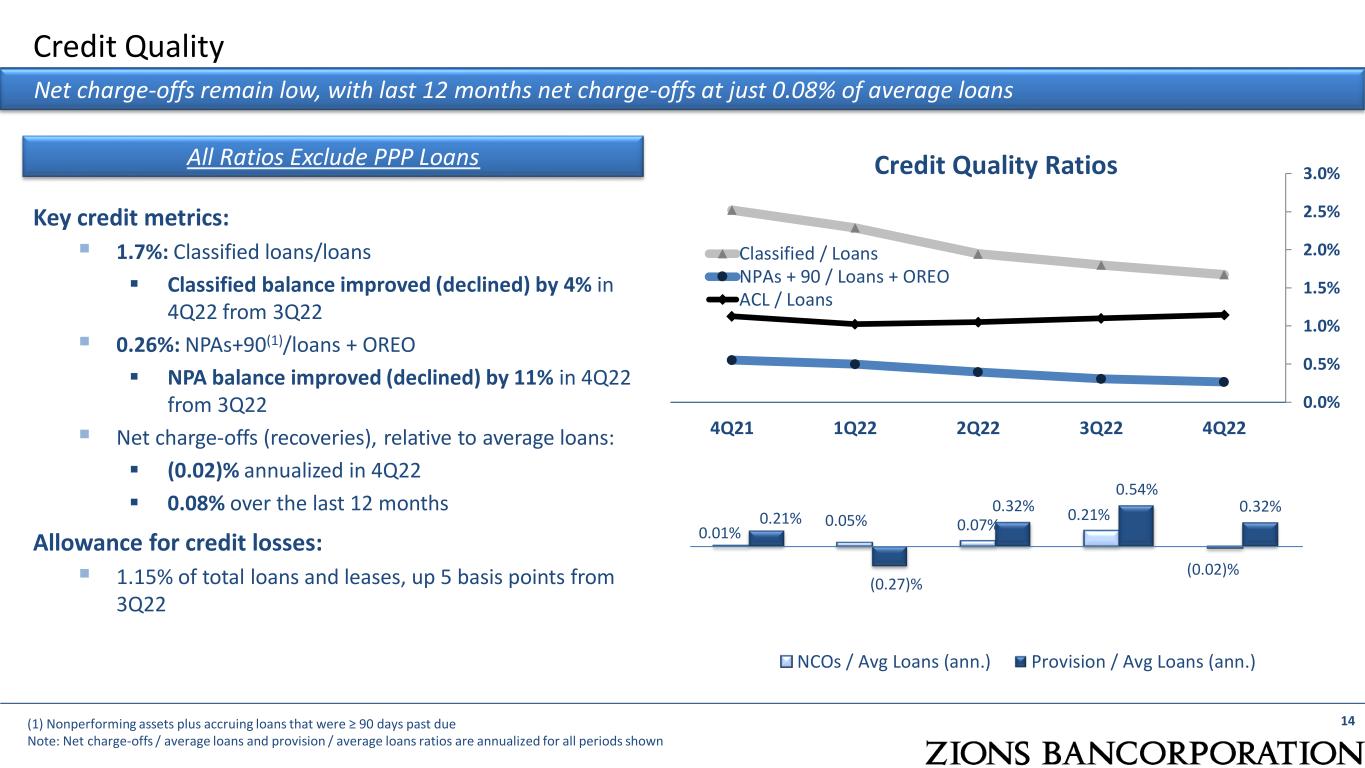
14 Credit Quality Ratios Net charge-offs remain low, with last 12 months net charge-offs at just 0.08% of average loans Key credit metrics: ▪ 1.7%: Classified loans/loans ▪ Classified balance improved (declined) by 4% in 4Q22 from 3Q22 ▪ 0.26%: NPAs+90(1)/loans + OREO ▪ NPA balance improved (declined) by 11% in 4Q22 from 3Q22 ▪ Net charge-offs (recoveries), relative to average loans: ▪ (0.02)% annualized in 4Q22 ▪ 0.08% over the last 12 months Allowance for credit losses: ▪ 1.15% of total loans and leases, up 5 basis points from 3Q22 (1) Nonperforming assets plus accruing loans that were ≥ 90 days past due Note: Net charge-offs / average loans and provision / average loans ratios are annualized for all periods shown Credit Quality 0.0% 0.5% 1.0% 1.5% 2.0% 2.5% 3.0% 4Q21 1Q22 2Q22 3Q22 4Q22 Classified / Loans NPAs + 90 / Loans + OREO ACL / Loans All Ratios Exclude PPP Loans 0.01% 0.05% 0.07% 0.21% (0.02)% 0.21% (0.27)% 0.32% 0.54% 0.32% NCOs / Avg Loans (ann.) Provision / Avg Loans (ann.)
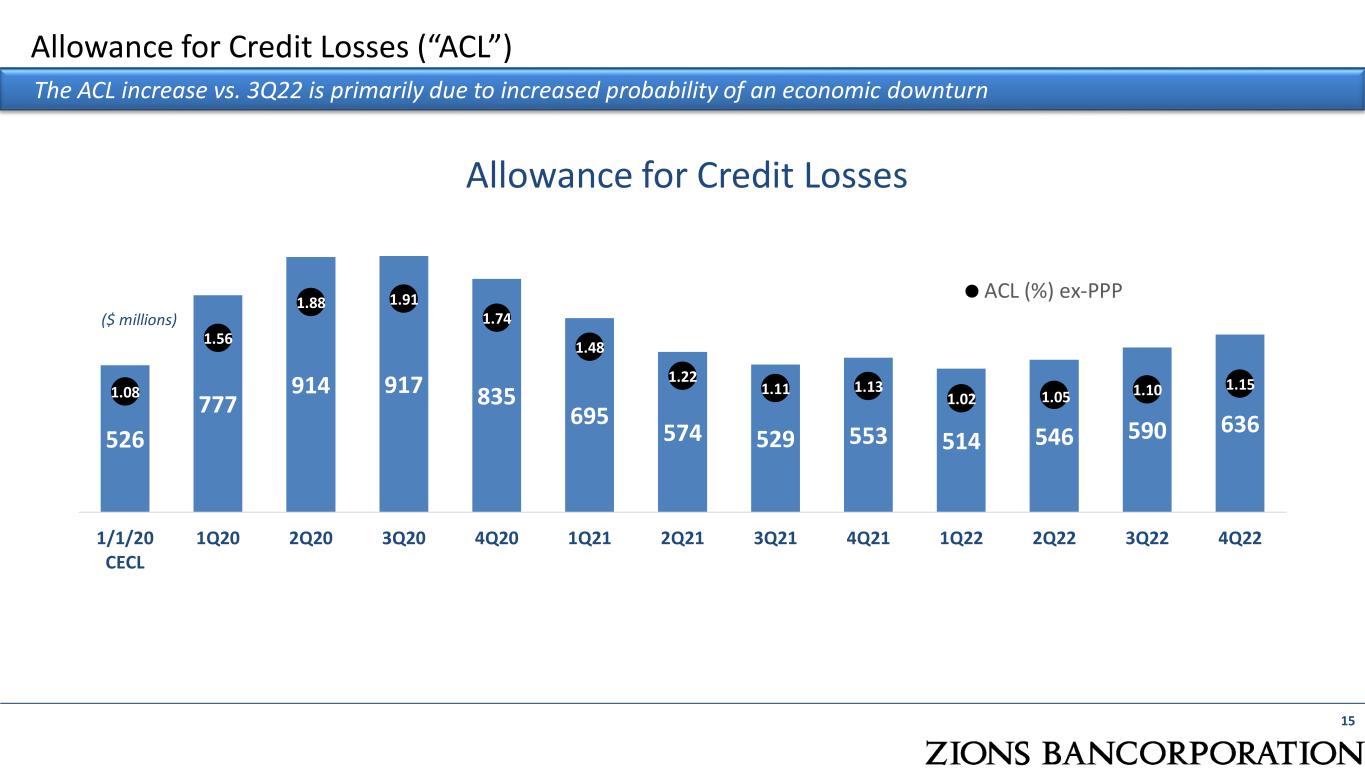
526 777 914 917 835 695 574 529 553 514 546 590 636 1.08 1.56 1.88 1.91 1.74 1.48 1.22 1.11 1.13 1.02 1.05 1.10 1.15 1/1/20 CECL 1Q20 2Q20 3Q20 4Q20 1Q21 2Q21 3Q21 4Q21 1Q22 2Q22 3Q22 4Q22 Allowance for Credit Losses ACL (%) ex-PPP 15 Allowance for Credit Losses (“ACL”) The ACL increase vs. 3Q22 is primarily due to increased probability of an economic downturn ($ millions)
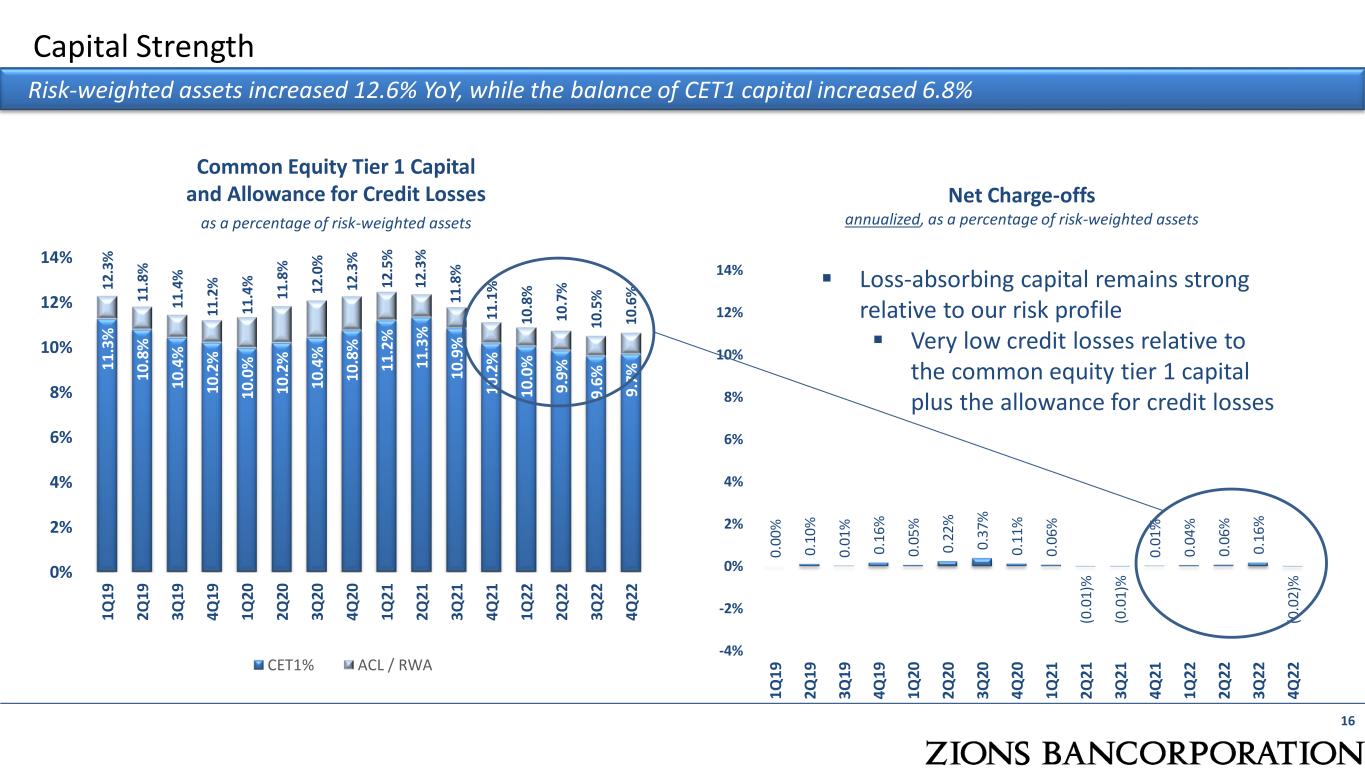
Net Charge-offs annualized, as a percentage of risk-weighted assets 0. 00 % 0. 10 % 0. 01 % 0 .1 6% 0. 05 % 0. 22 % 0. 37 % 0 .1 1% 0. 06 % (0 .0 1) % (0 .0 1 )% 0 .0 1% 0 .0 4 % 0 .0 6% 0. 16 % (0 .0 2 )% -4% -2% 0% 2% 4% 6% 8% 10% 12% 14% 1Q 19 2Q 19 3Q 19 4Q 19 1Q 20 2Q 20 3Q 20 4Q 20 1Q 21 2Q 21 3Q 21 4Q 21 1Q 22 2Q 22 3Q 22 4Q 22 Capital Strength 16 Risk-weighted assets increased 12.6% YoY, while the balance of CET1 capital increased 6.8% Common Equity Tier 1 Capital and Allowance for Credit Losses as a percentage of risk-weighted assets 11 .3 % 10 .8 % 10 .4 % 10 .2 % 10 .0 % 1 0 .2 % 10 .4 % 10 .8 % 11 .2 % 11 .3 % 10 .9 % 10 .2 % 10 .0 % 9. 9% 9. 6% 9 .7 % 12 .3 % 11 .8 % 11 .4 % 11 .2 % 11 .4 % 11 .8 % 1 2 .0 % 12 .3 % 12 .5 % 12 .3 % 11 .8 % 1 1 .1 % 10 .8 % 10 .7 % 10 .5 % 10 .6 % 0% 2% 4% 6% 8% 10% 12% 14% 1Q 19 2Q 19 3Q 19 4Q 19 1Q 20 2Q 20 3Q 20 4Q 20 1Q 21 2Q 21 3Q 21 4Q 21 1Q 22 2Q 22 3Q 22 4Q 22 CET1% ACL / RWA ▪ Loss-absorbing capital remains strong relative to our risk profile ▪ Very low credit losses relative to the common equity tier 1 capital plus the allowance for credit losses

Financial Outlook (FY 2023E vs FY 2022A), as of January 23, 2023 17 Outlook Comments Moderately Increasing Increasing ▪ We expect full year 2023 NII to increase at a rate in the high single digits relative to FY22 ▪ We expect 4Q23 NII to increase slightly relative to 4Q22, assuming a cumulative cycle-to-date deposit beta in the mid- to high-teens Moderately Increasing ▪ Customer-related noninterest income excludes securities gains/losses Moderately Increasing ▪ Subject to normal seasonality Moderately Increasing ▪ Capital ratios are expected to increase by YE23, although some capital may be returned to shareholders through share repurchases Customer-Related Noninterest Income Loan Balances (period-end) Net Interest Income (NII) CET1 Regulatory Capital Ratio Adjusted Noninterest Expense
▪ Financial Results Summary ▪ Credit Metrics ▪ Loan Loss Severity (NCOs as a percentage of nonaccrual loans) ▪ Balance Sheet Profitability ▪ Earning Asset Repricing ▪ Interest Rate Swaps ▪ Deposit Cost Advantage – 20+ Year Time Series ▪ Loan Growth by Geography and Type ▪ Mortgage Banking ▪ Non-GAAP Financial Measures 18 Appendix
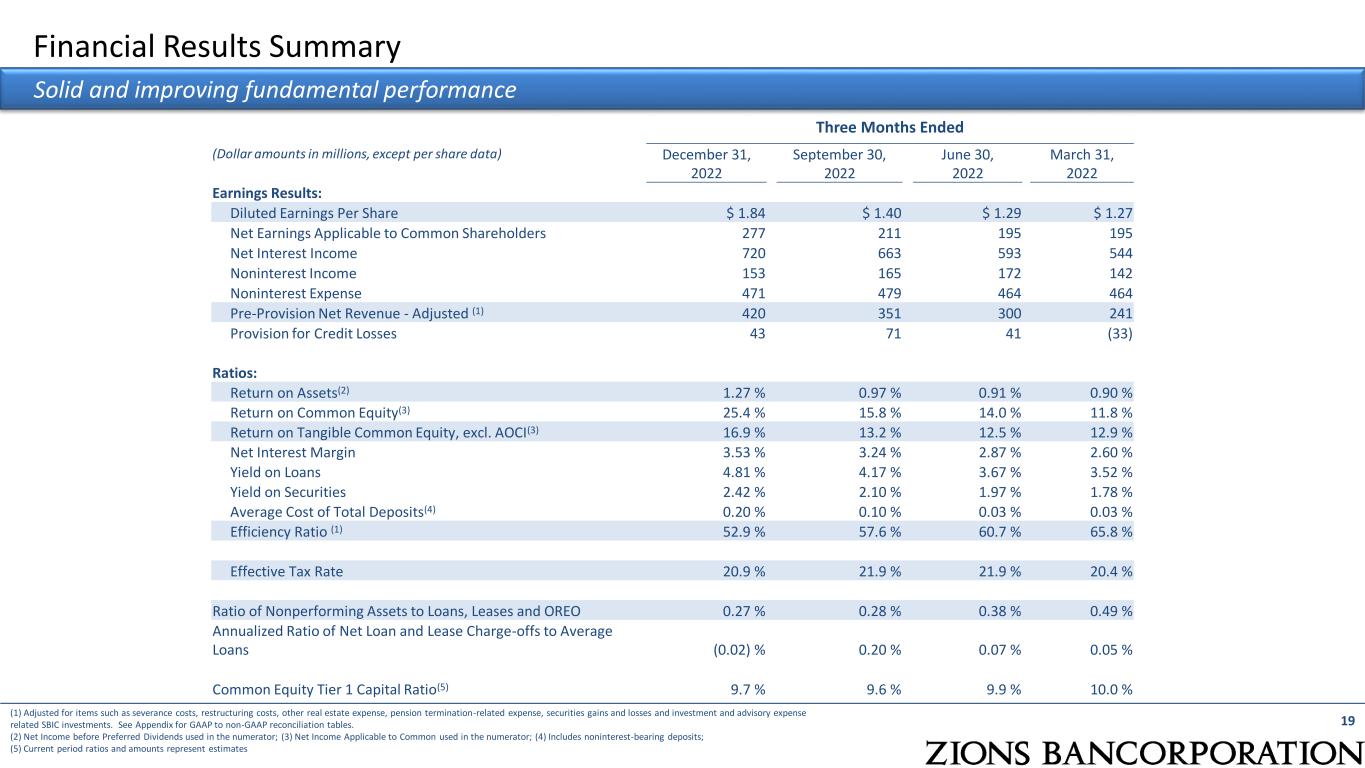
Financial Results Summary 19 Solid and improving fundamental performance Three Months Ended (Dollar amounts in millions, except per share data) December 31, 2022 September 30, 2022 June 30, 2022 March 31, 2022 Earnings Results: Diluted Earnings Per Share $ 1.84 $ 1.40 $ 1.29 $ 1.27 Net Earnings Applicable to Common Shareholders 277 211 195 195 Net Interest Income 720 663 593 544 Noninterest Income 153 165 172 142 Noninterest Expense 471 479 464 464 Pre-Provision Net Revenue - Adjusted (1) 420 351 300 241 Provision for Credit Losses 43 71 41 (33) Ratios: Return on Assets(2) 1.27 % 0.97 % 0.91 % 0.90 % Return on Common Equity(3) 25.4 % 15.8 % 14.0 % 11.8 % Return on Tangible Common Equity, excl. AOCI(3) 16.9 % 13.2 % 12.5 % 12.9 % Net Interest Margin 3.53 % 3.24 % 2.87 % 2.60 % Yield on Loans 4.81 % 4.17 % 3.67 % 3.52 % Yield on Securities 2.42 % 2.10 % 1.97 % 1.78 % Average Cost of Total Deposits(4) 0.20 % 0.10 % 0.03 % 0.03 % Efficiency Ratio (1) 52.9 % 57.6 % 60.7 % 65.8 % Effective Tax Rate 20.9 % 21.9 % 21.9 % 20.4 % Ratio of Nonperforming Assets to Loans, Leases and OREO 0.27 % 0.28 % 0.38 % 0.49 % Annualized Ratio of Net Loan and Lease Charge-offs to Average Loans (0.02) % 0.20 % 0.07 % 0.05 % Common Equity Tier 1 Capital Ratio(5) 9.7 % 9.6 % 9.9 % 10.0 % (1) Adjusted for items such as severance costs, restructuring costs, other real estate expense, pension termination-related expense, securities gains and losses and investment and advisory expense related SBIC investments. See Appendix for GAAP to non-GAAP reconciliation tables. (2) Net Income before Preferred Dividends used in the numerator; (3) Net Income Applicable to Common used in the numerator; (4) Includes noninterest-bearing deposits; (5) Current period ratios and amounts represent estimates
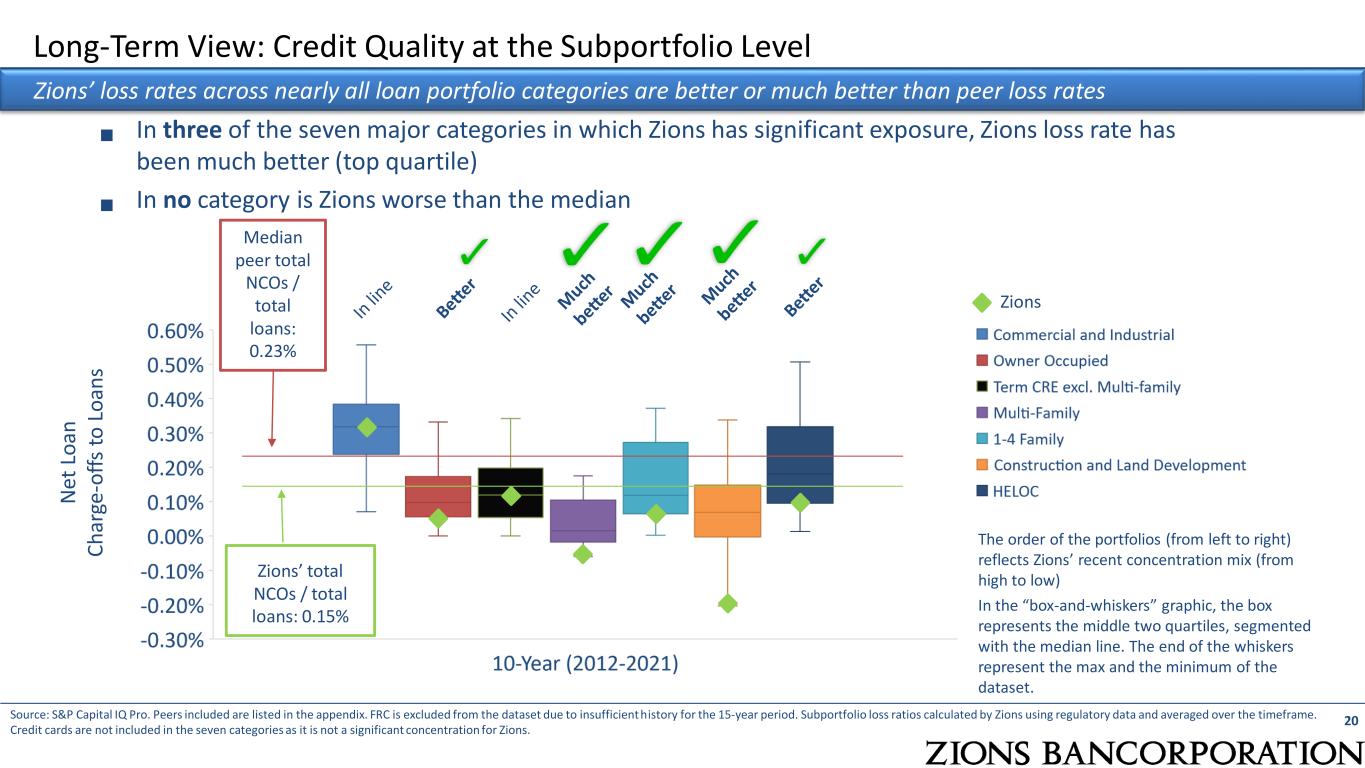
Long-Term View: Credit Quality at the Subportfolio Level 20 Zions’ loss rates across nearly all loan portfolio categories are better or much better than peer loss rates ▪ In three of the seven major categories in which Zions has significant exposure, Zions loss rate has been much better (top quartile) ▪ In no category is Zions worse than the median The order of the portfolios (from left to right) reflects Zions’ recent concentration mix (from high to low) Source: S&P Capital IQ Pro. Peers included are listed in the appendix. FRC is excluded from the dataset due to insufficient history for the 15-year period. Subportfolio loss ratios calculated by Zions using regulatory data and averaged over the timeframe. Credit cards are not included in the seven categories as it is not a significant concentration for Zions. Zions In the “box-and-whiskers” graphic, the box represents the middle two quartiles, segmented with the median line. The end of the whiskers represent the max and the minimum of the dataset. N et L o an C h ar ge -o ff s to L o an s Median peer total NCOs / total loans: 0.23% Zions’ total NCOs / total loans: 0.15%

Credit Quality: Consumer Real Estate Secured (Term 1-4 Family and Home Equity Credit Lines) 21 Minimal risk layering shows strength of the consumer real estate loan portfolio. Term 1-4 family mortgages (“1-4 family residential”) account for approximately $10.7 billion of the outstanding balances or 19% of the total loan portfolio ▪ 67 percent of such loans have FICO scores of 750 or better (higher) and loan-to-value (“LTV”) ratios of 70% or better (lower) ▪ No meaningful exposure in the low FICO and high LTV segments ▪ Average LTV: 47% ▪ Home equity credit line portfolio: ▪ 1st lien = 44% of portfolio balance, 50% of portfolio commitments, with an average LTV of 45% ▪ 2nd lien = 56% of portfolio balance, 50% of portfolio commitments, with an average LTV of 51% Loan-to-value calculations reflect most current appraisal adjusted by a home price index (Case-Shiller or FHFA) for the area where the collateral is located for the denominator and the most recent outstanding balances in the numerator. 1st Lien balances associated with Jr. Lien HECLs are updated using Experian data we receive. Due to rounding, some of the percentages may not add up to 100%. Data is as of 12/31/2022. <= 649 650-699 700-749 750-799 800-850 Row Total <= 50% 2% 3% 8% 15% 28% 56% 50.01-60% 0% 1% 3% 5% 9% 18% 60.01-70% 0% 1% 2% 5% 6% 14% 70.01-80% 0% 1% 2% 4% 4% 11% 80.01-90% 0% 0% 0% 0% 0% 1% >90% 0% 0% 0% 0% 0% 0% Column Total 2% 6% 16% 30% 47% 100% Term 1-4 Family (Mortgage) + HECL Refresh FICO C o m b in e d L o an t o V al u e ( In d e x- A d ju st e d )
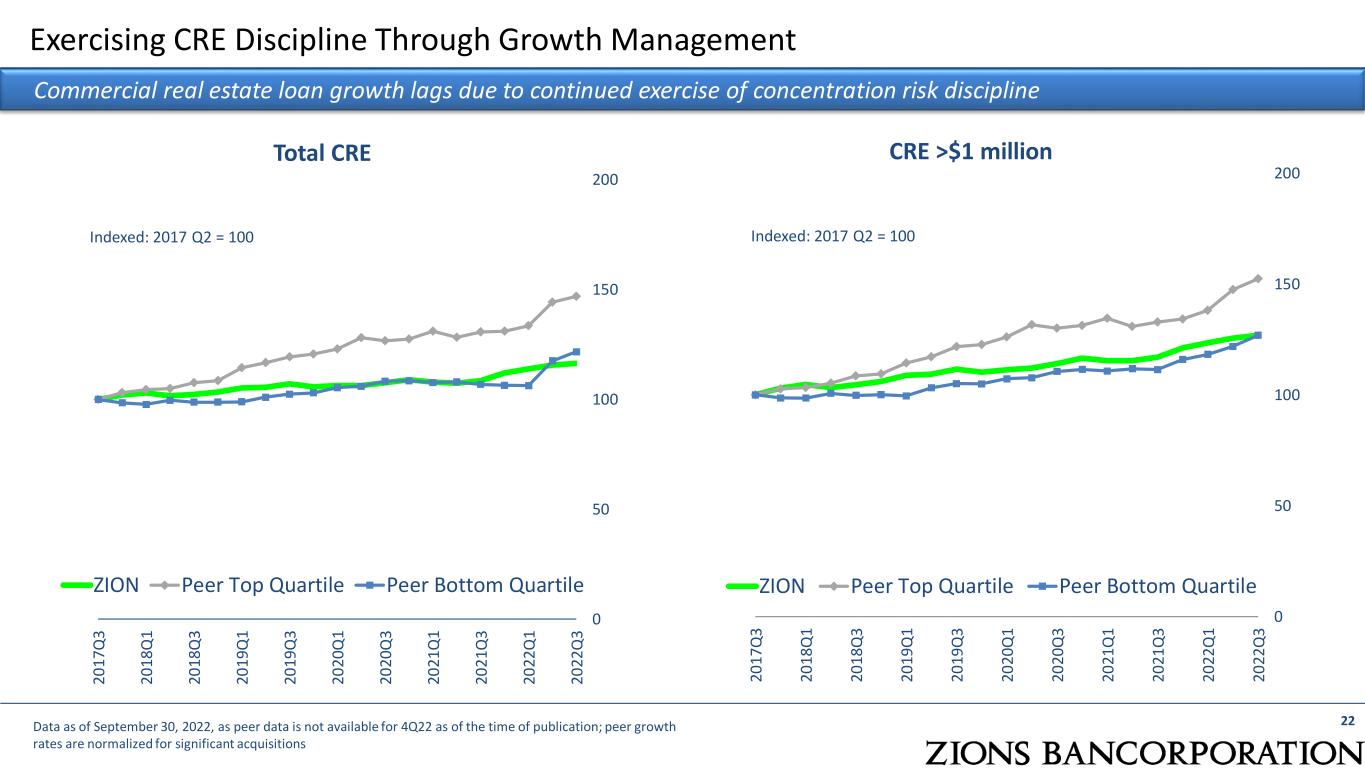
22 0 50 100 150 200 20 17 Q 3 20 18 Q 1 20 18 Q 3 20 19 Q 1 20 19 Q 3 20 20 Q 1 20 20 Q 3 20 21 Q 1 20 21 Q 3 20 22 Q 1 20 22 Q 3 ZION Peer Top Quartile Peer Bottom Quartile CRE >$1 million Exercising CRE Discipline Through Growth Management Commercial real estate loan growth lags due to continued exercise of concentration risk discipline 0 50 100 150 200 20 17 Q 3 20 18 Q 1 20 18 Q 3 20 19 Q 1 20 19 Q 3 20 20 Q 1 20 20 Q 3 20 21 Q 1 20 21 Q 3 20 22 Q 1 20 22 Q 3 ZION Peer Top Quartile Peer Bottom Quartile Total CRE Data as of September 30, 2022, as peer data is not available for 4Q22 as of the time of publication; peer growth rates are normalized for significant acquisitions Indexed: 2017 Q2 = 100 Indexed: 2017 Q2 = 100

Credit Quality: Term Commercial Real Estate (“CRE”) 23 Low loan-to-values ratios in the Term CRE portfolio demonstrates the ability of the portfolio to withstand stress Weighted Average LTV by Major Property Type – Term Loans Apartments (Multi-Family) 57% Hospitality 50% Industrial (Warehouse / Light MG./ R&D) 56% Office Building 56% Retail 51% Term CRE loans account for $10.2 billion of the outstanding balances; 18% of the total loan portfolio Data is limited to term CRE loans and updated through 4Q 2022. Loan-to-value calculations reflect most current appraisal in the denominator and the outstanding balance in the numerator. 24% 29% 34% 11% 2% 0% 0% 0% 5% 10% 15% 20% 25% 30% 35% 40% <45% 45-55% 55-65% 65-75% 75-85% 85-95% >95% Distribution of Term Commercial Real Estate LTV Ratios
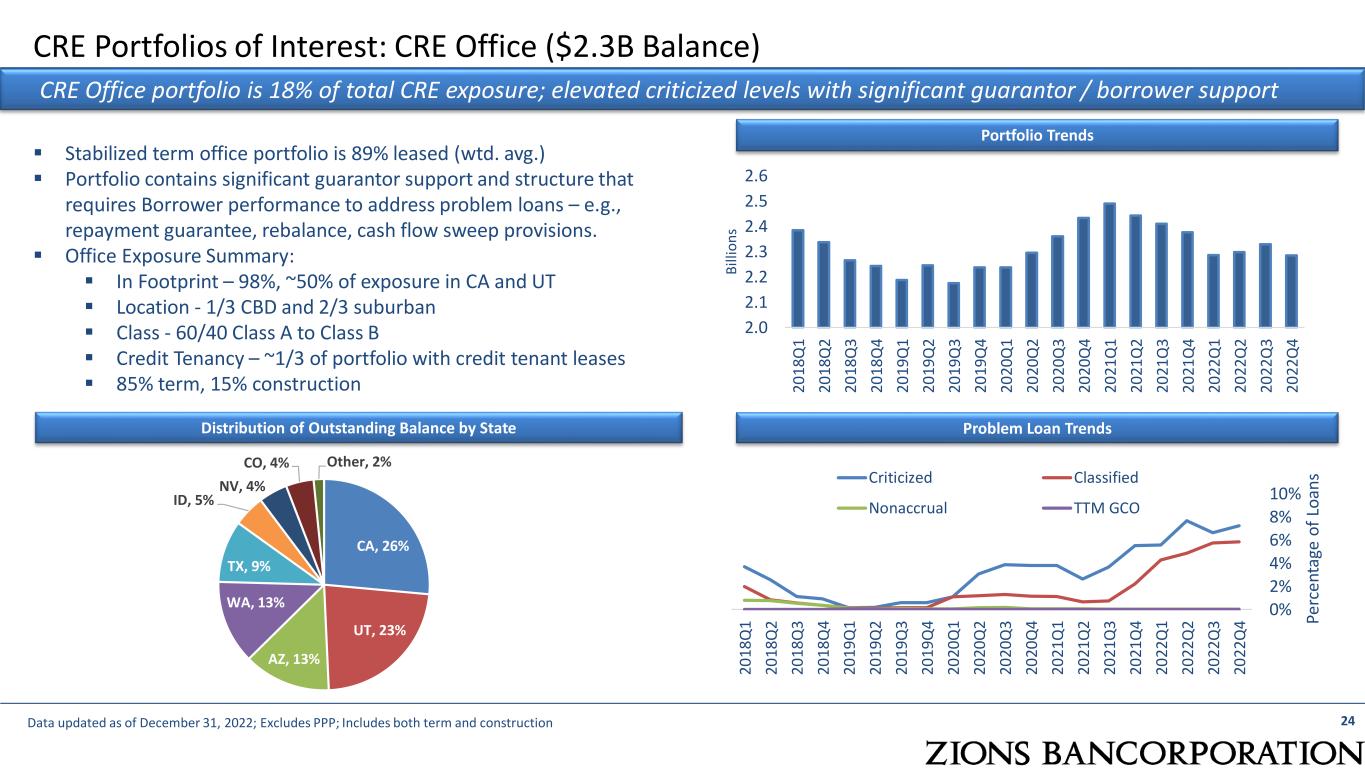
CRE Portfolios of Interest: CRE Office ($2.3B Balance) 24Data updated as of December 31, 2022; Excludes PPP; Includes both term and construction Portfolio Trends Distribution of Outstanding Balance by State Problem Loan Trends CRE Office portfolio is 18% of total CRE exposure; elevated criticized levels with significant guarantor / borrower support ▪ Stabilized term office portfolio is 89% leased (wtd. avg.) ▪ Portfolio contains significant guarantor support and structure that requires Borrower performance to address problem loans – e.g., repayment guarantee, rebalance, cash flow sweep provisions. ▪ Office Exposure Summary: ▪ In Footprint – 98%, ~50% of exposure in CA and UT ▪ Location - 1/3 CBD and 2/3 suburban ▪ Class - 60/40 Class A to Class B ▪ Credit Tenancy – ~1/3 of portfolio with credit tenant leases ▪ 85% term, 15% construction Pe rc e nt ag e o f Lo an s CA, 26% UT, 23% AZ, 13% WA, 13% TX, 9% ID, 5% NV, 4% CO, 4% Other, 2% 0% 2% 4% 6% 8% 10% 20 18 Q 1 20 18 Q 2 20 18 Q 3 20 18 Q 4 20 19 Q 1 20 19 Q 2 20 19 Q 3 20 19 Q 4 20 20 Q 1 20 20 Q 2 20 20 Q 3 20 20 Q 4 20 21 Q 1 20 21 Q 2 20 21 Q 3 20 21 Q 4 20 22 Q 1 20 22 Q 2 20 22 Q 3 20 22 Q 4 Criticized Classified Nonaccrual TTM GCO 2.0 2.1 2.2 2.3 2.4 2.5 2.6 20 18 Q 1 20 18 Q 2 20 18 Q 3 20 18 Q 4 20 19 Q 1 20 19 Q 2 20 19 Q 3 20 19 Q 4 20 20 Q 1 20 20 Q 2 20 20 Q 3 20 20 Q 4 20 21 Q 1 20 21 Q 2 20 21 Q 3 20 21 Q 4 20 22 Q 1 20 22 Q 2 20 22 Q 3 20 22 Q 4 B ill io n s

6% 22 % 25 % 27 % 31 % 35 % 35 % 36 % 39 % 4 4 % 44 % 45 % 55 % 55 % 57 % 58 % 60 % 65 % 74 % FR C B O K F M TB ZI O N A SB W A L FH N C M A C FG FN B W TF C P N FP K EY R F SN V EW B C H W C H B A N FI TB 3% 11 % 12 % 14 % 15 % 22 % 29 % 29 % 32 % 33 % 42 % 4 4 % 46 % 47 % 54 % 55 % 59 % 63 % 64 % FR C ZI O N W A L FH N M TB B O K F W T FC A SB C M A EW B C FN B P N FP K EY C FG R F H B A N FI TB SN V H W C Loan Loss Severity Annualized NCOs / Nonaccrual Loans Five Year Average (2017 – 2021) Annualized NCOs / Nonaccrual Loans Fifteen Year Average (2007 – 2021) 25Source: S&P Global. Calculated using the average of annualized quarterly results. Note: Survivorship bias: some banks that may have been included in Zions’ peer group have been excluded due to their failed or merged status. When problems arise, Zions generally experiences less severe loan losses due to strong collateral and underwriting practices
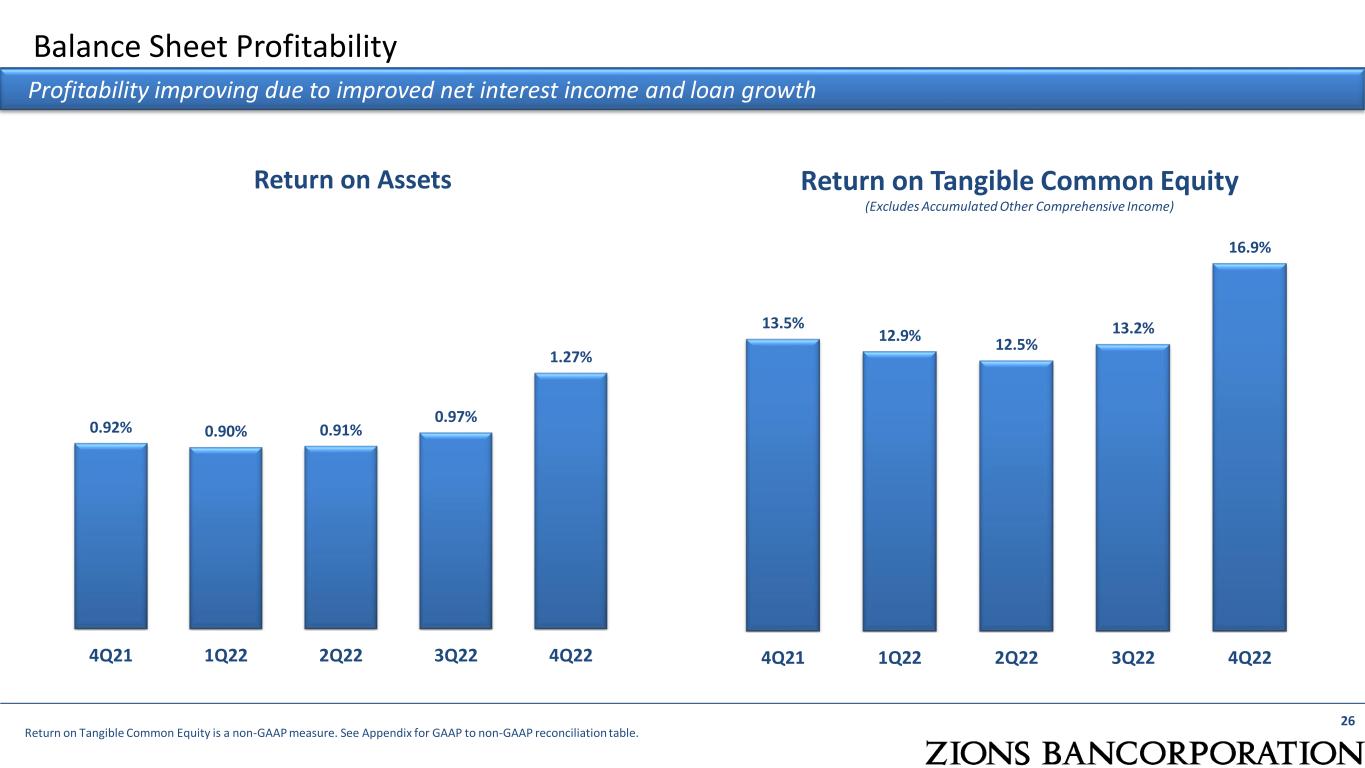
0.92% 0.90% 0.91% 0.97% 1.27% 4Q21 1Q22 2Q22 3Q22 4Q22 13.5% 12.9% 12.5% 13.2% 16.9% 4Q21 1Q22 2Q22 3Q22 4Q22 Balance Sheet Profitability 26 Profitability improving due to improved net interest income and loan growth Return on Assets Return on Tangible Common Equity (Excludes Accumulated Other Comprehensive Income) Return on Tangible Common Equity is a non-GAAP measure. See Appendix for GAAP to non-GAAP reconciliation table.

Simulated Repricing Expectations: Earning Assets and Loans 27Source: Company filings and S&P Global; “Prior Fed Cycle” refers to 3Q15-2Q19, reflecting the lag effect of deposit pricing relative to Fed Funds rates. The “Current Fed Cycle” begins in 3Q19 to present. (1) 12-month simulated impact of an instantaneous and parallel change in interest rates. Loans are assumed to experience prepayments, amortization and maturity events, in addition to interest rate resets in chart on the right. The loan and securities portfolios have durations of 2.0 and 3.9 years, respectively. 53 % 10 % 8% 6% 9% 14 % 40 % 12 % 12 % 9% 13 % 14 % ≤ 3m 4-12m 1-2 yrs 2-3 yrs 3-5 yrs > 5 yrs P er ce n t o f Lo an s Loans: Rate Reset and Cash Flow Profile Loans After Hedging 40% 11% 9% 7% 11% 22% 31% 12% 12% 9% 14% 22% ≤ 3m 4-12m 1-2 yrs 2-3 yrs 3-5 yrs > 5 yrs Pe rc en t o f Ea rn in g A ss et s Earning Assets Rate Reset and Cash Flow Profile Earning Assets After Hedging
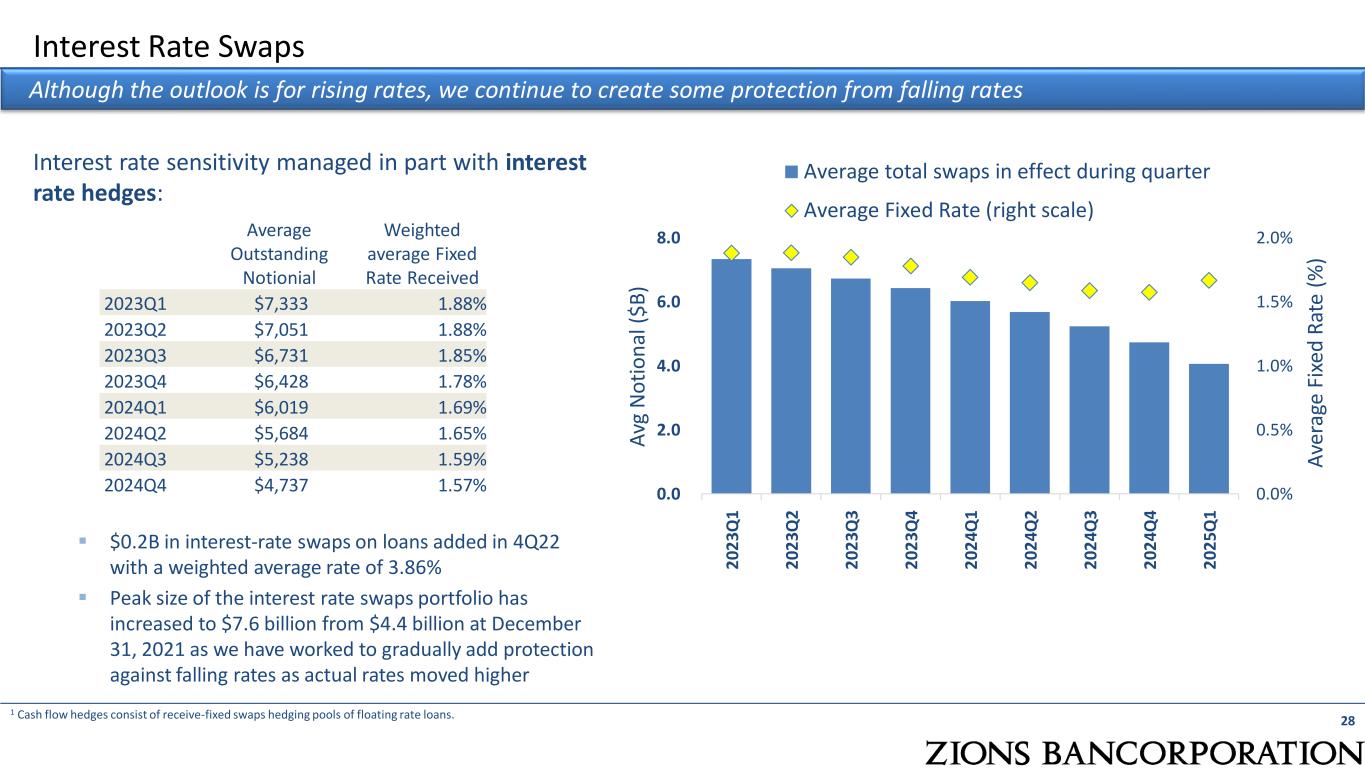
Interest Rate Swaps 28 Although the outlook is for rising rates, we continue to create some protection from falling rates 1 Cash flow hedges consist of receive-fixed swaps hedging pools of floating rate loans. Interest rate sensitivity managed in part with interest rate hedges: ▪ $0.2B in interest-rate swaps on loans added in 4Q22 with a weighted average rate of 3.86% ▪ Peak size of the interest rate swaps portfolio has increased to $7.6 billion from $4.4 billion at December 31, 2021 as we have worked to gradually add protection against falling rates as actual rates moved higher 0.0% 0.5% 1.0% 1.5% 2.0% 0.0 2.0 4.0 6.0 8.0 2 02 3Q 1 2 02 3Q 2 2 02 3Q 3 2 02 3Q 4 2 02 4Q 1 2 02 4Q 2 2 02 4Q 3 2 02 4Q 4 2 02 5Q 1 A ve ra ge F ix ed R at e (% ) A vg N o ti o n al ( $ B ) Average total swaps in effect during quarter Average Fixed Rate (right scale) Average Outstanding Notionial Weighted average Fixed Rate Received 2023Q1 $7,333 1.88% 2023Q2 $7,051 1.88% 2023Q3 $6,731 1.85% 2023Q4 $6,428 1.78% 2024Q1 $6,019 1.69% 2024Q2 $5,684 1.65% 2024Q3 $5,238 1.59% 2024Q4 $4,737 1.57%

Deposits – Noninterest Bearing (“NIB”) Mix and Cost of Total Deposits 29 Through multiple rate cycles, Zions’ NIB deposit concentration and cost have been consistently among the best of peers Source: S&P Global. The federal funds rate shown on this page has been adjusted such that, for example, the 2007 peak rate of 5.25% is the daily average rate from July 1, 2006 to June 30, 2007, which attempts to reflect the delay between the Fed’s increase or decrease and the response by Zions and the banking industry to increase or decrease rates paid on deposits. Average Noninterest Deposits / Average Total Deposits 0.00 1.00 2.00 3.00 4.00 5.00 6.00 7.00 2 0 0 0 2 0 0 1 2 0 0 2 2 0 0 3 2 0 0 4 2 0 0 5 2 0 0 6 2 0 0 7 2 0 0 8 2 0 0 9 2 0 1 0 2 0 1 1 2 0 1 2 2 0 1 3 2 0 1 4 2 0 1 5 2 0 1 6 2 0 1 7 2 0 1 8 2 0 1 9 2 0 2 0 2 0 2 1 3 Q 22 ZION Peer Top Quartile Peer Bottom Quartile Avg Fed Funds (6-Mo Lag) Zions ranked 2nd Average Cost of Total Deposits % Under higher interest rate environments (FF>3%), Zions’ cost of deposits has averaged ~40 bps better than the peer median. (0.75) (0.50) (0.25) 0.00 Zions vs. Peer Median G re en b a r = Zi o n s’ c o st o f d ep o si ts is le ss th a n p ee r m ed ia n ; R ed b a r = Zi o n s’ c o st o f d ep o si ts is g re a te r t h a n th e p ee r m ed ia n 0% 1% 2% 3% 4% 5% 6% 7% 0% 10% 20% 30% 40% 50% 60% 2 00 0 2 00 1 2 00 2 2 00 3 2 00 4 2 00 5 2 00 6 2 00 7 2 00 8 2 00 9 2 01 0 2 01 1 2 01 2 2 01 3 2 01 4 2 01 5 2 01 6 2 01 7 2 01 8 2 01 9 2 02 0 2 02 1 3 Q 2 2 ZION Peer Top Quartile Peer Bottom Quartile Avg Fed Funds (6-Mo Lag) Zions ranked 2nd (Lt. Axis)

Loan Growth in Detail Strong loan growth achieved in several categories: C&I (ex-O&G), residential real estate, & term Commercial Real Estate Linked Quarter Loan Balance Growth, Excluding PPP Total Loans, excluding PPP: +3.4% Linked quarter: ▪ Excluding PPP loans, period-end loans increased $1.8 billion or 3.4% ▪ Loan growth in dollars predominantly in C&I (ex-O&G), 1-4 Family, Term Commercial Real Estate ▪ Decline of 36% ($109 million) in SBA PPP loans G ro w th R at e : L in ke d Q u ar te r, n o t an n u al iz e d Dollar Growth: Linked Quarter 30 C&I (ex-Oil & Gas), 3% Owner occupied, 1% CRE Term, 7% Home Equity, 1% 1-4 Family, 6% Energy (Oil & Gas), 4% Municipal, 3% -6% -4% -2% 0% 2% 4% 6% 8% 10% -$300 -$100 $100 $300 $500 $700 $900 Note: circle size indicates relative proportion of loan portfolio as of 4Q22. PPP loans, not shown on graph, declined 36% in 4Q22 vs. 3Q22 ($ millions) Other loans (including Consumer Construction), not shown on graph, grew 12% in 4Q22 vs. 3Q22
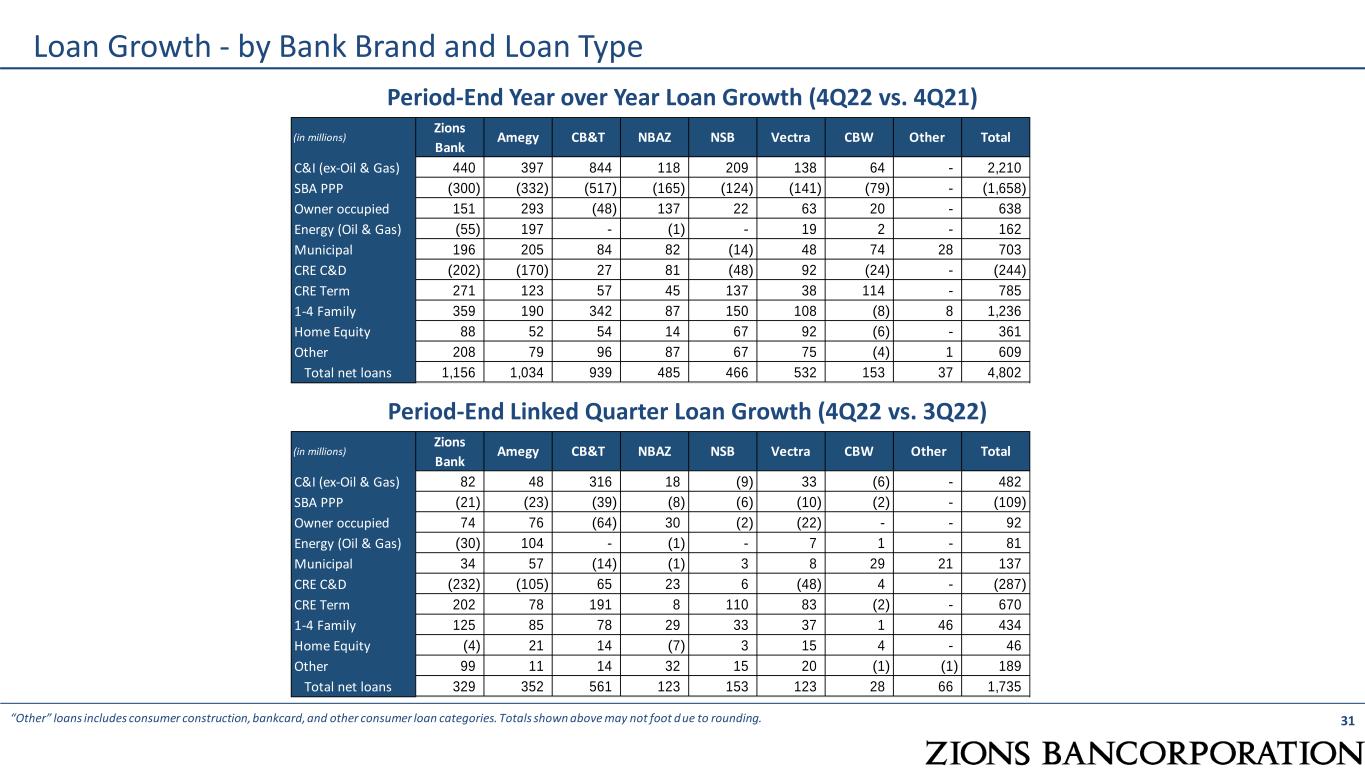
31 Loan Growth - by Bank Brand and Loan Type “Other” loans includes consumer construction, bankcard, and other consumer loan categories. Totals shown above may not foot due to rounding. Period-End Year over Year Loan Growth (4Q22 vs. 4Q21) Period-End Linked Quarter Loan Growth (4Q22 vs. 3Q22) (in millions) Zions Bank Amegy CB&T NBAZ NSB Vectra CBW Other Total C&I (ex-Oil & Gas) 440 397 844 118 209 138 64 - 2,210 SBA PPP (300) (332) (517) (165) (124) (141) (79) - (1,658) Owner occupied 151 293 (48) 137 22 63 20 - 638 Energy (Oil & Gas) (55) 197 - (1) - 19 2 - 162 Municipal 196 205 84 82 (14) 48 74 28 703 CRE C&D (202) (170) 27 81 (48) 92 (24) - (244) CRE Term 271 123 57 45 137 38 114 - 785 1-4 Family 359 190 342 87 150 108 (8) 8 1,236 Home Equity 88 52 54 14 67 92 (6) - 361 Other 208 79 96 87 67 75 (4) 1 609 Total net loans 1,156 1,034 939 485 466 532 153 37 4,802 (in millions) Zions Bank Amegy CB&T NBAZ NSB Vectra CBW Other Total C&I (ex-Oil & Gas) 82 48 316 18 (9) 33 (6) - 482 SBA PPP (21) (23) (39) (8) (6) (10) (2) - (109) Owner occupied 74 76 (64) 30 (2) (22) - - 92 Energy (Oil & Gas) (30) 104 - (1) - 7 1 - 81 Municipal 34 57 (14) (1) 3 8 29 21 137 CRE C&D (232) (105) 65 23 6 (48) 4 - (287) CRE Term 202 78 191 8 110 83 (2) - 670 1-4 Family 125 85 78 29 33 37 1 46 434 Home Equity (4) 21 14 (7) 3 15 4 - 46 Other 99 11 14 32 15 20 (1) (1) 189 Total net loans 329 352 561 123 153 123 28 66 1,735

2022 ▪ Funded $4.5B in 2022 (13% over 2021) with $0.8B in Q4 ▪ Production has returned to portfolio ARM production (88% in 2022) ▪ Production has slowed but remains above pre-pandemic levels ▪ Portfolio has grown to pre-pandemic levels ▪ Successfully launched numerous process enhancements including ▪ Refinement to the Affluent program launched late in 2021 ▪ Digital enhancements to our Consumer Construction process reducing turn-times and improving efficiency 32 Mortgage Banking Record originations, in contrast to industry decline, in 2022 have led to strong portfolio growth ($ millions) 2019 ▪ Roll-out 2021 ▪ Enhanced Digital Fulfillment Process ▪ 33% reduction in turn-time vs. 2019, allowing for record unit production 2020 ▪ Record production driven by refinance volumes ▪ Record Fee income contribution ($ millions)
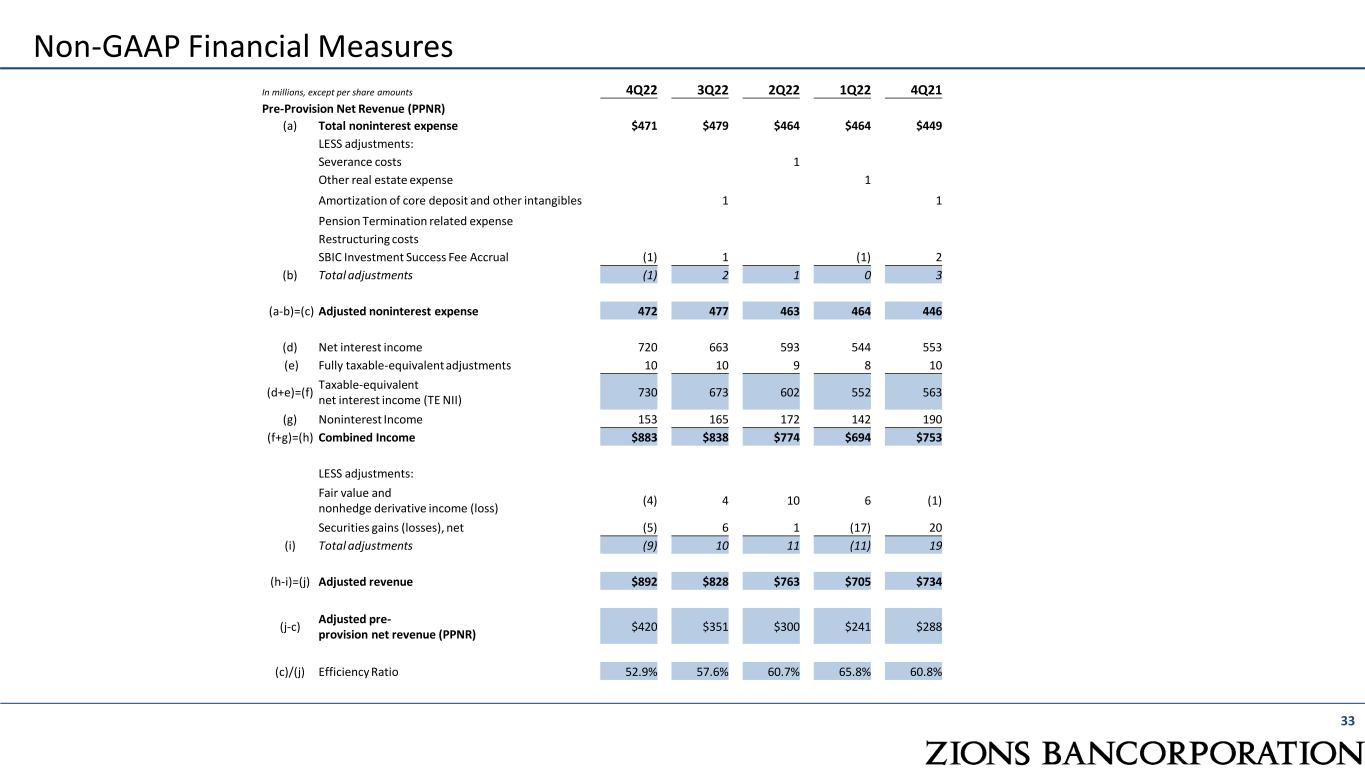
33 Non-GAAP Financial Measures In millions, except per share amounts 4Q22 3Q22 2Q22 1Q22 4Q21 Pre-Provision Net Revenue (PPNR) (a) Total noninterest expense $471 $479 $464 $464 $449 LESS adjustments: Severance costs 1 Other real estate expense 1 Amortization of core deposit and other intangibles 1 1 Pension Termination related expense Restructuring costs SBIC Investment Success Fee Accrual (1) 1 (1) 2 (b) Total adjustments (1) 2 1 0 3 (a-b)=(c) Adjusted noninterest expense 472 477 463 464 446 (d) Net interest income 720 663 593 544 553 (e) Fully taxable-equivalent adjustments 10 10 9 8 10 (d+e)=(f) Taxable-equivalent net interest income (TE NII) 730 673 602 552 563 (g) Noninterest Income 153 165 172 142 190 (f+g)=(h) Combined Income $883 $838 $774 $694 $753 LESS adjustments: Fair value and nonhedge derivative income (loss) (4) 4 10 6 (1) Securities gains (losses), net (5) 6 1 (17) 20 (i) Total adjustments (9) 10 11 (11) 19 (h-i)=(j) Adjusted revenue $892 $828 $763 $705 $734 (j-c) Adjusted pre- provision net revenue (PPNR) $420 $351 $300 $241 $288 (c)/(j) Efficiency Ratio 52.9% 57.6% 60.7% 65.8% 60.8%

34 Non-GAAP Financial Measures (Continued) In millions, except per share amounts 4Q22 3Q22 2Q22 1Q22 4Q21 Net Earnings Applicable to Common Shareholders (NEAC) Net earnings applicable to common $277 $211 $195 $195 $207 Diluted Shares (average) 149 150 151 152 154 (k) Diluted EPS 1.84 1.40 1.29 1.27 1.34 PLUS Adjustments: Adjustments to noninterest expense (1) 2 1 0 3 Adjustments to revenue 9 (10) (11) 11 (19) Tax effect for adjustments (2) 2 2 (3) 4 Preferred stock redemption Total adjustments 6 (6) (8) 8 (12) (l) Adjustments per share 0.04 (0.04) (0.05) 0.05 (0.08) (k+l)=(m) Adjusted EPS 1.88 1.36 1.24 1.32 1.26 Balance Sheet Profitability Adjusted Return on Assets 1.29% 0.92% 0.84% 0.94% 0.87% Adjusted Return on Tangible Common Equity, excl. AOCI 17.3% 12.8% 12.0% 13.5% 12.6%


