
April 19, 2023 First Quarter 2023 Financial Review

2 Forward-Looking Statements; Use of Non-GAAP Financial Measures Forward Looking Information This earnings presentation includes “forward-looking statements” as that term is defined in the Private Securities Litigation Reform Act of 1995. These statements, often accompanied by words such as “may,” “might,” “could,” “anticipate,” “expect,” and similar terms, are based on management’s current expectations and assumptions regarding future events or determinations, all of which are subject to known and unknown risks and uncertainties. Forward-looking statements are not guarantees, nor should they be relied upon as representing management’s views as of any subsequent date. Actual results and outcomes may differ materially from those presented. Although this list is not comprehensive, important factors that may cause material differences include the quality and composition of our loan and securities portfolios and the quality and composition of our deposits; changes in general industry, political and economic conditions, including continued high inflation, economic slowdown or recession, or other economic disruptions; changes in interest and reference rates which could adversely affect our revenue and expenses, the value of assets and obligations, and the availability and cost of capital and liquidity; deterioration in economic conditions that may result in increased loan and leases losses; securities and capital markets behavior, including volatility and changes in market liquidity and our ability to raise capital; the impact of bank failures or adverse developments at other banks on general investor sentiment regarding the stability and liquidity of banks; the possibility that our recorded goodwill could become impaired, which may have an adverse impact on our earnings and capital; our ability to recruit and retain talent, including increased competition for qualified candidates as a result of expanded remote-work opportunities and increased compensation expenses; competitive pressures and other factors that may affect aspects of our business, such as pricing and demand for our products and services; our ability to complete projects and initiatives and execute on our strategic plans, manage our risks, and achieve our business objectives; our ability to provide adequate oversight of our suppliers or prevent inadequate performance by third parties upon whom we rely for the delivery of various products and services; our ability to develop and maintain technology, information security systems and controls designed to guard against fraud, cybersecurity, and privacy risks; changes and uncertainties in applicable laws, and fiscal, monetary, regulatory, trade, and tax policies, and actions taken by governments, agencies, central banks and similar organizations; adverse media and other expressions of negative public opinion whether directed at us, other banks, the banking industry generally or otherwise that may adversely affect our reputation and that of the banking industry generally; the effects of pandemics and other health emergencies, including the lingering effects of the COVID-19 pandemic that may affect our business, employees, customers, and communities, such as ongoing effects on availability and cost of labor; the effects of wars and geopolitical conflicts, and other local, national, or international disasters, crises, or conflicts that may occur in the future; natural disasters that may impact our and our customer's operations and business; and governmental and social responses to environmental, social, and governance issues, including those with respect to climate change. Factors that could cause our actual results, performance or achievements, industry trends, and results or regulatory outcomes to differ materially from those expressed or implied in the forward-looking statements are discussed in our 2022 Form 10-K and subsequent filings with the Securities and Exchange Commission (SEC) and are available on our website (www.zionsbancorporation.com) and from the SEC (www.sec.gov). We caution against the undue reliance on forward-looking statements, which reflect our views only as of the date they are made. Except to the extent required by law, we specifically disclaim any obligation to update any factors or to publicly announce the revisions to any forward-looking statements to reflect future events or developments. Use of Non-GAAP Financial Measures: This document contains several references to non-GAAP measures, including but not limited to, pre-provision net revenue and the “efficiency ratio,” which are common industry terms used by investors and financial services analysts. Certain of these non-GAAP measures are key inputs into Zions’ management compensation and are used in Zions’ strategic goals that have been and may continue to be articulated to investors. Therefore, the use of such non-GAAP measures are believed by management to be of substantial interest to the consumers of these financial disclosures and are used prominently throughout the disclosures. A reconciliation of the difference between such measures and GAAP financials is provided within the document, and users of this document are encouraged to carefully review this reconciliation.

Summary of 1Q23 Financial Results Profile of our Deposits Cash & Securities Interest Rate Sensitivity Duration Management CRE Credit Quality, and In-Depth Review of Our Office CRE Portfolio Capital and AOCI Accretion Financial Outlook 3 Agenda Built For Resilience
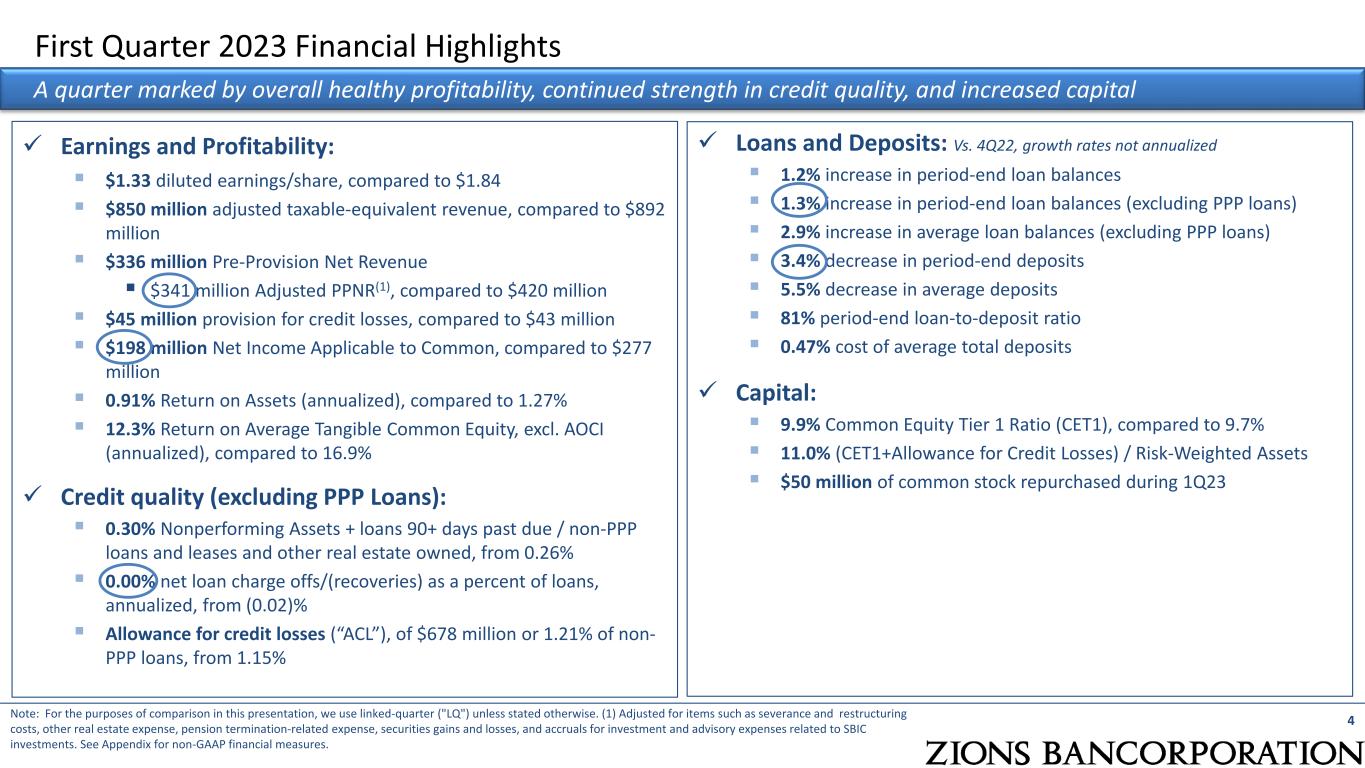
Earnings and Profitability: $1.33 diluted earnings/share, compared to $1.84 $850 million adjusted taxable-equivalent revenue, compared to $892 million $336 million Pre-Provision Net Revenue $341 million Adjusted PPNR(1), compared to $420 million $45 million provision for credit losses, compared to $43 million $198 million Net Income Applicable to Common, compared to $277 million 0.91% Return on Assets (annualized), compared to 1.27% 12.3% Return on Average Tangible Common Equity, excl. AOCI (annualized), compared to 16.9% Credit quality (excluding PPP Loans): 0.30% Nonperforming Assets + loans 90+ days past due / non-PPP loans and leases and other real estate owned, from 0.26% 0.00% net loan charge offs/(recoveries) as a percent of loans, annualized, from (0.02)% Allowance for credit losses (“ACL”), of $678 million or 1.21% of non- PPP loans, from 1.15% 4 First Quarter 2023 Financial Highlights A quarter marked by overall healthy profitability, continued strength in credit quality, and increased capital Note: For the purposes of comparison in this presentation, we use linked-quarter ("LQ") unless stated otherwise. (1) Adjusted for items such as severance and restructuring costs, other real estate expense, pension termination-related expense, securities gains and losses, and accruals for investment and advisory expenses related to SBIC investments. See Appendix for non-GAAP financial measures. Loans and Deposits: Vs. 4Q22, growth rates not annualized 1.2% increase in period-end loan balances 1.3% increase in period-end loan balances (excluding PPP loans) 2.9% increase in average loan balances (excluding PPP loans) 3.4% decrease in period-end deposits 5.5% decrease in average deposits 81% period-end loan-to-deposit ratio 0.47% cost of average total deposits Capital: 9.9% Common Equity Tier 1 Ratio (CET1), compared to 9.7% 11.0% (CET1+Allowance for Credit Losses) / Risk-Weighted Assets $50 million of common stock repurchased during 1Q23

$1.27 $1.29 $1.40 $1.84 $1.33 1Q22 2Q22 3Q22 4Q22 1Q23 Diluted Earnings Per Share Notable Items1: 1Q23: $(0.06) per share negative impact from tax contingency reserve 2Q22: $0.05 per share favorable impact from Credit Valuation Adjustment (CVA) 1Q22: $(0.10) per share adverse mark-to-market impact from Small Business Investment Company (SBIC) investments 5 Positive impact to EPS from interest income offset by elevated funding costs and seasonal noninterest expenses Diluted Earnings per Share (1) Items that were $0.05 per share or more. Note: EPS effects from PPP income and provision for credit loss calculations assume a statutory tax rate of approximately 24.5%. PPP income incorporates interest income less professional service expense related to forgiveness. $0.16 $(0.21) $(0.36) $(0.22) $(0.23) 1Q22 2Q22 3Q22 4Q22 1Q23 EPS Impact of Provision for Credit Losses $0.12 $0.07 $0.03 $0.01 Contribution from PPP income$0.01 Ex PPP income and Notable Items, YoY EPS increased 11%
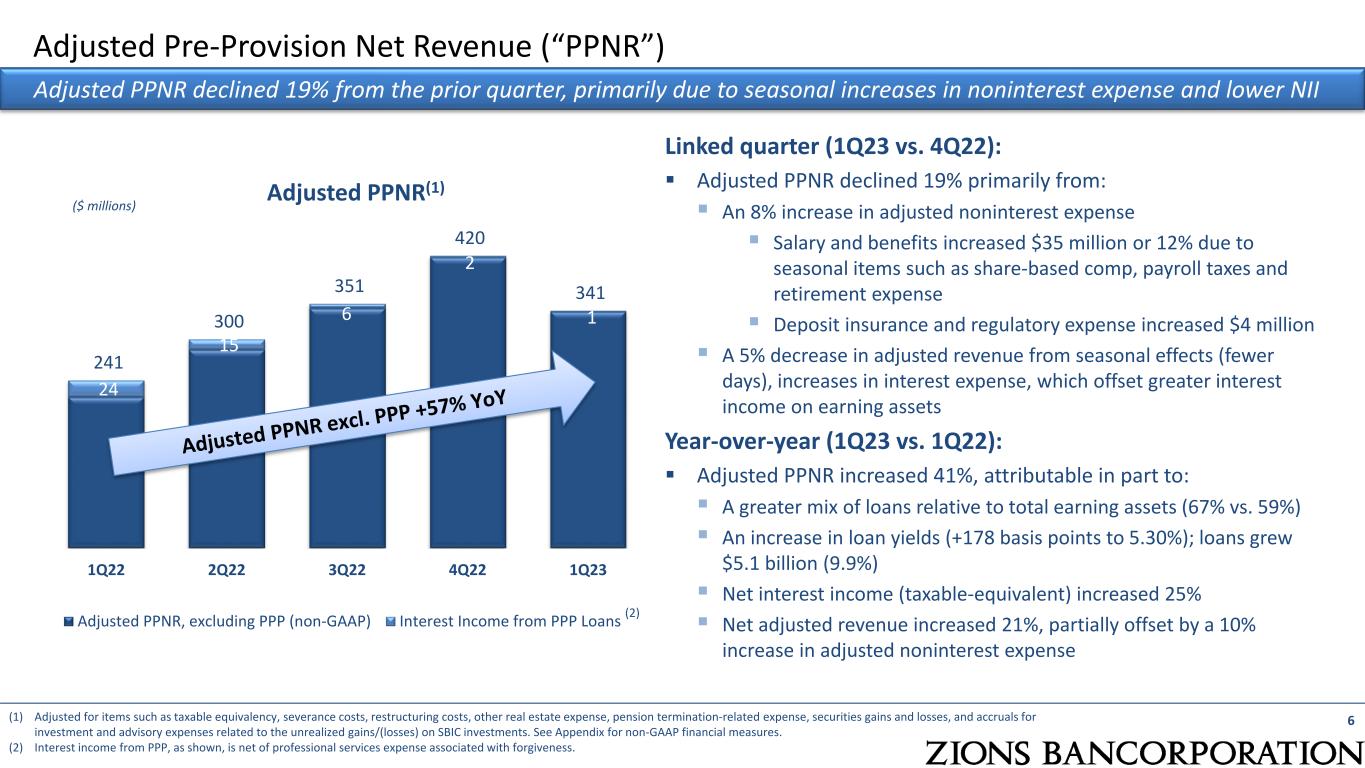
24 15 6 2 1 241 300 351 420 341 1Q22 2Q22 3Q22 4Q22 1Q23 Adjusted PPNR, excluding PPP (non-GAAP) Interest Income from PPP Loans Adjusted Pre-Provision Net Revenue (“PPNR”) Adjusted PPNR declined 19% from the prior quarter, primarily due to seasonal increases in noninterest expense and lower NII (1) Adjusted for items such as taxable equivalency, severance costs, restructuring costs, other real estate expense, pension termination-related expense, securities gains and losses, and accruals for investment and advisory expenses related to the unrealized gains/(losses) on SBIC investments. See Appendix for non-GAAP financial measures. (2) Interest income from PPP, as shown, is net of professional services expense associated with forgiveness. Adjusted PPNR(1) ($ millions) 6 Linked quarter (1Q23 vs. 4Q22): Adjusted PPNR declined 19% primarily from: An 8% increase in adjusted noninterest expense Salary and benefits increased $35 million or 12% due to seasonal items such as share-based comp, payroll taxes and retirement expense Deposit insurance and regulatory expense increased $4 million A 5% decrease in adjusted revenue from seasonal effects (fewer days), increases in interest expense, which offset greater interest income on earning assets Year-over-year (1Q23 vs. 1Q22): Adjusted PPNR increased 41%, attributable in part to: A greater mix of loans relative to total earning assets (67% vs. 59%) An increase in loan yields (+178 basis points to 5.30%); loans grew $5.1 billion (9.9%) Net interest income (taxable-equivalent) increased 25% Net adjusted revenue increased 21%, partially offset by a 10% increase in adjusted noninterest expense (2)
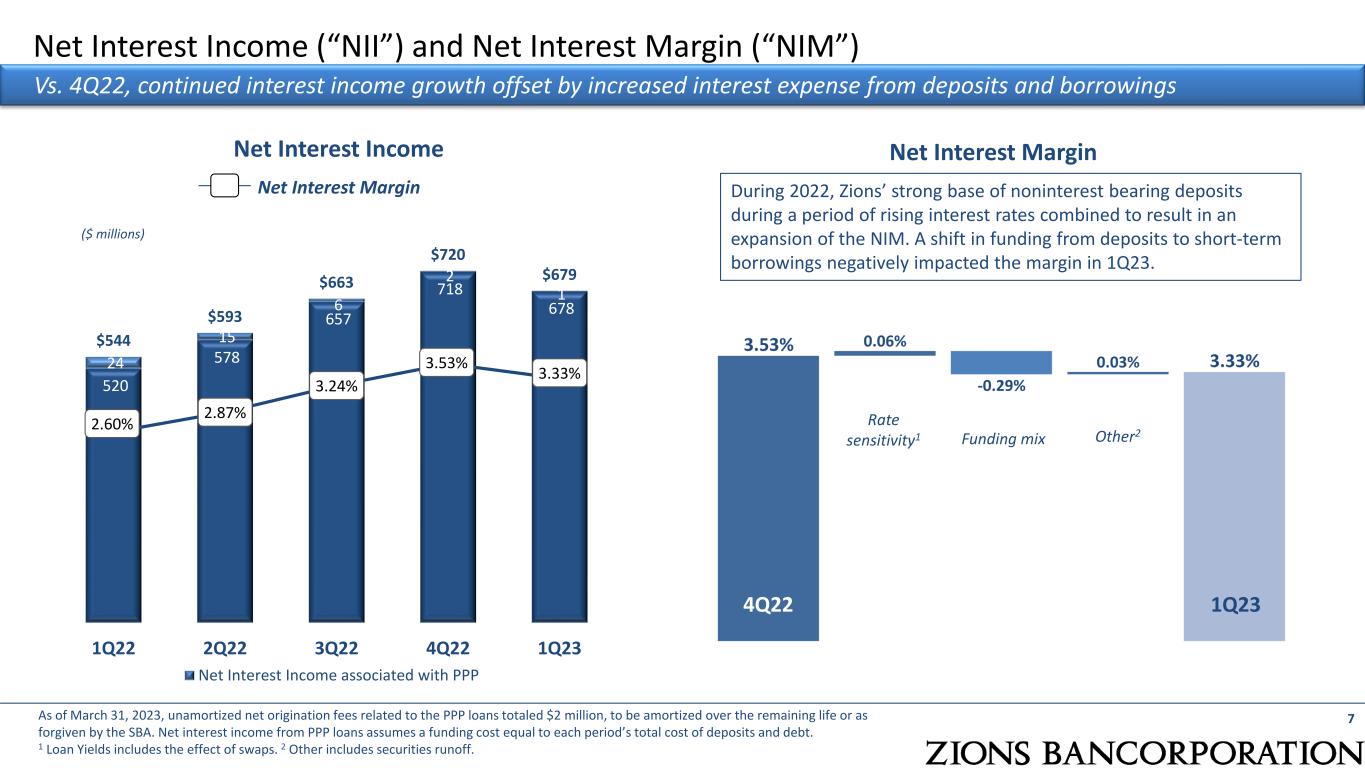
520 578 657 718 678 24 15 6 2 1 $544 $593 $663 $720 $679 2.60% 2.87% 3.24% 3.53% 3.33% 0.00% 1.00% 2.00% 3.00% 4.00% 5.00% $0 1Q22 2Q22 3Q22 4Q22 1Q23 Net Interest Income associated with PPP Net Interest Income (“NII”) and Net Interest Margin (“NIM”) Net Interest Income Net Interest Margin 7 Vs. 4Q22, continued interest income growth offset by increased interest expense from deposits and borrowings ($ millions) Net Interest Margin 4Q22 1Q23 Funding mix Other2 As of March 31, 2023, unamortized net origination fees related to the PPP loans totaled $2 million, to be amortized over the remaining life or as forgiven by the SBA. Net interest income from PPP loans assumes a funding cost equal to each period’s total cost of deposits and debt. 1 Loan Yields includes the effect of swaps. 2 Other includes securities runoff. During 2022, Zions’ strong base of noninterest bearing deposits during a period of rising interest rates combined to result in an expansion of the NIM. A shift in funding from deposits to short-term borrowings negatively impacted the margin in 1Q23. Rate sensitivity1

$151 $154 $156 $153 $151 1Q22 2Q22 3Q22 4Q22 1Q23 Noninterest Income and Revenue 8 Customer-Related Noninterest Income (1) Total customer-related noninterest income declined 1% vs. 4Q22 and was flat from the year-ago period; revenue decreased 5% vs. 4Q22 and was up 19% from the year-ago period. (1) Reflects total customer-related noninterest income, which excludes items such as fair value and non-hedge derivative income, securities gains (losses), and other items, as detailed in the Noninterest Income table located in the earnings release. (2) Revenue displayed is the sum of net interest income and customer-related noninterest income. It excludes the impact of securities gains/losses, dividends and fair value and non- hedge derivative income ($ millions) $695 $747 $819 $873 $830 1Q22 2Q22 3Q22 4Q22 1Q23 Revenue (2) ($ millions)
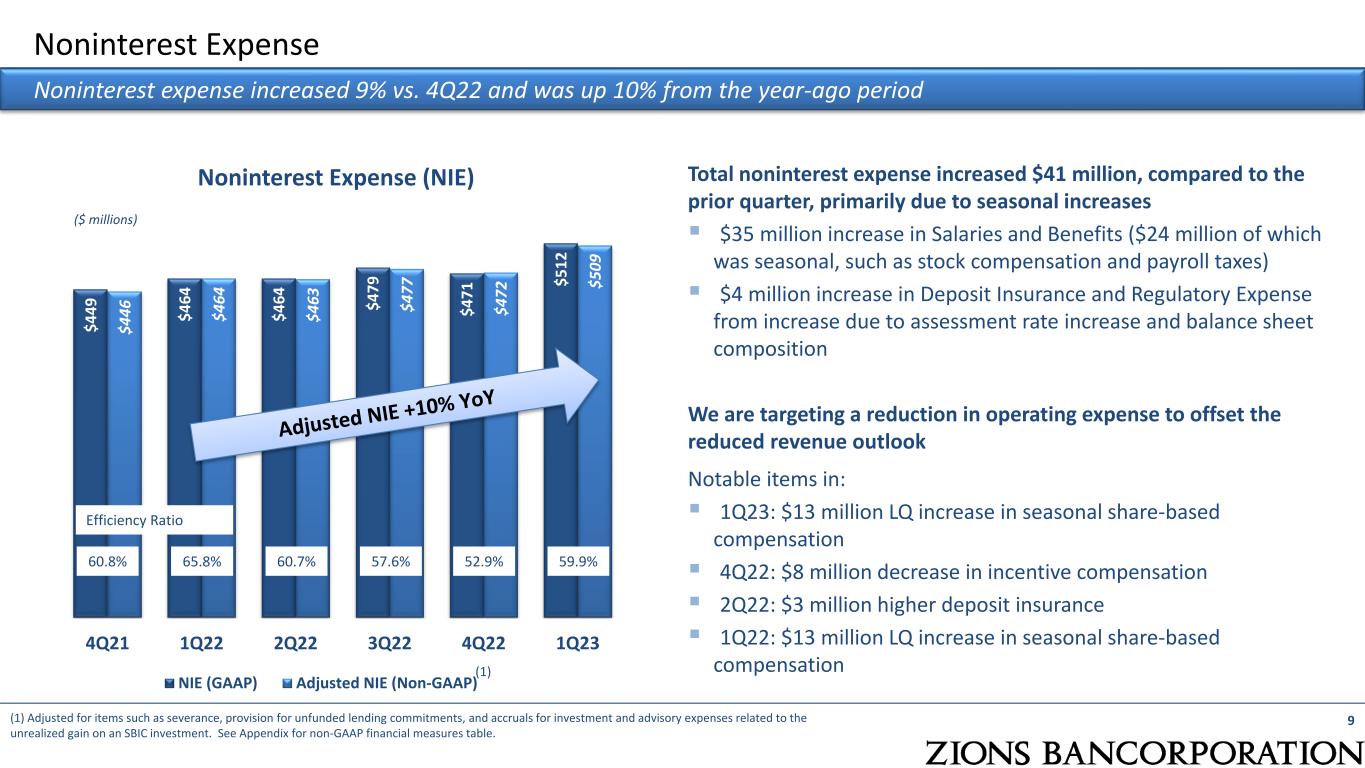
$4 49 $4 64 $4 64 $4 79 $4 71 $5 12 $4 46 $4 64 $4 63 $4 77 $4 72 $5 09 4Q21 1Q22 2Q22 3Q22 4Q22 1Q23 NIE (GAAP) Adjusted NIE (Non-GAAP) ($ millions) Noninterest Expense 9 Noninterest expense increased 9% vs. 4Q22 and was up 10% from the year-ago period Total noninterest expense increased $41 million, compared to the prior quarter, primarily due to seasonal increases $35 million increase in Salaries and Benefits ($24 million of which was seasonal, such as stock compensation and payroll taxes) $4 million increase in Deposit Insurance and Regulatory Expense from increase due to assessment rate increase and balance sheet composition We are targeting a reduction in operating expense to offset the reduced revenue outlook Notable items in: 1Q23: $13 million LQ increase in seasonal share-based compensation 4Q22: $8 million decrease in incentive compensation 2Q22: $3 million higher deposit insurance 1Q22: $13 million LQ increase in seasonal share-based compensation (1) Adjusted for items such as severance, provision for unfunded lending commitments, and accruals for investment and advisory expenses related to the unrealized gain on an SBIC investment. See Appendix for non-GAAP financial measures table. Noninterest Expense (NIE) (1) 60.8% 65.8% 60.7% 57.6% 52.9% 59.9% Efficiency Ratio
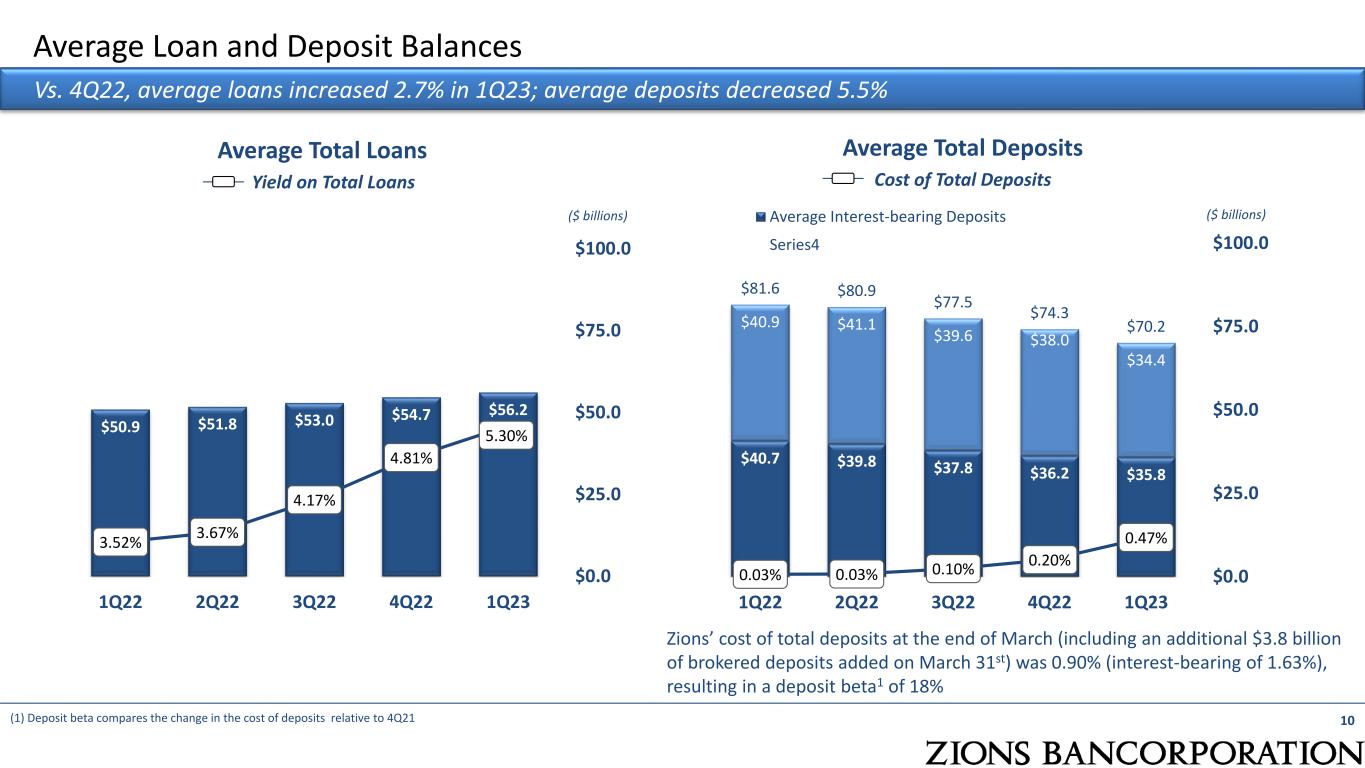
$50.9 $51.8 $53.0 $54.7 $56.2 3.52% 3.67% 4.17% 4.81% 5.30% $0.0 $25.0 $50.0 $75.0 $100.0 1Q22 2Q22 3Q22 4Q22 1Q23 Average Loan and Deposit Balances Average Total Loans Yield on Total Loans Average Total Deposits Cost of Total Deposits 10 Vs. 4Q22, average loans increased 2.7% in 1Q23; average deposits decreased 5.5% $40.7 $39.8 $37.8 $36.2 $35.8 $40.9 $41.1 $39.6 $38.0 $34.4 $81.6 $80.9 $77.5 $74.3 $70.2 0.03% 0.03% 0.10% 0.20% 0.47% $0.0 $25.0 $50.0 $75.0 $100.0 1Q22 2Q22 3Q22 4Q22 1Q23 Average Interest-bearing Deposits Series4 ($ billions) ($ billions) Zions’ cost of total deposits at the end of March (including an additional $3.8 billion of brokered deposits added on March 31st) was 0.90% (interest-bearing of 1.63%), resulting in a deposit beta1 of 18% (1) Deposit beta compares the change in the cost of deposits relative to 4Q21

33% 72% 82% 67% 28% 18% Commercial Other Consumer Insured Uninsured Data as of March 31, 2023; Brokered, trust, estate, and internal operational accounts included in Other Deposits. 11 55% of deposits are insured; an additional 3% of deposits are collateralized; 66% of commercial balances are on analysis No single customer had uncollateralized deposits exceeding 0.25% of total deposits; the top 25 largest uncollateralized deposit accounts were just 3.7% of total deposits Commercial Deposit Accounts Commercial Operating Deposit Accounts on Analysis represent: 66% of Commercial Deposit Balances 61% of Uninsured Commercial Deposit Balances 78% of Commercial Deposit Count Number of Accounts Commercial Accounts ≈ 275,000 Consumer Accounts ≈ 1.1 million Deposit Portfolio Composition Other Deposits $9.0 Billion Consumer Deposits $23.6 Billion Composition of Deposit Portfolio Total Deposits: $69.2 Billion Commercial Deposits $36.6 Billion
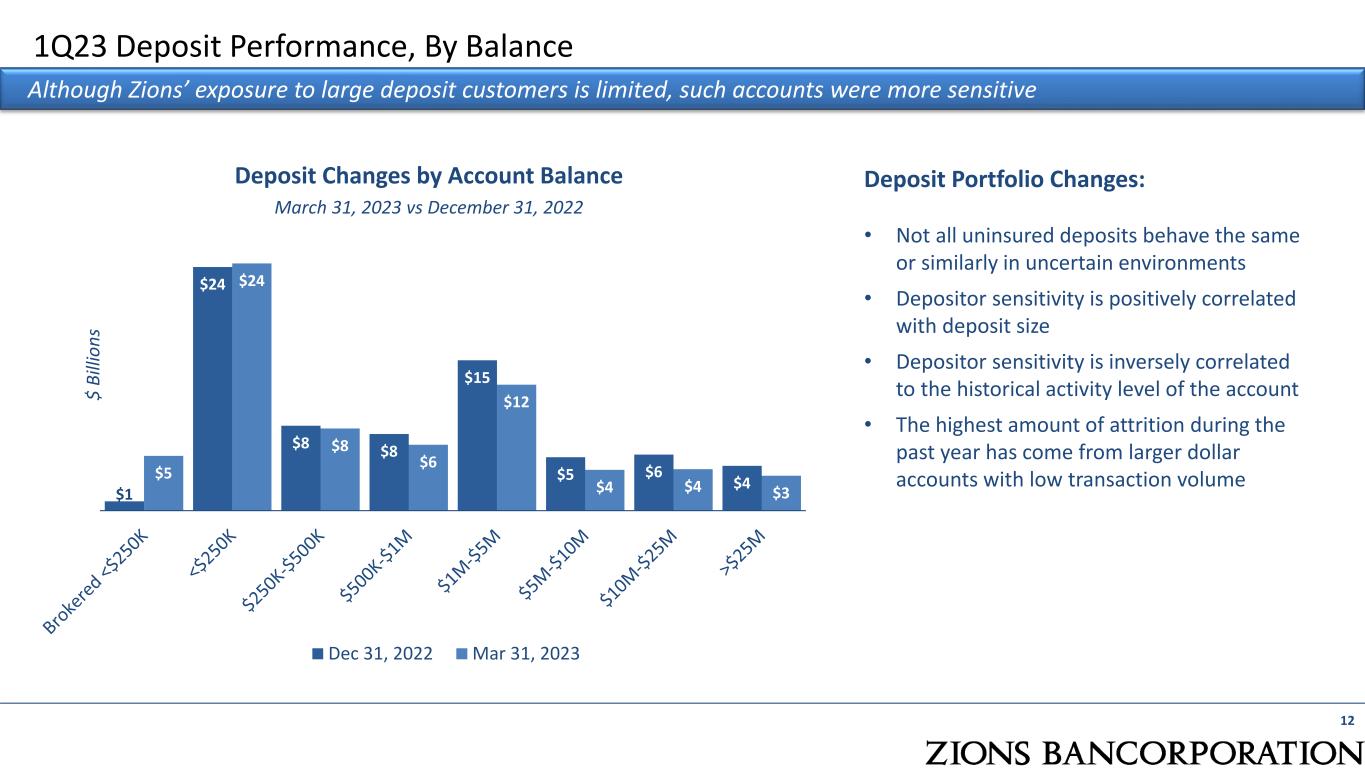
1Q23 Deposit Performance, By Balance 12 Although Zions’ exposure to large deposit customers is limited, such accounts were more sensitive $1 $24 $8 $8 $15 $5 $6 $4$5 $24 $8 $6 $12 $4 $4 $3 Dec 31, 2022 Mar 31, 2023 Deposit Changes by Account Balance March 31, 2023 vs December 31, 2022 Deposit Portfolio Changes: • Not all uninsured deposits behave the same or similarly in uncertain environments • Depositor sensitivity is positively correlated with deposit size • Depositor sensitivity is inversely correlated to the historical activity level of the account • The highest amount of attrition during the past year has come from larger dollar accounts with low transaction volume $ Bi lli on s

29 32 34 34 38 28 38 49 38 31 4Q19 4Q20 4Q21 4Q22 1Q23 Insured Deposits Uninsured Deposits 13 The pandemic was an anomaly, with recent deposit composition and levels representing a profile more typical of our portfolio Returning to pre-pandemic levels of uninsured deposits Large deposits increased from 2019 to 2021 and have been receding over the past year The reduction of large (and therefore uninsured) deposits represents a return to pre-pandemic levels Loan-to-Deposit Ratio 85% 77% 61% 78% 81% 4Q19 4Q20 4Q21 4Q22 1Q23 Deposit Balance Trends – Returning to Pre-Pandemic Levels $ Bi lli on s Insured vs. Uninsured Deposits
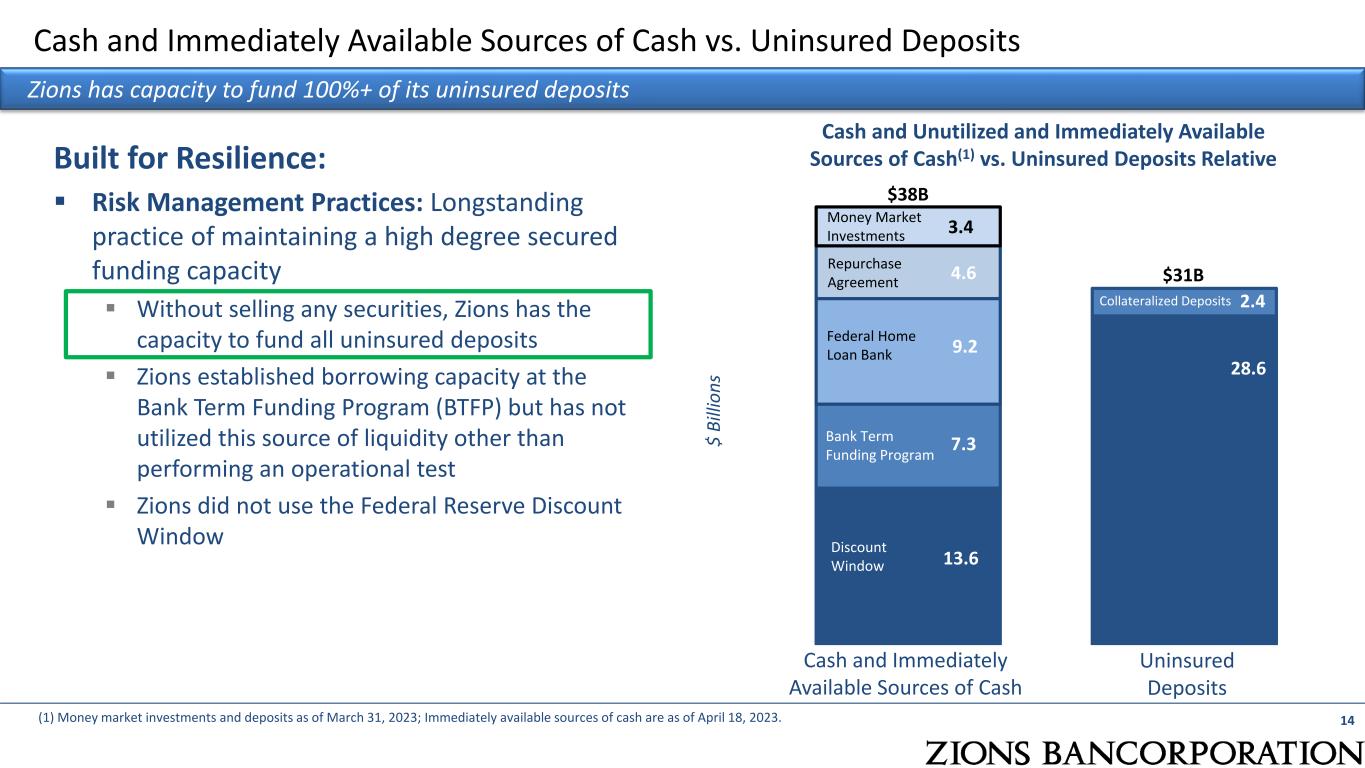
Built for Resilience: Risk Management Practices: Longstanding practice of maintaining a high degree secured funding capacity Without selling any securities, Zions has the capacity to fund all uninsured deposits Zions established borrowing capacity at the Bank Term Funding Program (BTFP) but has not utilized this source of liquidity other than performing an operational test Zions did not use the Federal Reserve Discount Window 14 Cash and Immediately Available Sources of Cash vs. Uninsured Deposits Zions has capacity to fund 100%+ of its uninsured deposits 13.6 28.6 7.3 2.4 9.2 4.6 3.4 Uninsured Deposits $ Bi lli on s Cash and Unutilized and Immediately Available Sources of Cash(1) vs. Uninsured Deposits Relative Collateralized Deposits Money Market Investments Repurchase Agreement Federal Home Loan Bank Bank Term Funding Program Discount Window Cash and Immediately Available Sources of Cash (1) Money market investments and deposits as of March 31, 2023; Immediately available sources of cash are as of April 18, 2023. $38B $31B
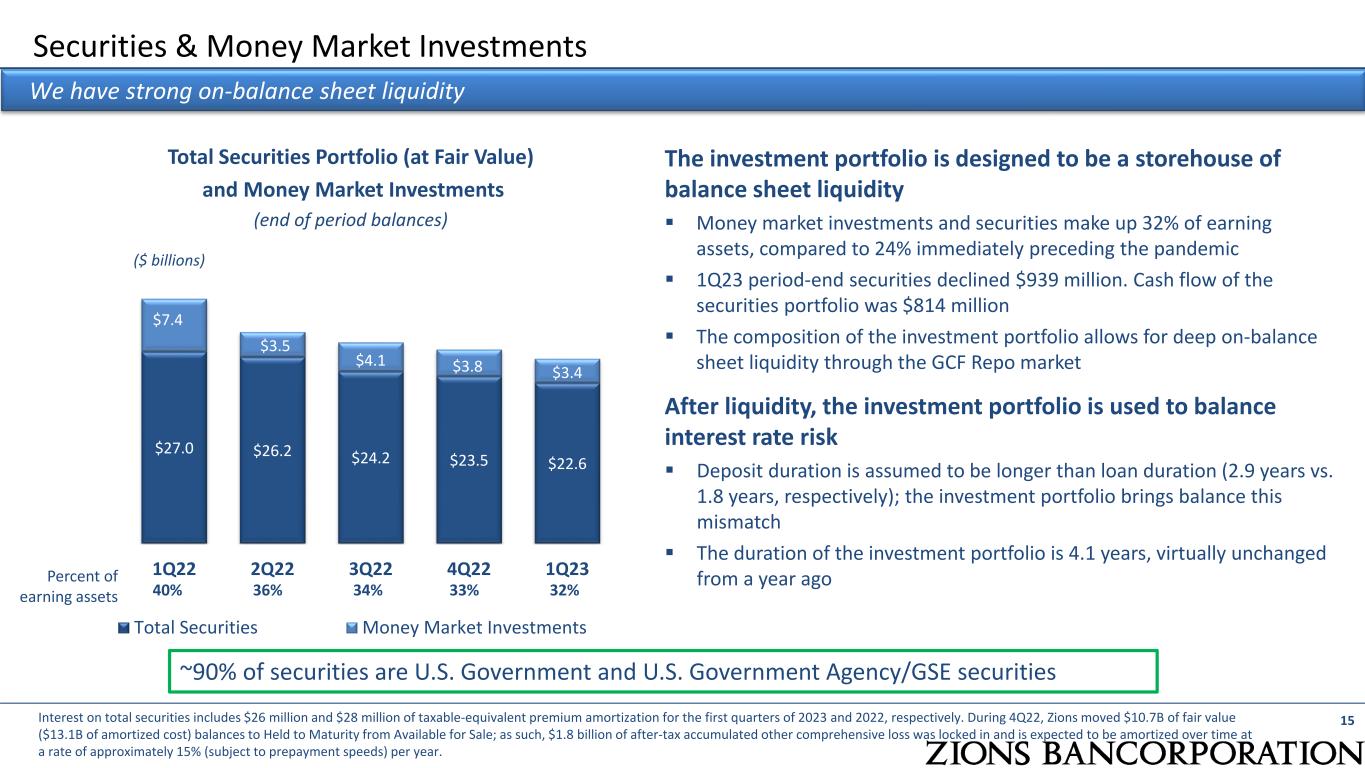
Securities & Money Market Investments 15 Total Securities Portfolio (at Fair Value) and Money Market Investments (end of period balances) $27.0 $26.2 $24.2 $23.5 $22.6 $7.4 $3.5 $4.1 $3.8 $3.4 1Q22 2Q22 3Q22 4Q22 1Q23 Total Securities Money Market Investments ($ billions) We have strong on-balance sheet liquidity The investment portfolio is designed to be a storehouse of balance sheet liquidity Money market investments and securities make up 32% of earning assets, compared to 24% immediately preceding the pandemic 1Q23 period-end securities declined $939 million. Cash flow of the securities portfolio was $814 million The composition of the investment portfolio allows for deep on-balance sheet liquidity through the GCF Repo market 40% 36% 34% 33% 32% Percent of earning assets Interest on total securities includes $26 million and $28 million of taxable-equivalent premium amortization for the first quarters of 2023 and 2022, respectively. During 4Q22, Zions moved $10.7B of fair value ($13.1B of amortized cost) balances to Held to Maturity from Available for Sale; as such, $1.8 billion of after-tax accumulated other comprehensive loss was locked in and is expected to be amortized over time at a rate of approximately 15% (subject to prepayment speeds) per year. After liquidity, the investment portfolio is used to balance interest rate risk Deposit duration is assumed to be longer than loan duration (2.9 years vs. 1.8 years, respectively); the investment portfolio brings balance this mismatch The duration of the investment portfolio is 4.1 years, virtually unchanged from a year ago ~90% of securities are U.S. Government and U.S. Government Agency/GSE securities
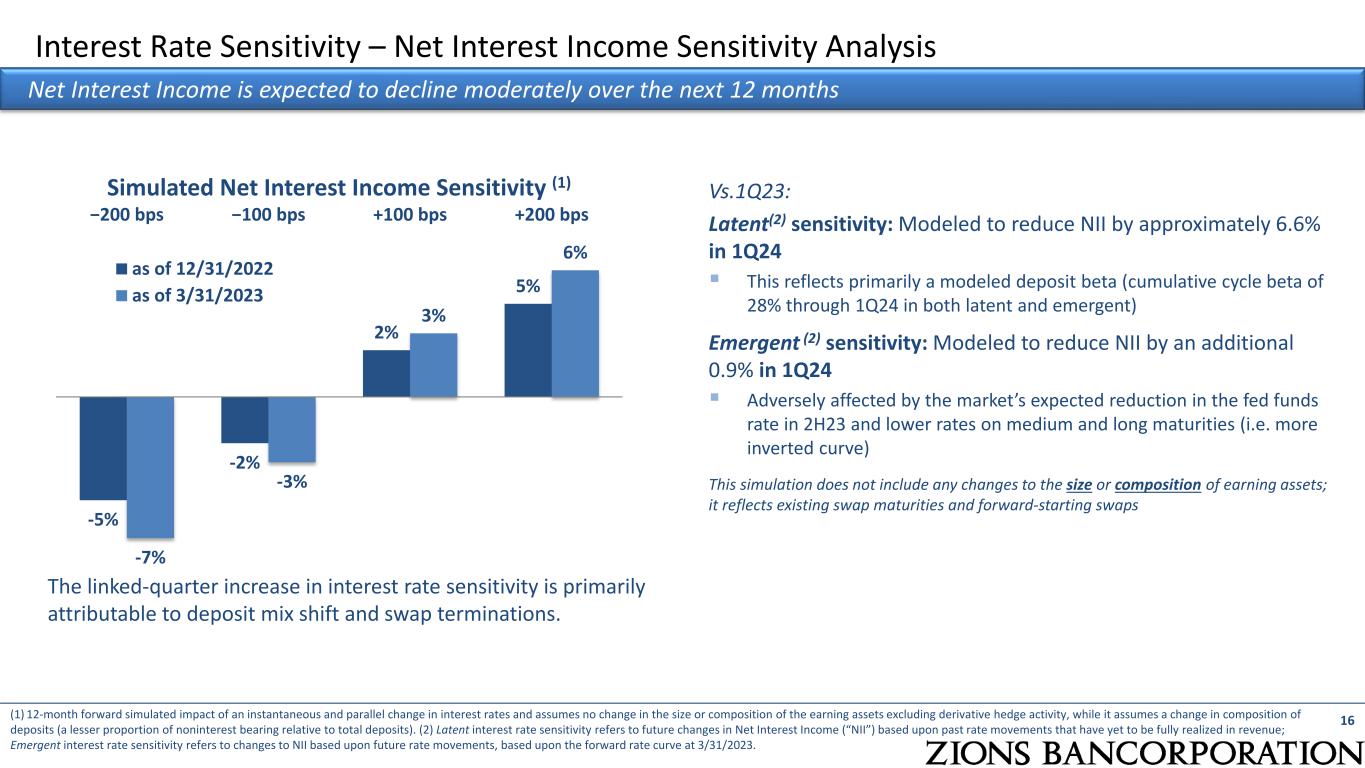
Interest Rate Sensitivity – Net Interest Income Sensitivity Analysis 16 Net Interest Income is expected to decline moderately over the next 12 months (1) 12-month forward simulated impact of an instantaneous and parallel change in interest rates and assumes no change in the size or composition of the earning assets excluding derivative hedge activity, while it assumes a change in composition of deposits (a lesser proportion of noninterest bearing relative to total deposits). (2) Latent interest rate sensitivity refers to future changes in Net Interest Income (“NII”) based upon past rate movements that have yet to be fully realized in revenue; Emergent interest rate sensitivity refers to changes to NII based upon future rate movements, based upon the forward rate curve at 3/31/2023. Vs.1Q23: Latent(2) sensitivity: Modeled to reduce NII by approximately 6.6% in 1Q24 This reflects primarily a modeled deposit beta (cumulative cycle beta of 28% through 1Q24 in both latent and emergent) Emergent (2) sensitivity: Modeled to reduce NII by an additional 0.9% in 1Q24 Adversely affected by the market’s expected reduction in the fed funds rate in 2H23 and lower rates on medium and long maturities (i.e. more inverted curve) This simulation does not include any changes to the size or composition of earning assets; it reflects existing swap maturities and forward-starting swaps The linked-quarter increase in interest rate sensitivity is primarily attributable to deposit mix shift and swap terminations. -5% -2% 2% 5% -7% -3% 3% 6% −200 bps −100 bps +100 bps +200 bps Simulated Net Interest Income Sensitivity (1) as of 12/31/2022 as of 3/31/2023

Understanding the Value of Duration on the Asset Side of the Balance Sheet 17 Net Interest Income Sensitivity Analysis (“Earnings at Risk” or “EaR”) Economic Value of Equity Sensitivity Analysis Duration associated with the investment and swap portfolios balances Zions’ overall interest rate risk -7% 6% -20% 19% Down 200 Up 200 As reported Hypothetical: Replace Securities with Cash and Eliminate Swaps 0% -2% -28% 21% Down 200 Up 200 WITHOUT securities and swaps, NII sensitivity is 3x more volatile WITHOUT securities and swaps, the EVE changes 49% (from a down 200 to an up 200 scenario) WITH securities and swaps, EVE changes just 2%
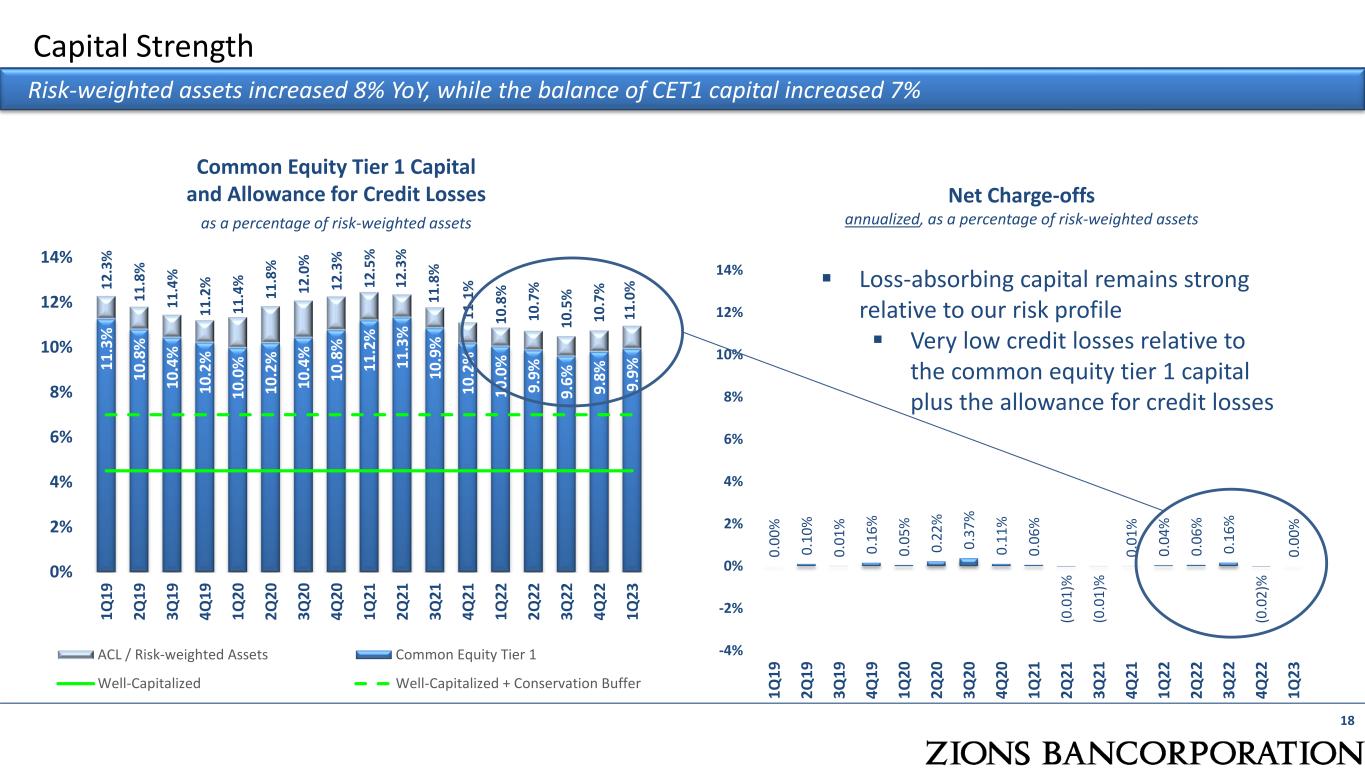
Net Charge-offs annualized, as a percentage of risk-weighted assets 0. 00 % 0. 10 % 0. 01 % 0. 16 % 0. 05 % 0. 22 % 0. 37 % 0. 11 % 0. 06 % (0 .0 1) % (0 .0 1) % 0. 01 % 0. 04 % 0. 06 % 0. 16 % (0 .0 2) % 0. 00 % -4% -2% 0% 2% 4% 6% 8% 10% 12% 14% 1Q 19 2Q 19 3Q 19 4Q 19 1Q 20 2Q 20 3Q 20 4Q 20 1Q 21 2Q 21 3Q 21 4Q 21 1Q 22 2Q 22 3Q 22 4Q 22 1Q 23 Capital Strength 18 Risk-weighted assets increased 8% YoY, while the balance of CET1 capital increased 7% Common Equity Tier 1 Capital and Allowance for Credit Losses as a percentage of risk-weighted assets 11 .3 % 10 .8 % 10 .4 % 10 .2 % 10 .0 % 10 .2 % 10 .4 % 10 .8 % 11 .2 % 11 .3 % 10 .9 % 10 .2 % 10 .0 % 9. 9% 9. 6% 9. 8% 9. 9% 12 .3 % 11 .8 % 11 .4 % 11 .2 % 11 .4 % 11 .8 % 12 .0 % 12 .3 % 12 .5 % 12 .3 % 11 .8 % 11 .1 % 10 .8 % 10 .7 % 10 .5 % 10 .7 % 11 .0 % 0% 2% 4% 6% 8% 10% 12% 14% 1Q 19 2Q 19 3Q 19 4Q 19 1Q 20 2Q 20 3Q 20 4Q 20 1Q 21 2Q 21 3Q 21 4Q 21 1Q 22 2Q 22 3Q 22 4Q 22 1Q 23 ACL / Risk-weighted Assets Common Equity Tier 1 Well-Capitalized Well-Capitalized + Conservation Buffer Loss-absorbing capital remains strong relative to our risk profile Very low credit losses relative to the common equity tier 1 capital plus the allowance for credit losses
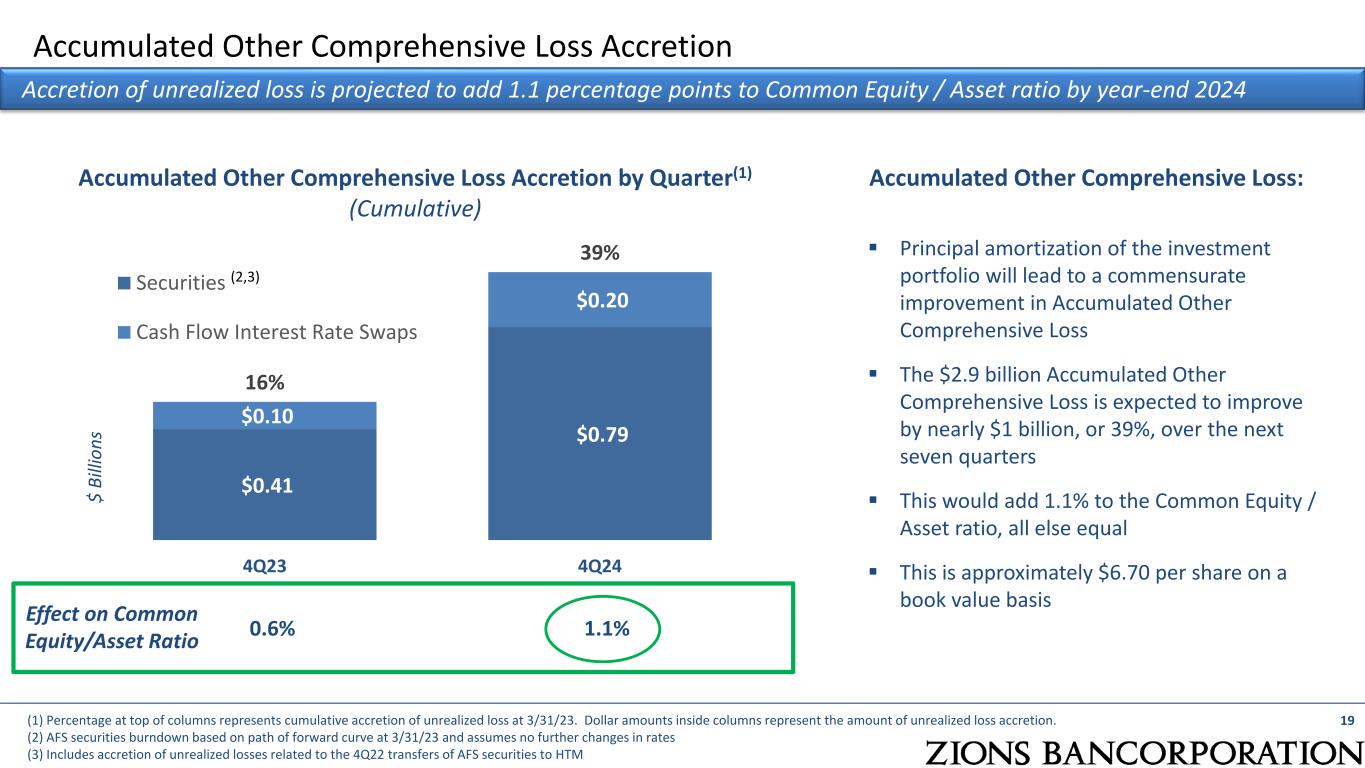
$0.41 $0.79 $0.10 $0.20 16% 39% 4Q23 4Q24 Securities Cash Flow Interest Rate Swaps Accumulated Other Comprehensive Loss Accretion Accretion of unrealized loss is projected to add 1.1 percentage points to Common Equity / Asset ratio by year-end 2024 $ Bi lli on s Accumulated Other Comprehensive Loss Accretion by Quarter(1) (Cumulative) 19 0.6% 1.1% Effect on Common Equity/Asset Ratio Accumulated Other Comprehensive Loss: (1) Percentage at top of columns represents cumulative accretion of unrealized loss at 3/31/23. Dollar amounts inside columns represent the amount of unrealized loss accretion. (2) AFS securities burndown based on path of forward curve at 3/31/23 and assumes no further changes in rates (3) Includes accretion of unrealized losses related to the 4Q22 transfers of AFS securities to HTM Principal amortization of the investment portfolio will lead to a commensurate improvement in Accumulated Other Comprehensive Loss The $2.9 billion Accumulated Other Comprehensive Loss is expected to improve by nearly $1 billion, or 39%, over the next seven quarters This would add 1.1% to the Common Equity / Asset ratio, all else equal This is approximately $6.70 per share on a book value basis (2,3)
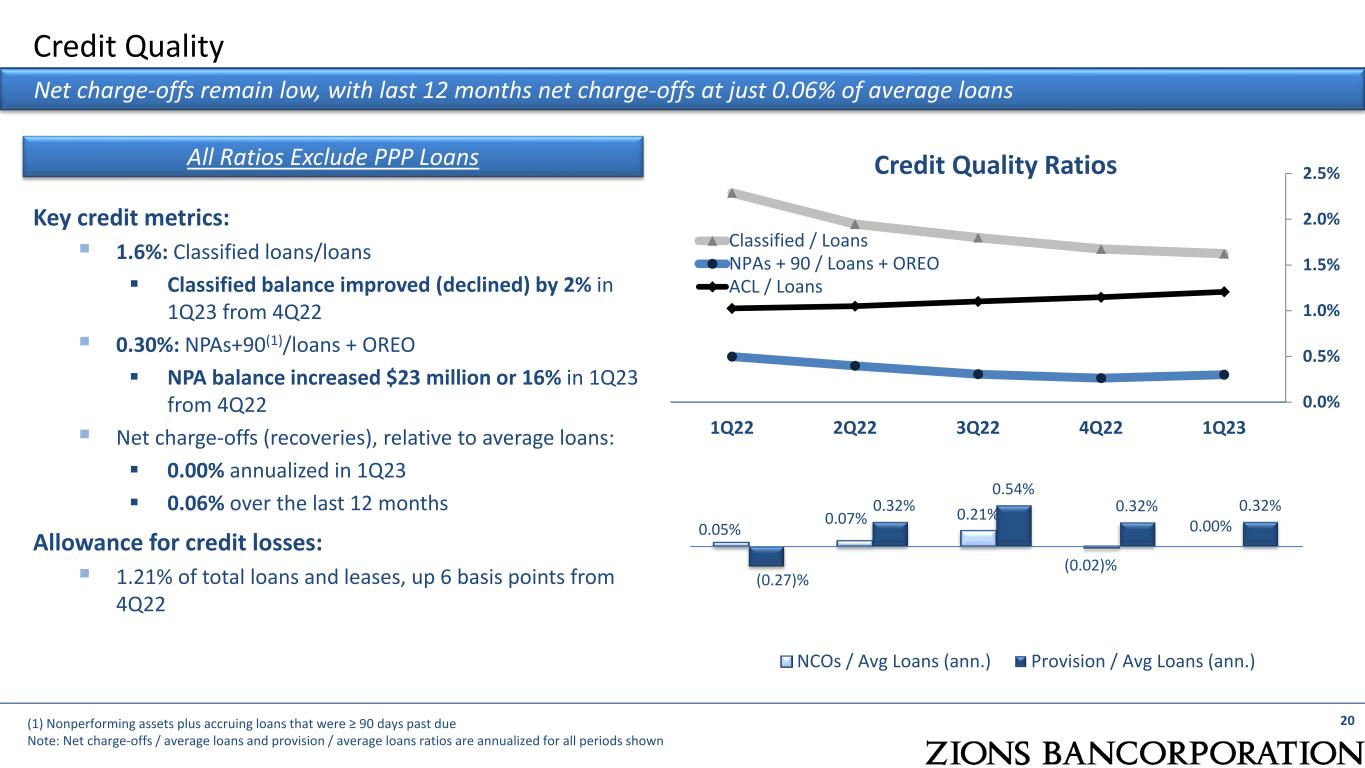
20 Credit Quality Ratios Net charge-offs remain low, with last 12 months net charge-offs at just 0.06% of average loans Key credit metrics: 1.6%: Classified loans/loans Classified balance improved (declined) by 2% in 1Q23 from 4Q22 0.30%: NPAs+90(1)/loans + OREO NPA balance increased $23 million or 16% in 1Q23 from 4Q22 Net charge-offs (recoveries), relative to average loans: 0.00% annualized in 1Q23 0.06% over the last 12 months Allowance for credit losses: 1.21% of total loans and leases, up 6 basis points from 4Q22 (1) Nonperforming assets plus accruing loans that were ≥ 90 days past due Note: Net charge-offs / average loans and provision / average loans ratios are annualized for all periods shown Credit Quality 0.0% 0.5% 1.0% 1.5% 2.0% 2.5% 1Q22 2Q22 3Q22 4Q22 1Q23 Classified / Loans NPAs + 90 / Loans + OREO ACL / Loans All Ratios Exclude PPP Loans 0.05% 0.07% 0.21% (0.02)% 0.00% (0.27)% 0.32% 0.54% 0.32% 0.32% NCOs / Avg Loans (ann.) Provision / Avg Loans (ann.)
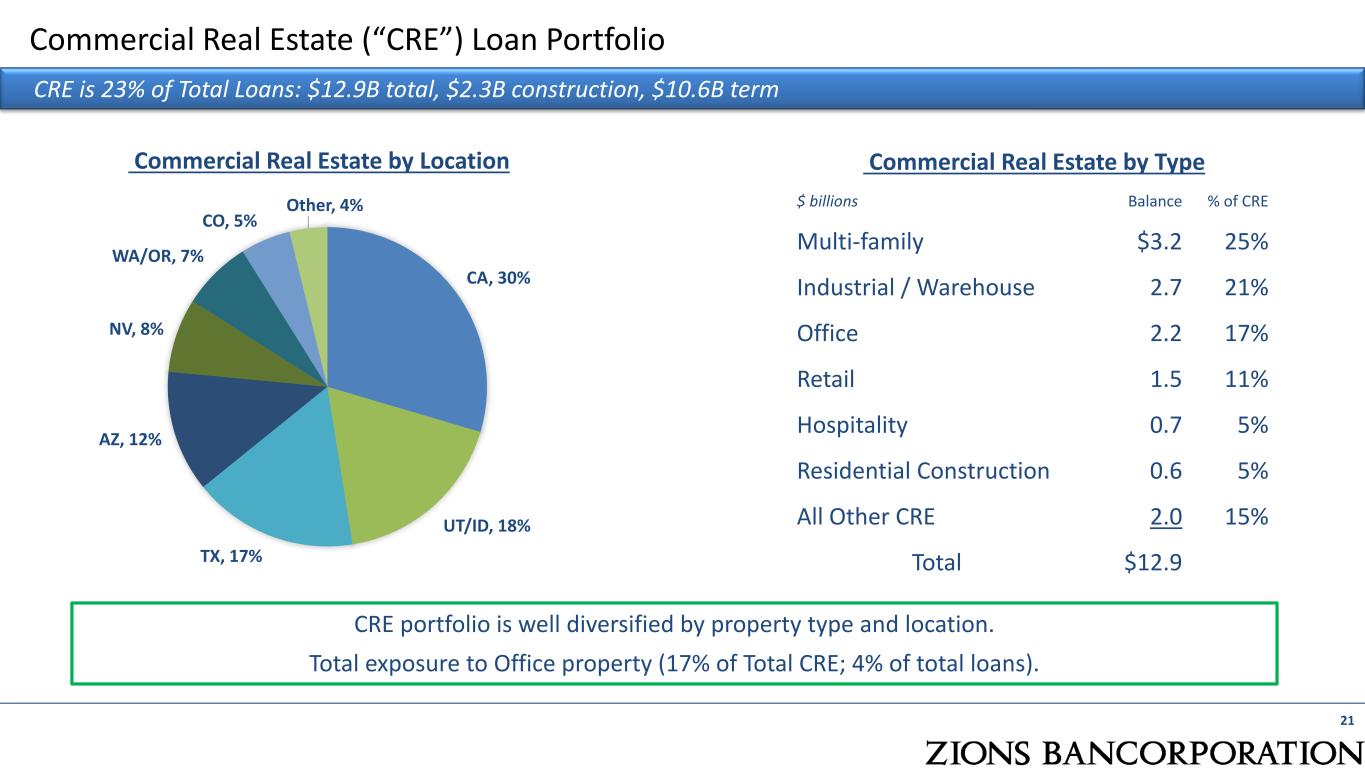
Commercial Real Estate (“CRE”) Loan Portfolio CRE is 23% of Total Loans: $12.9B total, $2.3B construction, $10.6B term 21 CA, 30% UT/ID, 18% TX, 17% AZ, 12% NV, 8% WA/OR, 7% CO, 5% Other, 4% Commercial Real Estate by TypeCommercial Real Estate by Location CRE portfolio is well diversified by property type and location. Total exposure to Office property (17% of Total CRE; 4% of total loans). $ billions Balance % of CRE Multi-family $3.2 25% Industrial / Warehouse 2.7 21% Office 2.2 17% Retail 1.5 11% Hospitality 0.7 5% Residential Construction 0.6 5% All Other CRE 2.0 15% Total $12.9

CRE In-Depth Review: Exercising CRE Discipline Through Growth Management Commercial real estate loan growth lags peers due to continued exercise of concentration risk discipline Data as of December 31, 2022; peer growth rates are normalized for significant acquisitions 0 50 100 150 200 20 17 Q 3 20 18 Q 1 20 18 Q 3 20 19 Q 1 20 19 Q 3 20 20 Q 1 20 20 Q 3 20 21 Q 1 20 21 Q 3 20 22 Q 1 20 22 Q 3 ZION Peer Top Quartile Peer Bottom Quartile Indexed: 2017 Q3 = 100 Commercial Real Estate Excluding Owner Occupied 20 22 Q 4 22 Zions has exercised caution in CRE concentrations for more than a decade and in underwriting standards for many decades. Key factors for consideration in credit risk within CRE Measured and disciplined growth compared to peers Significant borrower equity – conservative LTVs Disciplined underwriting on debt service coverage Diversified by geography and asset class Limited exposure to land / horizontal construction
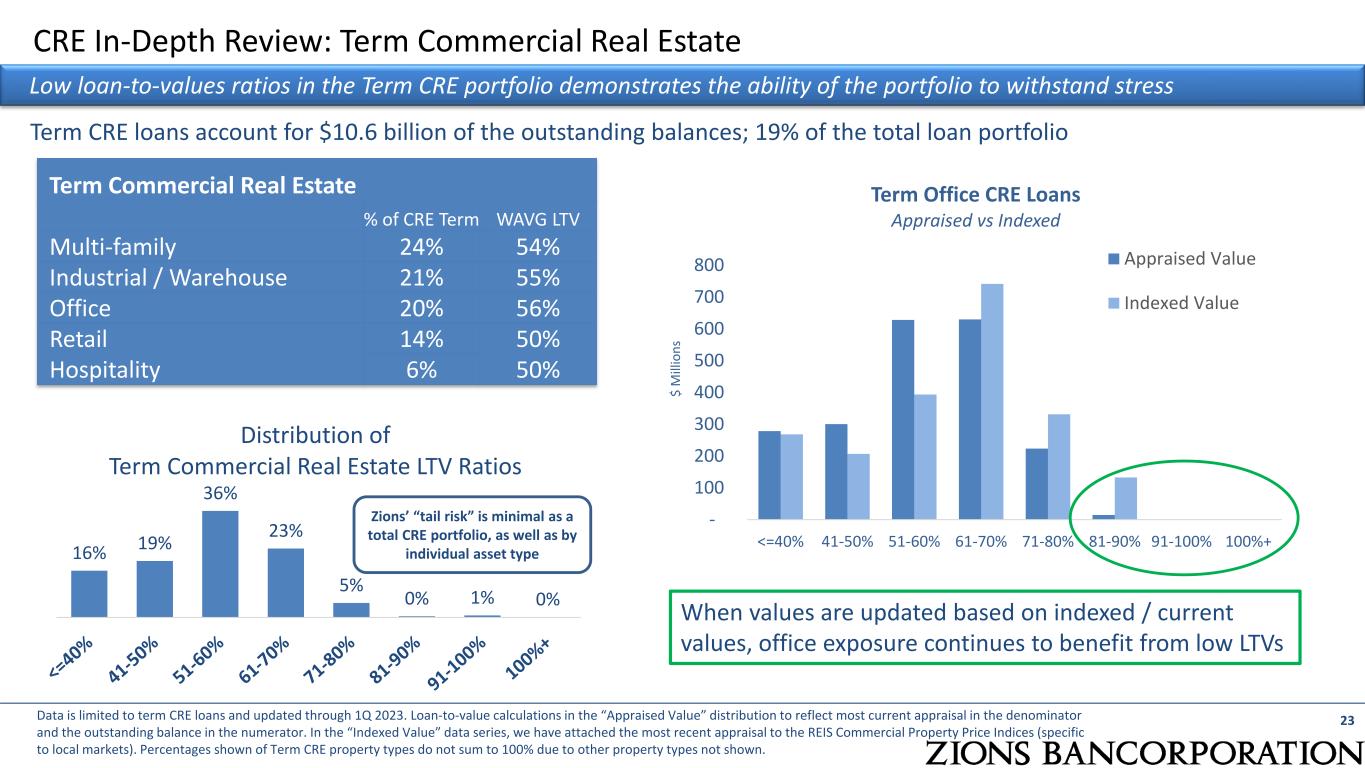
CRE In-Depth Review: Term Commercial Real Estate 23 Low loan-to-values ratios in the Term CRE portfolio demonstrates the ability of the portfolio to withstand stress Term Commercial Real Estate % of CRE Term WAVG LTV Multi-family 24% 54% Industrial / Warehouse 21% 55% Office 20% 56% Retail Hospitality 14% 50% 50%6% Term CRE loans account for $10.6 billion of the outstanding balances; 19% of the total loan portfolio Data is limited to term CRE loans and updated through 1Q 2023. Loan-to-value calculations in the “Appraised Value” distribution to reflect most current appraisal in the denominator and the outstanding balance in the numerator. In the “Indexed Value” data series, we have attached the most recent appraisal to the REIS Commercial Property Price Indices (specific to local markets). Percentages shown of Term CRE property types do not sum to 100% due to other property types not shown. Zions’ “tail risk” is minimal as a total CRE portfolio, as well as by individual asset type16% 19% 36% 23% 5% 0% 1% 0% Distribution of Term Commercial Real Estate LTV Ratios When values are updated based on indexed / current values, office exposure continues to benefit from low LTVs - 100 200 300 400 500 600 700 800 <=40% 41-50% 51-60% 61-70% 71-80% 81-90% 91-100% 100%+ $ M ill io ns Term Office CRE Loans Appraised vs Indexed Appraised Value Indexed Value
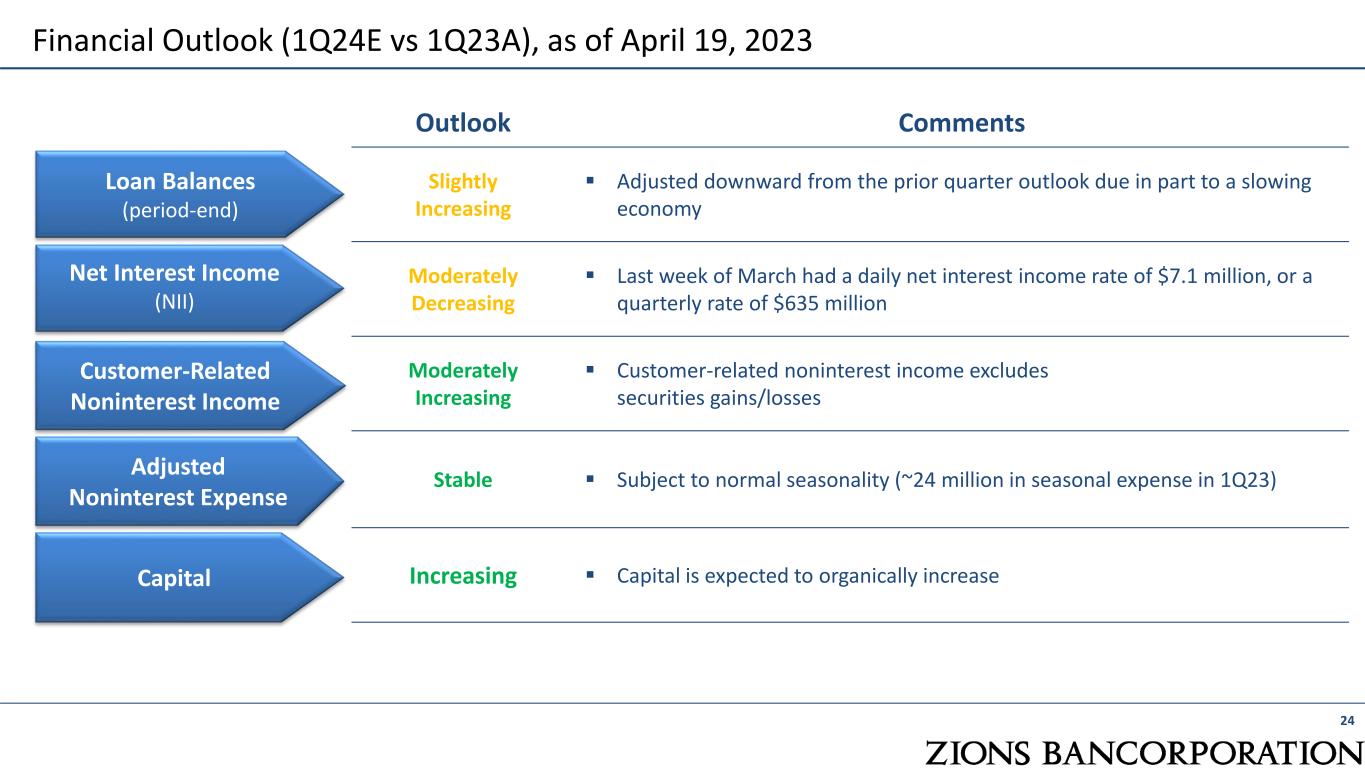
Financial Outlook (1Q24E vs 1Q23A), as of April 19, 2023 24 Outlook Comments Slightly Increasing Adjusted downward from the prior quarter outlook due in part to a slowing economy Moderately Decreasing Last week of March had a daily net interest income rate of $7.1 million, or a quarterly rate of $635 million Moderately Increasing Customer-related noninterest income excludes securities gains/losses Stable Subject to normal seasonality (~24 million in seasonal expense in 1Q23) Increasing Capital is expected to organically increase Customer-Related Noninterest Income Loan Balances (period-end) Net Interest Income (NII) Capital Adjusted Noninterest Expense
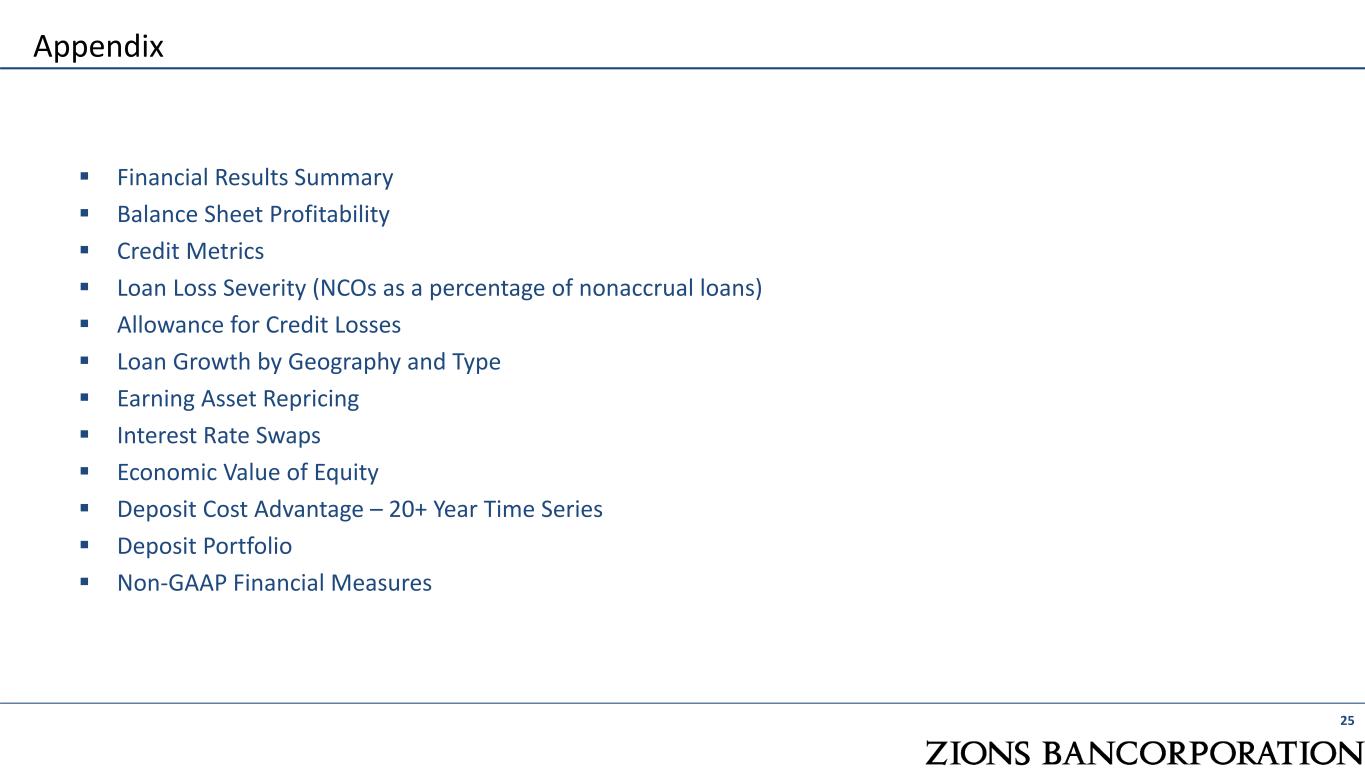
Financial Results Summary Balance Sheet Profitability Credit Metrics Loan Loss Severity (NCOs as a percentage of nonaccrual loans) Allowance for Credit Losses Loan Growth by Geography and Type Earning Asset Repricing Interest Rate Swaps Economic Value of Equity Deposit Cost Advantage – 20+ Year Time Series Deposit Portfolio Non-GAAP Financial Measures 25 Appendix

Financial Results Summary 26 Solid and improving fundamental performance Three Months Ended (Dollar amounts in millions, except per share data) March 31, 2023 December 31, 2022 September 30, 2022 June 30, 2022 Earnings Results: Diluted Earnings Per Share $ 1.33 $ 1.84 $ 1.40 $ 1.29 Net Earnings Applicable to Common Shareholders 198 277 211 195 Net Interest Income 679 720 663 593 Noninterest Income 160 153 165 172 Noninterest Expense 512 471 479 464 Pre-Provision Net Revenue - Adjusted (1) 341 420 351 300 Provision for Credit Losses 45 43 71 41 Ratios: Return on Assets(2) 0.91 % 1.27 % 0.97 % 0.91 % Return on Common Equity(3) 17.4 % 25.4 % 15.8 % 14.0 % Return on Tangible Common Equity, excl. AOCI(3) 12.3 % 16.9 % 13.2 % 12.5 % Net Interest Margin 3.33 % 3.53 % 3.24 % 2.87 % Yield on Loans 5.30 % 4.81 % 4.17 % 3.67 % Yield on Securities 2.46 % 2.42 % 2.10 % 1.97 % Average Cost of Total Deposits(4) 0.47 % 0.20 % 0.10 % 0.03 % Efficiency Ratio (1) 59.9 % 52.9 % 57.6 % 60.7 % Effective Tax Rate 27.7 % 20.9 % 21.9 % 21.9 % Ratio of Nonperforming Assets to Loans, Leases and OREO 0.30 % 0.27 % 0.28 % 0.38 % Annualized Ratio of Net Loan and Lease Charge-offs to Average Loans 0.00 % (0.02) % 0.20 % 0.07 % Common Equity Tier 1 Capital Ratio(5) 9.9 % 9.7 % 9.6 % 9.9 % (1) Adjusted for items such as severance costs, restructuring costs, other real estate expense, pension termination-related expense, securities gains and losses and investment and advisory expense related SBIC investments. See Appendix for non-GAAP financial measures. (2) Net Income before Preferred Dividends used in the numerator; (3) Net Income Applicable to Common used in the numerator; (4) Includes noninterest-bearing deposits; (5) Current period ratios and amounts represent estimates
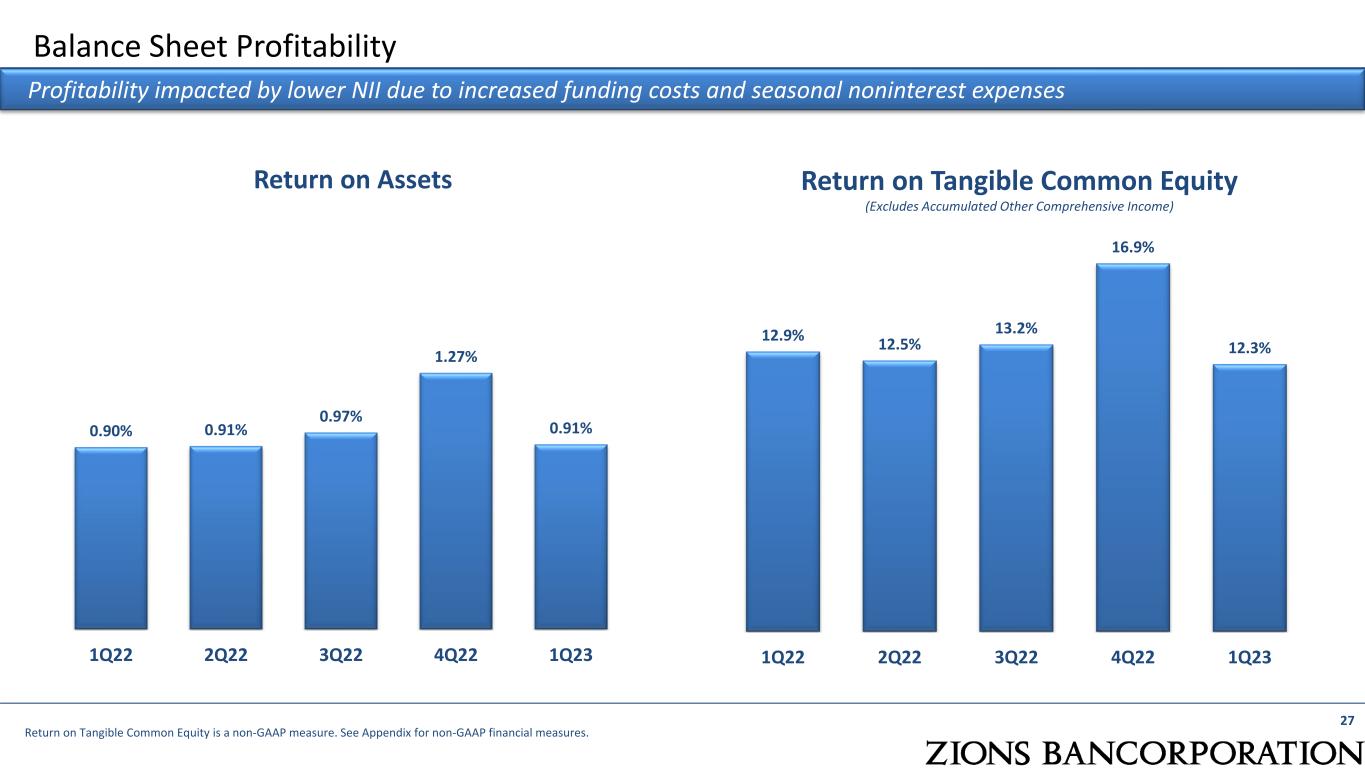
0.90% 0.91% 0.97% 1.27% 0.91% 1Q22 2Q22 3Q22 4Q22 1Q23 12.9% 12.5% 13.2% 16.9% 12.3% 1Q22 2Q22 3Q22 4Q22 1Q23 Balance Sheet Profitability 27 Profitability impacted by lower NII due to increased funding costs and seasonal noninterest expenses Return on Assets Return on Tangible Common Equity (Excludes Accumulated Other Comprehensive Income) Return on Tangible Common Equity is a non-GAAP measure. See Appendix for non-GAAP financial measures.
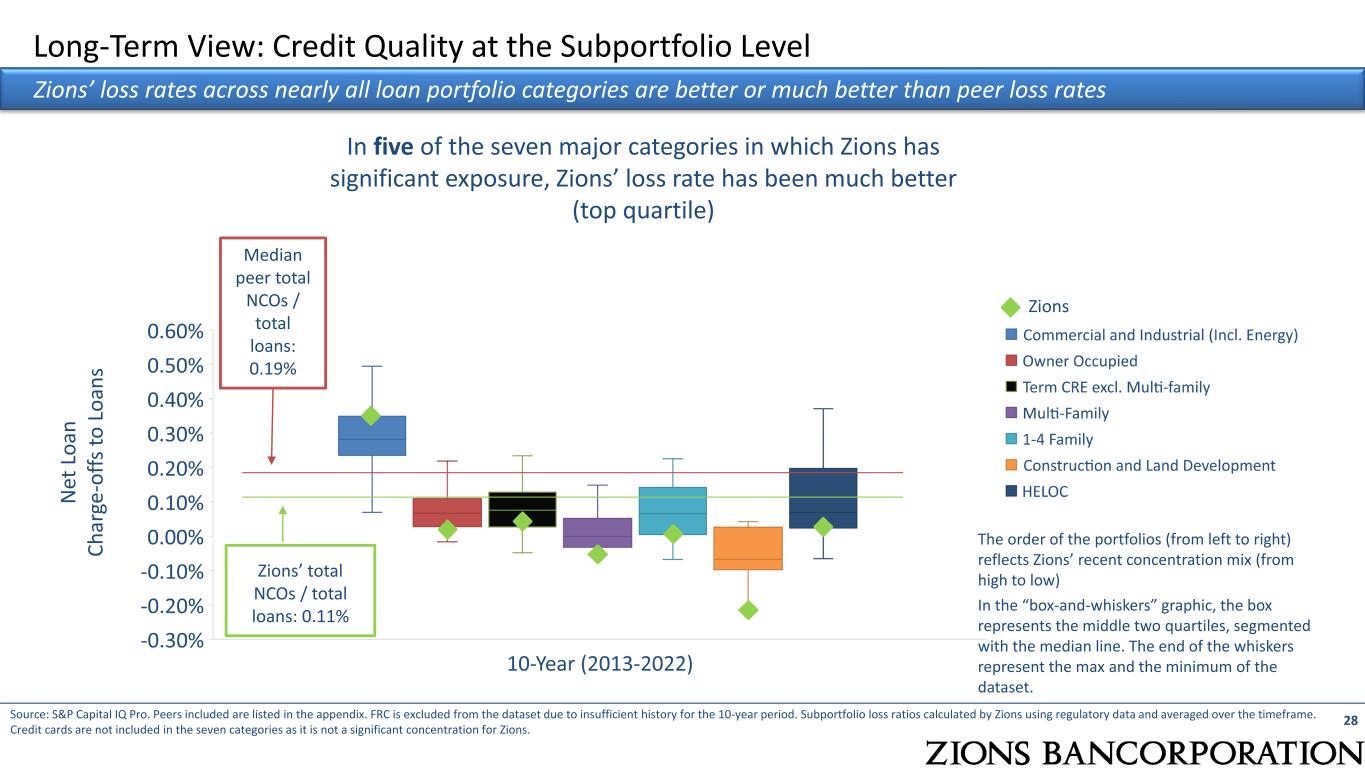
Long-Term View: Credit Quality at the Subportfolio Level Zions’ loss rates across nearly all loan portfolio categories are better or much better than peer loss rates In five of the seven major categories in which Zions has significant exposure, Zions’ loss rate has been much better (top quartile) The order of the portfolios (from left to right) reflects Zions’ recent concentration mix (from high to low) Source: S&P Capital IQ Pro. Peers included are listed in the appendix. FRC is excluded from the dataset due to insufficient history for the 10-year period. Subportfolio loss ratios calculated by Zions using regulatory data and averaged over the timeframe. Credit cards are not included in the seven categories as it is not a significant concentration for Zions. Zions In the “box-and-whiskers” graphic, the box represents the middle two quartiles, segmented with the median line. The end of the whiskers represent the max and the minimum of the dataset. N et L oa n Ch ar ge -o ffs to L oa ns Median peer total NCOs / total loans: 0.19% Zions’ total NCOs / total loans: 0.11% 28
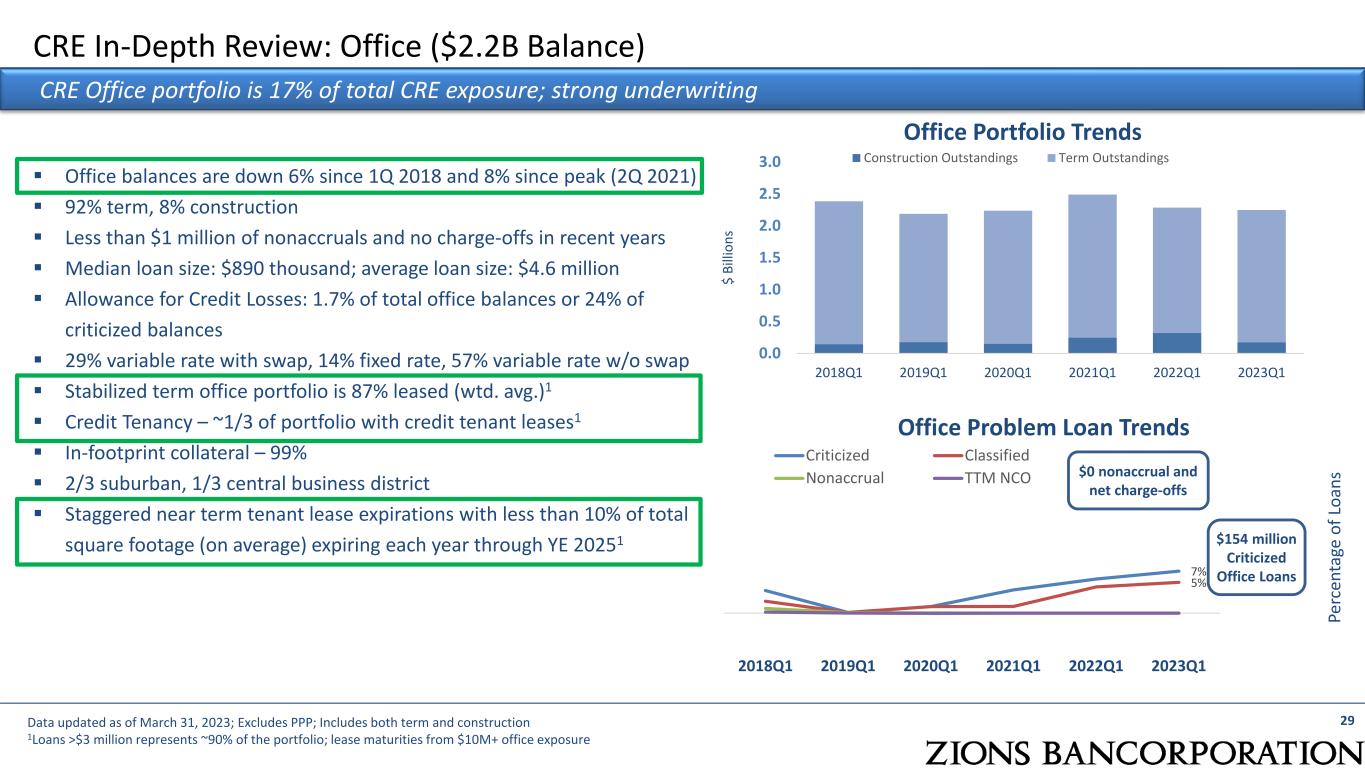
CRE In-Depth Review: Office ($2.2B Balance) 29Data updated as of March 31, 2023; Excludes PPP; Includes both term and construction 1Loans >$3 million represents ~90% of the portfolio; lease maturities from $10M+ office exposure CRE Office portfolio is 17% of total CRE exposure; strong underwriting Office balances are down 6% since 1Q 2018 and 8% since peak (2Q 2021) 92% term, 8% construction Less than $1 million of nonaccruals and no charge-offs in recent years Median loan size: $890 thousand; average loan size: $4.6 million Allowance for Credit Losses: 1.7% of total office balances or 24% of criticized balances 29% variable rate with swap, 14% fixed rate, 57% variable rate w/o swap Stabilized term office portfolio is 87% leased (wtd. avg.)1 Credit Tenancy – ~1/3 of portfolio with credit tenant leases1 In-footprint collateral – 99% 2/3 suburban, 1/3 central business district Staggered near term tenant lease expirations with less than 10% of total square footage (on average) expiring each year through YE 20251 Pe rc en ta ge o f L oa ns 0.0 0.5 1.0 1.5 2.0 2.5 3.0 2018Q1 2019Q1 2020Q1 2021Q1 2022Q1 2023Q1 $ Bi lli on s Construction Outstandings Term Outstandings 7% 5% 2018Q1 2019Q1 2020Q1 2021Q1 2022Q1 2023Q1 Criticized Classified Nonaccrual TTM NCO Office Portfolio Trends Office Problem Loan Trends $0 nonaccrual and net charge-offs $154 million Criticized Office Loans
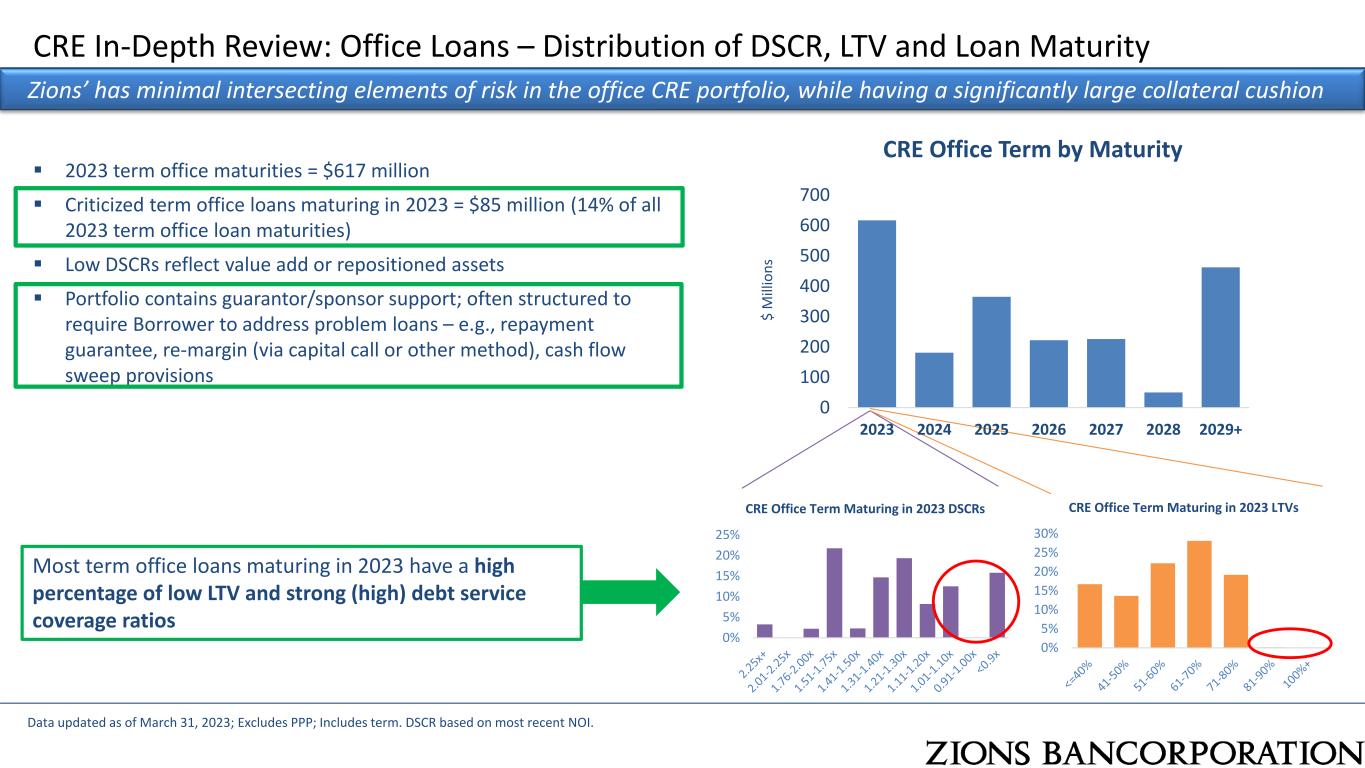
0% 5% 10% 15% 20% 25% CRE Office Term Maturing in 2023 DSCRs 0% 5% 10% 15% 20% 25% 30% CRE Office Term Maturing in 2023 LTVs CRE In-Depth Review: Office Loans – Distribution of DSCR, LTV and Loan Maturity Data updated as of March 31, 2023; Excludes PPP; Includes term. DSCR based on most recent NOI. Zions’ has minimal intersecting elements of risk in the office CRE portfolio, while having a significantly large collateral cushion 2023 term office maturities = $617 million Criticized term office loans maturing in 2023 = $85 million (14% of all 2023 term office loan maturities) Low DSCRs reflect value add or repositioned assets Portfolio contains guarantor/sponsor support; often structured to require Borrower to address problem loans – e.g., repayment guarantee, re-margin (via capital call or other method), cash flow sweep provisions CRE Office Term by Maturity Most term office loans maturing in 2023 have a high percentage of low LTV and strong (high) debt service coverage ratios 0 100 200 300 400 500 600 700 2023 2024 2025 2026 2027 2028 2029+ $ M ill io ns

Credit Quality: Consumer Real Estate Secured (Term 1-4 Family and Home Equity Credit Lines) 31 Minimal risk layering shows strength of the consumer real estate loan portfolio Loan-to-value calculations reflect most current appraisal adjusted by a home price index (Case-Shiller or FHFA) for the area where the collateral is located for the denominator and the most recent outstanding balances in the numerator. 1st Lien balances associated with Jr. Lien HECLs are updated using Experian data we receive. Due to rounding, some of the percentages may not add up to 100%. Data is as of 3/31/2023 Term 1-4 family mortgages (“1-4 family residential”) account for approximately $11.0 billion of the outstanding balances or 19% of the total loan portfolio 65 percent of such loans have FICO scores of 750 or better (higher) and loan-to-value (“LTV”) ratios of 70% or better (lower) Little meaningful exposure in the low FICO and high LTV segments Average LTV: 49% Home equity credit line portfolio: 1st lien = 42% of portfolio balance, 49% of portfolio commitments, with an average LTV of 46% 2nd lien = 58% of portfolio balance, 51% of portfolio commitments, with an average LTV of 53% <= 649 650-699 700-749 750-799 800-850 Row Total <= 50% 2% 3% 7% 14% 27% 52% 50.01-60% 0% 1% 3% 5% 8% 18% 60.01-70% 0% 1% 2% 5% 6% 14% 70.01-80% 0% 1% 2% 4% 5% 12% 80.01-90% 0% 0% 0% 1% 1% 3% >90% 0% 0% 0% 0% 0% 0% Column Total 2% 6% 14% 30% 49% 100% Term 1-4 Family (Mortgage) + HECL Refresh FICO Co m bi ne d Lo an to Va lu e (In de x- Ad ju st ed )
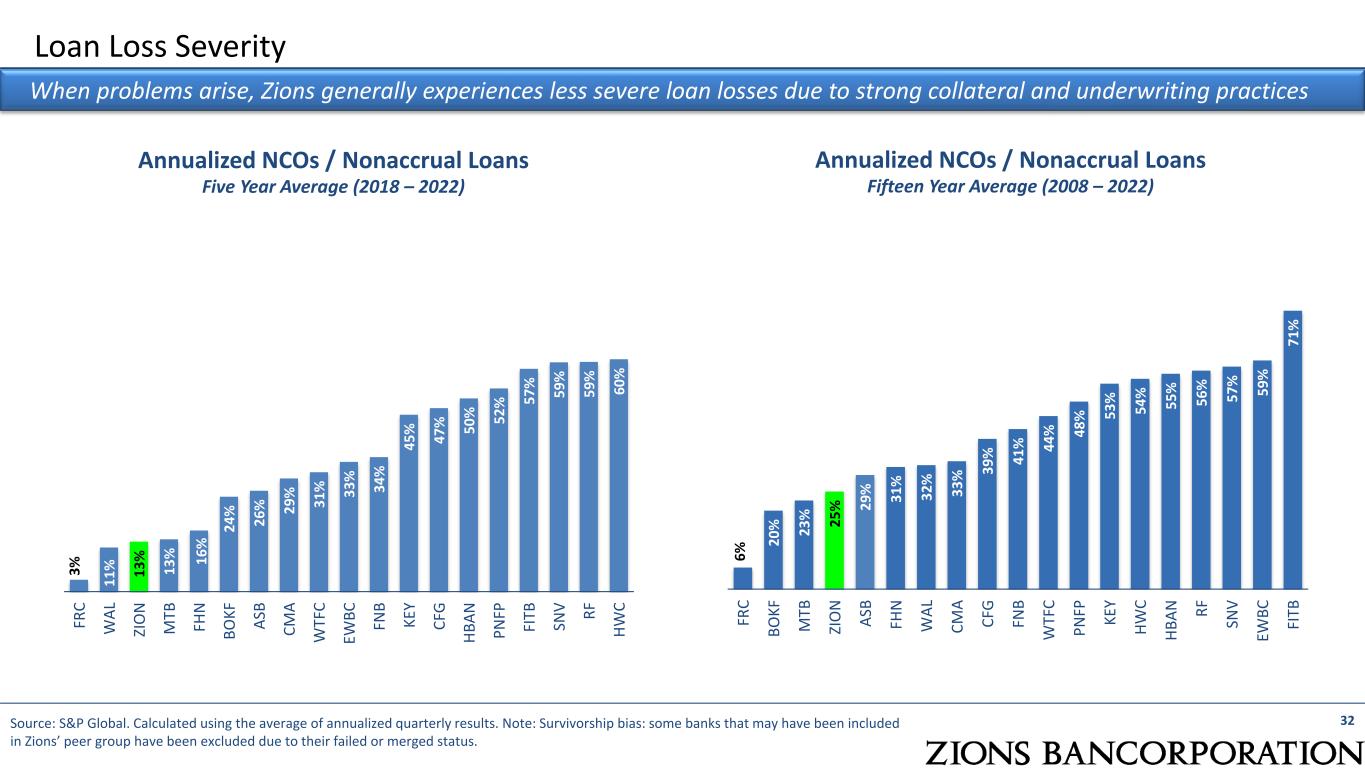
6% 20 % 23 % 25 % 29 % 31 % 32 % 33 % 39 % 41 % 44 % 48 % 53 % 54 % 55 % 56 % 57 % 59 % 71 % FR C BO KF M TB ZI O N AS B FH N W AL CM A CF G FN B W TF C PN FP KE Y HW C HB AN RF SN V EW BC FI TB 3% 11 % 13 % 13 % 16 % 24 % 26 % 29 % 31 % 33 % 34 % 45 % 47 % 50 % 52 % 57 % 59 % 59 % 60 % FR C W AL ZI O N M TB FH N BO KF AS B CM A W TF C EW BC FN B KE Y CF G HB AN PN FP FI TB SN V RF HW C Loan Loss Severity Annualized NCOs / Nonaccrual Loans Five Year Average (2018 – 2022) Annualized NCOs / Nonaccrual Loans Fifteen Year Average (2008 – 2022) 32Source: S&P Global. Calculated using the average of annualized quarterly results. Note: Survivorship bias: some banks that may have been included in Zions’ peer group have been excluded due to their failed or merged status. When problems arise, Zions generally experiences less severe loan losses due to strong collateral and underwriting practices

526 777 914 917 835 695 574 529 553 514 546 590 636 678 1.08 1.56 1.88 1.91 1.74 1.48 1.22 1.11 1.13 1.02 1.05 1.10 1.15 1.21 1/1/20 CECL 1Q20 2Q20 3Q20 4Q20 1Q21 2Q21 3Q21 4Q21 1Q22 2Q22 3Q22 4Q22 1Q23 Allowance for Credit Losses ACL (%) ex-PPP 33 Allowance for Credit Losses (“ACL”) The ACL increase vs. 4Q22 is primarily due to increased probability of an economic downturn in applied scenarios ($ millions)

Loan Growth in Detail Loan growth achieved in several categories: residential real estate, term CRE, consumer construction, and C&I (ex-O&G) Linked Quarter Loan Balance Growth, Excluding PPP Total Loans, excluding PPP: +1.3% Linked quarter: Excluding PPP loans, period-end loans increased $716 million or 1.3% Loan growth in dollars predominantly in 1-4 Family, Term Commercial Real Estate, Consumer Construction, and C&I (ex-O&G) Decline of 19% ($38 million) in SBA PPP loans G ro w th R at e: L in ke d Q ua rt er , n ot a nn ua liz ed Dollar Growth: Linked Quarter 34 C&I (ex-Oil & Gas), 1% Owner occupied, -1% CRE C&D, -8% CRE Term, 4% Home Equity, -3% 1-4 Family, 6% Energy (Oil & Gas), 1% Municipal, 0% Other, 8% -10% -8% -6% -4% -2% 0% 2% 4% 6% 8% 10% -$300 -$100 $100 $300 $500 $700 Note: circle size indicates relative proportion of loan portfolio as of 1Q23. PPP loans, not shown on graph, declined 19% in 1Q23 vs. 4Q22 ($ millions)
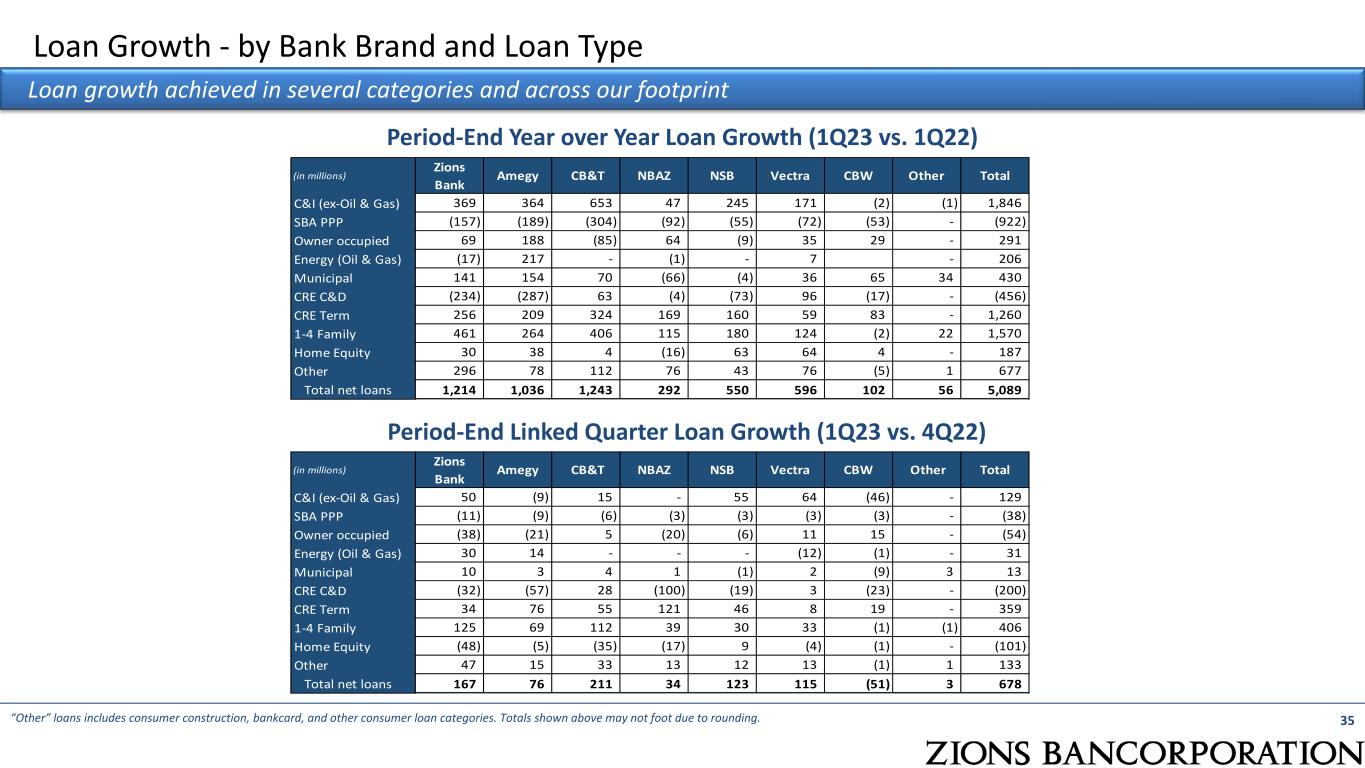
35 Loan Growth - by Bank Brand and Loan Type “Other” loans includes consumer construction, bankcard, and other consumer loan categories. Totals shown above may not foot due to rounding. Period-End Year over Year Loan Growth (1Q23 vs. 1Q22) Period-End Linked Quarter Loan Growth (1Q23 vs. 4Q22) (in millions) Zions Bank Amegy CB&T NBAZ NSB Vectra CBW Other Total C&I (ex-Oil & Gas) 369 364 653 47 245 171 (2) (1) 1,846 SBA PPP (157) (189) (304) (92) (55) (72) (53) - (922) Owner occupied 69 188 (85) 64 (9) 35 29 - 291 Energy (Oil & Gas) (17) 217 - (1) - 7 - 206 Municipal 141 154 70 (66) (4) 36 65 34 430 CRE C&D (234) (287) 63 (4) (73) 96 (17) - (456) CRE Term 256 209 324 169 160 59 83 - 1,260 1-4 Family 461 264 406 115 180 124 (2) 22 1,570 Home Equity 30 38 4 (16) 63 64 4 - 187 Other 296 78 112 76 43 76 (5) 1 677 Total net loans 1,214 1,036 1,243 292 550 596 102 56 5,089 (in millions) Zions Bank Amegy CB&T NBAZ NSB Vectra CBW Other Total C&I (ex-Oil & Gas) 50 (9) 15 - 55 64 (46) - 129 SBA PPP (11) (9) (6) (3) (3) (3) (3) - (38) Owner occupied (38) (21) 5 (20) (6) 11 15 - (54) Energy (Oil & Gas) 30 14 - - - (12) (1) - 31 Municipal 10 3 4 1 (1) 2 (9) 3 13 CRE C&D (32) (57) 28 (100) (19) 3 (23) - (200) CRE Term 34 76 55 121 46 8 19 - 359 1-4 Family 125 69 112 39 30 33 (1) (1) 406 Home Equity (48) (5) (35) (17) 9 (4) (1) - (101) Other 47 15 33 13 12 13 (1) 1 133 Total net loans 167 76 211 34 123 115 (51) 3 678 Loan growth achieved in several categories and across our footprint
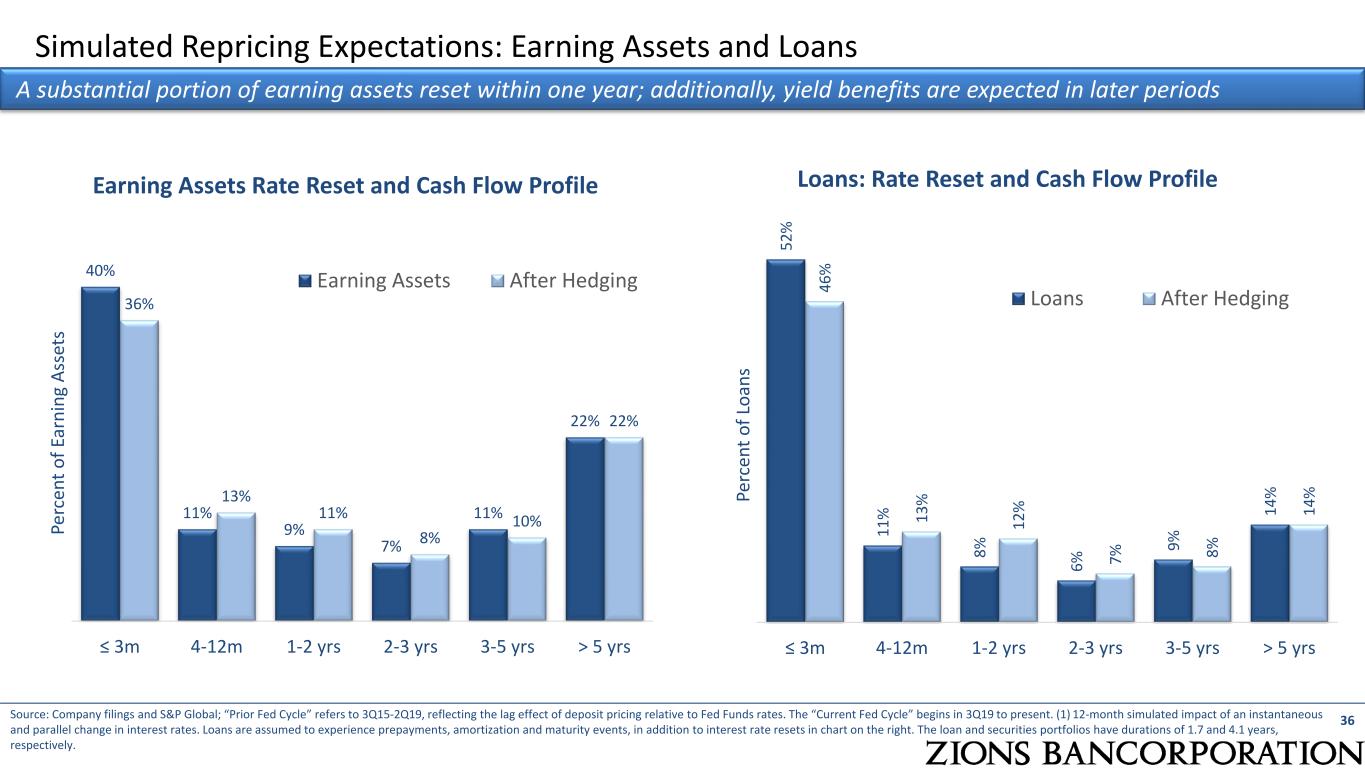
Simulated Repricing Expectations: Earning Assets and Loans 36 A substantial portion of earning assets reset within one year; additionally, yield benefits are expected in later periods Source: Company filings and S&P Global; “Prior Fed Cycle” refers to 3Q15-2Q19, reflecting the lag effect of deposit pricing relative to Fed Funds rates. The “Current Fed Cycle” begins in 3Q19 to present. (1) 12-month simulated impact of an instantaneous and parallel change in interest rates. Loans are assumed to experience prepayments, amortization and maturity events, in addition to interest rate resets in chart on the right. The loan and securities portfolios have durations of 1.7 and 4.1 years, respectively. 52 % 11 % 8% 6% 9% 14 % 46 % 13 % 12 % 7% 8% 14 % ≤ 3m 4-12m 1-2 yrs 2-3 yrs 3-5 yrs > 5 yrs Pe rc en t o f L oa ns Loans: Rate Reset and Cash Flow Profile Loans After Hedging 40% 11% 9% 7% 11% 22% 36% 13% 11% 8% 10% 22% ≤ 3m 4-12m 1-2 yrs 2-3 yrs 3-5 yrs > 5 yrs Pe rc en t o f E ar ni ng A ss et s Earning Assets Rate Reset and Cash Flow Profile Earning Assets After Hedging

Interest Rate Swaps 37 We continue to create some protection from falling rates 1 Cash flow hedges consist of receive-fixed swaps hedging pools of floating rate loans. Interest rate sensitivity managed in part with interest rate hedges: $2.6B in interest-rate swaps on loans terminated in March 2023 with a weighted average rate of 1.82% Average Outstanding Notionial Weighted average Fixed Rate Received 2023Q2 $4,433 1.92% 2023Q3 $4,133 1.87% 2023Q4 $3,833 1.75% 2024Q1 $3,233 1.55% 2024Q2 $2,933 1.45% 2024Q3 $2,433 1.38% 2024Q4 $1,933 1.29% 2025Q1 $1,350 1.37% 0.0% 0.5% 1.0% 1.5% 2.0% 2.5% 0.0 2.0 4.0 6.0 2 02 3Q 2 2 02 3Q 3 2 02 3Q 4 2 02 4Q 1 2 02 4Q 2 2 02 4Q 3 2 02 4Q 4 2 02 5Q 1 2 02 5Q 2 Av er ag e Fi xe d Ra te (% ) Av g N ot io na l ( $B ) Average total swaps in effect during quarter Average Fixed Rate (right scale)
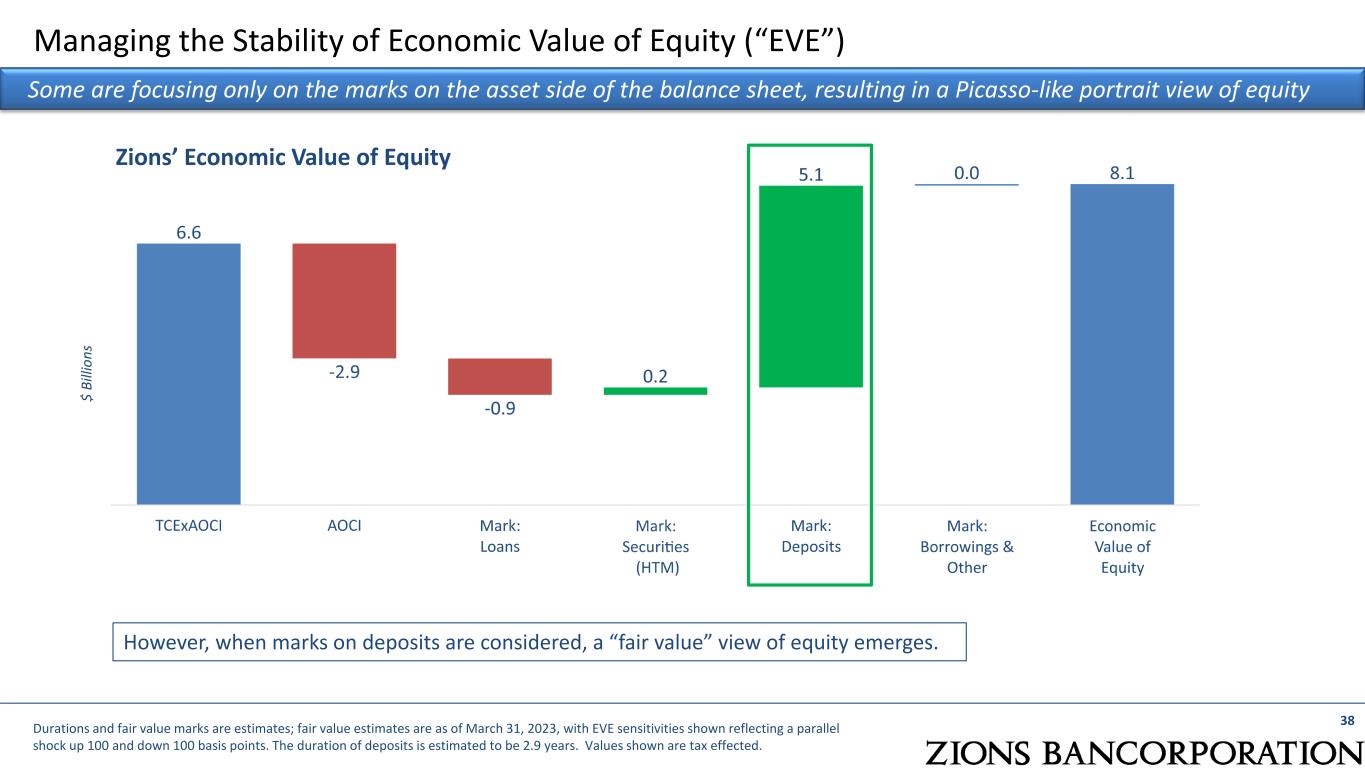
38 Managing the Stability of Economic Value of Equity (“EVE”) Some are focusing only on the marks on the asset side of the balance sheet, resulting in a Picasso-like portrait view of equity Durations and fair value marks are estimates; fair value estimates are as of March 31, 2023, with EVE sensitivities shown reflecting a parallel shock up 100 and down 100 basis points. The duration of deposits is estimated to be 2.9 years. Values shown are tax effected. Zions’ Economic Value of Equity $ Bi lli on s However, when marks on deposits are considered, a “fair value” view of equity emerges.
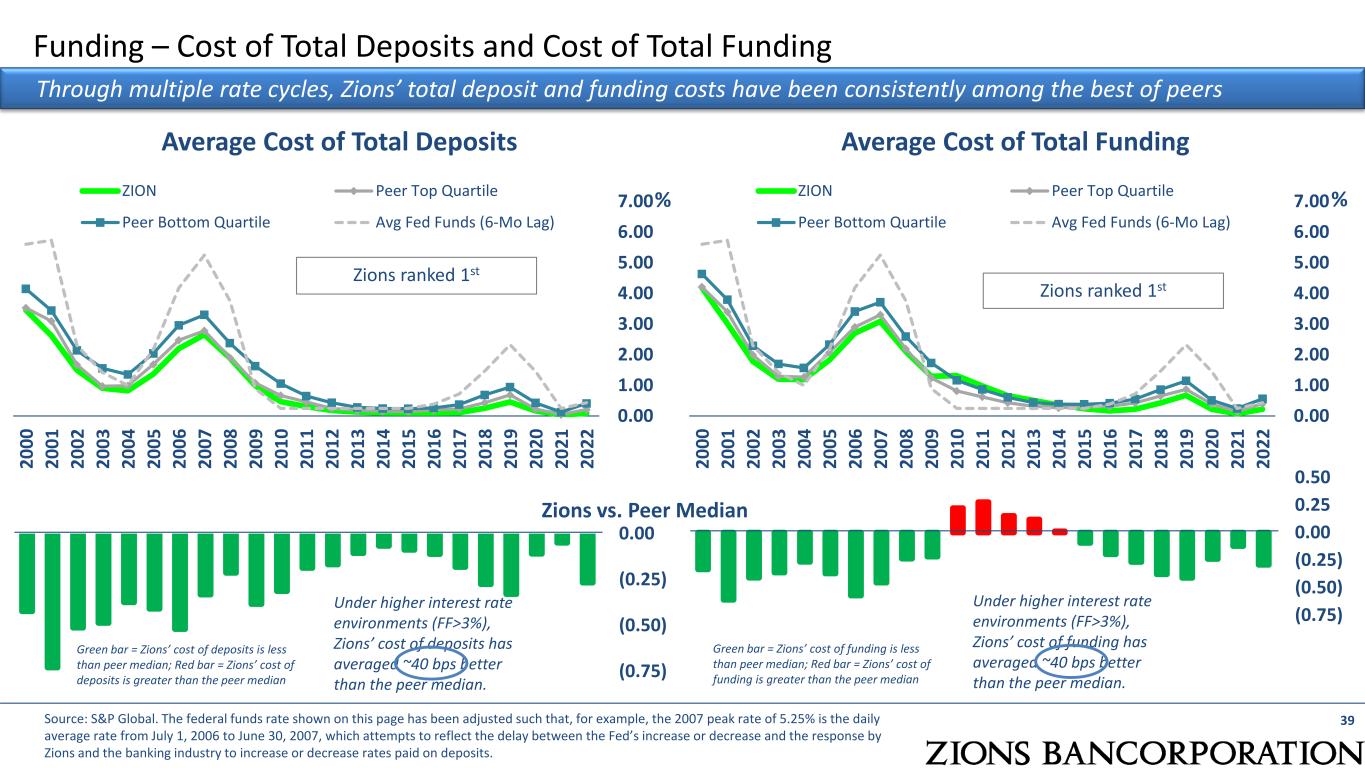
Funding – Cost of Total Deposits and Cost of Total Funding Through multiple rate cycles, Zions’ total deposit and funding costs have been consistently among the best of peers Source: S&P Global. The federal funds rate shown on this page has been adjusted such that, for example, the 2007 peak rate of 5.25% is the daily average rate from July 1, 2006 to June 30, 2007, which attempts to reflect the delay between the Fed’s increase or decrease and the response by Zions and the banking industry to increase or decrease rates paid on deposits. 0.00 1.00 2.00 3.00 4.00 5.00 6.00 7.00 20 00 20 01 20 02 20 03 20 04 20 05 20 06 20 07 20 08 20 09 20 10 20 11 20 12 20 13 20 14 20 15 20 16 20 17 20 18 20 19 20 20 20 21 20 22 ZION Peer Top Quartile Peer Bottom Quartile Avg Fed Funds (6-Mo Lag) Zions ranked 1st Average Cost of Total Funding % Under higher interest rate environments (FF>3%), Zions’ cost of deposits has averaged ~40 bps better than the peer median. (0.75) (0.50) (0.25) 0.00 0.25 0.50 Zions vs. Peer Median Green bar = Zions’ cost of deposits is less than peer median; Red bar = Zions’ cost of deposits is greater than the peer median 0.00 1.00 2.00 3.00 4.00 5.00 6.00 7.00 20 00 20 01 20 02 20 03 20 04 20 05 20 06 20 07 20 08 20 09 20 10 20 11 20 12 20 13 20 14 20 15 20 16 20 17 20 18 20 19 20 20 20 21 20 22 ZION Peer Top Quartile Peer Bottom Quartile Avg Fed Funds (6-Mo Lag) Zions ranked 1st Average Cost of Total Deposits (0.75) (0.50) (0.25) 0.00 Under higher interest rate environments (FF>3%), Zions’ cost of funding has averaged ~40 bps better than the peer median. % Green bar = Zions’ cost of funding is less than peer median; Red bar = Zions’ cost of funding is greater than the peer median 39
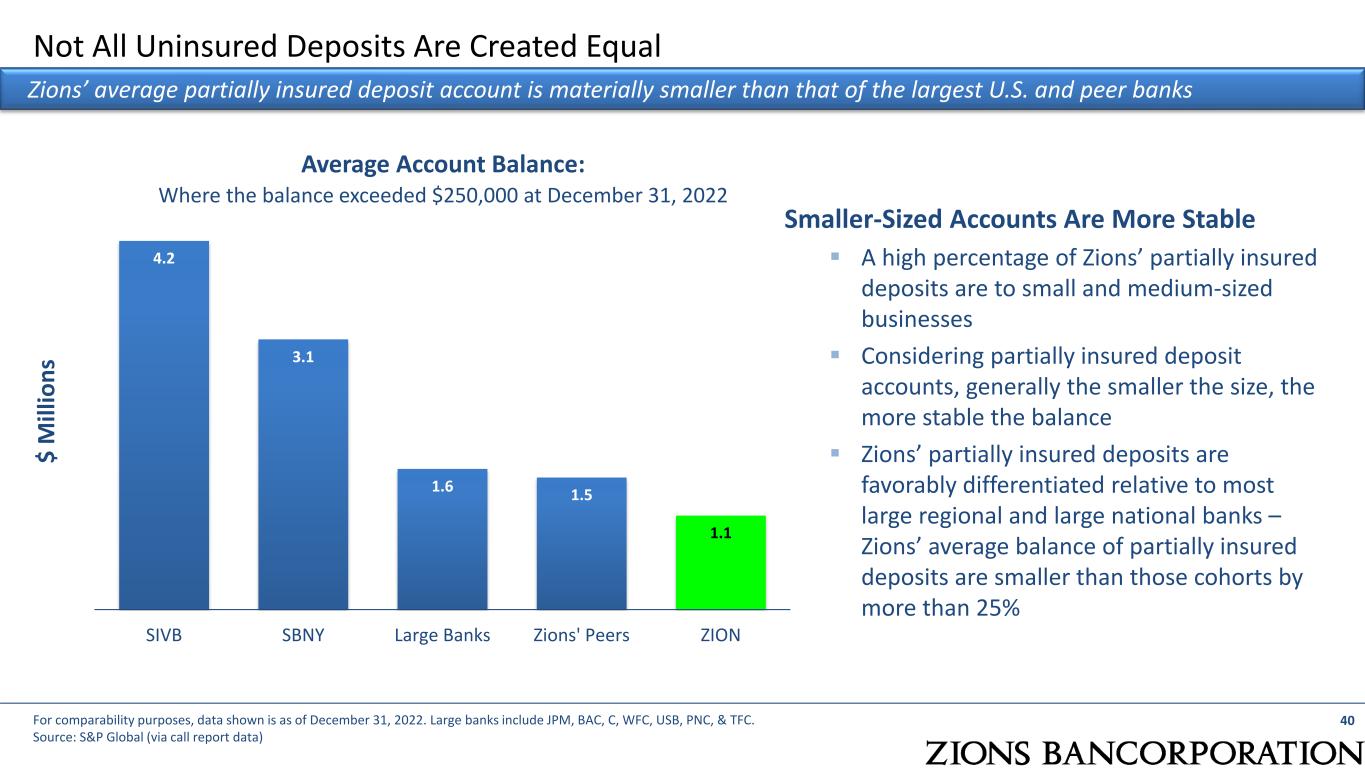
Not All Uninsured Deposits Are Created Equal 40 Zions’ average partially insured deposit account is materially smaller than that of the largest U.S. and peer banks For comparability purposes, data shown is as of December 31, 2022. Large banks include JPM, BAC, C, WFC, USB, PNC, & TFC. Source: S&P Global (via call report data) 4.2 3.1 1.6 1.5 1.1 SIVB SBNY Large Banks Zions' Peers ZION $ M ill io ns Average Account Balance: Where the balance exceeded $250,000 at December 31, 2022 Smaller-Sized Accounts Are More Stable A high percentage of Zions’ partially insured deposits are to small and medium-sized businesses Considering partially insured deposit accounts, generally the smaller the size, the more stable the balance Zions’ partially insured deposits are favorably differentiated relative to most large regional and large national banks – Zions’ average balance of partially insured deposits are smaller than those cohorts by more than 25%
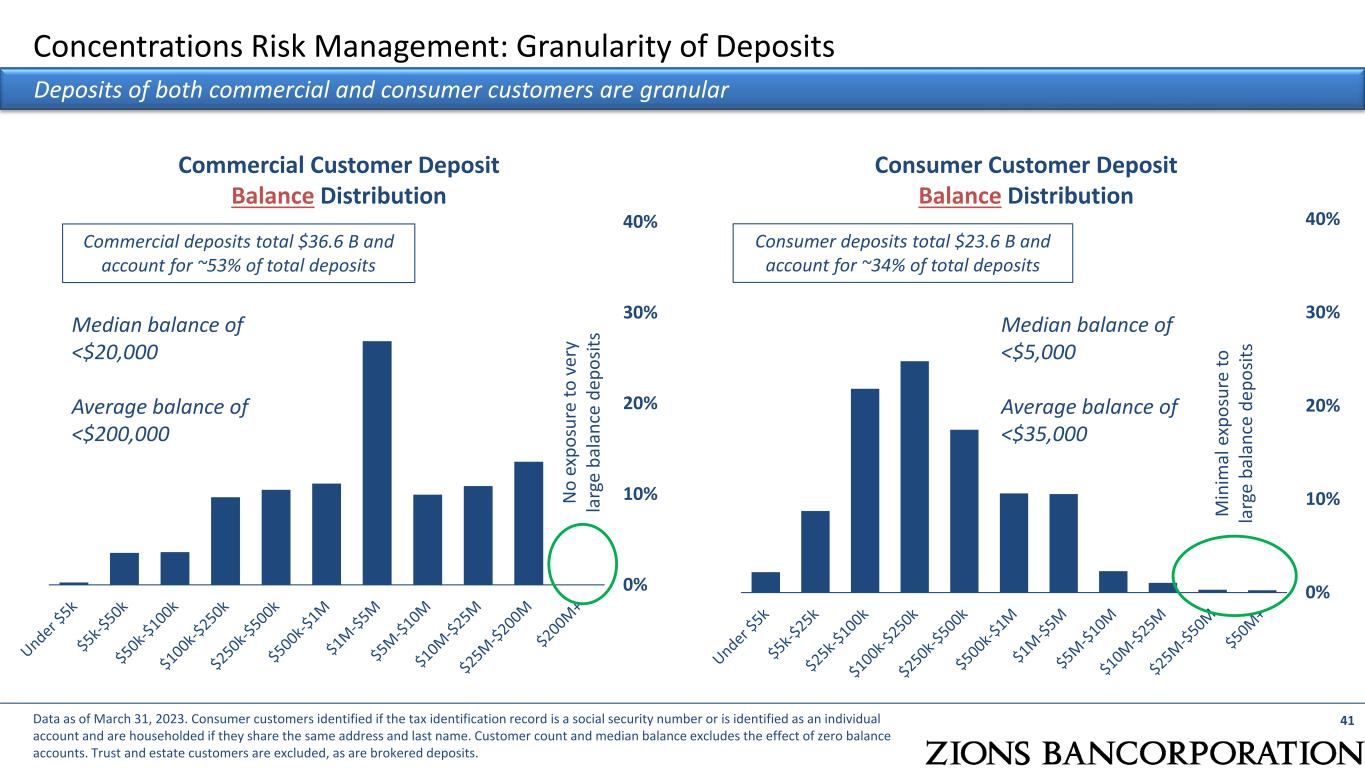
0% 10% 20% 30% 40% Concentrations Risk Management: Granularity of Deposits 41 Deposits of both commercial and consumer customers are granular Consumer Customer Deposit Balance Distribution Data as of March 31, 2023. Consumer customers identified if the tax identification record is a social security number or is identified as an individual account and are householded if they share the same address and last name. Customer count and median balance excludes the effect of zero balance accounts. Trust and estate customers are excluded, as are brokered deposits. Consumer deposits total $23.6 B and account for ~34% of total deposits M in im al e xp os ur e to la rg e ba la nc e de po sit s 0% 10% 20% 30% 40% Commercial Customer Deposit Balance Distribution N o ex po su re to v er y la rg e ba la nc e de po sit s Commercial deposits total $36.6 B and account for ~53% of total deposits Median balance of <$20,000 Average balance of <$200,000 Median balance of <$5,000 Average balance of <$35,000

42 Non-GAAP Financial Measures In millions, except per share amounts 1Q23 4Q22 3Q22 2Q22 1Q22 Pre-Provision Net Revenue (PPNR) (a) Total noninterest expense $512 $471 $479 $464 $464 LESS adjustments: Severance costs 1 1 Other real estate expense 1 Amortization of core deposit and other intangibles 2 1 Pension Termination related expense Restructuring costs SBIC Investment Success Fee Accrual (1) 1 (1) (b) Total adjustments 3 (1) 2 1 0 (a-b)=(c) Adjusted noninterest expense 509 472 477 463 464 (d) Net interest income 679 720 663 593 544 (e) Fully taxable-equivalent adjustments 9 10 10 9 8 (d+e)=(f) Taxable-equivalent net interest income (TE NII) 688 730 673 602 552 (g) Noninterest Income 160 153 165 172 142 (f+g)=(h) Combined Income $848 $883 $838 $774 $694 LESS adjustments: Fair value and nonhedge derivative income (loss) (3) (4) 4 10 6 Securities gains (losses), net 1 (5) 6 1 (17) (i) Total adjustments (2) (9) 10 11 (11) (h-i)=(j) Adjusted revenue $850 $892 $828 $763 $705 (j-c) Adjusted pre- provision net revenue (PPNR) $341 $420 $351 $300 $241 (c)/(j) Efficiency Ratio 59.9% 52.9% 57.6% 60.7% 65.8%
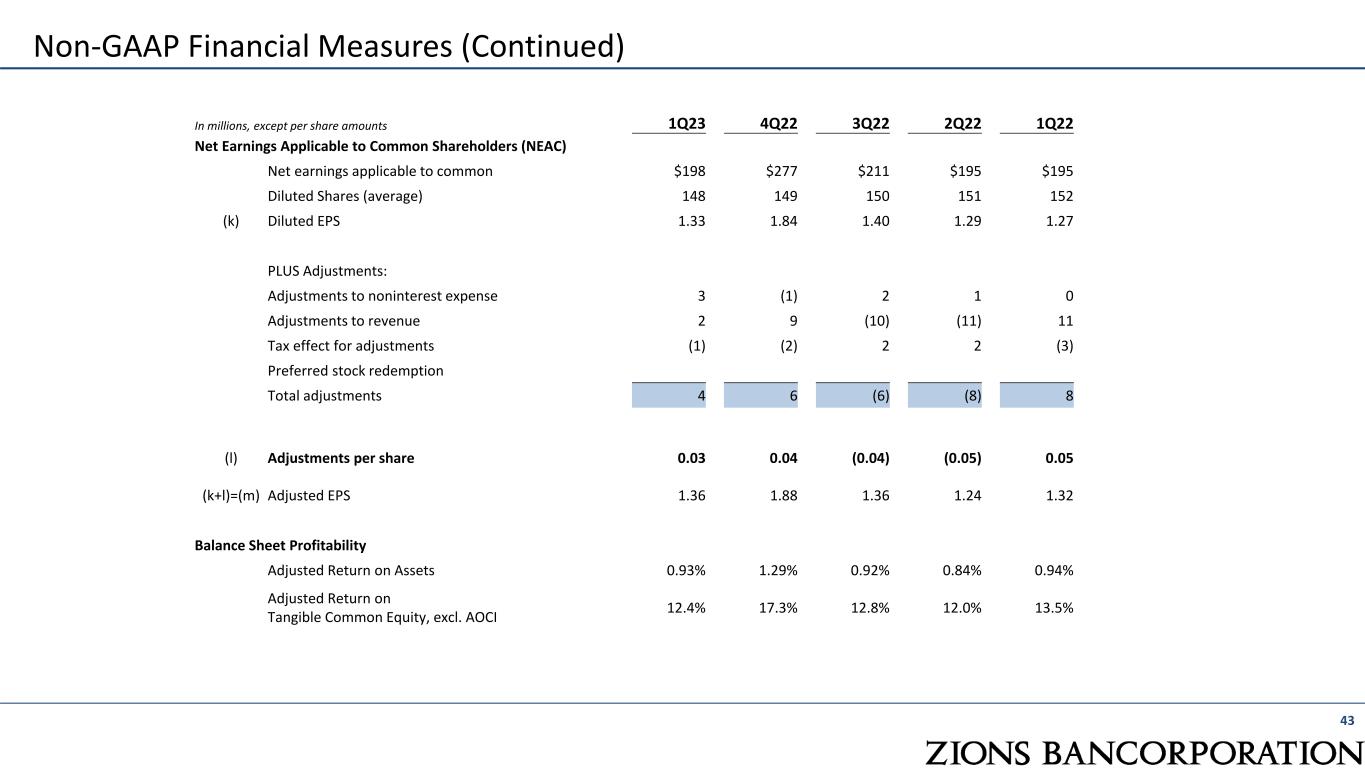
43 Non-GAAP Financial Measures (Continued) In millions, except per share amounts 1Q23 4Q22 3Q22 2Q22 1Q22 Net Earnings Applicable to Common Shareholders (NEAC) Net earnings applicable to common $198 $277 $211 $195 $195 Diluted Shares (average) 148 149 150 151 152 (k) Diluted EPS 1.33 1.84 1.40 1.29 1.27 PLUS Adjustments: Adjustments to noninterest expense 3 (1) 2 1 0 Adjustments to revenue 2 9 (10) (11) 11 Tax effect for adjustments (1) (2) 2 2 (3) Preferred stock redemption Total adjustments 4 6 (6) (8) 8 (l) Adjustments per share 0.03 0.04 (0.04) (0.05) 0.05 (k+l)=(m) Adjusted EPS 1.36 1.88 1.36 1.24 1.32 Balance Sheet Profitability Adjusted Return on Assets 0.93% 1.29% 0.92% 0.84% 0.94% Adjusted Return on Tangible Common Equity, excl. AOCI 12.4% 17.3% 12.8% 12.0% 13.5%


