
Investor Conference Salt Lake City
19 February 2004
The Intermountain West’s Largest Banking Company
• Total Assets of $29 Billion
• 28th Largest Domestic Bank by Deposits
• S&P 500 Index
• NASDAQ Financial 100 Index
• 400+ Offices and 550+ ATMs in 8 States
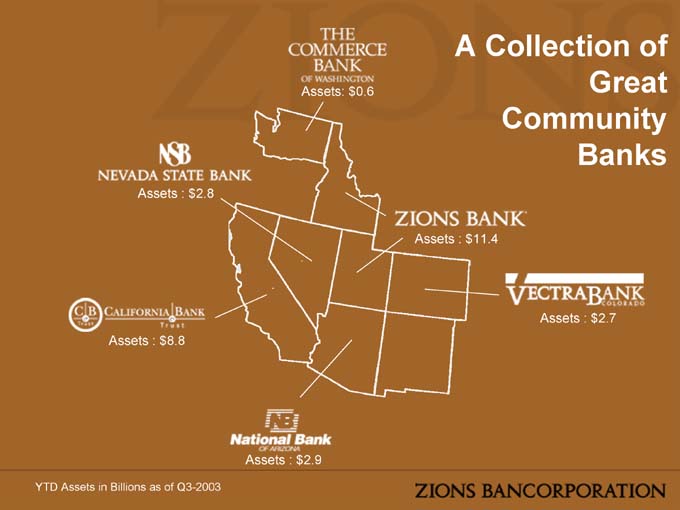
A Collection of Great Community Banks
Assets: $0.6
Assets : $11.4
Assets : $2.7
Assets : $2.9
Assets : $8.8
Assets : $2.8
YTD Assets in Billions as of Q3-2003
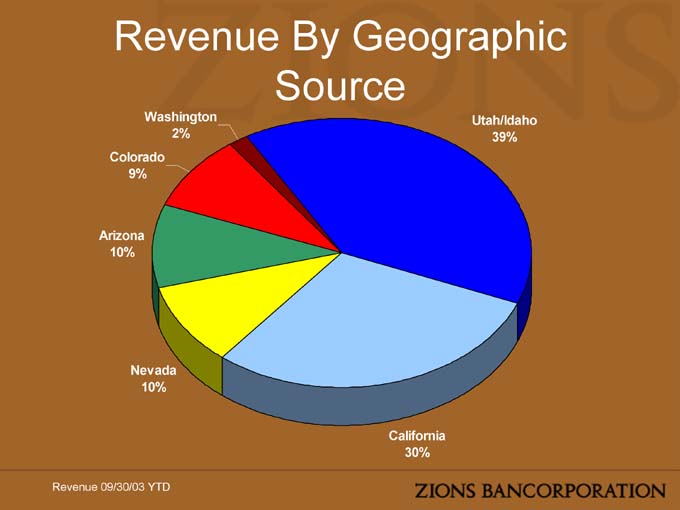
Revenue By Geographic Source
Washington Utah/Idaho
2% 39% Colorado 9%
Arizona 10%
Nevada 10%
California 30%
Revenue 09/30/03 YTD
Advantages of Community Banking Structure
• Better Talent
• Flexibility to Address Market Opportunities
• Strong Customer Relationships
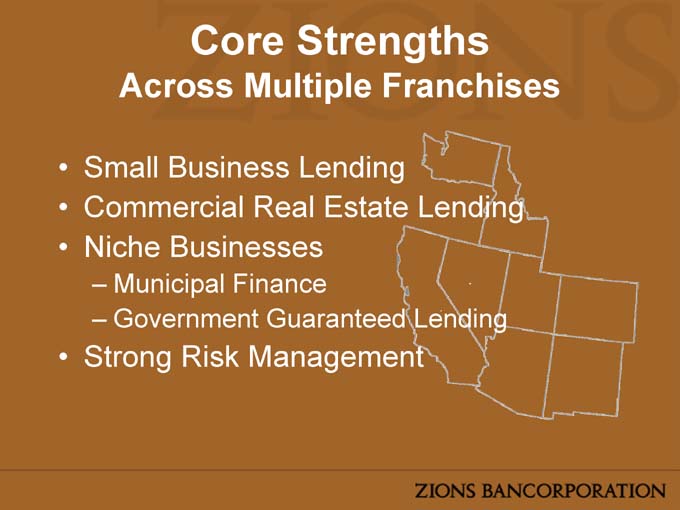
Core Strengths
Across Multiple Franchises
• Small Business Lending
• Commercial Real Estate Lending
• Niche Businesses
– Municipal Finance
– Government Guaranteed Lending
• Strong Risk Management
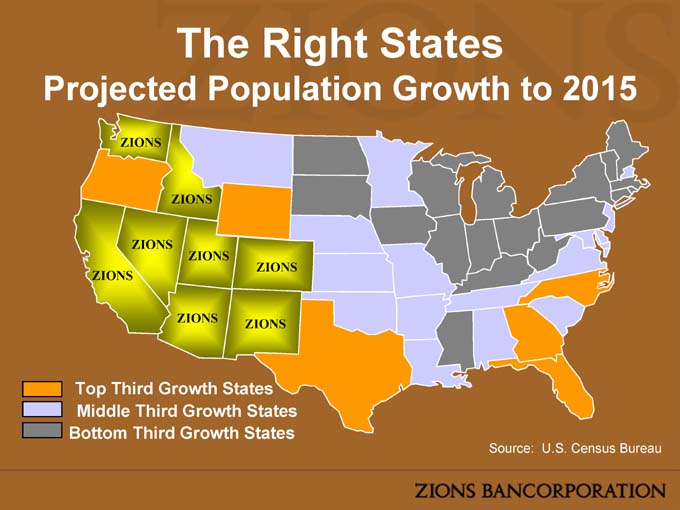
The Right States
Projected Population Growth to 2015
Top Third Growth States
Middle Third Growth States
Bottom Third Growth States
Source: U.S. Census Bureau
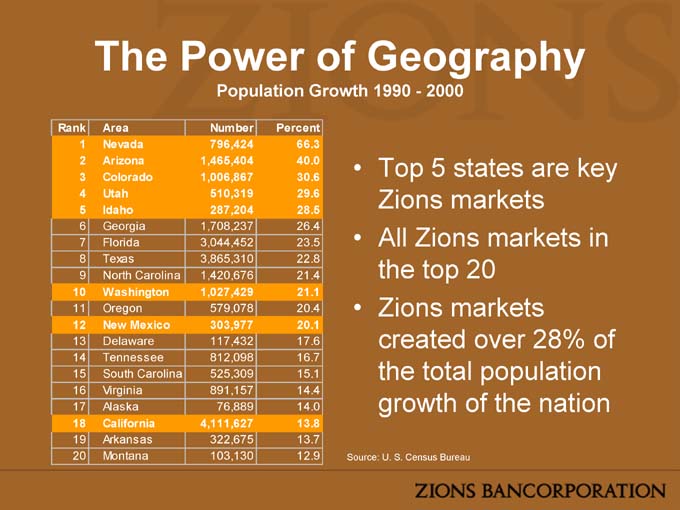
The Power of Geography
Population Growth 1990—2000
Rank Area Number Percent
1 Nevada 796,424 66.3
2 Arizona 1,465,404 40.0
3 Colorado 1,006,867 30.6
4 Utah 510,319 29.6
5 Idaho 287,204 28.5
6 Georgia 1,708,237 26.4
7 Florida 3,044,452 23.5
8 Texas 3,865,310 22.8
9 North Carolina 1,420,676 21.4
10 Washington 1,027,429 21.1
11 Oregon 579,078 20.4
12 New Mexico 303,977 20.1
13 Delaware 117,432 17.6
14 Tennessee 812,098 16.7
15 South Carolina 525,309 15.1
16 Virginia 891,157 14.4
17 Alaska 76,889 14.0
18 California 4,111,627 13.8
19 Arkansas 322,675 13.7
20 Montana 103,130 12.9
• Top 5 states are key Zions markets
• All Zions markets in the top 20
• Zions markets created over 28% of the total population growth of the nation
Source: U. S. Census Bureau
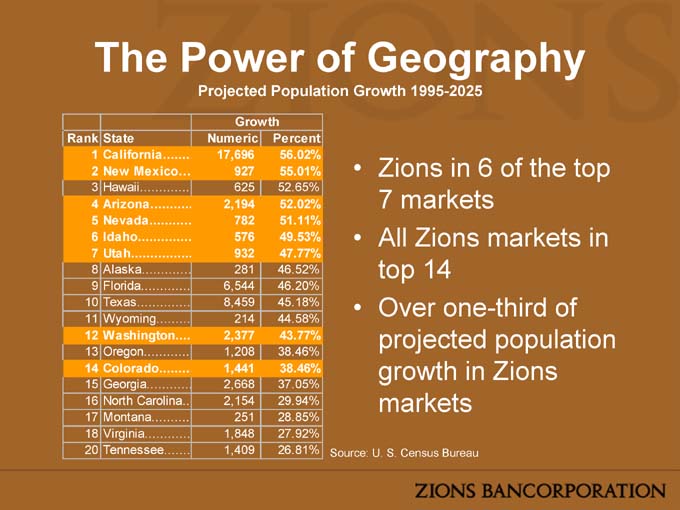
The Power of Geography
Projected Population Growth 1995-2025
Growth
Rank State Numeric Percent
1 California 17,696 56.02%
2 New Mexico… 927 55.01%
3 Hawaii 625 52.65%
4 Arizona 2,194 52.02%
5 Nevada 782 51.11%
6 Idaho 576 49.53%
7 Utah 932 47.77%
8 Alaska 281 46.52%
9 Florida 6,544 46.20%
10 Texas 8,459 45.18%
11 Wyoming 214 44.58%
12 Washington 2,377 43.77%
13 Oregon 1,208 38.46%
14 Colorado 1,441 38.46%
15 Georgia 2,668 37.05%
16 North Carolina… 2,154 29.94%
17 Montana 251 28.85%
18 Virginia 1,848 27.92%
20 Tennessee 1,409 26.81%
• Zions in 6 of the top 7 markets
• All Zions markets in top 14
• Over one-third of projected population growth in Zions markets
Source: U. S. Census Bureau
National Rankings
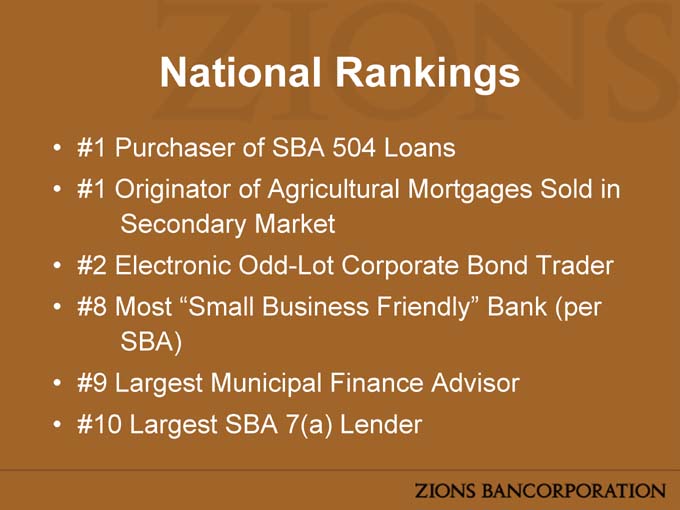
• #1 Purchaser of SBA 504 Loans
• #1 Originator of Agricultural Mortgages Sold in Secondary Market
• #2 Electronic Odd-Lot Corporate Bond Trader
• #8 Most “Small Business Friendly” Bank (per SBA)
• #9 Largest Municipal Finance Advisor
• #10 Largest SBA 7(a) Lender
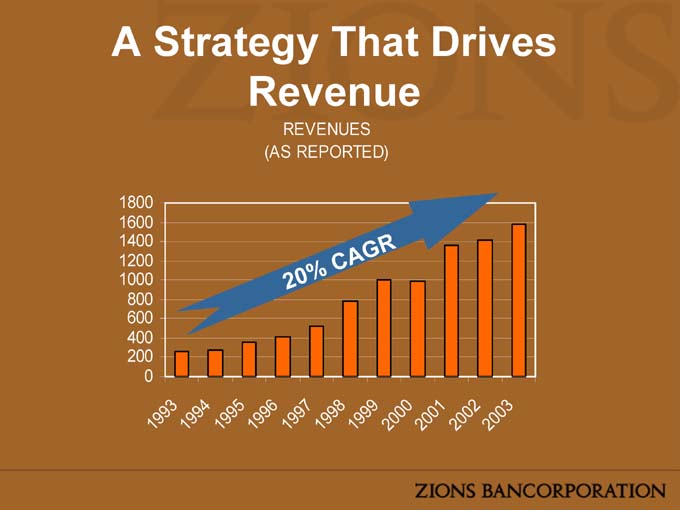
A Strategy That Drives Revenue
REVENUES (AS REPORTED)
1800
1600
1400
1200
1000
800
600
400
200
0 1993 1994 1995 1996 1997 1998
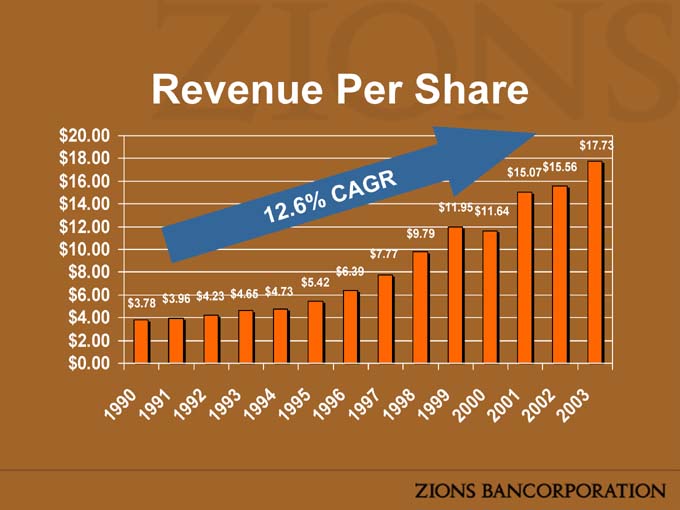
Revenue Per Share
$20.00
$18.00
$16.00
$14.00
$12.00
$10.00
$8.00
$6.00
$4.00
$2.00
$0.00
$1990 1991 1992 1993 1994 1995 1996 1997 1998 1999 2000 2001 2002 2003

What has changed?
Last Ten Years
• Numerous acquisitions using pooling
• Significant investment in niche businesses
• Strong revenue growth but high efficiency ratio
Zions Today
• Less reliance on acquisitions
• Stronger focus on organic growth
• Stronger focus on expense management
• More disciplined investing
Acquisitions
• “Keeping Hope • Emphasis on
Alive” – the impact community bank “in-
of Bank of America / fill” transactions
Fleet • A smaller role than
• Focus on IRR, in the past?
marginal returns on
capital—not just
accretion/dilution
Whose shareholders are we benefiting?
Focused Organic Growth
• Acquire or hire?
– The best way to spend $100 million
– Flagstaff experience
• The de novo tidal wave
Investing for the Future
• Electronic bond trading
– “Shoestring” start-up
– Investment in ICAP in 2000
–$ 5 million income from investment in 1H03
–$ 68 million gain on sale of stock in 2003
– The resulting business:
• 1500 trades daily
•$ 27 million in annual revenue
Investing for the Future:
A Sampling
• Wealth management
– The tarnished reputation of current players
– Close customer ties of a bank which focuses on small and mid-sized businesses
• NetDeposit
– Impact of Check 21
– Bank of America’s use of Zions’ technology
Zions Today
• The best geography
– The country still tilts to the west
• A management model that drives revenue
– Community banks with top 40 resources
• A focus on organic growth
– Acquiring producers vs. companies
• Innovative investing in the future
– Controlled investment in new products and services
Today’s Agenda
• Meet and hear from the bank presidents
• Meet and hear from managers of key niche businesses
• Discussion about issues of importance to all of us

Investor Conference
19 February
2004 Salt Lake City
2004 Analyst Day Presentation
February 19, 2004
Scott Anderson, President and CEO
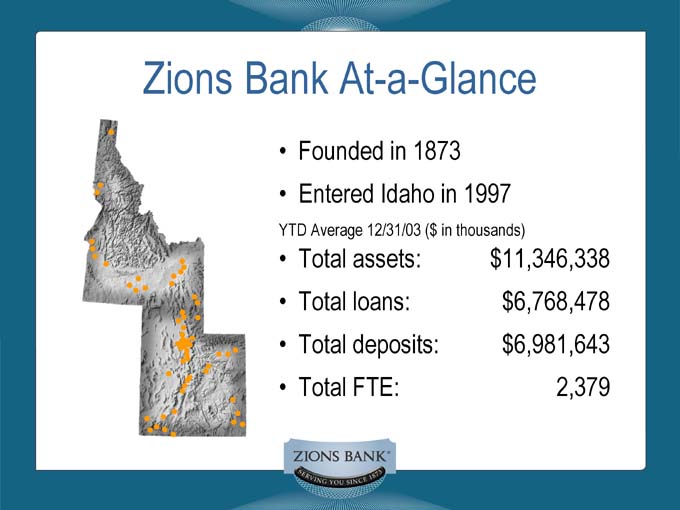
Zions Bank At-a-Glance
• Founded in 1873
• Entered Idaho in 1997
YTD Average 12/31/03 ($ in thousands)
• Total assets: $11,346,338
• Total loans: $6,768,478
• Total deposits: $6,981,643
• Total FTE: 2,379

Zions Bank—Utah
YTD Average 12/31/03 ($ in millions)
Branches 125
Deposits (% of total) $ 6,621 (94.8%)
Loans (% of total) $ 6,172 (91.2%)
Net Income(% of total) $ 148.9 (95.2%)
FTE (% of total) 2,191 (92.1%)
#1 bank in Utah (ranked by deposits)
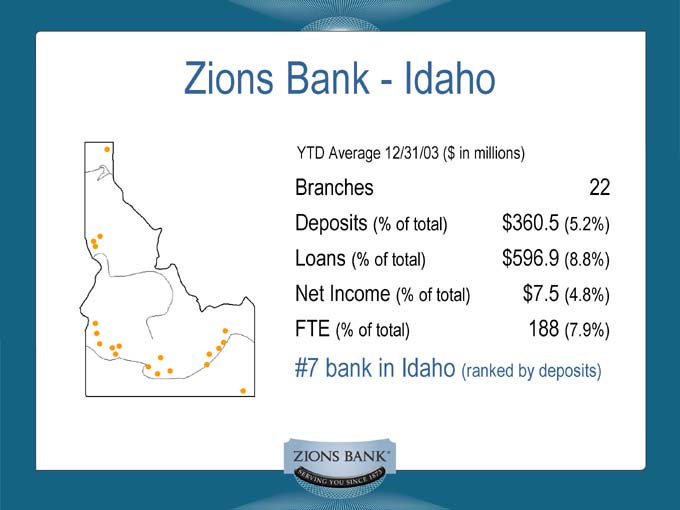
Zions Bank—Idaho
YTD Average 12/31/03 ($ in millions)
Branches 22
Deposits (% of total) $ 360.5 (5.2%)
Loans (% of total) $ 596.9 (8.8%)
Net Income(% of total) $7.5 (4.8%)
FTE (% of total) 188 (7.9%)
#7 bank in Idaho (ranked by deposits)
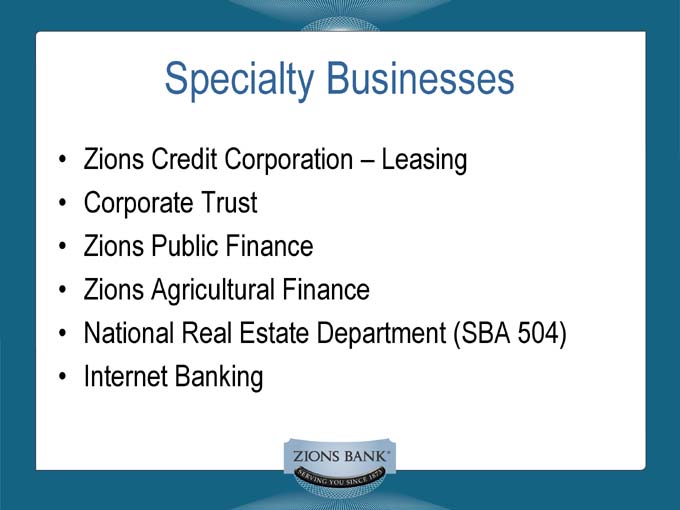
Specialty Businesses
• Zions Credit Corporation – Leasing
• Corporate Trust
• Zions Public Finance
• Zions Agricultural Finance
• National Real Estate Department (SBA 504)
• Internet Banking
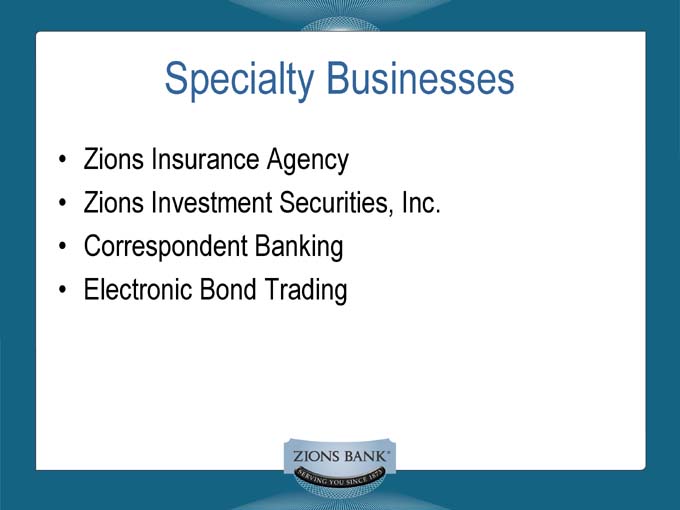
Specialty Businesses
• Zions Insurance Agency
• Zions Investment Securities, Inc.
• Correspondent Banking
• Electronic Bond Trading
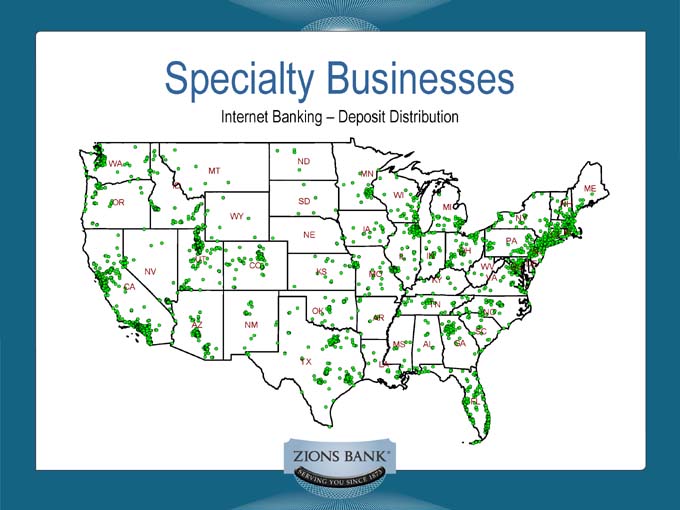
Specialty Businesses
Internet Banking – Deposit Distribution
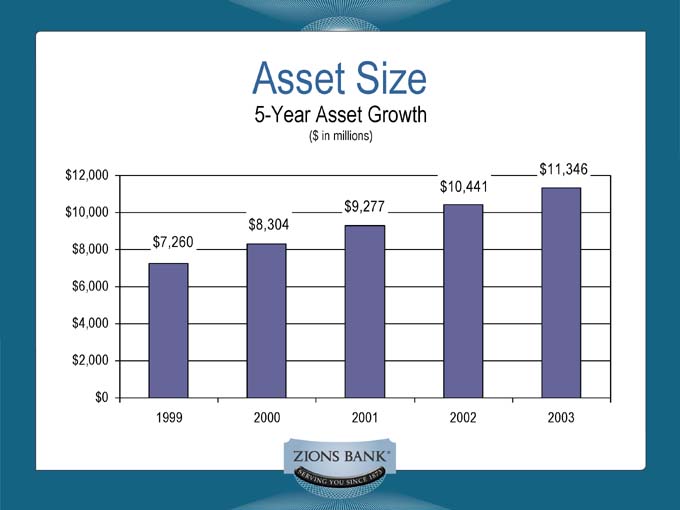
Asset Size
5-Year Asset Growth
($ in millions)
$ 12,000 $11,346
$9,277 $10,441
$ 10,000 $8,304
$ 8,000 $7,260
$ 6,000
$ 4,000
$ 2,000
$ 0
1999 2000 2001 2002 2003
Utah Economic Outlook
• In 2003, Utah experienced first meaningful rise in employment in nearly three years .
• Projecting 15,000 to 18,000 net new jobs during 2004.
• Among top eight states in economic performance, business vitality, and development capacity.
• New home construction activity across the state continues to be rock solid.
Source: Winter 2004 Zions Bank Insight – Economic News of Utah and the Nation
Idaho Economic Outlook
• In 2003, Idaho experienced one of largest employment gains in over three years .
• Projecting 11,000 to 13,000 net new jobs during 2004.
• Idaho continues to benefit from stronger U.S. economic growth.
Source: Winter 2004 Zions Bank Insight – Economic News of Idaho and the Nation
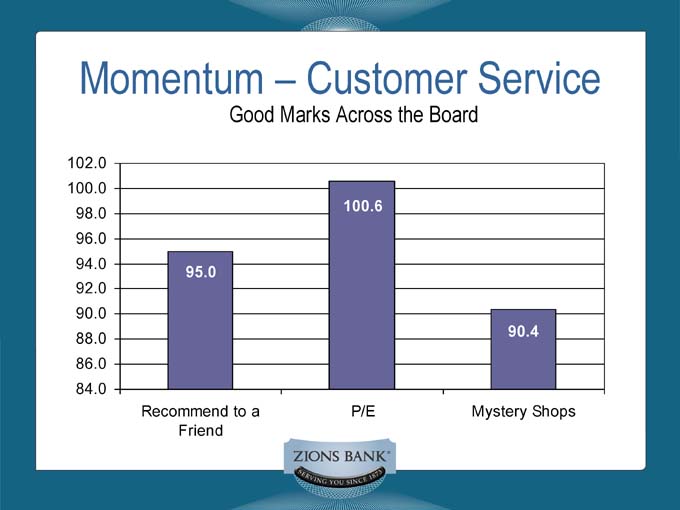
Momentum – Customer Service
Good Marks Across the Board
102.0
100.0
98.0 100.6
96.0
94.0
95.0
92.0
90.0
88.0 90.4
86.0
84.0
Recommend to a P/E Mystery Shops
Friend
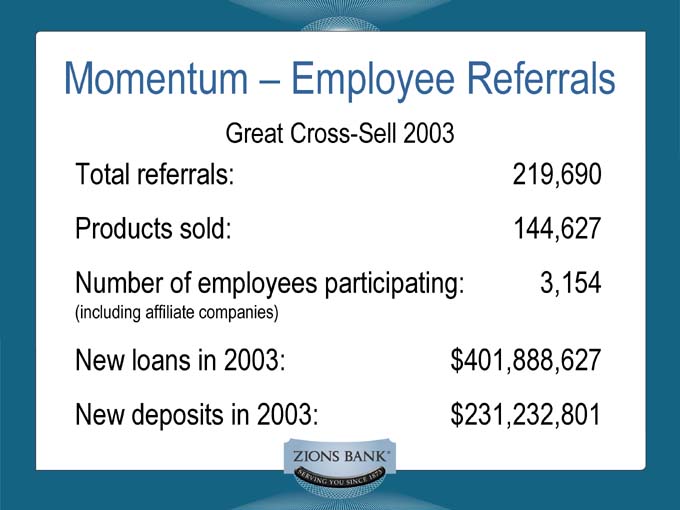
Momentum – Employee Referrals
Great Cross-Sell 2003
Total referrals: 219,690
Products sold: 144,627
Number of employees participating: 3,154
(including affiliate companies)
New loans in 2003: $ 401,888,627
New deposits in 2003: $ 231,232,801
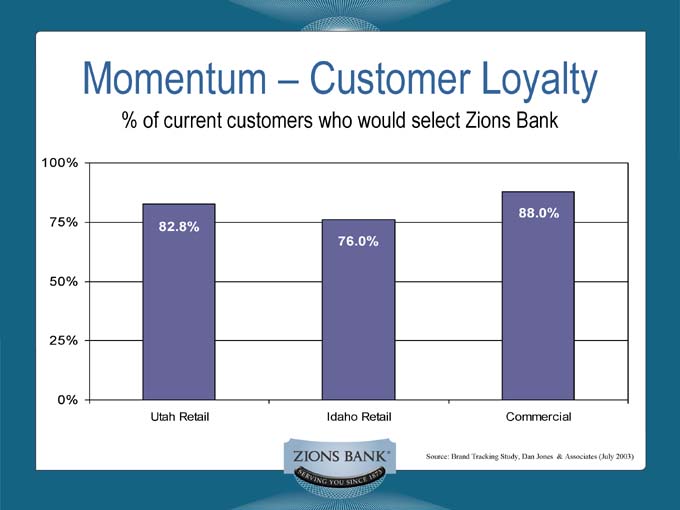
Momentum – Customer Loyalty
% of current customers who would select Zions Bank
100% 82.8%
88.0%
75% 76.0%
50%
25%
0% Utah Retail Idaho Retail Commercial
Source: Brand Tracking Study, Dan Jones & Associates (July 2003)
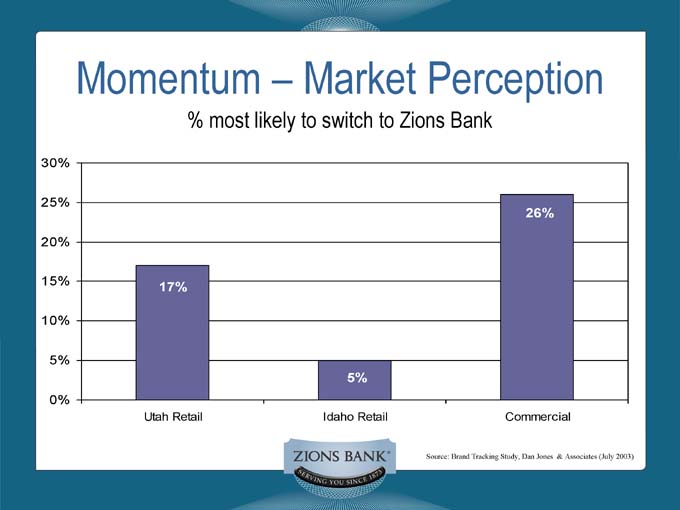
Momentum – Market Perception
% most likely to switch to Zions Bank
30%
25%
26%
20%
15%
17%
10%
5%
5%
0%
Utah Retail Idaho Retail Commercial
Source: Brand Tracking Study, Dan Jones & Associates (July 2003)
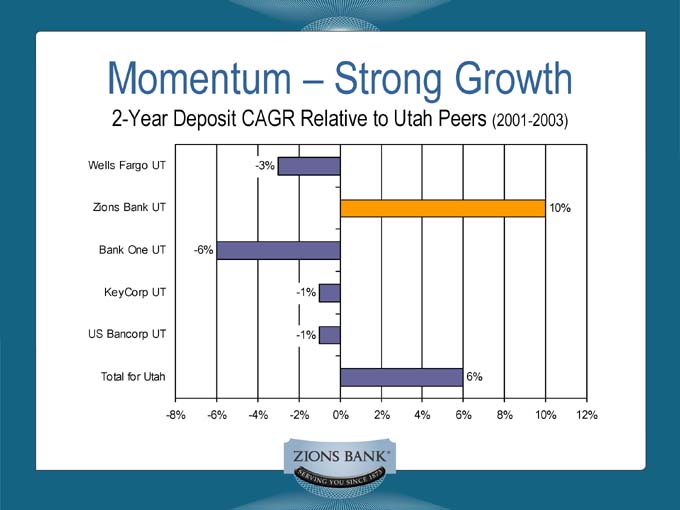
Momentum – Strong Growth
2-Year Deposit CAGR Relative to Utah Peers (2001-2003)
Wells Fargo UT -3%
Zions Bank UT 10%
Bank One UT -6%
KeyCorp UT -1%
US Bancorp UT -1%
Total for Utah 6%
-8% -6% -4% -2% 0% 2% 4% 6% 8% 10% 12%
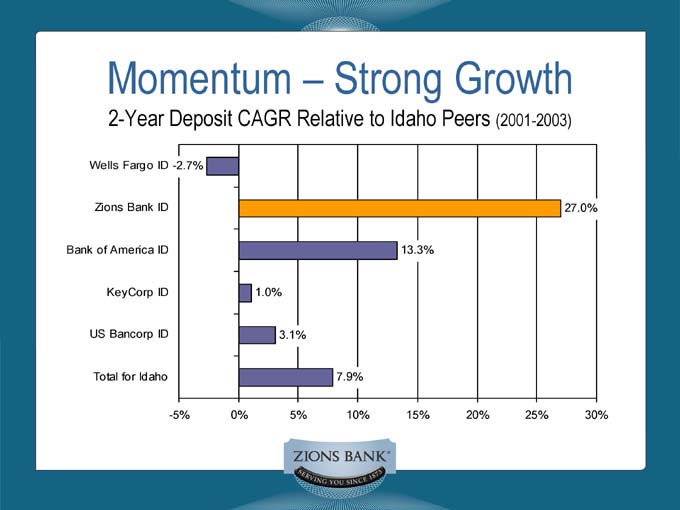
Momentum – Strong Growth
2-Year Deposit CAGR Relative to Idaho Peers (2001-2003)
Wells Fargo ID -2.7%
Zions Bank ID 27.0%
Bank of America ID 13.3%
KeyCorp ID 1.0%
US Bancorp ID 3.1%
Total for Idaho 7.9%
-5% 0% 5% 10% 15% 20% 25% 30%
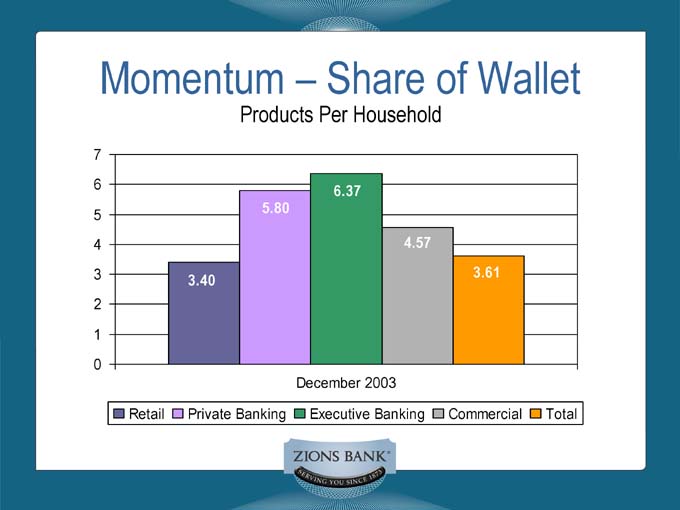
Momentum – Share of Wallet
Products Per Household
7
6 6.37
5 5.80
4 4.57
3 3.61
3.40
2
1
0
December 2003
Retail Private Banking Executive Banking Commercial Total
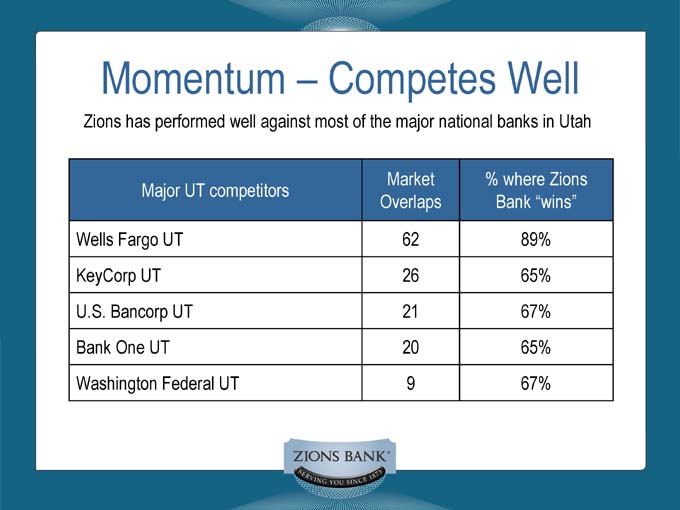
Momentum – Competes Well
Zions has performed well against most of the major national banks in Utah
Market % where Zions
Major UT competitors
Overlaps Bank “wins”
Wells Fargo UT 62 89%
KeyCorp UT 26 65%
U.S. Bancorp UT 21 67%
Bank One UT 20 65%
Washington Federal UT 9 67%
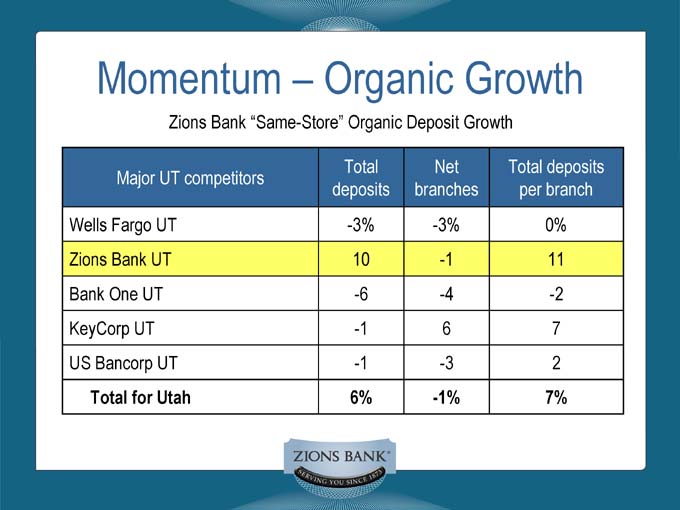
Momentum – Organic Growth
Zions Bank “Same-Store” Organic Deposit Growth
Total Net Total deposits
Major UT competitors
deposits branches per branch
Wells Fargo UT -3% -3% 0%
Zions Bank UT 10 -1 11
Bank One UT -6 -4 -2
KeyCorp UT -1 6 7
US Bancorp UT -1 -3 2
Total for Utah 6% -1% 7%
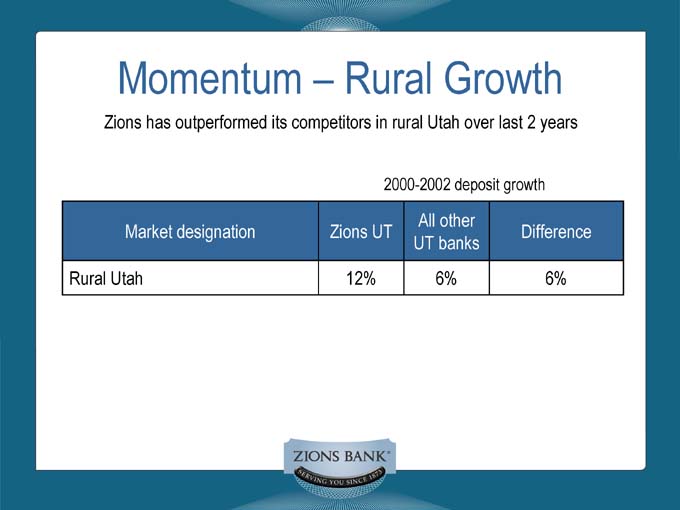
Momentum – Rural Growth
Zions has outperformed its competitors in rural Utah over last 2 years
2000-2002 deposit growth
All other
Market designation Zions UT Difference
UT banks
Rural Utah 12% 6% 6%
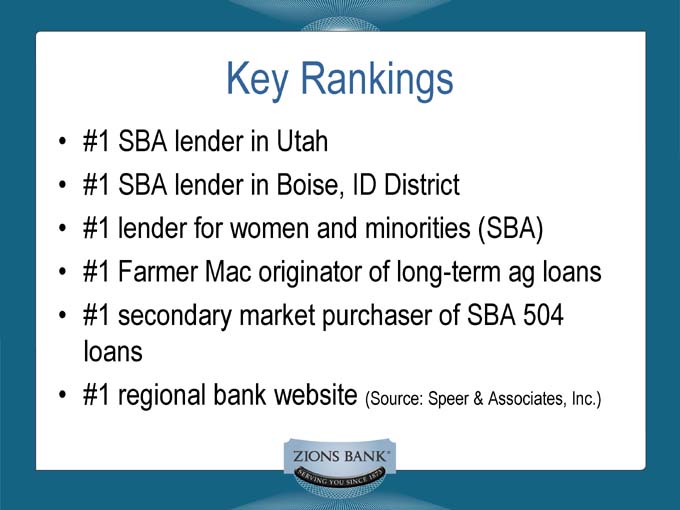
Key Rankings
• #1 SBA lender in Utah
• #1 SBA lender in Boise, ID District
• #1 lender for women and minorities (SBA)
• #1 Farmer Mac originator of long-term ag loans
• #1 secondary market purchaser of SBA 504 loans
• #1 regional bank website (Source: Speer & Associates, Inc.)

Financial History—Deposits
5-Year Deposit Growth
(Average Deposits—$ in millions)
$ 8,000
$ 6,982
$ 7,000
$ 6,116
$ 6,000
$ 4,714
$ 5,000 $ 4,169
$ 3,777
$ 4,000
$ 3,000
$ 2,000
$ 1,000
$0
1999 2000 2001 2002 2003
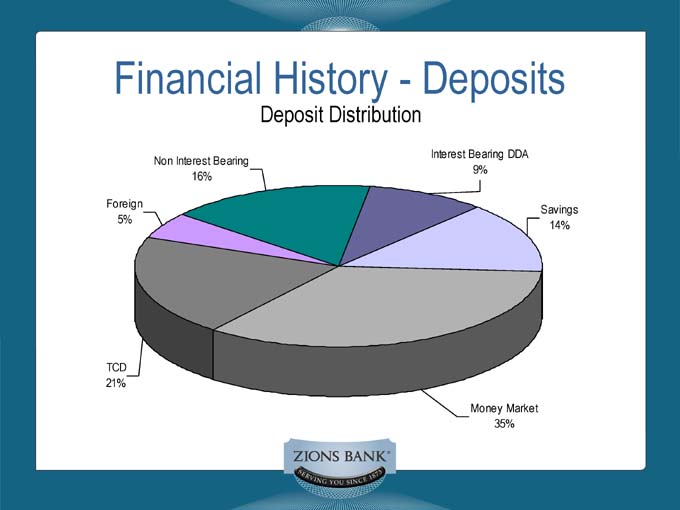
Financial History—Deposits
Deposit Distribution
Non Interest Bearing 16%
Interest Bearing DDA
9%
Savings 14%
Money Market 35%
TCD 21%
Foreign 5%
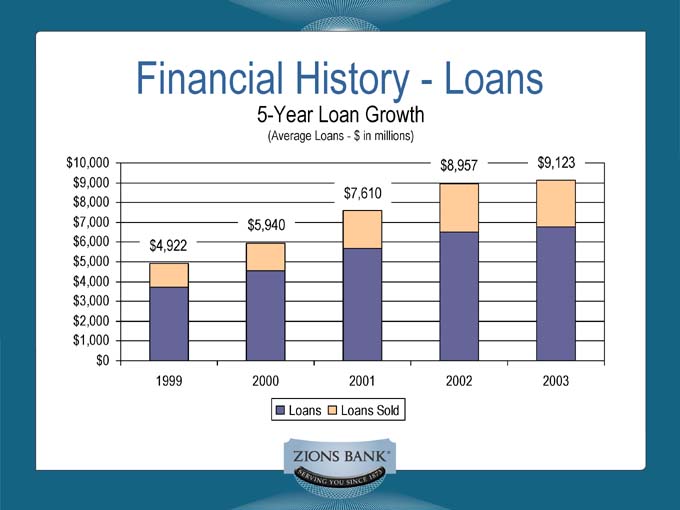
Financial History—Loans
5-Year Loan Growth
(Average Loans—$ in millions)
$ 10,000 $ 8,957 $ 9,123
$ 9,000
$ 7,610
$ 8,000
$ 7,000 $ 5,940
$ 6,000 $ 4,922
$ 5,000
$ 4,000
$ 3,000
$ 2,000
$ 1,000
$ 0
1999 2000 2001 2002 2003
Loans Loans Sold
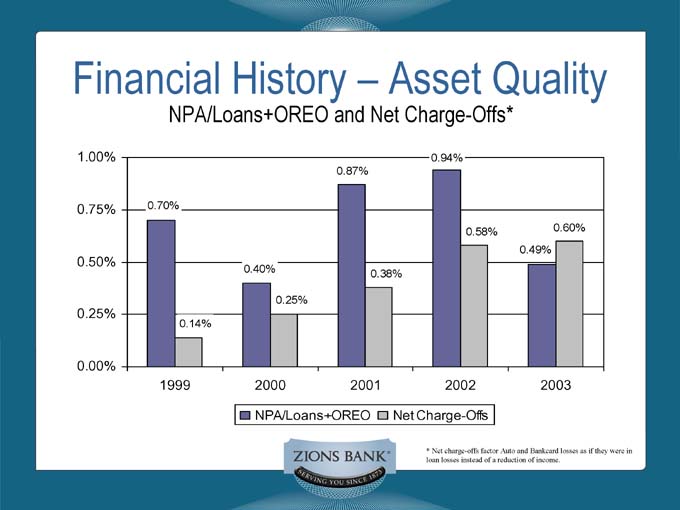
Financial History – Asset Quality
NPA/Loans+OREO and Net Charge-Offs*
1.00% 0.94%
0.87%
0.75% 0.70%
0.58% 0.60%
0.49%
0.50%
0.40% 0.38%
0.25%
0.25%
0.14%
0.00%
1999 2000 2001 2002 2003
NPA/Loans+OREO Net Charge-Offs
* Net charge-offs factor Auto and Bankcard losses as if they were in loan losses instead of a reduction of income.
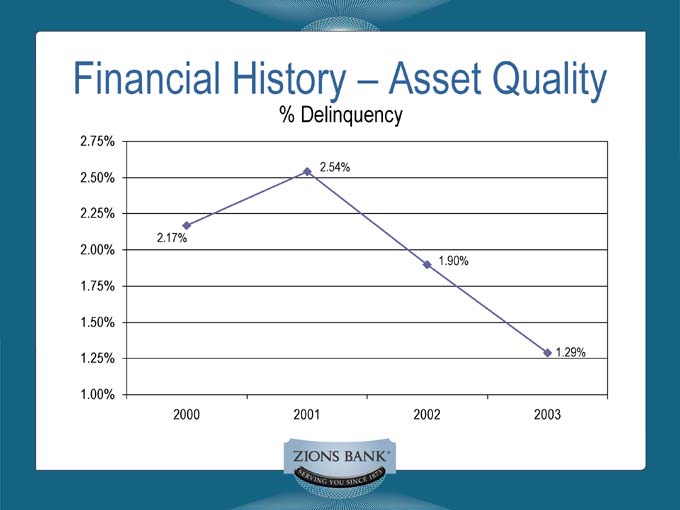
Financial History – Asset Quality
% Delinquency
2.75%
2.54%
2.50%
2.25%
2.17%
2.00%
1.90%
1.75%
1.50%
1.25% 1.29%
1.00%
2000 2001 2002 2003
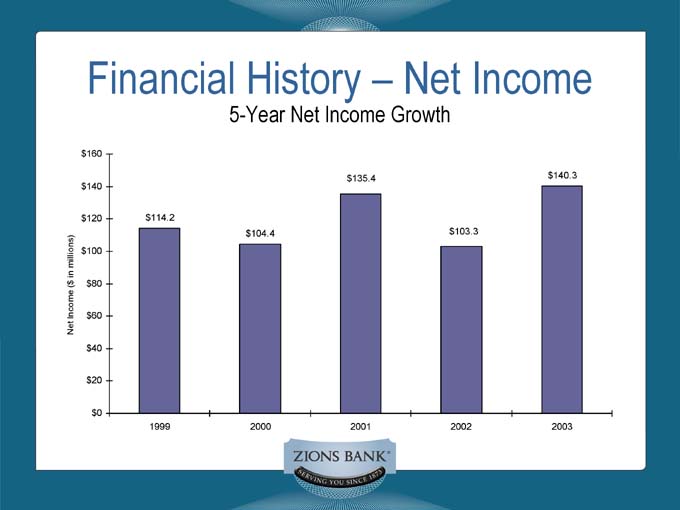
Financial History – Net Income
5-Year Net Income Growth
Net Income ($ in millions)
$ 160
$ 135.4 $ 140.3
$ 140
$ 120 $ 114.2
$ 104.4 $ 103.3
$ 100
$ 80
$ 60
$ 40
$ 20
$ 0
1999 2000 2001 2002 2003
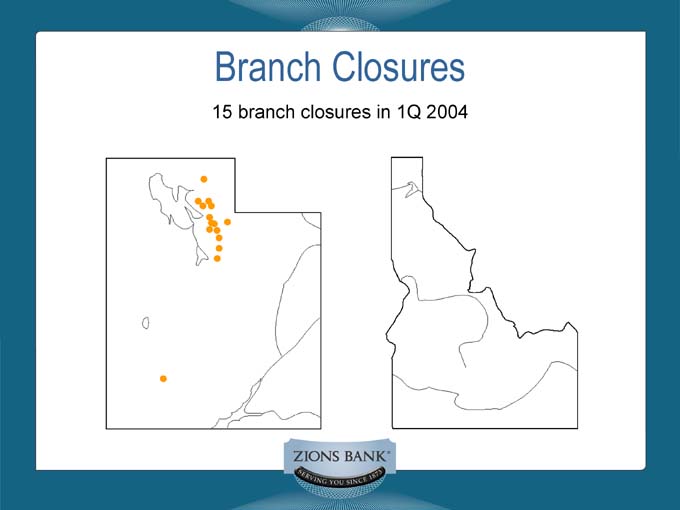
Branch Closures
15 branch closures in 1Q 2004
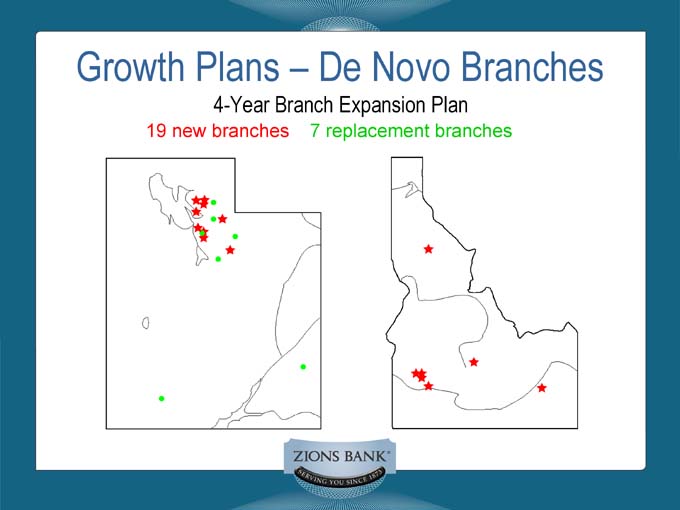
Growth Plans – De Novo Branches
4-Year Branch Expansion Plan
19 new branches 7 replacement branches
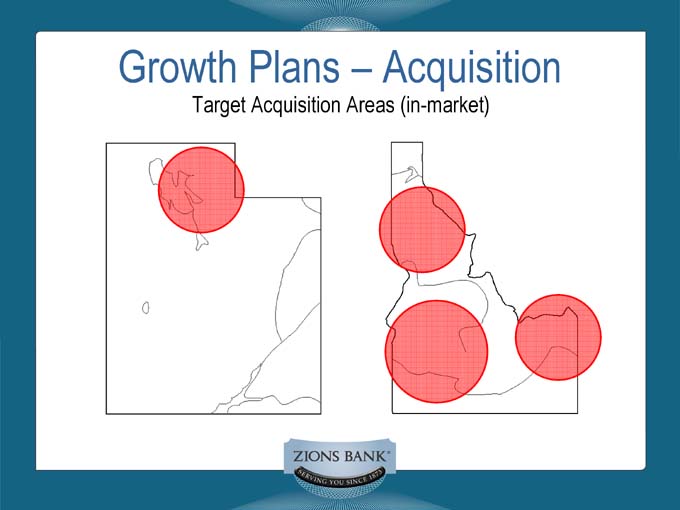
Growth Plans – Acquisition
Target Acquisition Areas (in-market)
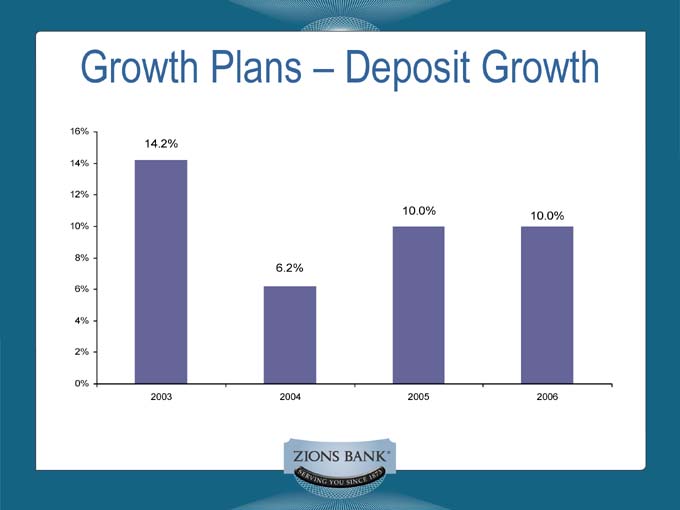
Growth Plans – Deposit Growth
16%
14.2%
14%
12%
10.0% 10.0%
10%
8%
6.2%
6%
4%
2%
0%
2003 2004 2005 2006
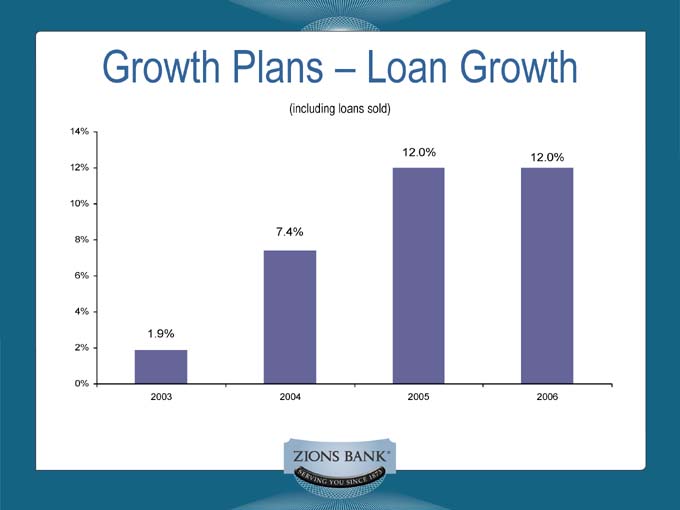
Growth Plans – Loan Growth
(including loans sold)
14%
12.0% 12.0%
12%
10%
7.4%
8%
6%
4%
1.9%
2%
0%
2003 2004 2005 2006
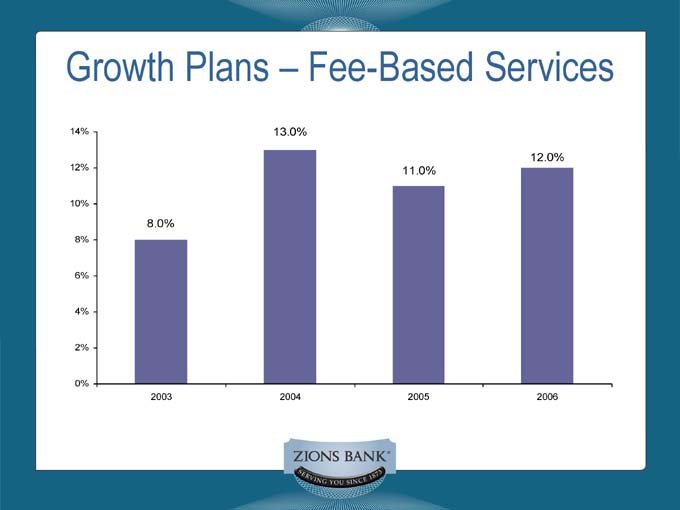
Growth Plans – Fee-Based Services
14% 13.0%
12.0%
12% 11.0%
10%
8.0%
8%
6%
4%
2%
0%
2003 2004 2005 2006
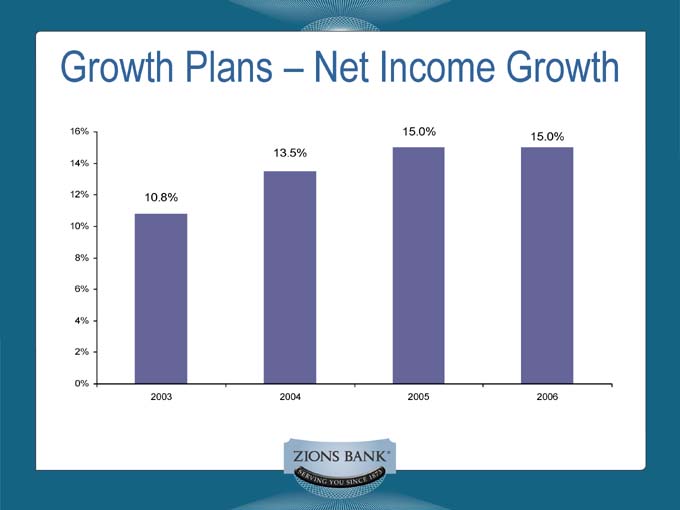
Growth Plans – Net Income Growth
16% 15.0%
15.0%
13.5%
14%
12% 10.8%
10%
8%
6%
4%
2%
0%
2003 2004 2005 2006
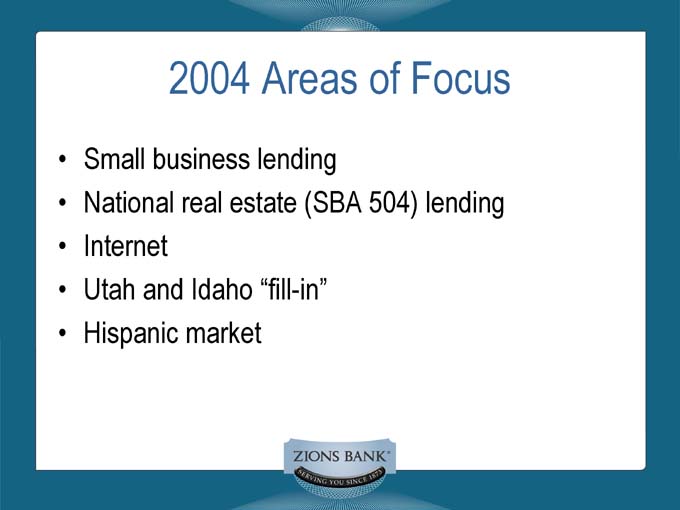
2004 Areas of Focus
• Small business lending
• National real estate (SBA 504) lending
• Internet
• Utah and Idaho “fill-in”
• Hispanic market


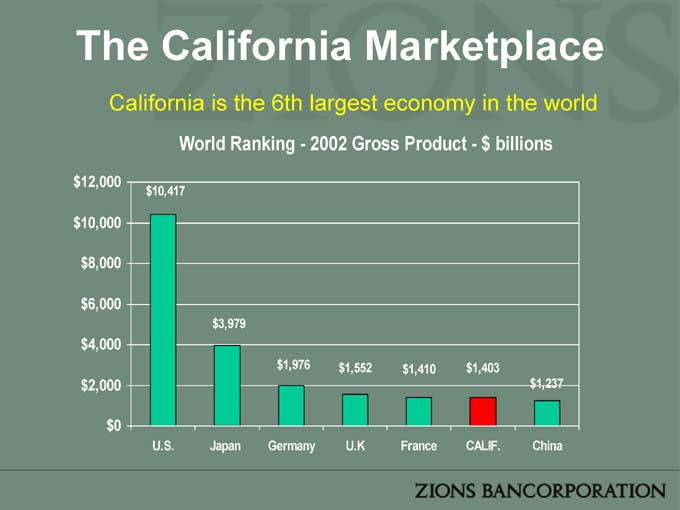
The California Marketplace
California is the 6th largest economy in the world
World Ranking—2002 Gross Product—$ billions
$ 12,000
$ 10,417
$ 10,000
$ 8,000
$ 6,000
$ 3,979
$ 4,000
$ 1,976 $ 1,552 $ 1,410 $ 1,403
$ 2,000 $ 1,237
$ 0
U.S. Japan Germany U.K France CALIF. China
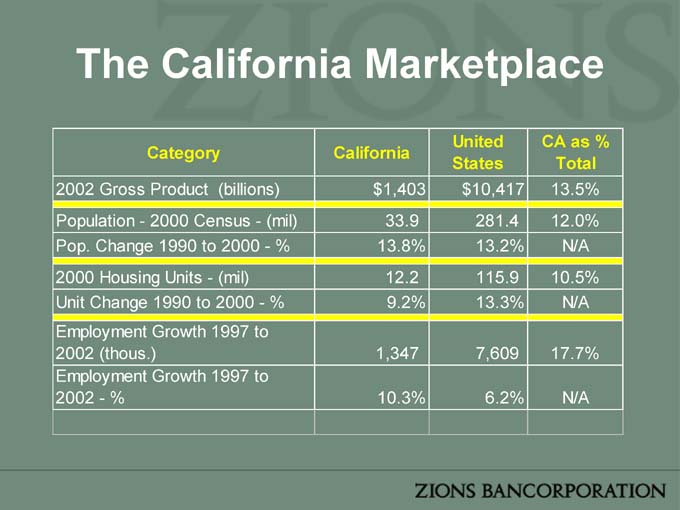
The California Marketplace
United CA as %
Category California
States Total
2002 Gross Product (billions) $ 1,403 $ 10,417 13.5%
Population—2000 Census—(mil) 33.9 281.4 12.0%
Pop. Change 1990 to 2000—% 13.8% 13.2% N/A
2000 Housing Units—(mil) 12.2 115.9 10.5%
Unit Change 1990 to 2000—% 9.2% 13.3% N/A
Employment Growth 1997 to
2002 (thous.) 1,347 7,609 17.7%
Employment Growth 1997 to
2002—% 10.3% 6.2% N/A
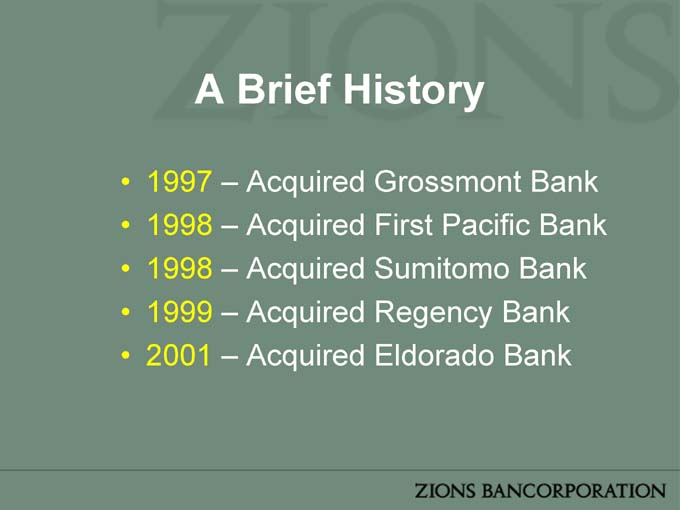
A Brief History
• 1997 – Acquired Grossmont Bank
• 1998 – Acquired First Pacific Bank
• 1998 – Acquired Sumitomo Bank
• 1999 – Acquired Regency Bank
• 2001 ��� Acquired Eldorado Bank
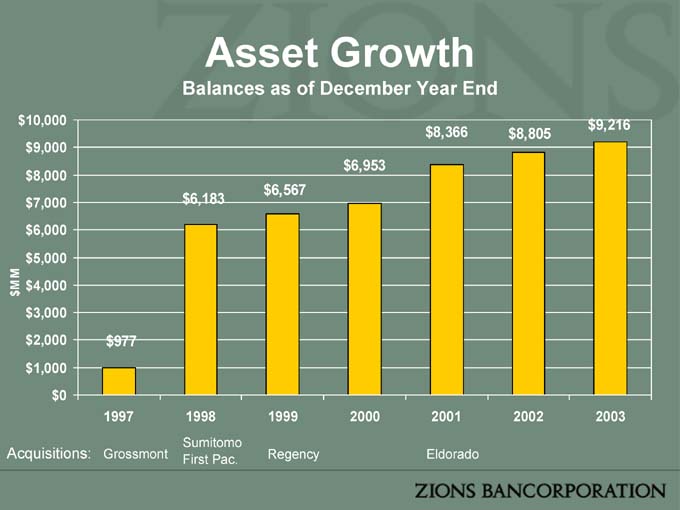
Asset Growth
Balances as of December Year End
$ 10,000 $ 9,216
$ 8,366 $ 8,805
$ 9,000
$ 6,953
$ 8,000
$ 6,567
$ 7,000 $ 6,183
$ 6,000
$ 5,000
MM $ 4,000
$
$ 3,000
$ 2,000 $ 977
$ 1,000
$ 0
1997 1998 1999 2000 2001 2002 2003
Sumitomo
Acquisitions: Grossmont First Pac. Regency Eldorado
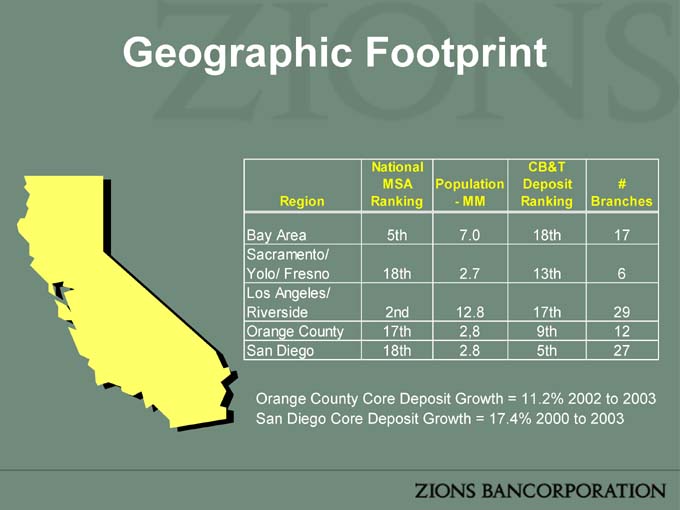
Geographic Footprint
National CB&T
MSA Population Deposit #
Region Ranking - MM Ranking Branches
Bay Area 5th 7.0 18th 17
Sacramento/
Yolo/ Fresno 18th 2.7 13th 6
Los Angeles/
Riverside 2nd 12.8 17th 29
Orange County 17th 2,8 9th 12
San Diego 18th 2.8 5th 27
Orange County Core Deposit Growth = 11.2% 2002 to 2003 San Diego Core Deposit Growth = 17.4% 2000 to 2003
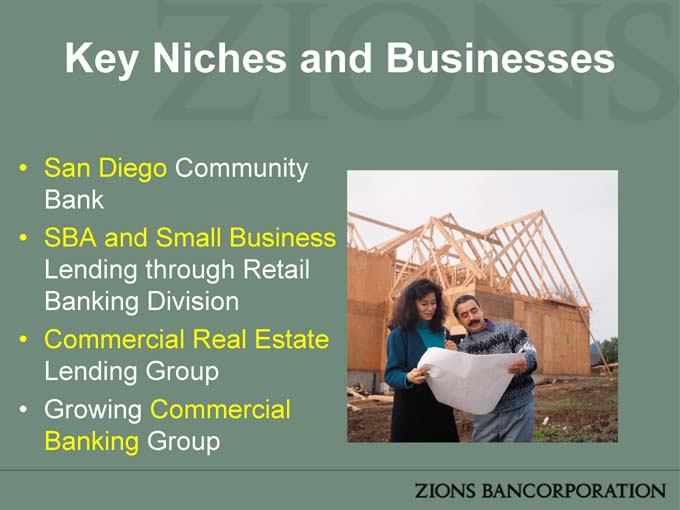
Key Niches and Businesses
• San Diego Community Bank
• SBA and Small Business Lending through Retail Banking Division
• Commercial Real Estate Lending Group
• Growing Commercial Banking Group
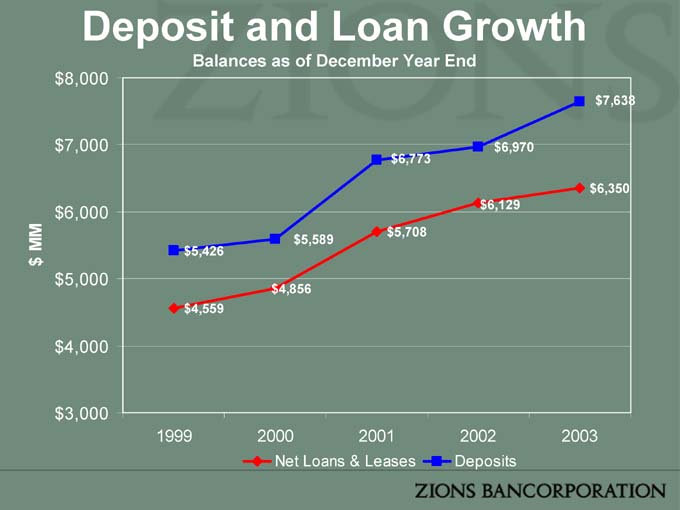
Deposit and Loan Growth
Balances as of December Year End
$ 8,000
$7,638
$ 7,000 $ 6,970
$ 6,773
$ 6,350
$ 6,000 $ 6,129
$ 5,708
MM $ 5,589
$ 5,426
$
$ 5,000
$ 4,856
$ 4,559
$ 4,000
$ 3,000
1999 2000 2001 2002 2003
Net Loans & Leases Deposits
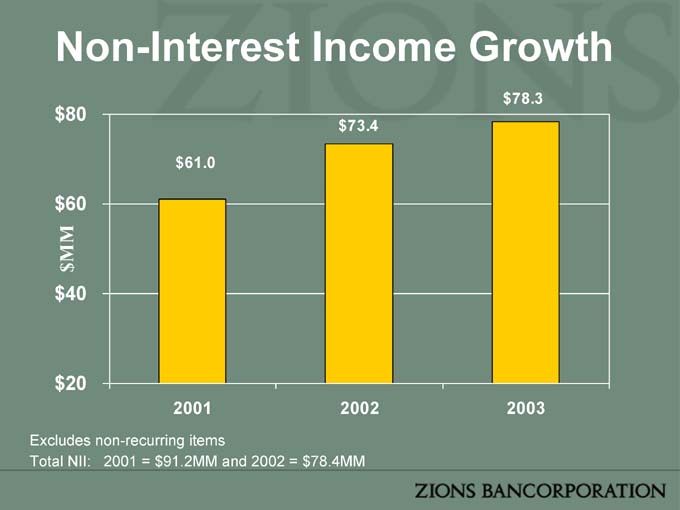
Non-Interest Income Growth
$ 78.3
$ 80
$ 73.4
$ 61.0
$ 60
MM
$
$ 40
$ 20
2001 2002 2003
Excludes non-recurring items
Total NII: 2001 = $91.2MM and 2002 = $78.4MM
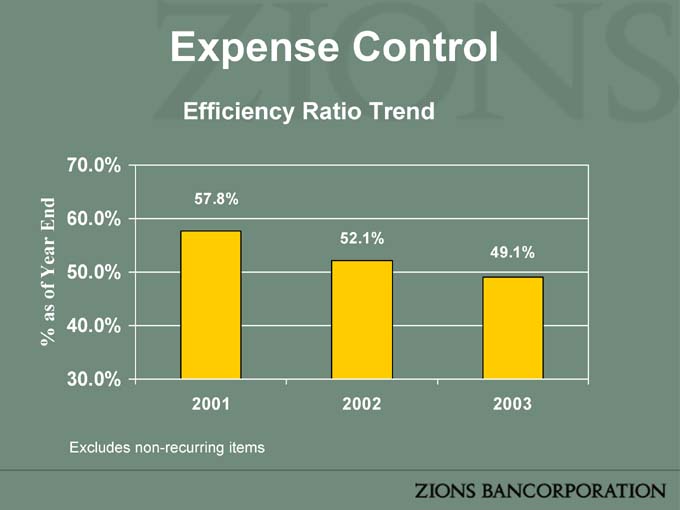
Expense Control
Efficiency Ratio Trend
% as of Year End 40.0%
70.0%
57.8%
60.0%
52.1%
49.1%
50.0%
30.0%
2001 2002 2003
Excludes non-recurring items
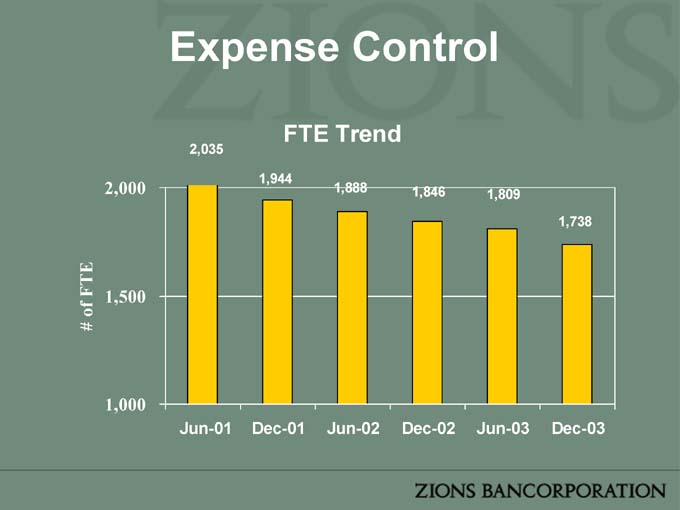
Expense Control
FTE Trend
2,035
1,944
2,000 1,888 1,846
1,809
1,738
1,500
1,000
Jun-01 Dec-01 Jun-02 Dec-02 Jun-03 Dec-03
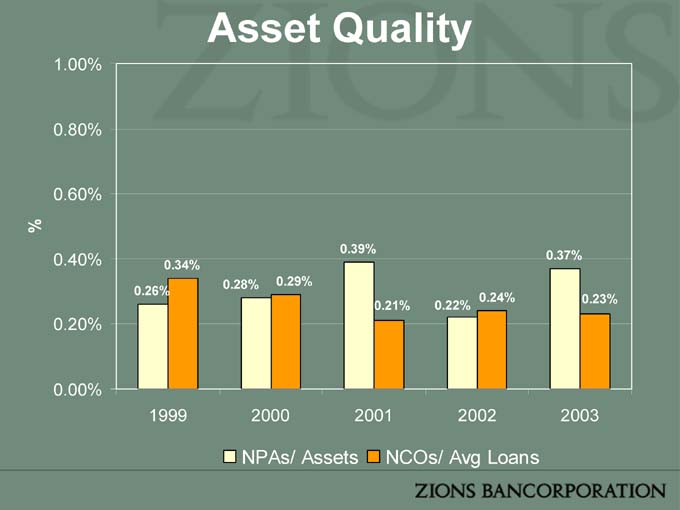
Asset Quality
1.00%
0.80%
0.60%
%
0.39%
0.40% 0.37%
0.34%
0.28% 0.29%
0.26%
0.24% 0.23%
0.21% 0.22%
0.20%
0.00%
1999 2000 2001 2002 2003
NPAs/ Assets NCOs/ Avg Loans
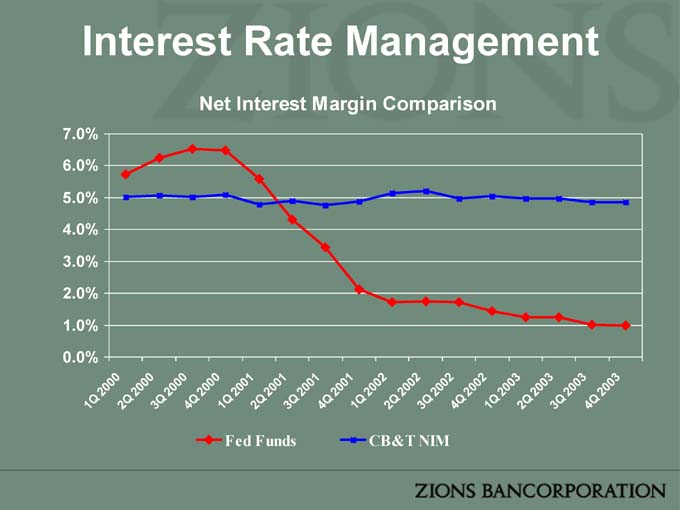
Interest Rate Management
Net Interest Margin Comparison
7.0%
6.0%
5.0%
4.0%
3.0%
2.0%
1.0%
0.0% 1 Q 2000 2 Q 2 000 3 Q 2 000 4 Q 2 000 1Q 2001 2Q 2001 3Q 2001 4 Q 2001 1 Q 2002 2 Q 2 002 3 Q 2 002 4 Q 2 002 1Q 2003 2Q 2003 3Q 2003 4 Q2003
Fed Funds CB&T NIM
Net Income
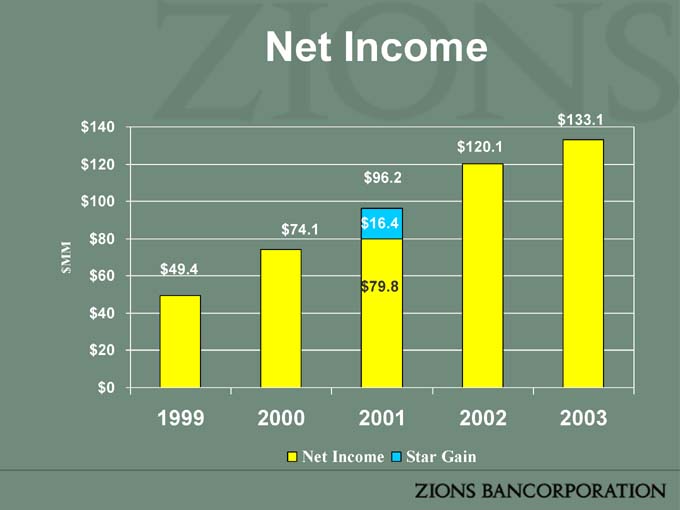
$ 133.1
$ 140
$ 120.1
$ 120
$ 96.2
$ 100
$ 74.1 $ 16.4
$ 80
MM
$ $ 60 $ 49.4
$ 79.8
$ 40
$ 20
$ 0
1999 2000 2001 2002 2003
Net Income Star Gain
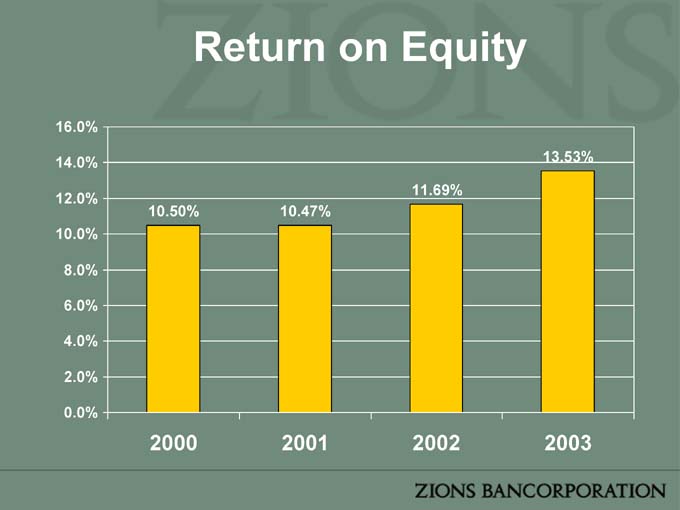
Return on Equity
16.0%
14.0% 13.53%
11.69%
12.0%
10.50% 10.47%
10.0%
8.0%
6.0%
4.0%
2.0%
0.0%
2000 2001 2002 2003
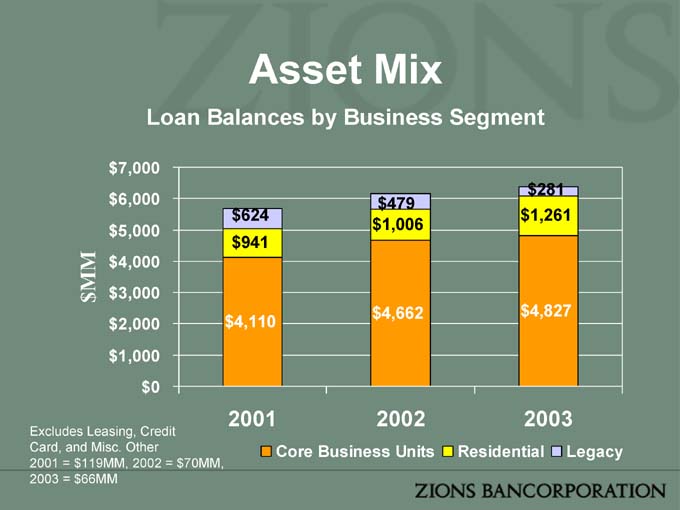
Asset Mix
Loan Balances by Business Segment
$ 7,000
$ 281
$ 6,000 $ 479
$ 624 $ 1,261
$ 5,000 $ 1,006
$ 941
MM $ 4,000
$ $ 3,000
$ 4,662 $ 4,827
$ 2,000 $ 4,110
$ 1,000
$ 0
2001 2002 2003
Excludes Leasing, Credit
Card, and Misc. Other Core Business Units Residential Legacy
2001 = $119MM, 2002 = $70MM,
2003 = $66MM
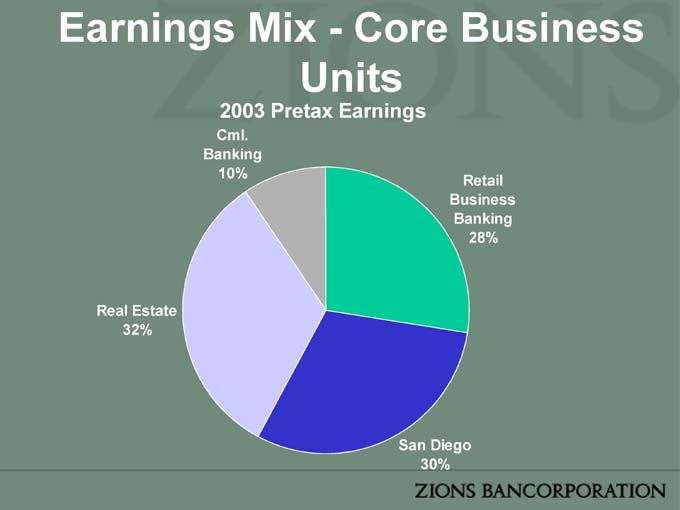
Earnings Mix—Core Business Units
2003 Pretax Earnings
Cml. Banking 10%
Retail Business Banking 28%
Real Estate 32%
San Diego 30%
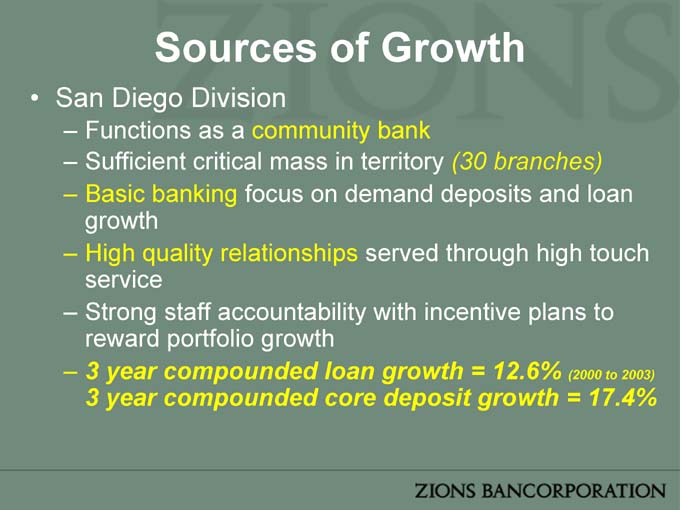
Sources of Growth
• San Diego Division
– Functions as a community bank
– Sufficient critical mass in territory (30 branches)
– Basic banking focus on demand deposits and loan growth
– High quality relationships served through high touch service
– Strong staff accountability with incentive plans to reward portfolio growth
– 3 year compounded loan growth = 12.6% (2000 to 2003) 3 year compounded core deposit growth = 17.4%
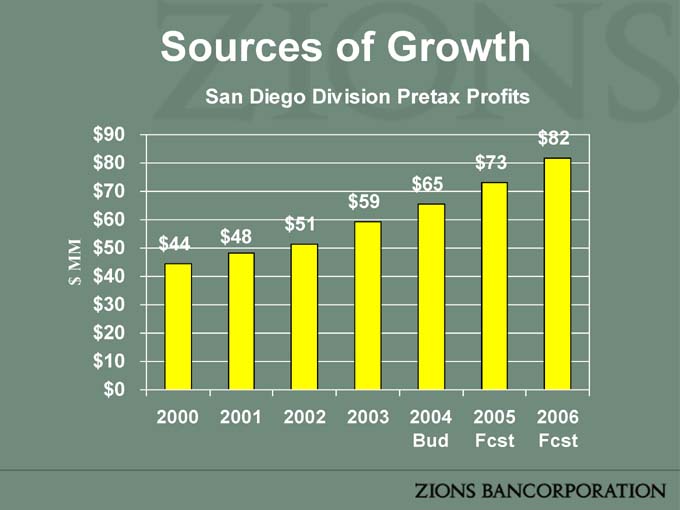
Sources of Growth
San Diego Division Pretax Profits
$ 90 $ 82
$ 80 $ 73
$ 70 $ 65
$ 59
$ 60 $ 51
$ 44 $ 48
MM $ 50
$ 40
$
$ 30
$ 20
$ 10
$ 0
2000 2001 2002 2003 2004 2005 2006
Bud Fcst Fcst
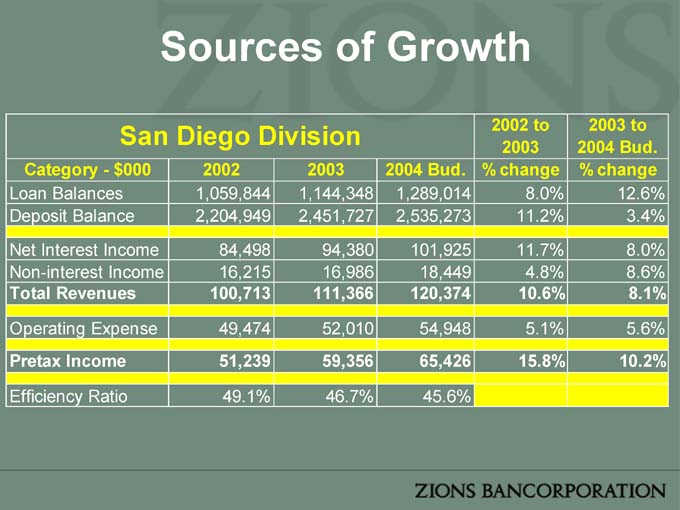
Sources of Growth
San Diego Division 2002 to 2003 to
2003 2004 Bud.
Category—$ 000 2002 2003 2004 Bud. % change % change
Loan Balances 1,059,844 1,144,348 1,289,014 8.0% 12.6%
Deposit Balance 2,204,949 2,451,727 2,535,273 11.2% 3.4%
Net Interest Income 84,498 94,380 101,925 11.7% 8.0%
Non-interest Income 16,215 16,986 18,449 4.8% 8.6%
Total Revenues 100,713 111,366 120,374 10.6% 8.1%
Operating Expense 49,474 52,010 54,948 5.1% 5.6%
Pretax Income 51,239 59,356 65,426 15.8% 10.2%
Efficiency Ratio 49.1% 46.7% 45.6%
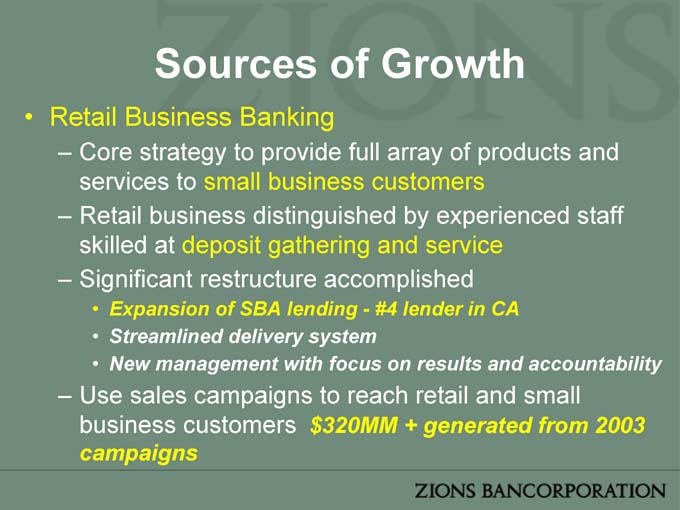
Sources of Growth
• Retail Business Banking
– Core strategy to provide full array of products and services to small business customers
– Retail business distinguished by experienced staff skilled at deposit gathering and service
– Significant restructure accomplished
• Expansion of SBA lending—#4 lender in CA
• Streamlined delivery system
• New management with focus on results and accountability
– Use sales campaigns to reach retail and small business customers $320MM + generated from 2003 campaigns
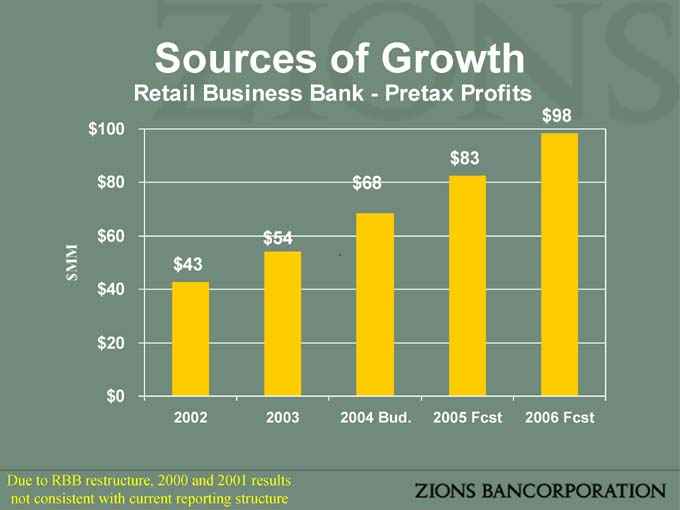
Sources of Growth
Retail Business Bank—Pretax Profits
$ 98
$ 100
$ 83
$ 80 $ 68
$ 60 $ 54
MM $ 43
$
$ 40
$ 20
$ 0
2002 2003 2004 Bud. 2005 Fcst 2006 Fcst
Due to RBB restructure, 2000 and 2001 results not consistent with current reporting structure
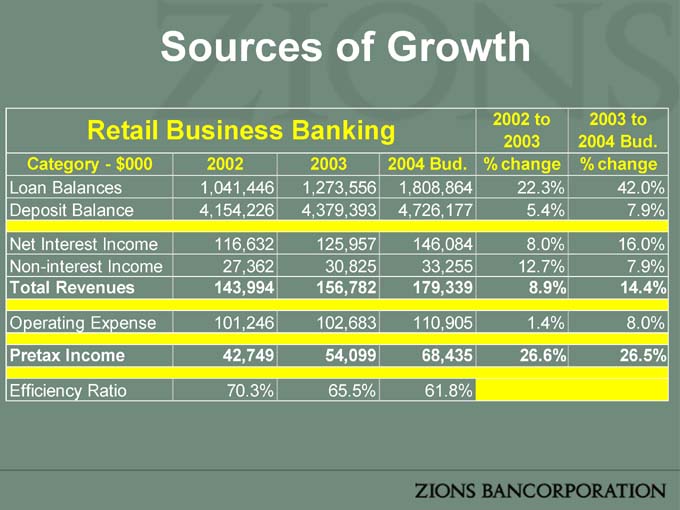
Retail Business Banking 2002 to 2003 to
2003 2004 Bud.
Category—$ 000 2002 2003 2004 Bud. % change % change
Loan Balances 1,041,446 1,273,556 1,808,864 22.3% 42.0%
Deposit Balance 4,154,226 4,379,393 4,726,177 5.4% 7.9%
Net Interest Income 116,632 125,957 146,084 8.0% 16.0%
Non-interest Income 27,362 30,825 33,255 12.7% 7.9%
Total Revenues 143,994 156,782 179,339 8.9% 14.4%
Operating Expense 101,246 102,683 110,905 1.4% 8.0%
Pretax Income 42,749 54,099 68,435 26.6% 26.5%
Efficiency Ratio 70.3% 65.5% 61.8%
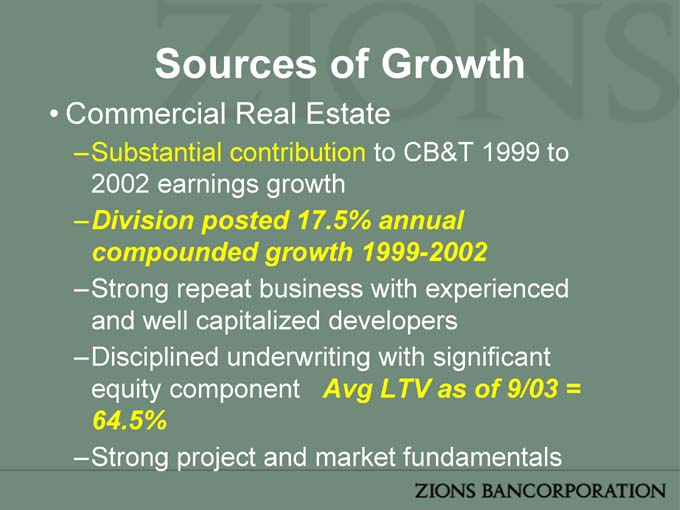
Sources of Growth
• Commercial Real Estate
–Substantial contribution to CB&T 1999 to 2002 earnings growth
– Division posted 17.5% annual compounded growth 1999-2002
–Strong repeat business with experienced and well capitalized developers –Disciplined underwriting with significant equity component Avg LTV as of 9/03 = 64.5%
–Strong project and market fundamentals
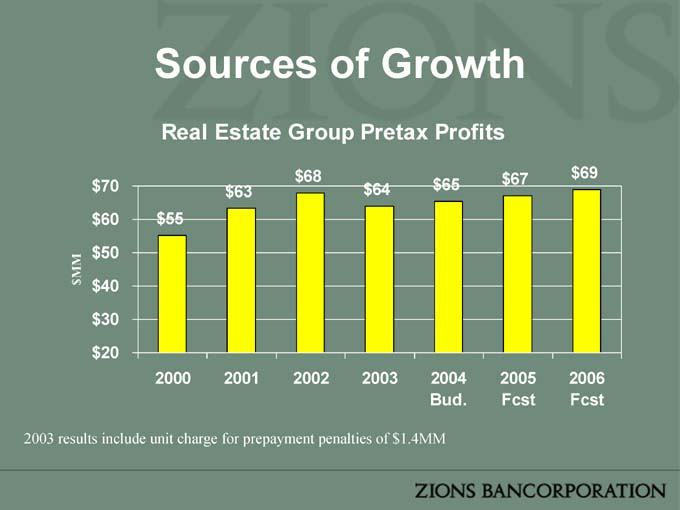
Sources of Growth
Real Estate Group Pretax Profits
2003 results include unit charge for prepayment penalties of $1.4MM

Sources of Growth
• CRE Portfolio Results
–$ 6.9B of originations over 5 years
–$ 2.1MM of net losses over same period (3bp)
–$ 1.84B currently outstanding
– Market conditions support continued caution and underwriting discipline
CRE Originations versus
Payoffs - $ Commitments
$ 1.8
$ 1.6 $ 1.6
$ 1.6
$ 1.3 $ 1.4
$ 1.4 $ 1.2 $ 1.3
$ 1.2
$ 1.0
$ 0.8
$ 0.6
$ 0.4
$ 0.2
$ 0.0
2001 2002 2003
Originations Payoffs
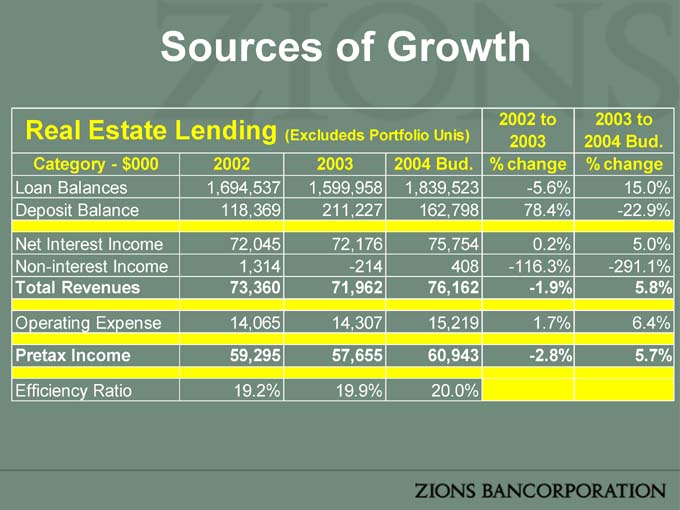
Sources of Growth
Real Estate Lending 2002 to 2003 to
(Excludeds Portfolio Unis) 2003 2004 Bud.
Category—$ 000 2002 2003 2004 Bud. % change % change
Loan Balances 1,694,537 1,599,958 1,839,523 -5.6% 15.0%
Deposit Balance 118,369 211,227 162,798 78.4% -22.9%
Net Interest Income 72,045 72,176 75,754 0.2% 5.0%
Non-interest Income 1,314 -214 408 -116.3% -291.1%
Total Revenues 73,360 71,962 76,162 -1.9% 5.8%
Operating Expense 14,065 14,307 15,219 1.7% 6.4%
Pretax Income 59,295 57,655 60,943 -2.8% 5.7%
Efficiency Ratio 19.2% 19.9% 20.0%
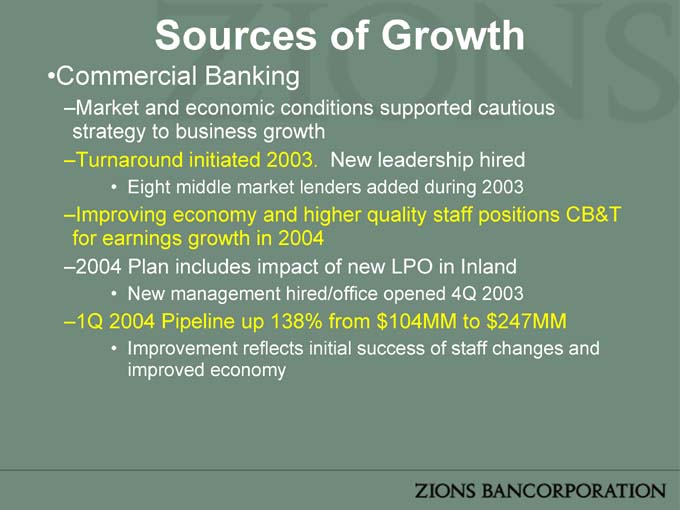
Sources of Growth
•Commercial Banking
–Market and economic conditions supported cautious strategy to business growth –Turnaround initiated 2003. New leadership hired
• Eight middle market lenders added during 2003
–Improving economy and higher quality staff positions CB&T for earnings growth in 2004 –2004 Plan includes impact of new LPO in Inland
• New management hired/office opened 4Q 2003
–1Q 2004 Pipeline up 138% from $104MM to $247MM
• Improvement reflects initial success of staff changes and improved economy
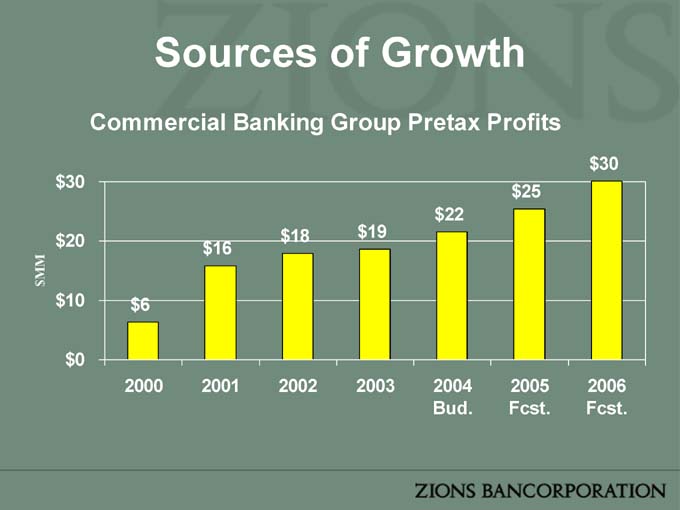
Sources of Growth
Commercial Banking Group Pretax Profits
$ 30
$ 30
$ 25
$ 22
$ 18 $ 19
$ 20 $ 16
MM
$
$ 10 $ 6
$ 0
2000 2001 2002 2003 2004 2005 2006
Bud. Fcst. Fcst.
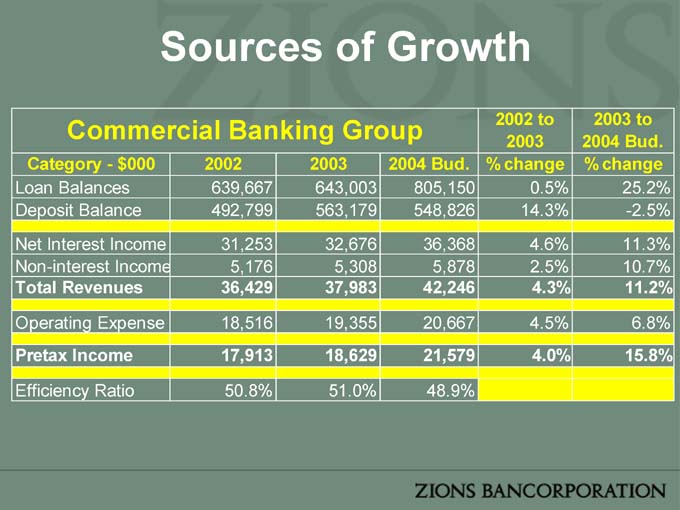
Sources of Growth
Commercial Banking Group 2002 to 2003 to
2003 2004 Bud.
Category—$000 2002 2003 2004 Bud. % change % change
Loan Balances 639,667 643,003 805,150 0.5% 25.2%
Deposit Balance 492,799 563,179 548,826 14.3% -2.5%
Net Interest Income 31,253 32,676 36,368 4.6% 11.3%
Non-interest Income 5,176 5,308 5,878 2.5% 10.7%
Total Revenues 36,429 37,983 42,246 4.3% 11.2%
Operating Expense 18,516 19,355 20,667 4.5% 6.8%
Pretax Income 17,913 18,629 21,579 4.0% 15.8%
Efficiency Ratio 50.8% 51.0% 48.9%
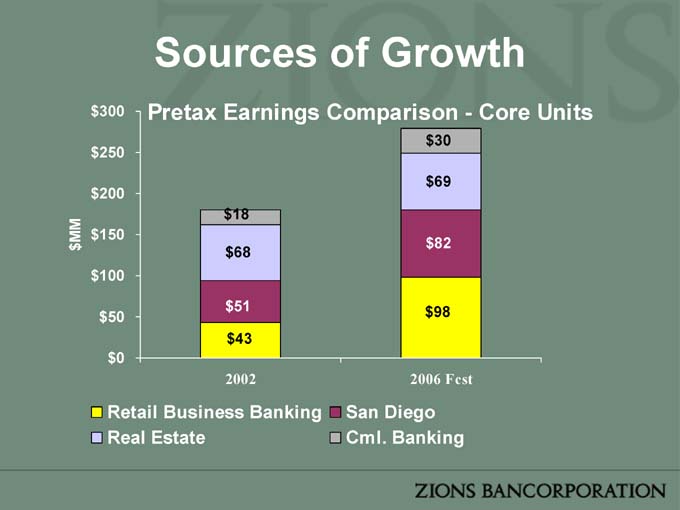
Sources of Growth
$ 300 Pretax Earnings Comparison—Core Units
$ 30
$ 250
$ 69
$ 200
$ 18
MM $ 150
$ $ 82
$ 68
$ 100
$ 51 $ 98
$ 50
$ 43
$ 0
2002 2006 Fcst
Retail Business Banking San Diego
Real Estate Cml. Banking
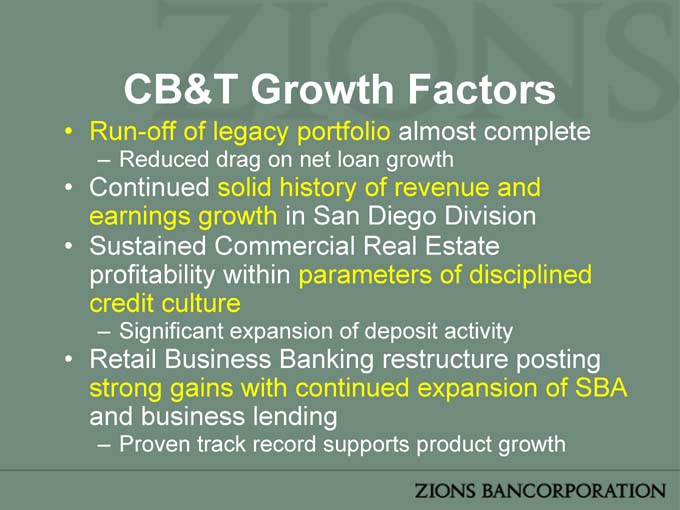
CB&T Growth Factors
• Run-off of legacy portfolio almost complete
– Reduced drag on net loan growth
• Continued solid history of revenue and earnings growth in San Diego Division
• Sustained Commercial Real Estate profitability within parameters of disciplined credit culture
– Significant expansion of deposit activity
• Retail Business Banking restructure posting strong gains with continued expansion of SBA and business lending
– Proven track record supports product growth
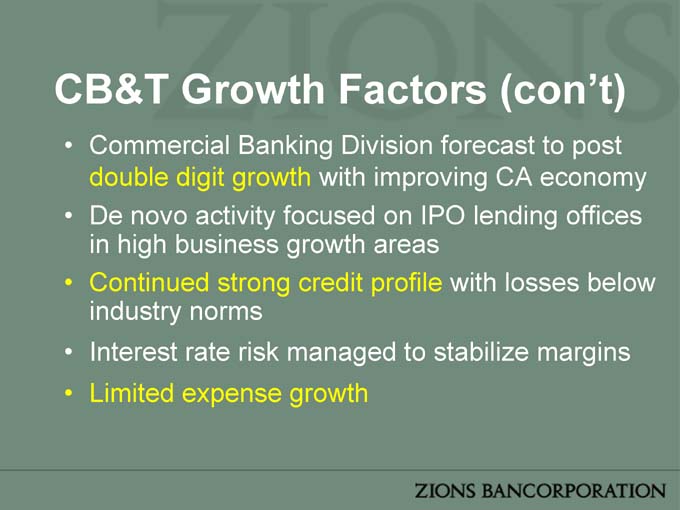
CB&T Growth Factors (con’t)
• Commercial Banking Division forecast to post double digit growth with improving CA economy
• De novo activity focused on IPO lending offices in high business growth areas
• Continued strong credit profile with losses below industry norms
• Interest rate risk managed to stabilize margins
• Limited expense growth

CB&T Long Term Outlook
• Run each business line to capitalize on specific competitive strengths and opportunities
• Invest in staff through strong hires and incentive plans that reward value creation
• Develop clear performance goals and use measurement tools to enforce accountability
• Utilize infrastructure investment in Sacramento and SLC processing centers to execute growing lending business
• Grow revenue through increased penetration and expansion of market share with existing business lines

ZIONS BANCORPORATION
ANALYST DAY
February 19, 2004
The Arizona Marketplace
• 2nd fastest growing population in the United States
• Population expected to surpass 6 million by 2006
• Over 65,000 residential permits in 2003
• Personal income growth expected to surpass 7% annually
A Brief History
• 1984—Founded in Tucson, AZ
• 1994—Acquired by Zions Bancorporation
($ .4B assets at acquisition)
• 1994—Acquired Rio Salado Bank
• 1996—Acquired Southern Arizona Bank
• 2000—Acquired County Bank
• 2001—Acquired Pacific Century Bank – Arizona
• 2002—Acquired Frontier State Bank
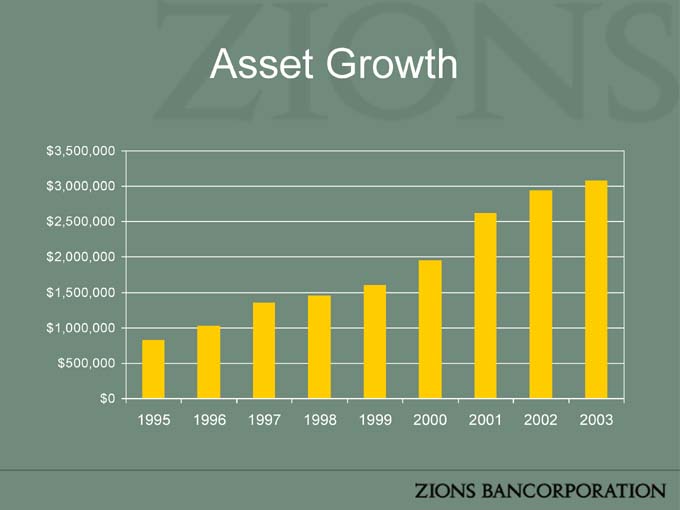
Asset Growth
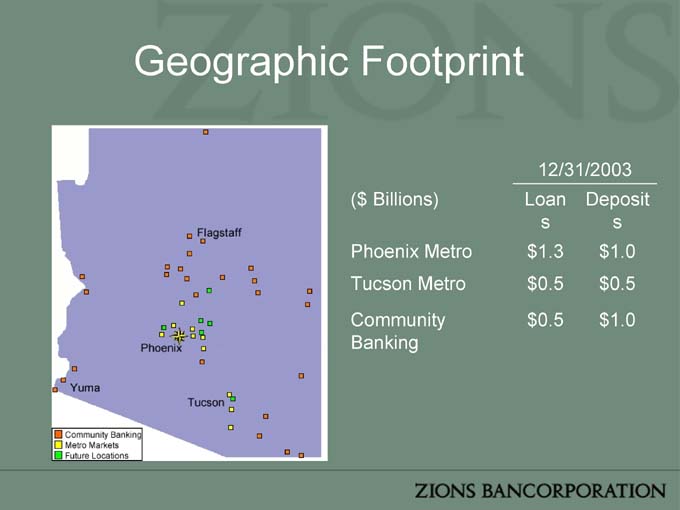
Geographic Footprint
12/31/2003
($ Billions) Loan Deposit
s s
Phoenix Metro $ 1.3 $ 1.0
Tucson Metro $ 0.5 $ 0.5
Community $ 0.5 $ 1.0
Banking
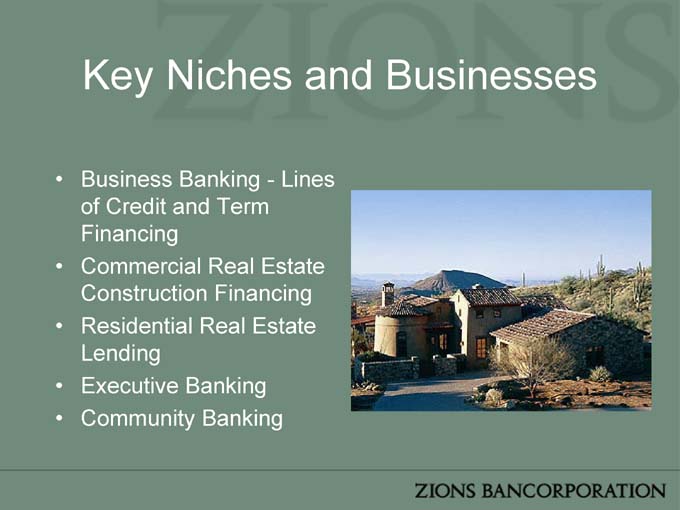
Key Niches and Businesses
• Business Banking—Lines of Credit and Term Financing
• Commercial Real Estate Construction Financing
• Residential Real Estate Lending
• Executive Banking
• Community Banking
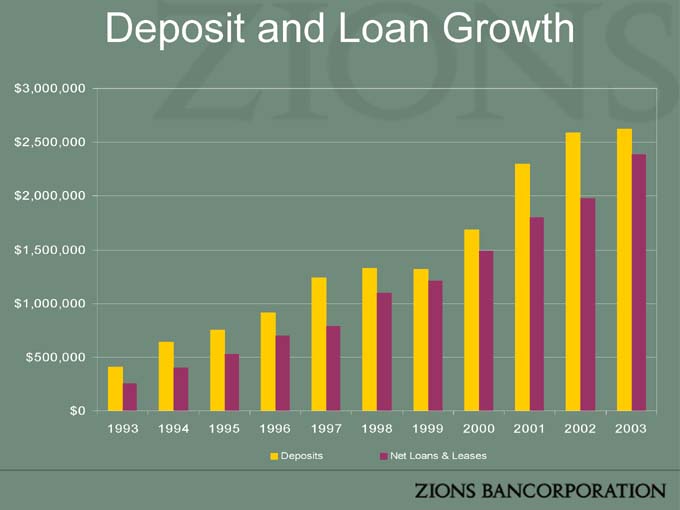
Deposit and Loan Growth
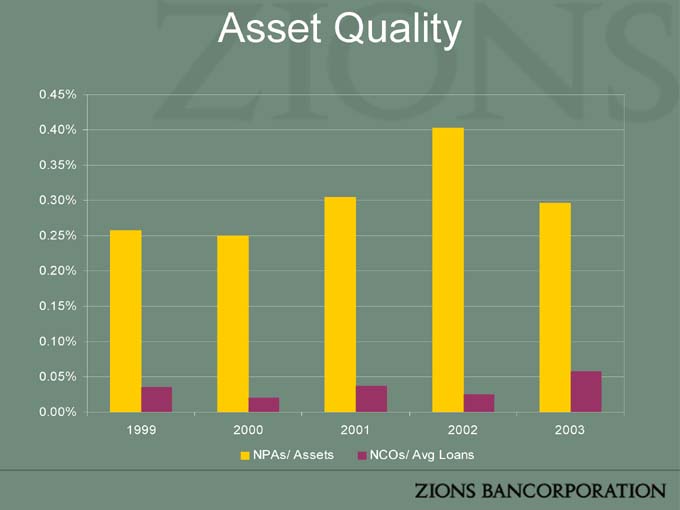
Asset Quality
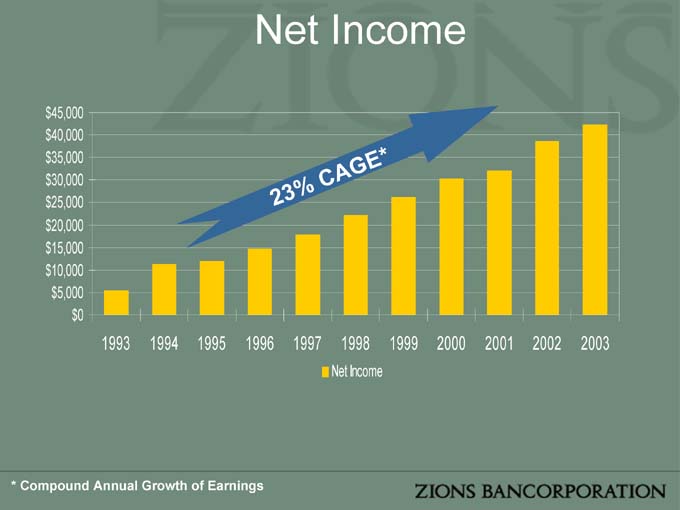
Net Income
* Compound Annual Growth of Earnings
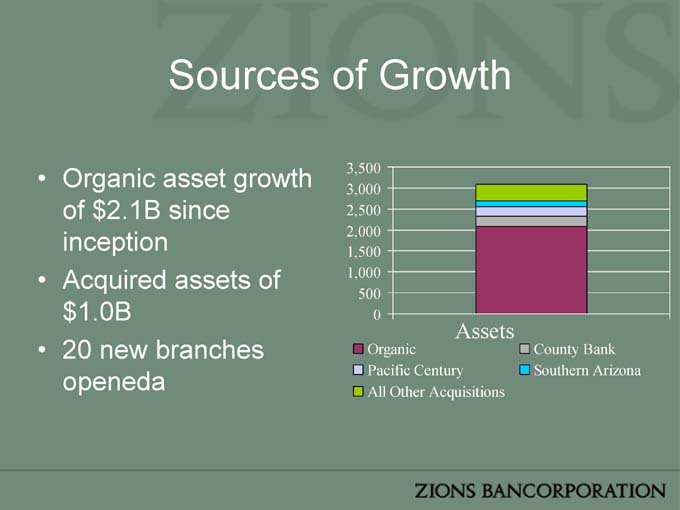
Sources of Growth
• Organic asset growth of $2.1B since inception
• Acquired assets of $1.0B
• 20 new branches openeda
Organic County Bank Pacific Century Southern Arizona All Other Acquisitions
Sources of Growth
• Established business banking acumen
–$ 1.7B of commercial and commercial real estate relationships
– 73% growth in past five years
Sources of Growth
• Recognized leader in residential lending
– Originated over $ 650MM in residential loans in 2003
– Maintain nearly $400MM in residential lot and construction loans
– Less than 25% of residential activity due to refinancing
Sources of Growth
• Executive Banking
– Division opened in 2002
– In excess of $150MM in loan commitments since inception
– Over 1,500 customer relationships

Sources of Growth
• Community Banking
– Reorganized in mid-2002 – recognizing the community market strength
– 33 community branches combined for local synergies
– Anticipate over 20% loan growth in 2004
Future Growth Opportunities
• Expanding Business Reach
• Community Banking
• Cross-Sell Expanding Client Services
• Strength From Expanding Retail Reach
• Strategic Acquisitions
Long-Term Outlook
Moderate Organic Revenue Growth + Continued Expense Control =
10% Annual Earnings Growth
[Acquisitions = Additional Growth]


ZIONS BANCORPORATION
ANALYST DAY
Nevada State Bank
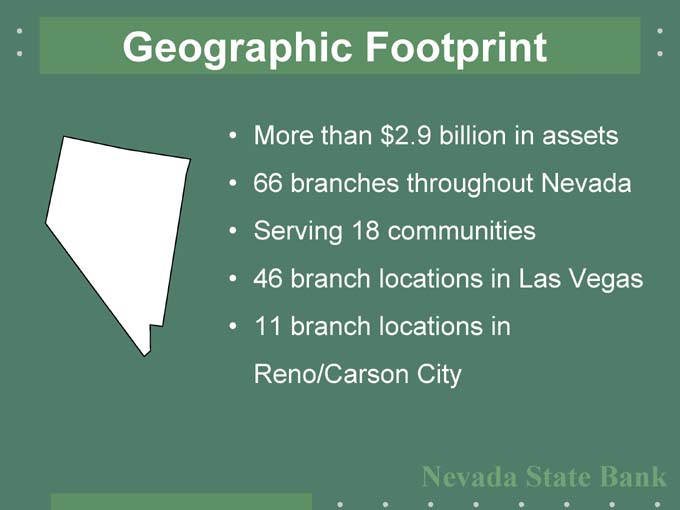
Geographic Footprint
• More than $2.9 billion in assets
• 66 branches throughout Nevada
• Serving 18 communities
• 46 branch locations in Las Vegas
• 11 branch locations in Reno/Carson City
Nevada State Bank
P
History of The Bank
1959—Nevada State Bank founded in Las Vegas 1985—Purchased by Zions Bancorporation 1989—Opened the first supermarket branch in Nevada 1997—Purchased Sun State Bank & five rural Wells Fargo locations 1999—Merged with Pioneer Citizens Bank of Nevada
• Pioneer Citizens Bank—Commercial/Real Estate focus
• Nevada State Bank—Retail/Small Business focus
Nevada State Bank
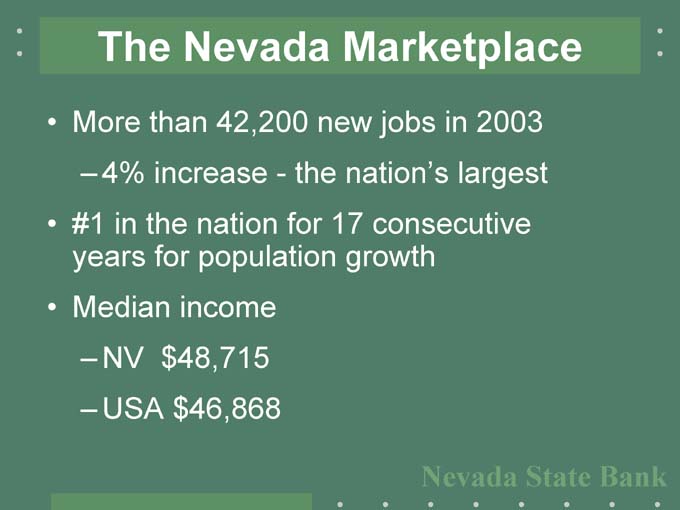
The Nevada Marketplace
• More than 42,200 new jobs in 2003
– 4% increase—the nation’s largest
• #1 in the nation for 17 consecutive years for population growth
• Median income
– NV $48,715
– USA $46,868
Nevada State Bank
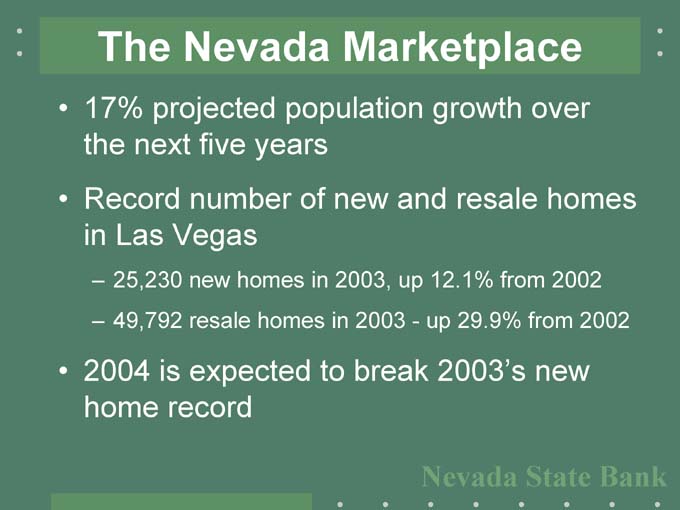
The Nevada Marketplace
• 17% projected population growth over the next five years
• Record number of new and resale homes in Las Vegas
– 25,230 new homes in 2003, up 12.1% from 2002
– 49,792 resale homes in 2003—up 29.9% from 2002
• 2004 is expected to break 2003’s new home record
Nevada State Bank

The Nevada Marketplace
Business Growth—Key Drivers
• Retail Growth—taxable sales up 7.5%
• Tourism/Travel—visitor volume up 1.1%
• Gaming Revenue—up 1.9% from 2002
Nevada State Bank
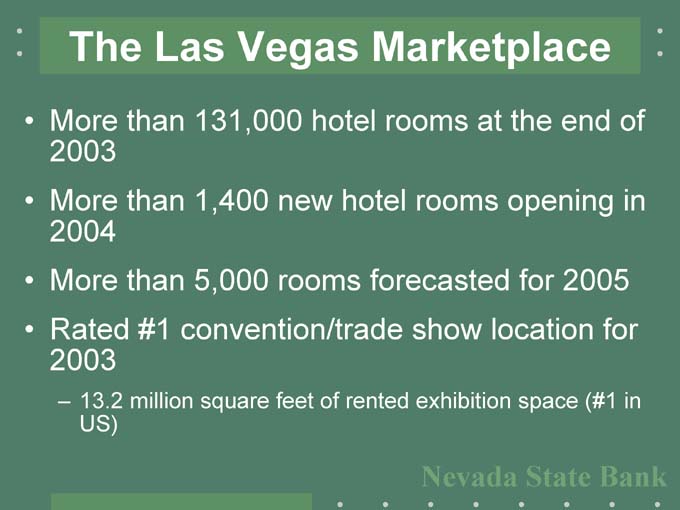
The Las Vegas Marketplace
• More than 131,000 hotel rooms at the end of 2003
• More than 1,400 new hotel rooms opening in 2004
• More than 5,000 rooms forecasted for 2005
• Rated #1 convention/trade show location for 2003
– 13.2 million square feet of rented exhibition space (#1 in US)
Nevada State Bank

Market Approach
Consumer Niche
• NSB’s position—alternative to the impersonal style of big banks
“Mega-bank products with community bank service”
• Greater product line advantage over community banks
Nevada State Bank

Market Approach
Corporate/Commercial Real Estate Niche
• NSB Advantage
– Business/professional products customized to specific needs
– Superior reputation as having “willing to go the extra mile” lenders
Nevada State Bank

Financial History
Total Deposits
Nevada State Bank

Loan History
Total Loans
Nevada State Bank

Asset Quality
NPA’s as % of Total Loans + OREO
Nevada State Bank
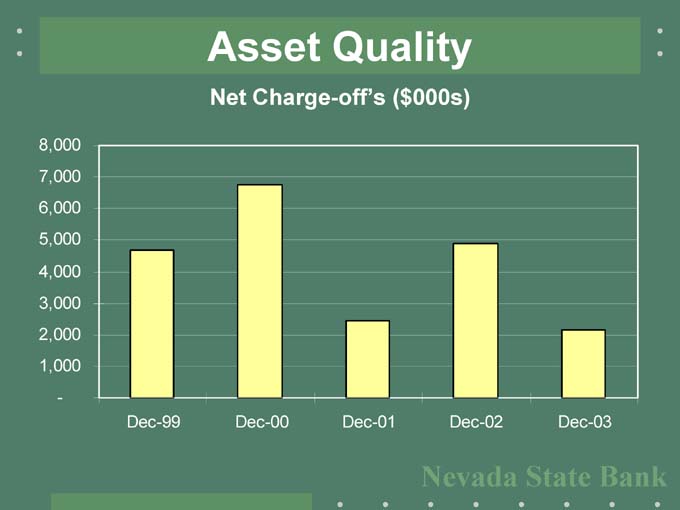
Asset Quality
Net Charge-off’s ($000s)
Nevada State Bank
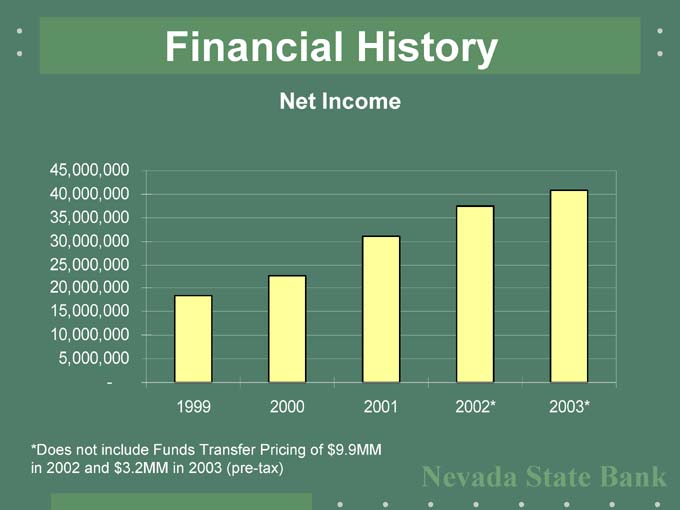
Financial History
Net Income
*Does not include Funds Transfer Pricing of $9.9MM in 2002 and $3.2MM in 2003 (pre-tax)
Nevada State Bank
Organic Growth
Branch Network
• 3 branches opened in 2003
• 6 branches planned for 2004
Nevada State Bank

Acquisition Growth
• No major opportunities
• Possible selective market fill-in’s
Nevada State Bank
Long-Term Growth Targets
CAGR (2005 – 2009)
• Revenue—10%
• Net Income – 10.9%
Nevada State Bank

Nevada State Bank
Zions Bancorporation
Analyst Day February 2004
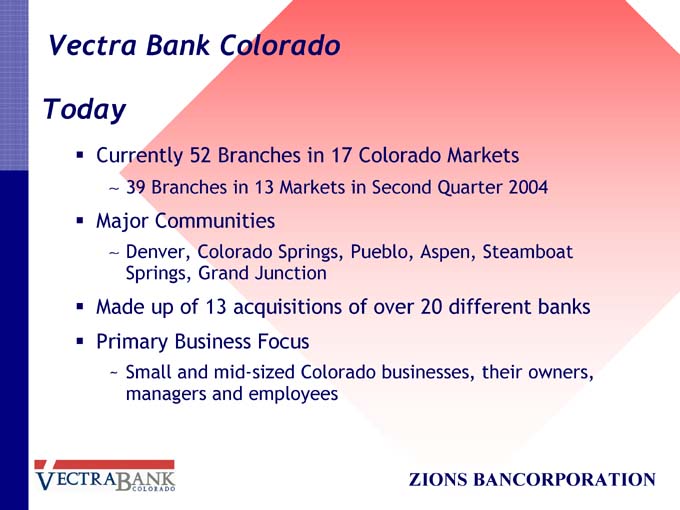
Vectra Bank Colorado
Today
Currently 52 Branches in 17 Colorado Markets
~ 39 Branches in 13 Markets in Second Quarter 2004
Major Communities
~ Denver, Colorado Springs, Pueblo, Aspen, Steamboat
Springs, Grand Junction
Made up of 13 acquisitions of over 20 different banks
Primary Business Focus
~ Small and mid-sized Colorado businesses, their owners,
managers and employees
ZIONS BANCORPORATION
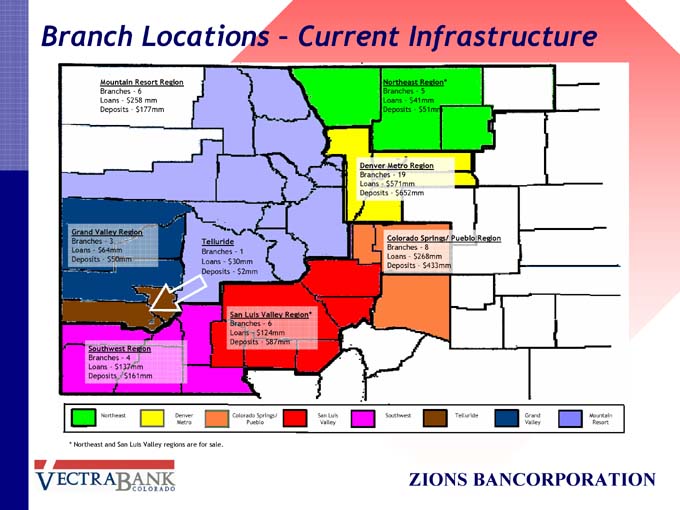
Branch Locations – Current Infrastructure
Mountain Resort Region
Branches – 6
Loans – $258 mm
Deposits – $177mm
Grand Valley Region
Branches – 3
Loans – $64mm
Deposits – $50mm
Southwest Region
Branches – 4
Loans – $137mm
Deposits – $161mm
Telluride
Branches – 1
Loans – $30mm
Deposits – $2mm
San Luis Valley Region*
Branches – 6
Loans – $124mm
Deposits – $87mm
Northeast Region*
Branches – 5
Loans – $41mm
Deposits – $51mm
Denver Metro Region
Branches – 19
Loans – $571mm
Deposits – $652mm
Colorado Springs/ Pueblo Region
Branches – 8
Loans – $268mm
Deposits – $433mm
Northeast
Denver Metro
Colorado Springs/ Pueblo
San Luis Valley
Southwest
Telluride
Grand Valley
Mountain Resort
ZIONS BANCORPORATION
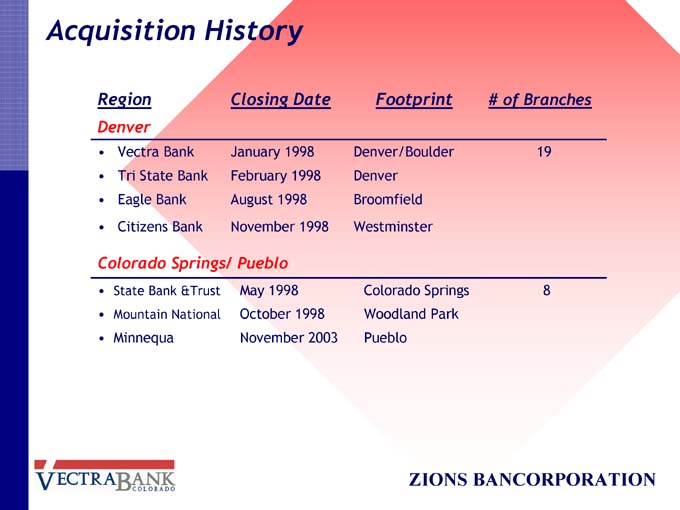
Acquisition History
Region Closing Date Footprint # of Branches
Denver
• Vectra Bank January 1998 Denver/Boulder 19
• Tri State Bank February 1998 Denver
• Eagle Bank August 1998 Broomfield
• Citizens Bank November 1998 Westminster
Colorado Springs/ Pueblo
• State Bank &Trust May 1998 Colorado Springs 8
• Mountain National October 1998 Woodland Park
• Minnequa November 2003 Pueblo
ZIONS BANCORPORATION
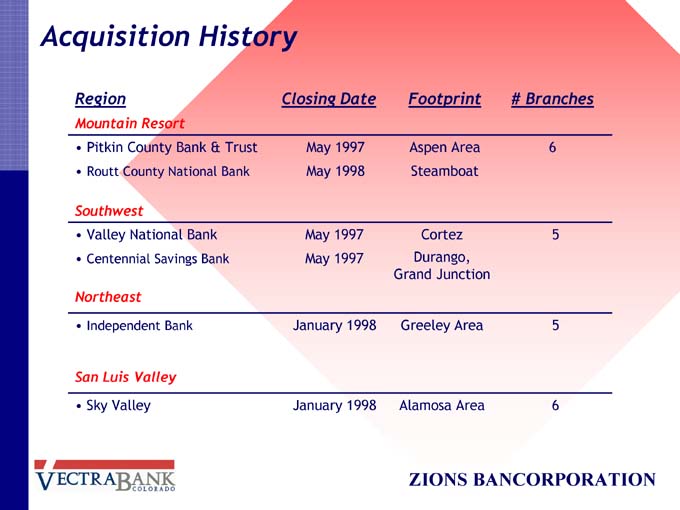
Acquisition History
Region Closing Date Footprint # Branches
Mountain Resort
• Pitkin County Bank & Trust May 1997 Aspen Area 6
• Routt County National Bank May 1998 Steamboat
Southwest
• Valley National Bank May 1997 Cortez 5
• Centennial Savings Bank May 1997 Durango,
Grand Junction
Northeast
• Independent Bank January 1998 Greeley Area 5
San Luis Valley
• Sky Valley January 1998 Alamosa Area 6
ZIONS BANCORPORATION
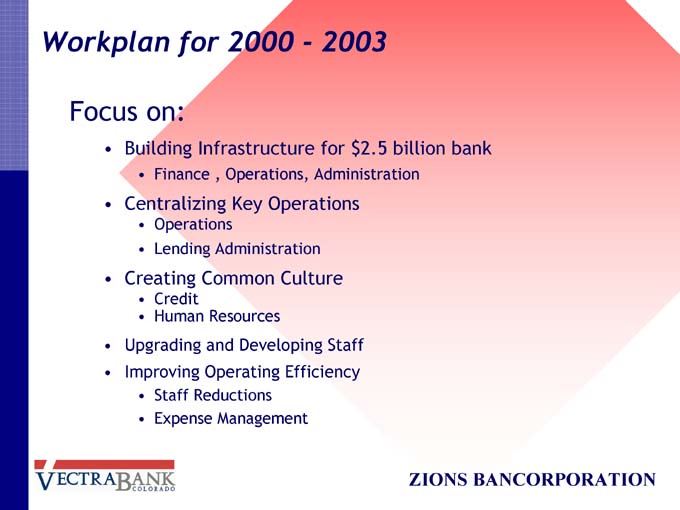
Workplan for 2000—2003
Focus on:
• Building Infrastructure for $2.5 billion bank
• Finance , Operations, Administration
• Centralizing Key Operations
• Operations
• Lending Administration
• Creating Common Culture
• Credit
• Human Resources
• Upgrading and Developing Staff
• Improving Operating Efficiency
• Staff Reductions
• Expense Management
ZIONS BANCORPORATION
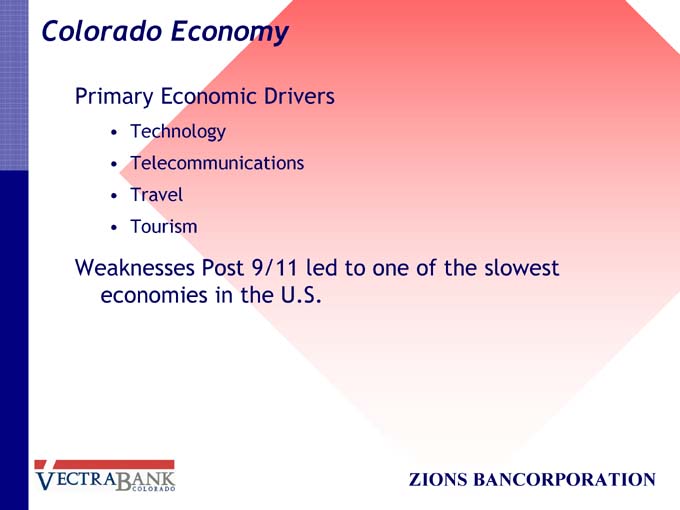
Colorado Economy
Primary Economic Drivers
• Technology
• Telecommunications
• Travel
• Tourism
Weaknesses Post 9/11 led to one of the slowest economies in the U.S.
ZIONS BANCORPORATION

Colorado Economy
Colorado Job Growth
Year Jobs Increase/Decrease
2002 - 40,000
2003 - 20,000
2004 + 15,000-25,000 (Projected)
Colorado Unemployment Rate
Year
2002 (average) 5.7%
December 31, 2003 5.6%
ZIONS BANCORPORATION
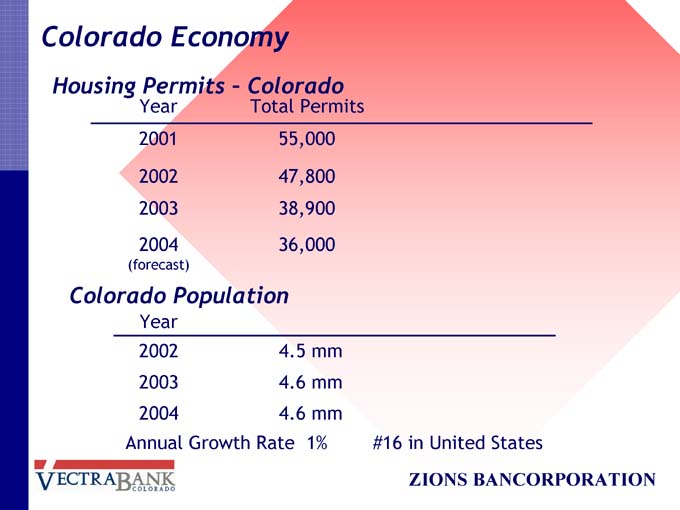
Colorado Economy
Housing Permits – Colorado
Year Total Permits
2001 55,000
2002 47,800
2003 38,900
2004 36,000
(forecast)
Colorado Population
2002 4.5 mm
2003 4.6 mm
2004 4.6 mm
Annual Growth Rate 1% #16 in United States
ZIONS BANCORPORATION
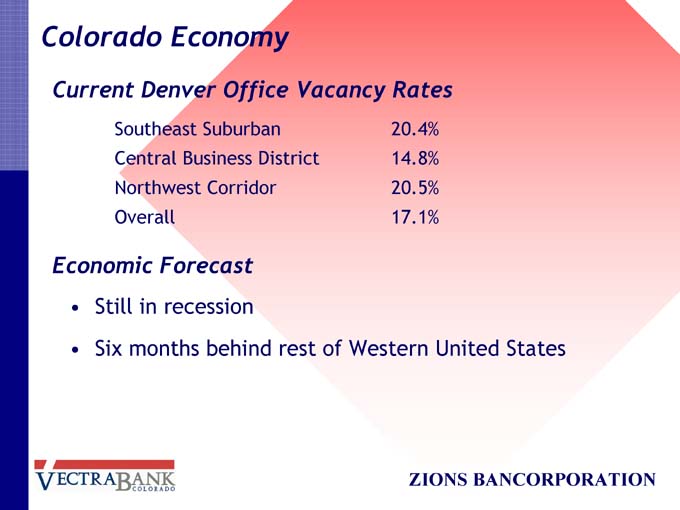
Colorado Economy
Current Denver Office Vacancy Rates
Southeast Suburban 20.4%
Central Business District 14.8%
Northwest Corridor 20.5%
Overall 17.1%
Economic Forecast
• Still in recession
• Six months behind rest of Western United States
ZIONS BANCORPORATION
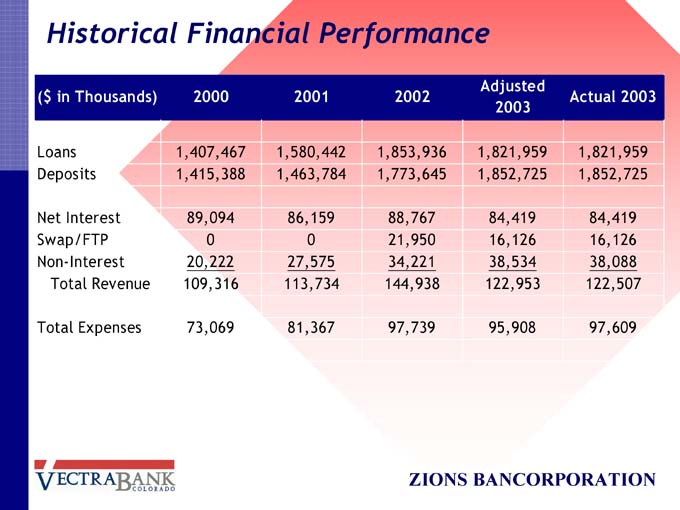
Historical Financial Performance
Adjusted
($ in Thousands) 2000 2001 2002 Actual 2003
2003
Loans 1,407,467 1,580,442 1,853,936 1,821,959 1,821,959
Deposits 1,415,388 1,463,784 1,773,645 1,852,725 1,852,725
Net Interest 89,094 86,159 88,767 84,419 84,419
Swap/FTP 0 0 21,950 16,126 16,126
Non-Interest 20,222 27,575 34,221 38,534 38,088
Total Revenue 109,316 113,734 144,938 122,953 122,507
Total Expenses 73,069 81,367 97,739 95,908 97,609
ZIONS BANCORPORATION
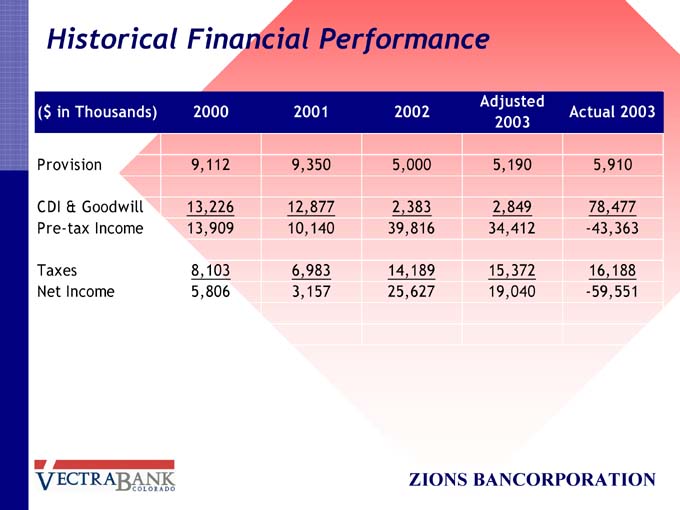
Historical Financial Performance
Adjusted
($ in Thousands) 2000 2001 2002 Actual 2003
2003
Provision 9,112 9,350 5,000 5,190 5,910
CDI & Goodwill 13,226 12,877 2,383 2,849 78,477
Pre-tax Income 13,909 10,140 39,816 34,412 -43,363
Taxes 8,103 6,983 14,189 15,372 16,188
Net Income 5,806 3,157 25,627 19,040 -59,551
ZIONS BANCORPORATION
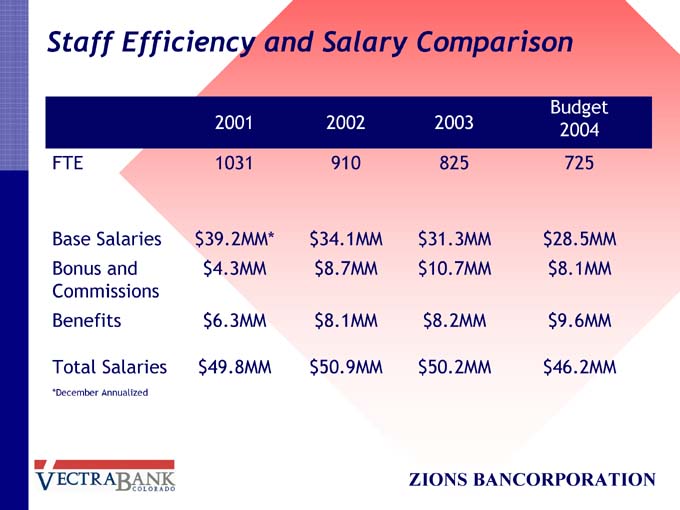
Staff Efficiency and Salary Comparison
Budget
2001 2002 2003 2004
FTE 1031 910 825 725
Base Salaries $ 39.2MM* $ 34.1MM $ 31.3MM $ 28.5MM
Bonus and $4.3MM $8.7MM $ 10.7MM $8.1MM
Commissions
Benefits $6.3MM $8.1MM $8.2MM $9.6MM
Total Salaries $49.8MM $ 50.9MM $ 50.2MM $ 46.2MM
*December Annualized
ZIONS BANCORPORATION
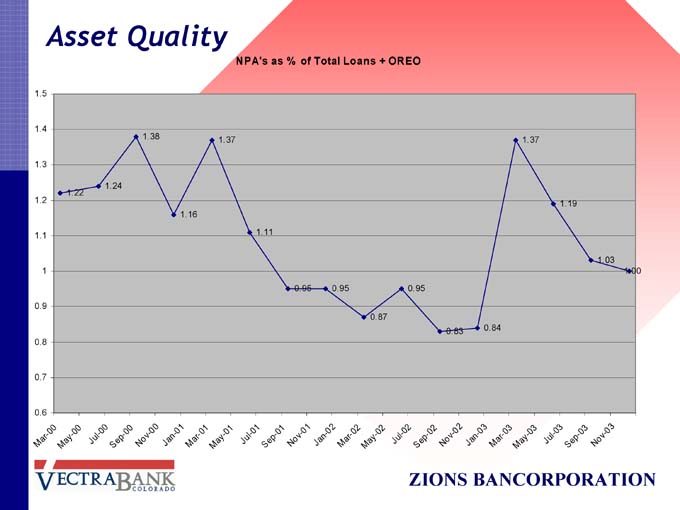
Asset Quality
NPA's as % of Total Loans + OREO
Mar- 00
May- 00
Jul- 00
Sep- 00
No
v—00
Jan- 01
Mar- 01
May- 01
Jul—01
Sep- 01
No
v—01
Jan-
02
Mar
- 02
May
- 02
Jul- 02
Sep
- 02
Nov-
02
Jan- 03
Mar
- 03
May
- 03
Jul- 03
Sep- 03
Nov-
03
ZIONS BANCORPORATION
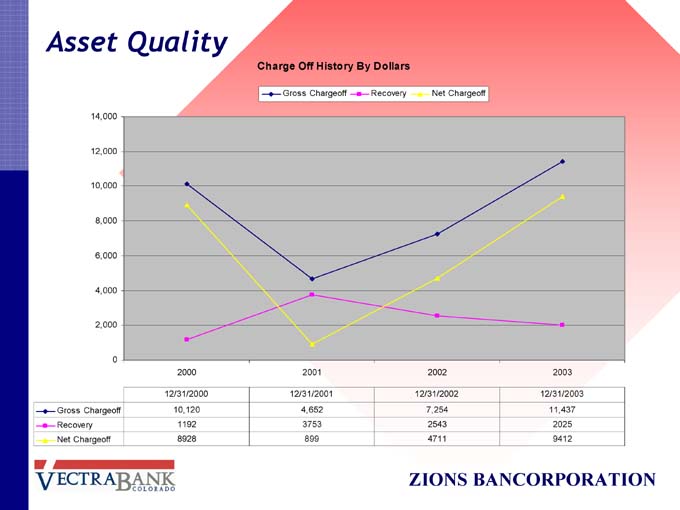
Asset Quality
Charge Off History By Dollars
Gross Chargeoff Recovery Net Chargeoff
12/31/2000 12/31/2001 12/31/2002 12/31/2003
Gross Chargeoff 10,120 4,652 7,254 11,437
Recovery 1192 3753 2543 2025
Net Chargeoff 8928 899 4711 9412
ZIONS BANCORPORATION
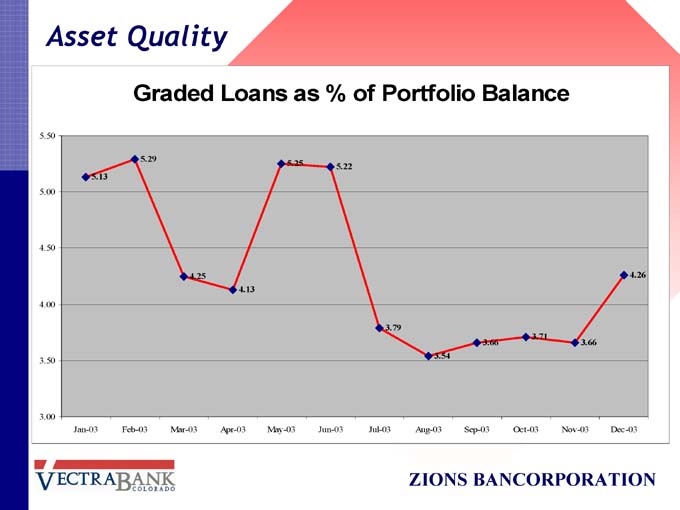
Asset Quality
Graded Loans as % of Portfolio Balance
Jan-03 Feb-03 Mar-03 Apr-03 May-03 Jun-03 Jul-03 Aug-03 Sep-03 Oct-03 Nov-03 Dec-03
ZIONS BANCORPORATION
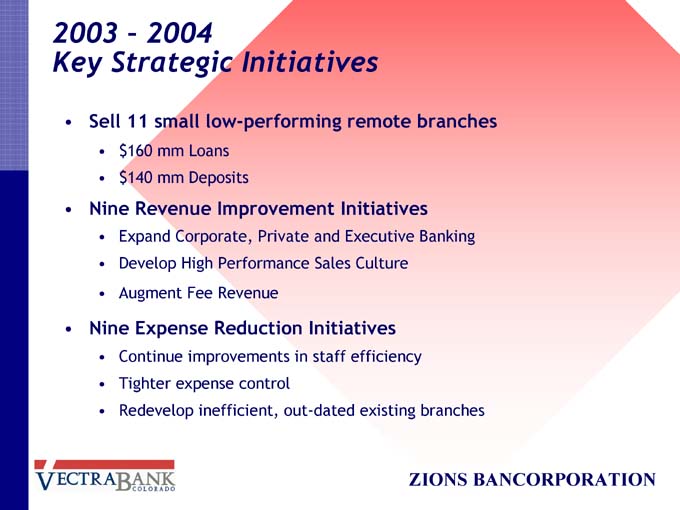
2003 – 2004
Key Strategic Initiatives
• Sell 11 small low-performing remote branches
• $160 mm Loans
• $140 mm Deposits
• Nine Revenue Improvement Initiatives
• Expand Corporate, Private and Executive Banking
• Develop High Performance Sales Culture
• Augment Fee Revenue
• Nine Expense Reduction Initiatives
• Continue improvements in staff efficiency
• Tighter expense control
• Redevelop inefficient, out-dated existing branches
ZIONS BANCORPORATION

Significant Growth Opportunities
2003 Average 2004 Pretax 2003 Pretax ($ in Thousands) Loan Operating Operating Income Balances Income
Corporate Banking 97,350 6,776 7,850
Real Estate Joint Venture 72,867 3,188 3,163
Private Banking 55,067 3,214 4,028
Executive Banking 0 0 -514
Total 225,284 13,178 14,527
ZIONS BANCORPORATION

Outlook for Growth
• Realigned Management Structure to focus on business opportunities
• Successful Recruiting efforts (New High Quality Staff)
• New Leadership in:
• Corporate Banking
• Community Banking
• Private Banking
• Chief Financial Officer
• Denver Commercial Banking
• Lower Expense Base (Staff and Operating costs)
• Develop Expansion Strategy in High Growth Business Markets
• Denver
• Colorado Springs
• Grand Junction
ZIONS BANCORPORATION
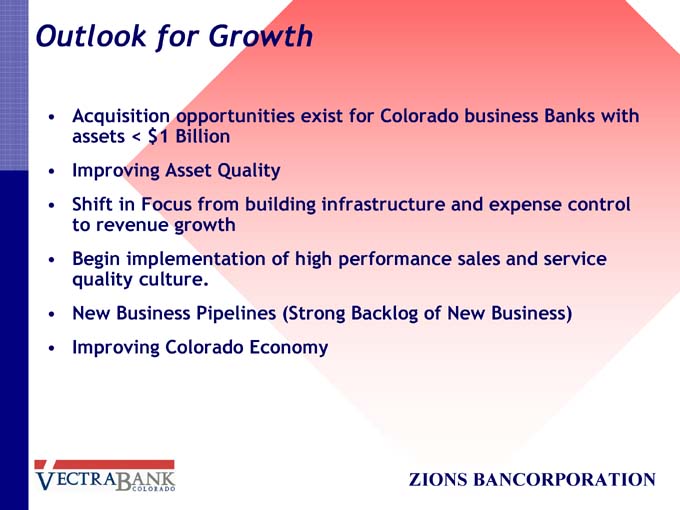
Outlook for Growth
• Acquisition opportunities exist for Colorado business Banks with
assets < $1 Billion
• Improving Asset Quality
• Shift in Focus from building infrastructure and expense control
to revenue growth
• Begin implementation of high performance sales and service
quality culture.
• New Business Pipelines (Strong Backlog of New Business)
• Improving Colorado Economy
ZIONS BANCORPORATION
THE COMMERCE BANK
OF WASHINGTON
Historical Data
• Opened for business July 1, 1988
– Merged with Zions Bancorporation in September, 1998
• Currently over $700 million in assets
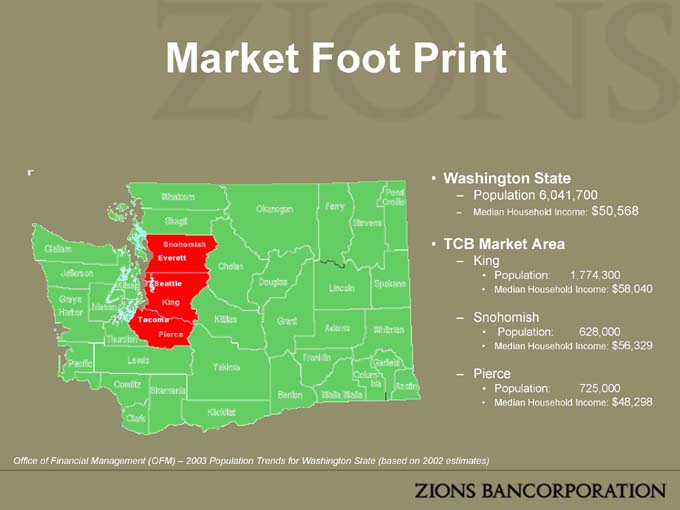
Market Foot Print
• Washington State
– Population 6,041,700
– Median Household Income: $ 50,568
• TCB Market Area
– King
• Population: 1,774,300
• Median Household Income: $ 58,040
– Snohomish
• Population: 628,000
• Median Household Income: $ 56,329
– Pierce
• Population: 725,000
• Median Household Income: $ 48,298
Office of Financial Management (OFM) – 2003 Population Trends for Washington State (based on 2002 estimates)
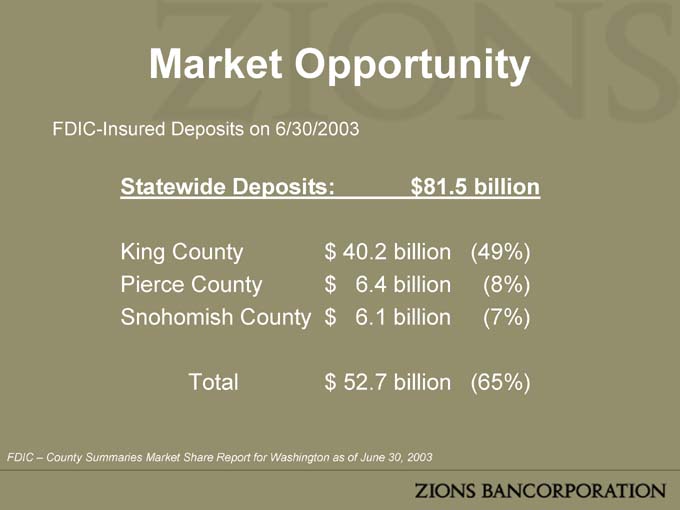
Market Opportunity
FDIC-Insured Deposits on 6/30/2003
Statewide Deposits: $81.5 billion
King County $ 40.2 billion (49%)
Pierce County $ 6.4 billion (8%)
Snohomish County $ 6.1 billion (7%)
Total $ 52.7 billion (65%)
FDIC – County Summaries Market Share Report for Washington as of June 30, 2003
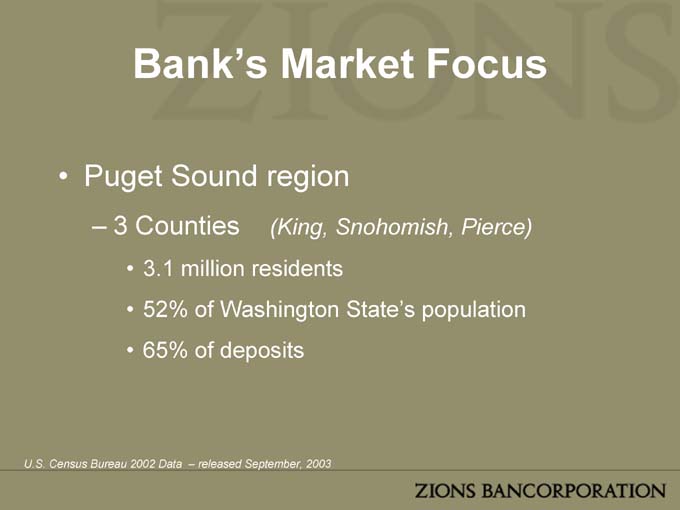
Bank’s Market Focus
• Puget Sound region
– 3 Counties (King, Snohomish, Pierce)
• 3.1 million residents
• 52% of Washington State’s population
• 65% of deposits
U.S. Census Bureau 2002 Data – released September, 2003
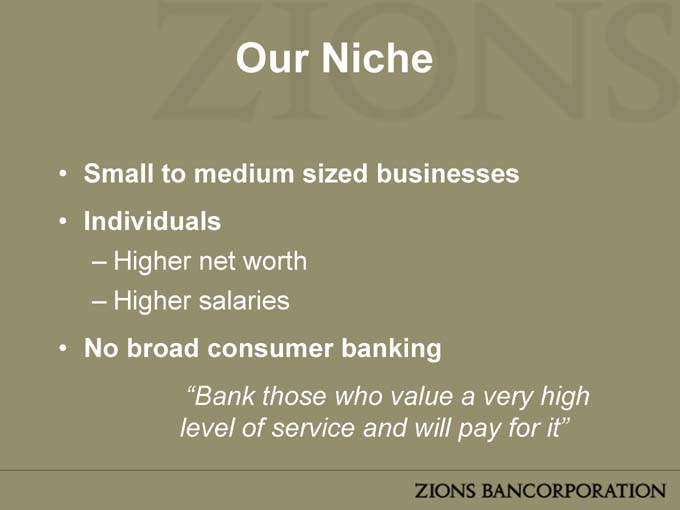
Our Niche
• Small to medium sized businesses
• Individuals
– Higher net worth
– Higher salaries
• No broad consumer banking
“Bank those who value a very high
level of service and will pay for it”
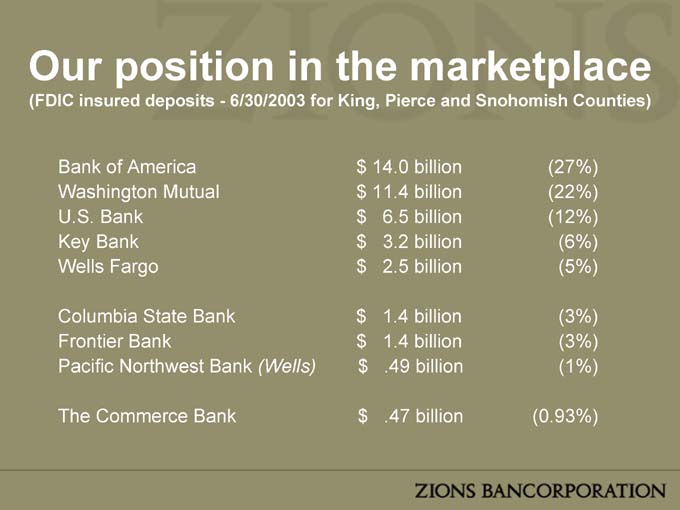
Our position in the marketplace
(FDIC insured deposits—6/30/2003 for King, Pierce and Snohomish Counties)
Bank of America $ 14.0 billion (27%)
Washington Mutual $ 11.4 billion (22%)
U.S. Bank $ 6.5 billion (12%)
Key Bank $ 3.2 billion (6%)
Wells Fargo $ 2.5 billion (5%)
Columbia State Bank $ 1.4 billion (3%)
Frontier Bank $ 1.4 billion (3%)
Pacific Northwest Bank (Wells) $ .49 billion (1%)
The Commerce Bank $ .47 billion (0.93%)
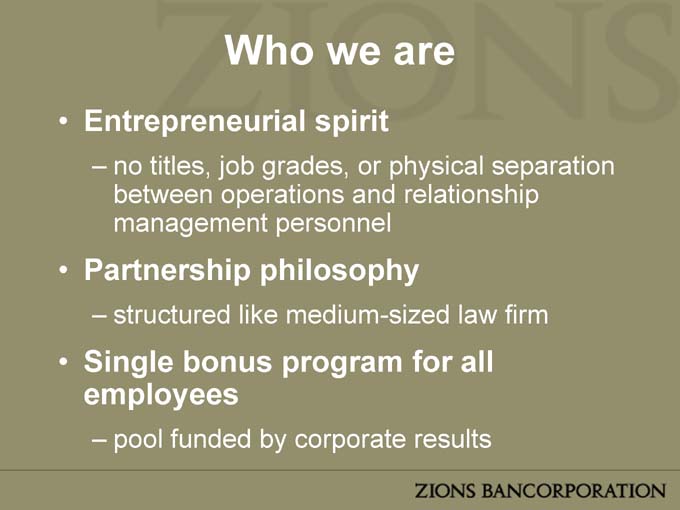
Who we are
• Entrepreneurial spirit
– no titles, job grades, or physical separation
between operations and relationship
management personnel
• Partnership philosophy
– structured like medium-sized law firm
• Single bonus program for all
employees
– pool funded by corporate results
Positioning of Products
• Deliver internally only those products in
which we can excel.
• Primary focus has been interest
differential products:
– Loans (including commercial real estate)
– Deposits and cash management
– Niche products
(i.e., Multiple Participant Deposit [MPD] Accounts)
Product Delivery
• No branches
– Single location on 36th floor of downtown Seattle high-rise
• Courier system
– 5 vans
– 2 modified armored trucks
– one walk-route messenger
• Electronic Convenience
– ATM network member
– Bank-by-Mail
– ACH
– Internet banking
– Bill paying capability
Bank Staff
• 55 total employees
• Back-office operational functions outsourced
when possible
• Client-oriented staff
• Very experienced relationship managers
and customer service personnel
(26 years average lending experience)
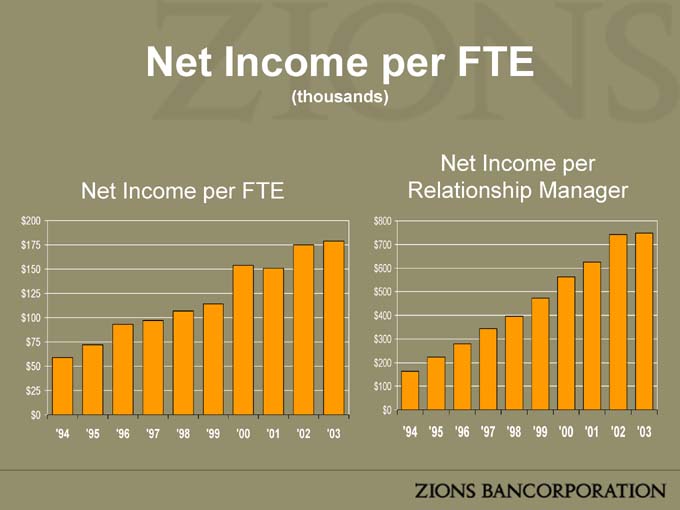
Net Income per FTE
(thousands)
Net Income per FTE
‘94 ‘95 ‘96 ‘97 ‘98 ‘99 ‘00 ‘01 ‘02 ‘03
Net Income per Relationship Manager
‘94 ‘95 ‘96 ‘97 ‘98 ‘99 ‘00 ‘01 ‘02 ‘03
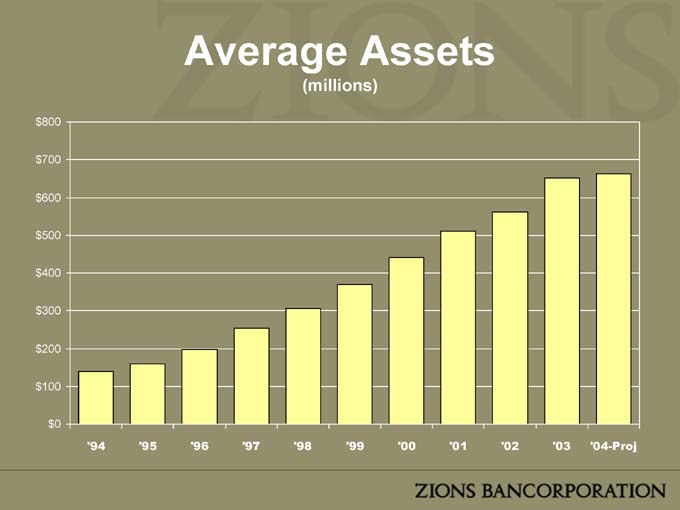
Average Assets
(millions)
‘94 ‘95 ‘96 ‘97 ‘98 ‘99 ‘00 ‘01 ‘02 ‘03 ‘04-Proj
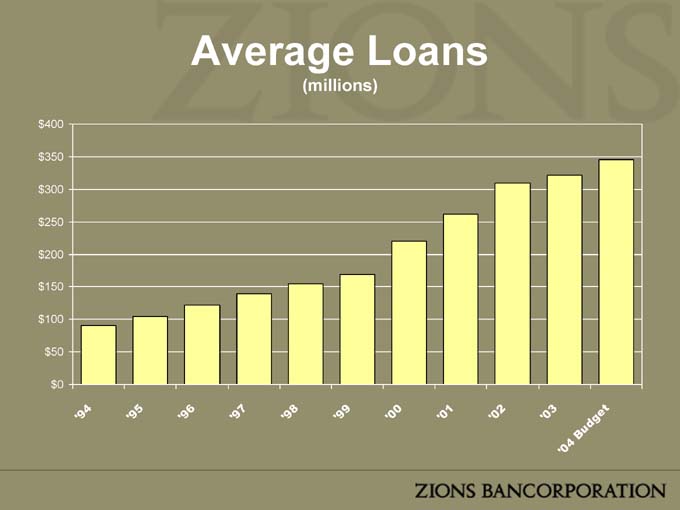
Average Loans
(millions)
‘ 94
‘95
‘96
‘97
‘ 98
‘99
‘ 00
‘ 01
‘02
‘03
‘04
Budget
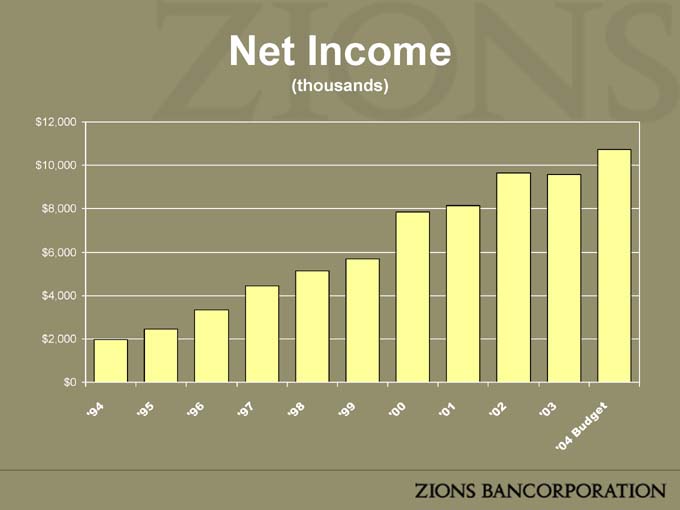
Net Income
(thousands)
‘94
‘95
‘96
‘ 97
‘98
‘ 99
‘00
‘01
‘02
‘ 03
‘ 04
Bud get
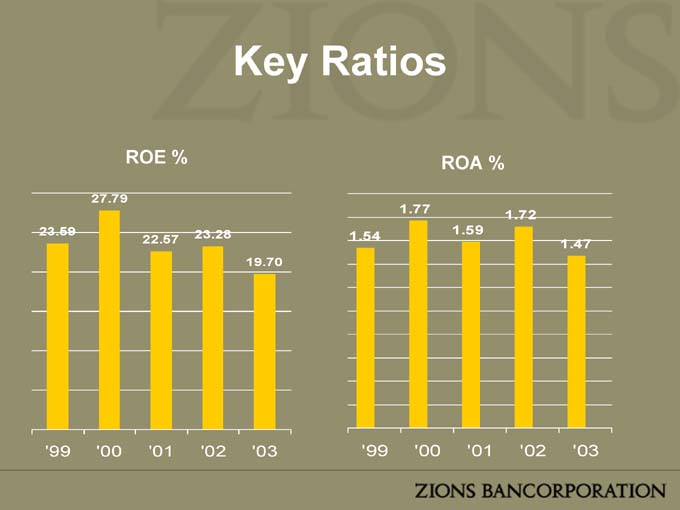
Key Ratios
ROE %
‘99 ‘00 ‘01 ‘02 ‘03
ROA %
‘99 ‘00 ‘01 ‘02 ‘03
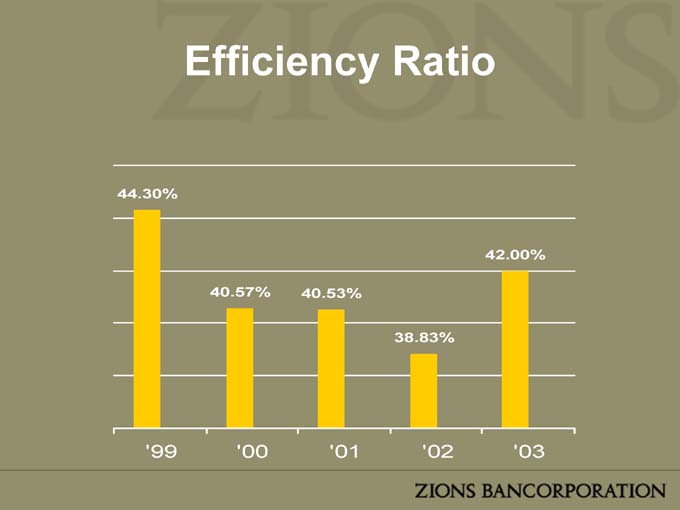
Efficiency Ratio
‘99 ‘00 ‘01 ‘02 ‘03
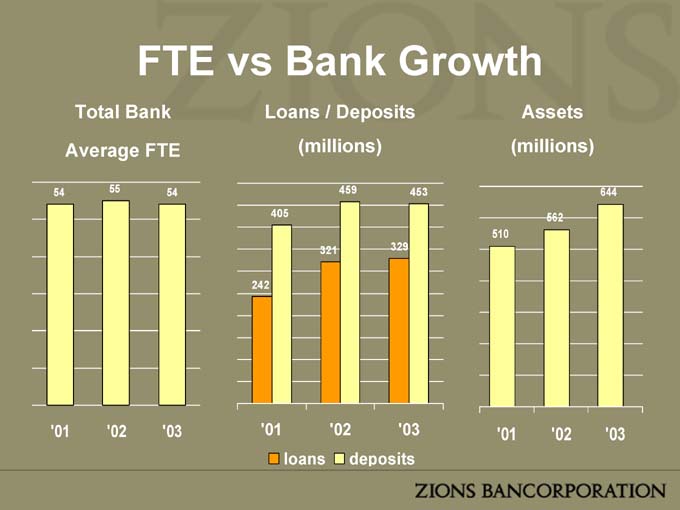
FTE vs Bank Growth
Total Bank
Average FTE
‘01 ‘02 ‘03
Loans / Deposits (millions)
‘01 ‘02 ‘03
Assets (millions)
‘01 ‘02 ‘03
loans deposits
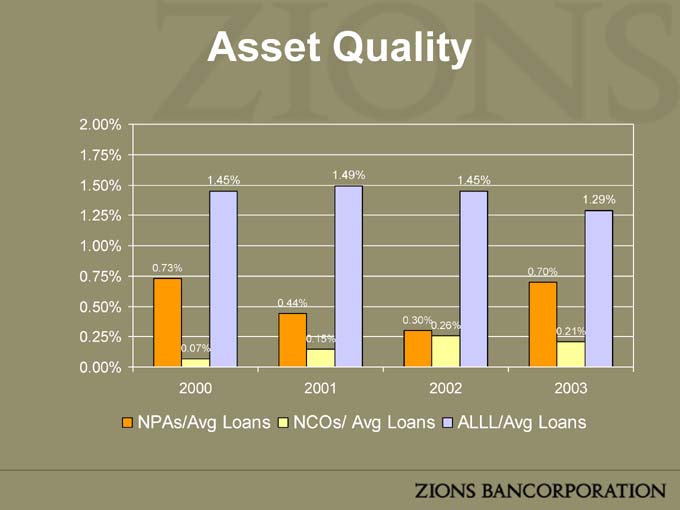
Asset Quality
2000 2001 2002 2003
NPAs/Avg Loans NCOs/ Avg Loans ALLL/Avg Loans
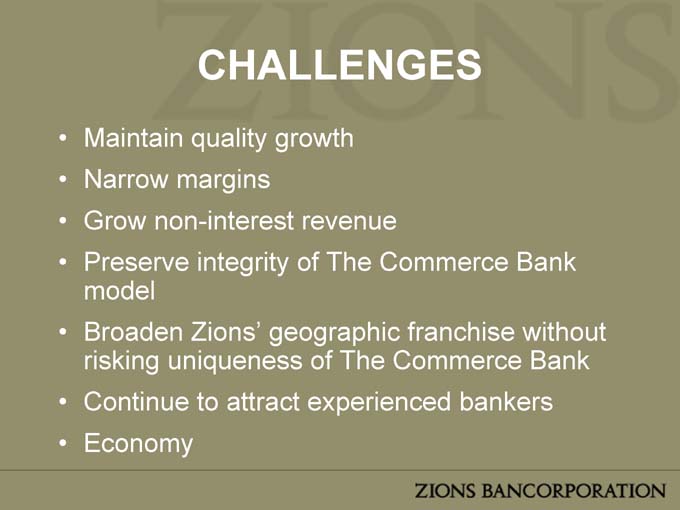
CHALLENGES
• Maintain quality growth
• Narrow margins
• Grow non-interest revenue
• Preserve integrity of The Commerce Bank
model
• Broaden Zions’ geographic franchise without
risking uniqueness of The Commerce Bank
• Continue to attract experienced bankers
• Economy
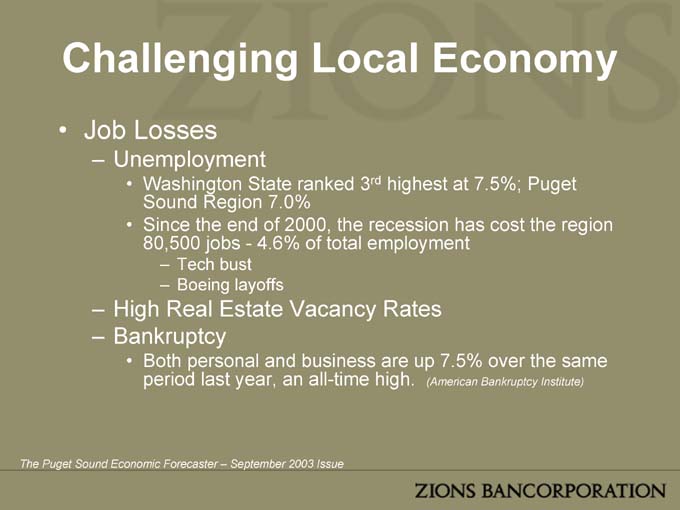
Challenging Local Economy
• Job Losses
– Unemployment
• Washington State ranked 3rd highest at 7.5%; Puget
Sound Region 7.0%
• Since the end of 2000, the recession has cost the region
80,500 jobs - - 4.6% of total employment
– Tech bust
– Boeing layoffs
– High Real Estate Vacancy Rates
– Bankruptcy
• Both personal and business are up 7.5% over the same
period last year, an all-time high. (American Bankruptcy Institute)
The Puget Sound Economic Forecaster – September 2003 Issue
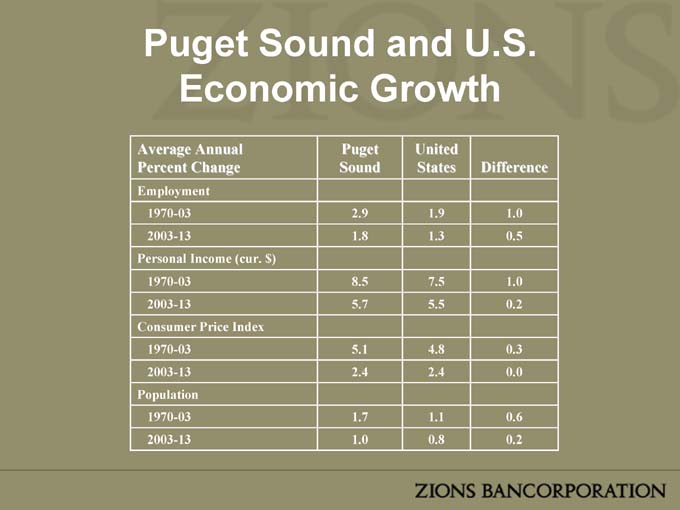
Puget Sound and U.S.
Economic Growth
Average Annual Puget United
Percent Change Sound States Difference
Employment
1970-03 2.9 1.9 1.0
2003-13 1.8 1.3 0.5
Personal Income (cur. $)
1970-03 8.5 7.5 1.0
2003-13 5.7 5.5 0.2
Consumer Price Index
1970-03 5.1 4.8 0.3
2003-13 2.4 2.4 0.0
Population
1970-03 1.7 1.1 0.6
2003-13 1.0 0.8 0.2
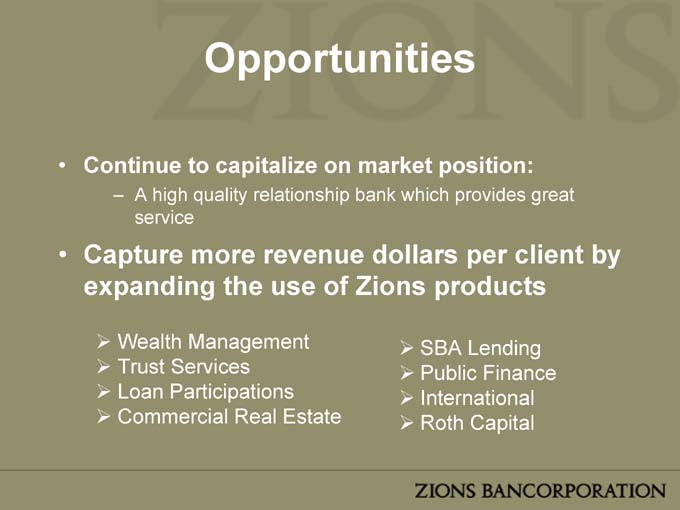
Opportunities
• Continue to capitalize on market position:
– A high quality relationship bank which provides great service
• Capture more revenue dollars per client by expanding the use of Zions products
Wealth Management SBA Lending
Trust Services Public Finance
Loan Participations International
Commercial Real Estate Roth Capital
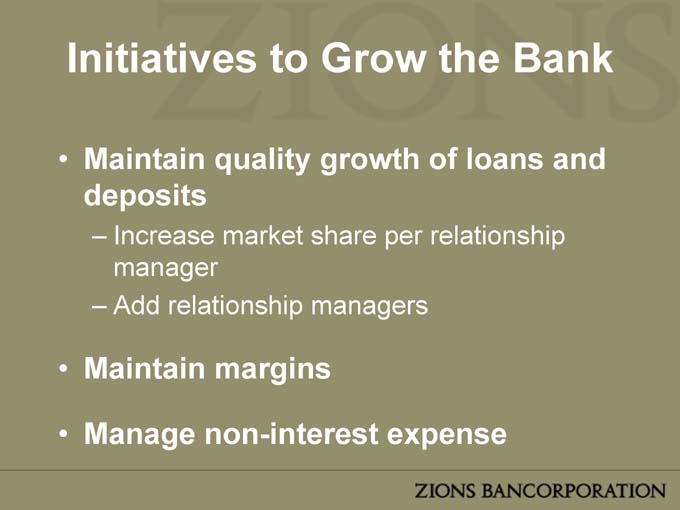
Initiatives to Grow the Bank
• Maintain quality growth of loans and
deposits
– Increase market share per relationship
manager
• Maintain margins
• Manage non-interest expense
Product Expansion
• Wealth Management Initiatives
– Trust Services
– Private Banking
• Cash Management
(i.e., real-time wire transfer)
• Product Mix
– Emphasize fee income opportunities in Cash
Management, Deposit, Loan, FX and Zions
cross-sales
Growth Through Acquisition
• Potential Target Areas
– Commercial Banks / Savings Banks
– Investment Management / Trust
Companies
– Growth through expansion to Bellevue and
Portland
Zions Bancorporation Analyst Day
19 February 2004 Salt Lake City, Utah
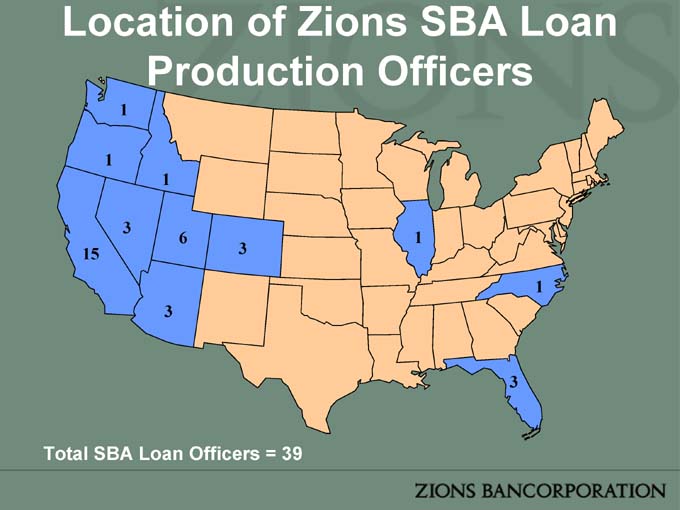
Location of Zions SBA Loan Production Officers
Total SBA Loan Officers = 39
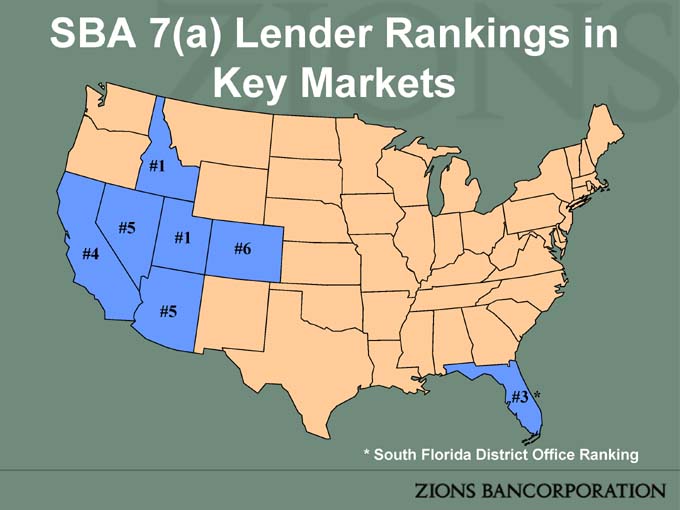
SBA 7(a) Lender Rankings in Key Markets
* South Florida District Office Ranking
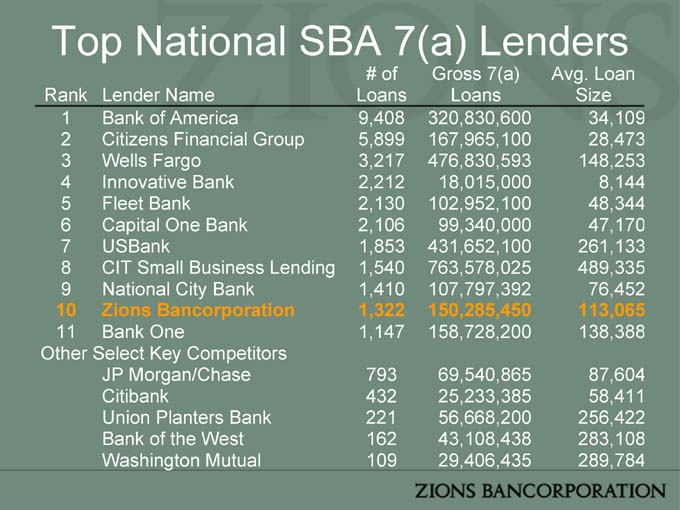
Top National SBA 7(a) Lenders
# of Gross 7(a) Avg. Loan
Rank Lender Name Loans Loans Size
1 Bank of America 9,408 320,830,600 34,109
2 Citizens Financial Group 5,899 167,965,100 28,473
3 Wells Fargo 3,217 476,830,593 148,253
4 Innovative Bank 2,212 18,015,000 8,144
5 Fleet Bank 2,130 102,952,100 48,344
6 Capital One Bank 2,106 99,340,000 47,170
7 USBank 1,853 431,652,100 261,133
8 CIT Small Business Lending 1,540 763,578,025 489,335
9 National City Bank 1,410 107,797,392 76,452
10 Zions Bancorporation 1,322 150,285,450 113,065
11 Bank One 1,147 158,728,200 138,388
Other Select Key Competitors
JP Morgan/Chase 793 69,540,865 87,604
Citibank 432 25,233,385 58,411
Union Planters Bank 221 56,668,200 256,422
Bank of the West 162 43,108,438 283,108
Washington Mutual 109 29,406,435 289,784
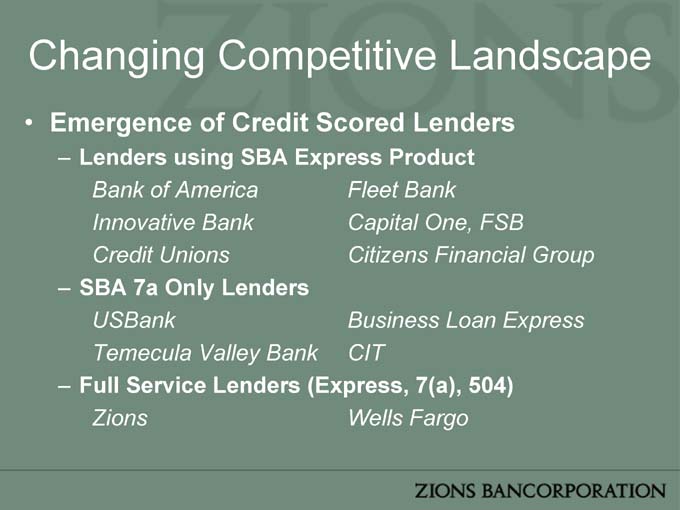
Changing Competitive Landscape
• Emergence of Credit Scored Lenders
– Lenders using SBA Express Product
Bank of America Fleet Bank Innovative Bank Capital One, FSB Credit Unions Citizens Financial Group
– SBA 7a Only Lenders
USBank Business Loan Express Temecula Valley Bank CIT
– Full Service Lenders (Express, 7(a), 504)
Zions Wells Fargo
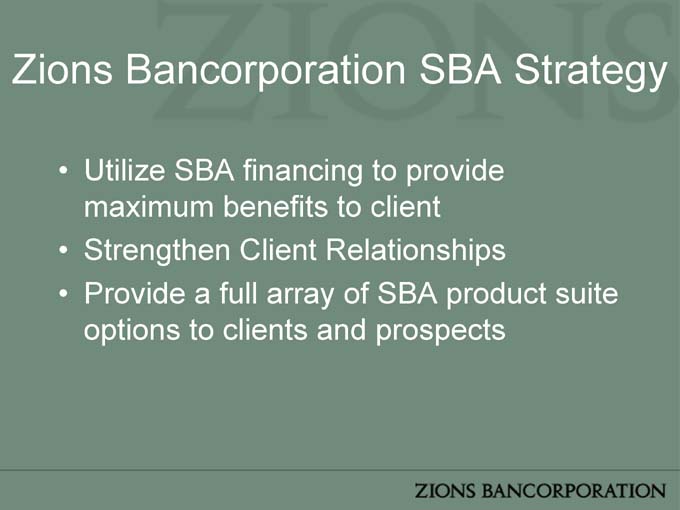
Zions Bancorporation SBA Strategy
• Utilize SBA financing to provide maximum benefits to client
• Strengthen Client Relationships
• Provide a full array of SBA product suite options to clients and prospects
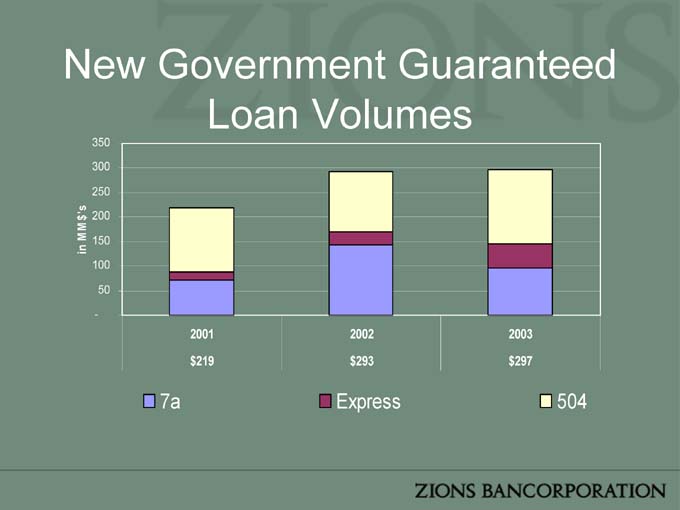
New Government Guaranteed Loan Volumes
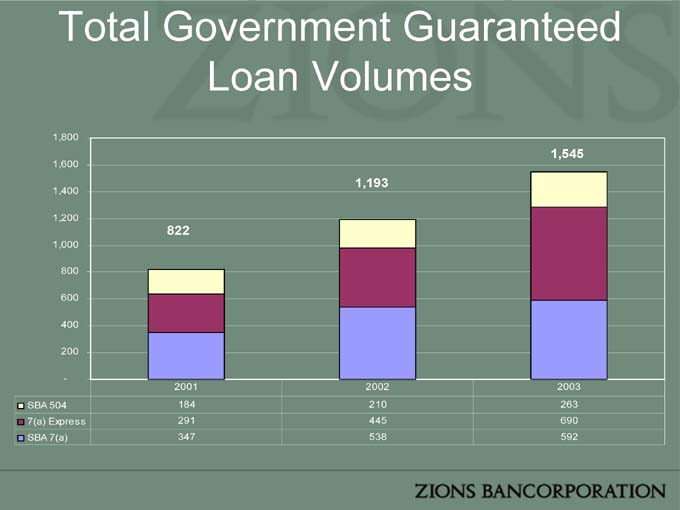
Total Government Guaranteed Loan Volumes
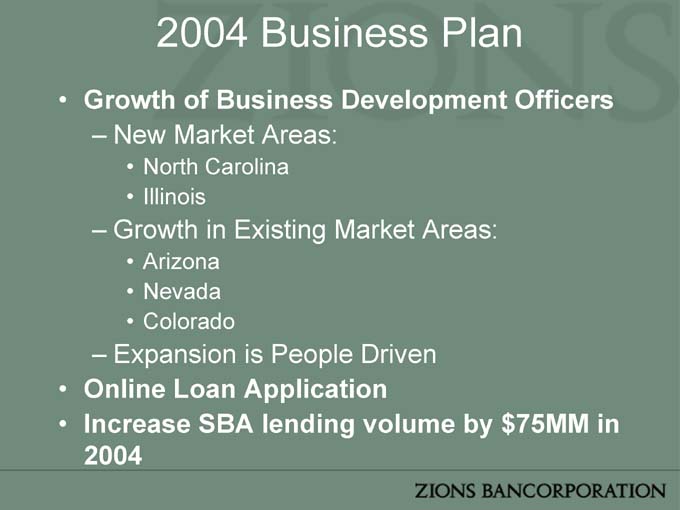
2004 Business Plan
• Growth of Business Development Officers
– New Market Areas:
• North Carolina
• Illinois
– Growth in Existing Market Areas:
• Arizona
• Nevada
• Colorado
– Expansion is People Driven
• Online Loan Application
• Increase SBA lending volume by $75MM in 2004
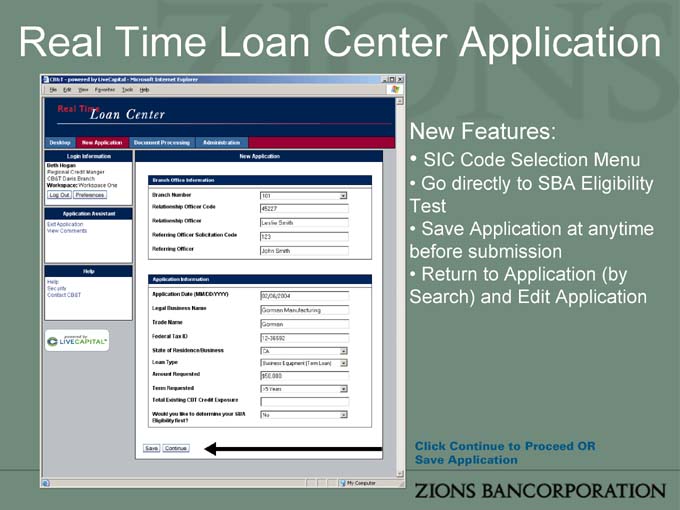
Real Time Loan Center Application
New Features:
• SIC Code Selection Menu
• Go directly to SBA Eligibility Test
• Save Application at anytime before submission
• Return to Application (by Search) and Edit Application
Click Continue to Proceed OR Save Application
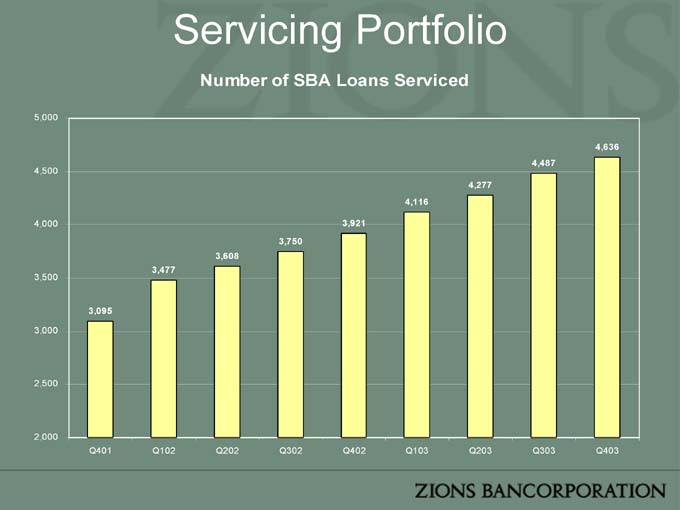
Servicing Portfolio
Number of SBA Loans Serviced
Servicing Portfolio
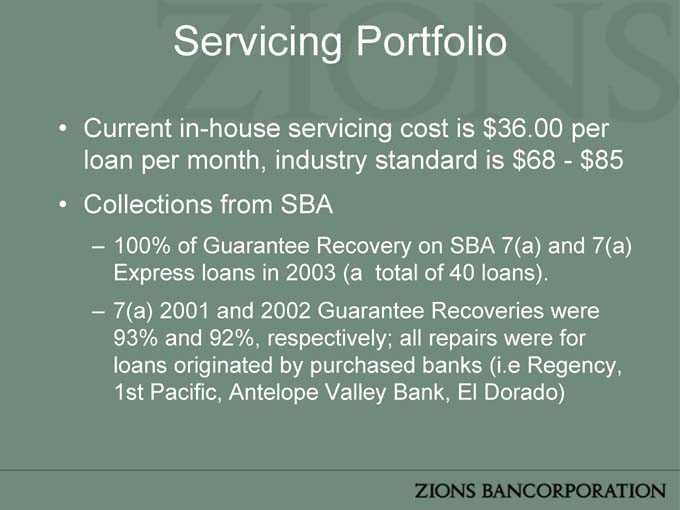
• Current in-house servicing cost is $36.00 per loan per month, industry standard is $68—$85
• Collections from SBA
– 100% of Guarantee Recovery on SBA 7(a) and 7(a) Express loans in 2003 (a total of 40 loans).
– 7(a) 2001 and 2002 Guarantee Recoveries were 93% and 92%, respectively; all repairs were for loans originated by purchased banks (i.e Regency, 1st Pacific, Antelope Valley Bank, El Dorado)
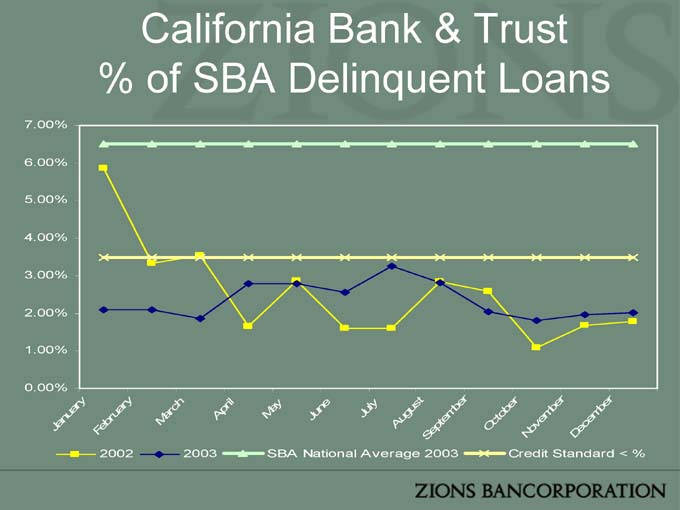
California Bank & Trust % of SBA Delinquent Loans

California Bank & Trust % of SBA Loan Loss Actuals
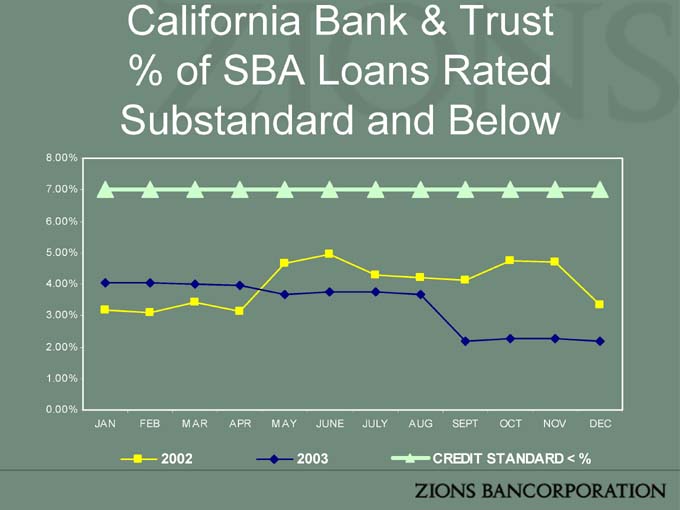
California Bank & Trust % of SBA Loans Rated Substandard and Below

SIC Concentration as of Dec 2003
Health services Wholesale trade—durable goods
Automotive repair, services, and parking Special trade contractors
Business services Engineering and management services
Food stores Agricultural services
Electrical and electronic equipment Legal services
Food and kindred products Furniture, home furnishings and equipment
Furniture and fixtures Insurance agents, brokers, and service
Lumber and wood products Real estate
Apparel and accessory stores Stone, clay, glass, and concrete products
Educational services M iscellaneous manufacturing industries
Chemicals and allied products Electric, gas, and sanitary services
Rubber and miscellaneous plastics products M otion pictures
Water transportation Holding and other investment offices
Communications Depository institutions
Agricultural production- crops Oil and gas extraction
Tobacco manufacturers Leather and leather products
Textile mill products Insurance carriers
Justice, public order, and safety Railroads, Line-haul Operating
Automotive dealers and gasoline service Eating and drinking places
Wholesale trade—nondurable goods Hotels, rooming houses, camps, and other
M iscellaneous retail Social services
M otor freight transportation and warehousing Industrial machinery and equipment
Fabricated metal products Transportation equipment
General building contractors Personal services
Printing and publishing General merchandise stores
Instruments and related products M iscellaneous repair services
Apparel and other textile products Amusement and recreational services
Building materials, hardware, garden supply, Heavy construction contractors
Private households Transportation services
Security, commodity brokers, and services Nondepository credit institutions
Primary metal industries M useums, art galleries, botanical &
Transportation by air Paper and allied products
Nonclassifiable Establishments Local and interurban passenger transit
M iscellaneous services Petroleum and coal products
Administration of economic programs Forestry
Agricultural production- livestock
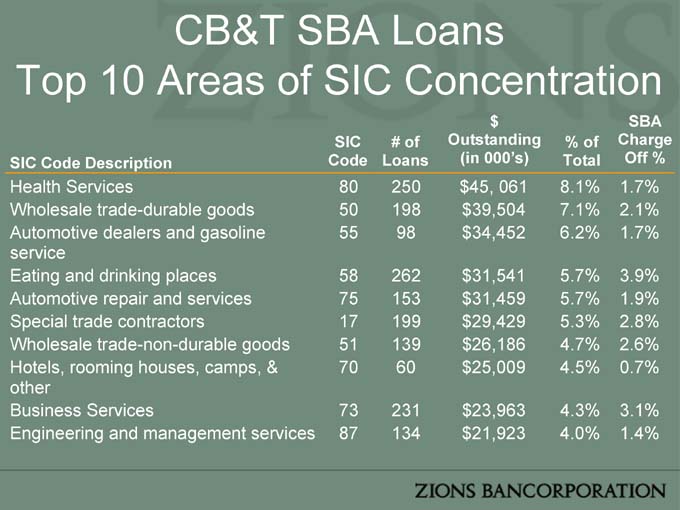
CB&T SBA Loans
Top 10 Areas of SIC Concentration
SIC # of $Outstanding % of SBA Charge
SIC Code Description Code Loans (in 000’s) Total Off %
Health Services 80 250 $45, 061 8.1% 1.7%
Wholesale trade-durable goods 50 198 $39,504 7.1% 2.1%
Automotive dealers and gasoline service 55 98 $34,452 6.2% 1.7%
Eating and drinking places 58 262 $31,541 5.7% 3.9%
Automotive repair and services 75 153 $31,459 5.7% 1.9%
Special trade contractors 17 199 $29,429 5.3% 2.8%
Wholesale trade-non-durable goods 51 139 $26,186 4.7% 2.6%
Hotels, rooming houses, camps, & other 70 60 $25,009 4.5% 0.7%
Business Services 73 231 $23,963 4.3% 3.1%
Engineering and management services 87 134 $21,923 4.0% 1.4%
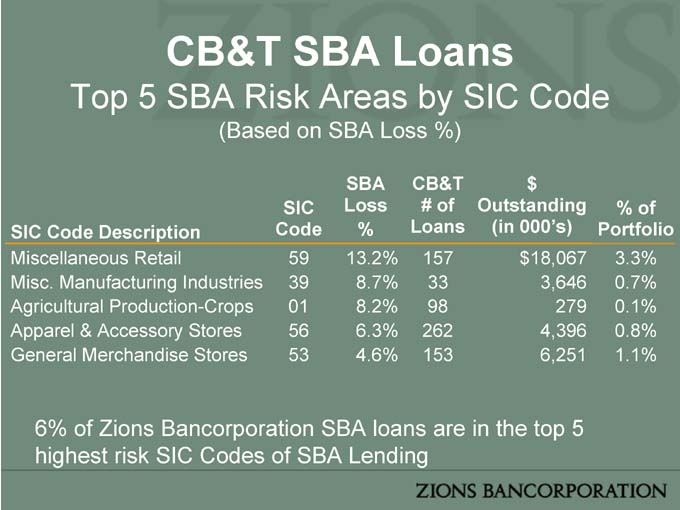
CB&T SBA Loans
Top 5 SBA Risk Areas by SIC Code
(Based on SBA Loss %)
SIC SBA Loss CB&T # of $ Outstanding % of
SIC Code Description Code % Loans (in 000’s) Portfolio
Miscellaneous Retail 59 13.2% 157 $ 18,067 3.3%
Misc. Manufacturing Industries 39 8.7% 33 3,646 0.7%
Agricultural Production-Crops 01 8.2% 98 279 0.1%
Apparel & Accessory Stores 56 6.3% 262 4,396 0.8%
General Merchandise Stores 53 4.6% 153 6,251 1.1%
6% of Zions Bancorporation SBA loans are in the top 5 highest risk SIC Codes of SBA Lending
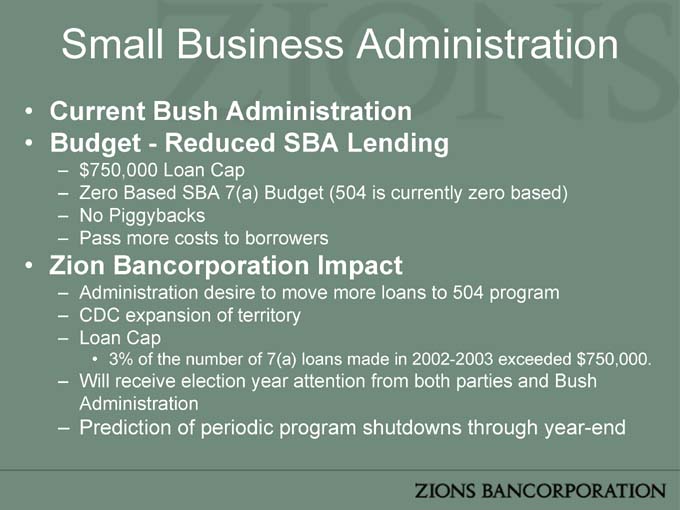
Small Business Administration
• Current Bush Administration
• Budget—Reduced SBA Lending
–$ 750,000 Loan Cap
– Zero Based SBA 7(a) Budget (504 is currently zero based)
– No Piggybacks
– Pass more costs to borrowers
• Zion Bancorporation Impact
– Administration desire to move more loans to 504 program
– CDC expansion of territory
– Loan Cap
• 3% of the number of 7(a) loans made in 2002-2003 exceeded $750,000.
– Will receive election year attention from both parties and Bush Administration
– Prediction of periodic program shutdowns through year-end
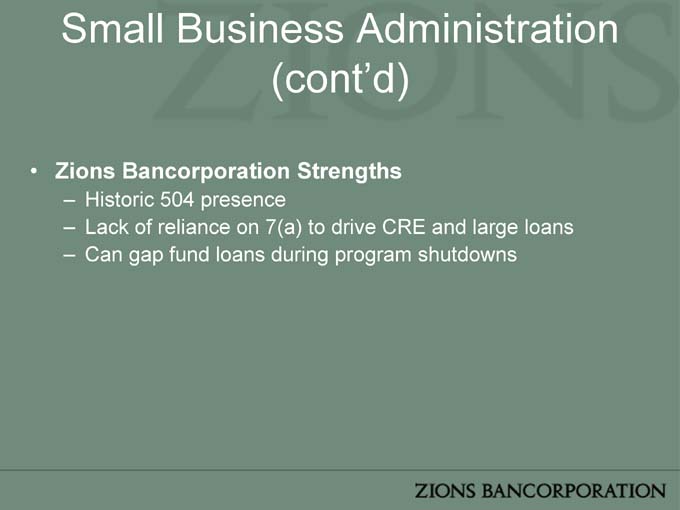
Small Business Administration (cont’d)
• Zions Bancorporation Strengths
– Historic 504 presence
– Lack of reliance on 7(a) to drive CRE and large loans
– Can gap fund loans during program shutdowns

National Real Estate Department
National Real Estate Dept.
“We provide our lending partners with a national secondary market for owner-occupied commercial real estate loans. Our service achieves two primary objectives:”
• We help our lending partners meet customers needs by increasing commercial lending capacity.
• We help our partner lenders generate fee income with nominal credit risk.
Dept Products & Functions
• Originate and purchase SBA 504, 7(a) piggyback and conv. 1st mortgages on commercial properties
• Active relationship with approximately 250 lenders nationwide
• Local lender performs some underwriting to determine eligibility
• Zions pays lender a premium; predominantly servicing released
• Securitize loans annually into CP Conduit
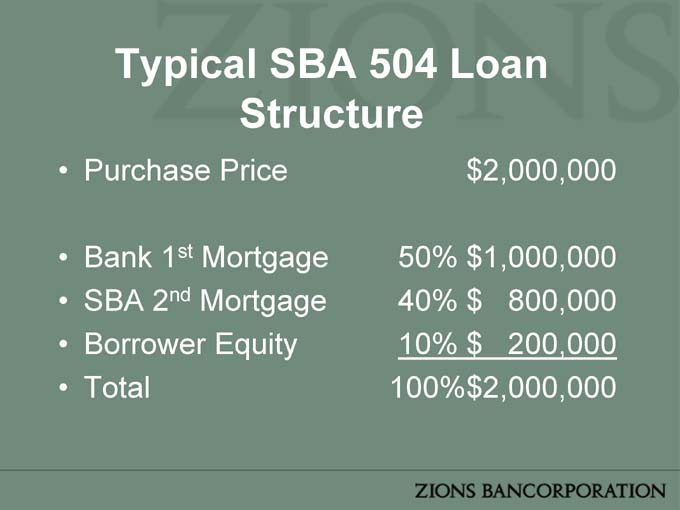
Typical SBA 504 Loan Structure
• Purchase Price $ 2,000,000
• Bank 1st Mortgage 50% $ 1,000,000
• SBA 2nd Mortgage 40% $ 800,000
• Borrower Equity 10% $ 200,000
• Total 100%$ 2,000,000
Commercial Property Types
• Multi-purpose
- Office, warehouse, office/warehouse mix, light industrial, retail, manufacturing, medical
• Special-use
- Hotels/motels, restaurants, day-care, gas station c-stores, car washes, golf courses, assisted living centers
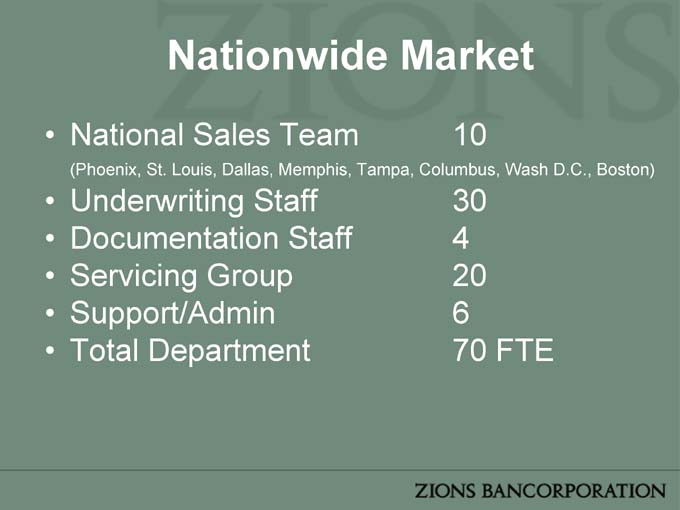
Nationwide Market
• National Sales Team 10
(Phoenix, St. Louis, Dallas, Memphis, Tampa, Columbus, Wash D.C., Boston)
• Underwriting Staff 30
• Documentation Staff 4
• Servicing Group 20
• Support/Admin 6
• Total Department 70 FTE
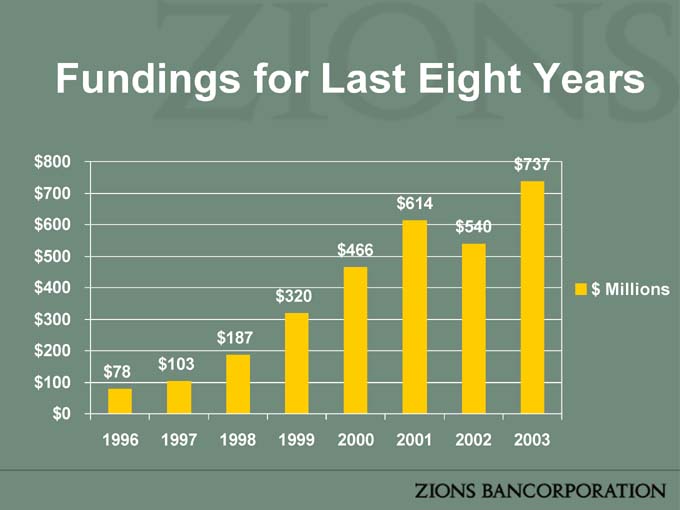
Fundings for Last Eight Years
$78 $103 $187 $320 $466 $614 $540 $737
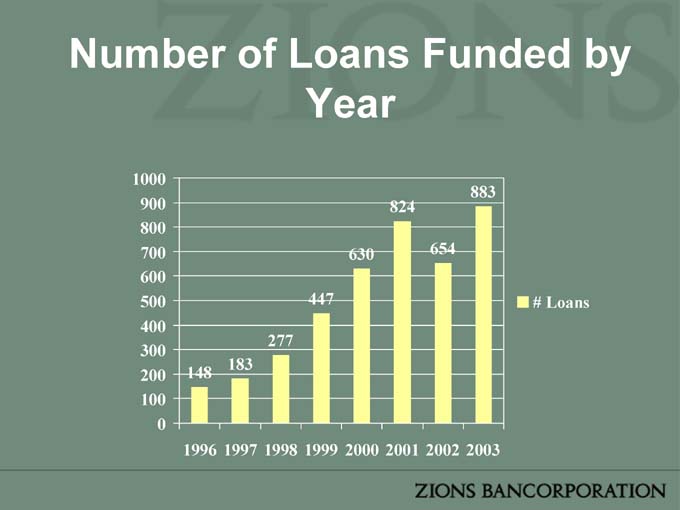
Number of Loans Funded by Year
148 183 277 447 630 824 654 883
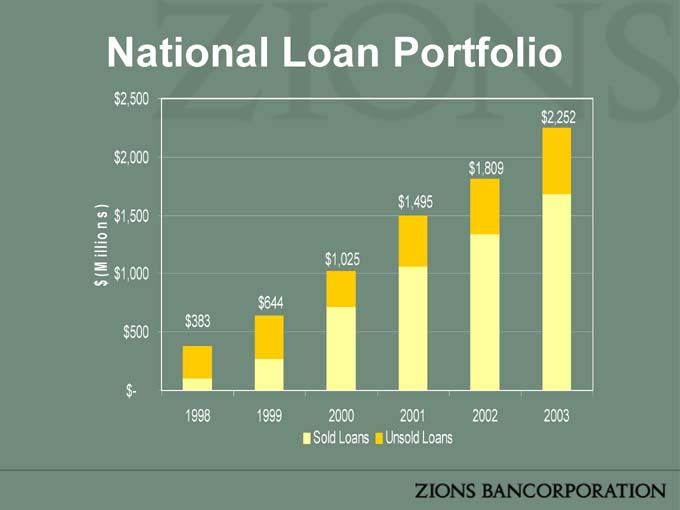
National Loan Portfolio $383 $644 $1,025 $1,495 $1,809 $2,252
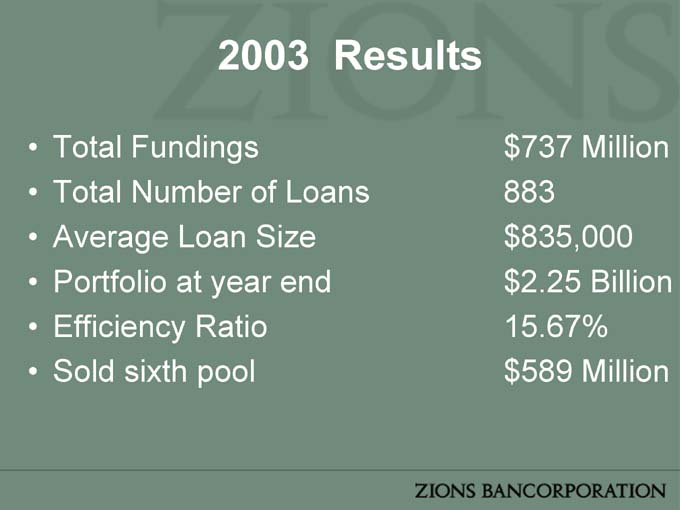
2003 Results
• Total Fundings $737 Million
• Total Number of Loans 883
• Average Loan Size $ 835,000
• Portfolio at year end $2.25 Billion
• Efficiency Ratio 15.67%
• Sold sixth pool $589 Million
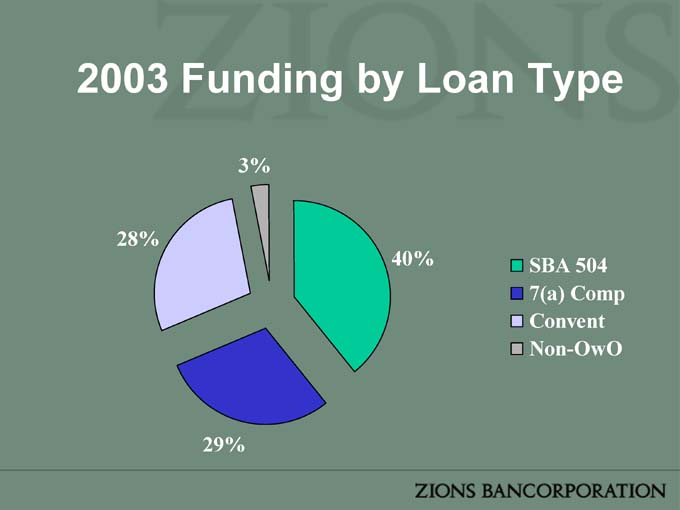
2003 Funding by Loan Type
40% 29% 28% 3%
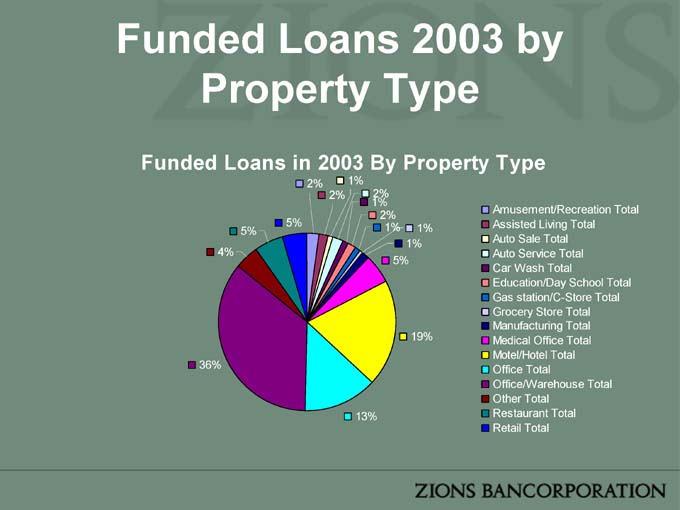
Funded Loans 2003 by Property Type
Funded Loans in 2003 By Property Type
2% 2% 1% 2% 1% 2% 1% 1% 1% 5% 19% 13% 36% 4% 5% 5%
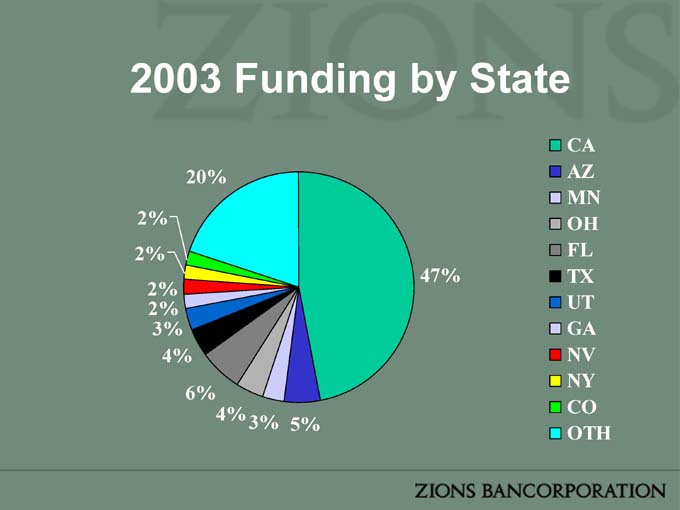
2003 Funding by State
47% 5% 3% 4% 6% 4% 2% 2% 2% 2% 3% 20%
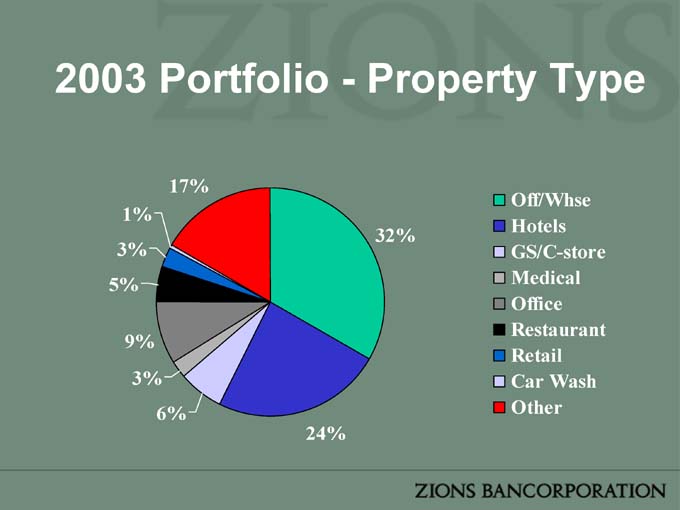
2003 Portfolio—Property Type
17% 32% 24% 1% 3% 5% 9% 3% 6%
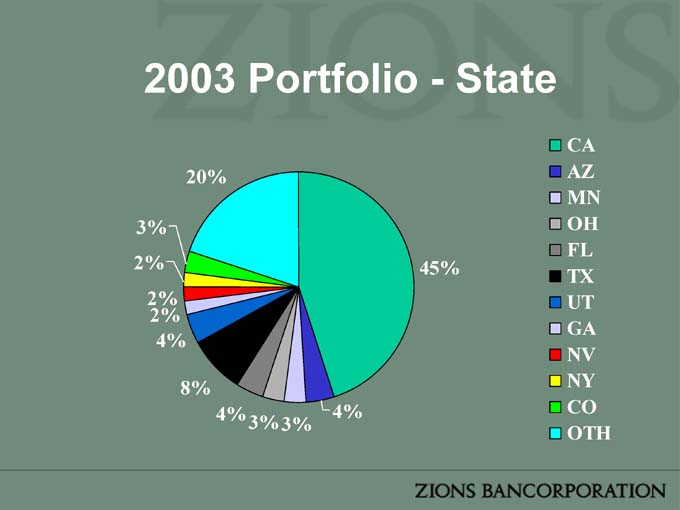
2003 Portfolio—State
45% 4% 4% 3% 3% 3% 2% 2% 2% 4% 8% 20%
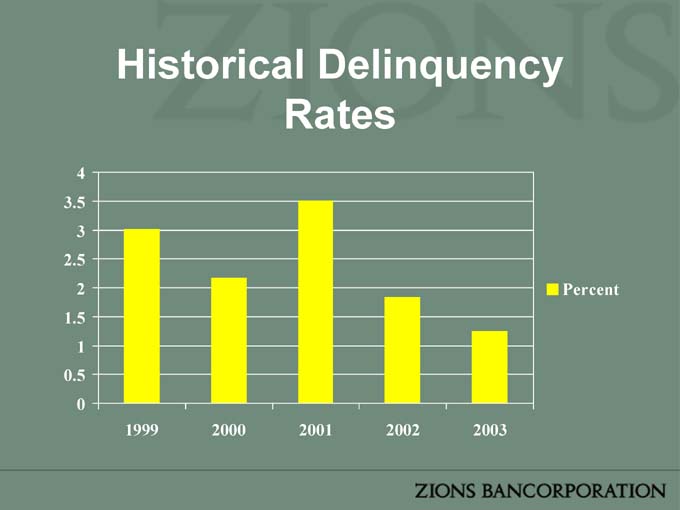
Historical Delinquency Rates
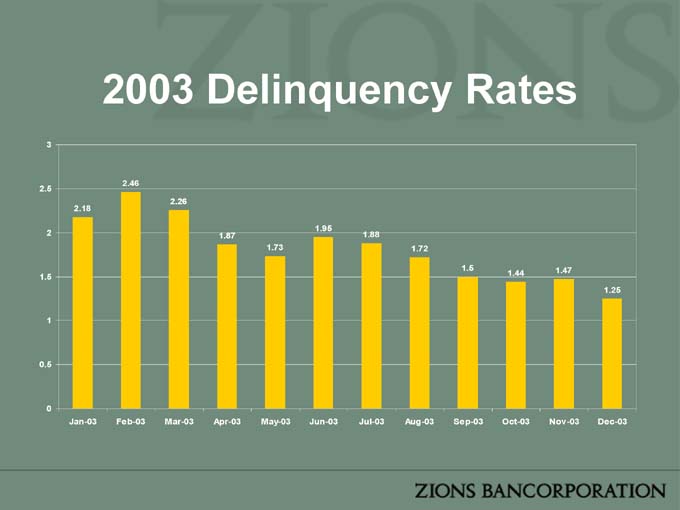
2003 Delinquency Rates
2.18 2.46 2.26 1.87 1.73 1.95 1.88 1.72 1.5 1.44 1.47 1.25
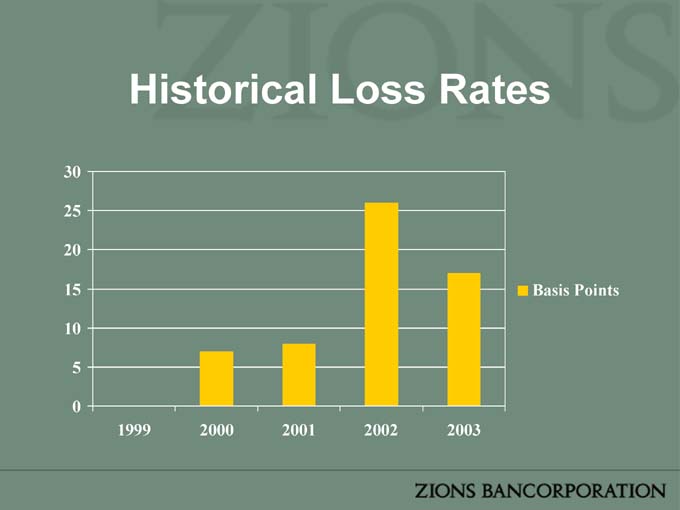
Historical Loss Rates

Zions Bancorporation Analyst Day
19 February 2004
1
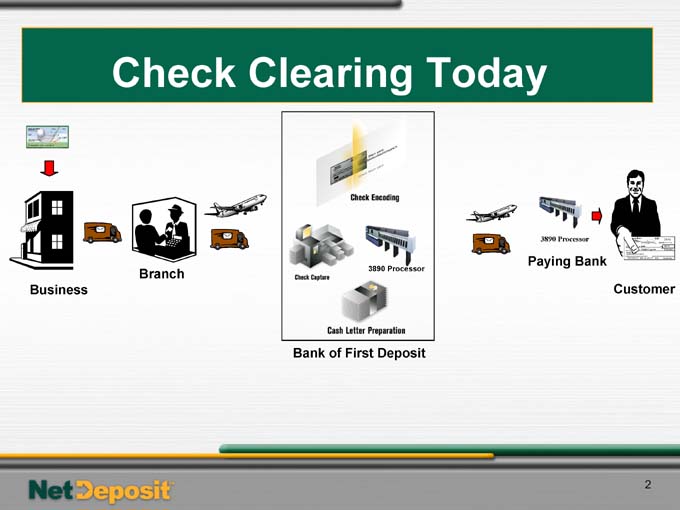
Check Clearing Today
Business
Branch
Bank of First Deposit
Paying Bank
Customer
2
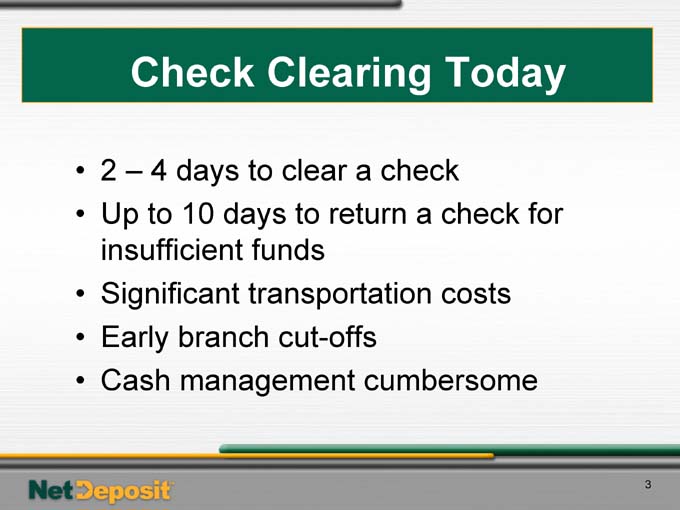
Check Clearing Today
• 2 – 4 days to clear a check
• Up to 10 days to return a check for insufficient funds
• Significant transportation costs
• Early branch cut-offs
• Cash management cumbersome
3
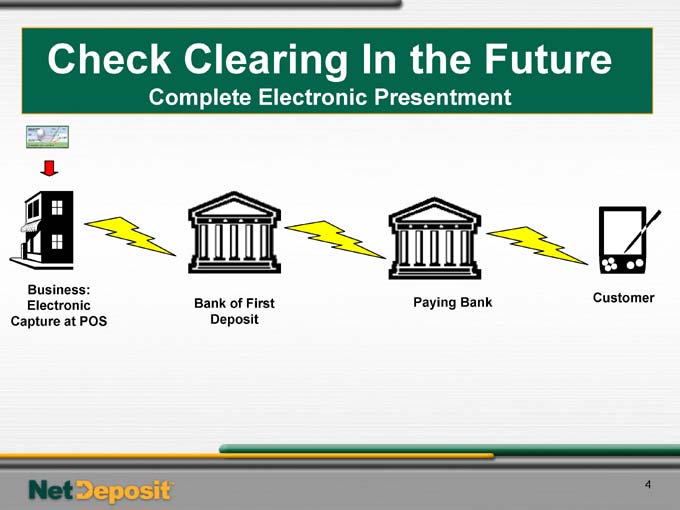
Check Clearing In the Future
Complete Electronic Presentment
Business: Electronic Capture at POS
Bank of First Deposit
Paying Bank
Customer
4

Obstacles to the Future
• Full electronic presentment requires individual agreements between individual banks.
• 8,000 banks would have to make significant investment in systems and talent.
5
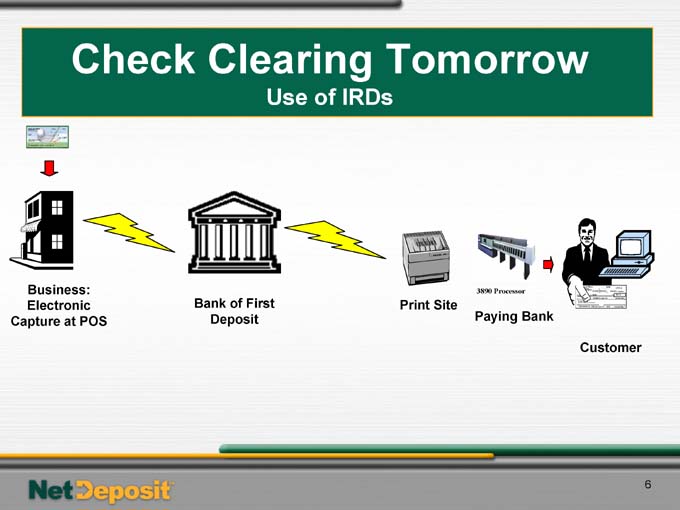
Check Clearing Tomorrow
Use of IRDs
Business: Electronic Capture at POS
Bank of First Deposit
Print Site
Paying Bank
Customer
What is NetDeposit?
• A subsidiary of Zions Bancorporation
• A patent-pending suite of products that reduces the time and cost of collecting payments, and processing returns by enhancing existing remittance processing activities
• A tool to optimize how individual payments are collected
7
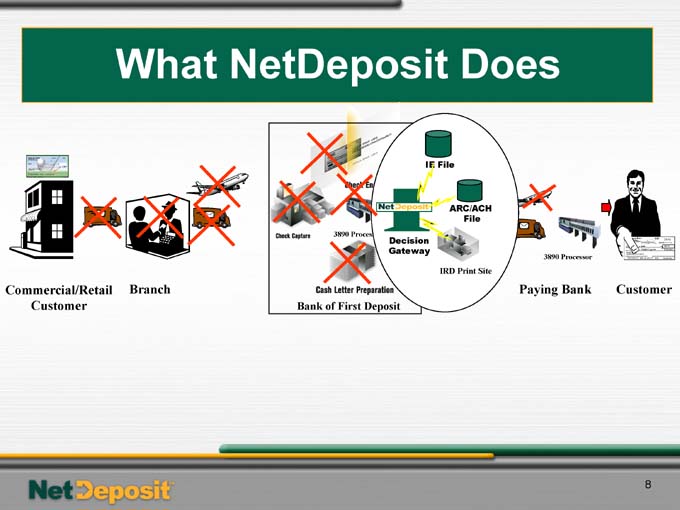
What NetDeposit Does
Commercial/Retail Branch Customer
Bank of First Deposit
Paying Bank
Customer
8
What NetDeposit Does
• Eliminates
– Transportation to bank
– Night drop deposit
– Teller function
– Capture, proof, encoding, balancing
• Reduces
– Cash letter preparation
– Transportation
– Incoming capture
9
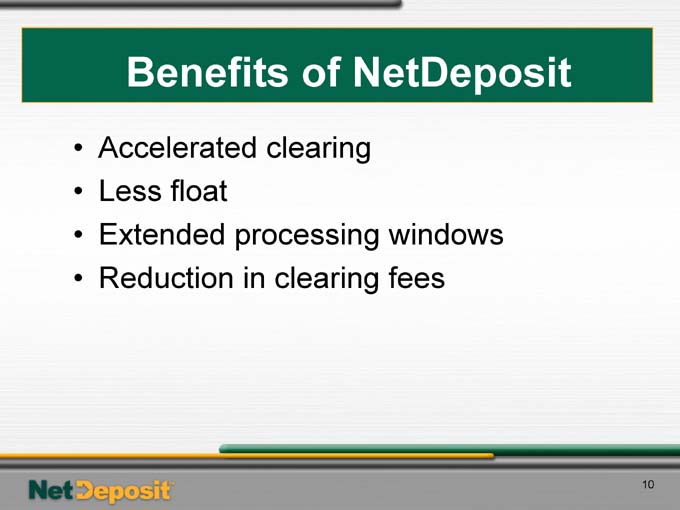
Benefits of NetDeposit
• Accelerated clearing
• Less float
• Extended processing windows
• Reduction in clearing fees
10
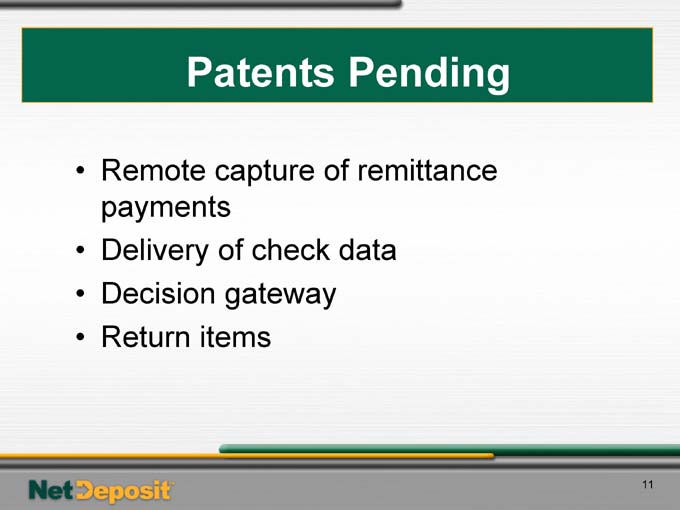
Patents Pending
• Remote capture of remittance payments
• Delivery of check data
• Decision gateway
• Return items
11

Check 21
• Does not mandate anything
• Does not deal with electronic presentment
• Simply gives “Image Replacement Documents” the same legal validity as original checks
• Effective October 28, 2004
12
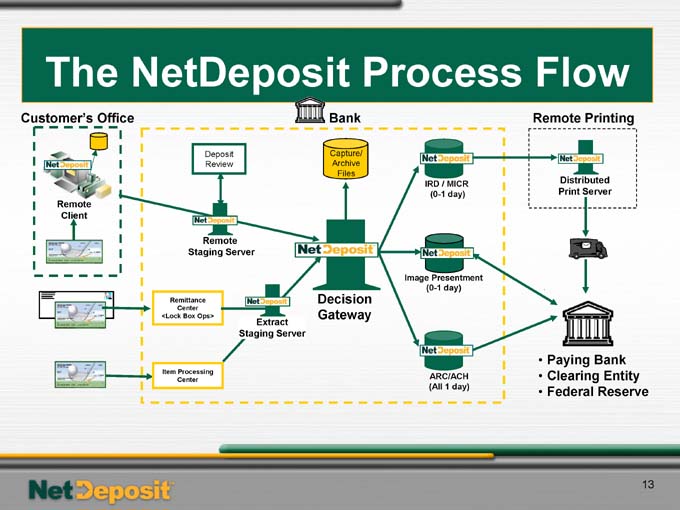
The NetDeposit Process Flow
Customer’s Office
Bank
Remote Printing
Remote Client
Deposit Review
Archive Files
IRD / MICR
(0-1 day)
Distributed Print Server
Remote Staging Server
Image Presentment (0-1 day)
Remittance Center <Lock Box Ops>
Extract Staging Server
Decision Gateway
ARC/ACH (All 1 day)
Item Processing Center
• Paying Bank
• Clearing Entity
• Federal Reserve
13
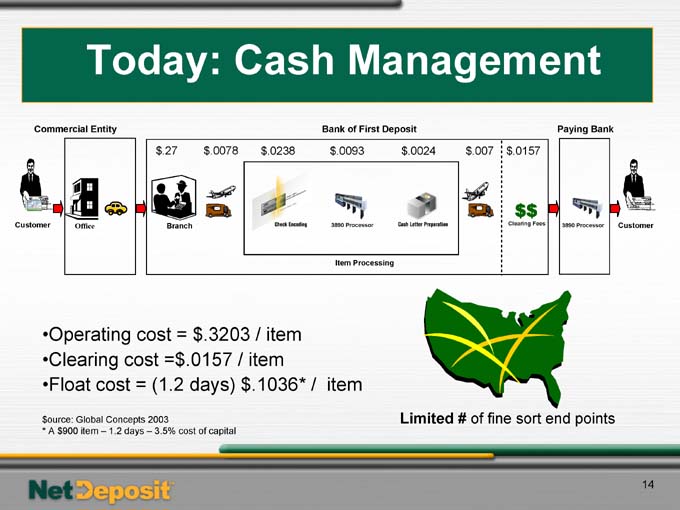
Today: Cash Management
Commercial Entity
Bank of First Deposit
Paying Bank
Customer
Office
Branch
Item Processing
$ .27 $ .0078 $ .0238 $ .0093 $ .0024 $ .007
Clearing Fees
3890 Processor
Customer
•Operating cost = $.3203 / item •Clearing cost =$.0157 / item •Float cost = (1.2 days) $.1036* / item
$ource: Global Concepts 2003
* A $900 item – 1.2 days – 3.5% cost of capital
Limited # of fine sort end points
14
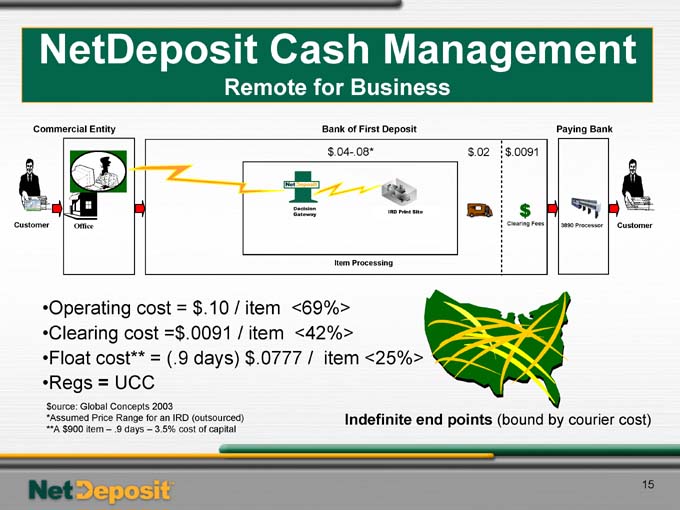
NetDeposit Cash Management
Remote for Business
Commercial Entity
Bank of First Deposit
Paying Bank
Customer
Office
Item Processing $.04-.08* $.02 $.0091
Clearing Fees
3890 Processor
•Operating cost = $.10 / item <69%> •Clearing cost =$.0091 / item <42%> •Float cost** = (.9 days) $.0777 / item <25%> •Regs = UCC $ource: Global Concepts 2003
*Assumed Price Range for an IRD (outsourced) **A $900 item – .9 days – 3.5% cost of capital
Indefinite end points (bound by courier cost)
15
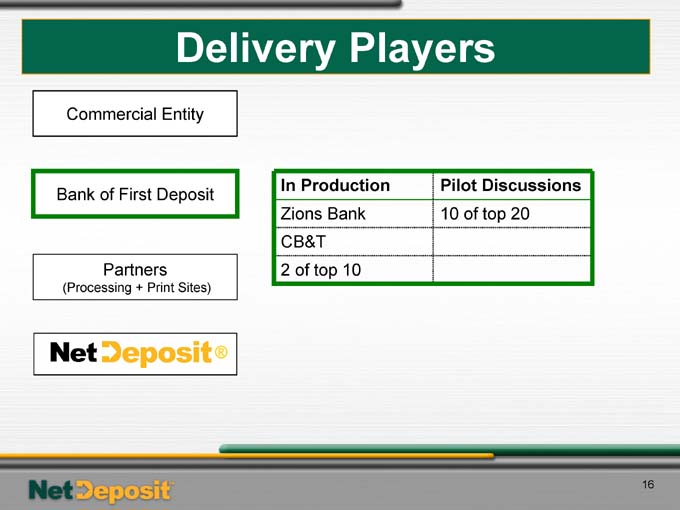
Delivery Players
Commercial Entity
Bank of First Deposit
Partners
(Processing + Print Sites)
®
In Production Pilot Discussions
Zions Bank 10 of top 20
CB&T
2 of top 10
16
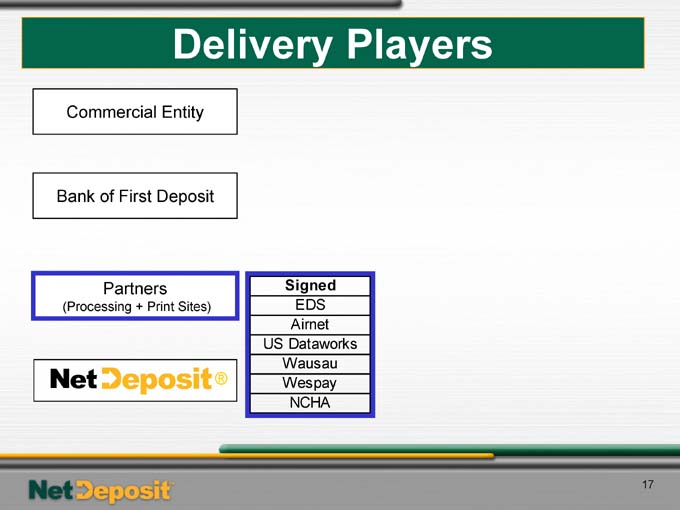
Delivery Players
Commercial Entity
Bank of First Deposit
Partners
(Processing + Print Sites)
Signed
EDS
Airnet
US Dataworks
Wausau
Wespay
NCHA
17
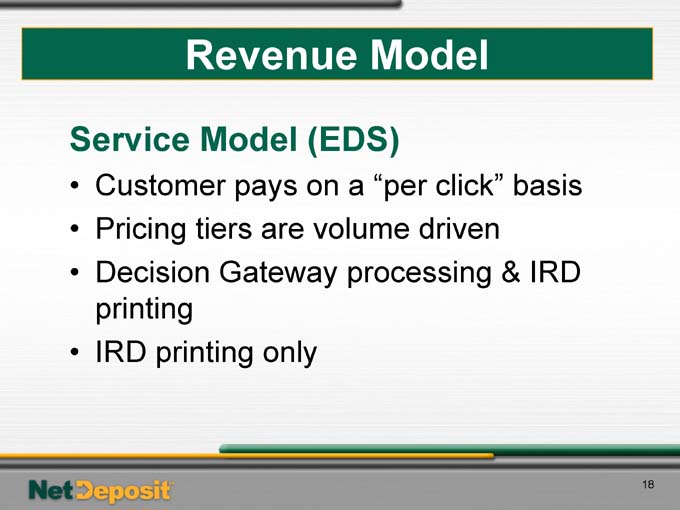
Revenue Model
Service Model (EDS)
• Customer pays on a “per click” basis
• Pricing tiers are volume driven
• Decision Gateway processing & IRD printing
• IRD printing only
18
Revenue Model
License Model
• Decision Gateway license
• Remote user license
• Additional licenses for Remote, Extract and Distributed Print servers
• Annual maintenance of 20%
• “Per click” fee
19

20

Electronic Bond Trading
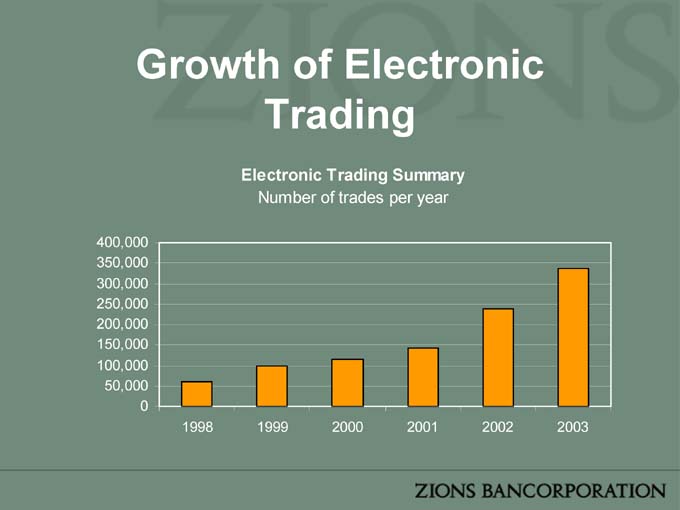
Growth of Electronic Trading
Electronic Trading Summary
Number of trades per year
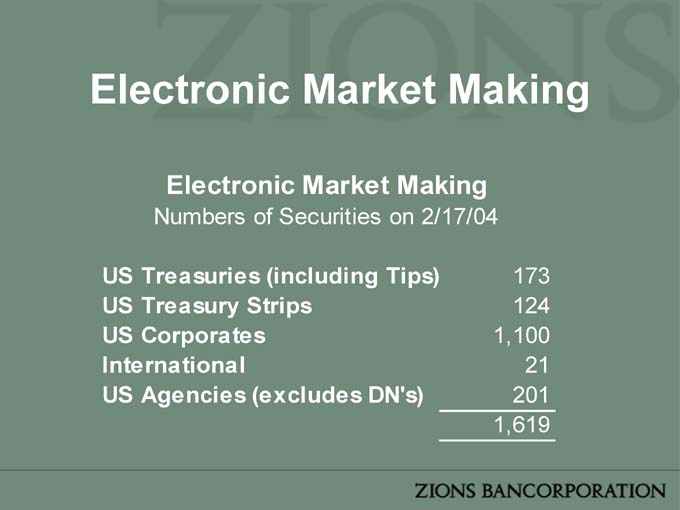
Electronic Market Making
Electronic Market Making
Numbers of Securities on 2/17/04
US Treasuries (including Tips) 173
US Treasury Strips 124
US Corporates 1,100
International 21
US Agencies (excludes DN’s) 201
1,619

Zions Bank Public Finance
Roles Performed by Zions Bank
• Financial Advisor – As Agent for the issuer, Zions Bank advises on the origination, development and sale of bond issues.
• Underwriter – Zions Bank purchases the bonds from the issuer and then sells them through the Bank’s institutional/retail distribution system
• Private Purchaser – Zions Bank assists the issuers by purchasing the bonds for investment in the Bank’s own investment portfolio.
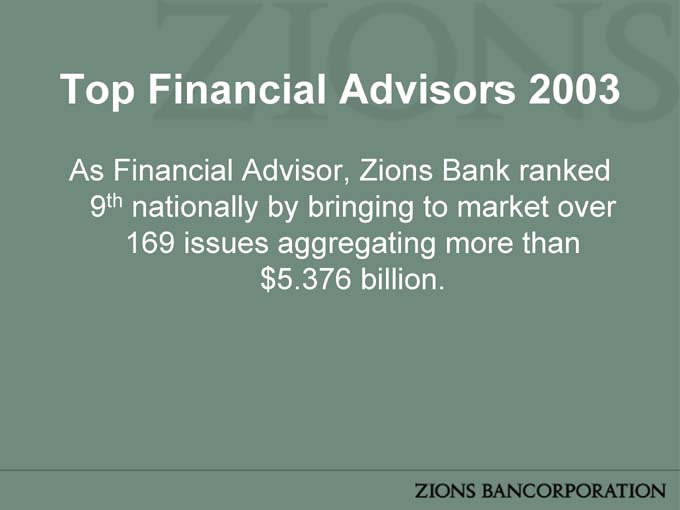
Top Financial Advisors 2003
As Financial Advisor, Zions Bank ranked 9th nationally by bringing to market over 169 issues aggregating more than $5.376 billion.
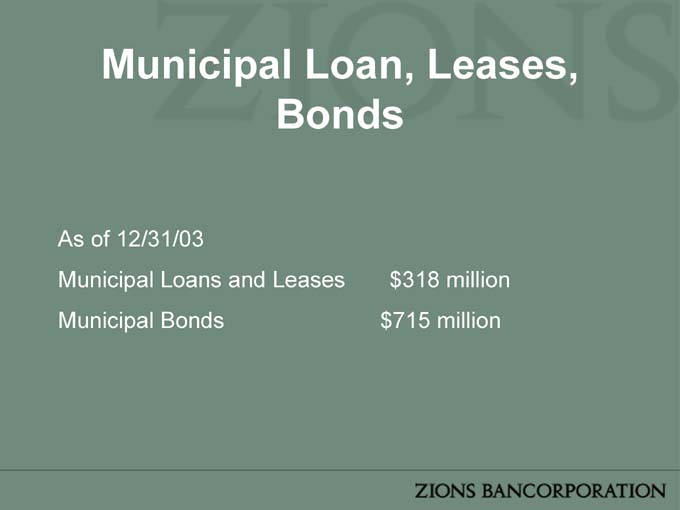
Municipal Loan, Leases, Bonds
As of 12/31/03
Municipal Loans and Leases $318 million
Municipal Bonds $715 million

Interest Sensitive Income and Liquidity
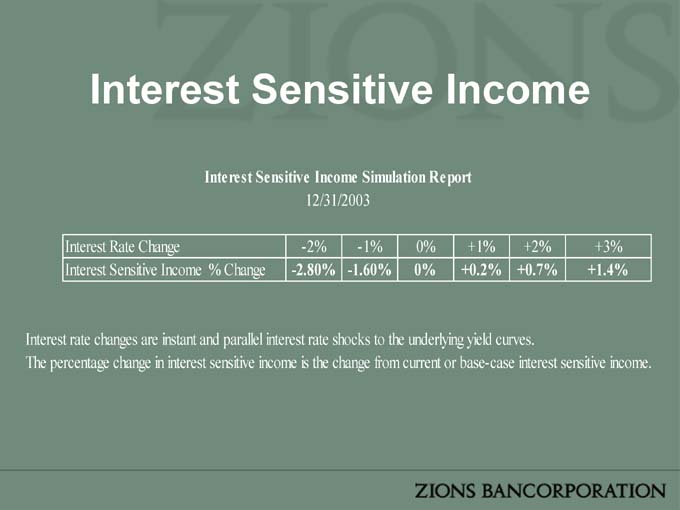
Interest Sensitive Income
Interest Sensitive Income Simulation Report
12/31/2003
Interest Rate Change -2% -1% 0% +1% +2% +3%
Interest Sensitive Income % Change -2.80% -1.60% 0% +0.2% +0.7% +1.4%
Interest rate changes are instant and parallel interest rate shocks to the underlying yield curves.
The percentage change in interest sensitive income is the change from current or base-case interest sensitive income.

Liquidity
Liquidity Report
12/31/03
Total FHLB FHLB Borrowing Available Collateral Available Collateral
Eligible Loans and (actual) for FHLB for FHLB
Unpledged Borrowing Borrowing to
Securities External FF
Purchased Plus
CDs>1year
6,318,364,455 426,412,807 5,891,951,648 287%
The Federal Home Loan Bank will allow a portion of total loans and securities to be eligible as collateral for borrowing. Total FHLB eligible loans and securities have already been discounted by the required FHLB haircut.

Lockhart Funding LLC
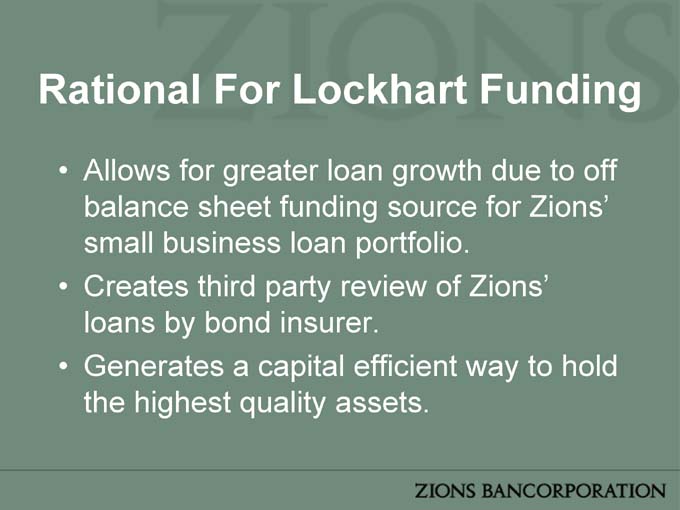
Rational For Lockhart Funding
• Allows for greater loan growth due to off balance sheet funding source for Zions’ small business loan portfolio.
• Creates third party review of Zions’ loans by bond insurer.
• Generates a capital efficient way to hold the highest quality assets.
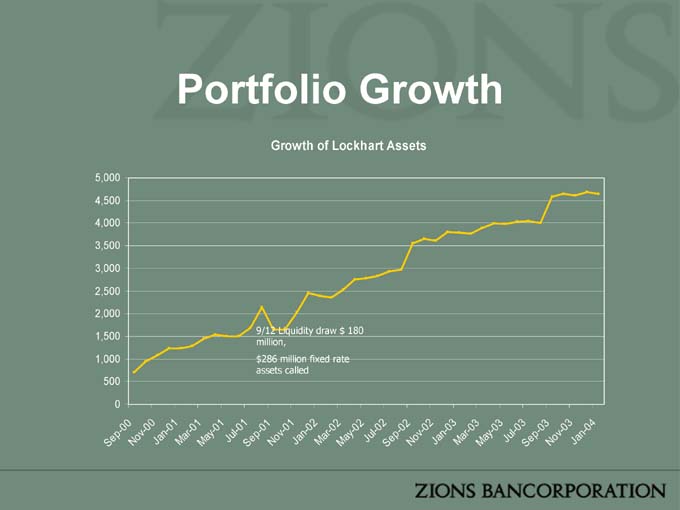
Portfolio Growth
Growth of Lockhart Assets
9/12 Liquidity draw $ 180 million,
$286 million fixed rate assets called
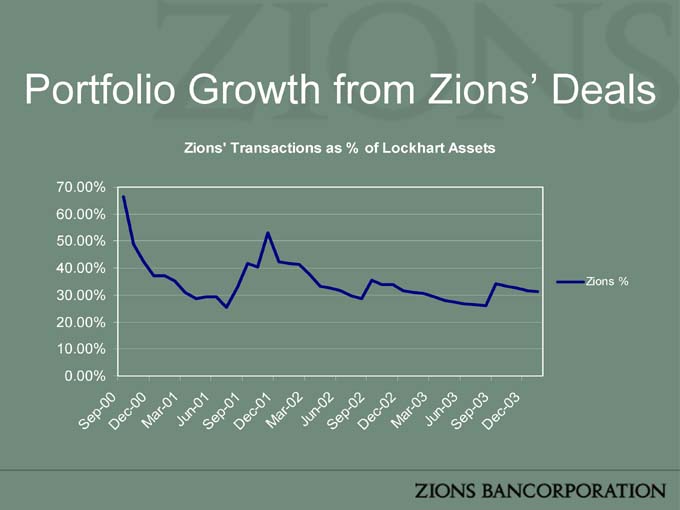
Portfolio Growth from Zions’ Deals
Zions’ Transactions as % of Lockhart Assets
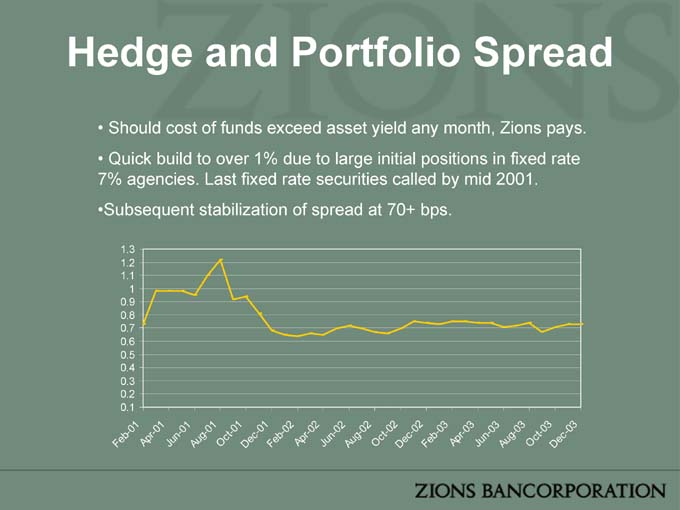
Hedge and Portfolio Spread
• Should cost of funds exceed asset yield any month, Zions pays.
• Quick build to over 1% due to large initial positions in fixed rate 7% agencies. Last fixed rate securities called by mid 2001. •Subsequent stabilization of spread at 70+ bps.
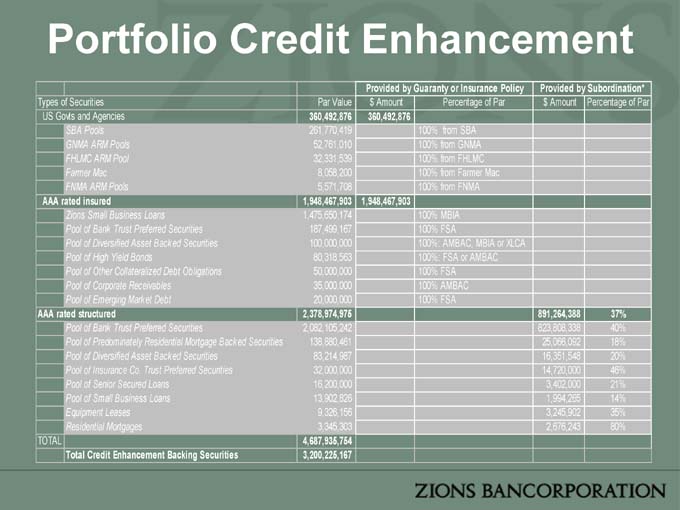
Portfolio Credit Enhancement
Provided by Guaranty or Insurance Policy Provided by Subordination*
Types of Securities Par Value $ Amount Percentage of Par $ Amount Percentage of Par
US Govts and Agencies 360,492,876 360,492,876
SBA Pools 261,770,419 100% from SBA
GNMA ARM Pools 52,761,010 100% from GNMA
FHLMC ARM Pool 32,331,539 100% from FHLMC
Farmer Mac 8,058,200 100% from Farmer Mac
FNMA ARM Pools 5,571,708 100% from FNMA
AAA rated insured 1,948,467,903 1,948,467,903
Zions Small Business Loans 1,475,650,174 100% MBIA
Pool of Bank Trust Preferred Securities 187,499,167 100% FSA
Pool of Diversified Asset Backed Securities 100,000,000 100%: AMBAC, MBIA or XLCA
Pool of High Yield Bonds 80,318,563 100%: FSA or AMBAC
Pool of Other Collateralized Debt Obligations 50,000,000 100% FSA
Pool of Corporate Receivables 35,000,000 100% AMBAC
Pool of Emerging Market Debt 20,000,000 100% FSA
AAA rated structured 2,378,974,975 891,264,388 37%
Pool of Bank Trust Preferred Securities 2,082,105,242 823,808,338 40%
Pool of Predominately Residential Mortgage Backed Securities 138,880,461 25,066,092 18%
Pool of Diversified Asset Backed Securities 83,214,987 16,351,548 20%
Pool of Insurance Co. Trust Preferred Securities 32,000,000 14,720,000 46%
Pool of Senior Secured Loans 16,200,000 3,402,000 21%
Pool of Small Business Loans 13,902,826 1,994,265 14%
Equipment Leases 9,326,156 3,245,902 35%
Residential Mortgages 3,345,303 2,676,243 80%
TOTAL 4,687,935,754
Total Credit Enhancement Backing Securities 3,200,225,167
Technology, Operations & Support
IT Performance
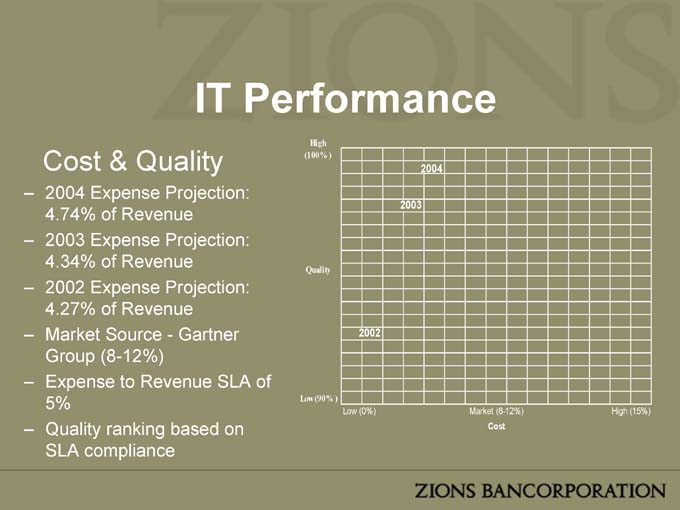
Cost & Quality
– 2004 Expense Projection: 4.74% of Revenue
– 2003 Expense Projection: 4.34% of Revenue
– 2002 Expense Projection: 4.27% of Revenue
– Market Source—Gartner Group (8-12%)
– Expense to Revenue SLA of 5%
– Quality ranking based on SLA compliance
Volumes
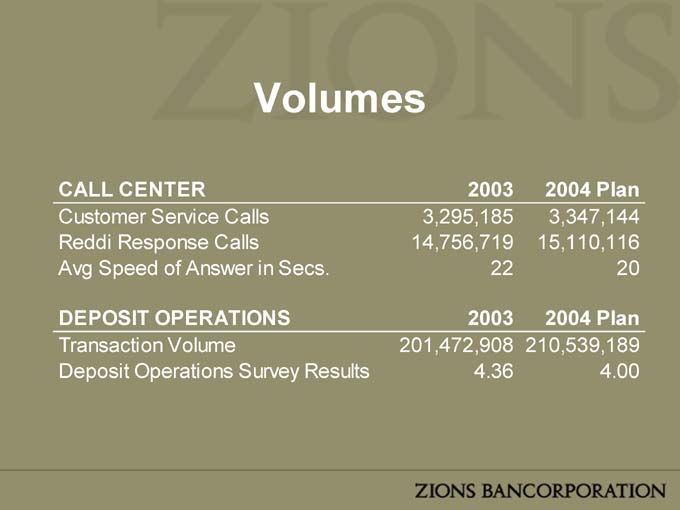
CALL CENTER 2003 2004 Plan
Customer Service Calls 3,295,185 3,347,144
Reddi Response Calls 14,756,719 15,110,116
Avg Speed of Answer in Secs. 22 20
DEPOSIT OPERATIONS 2003 2004 Plan
Transaction Volume 201,472,908 210,539,189
Deposit Operations Survey Results 4.36 4.00
Volumes
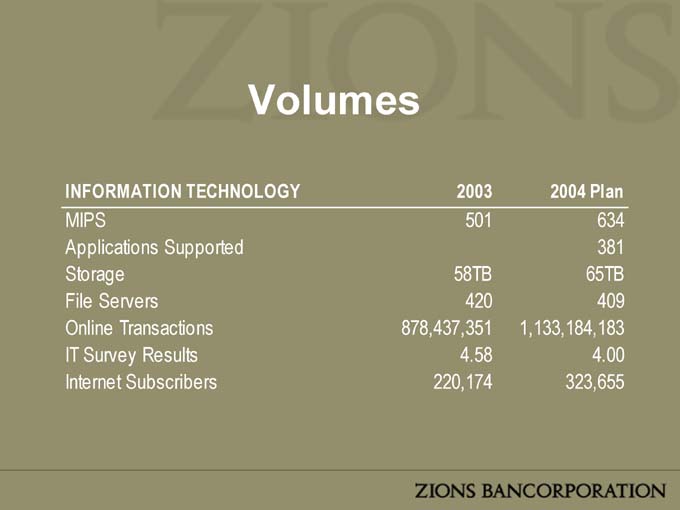
INFORMATION TECHNOLOGY 2003 2004 Plan
MIPS 501 634
Applications Supported 381
Storage 58TB 65TB
File Servers 420 409
Online Transactions 878,437,351 1,133,184,183
IT Survey Results 4.58 4.00
Internet Subscribers 220,174 323,655
Strategic Focus
– Continue to invest in highly available, highly reliable infrastructure
– Consolidate/Simplify the technology, environment
– Value added solutions
Unify Update
– Infrastructure Investments
– NBA Conversion
– CB&T Conversion
– Estimated Financial Impact over $15MM
The Credit Process at Zions Bancorporation
2004
Six Banks Covering Eight States
• How We Maintain a Common Credit Culture
• Credit Quality
• Loan Portfolio Composition
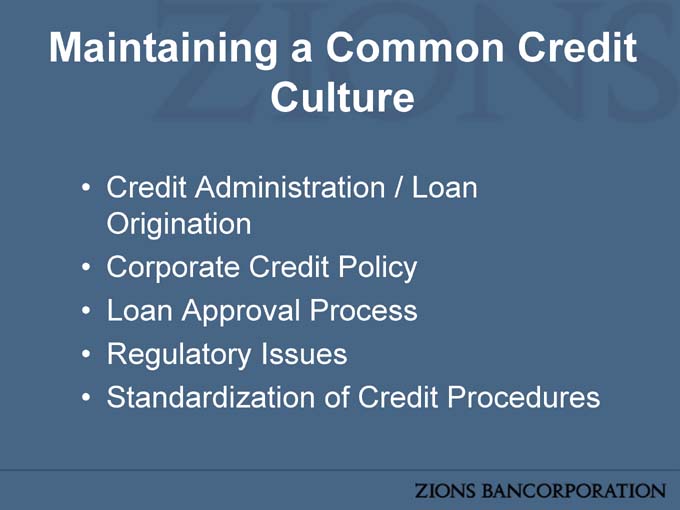
Maintaining a Common Credit Culture
• Credit Administration / Loan Origination
• Corporate Credit Policy
• Loan Approval Process
• Regulatory Issues
• Standardization of Credit Procedures
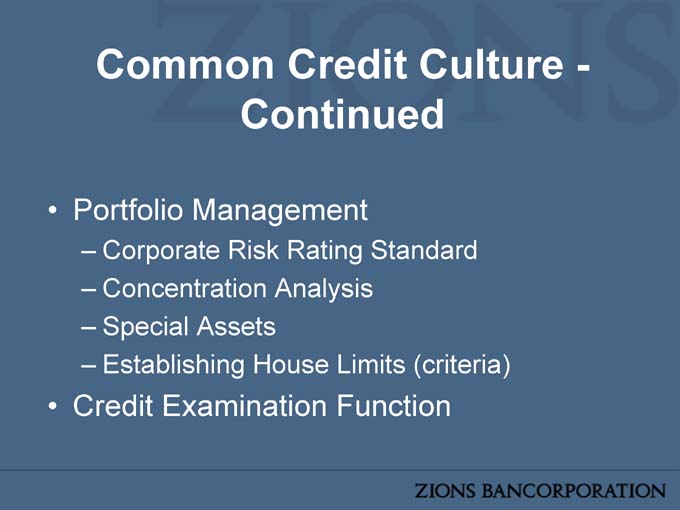
Common Credit Culture -Continued
• Portfolio Management
– Corporate Risk Rating Standard
– Concentration Analysis
– Special Assets
– Establishing House Limits (criteria)
• Credit Examination Function

Credit Quality
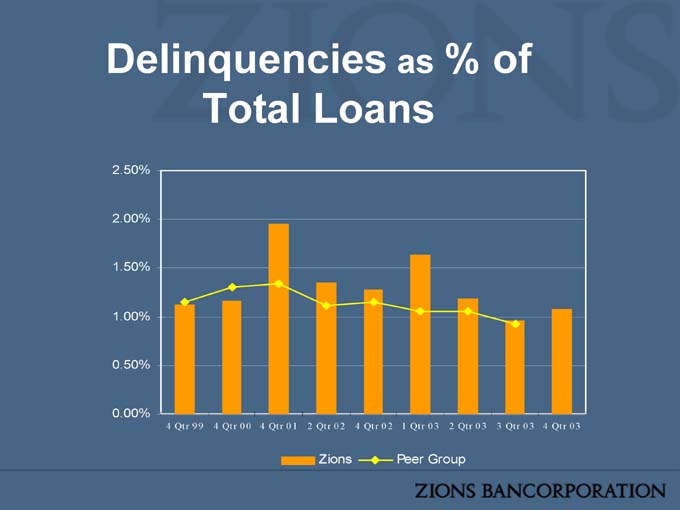
Delinquencies as % of Total Loans
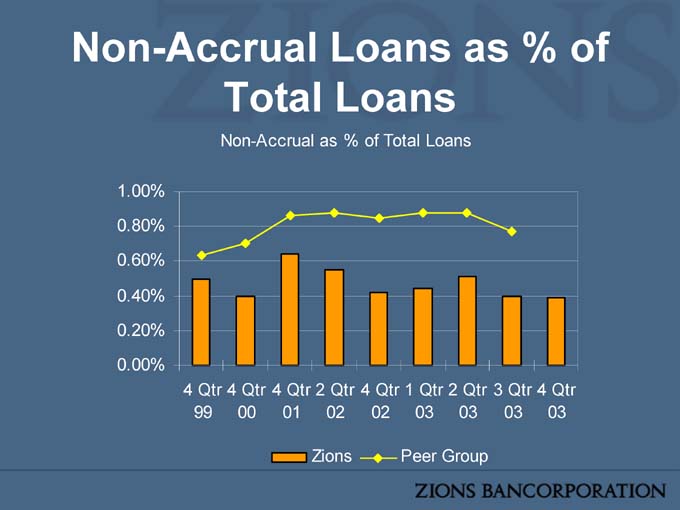
Non-Accrual Loans as % of Total Loans
Non-Accrual as % of Total Loans
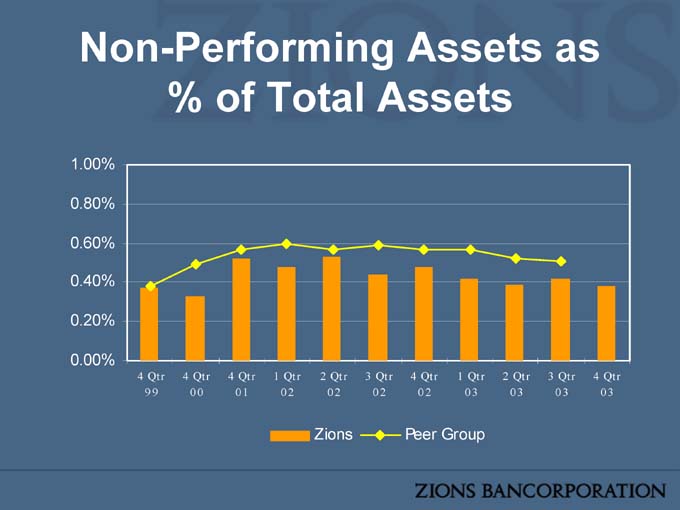
Non-Performing Assets as % of Total Assets
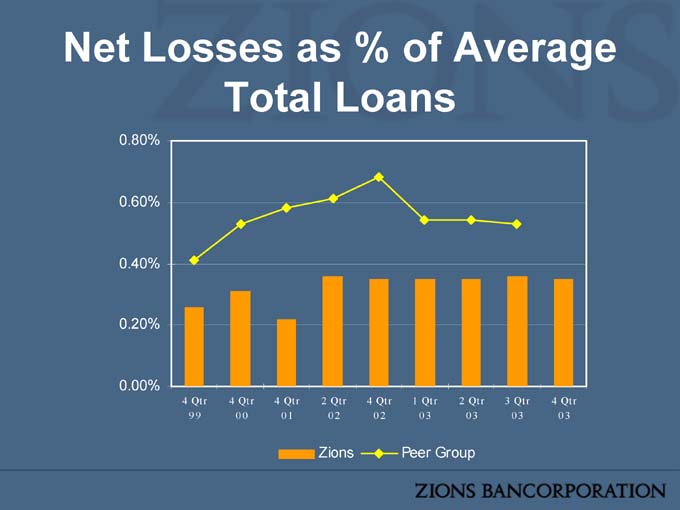
Net Losses as % of Average Total Loans
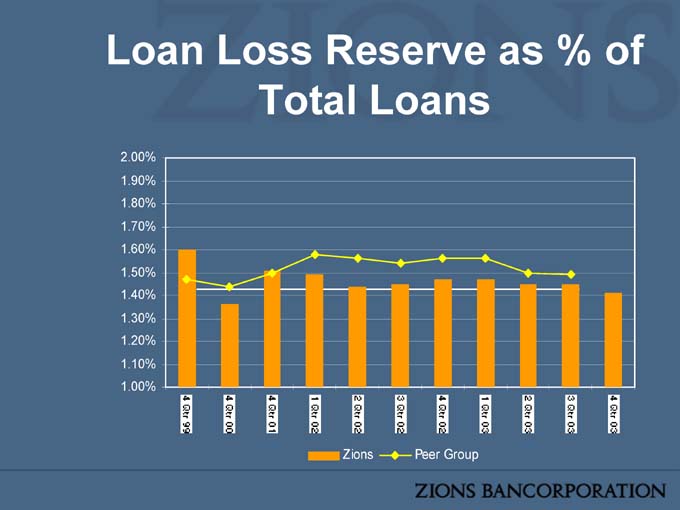
Loan Loss Reserve as % of Total Loans
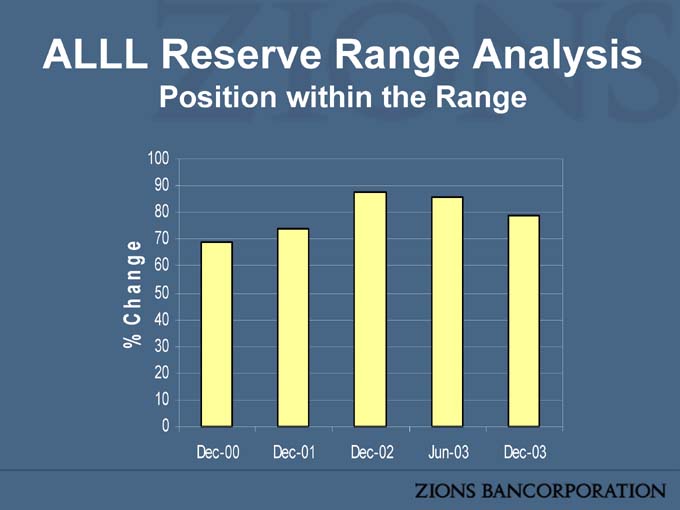
ALLL Reserve Range Analysis
Position within the Range
Portfolio Composition
Analyze Concentrations by
– Industry – Relationship
– Product Type
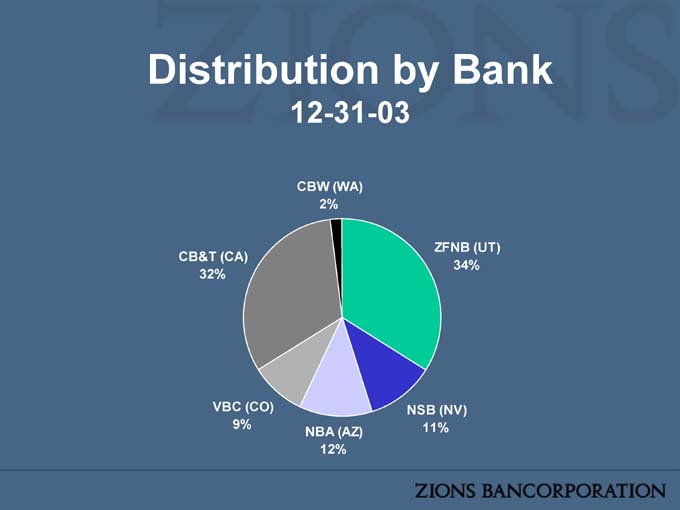
Distribution by Bank
12-31-03
CBW (WA) 2%
ZFNB (UT) 34%
NSB (NV) 11%
NBA (AZ) 12%
VBC (CO) 9%
CB&T (CA) 32%
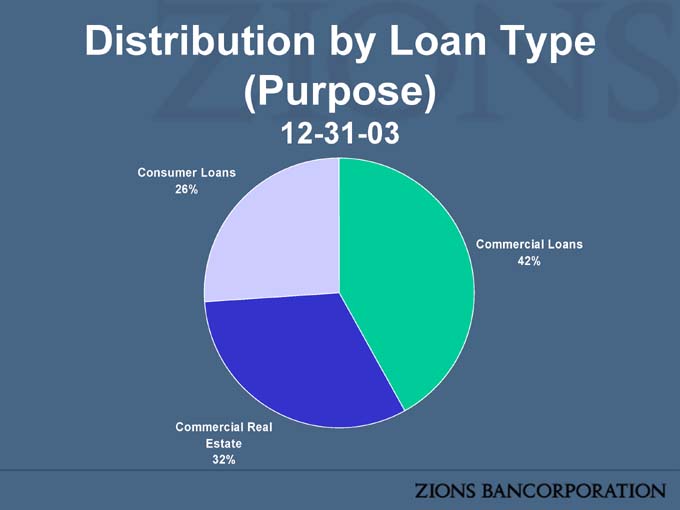
Distribution by Loan Type (Purpose)
12-31-03
Commercial Loans 42%
Commercial Real Estate 32%
Consumer Loans 26%

Secured by Real Estate
12-31-03
Total CRE 43.9%
Commercial Construction
20.0%
Commercial Term
23.9%
Residential (Consumer) 33.2%
Owner Occupied 23.0%
Includes some Commercial and some Consumer Loans and represents 72.5% of Zions Total Loan Portfolio.
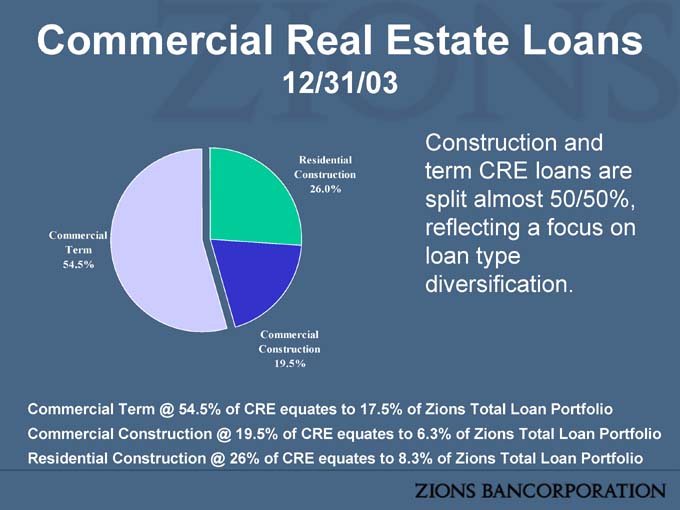
Commercial Real Estate Loans
12/31/03
Residential Construction 26.0%
Commercial Construction 19.5%
Commercial Term 54.5%
Construction and term CRE loans are split almost 50/50%, reflecting a focus on loan type diversification.
Commercial Term @ 54.5% of CRE equates to 17.5% of Zions Total Loan Portfolio Commercial Construction @ 19.5% of CRE equates to 6.3% of Zions Total Loan Portfolio Residential Construction @ 26% of CRE equates to 8.3% of Zions Total Loan Portfolio
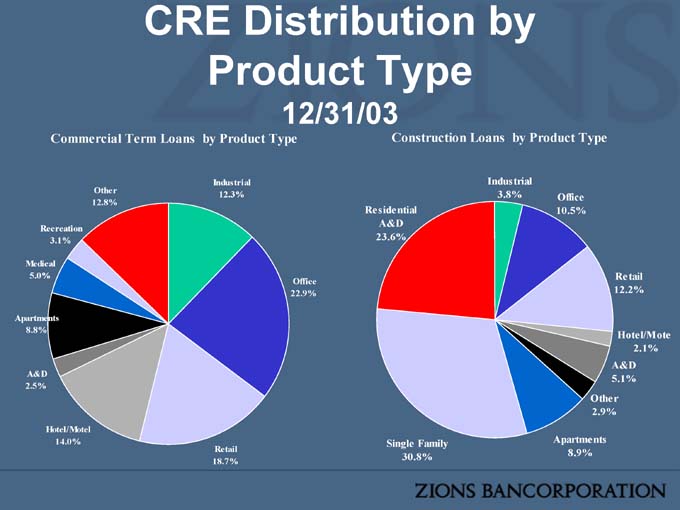
CRE Distribution by Product Type
12/31/03
Commercial Term Loans by Product Type
Industrial 12.3%
Office 22.9%
Retail 18.7%
Hotel/Motel 14.0%
A&D 2.5%
Apartments 8.8%
Medical 5.0%
Recreation 3.1%
Other 12.8%
Construction Loans by Product Type
Industrial 3.8%
Office 10.5%
Retail 12.2%
Hotel/Mote 2.1%
A&D 5.1%
Other 2.9%
Apartments 8.9%
Single Family 30.8%
Residential A&D
23.6%
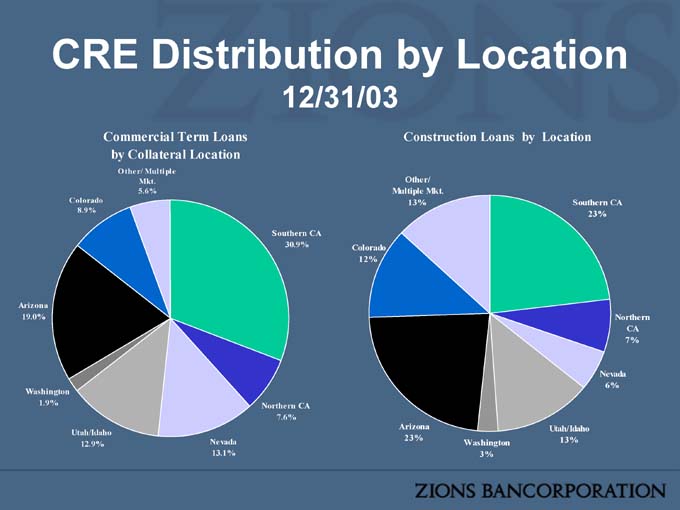
CRE Distribution by Location
12/31/03
Commercial Term Loans by Collateral Location
Other/ Multiple Mkt.
5.6%
Southern CA
30.9%
Northern CA
7.6%
Nevada 13.1%
Utah/Idaho 12.9%
Washington 1.9%
Arizona 19.0%
Colorado 8.9%
Construction Loans by Location
Southern CA
23%
Northern CA
7%
Nevada 6%
Utah/Idaho 13%
Washington 3%
Arizona 23%
Colorado 12%
Other/ Multiple Mkt.
13%
Doyle Arnold ¦19 February 2004
Accomplishments: 2001-2003
• Rebuild management team post First Security
• Keep growing the banks
• Put mistakes behind us
• Increase investment discipline
• Manage risk in tough environment
• Reduce Exp/Rev Ratio
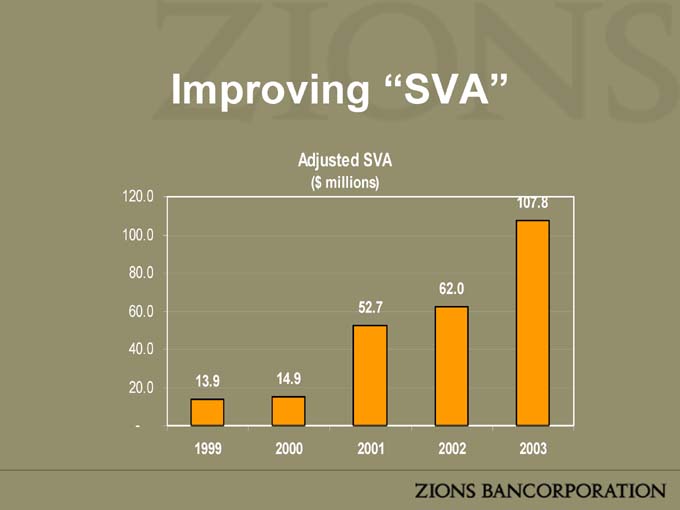
Improving “SVA”
Adjusted SVA
($ millions)
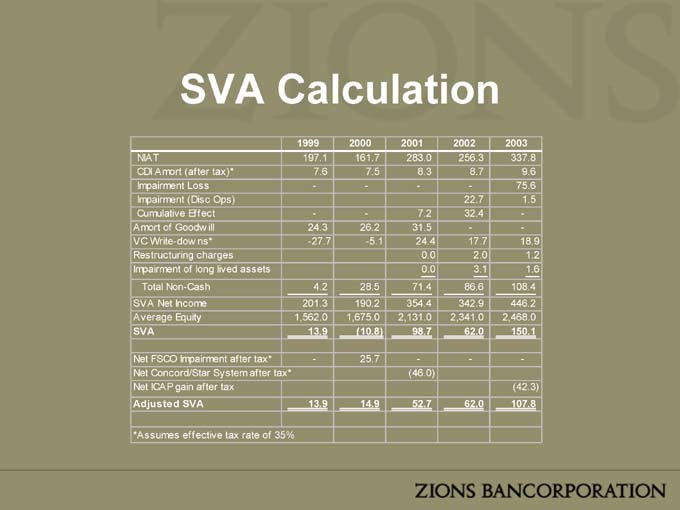
SVA Calculation
1999 2000 2001 2002 2003
NIAT 197.1 161.7 283.0 256.3 337.8
CDI Amort (after tax)* 7.6 7.5 8.3 8.7 9.6
Impairment Loss - - - - 75.6
Impairment (Disc Ops) 22.7 1.5
Cumulative Effect - - 7.2 32.4 -
Amort of Goodw ill 24.3 26.2 31.5 - -
VC Write-dow ns* -27.7 -5.1 24.4 17.7 18.9
Restructuring charges 0.0 2.0 1.2
Impairment of long lived assets 0.0 3.1 1.6
Total Non-Cash 4.2 28.5 71.4 86.6 108.4
SVA Net Income 201.3 190.2 354.4 342.9 446.2
Average Equity 1,562.0 1,675.0 2,131.0 2,341.0 2,468.0
SVA 13.9 (10.8) 98.7 62.0 150.1
Net FSCO Impairment after tax* - 25.7 - - -
Net Concord/Star System after tax* (46.0)
Net ICAP gain after tax (42.3)
Adjusted SVA 13.9 14.9 52.7 62.0 107.8
*Assumes effective tax rate of 35%
The Agenda: 2004-2006
• Keep growing the banks
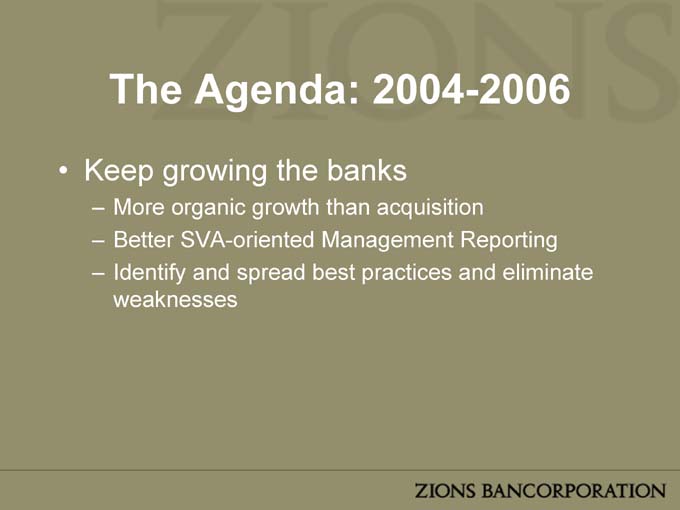
The Agenda: 2004-2006
• Keep growing the banks
– More organic growth than acquisition
– Better SVA-oriented Management Reporting
– Identify and spread best practices and eliminate weaknesses
The Agenda: 2004-2006
• Keep growing the banks
• Continue disciplined investment/innovation
The Agenda: 2004-2006
• Keep growing the banks
• Continue disciplined investment/innovation
– Private client services
– Net Deposit
– Hispanic business banking
– Other
The Agenda: 2004-2006
• Keep growing the banks
• Continue disciplined investment/innovation
• Maintain risk and expense discipline
The Agenda: 2004-2006
• Keep growing the banks
• Continue disciplined investment/innovation
• Maintain risk and expense discipline
• Continue Capital Management
The Agenda: 2004-2006
• Keep growing the banks
• Continue disciplined investment/innovation
• Maintain risk and expense discipline
• Continue Capital Management
– No plans to further increase ratios
– Return excess to shareholders
– Develop BASLE II economic capital capability

Forward-Looking Statements
This presentation contains statements regarding the projected performance of Zions Bancorporation. These statements constitute forward-looking information within the meaning of the Private Securities Litigation Reform Act. Actual results or achievements may differ materially from the projections provided in this presentation since such projections involve significant known and unknown risks and uncertainties. Factors that might cause such differences include, but are not limited to: competitive pressures among financial institutions increasing significantly; economic conditions, either nationally or locally in areas in which Zions Bancorporation conducts their operations, being less favorable than expected; changes in the interest rate environment reducing expected interest margins; legislation or regulatory changes, which adversely affect the ability of the company to conduct the business in which the company would be engaged; delays in adoption of digital certificates for online services. Zions Bancorporation disclaims any obligation to update any such factors or to publicly announce the result of any revisions to any of the forward-looking statements included herein to reflect future events or developments.
Zions Bancorporation Analyst Day
19 February 2004 Salt Lake City, Utah