Exhibit 13
[FINANCIAL HIGHLIGHTS]
| | | | | | | | | | | | |
| (In millions except per share amounts) | | 2003 /2002
CHANGE
| | 2003
| | 2002
| | 2001
| | 2000
| | 1999
|
FOR THE YEAR | | | | | | | | | | | | |
INCOME FROM CONTINUING OPERATIONS | | +7% | | 339.6 | | 317.1 | | 298.6 | | 161.7 | | 194.1 |
NET INCOME | | +32% | | 337.8 | | 256.3 | | 283.0 | | 161.7 | | 194.1 |
| | | | | | |
PER SHARE | | | | | | | | | | | | |
INCOME FROM CONTINUING OPERATIONS – DILUTED | | +9% | | 3.74 | | 3.44 | | 3.24 | | 1.86 | | 2.26 |
NET INCOME – DILUTED | | +34% | | 3.72 | | 2.78 | | 3.07 | | 1.86 | | 2.26 |
NET INCOME – BASIC | | +34% | | 3.75 | | 2.80 | | 3.10 | | 1.87 | | 2.29 |
DIVIDENDS DECLARED | | +28% | | 1.02 | | .80 | | .80 | | .89 | | .72 |
BOOK VALUE(1) | | +8% | | 28.27 | | 26.17 | | 24.74 | | 20.42 | | 19.39 |
MARKET PRICE – END | | | | 61.34 | | 39.35 | | 52.58 | | 62.44 | | 59.19 |
MARKET PRICE – HIGH | | | | 63.86 | | 59.65 | | 64.00 | | 62.75 | | 75.88 |
MARKET PRICE – LOW | | | | 39.31 | | 34.14 | | 42.30 | | 36.44 | | 49.00 |
| | | | | | |
AT YEAR-END | | | | | | | | | | | | |
ASSETS | | +8% | | 28,558 | | 26,566 | | 24,304 | | 21,939 | | 20,281 |
LOANS AND LEASES | | +5% | | 19,920 | | 19,040 | | 17,311 | | 14,378 | | 12,791 |
LOANS SOLD BEING SERVICED(2) | | +12% | | 2,782 | | 2,476 | | 2,648 | | 1,750 | | 1,252 |
DEPOSITS | | +4% | | 20,897 | | 20,132 | | 17,842 | | 15,070 | | 14,062 |
LONG-TERM BORROWINGS | | +41% | | 1,843 | | 1,310 | | 1,022 | | 563 | | 566 |
SHAREHOLDERS’ EQUITY | | +7% | | 2,540 | | 2,374 | | 2,281 | | 1,779 | | 1,660 |
| | | | | | |
PERFORMANCE RATIOS | | | | | | | | | | | | |
RETURN ON AVERAGE ASSETS | | | | 1.20% | | .97% | | 1.19% | | .74% | | .97% |
RETURN ON AVERAGE SHAREHOLDERS’ EQUITY | | | | 13.69% | | 10.95% | | 13.28% | | 9.65% | | 12.42% |
EFFICIENCY RATIO | | | | 55.65% | | 63.40% | | 61.60% | | 64.92%(3) | | 66.55% |
NET INTEREST MARGIN | | | | 4.45% | | 4.56% | | 4.64% | | 4.27% | | 4.31% |
| | | | | | |
CAPITAL RATIOS(1) | | | | | | | | | | | | |
EQUITY TO ASSETS | | | | 8.89% | | 8.94% | | 9.38% | | 8.11% | | 8.18% |
TIER 1 LEVERAGE | | | | 8.06% | | 7.56% | | 6.56% | | 6.38% | | 6.16% |
TIER 1 RISK-BASED CAPITAL | | | | 9.42% | | 9.26% | | 8.25% | | 8.53% | | 8.64% |
TOTAL RISK-BASED CAPITAL | | | | 13.52% | | 12.94% | | 12.20% | | 10.83% | | 11.29% |
| | | | | | |
SELECTED INFORMATION | | | | | | | | | | | | |
AVERAGE COMMON-EQUIVALENT SHARES (in thousands) | | | | 90,734 | | 92,079 | | 92,174 | | 87,120 | | 85,695 |
COMMON DIVIDEND PAYOUT RATIO | | | | 27.20% | | 28.58% | | 26.11% | | 34.65%(3) | | 29.33% |
FULL-TIME EQUIVALENT EMPLOYEES | | | | 7,896 | | 8,073 | | 8,124 | | 6,915 | | 6,833 |
COMMERCIAL BANKING OFFICES | | | | 412 | | 415 | | 412 | | 373 | | 362 |
ATMS | | | | 553 | | 588 | | 589 | | 509 | | 484 |
| (2) | Amount represents the outstanding balance of loans sold and being serviced by the Company, excluding conforming first mortgage residential real estate loans. |
| (3) | Before impairment loss of $96.6 million on First Security Corporation common stock. |
INSIDE FRONT COVER
MANAGEMENT’S DISCUSSION AND ANALYSIS
EXECUTIVE SUMMARY
COMPANY OVERVIEW
Zions Bancorporation (“the Parent”) and subsidiaries (collectively “the Company”, “Zions”, “we”, “our”) is a financial holding company headquartered in Salt Lake City, Utah. The Company operates banking businesses primarily in seven Western states. These banking operations currently generate the majority of the Company’s revenues and profits. In addition, Zions operates a number of specialty financial services and financial technology businesses on a regional or national scale.
In operating its banking businesses, Zions seeks to combine the advantages that it believes can result from decentralized organization and branding, with those that can come from centralized risk management, capital management and operations. In its specialty financial services and technology businesses, Zions seeks to develop a competitive advantage in a particular product, customer or technology niche.
BANKING BUSINESSES
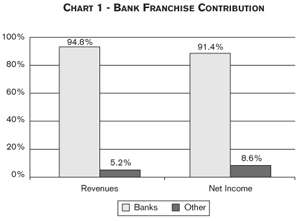
As shown in Chart 1, in 2003 the banking franchises accounted for 94.8% of the Company’s total revenue and 91.4% of its net income. Other sources of income for 2003 consisted primarily of gains on sales of investments, which are discussed in more detail in “Noninterest Income” on page 35.
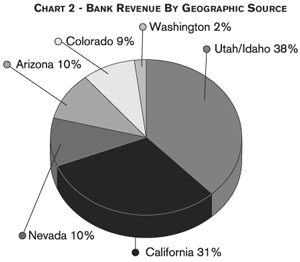
As shown in Chart 2, revenue from the banking franchises is widely diversified among the states in which the Company operates.
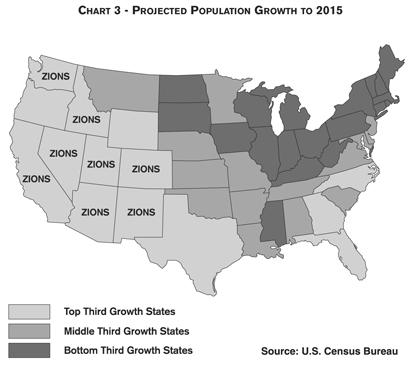
Our growth strategy for Zions’ banking business is driven by several key factors: (1) focus on high growth markets; (2) keep decisions about customers local; and (3) centralize technology and operations to achieve economies of scale.
Focus on high growth markets:Zions conducts its banking business in the Western States – primarily Arizona, California, Colorado, Idaho, Nevada, Utah, and Washington, with a small presence in New Mexico. Each of these states has experienced historical growth and each ranks among the top one-third of the fastest growing states as projected by the U. S. Census Bureau. These states have high population growth relative to other states, largely driven by inward migration from other parts of the United States and from other countries.
Within these geographic regions, we focus on what we believe to be the most attractive segments. We believe that the states in which Zions operates have rates of business formation and expansion higher than in other states. We also believe that these states have higher rates of commercial real estate development to provide housing, shopping, business locations and other
23
amenities for their growing populations. As a result, a common focus of all of Zions’ subsidiary banks is small and middle market business banking (including the executives and employees of those businesses) and commercial real estate development. In many cases the Company’s relationship with these customers is primarily driven by the goal to satisfy their needs for credit to finance their expanding business opportunities. In some states we also pursue a broad base of consumer business, which is often more deposit driven. This mix of business often leads to loan balances growing faster than internally generated deposits. In addition, it has important implications for the Company’s management of certain risks, including interest rate and liquidity risks, which are discussed further in later sections of this document.
The Company historically has also generated rapid growth through acquisitions of other community banks. However, in recent years acquisitions have not been an important contributor to growth. We believe that average prices paid for acquired banks have generally steadily escalated over the past two decades, as measured by such common metrics as premium-to-deposits and price-to-book value. Price expectations of sellers, therefore, have become high. At prices typically paid in today’s market, we believe that it could be more difficult than in prior years to create economic value for the Company’s shareholders through acquisitions. While we will continue to pursue acquisitions as a growth strategy, we believe that bank acquisitions, in general, may be a less important contributor to the Company’s growth in the near future.
Keep decisions about customers local:To assure that decisions related to customers stay local, the Company operates six different community/regional banks, each under a different name and a separate charter and each with its own chief executive officer, management team and local market strategies. Each bank controls, among other things, all decisions related to its branding, market strategies, its customer relationships, pricing and credit decisions (within corporate policy). In this way each bank seeks to differentiate itself in the market from much larger “mass market” banking competitors that operate regional or national franchises under a common
24
brand, often organized around “vertical” product silos. We believe that this management approach allows Zions to attract and retain superior management, and we believe that it results in superior customer service to our target customers. We also believe that this strategy over time generates superior growth.
Centralize technology and operations to achieve economies of scale:We seek to differentiate the Company from smaller banks in two ways. First, we use the combined scale of all the Company’s banks to create a broad product offering without the fragmentation of systems and operations that would drive up costs. Second, for certain products for which economies of scale are believed to be important, the Company “manufactures” the product centrally, or outsources it from a third party. Examples include cash management, credit card, mortgage servicing, trust and deposit operations. In this way the Company over time seeks to remain efficient while generating superior growth.
SPECIALTY FINANCE AND TECHNOLOGY BUSINESSES
In addition to its community and regional banking businesses, the Company operates a number of specialized businesses that are not geographically organized, but rather are national in scope. In some cases, results from these businesses are included within the results of one or more of the bank business segments. In other cases, these businesses are included in the “Other” segment, which also includes the Parent and other nonbanking subsidiaries. Key among these businesses are:
Included in Bank Segments:
| • | Low loan-to-value, owner-occupied, first mortgage small business commercial loans |
| • | Identrus, LLC – identity authentication |
| • | Odd lot electronic bond trading |
| • | Public finance advisory and underwriting |
Included in “Other” Segment:
| • | NetDeposit, Inc. – check digital imaging and clearing software and services |
| • | P5, Inc. – health care claims reconciliation services and receivables factoring |
| • | Providus Software Solutions, Inc. – software for assessing and managing operating risk |
RISK MANAGEMENT
Zions has centralized key risk management functions to assure independence and consistent application. The key centralized risk functions are:
| • | Credit policy and credit examination |
| • | Interest rate and market risk management (“Asset-Liability Management” or “ALM”) |
| • | Liquidity risk management |
| • | Operational risk assessment |
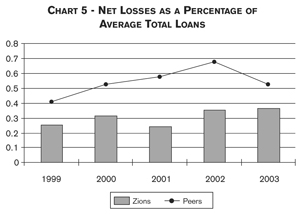
We believe that centralization of these risk management functions is in part responsible for consistently superior risk performance in relation to peers. For example, as displayed in Charts 4 and 5, for two key measures of credit risk (nonperforming assets to total assets and net losses to average total loans), the Company has consistently recorded better results than the average of peer bank-holding companies.
The nature of the Company’s core banking businesses poses particular challenges for managing liquidity and interest rate risk. Zions’ location in the fast-growing West and its focus on business banking means that it often does not generate deposit growth as rapidly as loan growth. While in late 2002 and much of 2003 robust deposit growth more than kept pace with

Note: Peer group is defined as bank holding companies with assets > $10 billion.
Peer data source: SNL Financial Database
Peer information for 2003 is from 3rd quarter 2003.
25
Note: Peer group is defined as bank holding companies with assets > $10 billion.
Peer data source: SNL Financial Database
Peer information for 2003 is from 3rd quarter 2003.
slower loan growth, historically this has not been the case. We also do not believe this will be the case going forward. Hence, we have engaged in securitizing assets and managing a securities conduit to help fund asset growth. This is explained in more detail in “Liquidity Management” on page 64.
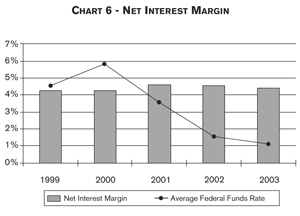
Our focus on business banking also determines the nature of the Company’s asset-liability management posture. In particular, this business mix leads naturally to a highly “asset sensitive” position, which we seek to mitigate in various ways, including an ongoing program of hedging floating rate commercial loans. Our approach toward asset-liability management, which is discussed in more detail in the section on page 59 entitled “Interest Rate Risk”, has enabled the Company to achieve a relatively stable net interest margin in a volatile interest rate environment. For example, Chart 6 shows the Company’s margin over time, compared to the average Federal Funds rate.
Of particular note, in January 2004 the staff of the Financial Accounting Standards Board (“FASB”) issued for comment a proposed interpretation of Statement of Financial Accounting Standards (“SFAS”) No. 133,Accounting for Derivative Instruments and Hedging Activities, that would disallow “Prime” as an acceptable index for cash flow hedges. We believe that a number of banks (including Zions), accounting firms and regulators will submit comments opposing this proposal. However, if it is issued in its current form, we would be required to significantly change the Company’s interest rate risk management practices.
Further discussion of the Company’s use of and accounting for hedges is found in the section entitled “Interest Rate and Market Risk Management” on page 59 and Notes 1 and 7 of the Notes to Consolidated Financial Statements.
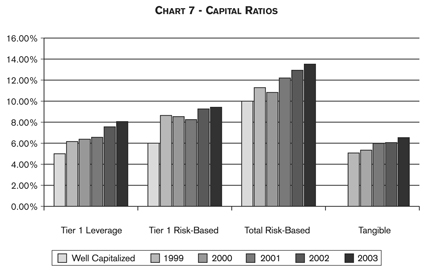
CAPITAL MANAGEMENT
We believe that the Company should maintain adequate capital to support its businesses and the risks inherent in them, but it should not retain capital in excess of those needs. Thus, we seek to maintain capital ratios consistent with achieving an “investment grade” rating on the Company’s debt, and to meet relevant “well capitalized” regulatory standards at all times. We believe that the capital ratios achieved in 2003 are consistent with those objectives, and presently do not plan to further materially increase the Company’s key capital ratios. See “Capital Management” on page 66 for more information on capital requirements.
26
MANAGEMENT’S OVERVIEW OF 2003
The Company reported record earnings for 2003 of $337.8 million or $3.72 per diluted share, compared with $256.3 million or $2.78 per share for 2002, and $283.0 million or $3.07 per share in 2001. Income from continuing operations for 2003 was $339.6 million or $3.74 per diluted share, an increase from $317.1 million or $3.44 for 2002, and $298.6 million or $3.24 for 2001.
The Company’s primary or “core” business consists of providing community and regional banking services to both individuals and businesses in the Western states. We believe that this core banking business performed well during 2003 despite the difficult economic environment that these markets continue to experience. However, while we believe that the general economy in the Company’s markets is improving, the cautious optimism that we maintained in 2003 with regard to the Company’s growth is still appropriate and will continue to influence our decisions.
PERFORMANCE SUMMARY
The key indicators that we look to when evaluating the Company’s performance displayed positive and encouraging results for 2003. Taxable-equivalent net interest income increased 5.9% over 2002, despite the difficult interest rate environment that persisted throughout 2003, and in light of a slight erosion in the net interest margin that we experienced during the same period. We attribute this reduction in the margin to the Company’s “asset sensitive” position with regard to asset-liability management (“ALM”), in an environment that has been characterized by sustained low interest rates. We also expect that we will see continued downward pressures on our margins in 2004. See “Interest Rate Risk” on page 59 for more information on the Company’s ALM philosophy and practice.
EXPENSES
In 2002, we announced our intention to place a greater focus on controlling expenses with a goal of taking $50 million out of the annual run-rate of expenses by mid-2003. We believe that our efforts have been successful as reflected in the improvement in the Company’s efficiency ratio from 63.40% in 2002 to 55.65% in 2003. The efficiency ratio is the relationship between noninterest expense and total taxable-equivalent revenue. However, since the ratio for 2003 was favorably influenced by some large equity gains that took place in the third quarter of 2003, it may not be indicative of a sustainable ratio in the future. We believe that the efficiency ratio that we achieved in the fourth quarter of 2003 of 56.38% may be more indicative of the current “run-rate” for the ratio, although we expect to continue our efforts to identify opportunities for operating efficiencies and additional cost savings in the future.
27
ASSET QUALITY
The Company’s asset quality also experienced improvements during 2003. The ratio of nonperforming assets to net loans and other real estate owned was 0.49%, which is its lowest level since the fourth quarter of 2000. Based on data that we have available, the Company’s credit quality trends remain better than its peer average as measured by nonperforming asset and charge-off data. In addition, if the present economic recovery continues, we expect, based on the data available, to see continued stable to improving trends in credit quality indicators.
DEPOSIT AND LOAN GROWTH
Growth in deposits and loans is also a gauge that we use to measure the Company’s performance. The strong deposit growth that the Company enjoyed in 2002 slowed significantly in 2003. The 12.8% growth in 2002 decreased to 3.8% in 2003. However, the mix of deposits improved during 2003 with time deposits generally being replaced by demand, savings and money market deposits. We believe that the rate of increase in 2002 and early 2003 was unusual and caused by a combination of two factors. These were reduced levels of investments in market instruments (e.g., stocks, bonds and mutual funds) during periods of perceived high risk, and businesses reducing expenses and inventories during a period of slower economic activity, both of which resulted in increased cash balances in bank deposit accounts. We believe that these deposit growth drivers may be weakening as financial markets and economic activity rebound. This could result in a downward trend in deposit growth, which may continue throughout 2004 and require us to use alternative sources to meet our funding needs.
Loan growth was modest for 2003 reflecting an improving but still soft economy in Zions’ primary markets. In particular, we experienced strong loan growth in Arizona and Nevada but this strength was offset by net slower growth in California and Colorado. In addition, in Utah we experienced moderate loan growth that we expect will continue in 2004.
In California, we continue to experience reasonably strong new originations of commercial real estate, commercial business and consumer loans, although the consumer lending business for us in California is relatively new and growing from a small base. However, intentional run-off of certain acquired portfolios, a high rate of refinance activity in commercial real estate term lending and rapid sales of completed homes in our residential construction lending offset these originations. Finally, a portion of the growth that we experienced in California in 2003 resulted from purchases of adjustable-rate (generally “5/1 ARM”) mortgages by California Bank & Trust in connection with its asset-liability management efforts. We anticipate that in 2004 this commercial real estate refinance activity and intentional run-off of acquired portfolios will diminish, allowing California Bank & Trust to generate net loan growth for the year.
In Colorado, the Company engaged in a complete strategic review of its subsidiary, Vectra Bank Colorado (“Vectra”). As part of the review, the Company recorded impairment charges, severance and restructuring charges and made a number of decisions regarding Vectra’s strategy. We decided to deemphasize certain types of businesses, including several specific lending products, and focus more specifically on providing services to small- and mid-sized businesses and their employees. Net loan, deposit and income growth was depressed in 2003 by both the implementation of those decisions and the poor economic environment. In addition, eleven branches with approximately $150 million of loans and deposits are currently under contracts to be sold. These sales are expected to close in the first half of 2004, and selling those loans and deposits will depress net growth in the first half of the year. However, as 2003 ended, Vectra’s pipeline of new potential business was strengthening, and we currently believe that net positive growth will resume later in 2004.
CAPITAL
Since Zions is a regulated financial institution, the Company and the subsidiary banks are required to maintain adequate levels of capital as measured by
28
several regulatory capital ratios. One of our goals is to maintain capital levels that are at least “well capitalized” under regulatory standards. In addition, the Parent and its subsidiaries have issued various debt securities that have been rated by the principal rating agencies. Another goal is to maintain capital at levels consistent with an “investment grade” rating for these securities. The Company has maintained its well capitalized status and its capital ratios have increased over the past five years to their current levels.
We believe that the Company has adequate levels of capital in relation to its balance sheet size, business mix and levels of risk and, as a result, we do not presently plan that the capital ratios will materially increase from their present levels. It is our belief that capital not considered necessary to support current and anticipated business should be returned to the Company’s shareholders through dividends and repurchases of its shares and, in particular, the Company does not hold capital in anticipation of possible acquisitions. Historically, the Company has emphasized share repurchases over dividends, due to the lower federal tax rate applied to capital gains. However, with the change in tax law to reduce and equalize the tax rates applied to dividends and capital gains, in the third quarter of 2003 the Company increased its quarterly per share dividend 43%, from $0.21 per share to the current rate of $0.30 per share. The Company paid $91.9 million in common stock dividends in 2003, and used $106.8 million to repurchase shares of Zions common stock. In total, we returned to shareholders $198.7 million out of total net income of $337.8 million, or 58.8%. Additional information on capital management is found in the section entitled “Capital Management” on page 66.
CHALLENGES TO OPERATIONS
By far the largest operating challenges that we faced during 2003 were directly tied to the economies in our various markets and we believe that these challenges will continue into 2004, although they do appear to be moderating. The interest rate environment that we experienced has left little room for us to reduce the costs of our deposits, while at the same time older higher-rate loans and investments have been maturing or paying down. This has placed downward pressure on our net interest margin.
Loan demand remains weak in some geographical areas and for some product lines. In addition, we believe that expense and inventory reductions that have been realized by companies in the industrial sectors have led to cash build-ups, which likely will be reduced before new loan funding is needed.
On the positive side, however, Arizona and Nevada have experienced improved loan demand. In addition, low rates continue to help keep the demand for consumer mortgages relatively high, and our credit quality has consistently improved throughout 2003 and exceeds most of our peers in terms of nonperforming assets and net charge-offs.
The geographic regions in which the Company operates should strengthen with the anticipated improvements in the economy. However, if the economy continues to improve, we would also expect to begin to see customer funds leave the safety of insured deposits and move to such areas as higher-risk stocks and mutual funds, or to fund customers’ business activities. If this occurs, we will need to look to securitization of assets and higher-cost funding sources to finance earning asset growth.
29
Competition with credit unions also continues to be a significant challenge. Their aggressive expansion with new branch construction moving across the Company’s markets will present ongoing competitive pressures. While this is an issue in all of Zions’ markets, it is especially acute in Utah at the present time.
STRATEGIC DECISIONS
Over the past three years, we have made a number of strategic decisions to help position the Company for improved performance in the future. The following table summarizes the income statement effects of these and certain other actions on pretax and after-tax earnings and on diluted earnings per share for the years 2003, 2002 and 2001.
Please refer to this table as part of the following discussions of the key decisions that we made during 2003. These events are also more fully discussed in subsequent sections of Management’s Discussion and Analysis.
VECTRA BANK COLORADO
Beginning in 1997, the Company commenced banking operations in Colorado through a series of acquisitions, which were combined into Vectra. In the ensuing years, Vectra has taken a number of steps to improve its performance. However, in light of continued weak economic conditions in Colorado, Vectra’s performance has not yet met our expectations. Early in 2003, we engaged a national consulting firm to assist Vectra in analyzing its strategy and accelerating its performance improvement. This analysis resulted in a decision to restructure Vectra to enable it to focus on small- and mid-sized businesses and their employees. As noted in the following table, this restructuring and an accompanying goodwill impairment analysis in accordance with the requirements of SFAS No. 142,Goodwill and Other Intangible Assets,resulted in our writing off $75.6 million of the goodwill associated with Vectra.
| | | | | | | | | | | | | | | | | | | |
| | | 2003
| | 2002
| | 2001
|
| (In millions, except per share amounts) | | Pretax
| | After-tax
| | EPS
effect
| | Pretax
| | After-tax
| | EPS
effect
| | Pretax
| | After-tax
| | EPS
effect
|
Noninterest income: | | | | | | | | | | | | | | | | | | | |
Equity securities gains (losses), net: | | | | | | | | | | | | | | | | | | | |
Net write-downs of venture capital investments and a minority interest in an investment banking firm | | $ | (30.6) | | (18.9) | | (0.21) | | (28.7) | | (17.7) | | (0.19) | | (39.6) | | (24.4) | | (0.26) |
Gain on sale of ICAP, plc | | | 68.5 | | 42.3 | | 0.47 | | – | | – | | – | | – | | – | | – |
Net gain on sales of other equity investments | | | 25.9 | | 16.0 | | 0.18 | | 3.4 | | 2.1 | | 0.02 | | 6.0 | | 3.7 | | 0.04 |
Gains from Concord EFS, Inc. transactions | | | – | | – | | – | | – | | – | | – | | 70.8 | | 42.7 | | 0.46 |
| | |
|
| |
| |
| |
| |
| |
| |
| |
| |
|
Subtotal | | | 63.8 | | 39.4 | | 0.44 | | (25.3) | | (15.6) | | (0.17) | | 37.2 | | 22.0 | | 0.24 |
| | |
|
| |
| |
| |
| |
| |
| |
| |
| |
|
Noninterest expense: | | | | | | | | | | | | | | | | | | | |
Debt extinguishment cost | | | 24.2 | | 15.0 | | (0.16) | | – | | – | | – | | – | | – | | – |
Restructuring charges | | | 1.9 | | 1.2 | | (0.01) | | 3.3 | | 2.0 | | (0.02) | | – | | – | | – |
Impairment losses on certain long-lived assets | | | 2.7 | | 1.6 | | (0.02) | | 4.9 | | 3.1 | | (0.03) | | – | | – | | – |
Merger related expense | | | – | | – | | – | | – | | – | | – | | 7.3 | | 4.5 | | (0.05) |
| | |
|
| |
| |
| |
| |
| |
| |
| |
| |
|
Subtotal | | | 28.8 | | 17.8 | | (0.19) | | 8.2 | | 5.1 | | (0.05) | | 7.3 | | 4.5 | | (0.05) |
| | |
|
| |
| |
| |
| |
| |
| |
| |
| |
|
Impairment loss on goodwill | | | 75.6 | | 75.6 | | (0.83) | | – | | – | | – | | – | | – | | – |
| | |
|
| |
| |
| |
| |
| |
| |
| |
| |
|
Other tax effects | | | n/a | | 7.3 | | 0.08 | | – | | – | | – | | – | | – | | – |
| | |
|
| |
| |
| |
| |
| |
| |
| |
| |
|
Discontinued operations: | | | | | | | | | | | | | | | | | | | |
Impairment losses and loss on sale | | | (2.4) | | (1.5) | | (0.02) | | (28.7) | | (22.7) | | (0.25) | | – | | – | | – |
| | |
|
| |
| |
| |
| |
| |
| |
| |
| |
|
Cumulative effect of change in accounting principle | | | – | | – | | – | | (35.0) | | (32.4) | | (0.35) | | (11.7) | | (7.2) | | (0.08) |
| | |
|
| |
| |
| |
| |
| |
| |
| |
| |
|
Total significant unusual items | | $ | (43.0) | | (48.2) | | (0.52) | | (97.2) | | (75.8) | | (0.82) | | 18.2 | | 10.3 | | 0.11 |
| | |
|
| |
| |
| |
| |
| |
| |
| |
| |
|
30
In addition, Vectra has taken a number of other steps to improve its financial performance, including consolidating operations, reducing staff costs, and hiring new business development officers and management. Also included in these actions is the sale of eleven branches in areas that no longer fit Vectra’s new strategic direction. These branches are all under contracts of sale in two transactions and are expected to close in the first half of 2004. Upon closing, approximately $150 million of loans and deposits, and associated revenues and expenses, will no longer be included in Vectra’s financial statements, temporarily depressing Vectra’s net growth. We believe, however, that the restructuring is a positive step toward improving the future profitability of this subsidiary bank.
EQUITY SALES
In 2003, we made a decision to sell the Company’s investment in ICAP plc (“ICAP”). Net proceeds from the sale were approximately $106.8 million and the Company realized a pretax gain of approximately $68.5 million in connection with the sale. In 2003, we also sold our investment in Lending Tree, Inc. for net proceeds of $25.6 million, from which the Company realized a pretax gain of approximately $21.1 million.
In addition, we sold our investment in Lexign, Inc., which completed our previously announced plan to sell portions of the Company’s e-commerce investments. The sale resulted in a pretax loss of $2.4 million. With this sale, the Company disposed of the last of the businesses that were written down in 2002 and moved into discontinued operations.
RESULTS OF OPERATIONS
NET INTEREST INCOME, MARGIN AND INTEREST RATE SPREADS
Net interest income is the difference between interest earned on assets and interest incurred on liabilities. When we discuss net interest income on a taxable-equivalent basis, we have adjusted net interest income such that any income that is exempt from income taxes is “grossed-up” to become comparable to the income that is taxable. We believe that presenting net interest income on a tax-equivalent basis provides a better comparability of income received from both taxable and tax-exempt sources. In addition, such presentation is consistent with industry practice.
On a taxable-equivalent basis, net interest income for 2003 was up 5.9% from 2002, which was up 8.9% from 2001. The tax-equivalent adjustments to net interest income for 2003, 2002 and 2001 were $22.9 million, $21.3 million, and $20.2 million, respectively. The increase in taxable-equivalent net interest income for both years was driven primarily by growth in average earning assets of 8.4% in 2003 and 10.8% in 2002, offset by the effects of declining net interest margins.
Taxable-equivalent net interest income is the largest component of Zions’ revenue. For the year 2003, it was 69.5% of our taxable-equivalent revenues, compared to 73.7% in 2002 and 70.2% in 2001. The decrease in the percentage for 2003 was primarily caused by the previously discussed gain on the sale of ICAP, which increased noninterest income in relation to total taxable-equivalent revenues. By its nature, net interest income is especially vulnerable to changes in the mix and amounts of interest-earning assets and interest-bearing liabilities. In addition, changes in the interest rates and yields associated with these assets and liabilities significantly impact net interest income. See “Interest Rate and Market Risk Management” on page 59 for a complete discussion of how we manage the portfolios of interest-earning assets and interest-bearing liabilities.
31
SCHEDULE 1
DISTRIBUTION OF ASSETS, LIABILITIES, AND SHAREHOLDERS’ EQUITY
AVERAGE BALANCE SHEETS, YIELDS AND RATES
| | | | | | | | | | | | | | | | | | | | | |
| | | 2003
| | 2002
| | | | | | |
(Amounts in millions) | | Average
balance
| | Amount
of
interest(1)
| | Average
rate
| | Average
balance
| | Amount
of
interest(1)
| | Average
rate
| | | | | | |
ASSETS: | | | | | | | | | | | | | | | | | | | | | |
Money market investments | | $ | 1,343 | | 13.0 | | 0.97% | | $ | 1,199 | | 18.6 | | 1.55% | | | | | | | |
Securities: | | | | | | | | | | | | | | | | | | | | | |
Held to maturity | | | – | | – | | | | | 43 | | 2.3 | | 5.34 | | | | | | | |
Available for sale | | | 3,736 | | 171.5 | | 4.59 | | | 3,209 | | 170.0 | | 5.30 | | | | | | | |
Trading account | | | 711 | | 24.7 | | 3.47 | | | 611 | | 22.1 | | 3.62 | | | | | | | |
| | |
|
| |
| | | |
|
| |
| | | | | | | | | |
Total securities | | | 4,447 | | 196.2 | | 4.41 | | | 3,863 | | 194.4 | | 5.03 | | | | | | | |
| | |
|
| |
| | | |
|
| |
| | | | | | | | | |
Loans: | | | | | | | | | | | | | | | | | | | | | |
Loans held for sale | | | 220 | | 8.3 | | 3.77 | | | 210 | | 9.4 | | 4.50 | | | | | | | |
Net loans and leases(2) | | | 19,105 | | 1,204.8 | | 6.31 | | | 17,904 | | 1,254.8 | | 7.01 | | | | | | | |
| | |
|
| |
| | | |
|
| |
| | | | | | | | | |
Total loans and leases | | | 19,325 | | 1,213.1 | | 6.28 | | | 18,114 | | 1,264.2 | | 6.98 | | | | | | | |
| | |
|
| |
| | | |
|
| |
| | | | | | | | | |
Total interest-earning assets | | | 25,115 | | 1,422.3 | | 5.66 | | | 23,176 | | 1,477.2 | | 6.37 | | | | | | | |
| | | | | |
| | | | | | |
| | | | | | | | | |
Cash and due from banks | | | 953 | | | | | | | 939 | | | | | | | | | | | |
Allowance for loan losses | | | (282) | | | | | | | (267) | | | | | | | | | | | |
Goodwill | | | 711 | | | | | | | 744 | | | | | | | | | | | |
Core deposit and other intangibles | | | 77 | | | | | | | 98 | | | | | | | | | | | |
Other assets | | | 1,630 | | | | | | | 1,606 | | | | | | | | | | | |
| | |
|
| | | | | |
|
| | | | | | | | | | | |
Total assets | | $ | 28,204 | | | | | | $ | 26,296 | | | | | | | | | | | |
| | |
|
| | | | | |
|
| | | | | | | | | | | |
LIABILITIES: | | | | | | | | | | | | | | | | | | | | | |
Interest-bearing deposits: | | | | | | | | | | | | | | | | | | | | | |
Savings and NOW | | $ | 2,984 | | 19.1 | | 0.64 | | $ | 2,555 | | 26.5 | | 1.04 | | | | | | | |
Money market super NOW | | | 8,890 | | 92.5 | | 1.04 | | | 8,021 | | 138.1 | | 1.72 | | | | | | | |
Time under $100,000 | | | 1,644 | | 36.9 | | 2.25 | | | 1,911 | | 62.1 | | 3.25 | | | | | | | |
Time $100,000 and over | | | 1,290 | | 33.3 | | 2.58 | | | 1,487 | | 50.5 | | 3.40 | | | | | | | |
Foreign | | | 186 | | 1.7 | | 0.89 | | | 106 | | 1.5 | | 1.42 | | | | | | | |
| | |
|
| |
| | | |
|
| |
| | | | | | | | | |
Total interest-bearing deposits | | | 14,994 | | 183.5 | | 1.22 | | | 14,080 | | 278.7 | | 1.98 | | | | | | | |
| | |
|
| |
| | | |
|
| |
| | | | | | | | | |
Borrowed funds: | | | | | | | | | | | | | | | | | | | | | |
Securities sold, not yet purchased | | | 538 | | 20.4 | | 3.80 | | | 394 | | 16.4 | | 4.17 | | | | | | | |
Federal funds purchased and security repurchase agreements | | | 2,605 | | 25.5 | | 0.98 | | | 2,528 | | 39.1 | | 1.55 | | | | | | | |
Commercial paper | | | 215 | | 3.0 | | 1.41 | | | 359 | | 7.5 | | 2.09 | | | | | | | |
FHLB advances and other borrowings: | | | | | | | | | | | | | | | | | | | | | |
One year or less | | | 145 | | 1.9 | | 1.32 | | | 533 | | 10.3 | | 1.93 | | | | | | | |
Over one year | | | 237 | | 12.3 | | 5.19 | | | 240 | | 12.5 | | 5.18 | | | | | | | |
Long-term debt | | | 1,277 | | 57.3 | | 4.48 | | | 874 | | 56.3 | | 6.45 | | | | | | | |
| | |
|
| |
| | | |
|
| |
| | | | | | | | | |
Total borrowed funds | | | 5,017 | | 120.4 | | 2.40 | | | 4,928 | | 142.1 | | 2.88 | | | | | | | |
| | |
|
| |
| | | |
|
| |
| | | | | | | | | |
Total interest-bearing liabilities | | | 20,011 | | 303.9 | | 1.52 | | | 19,008 | | 420.8 | | 2.21 | | | | | | | |
| | | | | |
| | | |
|
| |
| | | | | | | | | |
Noninterest-bearing deposits | | | 5,259 | | | | | | | 4,522 | | | | | | | | | | | |
Other liabilities | | | 444 | | | | | | | 404 | | | | | | | | | | | |
| | |
|
| | | | | |
|
| | | | | | | | | | | |
Total liabilities | | | 25,714 | | | | | | | 23,934 | | | | | | | | | | | |
Minority interest | | | 22 | | | | | | | 21 | | | | | | | | | | | |
Total shareholders’ equity | | | 2,468 | | | | | | | 2,341 | | | | | | | | | | | |
| | |
|
| | | | | |
|
| | | | | | | �� | | | | |
Total liabilities and shareholders’ equity | | $ | 28,204 | | | | | | $ | 26,296 | | | | | | | | | | | |
| | |
|
| | | | | |
|
| | | | | | | | | | | |
Spread on average interest-bearing funds | | | | | | | 4.14% | | | | | | | 4.16% | | | | | | | |
| | | | | | | |
| | | | | | |
| | | | | | | |
Taxable-equivalent net interest income and net yield on interest-earning assets | | | | | 1,118.4 | | 4.45% | | | | | 1,056.4 | | 4.56% | | | | | | | |
| | | | | |
| |
| | | | |
| |
| | | | | | | |
| | | |
| | | 2001
| | 2000
| | 1999
|
| (Amounts in millions) | | Average
balance
| | Amount
of
interest(1)
| | Average
rate
| | Average
balance
| | Amount
of
interest(1)
| | Average
rate
| | Average
balance
| | Amount
of
interest(1)
| | Average
rate
|
ASSETS: | | | | | | | | | | | | | | | | | | | | | |
Money market investments | | $ | 924 | | 34.9 | | 3.78% | | $ | 1,061 | | 67.4 | | 6.35% | | $ | 1,185 | | 67.2 | | 5.67% |
Securities: | | | | | | | | | | | | | | | | | | | | | |
Held to maturity | | | 56 | | 3.4 | | 5.98 | | | 3,254 | | 222.1 | | 6.83 | | | 3,277 | | 204.6 | | 6.24 |
Available for sale | | | 3,269 | | 207.2 | | 6.34 | | | 685 | | 44.8 | | 6.53 | | | 741 | | 42.4 | | 5.72 |
Trading account | | | 647 | | 30.9 | | 4.78 | | | 574 | | 36.3 | | 6.32 | | | 538 | | 30.1 | | 5.59 |
| | |
|
| |
| | | |
|
| |
| |
| |
|
| |
| | |
Total securities | | | 3,972 | | 241.5 | | 6.08 | | | 4,513 | | 303.2 | | 6.72 | | | 4,556 | | 277.1 | | 6.08 |
| | |
|
| |
| | | |
|
| |
| | | |
|
| |
| | |
Loans: | | | | | | | | | | | | | | | | | | | | | |
Loans held for sale | | | 220 | | 13.1 | | 5.94 | | | 192 | | 14.5 | | 7.52 | | | 178 | | 12.2 | | 6.85 |
Net loans and leases(2) | | | 15,795 | | 1,322.6 | | 8.37 | | | 13,457 | | 1,259.2 | | 9.36 | | | 11,641 | | 1,019.0 | | 8.75 |
| | |
|
| |
| | | |
|
| |
| | | |
|
| |
| | |
Total loans and leases | | | 16,015 | | 1,335.7 | | 8.34 | | | 13,649 | | 1,273.7 | | 9.33 | | | 11,819 | | 1,031.2 | | 8.72 |
| | |
|
| |
| | | |
|
| |
| | | |
|
| |
| | |
Total interest-earning assets | | | 20,911 | | 1,612.1 | | 7.71 | | | 19,223 | | 1,644.3 | | 8.55 | | | 17,560 | | 1,375.5 | | 7.83 |
| | | | | |
| | | | | | |
| | | | | | |
| | |
Cash and due from banks | | | 821 | | | | | | | 826 | | | | | | | 856 | | | | |
Allowance for loan losses | | | (229) | | | | | | | (203) | | | | | | | (211) | | | | |
Goodwill | | | 703 | | | | | | | 572 | | | | | | | 574 | | | | |
Core deposit and other intangibles | | | 101 | | | | | | | 76 | | | | | | | 81 | | | | |
Other assets | | | 1,513 | | | | | | | 1,228 | | | | | | | 1,052 | | | | |
| | |
|
| | | | | |
|
| | | | | |
|
| | | | |
Total assets | | $ | 23,820 | | | | | | $ | 21,722 | | | | | | $ | 19,912 | | | | |
| | |
|
| | | | | |
|
| | | | | |
|
| | | | |
LIABILITIES: | | | | | | | | | | | | | | | | | | | | | |
Interest-bearing deposits: | | | | | | | | | | | | | | | | | | | | | |
Savings and NOW | | $ | 2,060 | | 32.3 | | 1.57 | | $ | 1,783 | | 40.0 | | 2.24 | | $ | 1,812 | | 44.1 | | 2.43 |
Money market super NOW | | | 7,039 | | 219.3 | | 3.12 | | | 6,210 | | 289.4 | | 4.66 | | | 5,521 | | 203.6 | | 3.69 |
Time under $100,000 | | | 1,984 | | 98.2 | | 4.95 | | | 1,719 | | 87.7 | | 5.10 | | | 2,085 | | 98.5 | | 4.72 |
Time $100,000 and over | | | 1,658 | | 86.5 | | 5.22 | | | 1,408 | | 80.4 | | 5.71 | | | 1,257 | | 61.1 | | 4.86 |
Foreign | | | 106 | | 2.9 | | 2.79 | | | 138 | | 6.3 | | 4.56 | | | 165 | | 7.2 | | 4.36 |
| | |
|
| |
| | | |
|
| |
| | | |
|
| |
| | |
Total interest-bearing deposits | | | 12,847 | | 439.2 | | 3.42 | | | 11,258 | | 503.8 | | 4.48 | | | 10,840 | | 414.5 | | 3.82 |
| | |
|
| |
| | | |
|
| |
| | | |
|
| |
| | |
Borrowed funds: | | | | | | | | | | | | | | | | | | | | | |
Securities sold, not yet purchased | | | 340 | | 17.0 | | 5.01 | | | 311 | | 19.7 | | 6.32 | | | 271 | | 15.6 | | 5.76 |
Federal funds purchased and security repurchase agreements | | | 2,668 | | 95.9 | | 3.59 | | | 2,747 | | 159.7 | | 5.81 | | | 2,369 | | 108.5 | | 4.58 |
Commercial paper | | | 336 | | 14.5 | | 4.30 | | | 316 | | 20.7 | | 6.55 | | | 194 | | 10.8 | | 5.57 |
FHLB advances and other borrowings: | | | | | | | | | | | | | | | | | | | | | |
One year or less | | | 404 | | 21.7 | | 5.37 | | | 1,161 | | 76.2 | | 6.56 | | | 545 | | 28.5 | | 5.23 |
Over one year | | | 203 | | 11.1 | | 5.44 | | | 140 | | 8.5 | | 6.06 | | | 76 | | 4.8 | | 6.32 |
Long-term debt | | | 569 | | 42.7 | | 7.51 | | | 429 | | 34.2 | | 7.98 | | | 453 | | 35.1 | | 7.75 |
| | |
|
| |
| | | |
|
| |
| | | |
|
| |
| | |
Total borrowed funds | | | 4,520 | | 202.9 | | 4.49 | | | 5,104 | | 319.0 | | 6.25 | | | 3,908 | | 203.3 | | 5.20 |
| | |
|
| |
| | | |
|
| |
| | | |
|
| |
| | |
Total interest-bearing liabilities | | | 17,367 | | 642.1 | | 3.70 | | | 16,362 | | 822.8 | | 5.03 | | | 14,748 | | 617.8 | | 4.19 |
| | | | | |
| | | | | | |
| | | | | | |
| | |
Noninterest-bearing deposits | | | 3,907 | | | | | | | 3,316 | | | | | | | 3,249 | | | | |
Other liabilities | | | 385 | | | | | | | 329 | | | | | | | 316 | | | | |
| | |
|
| | | | | |
|
| | | | | |
|
| | | | |
Total liabilities | | | 21,659 | | | | | | | 20,007 | | | | | | | 18,313 | | | | |
Minority interest | | | 30 | | | | | | | 40 | | | | | | | 37 | | | | |
Total shareholders’ equity | | | 2,131 | | | | | | | 1,675 | | | | | | | 1,562 | | | | |
| | |
|
| | | | | |
|
| | | | | |
|
| | | | |
Total liabilities and shareholders’ equity | | $ | 23,820 | | | | | | $ | 21,722 | | | | | | $ | 19,912 | | | | |
| | |
|
| | | | | |
|
| | | | | |
|
| | | | |
Spread on average interest-bearing funds | | | | | | | 4.01% | | | | | | | 3.52% | | | | | | | 3.64% |
| | | | | | | |
| | | | | | |
| | | | | | |
|
Taxable-equivalent net interest income and net yield on interest-earning assets | | | | | 970.0 | | 4.64% | | | | | 821.5 | | 4.27% | | | | | 757.7 | | 4.31% |
| | | | | |
| |
| | | | |
| |
| | | | |
| |
|
| (1) | Taxable-equivalent rates used where applicable. |
| (2) | Net of unearned income and fees, net of related costs. Loans include nonaccrual and restructured loans. |
32
[THIS PAGE INTENTIONALLY LEFT BLANK]
33
One of the gauges that we use to measure success in managing our interest-earning assets and interest-bearing liabilities is the net interest margin. The net interest margin was 4.45% in 2003 compared with 4.56% in 2002 and 4.64% in 2001. The lower margin for 2003 was primarily the result of the continued declining interest rate environment that we also experienced in 2002. The loan portfolio experienced the largest rate decline, primarily as a result of the maturity and pre-payment of higher rate fixed-interest loans, which were replaced by new lower-yielding loans. For 2002, the margin was affected by deposit
SCHEDULE 2
ANALYSIS OF INTEREST CHANGES DUE TO VOLUME AND RATE
| | | | | | | | | | | | | |
| | | 2003 over 2002
| | 2002 over 2001
|
| | | Changes due to
| | Total
changes
| | Changes due to
| | Total
changes
|
| (Amounts in millions) | | Volume
| | Rate(1)
| | | Volume
| | Rate(1)
| |
INTEREST-EARNING ASSETS: | | | | | | | | | | | | | |
Money market investments | | $ | 1.4 | | (7.0) | | (5.6) | | 4.3 | | (20.6) | | (16.3) |
Securities: | | | | | | | | | | | | | |
Held to maturity | | | (2.3) | | – | | (2.3) | | (0.7) | | (0.4) | | (1.1) |
Available for sale | | | 24.2 | | (22.7) | | 1.5 | | (3.2) | | (34.0) | | (37.2) |
Trading account | | | 3.5 | | (0.9) | | 2.6 | | (1.3) | | (7.5) | | (8.8) |
| | |
|
| |
| |
| |
| |
| |
|
Total securities | | | 25.4 | | (23.6) | | 1.8 | | (5.2) | | (41.9) | | (47.1) |
| | |
|
| |
| |
| |
| |
| |
|
Loans: | | | | | | | | | | | | | |
Loans held for sale | | | 0.4 | | (1.5) | | (1.1) | | (0.5) | | (3.2) | | (3.7) |
Net loans and leases (2) | | | 75.1 | | (125.1) | | (50.0) | | 147.6 | | (215.4) | | (67.8) |
| | |
|
| |
| |
| |
| |
| |
|
Total loans and leases | | | 75.5 | | (126.6) | | (51.1) | | 147.1 | | (218.6) | | (71.5) |
| | |
|
| |
| |
| |
| |
| |
|
Total interest-earning assets | | $ | 102.3 | | (157.2) | | (54.9) | | 146.2 | | (281.1) | | (134.9) |
| | |
|
| |
| |
| |
| |
| |
|
INTEREST-BEARING LIABILITIES: | | | | | | | | | | | | | |
Interest-bearing deposits: | | | | | | | | | | | | | |
Savings and NOW | | $ | 2.8 | | (10.2) | | (7.4) | | 5.1 | | (10.9) | | (5.8) |
Money market super NOW | | | 9.1 | | (54.7) | | (45.6) | | 17.0 | | (98.2) | | (81.2) |
Time under $100,000 | | | (6.1) | | (19.1) | | (25.2) | | (2.4) | | (33.7) | | (36.1) |
Time $100,000 and over | | | (5.1) | | (12.1) | | (17.2) | | (5.9) | | (30.1) | | (36.0) |
Foreign | | | 0.7 | | (0.5) | | 0.2 | | – | | (1.4) | | (1.4) |
| | |
|
| |
| |
| |
| |
| |
|
Total interest-bearing deposits | | | 1.4 | | (96.6) | | (95.2) | | 13.8 | | (174.3) | | (160.5) |
| | |
|
| |
| |
| |
| |
| |
|
Borrowed funds: | | | | | | | | | | | | | |
Securities sold, not yet purchased | | | 5.5 | | (1.5) | | 4.0 | | 2.3 | | (2.9) | | (0.6) |
Federal funds purchased and security repurchase agreements | | | 0.7 | | (14.3) | | (13.6) | | (2.2) | | (54.6) | | (56.8) |
Commercial paper | | | (2.1) | | (2.4) | | (4.5) | | 0.4 | | (7.4) | | (7.0) |
FHLB advances and other borrowings: | | | | | | | | | | | | | |
One year or less | | | (5.1) | | (3.3) | | (8.4) | | 2.5 | | (13.9) | | (11.4) |
Over one year | | | (0.2) | | – | | (0.2) | | 1.9 | | (0.5) | | 1.4 |
Long-term debt | | | 18.2 | | (17.2) | | 1.0 | | 19.6 | | (6.0) | | 13.6 |
| | |
|
| |
| |
| |
| |
| |
|
Total borrowed funds | | | 17.0 | | (38.7) | | (21.7) | | 24.5 | | (85.3) | | (60.8) |
| | |
|
| |
| |
| |
| |
| |
|
Total interest-bearing liabilities | | $ | 18.4 | | (135.3) | | (116.9) | | 38.3 | | (259.6) | | (221.3) |
| | |
|
| |
| |
| |
| |
| |
|
Change in taxable-equivalent net interest income | | $ | 83.9 | | (21.9) | | 62.0 | | 107.9 | | (21.5) | | 86.4 |
| | |
|
| |
| |
| |
| |
| |
|
| (1) | Taxable-equivalent income used where applicable. |
| (2) | Net of unearned income and fees. Loans include nonaccrual and restructured loans. |
In the analysis of interest changes due to volume and rate, changes due to the volume/rate variance are allocated to volume with the following exceptions: when volume and rate both increase, the variance is allocated proportionately to both volume and rate; when the rate increases and volume decreases, the variance is allocated to rate.
34
growth exceeding loan growth, which resulted in our investing funds in lower-yielding money market investments, particularly in the second half of the year. We believe that as a result of the Company’s previously discussed “asset sensitive” ALM position, the net interest margin will continue to experience downward pressures in 2004.
Schedule 1 summarizes the average balances, the amount of interest earned or incurred, and the applicable yields for interest-earning assets and the costs of interest-bearing liabilities that generate taxable-equivalent net interest income.
Schedule 2 analyzes the year-to-year changes in net interest income on a fully taxable-equivalent basis for the years indicated. For purposes of calculating the yields in these schedules, the average loan balances also include the principal amounts of nonaccrual and restructured loans. However, interest received on nonaccrual loans is included in income only to the extent that cash payments have been received and not applied to principal reductions. In addition, interest on restructured loans is generally accrued at reduced rates.
The incremental tax rate used for calculating the taxable-equivalent adjustments was 35% for all years presented.
PROVISION FOR LOAN LOSSES
The provision for loan losses is the amount of expense that, based on our judgment, is required to maintain the allowance for loan losses at an adequate level. In determining an adequate level for the allowance, we perform periodic evaluations of the Company’s various portfolios, the levels of actual loan losses, and statistical trends and other economic factors. See “Credit Risk Management” on page 52 for a complete discussion of how we determine the appropriate level for the allowance.
The provision for loan losses for 2003 was $69.9 million or .36% of average loans for the year. This compares to $71.9 million or .40% for 2002, and $73.2 million or .46% for 2001. The declining trend in the provision corresponds to the improvements that have taken place during 2003 and 2002 in the loan and lease portfolios and, in particular, the improving levels of nonperforming assets.
NONINTEREST INCOME
Noninterest income represents revenues that the Company earns for products and services that have no interest rate or yield associated with them. Noninterest income for 2003 comprised 30.5% of net taxable-equivalent revenues compared to 26.3% in 2002 and 29.8% in 2001. Schedule 3 presents a comparison of the major components of noninterest income for the past five years.
SCHEDULE 3
NONINTEREST INCOME
| | | | | | | | | | | | | | | | | | | | | | | |
| (Amounts in millions) | | 2003
| | Percent
change
| | 2002
| | Percent
change
| | 2001
| | Percent
change
| | 2000
| | Percent
change
| | 1999
|
Service charges and fees on deposit accounts | | $ | 129.8 | | 9.1% | | $ | 119.0 | | 17.8% | | $ | 101.0 | | 29.0% | | $ | 78.3 | | 2.0% | | $ | 76.8 |
Loan sales and servicing income | | | 85.1 | | 21.4 | | | 70.1 | | (27.6) | | | 96.8 | | 87.2 | | | 51.7 | | 27.7 | | | 40.5 |
Other service charges, commissions and fees | | | 88.9 | | 9.5 | | | 81.2 | | 11.2 | | | 73.0 | | 12.1 | | | 65.1 | | (1.5) | | | 66.1 |
Trust and investment management income | | | 21.1 | | 14.1 | | | 18.5 | | 1.1 | | | 18.3 | | 0.5 | | | 18.2 | | 15.2 | | | 15.8 |
Income from securities conduit | | | 29.4 | | 44.8 | | | 20.3 | | 65.0 | | | 12.3 | | 6,050.0 | | | 0.2 | | – | | | – |
Dividends and other investment income | | | 28.5 | | (19.7) | | | 35.5 | | 25.4 | | | 28.3 | | 4.8 | | | 27.0 | | 51.7 | | | 17.8 |
Market making, trading and nonhedge derivative income | | | 29.4 | | (24.6) | | | 39.0 | | 14.4 | | | 34.1 | | 237.6 | | | 10.1 | | (12.2) | | | 11.5 |
Equity securities gains (losses), net | | | 63.8 | | 352.2 | | | (25.3) | | (168.0) | | | 37.2 | | 68.3 | | | 22.1 | | (49.9) | | | 44.1 |
Fixed income securities gains (losses), net | | | – | | (100.0) | | | 0.4 | | 110.5 | | | (3.8) | | (860.0) | | | 0.5 | | 105.1 | | | (9.9) |
Impairment loss on First Security Corporation common stock | | | – | | – | | | – | | – | | | – | | (100.0) | | | (96.9) | | – | | | – |
Other | | | 14.1 | | (22.1) | | | 18.1 | | 20.7 | | | 15.0 | | (8.0) | | | 16.3 | | 297.6 | | | 4.1 |
| | |
|
| | | |
|
| | | |
|
| | | |
|
| | | |
|
|
Total | | $ | 490.1 | | 30.1% | | $ | 376.8 | | (8.6)% | | $ | 412.2 | | 114.0% | | $ | 192.6 | | (27.8)% | | $ | 266.8 |
| | |
|
| | | |
|
| | | |
|
| | | |
|
| | | |
|
|
35
Compared to 2002, noninterest income increased $113.3 million or 30.1% in 2003. The largest component of this increase was in net equity securities gains, which was $63.8 million compared with losses of $25.3 million in 2002. As previously discussed, we made the decision to sell the Company’s holdings of ICAP for $106.8 million, resulting in a pretax gain of $68.5 million. The Company also sold several equity investment securities resulting in net gains of $25.9 million, of which approximately $21.1 million resulted from the sale of our investment in Lending Tree, Inc. The ICAP and other gains were partially offset by $30.6 million in write-downs of venture capital and other investments.
The growth in service charges and fees on deposit accounts that we experienced in both 2002 and 2001 continued in 2003, reflecting strong core deposit growth and the effects of the acquisitions that were consummated in 2001.
Loan sales and servicing income includes revenues from securitizations of loans as well as revenues that we earn through servicing loans that have been sold to third parties. For 2003, loan sales and servicing income increased 21.4% compared with 2002. However, 2002 included a write-down of approximately $13.6 million on capitalized excess servicing related to an auto securitization nonhedge derivative transaction. The $13.6 million fair value of a swap entered into in this transaction was recorded as an asset and non-hedge derivative income was increased by this amount. The effects of this transaction constituted substantially all of the 21.4% increase from 2002 to 2003, however, the transaction had no effect on net income. See Note 6 of the Notes to Consolidated Financial Statements for additional information on the Company’s securitization programs.
Other services charges, commissions and fees, which is comprised of investment, brokerage and fiscal agent fees, Automated Teller Machine (“ATM”) fees, insurance commissions, bankcard merchant fees and other miscellaneous fees, increased $7.7 million or 9.5% from 2002, which was up 11.2% from 2001. The increases in both years are largely the result of increased fees from ATM usage and higher insurance commissions as well as growth in revenues from the Company’s municipal finance operations, reflecting the continued low interest rate environment.
Trust and investment management income for 2003 increased 14.1% compared to 2002, which was essentially the same as 2001. The increase in 2003 was primarily attributable to stock market increases, which resulted in higher asset values upon which trust fees are determined, coupled with increased sales activities.
Income from securities conduit represents fees that we receive from Lockhart Funding, LLC, a “qualified special-purpose entity” securities conduit (“Lockhart”), in return for liquidity, an interest rate agreement and administrative services that Zions provides to the entity in accordance with a servicing agreement. The increases in income for both 2003 and 2002 resulted from increased investment holdings in Lockhart’s securities portfolio, which created higher servicing fees. See “Liquidity Management” on page 64 and Note 6 of the Notes to Consolidated Financial Statements for further information regarding securitizations and Lockhart.
Dividends and other investment income consist of revenue from the Company’s bank-owned life insurance program, dividends on securities holdings and equity in earnings from investments in unconsolidated companies. Income from bank-owned life insurance programs was $19.0 million in 2003, $18.9 million in 2002 and $16.6 million in 2001. The growth in revenues resulted mainly from increased investment holdings of the programs. Income from investments in unconsolidated subsidiaries includes dividends on Federal Home Loan Bank (“FHLB”) stock and equity earnings in unconsolidated affiliates and was $9.5 million in 2003, $16.6 million in 2002 and $11.7 million in 2001. The decrease in 2003 was caused primarily by reduced holdings in FHLB stock and other investments, coupled with a lower dividend rate being paid on the FHLB stock.
36
Market making, trading and nonhedge derivative income consists of the following:
| | | | | | | | | | | | | |
| (Amounts in millions) | | 2003
| | Percent
change
| | 2002
| | Percent
change
| | 2001
|
Market making and trading income | | $ | 27.4 | | 11.4 % | | $ | 24.6 | | 33.0 % | | $ | 18.5 |
Nonhedge derivative income | | | 2.0 | | (86.1) | | | 14.4 | | (7.7) | | | 15.6 |
| | |
|
| | | |
|
| | | |
|
|
Total | | $ | 29.4 | | | | $ | 39.0 | | | | $ | 34.1 |
| | |
|
| | | |
|
| | | |
|
|
Zions added corporate bonds to its odd lot bond trading business in 2001, which resulted in an increase in trading income for 2002 and 2003. Trading income for 2001 also included $3.3 million in appreciation of held to maturity securities transferred to trading in conjunction with the adoption of SFAS 133. These same securities were subsequently sold in the first quarter of 2001. Nonhedge derivative income for 2002 includes the previously discussed $13.6 million nonhedge derivative transaction. In January 2004 the Company announced its plans to purchase Van der Moolen UK Ltd., which is an odd lot bond trading firm in the United Kingdom. The acquisition is expected to increase Zions’ daily electronic bond trading volume by approximately 20 percent. The transaction is subject to the approval by regulators in the United States and United Kingdom, and closing is anticipated in the first half of 2004.
As previously discussed, equity securities gains for 2003 included a $68.5 million gain on the sale of ICAP, $25.9 million in other equity securities gains and $30.6 million of investment write-downs. Net equity securities losses for 2002 included $28.7 million of write-downs of various venture capital investments and the Company’s minority interest in an investment banking firm. Net equity securities gains in 2001 included gains of $70.8 million from the sale of our investment in Concord EFS, Inc., which we describe in more detail below, and losses of $39.6 million from write-downs of various venture capital investments.
During 2001, the Company recognized an aggregate gain of $70.8 million in connection with the sale of its equity interest in Star Systems, Inc. to Concord EFS. Consideration received in the amount of approximately $83 million was in the form of restricted Concord securities that were hedged by the Company through a forward sale contract. Both the securities and the forward contract were subsequently contributed to an off-balance sheet trust. The contribution represented a sale of the transferred assets for financial reporting purposes. The forward sale contract was treated as a fair value derivative hedge contract of securities resulting in a $4.3 million gain reported in other noninterest income. We have determined that this transaction will not require consolidation into the Company’s financial statements under FASB Interpretation No. 46 (“FIN 46”),Consolidation of Variable Interest Entities.
NONINTEREST EXPENSE
Actions taken by management to control expenses included restructuring the e-commerce operations, closing unproductive branches, scaling back the indirect auto financing business, consolidating operations, and improving the procurement processes. As part of these cost reduction efforts, the Company incurred restructuring charges of $1.9 million in 2003 and $3.3 million in 2002 related to several cost-saving steps that included branch closures in Utah and Colorado and the restructuring of trust operations and administrative functions. In addition, the Company incurred impairment losses of $2.7 million in 2003 and $4.9 million in 2002 on certain software related to its e-commerce activities and in response to ZFNB’s efforts to exit certain branches. See Note 16 of the Notes to Consolidated Financial Statements for additional information on these restructuring and impairment charges.
Noninterest expense for 2003 increased 4.1% to $893.9 million, compared with $858.9 million in 2002, which was up 2.7% over the $836.1 million in 2001. Approximately 69% of the increase in noninterest expense for 2003 relates to debt extinguishment costs of $24.2 million, which were incurred in the third quarter when the Company repurchased $197.4 million of its debt. Schedule 4 summarizes the major components of noninterest expense and provides a comparison of the components over the past five years.
37
ZIONS BANCORPORATION AND SUBSIDIARIES
SCHEDULE 4
NONINTEREST EXPENSE
| | | | | | | | | | | | | | | | | | | | | | | |
| (Amounts in millions) | | 2003
| | Percent
change
| | 2002
| | Percent
change
| | 2001
| | Percent
change
| | 2000
| | Percent
change
| | 1999
|
Salaries and employee benefits | | $ | 491.6 | | 2.8 % | | $ | 478.0 | | 10.4 % | | $ | 432.9 | | 24.3 % | | $ | 348.3 | | 0.5 % | | $ | 346.7 |
Occupancy, net | | | 71.0 | | 3.5 | | | 68.6 | | 7.9 | | | 63.6 | | 23.0 | | | 51.7 | | 4.7 | | | 49.4 |
Furniture and equipment | | | 65.5 | | 3.3 | | | 63.4 | | 4.3 | | | 60.8 | | 15.4 | | | 52.7 | | 16.1 | | | 45.4 |
Legal and professional services | | | 26.0 | | 2.4 | | | 25.4 | | (17.0) | | | 30.6 | | 55.3 | | | 19.7 | | 21.6 | | | 16.2 |
Postage and supplies | | | 25.8 | | (6.5) | | | 27.6 | | (0.7) | | | 27.8 | | 26.9 | | | 21.9 | | (4.4) | | | 22.9 |
Advertising | | | 18.2 | | (11.7) | | | 20.6 | | (7.6) | | | 22.3 | | (12.2) | | | 25.4 | | 37.3 | | | 18.5 |
Debt extinguishment cost | | | 24.2 | | – | | | – | | – | | | – | | – | | | – | | – | | | – |
Impairment losses on long-lived assets | | | 2.7 | | (44.9) | | | 4.9 | | – | | | – | | – | | | – | | – | | | – |
Restructuring charges | | | 1.9 | | (42.4) | | | 3.3 | | – | | | – | | – | | | – | | – | | | – |
Merger related expense | | | – | | – | | | – | | (100.0) | | | 7.3 | | (84.0) | | | 45.5 | | 64.3 | | | 27.7 |
Amortization of core deposit and other intangibles | | | 14.2 | | 6.0 | | | 13.4 | | 4.7 | | | 12.8 | | 11.3 | | | 11.5 | | (1.7) | | | 11.7 |
Amortization of goodwill | | | – | | – | | | – | | (100.0) | | | 31.5 | | 20.2 | | | 26.2 | | 6.9 | | | 24.5 |
Other | | | 152.8 | | (0.6) | | | 153.7 | | 4.9 | | | 146.5 | | 23.7 | | | 118.4 | | (0.3) | | | 118.8 |
| | |
|
| | | |
|
| | | |
|
| | | |
|
| | | |
|
|
Total | | $ | 893.9 | | 4.1 % | | $ | 858.9 | | 2.7 % | | $ | 836.1 | | 15.9 % | | $ | 721.3 | | 5.8 % | | $ | 681.8 |
| | |
|
| | | |
|
| | | |
|
| | | |
|
| | | |
|
|
The Company’s efficiency ratio was 55.65% for 2003 compared to 63.40% for 2002. The efficiency ratio for 2003, however, was favorably impacted by large equity gains reported in the third quarter. As a result, we believe that the 56.38% efficiency ratio that we achieved in the fourth quarter of 2003 may be more indicative of the current “run rate” for this ratio.
Salary costs for 2003 experienced a modest increase compared to 2002. Salary costs in 2002 increased significantly over 2001, partly as a result of enhanced incentive programs and the effects of the acquisitions that were completed in 2002 and 2001. The Company also added staff in 2002 in anticipation of planned conversions of all subsidiary banks to common operating platforms. Employee benefits increased in both 2003 and 2002, primarily as a result of higher employee health insurance costs and increased costs associated with the Company’s retirement plans. Salaries and employee benefits are shown in greater detail in the following table.
| | | | | | | | | | | | | |
| (Dollar amounts in millions) | | 2003
| | Percent
change
| | 2002
| | Percent
change
| | 2001
|
Salaries and bonuses | | $ | 409.7 | | 1.6 % | | $ | 403.4 | | 10.1 % | | $ | 366.3 |
Benefits: | | | | | | | | | | | | | |
Employee health and insurance | | | 28.7 | | 8.3 | | | 26.5 | | 22.7 | | | 21.6 |
Retirement | | | 25.6 | | 26.7 | | | 20.2 | | 11.6 | | | 18.1 |
Payroll taxes and other | | | 27.6 | | (1.1) | | | 27.9 | | 3.7 | | | 26.9 |
| | |
|
| | | |
|
| | | |
|
|
Total benefits | | | 81.9 | | 9.8 | | | 74.6 | | 12.0 | | | 66.6 |
| | |
|
| | | |
|
| | | |
|
|
Total salaries and employee benefits | | $ | 491.6 | | 2.8 % | | $ | 478.0 | | 10.4 % | | $ | 432.9 |
| | |
|
| | | |
|
| | | |
|
|
FTEs (at December 31) | | | 7,896 | | (2.2)% | | | 8,073 | | (0.6)% | | | 8,124 |
| | |
|
| | | |
|
| | | |
|
|
As noted in the table under FTEs (full-time equivalent employees), the Company’s ongoing efforts to consolidate operations, exit unprofitable businesses and reduce costs have resulted in a 2.8% reduction in staffing since year-end 2001.
IMPAIRMENT LOSS ON GOODWILL
As previously discussed, Vectra is in the process of restructuring to focus on serving small- and mid-sized businesses and their employees. In connection with the restructuring, in the third quarter we identified and offered eleven of Vectra’s branches for sale. The assets and liabilities from these branches were measured at their fair values based upon bids, letters of intent, and negotiations with potential buyers. The comparison of the fair values to the carrying values of
38
these assets and liabilities resulted in an impairment loss on goodwill of $7.1 million, which we recorded in 2003.
Also as a result of the Vectra restructuring, the Company, with the assistance of an independent valuation consulting firm, performed an impairment analysis on the operations that were being retained. The analysis was performed in accordance with the valuation process specified in SFAS 142. Based on the results of the analysis, the Company recognized an additional impairment loss on goodwill of $68.5 million, which when added to the $7.1 million discussed above, totals $75.6 million and is separately disclosed in the Consolidated Statements of Income.
DISCONTINUED OPERATIONS
During 2002, we took a number of actions to revalue and restructure Zions’ e-commerce activities in light of continued disappointing operating results and a difficult market environment. We determined that our plan to restructure and offer all or part of these e-commerce subsidiaries for sale met the held for sale and discontinued operations criteria of SFAS No. 144,Accounting for the Impairment or Disposal of Long-Lived Assets.
We sold the first e-commerce subsidiary, Phaos Technology Corp., in 2002 and recognized a $5.3 million income tax benefit as a result of the sale. The remaining e-commerce subsidiary that we had identified to sell, Lexign, Inc., was sold in the third quarter of 2003, resulting in a pretax loss on the sale of $2.4 million. The loss on discontinued operations decreased in 2003 to $1.8 million from $28.5 million in 2002 and $8.4 million in 2001. The loss for 2002 included additional impairment related to our restructuring efforts. See Note 16 of the Notes to Consolidated Financial Statements for additional information regarding the discontinued operations and the related impairment losses that the Company has recognized.
FOREIGN OPERATIONS
Zions First National Bank (“ZFNB”) operates a foreign branch in Grand Cayman, Grand Cayman Islands, B.W.I. The branch only accepts deposits from qualified customers. While deposits in this branch are not subject to Federal Reserve Board reserve requirements or Federal Deposit Insurance Corporation insurance requirements, there are no federal or state income tax benefits to the Company or any customers as a result of these operations.
Foreign deposits at December 31, 2003, 2002 and 2001 totaled $235 million, $191 million and $133 million, respectively, and averaged $186 million for 2003, and $106 million for both 2002 and 2001. See Schedule 8 for foreign loans outstanding.
INCOME TAXES
The Company’s income tax expense on continuing operations for 2003 was $213.8 million compared to $167.7 million in 2002 and $161.9 million in 2001. The Company’s effective income tax rate was 39.1% in 2003, 34.9% in 2002 and 35.8% in 2001. The difference between the Company’s effective tax rate for 2003 and the statutory federal income tax rate of 35% is primarily the result of higher taxable income resulting from nondeductible expenses, including goodwill impairment. See Note 17 of the Notes to Consolidated Financial Statements for more information on income taxes.
BUSINESS SEGMENT RESULTS
The Company manages its operations and prepares management reports with a primary focus on geographical area. All segments that are presented in the following discussion, except for the segment identified as “Other”, are based on geographical banking operations. The operating segment identified as “Other” includes Zions Bancorporation (“the Parent”), certain e-commerce subsidiaries, other smaller nonbank operating units and eliminations of intercompany transactions.
Operating segment information is presented in Schedule 5 and Note 24 of the Notes to Consolidated Financial Statements. The accounting policies of the individual segments are the same as those of the Company. The Company allocates centrally provided services to the business segments based upon esti-
39
SCHEDULE 5
OPERATING SEGMENTS INFORMATION
| | | | | | | | | | | | | | | | | | | | | | | | | | | | |
| | | Zions First
National Bank
and Subsidiaries
| | California
Bank & Trust
| | Nevada
State Bank
| | National Bank of Arizona
|
| (Amounts in millions) | | 2003
| | 2002
| | % Change
| | 2003
| | 2002
| | % Change
| | 2003
| | 2002
| | % Change
| | 2003
| | 2002
| | % Change
|
CONDENSED INCOME STATEMENT | | | | | | | | | | | | | | | | | | | | | | | | | | | | |
Net interest income | | $ | 335.6 | | 296.2 | | 13 % | | $ | 385.4 | | 377.9 | | 2 % | | $ | 125.8 | | 124.9 | | 1 % | | | $128.5 | | 116.0 | | 11 % |
Noninterest income | | | 233.8 | | 199.7 | | 17 | | | 75.9 | | 78.4 | | (3) | | | 31.7 | | 28.1 | | 13 | | | 21.4 | | 19.1 | | 12 |
| | |
|
| |
| | | |
|
| |
| | | |
|
| |
| | | |
|
| |
| | |
Total revenue | | | 569.4 | | 495.9 | | 15 | | | 461.3 | | 456.3 | | 1 | | | 157.5 | | 153.0 | | 3 | | | 149.9 | | 135.1 | | 11 |
Provision for loan losses | | | 46.3 | | 41.3 | | 12 | | | 12.1 | | 17.0 | | (29) | | | 5.6 | | 4.7 | | 19 | | | 0.2 | | 2.0 | | (90) |
Noninterest expense | | | 318.3 | | 310.1 | | 3 | | | 227.0 | | 238.2 | | (5) | | | 86.9 | | 81.9 | | 6 | | | 79.8 | | 69.0 | | 156 |
Impairment loss on goodwill | | | – | | – | | – | | | – | | – | | – | | | – | | – | | – | | | – | | – | | – |
| | |
|
| |
| | | |
|
| |
| | | |
|
| |
| | | |
|
| |
| | |
Income from continuing operations before income taxes and minority interest | | | 204.8 | | 144.5 | | 42 | | | 222.2 | | 201.1 | | 10 | | | 65.0 | | 66.4 | | (2) | | | 69.9 | | 64.1 | | 9 |
Income tax expense (benefit) | | | 65.0 | | 42.4 | | 53 | | | 89.1 | | 81.0 | | 10 | | | 22.1 | | 22.6 | | (2) | | | 27.7 | | 25.5 | | 9 |
Minority interest | | | (0.5) | | (1.2) | | (58) | | | – | | – | | – | | | – | | – | | – | | | – | | – | | – |
| | |
|
| |
| | | |
|
| |
| | | |
|
| |
| | | |
|
| |
| | |
Income from continuing operations | | | 140.3 | | 103.3 | | 36 | | | 133.1 | | 120.1 | | 11 | | | 42.9 | | 43.8 | | (2) | | | 42.2 | | 38.6 | | 9 |
Loss on discontinued operations | | | – | | – | | – | | | – | | – | | – | | | – | | – | | – | | | – | | – | | – |
| | |
|
| |
| | | |
|
| |
| | | |
|
| |
| | | |
|
| |
| | |
Income before cumulative effect adjustment | | | 140.3 | | 103.3 | | 36 | | | 133.1 | | 120.1 | | 11 | | | 42.9 | | 43.8 | | (2) | | | 42.2 | | 38.6 | | 9 |
Cumulative effect adjustment | | | – | | – | | – | | | – | | – | | – | | | – | | – | | – | | | – | | – | | – |
| | |
|
| |
| | | |
|
| |
| | | |
|
| |
| | | |
|
| |
| | |
Net income (loss) | | $ | 140.3 | | 103.3 | | 36 % | | $ | 133.1 | | 120.1 | | 11 % | | $ | 42.9 | | 43.8 | | (2)% | | | $ 42.2 | | 38.6 | | 9 % |
| | |
|
| |
| | | |
|
| |
| | | |
|
| |
| | | |
|
| |
| | |
YEAR END BALANCE SHEET DATA | | | | | | | | | | | | | | | | | | | | | | | | | | | | |
Total assets | | $ | 10,598 | | 10,530 | | 1 % | | $ | 9,216 | | 8,805 | | 5 % | | $ | 2,958 | | 2,683 | | 10 % | | | $3,067 | | 2,925 | | 5 % |
Net loans and leases | | | 6,888 | | 6,714 | | 3 | | | 6,349 | | 6,129 | | 4 | | | 2,162 | | 1,850 | | 17 | | | 2,381 | | 1,979 | | 20 |
Allowance for loan losses | | | 98 | | 96 | | 2 | | | 81 | | 88 | | (8) | | | 28 | | 25 | | 12 | | | 30 | | 32 | | (6) |
Goodwill, core deposit and other intangibles | | | 30 | | 30 | | – | | | 426 | | 434 | | (2) | | | 23 | | 23 | | – | | | 72 | | 74 | | (3) |
Noninterest-bearing demand deposits | | | 1,272 | | 1,178 | | 8 | | | 2,401 | | 2,035 | | 18 | | | 807 | | 653 | | 24 | | | 773 | | 721 | | 7 |
Total deposits | | | 7,104 | | 7,116 | | – | | | 7,638 | | 6,970 | | 10 | | | 2,555 | | 2,349 | | 9 | | | 2,539 | | 2,487 | | 2 |
Common equity | | | 725 | | 682 | | 6 | | | 956 | | 978 | | (2) | | | 194 | | 173 | | 12 | | | 241 | | 233 | | 3 |
| | | | | | | | | | | | |
PERFORMANCE RATIOS | | | | | | | | | | | | | | | | | | | | | | | | | | | | |
Return on average assets | | | 1.24% | | 0.99% | | | | | 1.51% | | 1.40% | | | | | 1.52% | | 1.70% | | | | | 1.46% | | 1.44% | | |
Return on average common equity | | | 19.99% | | 15.56% | | | | | 13.52% | | 11.69% | | | | | 23.98% | | 26.68% | | | | | 18.23% | | 17.96% | | |
Efficiency ratio | | | 54.62% | | 61.00% | | | | | 49.12% | | 52.12% | | | | | 54.83% | | 53.13% | | | | | 52.93% | | 50.84% | | |
| | | | | | | | | | | | |
OTHER INFORMATION | | | | | | | | | | | | | | | | | | | | | | | | | | | | |
Full-time equivalent employees | | | 2,379 | | 2,333 | | | | | 1,738 | | 1,846 | | | | | 752 | | 750 | | | | | 831 | | 833 | | |
Domestic offices: | | | | | | | | | | | | | | | | | | | | | | | | | | | | |
Traditional branches | | | 100 | | 103 | | | | | 91 | | 91 | | | | | 31 | | 30 | | | | | 54 | | 53 | | |
Banking centers in grocery stores | | | 48 | | 46 | | | | | – | | – | | | | | 35 | | 33 | | | | | – | | – | | |
Foreign office | | | 1 | | 1 | | | | | – | | – | | | | | – | | – | | | | | – | | – | | |
| | |
|
| |
| | | |
|
| |
| | | |
|
| |
| | | |
|
| |
| | |
Total offices | | | 149 | | 150 | | | | | 91 | | 91 | | | | | 66 | | 63 | | | | | 54 | | 53 | | |
ATMs | | | 206 | | 208 | | | | | 108 | | 108 | | | | | 88 | | 87 | | | | | 54 | | 52 | | |
| | | | |
| | | Vectra Bank Colorado
| | The Commerce Bank
of Washington
| | Other
| | Consolidated
Company
|
| (Amounts in millions) | | 2003
| | 2002
| | % Change
| | 2003
| | 2002
| | % Change
| | 2003
| | 2002
| | % Change
| | 2003
| | 2002
| | % Change
|
CONDENSED INCOME STATEMENT | | | | | | | | | | | | | | | | | | | | | | | | | | | | |
Net interest income | | $ | 100.6 | | 110.7 | | (9)% | | $ | 24.7 | | 24.6 | | – | | $ | (5.1) | | (15.2) | | 66 % | | $ | 1,095.5 | | 1,035.1 | | 6 % |
Noninterest income | | | 38.1 | | 34.2 | | 11 | | | 2.0 | | 1.7 | | 18 % | | | 87.2 | | 15.6 | | 459 | | | 490.1 | | 376.8 | | 30 |
| | |
|
| |
| | | |
|
| |
| | | |
|
| |
| | | |
|
| |
| | |
Total revenue | | | 138.7 | | 144.9 | | (4) | | | 26.7 | | 26.3 | | 2 | | | 82.1 | | 0.4 | | 20,425 | | | 1,585.6 | | 1,411.9 | | 12 |
Provision for loan losses | | | 5.9 | | 5.0 | | 18 | | | 0.8 | | 1.1 | | (27) | | | (1.0) | | 0.8 | | (225) | | | 69.9 | | 71.9 | | (3) |
Noninterest expense | | | 100.5 | | 100.1 | | – | | | 11.2 | | 10.3 | | 9 | | | 70.2 | | 49.3 | | 42 | | | 893.9 | | 858.9 | | 4 |
Impairment loss on goodwill | | | 75.6 | | – | | – | | | – | | – | | – | | | – | | – | | – | | | 75.6 | | – | | – |
| | |
|
| |
| | | |
|
| |
| | | |
|
| |
| | | |
|
| |
| | |
Income from continuing operations before income taxes and minority interest | | | (43.3) | | 39.8 | | (209) | | | 14.7 | | 14.9 | | (1) | | | 12.9 | | (49.7) | | 126 | | | 546.2 | | 481.1 | | 14 |
Income tax expense (benefit) | | | 16.2 | | 14.2 | | 14 | | | 5.1 | | 5.3 | | (4) | | | (11.4) | | (23.3) | | 51 | | | 213.8 | | 167.7 | | 27 |
Minority interest | | | – | | – | | – | | | – | | – | | – | | | (6.7) | | (2.5) | | 168 | | | (7.2) | | (3.7) | | 95 |
| | |
|
| |
| | | |
|
| |
| | | |
|
| |
| | | |
|
| |
| | |
Income from continuing operations | | | (59.5) | | 25.6 | | (332) | | | 9.6 | | 9.6 | | – | | | 31.0 | | (23.9) | | 230 | | | 339.6 | | 317.1 | | 7 |
Loss on discontinued operations | | | – | | – | | – | | | – | | – | | – | | | (1.8) | | (28.4) | | (94) | | | (1.8) | | (28.4) | | (94) |
| | |
|
| |
| | | |
|
| |
| | | |
|
| |
| | | |
|
| |
| | |
Income before cumulative effect adjustment | | | (59.5) | | 25.6 | | (332) | | | 9.6 | | 9.6 | | – | | | 29.2 | | (52.3) | | 156 | | | 337.8 | | 288.7 | | 17 |
Cumulative effect adjustment | | | – | | – | | – | | | – | | – | | – | | | – | | (32.4) | | (100) | | | – | | (32.4) | | (100) |
| | |
|
| |
| | | |
|
| |
| | | |
|
| |
| | | |
|
| |
| | |
Net income (loss) | | $ | (59.5) | | 25.6 | | (332)% | | $ | 9.6 | | 9.6 | | – | | $ | 29.2 | | (84.7) | | 134 % | | $ | 337.8 | | 256.3 | | 32 % |
| | |
|
| |
| | | |
|
| |
| | | |
|
| |
| | | |
|
| |
| | |
YEAR END BALANCE SHEET DATA | | | | | | | | | | | | | | | | | | | | | | | | | | | | |
Total assets | | $ | 2,532 | | 2,768 | | (9)% | | $ | 705 | | 648 | | 9 % | | $ | (518) | | (1,793) | | 71 % | | $ | 28,558 | | 26,566 | | 7 % |
Net loans and leases | | | 1,691 | | 1,918 | | (12) | | | 329 | | 321 | | 2 | | | 120 | | 129 | | (7) | | | 19,920 | | 19,040 | | 5 |
Allowance for loan losses | | | 28 | | 33 | | (15) | | | 4 | | 5 | | (20) | | | – | | 1 | | (100) | | | 269 | | 280 | | (4) |
Goodwill, core deposit and other intangibles | | | 174 | | 252 | | (31) | | | – | | – | | – | | | (2) | | – | | – | | | 723 | | 813 | | (11) |
Noninterest-bearing demand deposits | | | 543 | | 477 | | 14 | | | 101 | | 79 | | 28 | | | (14) | | (26) | | 46 | | | 5,883 | | 5,117 | | 15 |
Total deposits | | | 1,764 | | 1,911 | | (8) | | | 453 | | 459 | | (1) | | | (1,156) | | (1,160) | | – | | | 20,897 | | 20,132 | | 4 |
Common equity | | | 375 | | 441 | | (15) | | | 52 | | 45 | | 16 | | | (3) | | (178) | | 98 | | | 2,540 | | 2,374 | | 7 |
| | | | | | | | | | | | |
PERFORMANCE RATIOS | | | | | | | | | | | | | | | | | | | | | | | | | | | | |
Return on average assets | | | (2.22)% | | 0.97% | | | | | 1.47% | | 1.72% | | | | | | | | | | | | 1.20% | | 0.97% | | |
Return on average common equity | | | (13.93)% | | 5.81% | | | | | 19.70% | | 23.28% | | | | | | | | | | | | 13.69% | | 10.95% | | |
Efficiency ratio | | | 72.08% | | 68.60% | | | | | 42.00% | | 38.83% | | | | | | | | | | | | 55.65% | | 63.40% | | |
| | | | | | | | | | | | |
OTHER INFORMATION | | | | | | | | | | | | | | | | | | | | | | | | | | | | |
Full-time equivalent employees | | | 825 | | 912 | | | | | 57 | | 54 | | | | | 1,314 | | 1,345 | | | | | 7,896 | | 8,073 | | |
Domestic offices: | | | | | | | | | | | | | | | | | | | | | | | | | | | | |
Traditional branches | | | 48 | | 54 | | | | | 1 | | 1 | | | | | – | | – | | | | | 325 | | 332 | | |
Banking centers in grocery stores | | | 4 | | 4 | | | | | – | | – | | | | | – | | – | | | | | 87 | | 83 | | |
Foreign office | | | – | | – | | | | | – | | | | | | | – | | – | | | | | 1 | | 1 | | |
| | |
|
| |
| | | |
|
| |
| | | |
|
| |
| | | |
|
| |
| | |
Total offices | | | 52 | | 58 | | | | | 1 | | 1 | | | | | – | | – | | | | | 413 | | 416 | | |
ATMs | | | 97 | | 133 | | | | | – | | – | | | | | – | | – | | | | | 553 | | 588 | | |
mated usage of those services. We initiated a program in 2002 to allocate income between certain of the Company’s banking subsidiaries to better match the revenues generated from hedging strategies to the operating units that gave rise to the exposures being hedged. The allocated income (expenses) from this program, which is included in net interest income of the banking subsidiaries is as follows:
| | | | | |
| (Amounts in millions) | | 2003 | | 2002 |
|
Zions First National Bank | | $ | (26.0) | | (47.0) |
Nevada State Bank | | | 2.6 | | 9.9 |
National Bank of Arizona | | | 6.7 | | 10.1 |
Vectra Bank Colorado | | | 12.3 | | 21.9 |
The Commerce Bank of Washington | | | 4.4 | | 5.1 |
| | |
|
| |
|
| | | $ | – | | – |
| | |
|
| |
|
40
Effective January 1, 2003, we changed the method by which this hedge program income (expense) is allocated. As a result, the amounts allocated to each segment for the years shown above are not directly comparable. Further, the allocated amounts will continue to decrease as the underlying hedges mature and new hedges are recorded directly at the banking subsidiaries.
The Company invests in start-up and early-stage ventures through a variety of entities. Through certain subsidiary banks, the Company has principally made non-marketable investments in a number of companies using four Small Business Investment Companies (“SBIC”). The Company recognized losses on these venture capital SBIC investments, net of income taxes and minority interest, of $12.3 million in 2003, compared to losses of $11.4 million in 2002, and $20.3 million in 2001. These losses are included in noninterest income reported by the respective subsidiary banks.
The Company has also made investments in a number of ventures, either through acquisition or through inter-
41
nal funding initiatives. During 2002, the Company decided to discontinue the operations of two of its acquired companies, Lexign, Inc. and Phaos Technology Corp. The Company completed the sale of Lexign in 2003 and the sale of Phaos in 2002. Prior to their sale, both companies were subsidiaries of Zions Bancorporation and results of the discontinued operations are included in the “Other” segment.
Digital Signature Trust (“DST”) was the largest internally funded venture that the Company had engaged in and was a majority owned subsidiary of ZFNB. During 2002, the Company completed the sale of DST in exchange for an approximate 33% ownership interest in Identrus, LLC, another venture company. The Company has several smaller early-stage venture activities that generally are subsidiaries of either ZFNB or Zions Bancorporation.
ZIONS FIRST NATIONAL BANK AND SUBSIDIARIES
ZFNB consists primarily of the Company’s operations in Utah and Idaho. Net income for ZFNB increased 35.8% to $140.3 million for 2003 compared with $103.3 million for 2002 and $135.4 million for 2001. Results for 2003 include allocated expense of $26.0 million, compared to $47.0 million for 2002, that is recorded as a reduction of net interest income under the previously discussed allocation program initiated by the Company in 2002. This allocation does not affect the consolidated results of operations of the Company as all such amounts are eliminated in consolidation.
While the economy has been depressed in ZFNB’s primary markets during 2003, ZFNB experienced growth during a difficult year. During late 2003, ZFNB began to see an increase in loan demand and was able to expand its residential and small commercial construction lending in 2003. ZFNB is now experiencing encouraging results from this expansion. ZFNB also continues to see favorable loan demand in Idaho, especially in southeastern Idaho. However, net consumer loans have generally been declining mainly due to its decision to substantially scale back its indirect auto loan business. On-balance-sheet loan growth for ZFNB was 2.6% for 2003 with loans increasing to $6.9 billion.
In 2003, ZFNB experienced positive trends in the quality of its loan portfolio. Nonperforming assets for ZFNB decreased to $33.3 million at December 31, 2003 from $62.2 million at December 31, 2002, including a decrease in other real estate owned to $8.4 million from $20.6 million at the end of 2002. Accruing loans past due 90 days or more decreased to $15.8 million at year-end 2003 compared with $19.8 million at year-end 2002. Net loan and lease charge-offs for 2003 were $40.5 million compared to $38.5 million for 2002. For 2003, ZFNB’s loan loss provision was $46.3 million compared with $41.3 million for 2002 and $41.9 million for 2001.
Deposits at year-end 2003 of $7.1 billion were essentially unchanged from 2002. At December 31, 2003 and 2002, deposits included $960 million of certificates of deposit from California Bank & Trust.
Noninterest income increased 17.1% to $233.8 million compared to $199.7 million for 2002 and $234.8 million for 2001. Noninterest income for 2001 included $44.6 million in gains realized from ZFNB’s appreciated investment in Star Systems, which was acquired by Concord EFS.
Noninterest expense for 2003 increased 2.6% compared to 2002, reflecting the Company’s cost control efforts. As previously discussed, during 2002 ZFNB completed the sale of an e-commerce subsidiary, Digital Signature Trust, in exchange for an approximate 33% ownership interest in Identrus, LLC. After-tax operating losses from ZFNB’s investment in these companies were $6.0 million for 2003, $6.1 million for 2002 and $12.7 million for 2001.
CALIFORNIA BANK & TRUST
California Bank & Trust (“CB&T”) consists of the Company’s California operations. CB&T also operates loan production offices in Phoenix, Arizona and Denver, Colorado. CB&T’s results for 2003 were significantly affected by slow market conditions in
42
California and the general interest rate environment. CB&T experienced limited opportunities for any significant loan growth, especially in the area of commercial real estate lending, which has historically been a source of strong loan demand in California. CB&T took steps in 2003 to offset some of the negative effects of the slower economy. In particular, CB&T continued its efforts to place significant emphasis on credit management, effective interest rate management, and “right sizing” its expense structure. In addition, during 2003 CB&T completed the restructuring of its Retail Banking Division and expects improved performance from it in the future.
Net income for CB&T increased 10.8% to $133.1 million in 2003 compared with $120.1 million for 2002, and $96.2 million for 2001. In 2003, net loans and leases increased 3.6% to $6.3 billion and deposits increased 9.6% to $7.6 billion from year-end 2002. The increase in loans primarily resulted from purchases of 5/1 adjustable rate mortgages. Net interest income for 2003 increased 2.0% from 2002 to $385.4 million while noninterest income decreased 3.2% to $75.9 million. The results of operations for CB&T for 2002 were significantly influenced by an acquisition accounted for as a purchase during 2001. See Note 3 of the Notes to Consolidated Financial Statements for further information about the acquisition.
Nonperforming assets for CB&T increased to $34.3 million at year-end 2003 compared to $19.3 million at year-end 2002. The level of nonperforming assets to total loans and other real estate at December 31, 2003, was 0.54% compared with 0.31% at December 31, 2002. Net loan and lease charge-offs were $14.4 million for 2003 compared with $14.3 million for 2002. For 2003, CB&T’s loan loss provision was $12.1 million compared to $17.0 million for 2002. The reduced provision reflects the improving California economy and a reduction in the bank’s classified loans from the prior year.
Despite the depressed interest rate environment, CB&T maintained its net interest margin at an acceptable and reasonably constant level. This was accomplished through a combination of tools including interest rate floors for some types of loans, interest rate swaps and purchases of 5/1 adjustable-rate mortgages. CB&T expects these purchases will continue until the demand for loan products in its markets begins to improve.
CB&T has been focusing on identifying areas for operating efficiencies and cost savings. Its efficiency ratio has consistently improved for the past three years to its current level of 49.1%. CB&T management expects to maintain costs at these low levels such that anticipated improvements in revenues will result in continued improvements in the efficiency ratio in the future. Noninterest expense decreased 4.7% for 2003 compared to 2002.
NEVADA STATE BANK
Net income for Nevada State Bank (“NSB”) was $42.9 million, compared with $43.8 million for 2002, and $31.0 million for 2001. Earnings for 2003 include $2.6 million of allocated net interest income compared with $9.9 million for 2002. Earnings for 2003 included a provision for loan losses of $5.6 million compared with $4.7 million for 2002 and $10.1 million for 2001.
In 2003, NSB’s revenues increased 2.9%. NSB experienced strong balance sheet growth, with average earning assets increasing 9.7% during the year. The net interest margin, however, declined to 4.90% as compared to 5.35% in 2002. The change in the mix and volume of earning assets and interest bearing liabilities and their related yields and interest rates had a major impact on earnings. The decreased margin in 2003 was the result of intense competition and declining interest rates during the year. During the year, NSB was able to reduce interest rates on several deposit products while remaining competitive in its local market. In addition, the low interest rate environment created strong demand for mortgage loans and NSB’s Home Residential Loan (HRL) program created strong consumer loan growth during the year. Net loans and leases at year-end 2003 increased 16.9% from 2002 while total deposits increased 8.8%.
43
Noninterest income increased 12.8%, reflecting strong growth in deposit service charges of 15.2%. In addition, NSB continued to focus on keeping operating costs in check. Expense control targets were implemented to keep expenses at prior year levels and were achieved in several categories. However, salary and employee benefit costs increased 4.9% in 2003, primarily as a result of increased employee incentive programs and medical costs.
Net loan and lease charge-offs totaled $2.2 million in 2003 or 0.11% of average loans and leases. This was a decrease from $4.9 million or 0.29% in 2002. Nonperforming assets, consisting of nonaccrual loans, other real estate owned and restructured loans, totaled $1.4 million or 0.07% of net loans and leases and other real estate owned at year-end 2003, as compared to $1.2 million or 0.06% at the end of 2002.
NATIONAL BANK OF ARIZONA
National Bank of Arizona (“NBA”) has experienced positive results due to the strengthening economy in Arizona. Net income for NBA was $42.2 million for 2003, up from $38.6 million for 2002 and $32.1 million for 2001. Earnings for 2003 include $6.7 million of allocated net interest income compared with $10.1 million in 2002. NBA’s efficiency ratio remained low (52.93% in 2003) in comparison with industry standards. Expense control will remain a primary focus during 2004 and remain comparable with 2003.
Although NBA experienced compression in the interest rate yields on its loan portfolio during 2003, net margins continuously improved throughout the year. This was a direct result of tighter management of the depository mix and cost, along with a reduced cost of funds. Continuing compression in loan yields, albeit significantly less than experienced in 2003, are expected in 2004. Despite the decline in yields, net interest margins are expected to be stable and comparable with the results experienced at the end of 2003. This is a direct result of a decline in depository costs, coupled with an increasing loan demand.
The loan portfolio has expanded in almost every area of NBA. Loan demand for 2003 was strong and is expected to continue at this or even a quicker pace in 2004. Net loans and leases increased 20.3% from year-end 2002 to $2.4 billion at year-end 2003. The provision for loan and lease losses was $0.2 million in 2003 compared with $2.0 million for 2002 and $1.5 million for 2001. Underwriting standards continue to drive favorable results with regard to the low levels of losses that were sustained in the portfolio in 2003. Nonperforming assets were $10.0 million at year-end 2003 compared with $11.0 million at December 31, 2002. Net loan and lease charge-offs for 2003 were $1.2 million compared with $0.5 million for 2002.
Outstanding deposits remained relatively static during 2003 with an increase of 2.1% to $2.5 billion. Modest growth is expected in deposits in 2004.
VECTRA BANK COLORADO
Vectra Bank Colorado (“Vectra”) has operations in Colorado and in Farmington, New Mexico. Compared with 2002, the 2003 economic environment in Colorado worsened as evidenced by increased bankruptcies and foreclosures and decreases in construction activity. This resulted in weak demand for credit products, particularly commercial- and construction-based lending. Vectra also experienced a sizeable amount of loan run-off in the latter half of 2003 as a result of the poor economic environment, coupled with tighter credit policies, which were implemented during the year.
As discussed earlier, during 2003 the Company made the decision to restructure Vectra to enable it to focus on providing services to small- and mid-sized businesses and their employees. Vectra also enhanced its management to implement and carry out the restructuring. At the same time, Vectra made a commitment to improve operating efficiencies through expense management and centralization of functions and operations. We are optimistic that these initiatives will provide a foundation for improved performance for Vectra going forward.
44
The net loss for Vectra was $59.5 million for 2003 compared with net income of $25.6 million in 2002 and $3.4 million in 2001. Included in 2003 results was the previously discussed $75.6 million goodwill write-off associated with Vectra’s restructuring. Earnings for 2003 include $12.3 million of allocated net interest income compared with $21.9 million in 2002.
Net loans and leases decreased 11.8% from year-end 2002 to $1.7 billion at year-end 2003 and deposits decreased 7.7% to $1.8 billion. The decrease in loans was caused by commercial and construction loan runoff and higher consumer refinance activity in light of the low interest rate environment. The provision for loan losses was $5.9 million in 2003 compared to $5.0 million for 2002 and $9.4 million for 2001. Non-performing assets for Vectra increased slightly to $16.8 million at year-end 2003 compared with $16.0 million at December 31, 2002. Net loan and lease charge-offs for 2003 were $9.4 million compared with $4.7 million for 2002.
THE COMMERCE BANK OF WASHINGTON
The Commerce Bank of Washington (“Commerce”) was significantly affected in 2003 by the soft economy in the Pacific Northwest. The Puget Sound Region alone has lost approximately 81,000 jobs over the past three years, which reflects the downsizing and cost cutbacks of local businesses. While Commerce has been taking steps to address improving performance in the existing economic environment, any significant improvements in Commerce’s performance for 2004 will be dependent upon improvements in the local economy.
Net income for Commerce was $9.6 million for 2003 and 2002 compared to $8.1 million in 2001. Earnings for 2003 include $4.4 million of allocated net interest income compared with $5.1 million in 2002. Net loans and leases increased 2.5% from year-end 2002 to $329 million at year-end 2003 and deposits decreased 1.3% to $453 million. The provision for loan and lease losses was $0.8 million in 2003 compared with $1.1 million for 2002 and $1.3 million for 2001. Nonperforming assets for Commerce decreased to $2.2 million at year-end 2003 compared with $4.3 million at December 31, 2002. Net loan and lease charge-offs were $1.2 million for 2003 and $0.8 million for 2002.
OTHER
“Other” includes the Parent and other various nonbanking subsidiaries including certain e-commerce and other investment activities. Net income in the Other segment was $29.2 million compared to a net loss of $84.7 million for 2002 and a net loss of $23.2 million for 2001. Earnings for 2003 include the pretax gains of $68.5 million on the sale of ICAP, the $21.1 million gain on the sale of Lending Tree, and the $24.2 million of debt extinguishment costs that were all previously discussed. The large loss for 2002 relates primarily to losses on discontinued e-commerce subsidiaries previously discussed and a $32.4 million charge for the cumulative effect adjustment related to goodwill impairment in the e-commerce subsidiaries. See Note 10 of the Notes to Consolidated Financial Statements for more information on the goodwill impairment.
In 2002, the Company took a number of actions to revalue and restructure its e-commerce activities in light of continued disappointing results and a difficult market environment. In May 2002 the Company completed the sale of its DST subsidiary to Identrus, LLC for a 33% ownership position in Identrus. No gain or loss was recognized on the sale. DST was a leader in providing public key infrastructure (“PKI”) digital signatures for on-line identity authentication. Market adoption of this technology, however, had been slow. Identrus, a company owned by a global consortium of banks, also provides online identity authentication services and infrastructure. By selling DST to Identrus, the Company was able to cut its operating losses from this business activity by almost two-thirds, while retaining an ability to benefit financially if the market develops for identity authentication services. Identrus continues to post operating losses, although these losses have been significantly reduced through cost reductions achieved, in part, through the consolidation with DST. Identrus also recently, under new management, has
45
shown evidence of greater market place success for its products. Late in 2003 and early in 2004, the Company modestly increased its investment and ownership percentage in Identrus through its participation in a successful round of equity financing.
In support of its PKI activities, the Company acquired several software companies in 2001 and 2000 with the objective of hastening the adoption of digital signatures by developing applications using them. These acquisitions became the Company’s subsidiaries, Lexign, Inc. and Phaos Technology Corp. Market declines in the value of similar software companies led the Company to recognize valuation impairments related to these subsidiaries upon the adoption of SFAS 142 in 2002. More importantly, after the sale of DST, the Company no longer had a strategic rationale to continue the development of digital signature applications software. As a result, both Lexign and Phaos were down-sized, offered for sale and reclassified as discontinued operations in the third quarter of 2002. Additional write-downs to the impairment charges were taken at this time. In December 2002, the Company completed the sale of Phaos for approximately its revised value. The sale of Lexign was consummated in 2003 resulting in a pretax loss of $2.4 million.
The Company and Lexign, prior to its sale, developed an operating risk management system that it is deploying throughout the Company. This system is called RiskResolve™ and it is currently being offered under license to third parties through a newly formed subsidiary, Providus Software Solutions, Inc. (“Providus”). Providus’ RiskResolve™ has been recognized as a market leader in “Control Self Assessment” risk management software. However, Providus continues to produce financial losses at this time.
In addition to the Company’s e-commerce activities, the Company had developed a secure online storage and retrieval product called “Entervault.” However, as a result of poor market response, management ceased further development of Entervault in 2002, resulting in charges to income in the fourth quarter of that year.
In 2000, the Company acquired a 24.5% interest in an investment banking company serving primarily smaller and middle market companies in the West. The strategic intent was to allow the Company and the investment banking company to provide a more complete array of financial products and services to customers through cross-referrals. While a number of mutually-beneficial referrals have occurred and continue to occur, the overall market for investment banking products and services declined markedly in 2002. As a result, the investment banking company experienced a substantial decline in revenue and incurred significant operating losses. In the third quarter of 2002, the Company took an impairment charge on its investment in the investment banking company to reflect the decline in value attributable to its poor operating results. In 2003, this investment banking company returned to profitability.
The Company continues to selectively invest in new, innovative products and ventures. Most notably the Company has funded the development of NetDeposit, a family of innovative check imaging and clearing products and services for which the Company has sought extensive intellectual property protection. We believe that the enactment in October 2003 of federal legislation known as the Check 21 Act, which becomes effective in October 2004, has significantly improved the likelihood of marketplace adoption of NetDeposit’s products and services. The Company is actively marketing NetDeposit’s products and has received indications of significant interest. However, it is not yet known if the products will be commercially successful.
BALANCE SHEET ANALYSIS
INTEREST-EARNING ASSETS
Interest-earning assets are those with interest rates or yields associated with them. Nonearning assets are those that do not directly generate any revenues for the Company. One of our goals is to maintain a high level of interest-earning assets, while keeping non-earning assets at a minimum.
46
ZIONS BANCORPORATION AND SUBSIDIARIES
Interest-earning assets consists of money market investments, securities and loans. Schedule 1, which we referred to in our discussion of net interest income, includes the average balances of the Company’s interest-earning assets, the amount of revenue generated by them, and their respective yields. As shown in the schedule, average interest-earning assets in 2003 increased 8.4% to $25,115 million from $23,176 million in 2002. Average interest-earning assets comprised 89.0% of total average assets in 2003 compared with 88.1% in 2002. Average interest-earning assets in 2003 were 91.6% of average tangible assets compared with 91.1% in 2002.
Average money market investments, which consists of interest bearing deposits, Federal Funds sold and security resell agreements, increased 11.9% in 2003 over 2002. All of this increase was the result of a larger average trading balance, which required more securities sold short to manage the interest rate risk. All securities sold short must be borrowed through security resell agreements.
INVESTMENT SECURITIES PORTFOLIO
We invest in securities both to generate revenues for the Company and to manage liquidity. Schedule 6 presents a profile of Zions’ investment portfolios at December 31, 2003, 2002 and 2001. The amortized cost amounts represent the Company’s original cost for the investments, less the accumulated amortization of any yield adjustments related to the security. The estimated market values are the amounts that we believe the securities could be sold for as of the dates indicated.
The amortized cost of investment securities at year-end 2003 increased 35.6% over 2002, with most of the increase taking place in floating-rate securities. The Company increased its securities portfolio during the year as it took advantage of the availability of low-cost financing. We currently expect that these securities will be sold when demand for loans increases.
Schedule 7 also presents information regarding the investment securities portfolio. This schedule presents the maturities of the different types of investments that
SCHEDULE 6
INVESTMENT SECURITIES PORTFOLIO
| | | | | | | | | | | | | |
| | | December 31,
|
| | | 2003
| | 2002
| | 2001
|
(Amounts in millions) | | Amortized
cost
| | Estimated
market
value
| | Amortized
cost
| | Estimated
market
value
| | Amortized
cost
| | Estimated
market
value
|
HELD TO MATURITY: | | | | | | | | | | | | | |
Mortgage-backed securities | | $ | – | | – | | – | | – | | 79 | | 80 |
| | |
|
| |
| |
| |
| |
| |
|
| | | | – | | – | | – | | – | | 79 | | 80 |
| | |
|
| |
| |
| |
| |
| |
|
AVAILABLE FOR SALE: | | | | | | | | | | | | | |
U.S. Treasury securities | | | 42 | | 43 | | 44 | | 47 | | 61 | | 63 |
U.S. government agencies and corporations: | | | | | | | | | | | | | |
Small Business Administration loan-backed securities | | | 738 | | 741 | | 752 | | 756 | | 674 | | 674 |
Other agency securities | | | 241 | | 242 | | 299 | | 302 | | 769 | | 781 |
Municipal securities | | | 715 | | 718 | | 640 | | 645 | | 505 | | 514 |
Mortgage/asset-backed and other debt securities | | | 2,351 | | 2,368 | | 1,187 | | 1,208 | | 960 | | 969 |
| | |
|
| |
| |
| |
| |
| |
|
| | | | 4,087 | | 4,112 | | 2,922 | | 2,958 | | 2,969 | | 3,001 |
| | |
|
| |
| |
| |
| |
| |
|
Other securities: | | | | | | | | | | | | | |
Mutual funds | | | 318 | | 318 | | 317 | | 321 | | 266 | | 267 |
Stock | | | 8 | | 8 | | 15 | | 25 | | 10 | | 16 |
| | |
|
| |
| |
| |
| |
| |
|
| | | | 326 | | 326 | | 332 | | 346 | | 276 | | 283 |
| | |
|
| |
| |
| |
| |
| |
|
| | | | 4,413 | | 4,438 | | 3,254 | | 3,304 | | 3,245 | | 3,284 |
| | |
|
| |
| |
| |
| |
| |
|
Total | | $ | 4,413 | | 4,438 | | 3,254 | | 3,304 | | 3,324 | | 3,364 |
| | |
|
| |
| |
| |
| |
| |
|
47
ZIONS BANCORPORATION AND SUBSIDIARIES
SCHEDULE 7
MATURITIES AND AVERAGE YIELDS ON SECURITIES
ON DECEMBER 31, 2003
| | | | | | | | | | | | | | | | | | | | | | | | | |
| | | Total securities
| | Within one year
| | After one but
within five years
| | After five but
within ten years
| | After ten years
|
| (Amounts in millions) | | Amount
| | Yield*
| | Amount
| | Yield*
| | Amount
| | Yield*
| | Amount
| | Yield*
| | Amount
| | Yield*
|
AVAILABLE FOR SALE: | | | | | | | | | | | | | | | | | | | | | | | | | |
U.S. Treasury securities | | $ | 42 | | 3.7% | | $ | 23 | | 1.2% | | $ | 18 | | 6.7% | | $ | – | | | | $ | 1 | | 8.4% |
U.S. government agencies and corporations: | | | | | | | | | | | | | | | | | | | | | | | | | |
Small Business Administration loan-backed securities | | | 738 | | 2.8 | | | 168 | | 2.8 | | | 373 | | 2.8 | | | 149 | | 2.8% | | | 48 | | 2.8 |
Other agency securities | | | 241 | | 4.9 | | | 48 | | 1.4 | | | 4 | | 5.6 | | | 12 | | 7.5 | | | 177 | | 5.6 |
Municipal securities | | | 715 | | 7.0 | | | 86 | | 6.7 | | | 215 | | 7.0 | | | 219 | | 7.1 | | | 195 | | 7.2 |
Mortgage/asset-backed and other debt securities | | | 2,351 | | 4.1 | | | 119 | | 4.1 | | | 272 | | 4.1 | | | 115 | | 4.1 | | | 1,845 | | 4.1 |
| | |
|
| | | |
|
| | | |
|
| | | |
|
| | | |
|
| | |
| | | | 4,087 | | 4.4 | | | 444 | | 3.7 | | | 882 | | 4.3 | | | 495 | | 5.1 | | | 2,266 | | 4.5 |
| | |
|
| | | |
|
| | | |
|
| | | |
|
| | | |
|
| | |
Other securities: | | | | | | | | | | | | | | | | | | | | | | | | | |
Mutual funds | | | 318 | | 1.6 | | | 211 | | 0.6 | | | – | | | | | – | | | | | 107 | | 3.6 |
Stock | | | 8 | | 0.5 | | | – | | | | | – | | | | | – | | | | | 8 | | 0.5 |
| | |
|
| | | |
|
| | | |
|
| | | |
|
| | | |
|
| | |
| | | | 326 | | 1.6 | | | 211 | | 0.6 | | | – | | | | | – | | | | | 115 | | 3.4 |
| | |
|
| | | |
|
| | | |
|
| | | |
|
| | | |
|
| | |
Total | | $ | 4,413 | | 4.2% | | $ | 655 | | 2.7% | | $ | 882 | | 4.3% | | $ | 495 | | 5.1% | | $ | 2,381 | | 4.4% |
| | |
|
| | | |
|
| | | |
|
| | | |
|
| | | |
|
| | |
| * | Taxable-equivalent rates used where applicable. |
the Company owned as of December 31, 2003, and the corresponding average interest rates that the investments will yield if they are held to maturity. See “Liquidity Risk” on page 63 and also Notes 1, 4, and 7 of the Notes to Consolidated Financial Statements for additional information about the Company’s investment securities and their management.
The investment securities portfolio at December 31, 2003 includes $1,023 million of non-rated, fixed-income securities. Non-rated municipal securities held in the portfolio were created by Zions Public Finance Department. In addition to operations in Utah and Idaho, this Department includes the operations of Kelling, Northcross and Nobriga in California, Howarth & Associates in Nevada and the public finance department of NBA in Arizona. In addition to the non-rated municipal securities, the portfolio includes non-rated, asset-backed subordinated tranches. The asset-backed subordinated tranches created from Zions’ loans are mainly the subordinated retained interests of small-business loan securitizations. At December 31, 2003, these comprised $134 million of the $151 million set forth in Schedule 9. The tranches not created from Zions’ loans are tranches of bank and insurance company Trust Preferred Collateral Debt Obligations. In addition, investment securities includes other non-rated debt securities, the majority of which were created by ZFNB. Although the credit quality of these non-rated securities is high, it would be difficult to market them in a short period of time without bond ratings.
NON-RATED SECURITIES
| | | | | |
| | | December 31,
|
| (Book value in millions) | | 2003
| | 2002
|
Municipal securities | | $ | 653 | | 537 |
Asset-backed subordinated tranches, created from Zions’ loans | | | 134 | | 104 |
Asset-backed subordinated tranches, not created from Zions’ loans | | | 153 | | 103 |
Other non-rated debt securities | | | 83 | | 83 |
| | |
|
| |
|
| | | $ | 1,023 | | 827 |
| | |
|
| |
|
48
SCHEDULE 8
LOAN PORTFOLIO BY TYPE AND MATURITY
| | | | | | | | | | | | | | |
| | | December 31, 2003
| | | | |
(Amounts in millions) | | One year or less
| | One year
through
five years
| | Over five
years
| | Total
| | December 31,
|
| | | | | | 2002
| | 2001
|
Loans held for sale | | $ | 1 | | | 106 | | 70 | | 177 | | 289 | | 298 |
Commercial lending: | | | | | | | | | | | | | | |
Commercial and industrial | | | 2,397 | | | 1,059 | | 655 | | 4,111 | | 4,124 | | 3,921 |
Leasing | | | 22 | | | 240 | | 115 | | 377 | | 384 | | 421 |
Owner occupied | | | 276 | | | 570 | | 2,449 | | 3,295 | | 3,018 | | 2,344 |
| | |
|
| |
|
| |
| |
| |
| |
|
Total commercial lending | | | 2,695 | | | 1,869 | | 3,219 | | 7,783 | | 7,526 | | 6,686 |
| | |
|
| |
|
| |
| |
| |
| |
|
Commercial real estate: | | | | | | | | | | | | | | |
Construction | | | 1,792 | | | 936 | | 139 | | 2,867 | | 2,947 | | 2,874 |
Term | | | 317 | | | 1,325 | | 1,784 | | 3,426 | | 3,175 | | 3,027 |
| | |
|
| |
|
| |
| |
| |
| |
|
Total commercial real estate | | | 2,109 | | | 2,261 | | 1,923 | | 6,293 | | 6,122 | | 5,901 |
| | |
|
| |
|
| |
| |
| |
| |
|
Consumer: | | | | | | | | | | | | | | |
Home equity credit line | | | 104 | | | 10 | | 724 | | 838 | | 651 | | 401 |
1-4 family residential | | | 333 | | | 829 | | 2,712 | | 3,874 | | 3,209 | | 3,173 |
Bankcard and other revolving plans | | | 85 | | | 111 | | 2 | | 198 | | 205 | | 126 |
Other | | | 140 | | | 492 | | 117 | | 749 | | 1,000 | | 707 |
| | |
|
| |
|
| |
| |
| |
| |
|
Total consumer | | | 662 | | | 1,442 | | 3,555 | | 5,659 | | 5,065 | | 4,407 |
| | |
|
| |
|
| |
| |
| |
| |
|
Foreign loans | | | 1 | | | 14 | | – | | 15 | | 5 | | 14 |
Other receivables | | | 76 | | | 2 | | 12 | | 90 | | 126 | | 107 |
| | |
|
| |
|
| |
| |
| |
| |
|
Total loans | | $ | 5,544 | | | 5,694 | | 8,779 | | 20,017 | | 19,133 | | 17,413 |
| | |
|
| |
|
| |
| |
| |
| |
|
Loans maturing in more than one year: | | | | | | | | | | | | | | |
With fixed interest rates | | | | | $ | 2,648 | | 2,712 | | 5,360 | | | | |
With variable interest rates | | | | | | 3,046 | | 6,067 | | 9,113 | | | | |
| | | | | |
|
| |
| |
| | | | |
Total | | | | | $ | 5,694 | | 8,779 | | 14,473 | | | | |
| | | | | |
|
| |
| |
| | | | |
During 2002 the Company changed the classification of loans to more appropriate presentation categories. Information to reclassify the loans to the new categories for periods prior to 2001 is not available.
| | | | | |
| | | December 31,
|
(Amounts in millions) | | 2000
| | 1999
|
Loans held for sale | | $ | 181 | | 205 |
| | |
Commercial financial and agricultural | | | 3,615 | | 3,036 |
| | |
Loans secured by real estate: | | | | | |
Construction | | | 2,273 | | 1,722 |
Other: | | | | | |
Home equity credit line | | | 263 | | 232 |
1-4 family residential | | | 2,911 | | 2,503 |
Other real estate-secured | | | 4,190 | | 4,168 |
| | |
|
| |
|
| | | | 9,637 | | 8,625 |
| | |
|
| |
|
Consumer: | | | | | |
Bankcard and other revolving plans | | | 135 | | 107 |
Other | | | 472 | | 490 |
| | |
|
| |
|
| | | | 607 | | 597 |
| | |
|
| |
|
| | |
Lease financing | | | 317 | | 275 |
| | |
Foreign loans | | | 26 | | 53 |
| | |
Other receivables | | | 75 | | 62 |
| | |
|
| |
|
Total loans | | $ | 14,458 | | 12,853 |
| | |
|
| |
|
LOAN PORTFOLIO
As of December 31, 2003, net loans and leases accounted for 69.8% of total assets and 71.6% of tangible assets. Schedule 8 presents the Company’s loan outstandings by type of loan as of the five most recent year-ends. The schedule also includes a maturity profile for the loans that were outstanding as of December 31, 2003. During 2002, we expanded the categories of loans that we present, in an effort to better reflect the composition of the portfolio. However, the information to retroactively apply this change to years prior to 2001 is unavailable.
49
Loan growth during 2003 continued at a moderate pace, reflecting the persistent soft economy and our concerns regarding aggressive loan growth in such an environment. In addition to new loan generation, approximately $612 million of the growth in the loan portfolio related to purchased adjustable rate mortgages by CB&T as part of its asset-liability management program. We also continued our practice of securitizing and selling groups of loans to generate cash, which helps us manage interest rate risk and take advantage of new lending opportunities. During 2003, the Company securitized and sold $1,064 million in small business loans, home equity credit lines, and Federal Agricultural Mortgage Corporation loans. For 2002, securitized loan sales totaled $1,344 million.
SOLD LOANS BEING SERVICED
Zions performs loan servicing operations on both loans that it holds in its portfolios as well as loans that are owned by third party investor-owned trusts. Servicing loans includes:
| • | collecting loan and, in certain instances, insurance and property tax payments from the borrowers; |
| • | monitoring adequate insurance coverage; |
| • | maintaining documentation files in accordance with legal and contractual guidelines; and |
| • | remitting payments to third party investor trusts and, where required, for insurance and property taxes. |
Zions receives a fee for performing loan servicing for third parties. Failure by the Company to service the loans in accordance with the contractual requirements of the servicing agreements may lead to the termination of the servicing contract and the loss of future servicing fees.
SCHEDULE 9
SOLD LOANS BEING SERVICED
| | | | | | | | | | | | | |
| | | 2003
| | 2002
| | 2001
|
(Amounts in millions) | | Sales
| | Outstanding at year-end
| | Sales
| | Outstanding at year-end
| | Sales
| | Outstanding at year-end
|
Auto loans | | $ | – | | – | | 245 | | – | | 206 | | 312 |
Home equity credit lines | | | 327 | | 446 | | 362 | | 447 | | 308 | | 349 |
Bankcard receivables | | | – | | – | | 197 | | – | | 259 | | 79 |
Nonconforming residential real estate loans | | | – | | – | | – | | 80 | | 281 | | 222 |
Small business loans | | | 587 | | 1,699 | | 443 | | 1,351 | | 447 | | 1,079 |
SBA 7(a) loans | | | 69 | | 227 | | 16 | | 194 | | 76 | | 237 |
Farmer Mac | | | 81 | | 410 | | 81 | | 404 | | 108 | | 370 |
| | |
|
| |
| |
| |
| |
| |
|
Total | | $ | 1,064 | | 2,782 | | 1,344 | | 2,476 | | 1,685 | | 2,648 |
| | |
|
| |
| |
| |
| |
| |
|
| | | | | | | | | | | | | |
| | | Residual interests on balance sheet at December 31, 2003
| | Residual interests on balance sheet at December 31, 2002
|
(Amounts in millions) | | Subordinated
retained
interests
| | Capitalized
residual
cash flows
| | Total
| | Subordinated
retained
interests
| | Capitalized
residual cash
flows
| | Total
|
Home equity credit lines | | $ | 11 | | 9 | | 20 | | 11 | | 9 | | 20 |
Nonconforming residential real estate loans | | | – | | – | | – | | 3 | | 2 | | 5 |
Small business loans | | | 151 | | 96 | | 247 | | 119 | | 93 | | 212 |
SBA 7(a) loans | | | – | | 5 | | 5 | | – | | 2 | | 2 |
Farmer Mac | | | – | | 8 | | 8 | | – | | 5 | | 5 |
| | |
|
| |
| |
| |
| |
| |
|
Total | | $ | 162 | | 118 | | 280 | | 133 | | 111 | | 244 |
| | |
|
| |
| |
| |
| |
| |
|
50
As discussed earlier, Zions has a practice of securitizing and selling a portion of the loans that it originates. In many instances, we provide the servicing on these loans as a condition of the sale. Schedule 9 summarizes the sold loans (other than conforming long-term first mortgage real estate loans) that the Company was servicing as of the dates indicated and the related loan sales activity. As of December 31, 2003, conforming long-term first mortgage real estate loans being serviced for others was $352 million compared with $342 million at the same date in 2002. Consumer and other sold loans being serviced totaled $2,782 million at the end of 2003 and $2,476 million at the end of 2002. In addition, in the fourth quarter of 2002, the Company, with the consents of the parties to the agreements and a majority of the beneficial interest owners, repurchased at fair value the entire outstanding balances of previously securitized automobile loans and bankcard receivables. No gain or loss was recognized as a result of the transactions. See Notes 1 and 6 of the Notes to Consolidated Financial Statements for additional information on asset securitizations.
As of December 31, 2003, the Company had recorded assets in the amount of $280 million in connection with sold loans being serviced of $2,782 million. Although it performs the servicing, Zions exerts no control nor does it have any equity interest in any of the trusts that own the securitized loans. However, as is a common practice with securitized transactions, the Company had retained subordinated interests in the securitized assets amounting to $162 million at December 31, 2003, representing junior positions to the other investors in the trust securities. The capitalized residual cash flows, which is sometimes referred to as “excess servicing”, of $118 million primarily represent the present value of the excess cash flows that have been projected over the lives of the sold loans. These excess cash flows are subject to prepayment risk, which is the risk that a loan will be paid prior to its contractual maturity. When this occurs, any remaining excess cash flows that are associated with the loan must be reduced. See Note 6 of the Notes to Consolidated Financial Statements for more information on assets securitizations.
OTHER EARNING ASSETS
As of December 31, 2003, the Company had $584 million of other noninterest bearing investments compared with $602 million in 2002. At year-end 2003 these investments included of $366 million of bank-owned life insurance, $96 million of Federal Home Loan Bank and Federal Reserve Bank stock and $64 million in non-public ventures through four Small Business Investment Companies. The Company’s remaining equity exposure to the ventures, net of minority interest and Small Business Administration debt, at December 31, 2003 was $38.0 million. The Company also had $58 million of investments in other unconsolidated publicly traded and nonpublic companies, of which $28 million are in a publicly traded company as set forth in the following table:
| | | | | | | | | |
| | | | | December 31, 2003
|
| (Amounts in millions) | | Symbol
| | Carrying
value
| | Market
value
| | Unrealized
gain
|
COMPANY | | | | | | | | | |
Federal Agricultural Mortgage Corporation (Farmer Mac) | | AGM/A | | $ | 5 | | 7 | | 2 |
Federal Agricultural Mortgage Corporation (Farmer Mac) | | AGM | | | 23 | | 48 | | 25 |
| | | | |
|
| |
| |
|
Total publicly traded equity investments | | | | $ | 28 | | 55 | | 27 |
| | | | |
|
| |
| |
|
DEPOSITS AND BORROWED FUNDS
Deposits, both interest bearing and noninterest bearing, are a primary source of funding for the Company. Schedule 1 summarizes the average deposit balances for the past five years, along with their respective interest costs and average interest rates. Average noninterest bearing deposits increased 16.3% in 2003 over 2002, while interest bearing deposits increased 6.5% during the same time period.
See “Liquidity Risk” on page 63 for information on funding and borrowed funds. Also, see Notes 12, 13 and 14 of the Notes to Consolidated Financial Statements for additional information on borrowed funds.
51
OFF-BALANCE SHEET ARRANGEMENTS
As discussed earlier, ZFNB provides a liquidity facility for a fee to a qualifying special-purpose entity securities conduit, Lockhart Funding, LLC, that purchases U.S. Government and AAA-rated securities, which are funded through the issuance of commercial paper. ZFNB also provides for a fee hedge support and administrative and investment advisory services. Under the terms of the liquidity facility, if certain conditions arise, ZFNB is required to purchase securities from Lockhart to provide funds and enable it to repay maturing commercial paper. Lockhart is an important source of funding for the Company’s loans and is not consolidated in the Company’s financial statements. See “Liquidity Management” on page 64 and Note 6 of the Notes to Consolidated Financial Statements for additional information on Lockhart.
The Company, through its securitization activities, securitizes and sells loans that it originates to Qualifying Special Purpose Entities. These securitizations provide an alternative source of funding for the subsidiaries and enhance the flexibility in meeting funding needs. In connection with the securitizations, the Company generally retains an interest in the securitized assets and provides servicing for the loans as part of the arrangement. These Qualified Special Purpose Entities are not consolidated into the Company. See Note 6 of the Notes to Consolidated Financial Statements for additional information on the Company’s securitization activities.
RISK ELEMENTS
Since risk is inherent in most of the Company’s operations, management of risk is integral to its operations and is also a key determinant of its overall performance. We apply various strategies to reduce the risks to which the Company’s operations are exposed, namely credit, operational, interest rate and market, and liquidity risks. These strategies are discussed in the following sections.
CREDIT RISK MANAGEMENT
Credit risk is the possibility of loss from the failure of a borrower or contractual counterparty to fully perform under the terms of a credit-related contract. Credit risk arises primarily from the Company’s lending activities, as well as from other on- and off-balance-sheet credit instruments.
As noted earlier in the Executive Summary, we believe that the Company’s credit risk metrics have constantly compared favorably with those of peer institutions. In addition, during 2003 most indicators of credit quality, such as nonaccrual loans and other nonperforming assets, as well as internal classification measures exhibited improvement, particularly in the latter half of the year. Based on information currently available, we expect some further improvement in these credit quality measures in 2004.
Effective management of credit risk is essential in maintaining a safe and sound financial institution. We have structured the organization to separate the lending function from the credit administration function, which has added strength to the control over, and independent evaluation of credit activities. Formal loan policies and procedures provide the Company with a framework for consistent underwriting and a basis for sound credit decisions. In addition, the Company has a well-defined set of standards for evaluating its loan portfolio, and management utilizes a comprehensive loan grading system to determine the risk potential in the portfolio. Further, an independent internal credit examination department periodically conducts examinations of the Company’s lending departments. These examinations are designed to review the quality, documentation, administration and compliance with lending policies and reports thereon are submitted to a committee of the Board of Directors. Both the credit policy and the credit examination functions are managed centrally. Each bank is able to modify corporate credit policy to be more conservative, however, corporate approval must be obtained if a bank wishes to create a more liberal exception to policy. Historically, a limited number of exceptions have been approved. This entire
52
process has been designed to place an emphasis on early detection of potential problem credits so that action plans can be developed and implemented on a timely basis to mitigate any potential losses.
With regard to credit risk associated with counterparties in off-balance-sheet credit instruments, ZFNB has ten International Swap Dealer Association (“ISDA”) agreements in place under which derivative transactions are entered into with major derivative dealers. Each ISDA agreement details the collateral arrangement between ZFNB and its counterparty. In every case, the amount of the collateral required to secure the exposed party in the derivative transaction is determined by the mark-to-market exposure on the derivative and the credit rating of the party with the obligation. The credit rating used in these situations is provided by either Moody’s or Standard and Poor’s. This means that a counterparty with a “AAA” rating would be obligated to provide less collateral to secure a major credit exposure to ZFNB than one with an “A” rating. All derivative gains and losses between ZFNB and a single counter-party are netted to determine the net credit exposure and therefore the collateral required.
Another aspect of the Company’s credit risk management strategy is to pursue the diversification of the loan portfolio. As displayed in the following table, at year-end 2003 no single loan type exceeded 20.5% of the Company’s total loan portfolio.
LOAN PORTFOLIO DIVERSIFICATION
| | | | | | | | | | |
| | | December 31, 2003
| | December 31, 2002
|
| (Amounts in millions) | | Amount
| | % of
total loans
| | Amount
| | % of
total loans
|
Commercial lending: | | | | | | | | | | |
Commercial and industrial | | $ | 4,111 | | 20.5% | | $ | 4,124 | | 21.5% |
Leasing | | | 377 | | 1.9 | | | 384 | | 2.0 |
Owner occupied | | | 3,295 | | 16.5 | | | 3,018 | | 15.8 |
Commercial real estate: | | | | | | | | | | |
Construction | | | 2,867 | | 14.3 | | | 2,947 | | 15.4 |
Term | | | 3,426 | | 17.1 | | | 3,175 | | 16.6 |
Consumer: | | | | | | | | | | |
Home equity credit line | | | 838 | | 4.2 | | | 651 | | 3.4 |
1-4 family residential | | | 3,874 | | 19.4 | | | 3,209 | | 16.8 |
Bankcard and other revolving plans | | | 198 | | 1.0 | | | 205 | | 1.1 |
Other | | | 749 | | 3.7 | | | 1,000 | | 5.2 |
Other receivables | | | 282 | | 1.4 | | | 420 | | 2.2 |
| | |
|
| |
| |
|
| |
|
Total Loans | | $ | 20,017 | | 100.0% | | $ | 19,133 | | 100.0% |
| | |
|
| |
| |
|
| |
|
In addition, as reflected in Schedule 10, as of December 31, 2003, the commercial real estate loan portfolio is also well diversified by property type and collateral location.
53
SCHEDULE 10
COMMERCIAL REAL ESTATE PORTFOLIO BY PROPERTY TYPE AND COLLATERAL LOCATION
(REPRESENTS PERCENTAGES BASED UPON OUTSTANDING COMMERCIAL REAL ESTATE LOANS)
ON DECEMBER 31, 2003
| | | | | | | | | | | | | | | | | | | | |
| | | Collateral Location
| | Product as a % of
total CRE
| | Product as a % of
loan type
|
| Loan Type | | Arizona
| | Northern
California
| | Southern
California
| | Nevada
| | Colorado
| | Utah/
Idaho
| | Washington
| | Other
| | |
Commercial term: | | | | | | | | | | | | | | | | | | | | |
Industrial | | 1.31% | | 0.75 | | 3.04 | | 0.07 | | 1.08 | | 0.24 | | 0.16 | | 0.23 | | 6.88 | | 12.26 |
Office | | 2.19 | | 1.06 | | 2.59 | | 2.27 | | 1.17 | | 2.05 | | 0.24 | | 1.28 | | 12.85 | | 22.94 |
Retail | | 2.25 | | 1.24 | | 3.96 | | 1.17 | | 0.58 | | 0.47 | | 0.21 | | 0.58 | | 10.46 | | 18.66 |
Hotel/motel | | 1.70 | | 0.22 | | 1.12 | | 0.99 | | 0.43 | | 1.17 | | 0.13 | | 2.07 | | 7.83 | | 14.00 |
A&D | | 0.24 | | 0.04 | | 0.19 | | 0.16 | | 0.24 | | 0.28 | | 0.13 | | 0.09 | | 1.37 | | 2.47 |
Medical | | 0.91 | | 0.05 | | 0.95 | | 0.58 | | 0.01 | | 0.11 | | – | | 0.21 | | 2.82 | | 5.00 |
Recreation/restaurant | | 0.13 | | 0.15 | | 0.30 | | 0.17 | | 0.11 | | 0.04 | | – | | 0.27 | | 1.17 | | 2.07 |
Multifamily | | 0.57 | | 0.34 | | 1.13 | | 0.51 | | 0.70 | | 0.91 | | 0.17 | | 0.58 | | 4.91 | | 8.77 |
Golf course | | 0.44 | | 0.04 | | – | | – | | – | | 0.05 | | – | | 0.02 | | 0.55 | | 0.98 |
Other | | 0.93 | | 0.35 | | 2.04 | | 1.42 | | 0.67 | | 1.08 | | 0.05 | | 0.66 | | 7.20 | | 12.85 |
Total commercial term | | 10.67 | | 4.24 | | 15.32 | | 7.34 | | 4.99 | | 6.40 | | 1.09 | | 5.99 | | 56.04 | | 100.00 |
Residential construction: | | | | | | | | | | | | | | | | | | | | |
Single family housing | | 3.79 | | 0.23 | | 3.02 | | 0.18 | | 1.28 | | 2.79 | | 0.05 | | 1.29 | | 12.63 | | 52.79 |
Condominium/townhouse | | 0.27 | | 0.12 | | 0.31 | | – | | 0.09 | | 0.04 | | – | | 0.06 | | 0.89 | | 3.77 |
A&D | | 2.39 | | 0.81 | | 2.93 | | 0.36 | | 0.90 | | 1.06 | | 0.01 | | 1.93 | | 10.39 | | 43.44 |
Total residential construction | | 6.45 | | 1.16 | | 6.26 | | 0.54 | | 2.27 | | 3.89 | | 0.06 | | 3.28 | | 23.91 | | 100.00 |
Commercial construction: | | | | | | | | | | | | | | | | | | | | |
Industrial | | 0.12 | | 0.12 | | 0.44 | | 0.13 | | 0.49 | | 0.12 | | 0.01 | | 0.26 | | 1.69 | | 8.44 |
Office | | 0.45 | | 0.87 | | 0.54 | | 0.11 | | 0.64 | | 0.44 | | 0.53 | | 1.04 | | 4.62 | | 23.07 |
Retail | | 1.97 | | – | | 0.49 | | 0.64 | | 0.38 | | 0.57 | | 0.06 | | 1.25 | | 5.36 | | 26.73 |
Hotel/motel | | 0.06 | | 0.44 | | 0.24 | | – | | – | | 0.08 | | – | | 0.10 | | 0.92 | | 4.55 |
A&D | | 0.34 | | 0.10 | | 0.23 | | 0.90 | | 0.40 | | 0.06 | | 0.07 | | 0.14 | | 2.24 | | 11.25 |
Medical | | 0.17 | | – | | 0.18 | | – | | – | | – | | 0.03 | | 0.01 | | 0.39 | | 1.94 |
Recreation/restaurant | | 0.02 | | – | | – | | – | | – | | – | | – | | 0.02 | | 0.04 | | 0.17 |
Golf course | | – | | – | | 0.21 | | 0.07 | | – | | – | | – | | – | | 0.28 | | 1.37 |
Other | | – | | 0.10 | | 0.19 | | – | | 0.11 | | – | | 0.15 | | 0.04 | | 0.59 | | 2.94 |
Apartments | | 0.43 | | 0.42 | | 0.70 | | 0.03 | | 1.16 | | 0.06 | | 0.33 | | 0.79 | | 3.92 | | 19.54 |
Total commercial construction | | 3.56 | | 2.05 | | 3.22 | | 1.88 | | 3.18 | | 1.33 | | 1.18 | | 3.65 | | 20.05 | | 100.00 |
Total construction | | 10.01 | | 3.21 | | 9.48 | | 2.42 | | 5.45 | | 5.22 | | 1.24 | | 6.93 | | 43.96 | | 100.00 |
Total commercial real estate | | 20.68% | | 7.45 | | 24.80 | | 9.76 | | 10.44 | | 11.62 | | 2.33 | | 12.92 | | 100.00 | | |
Note: Excludes approximately $333 million of unsecured loans outstanding, but related to the real estate industry.
The Company’s concentration in owner occupied commercial loans is substantially reduced by the emphasis we place on lending programs sponsored by the Small Business Administration. On these types of loans, the Small Business Administration bears a major portion of the credit risk. In addition, the Company attempts to avoid the risk of an undue concentration of credits in a particular industry, trade group or property type. The Company also has no significant exposure to highly-leveraged transactions. In addition, the majority of the Company’s business activity is with customers located within the states of Utah, Idaho, California, Nevada, Arizona, Colorado, and Washington. Finally, the Company has no significant exposure to any individual customer or counter-party. See Note 5 of the Notes to Consolidated Financial Statements for further information on concentrations of credit risk.
54
SCHEDULE 11
NONPERFORMING ASSETS
| | | | | | | |
| | | December 31,
|
| (Amounts in millions) | | 2003
| | 2002
| | 2001
|
Nonaccrual loans: | | | | | | | |
Commercial lending: | | | | | | | |
Commercial and industrial | | $ | 36 | | 29 | | 40 |
Leasing | | | 2 | | 11 | | 6 |
Owner occupied | | | 15 | | 14 | | 18 |
Commercial real estate: | | | | | | | |
Construction | | | 7 | | 7 | | 12 |
Term | | | 3 | | 4 | | 20 |
Consumer: | | | | | | | |
Real estate | | | 11 | | 11 | | 9 |
Other | | | 3 | | 4 | | 2 |
Other | | | 1 | | 2 | | 2 |
Restructured loans: | | | | | | | |
Commercial real estate: | | | | | | | |
Construction | | | 1 | | 1 | | 1 |
Term | | | – | | 1 | | – |
Other real estate owned: | | | | | | | |
Commercial, financial and agricultural | | | | | | | |
Improved | | | 12 | | 23 | | 4 |
Unimproved | | | 4 | | 3 | | 2 |
Residential, 1-4 Family | | | 3 | | 6 | | 4 |
| | |
|
| |
| |
|
Total | | $ | 98 | | 116 | | 120 |
| | |
|
| |
| |
|
% of net loans* and leases and other real estate owned | | | 0.49% | | 0.61% | | 0.69% |
Accruing loans past due 90 days or more: | | | | | | | |
Commercial lending | | $ | 10 | | 13 | | 22 |
Commercial real estate | | | 3 | | 10 | | 13 |
Consumer | | | 11 | | 12 | | 11 |
Other receivables | | | – | | 2 | | – |
| | |
|
| |
| |
|
Total | | $ | 24 | | 37 | | 46 |
| | |
|
| |
| |
|
% of net loans* and leases | | | 0.12% | | 0.20% | | 0.27% |
| | | |
* Includes loans held for sale. | | | | | | | |
|
| During 2002 the Company changed the classification of loans to more appropriate presentation categories. Information to reclassify the loans to the new categories for periods prior to 2001 is not available. |
| | | | | |
| | | December 31,
|
| (Amounts in millions) | | 2000
| | 1999
|
Nonaccrual loans: | | | | | |
Commercial, financial and agricultural | | $ | 20 | | 29 |
Real estate | | | 34 | | 34 |
Consumer | | | 2 | | 1 |
Lease financing | | | 2 | | 1 |
Restructured loans: | | | | | |
Commercial, financial and agricultural | | | 2 | | – |
Real estate | | | 1 | | 1 |
Other real estate owned: | | | | | |
Commercial, financial and agricultural: | | | | | |
Improved | | | 6 | | 5 |
Unimproved | | | 2 | | 3 |
Residential, 1-4 Family | | | 2 | | 1 |
| | |
|
| |
|
Total | | $ | 71 | | 75 |
| | |
|
| |
|
% of net loans* and leases and other real estate owned | | | 0.49% | | 0.58% |
Accruing loans past due 90 days or more: | | | | | |
Commercial, financial and agricultural | | $ | 8 | | 4 |
Real estate | | | 18 | | 15 |
Consumer | | | 1 | | 2 |
| | |
|
| |
|
Total | | $ | 27 | | 21 |
| | |
|
| |
|
% of net loans* and leases | | | 0.19% | | 0.16% |
| | |
* Includes loans held for sale. | | | | | |
NONPERFORMING ASSETS
Nonperforming assets include nonaccrual loans, restructured loans and other real estate owned. Loans are generally placed on nonaccrual status when the loan is 90 days or more past due as to principal or interest, unless the loan is both well secured and in the process of collection. Consumer loans, however, are not normally placed on a nonaccrual status, inasmuch as they are generally charged off when they become 120 days past due. Loans may be occasionally restructured to provide a reduction or deferral of interest or principal payments. This generally occurs when the financial condition of a borrower deteriorates to the point that the borrower needs to be given temporary or permanent relief from the original contractual terms of the loan. Other real estate owned is acquired primarily through or in lieu of foreclosure on loans secured by real estate.
The level of the Company’s nonperforming assets continued to improve during 2003. Total nonperforming assets were $98 million at December 31, 2003 down from $116 million at December 31, 2002, and $120 million at December 31, 2001. Nonperforming assets
55
as a percentage of net loans and leases and other real estate owned were 0.49% at December 31, 2003 compared with 0.61% on December 31, 2002.
Included in nonaccrual loans are loans that we have determined to be impaired. Loans, other than those included in large groups of smaller-balance homogeneous loans, are considered impaired when, based on current information and events, it is probable that the Company will be unable to collect all amounts due in accordance with the contractual terms of the loan agreement, including scheduled interest payments. The amount of the impairment is measured based on either the present value of expected cash flows, the observable market price of the loan, or the fair value of the collateral securing the loan.
The Company’s total recorded investment in impaired loans was $44 million at both December 31, 2003 and December 31, 2002. Estimated losses on impaired loans are added to the allowance for loan losses through the provision for loan losses. At December 31, 2003, the allowance for loan losses included $5 million for impaired loans with a recorded investment of $21 million. At December 31, 2002 the allowance included $7 million for impaired loans with a $20 million recorded investment. See Note 5 of the Notes to Consolidated Financial Statements for additional information on impaired loans.
ALLOWANCE FOR LOAN LOSSES
In analyzing the adequacy of the allowance for loan losses, we utilize a comprehensive loan grading system to determine the risk potential in the portfolio and consider the results of independent internal credit reviews. To determine the adequacy of the allowance, the Company’s loan and lease portfolio is broken into segments based on loan type. We use historical loss experience factors by loan segment, adjusted for changes in trends and conditions, to help determine the required allowance for each segment. These factors are evaluated and updated using migration analysis techniques and other considerations based on the makeup of the specific portfolio segment. Other considerations include:
| • | volumes and trends of delinquencies; |
| • | nonaccruals, repossessions and bankruptcies; |
| • | criticized and classified loan trends; |
| • | current and anticipated foreclosure losses; |
| • | new products and policies; |
| • | concentrations of credit risk; and |
| • | experience and abilities of lending personnel. |
In addition to the segment evaluations, all loans graded substandard or doubtful with an outstanding balance of $500 thousand or more are individually evaluated based on facts and circumstances of the loan to determine if a specific allowance amount may be necessary. Specific allowances may also be established for loans whose outstanding balances are below the specified thresholds when it is determined that the risk associated with the loan differs significantly from the risk factor amounts established for its loan segment.
After a preliminary allowance for credit losses has been established for the loan portfolio segments, we perform an additional review of the adequacy of the allowance based on the loan portfolio in its entirety. This enables us to mitigate the imprecision inherent in most estimates of expected credit losses and also supplements the allowance. This supplemental portion of the allowance includes our judgmental consideration of any additional amounts necessary for subjective factors such as economic uncertainties and excess concentration risks.
Schedule 12 provides a breakdown of the allowance for loan losses, the allocation among the portfolio segments and the amount that is unallocated. No significant changes took place in the allocation of the allowance for loan losses, reflecting the mix of the loan portfolio and the levels of nonperforming assets. Schedule 13 summarizes the Company’s loan loss experience by major portfolio segment.
We also estimate the potential credit losses related to undrawn commitments to extend credit using a similar process to the one described above. At December 31, 2003, this estimate totaled $12.2 million and is included in other liabilities. In prior years, the potential credit losses related to undrawn commitments to extend credit were included in the allowance for loan losses.
56
SCHEDULE 12
ALLOCATION OF THE ALLOWANCE FOR LOAN LOSSES
ON DECEMBER 31
| | | | | | | | | | | | | | | |
| | | 2003
| | 2002
| | 2001
|
| (Amounts in millions) | | % of
total
loans
| | Allocation
of
allowance
| | % of
total
loans
| | Allocation
of
allowance
| | % of
total
loans
| | Allocation
of
allowance
|
TYPE OF LOAN | | | | | | | | | | | | | | | |
Loans held for sale | | 0.9% | | $ | 2 | | 1.5% | | $ | 2 | | 1.7% | | $ | 2 |
Commercial lending | | 38.9 | | | 130 | | 39.3 | | | 132 | | 38.5 | | | 123 |
Commercial real estate | | 31.5 | | | 90 | | 32.0 | | | 91 | | 33.9 | | | 89 |
Consumer | | 28.3 | | | 45 | | 26.5 | | | 42 | | 25.3 | | | 35 |
Other receivables | | 0.4 | | | 2 | | 0.7 | | | 2 | | 0.6 | | | 2 |
| | |
| | | | |
| | | | |
| | | |
Total loans | | 100.0% | | | | | 100.0% | | | | | 100.0% | | | |
| | |
| | | | |
| | | | |
| | | |
Off-balance sheet unused commitments and standby letters of credit (1) | | | | | – | | | | | 10 | | | | | 8 |
| | | | |
|
| | | |
|
| | | |
|
|
Total allocated | | | | | 269 | | | | | 279 | | | | | 259 |
Unallocated | | | | | – | | | | | 1 | | | | | 1 |
| | | | |
|
| | | |
|
| | | |
|
|
Total allowance for loan losses | | | | $ | 269 | | | | $ | 280 | | | | $ | 260 |
| | | | |
|
| | | |
|
| | | |
|
|
(1) In 2003 the potential credit losses related to undrawn commitments to extend credit were reclassified and included in other liabilities. During 2002 the Company changed the classification of loans to more appropriate presentation categories. Information to reclassify the loans to the new categories prior to 2001 is not available. |
| | | 2000
| | 1999
| | | | |
| (Amounts in millions) | | % of
total
loans
| | Allocation
of
allowance
| | % of
total
loans
| | Allocation of allowance
| | | | |
TYPE OF LOAN | | | | | | | | | | | | | | | |
Loans held for sale | | 1.3% | | $ | – | | 1.6% | | $ | – | | | | | |
Commercial, financial and agricultural | | 25.1 | | | 57 | | 23.8 | | | 46 | | | | | |
Real estate | | 66.7 | | | 110 | | 67.4 | | | 100 | | | | | |
Consumer | | 4.2 | | | 9 | | 4.6 | | | 12 | | | | | |
Lease financing | | 2.2 | | | 4 | | 2.1 | | | 6 | | | | | |
Other receivables | | 0.5 | | | – | | 0.5 | | | – | | | | | |
| | |
| | | | |
| | | | | | | | |
Total loans | | 100.0% | | | | | 100.0% | | | | | | | | |
| | |
| | | | |
| | | | | | | | |
Off-balance sheet unused commitments and standby letters of credit (1) | | | | | 14 | | | | | 23 | | | | | |
| | | | |
|
| | | |
|
| | | | | |
Total allocated | | | | | 194 | | | | | 187 | | | | | |
Unallocated | | | | | 2 | | | | | 17 | | | | | |
| | | | |
|
| | | |
|
| | | | | |
Total allowance for loan losses | | | | $ | 196 | | | | $ | 204 | | | | | |
| | | | |
|
| | | |
|
| | | | | |
| (1) | In 2003 the potential credit losses related to undrawn commitments to extend credit were reclassified and included in other liabilities. |
57
SCHEDULE 13
SUMMARY OF LOAN LOSS EXPERIENCE
| | | | | | | |
| (Amounts in millions) | | 2003
| | 2002
| | 2001
|
Loans* and leases outstanding on December 31, (net of unearned income) | | $ | 19,920 | | 19,040 | | 17,311 |
| | |
|
| |
| |
|
Average loans* and leases outstanding (net of unearned income) | | $ | 19,325 | | 18,114 | | 16,015 |
| | |
|
| |
| |
|
Allowance for loan losses: | | | | | | | |
Balance at beginning of year | | $ | 280 | | 260 | | 196 |
Allowance of companies acquired | | | – | | 1 | | 30 |
Allowance associated with repurchased revolving securitized loans | | | – | | 10 | | – |
Provision charged against earnings | | | 70 | | 72 | | 73 |
Loans and leases charged-off: | | | | | | | |
Commercial lending | | | (56) | | (54) | | (37) |
Commercial real estate | | | (3) | | (10) | | (4) |
Consumer | | | (27) | | (20) | | (14) |
| | |
|
| |
| |
|
Total | | | (86) | | (84) | | (55) |
| | |
|
| |
| |
|
Recoveries: | | | | | | | |
Commercial lending | | | 12 | | 14 | | 11 |
Commercial real estate | | | – | | 3 | | 1 |
Consumer | | | 5 | | 4 | | 4 |
| | |
|
| |
| |
|
Total | | | 17 | | 21 | | 16 |
| | |
|
| |
| |
|
Net loan and lease charge-offs | | | (69) | | (63) | | (39) |
| | |
|
| |
| |
|
| | | | 281 | | 280 | | 260 |
Reclassification of allowance for unfunded lending commitments | | | (12) | | – | | – |
| | |
|
| |
| |
|
Balance at end of year | | $ | 269 | | 280 | | 260 |
| | |
|
| |
| |
|
Ratio of net charge-offs to average loans and leases | | | 0.36 % | | 0.35 % | | 0.24 % |
Ratio of allowance for loan losses to net loans and
leases outstanding on December 31, | | | 1.35 % | | 1.47 % | | 1.50 % |
Ratio of allowance for loan losses to
nonperforming loans on December 31, | | | 338.31 % | | 332.37 % | | 236.65 % |
Ratio of allowance for loan losses to nonaccrual loans and accruing
loans past due 90 days or more on December 31, | | | 262.21 % | | 234.14 % | | 168.23 % |
During 2002 the Company changed the classification of loans to more appropriate presentation categories. Information to reclassify the loans to the new categories for periods prior to 2001 is not available.
| | | | | |
| (Amounts in millions) | | 2000
| | 1999
|
Loans* and leases outstanding on December 31, (net of unearned income) | | $ | 14,378 | | 12,791 |
| | |
|
| |
|
Average loans* and leases outstanding (net of unearned income) | | $ | 13,649 | | 11,819 |
| | |
|
| |
|
Allowance for loan losses: | | | | | |
Balance at beginning of year | | $ | 204 | | 213 |
Allowance of companies acquired | | | 2 | | 3 |
Provision charged against earnings | | | 32 | | 18 |
Loans and leases charged-off: | | | | | |
Commercial, financial and agricultural | | | (38) | | (32) |
Real estate | | | (4) | | (3) |
Consumer | | | (9) | | (9) |
Lease financing | | | (2) | | (2) |
| | |
|
| |
|
Total | | | (53) | | (46) |
| | |
|
| |
|
Recoveries: | | | | | |
Commercial, financial and agricultural | | | 6 | | 6 |
Real estate | | | 1 | | 7 |
Consumer | | | 3 | | 3 |
Lease financing | | | 1 | | – |
| | |
|
| |
|
Total | | | 11 | | 16 |
| | |
|
| |
|
Net loan and lease charge-offs | | | (42) | | (30) |
| | |
|
| |
|
Balance at end of year | | $ | 196 | | 204 |
| | |
|
| |
|
Ratio of net charge-offs to average loans and leases | | | 0.31 % | | 0.25 % |
Ratio of allowance for loan losses to net loans and
leases outstanding on December 31, | | | 1.36 % | | 1.60 % |
Ratio of allowance for loan losses to
nonperforming loans on December 31, | | | 320.69 % | | 310.87 % |
Ratio of allowance for loan losses to nonaccrual loans and accruing
loans past due 90 days or more on December 31, | | | 229.35 % | | 238.07 % |
| * | Includes loans held for sale. |
58
OPERATIONAL RISK MANAGEMENT
Operational risk is the risk of unexpected losses attributable to human error, systems failures, fraud, or inadequate internal controls and procedures. The Company currently has in place systems and procedures to monitor transactions and positions, transactional documentation requirements, regulatory compliance reviews, and periodic reviews by internal audit and credit examination, all of which mitigate operational risk. Reconciliation procedures are also in place to ensure that data processing systems capture critical data. In addition, we maintain contingency plans and systems for operations support in the event of natural disasters.
In addition, during 2003 the Company substantially enhanced its central Operating Risk Management group. We installed RiskResolve™ software developed and marketed by Providus Software Solutions, Inc., a wholly-owned subsidiary of Zions. With RiskResolve™ we have documented controls and the Control Self Assessment related to financial reporting under Section 404 of the Sarbanes-Oxley Act of 2002 and the Federal Deposit Insurance Corporation Improvement Act of 1991 (“FDICIA”). During 2004, we expect to continue to enhance the Company’s controls over operating risk more broadly through further deployment of RiskResolve™.
INTEREST RATE AND MARKET RISK MANAGEMENT
Interest rate risk is the potential for loss resulting from adverse changes in the level of interest rates on the Company’s net interest income. Market risk is the potential for loss arising from adverse changes in the prices of fixed income securities, equity securities, other earning assets and derivative financial instruments as a result of changes in interest rates or other factors. As a financial institution that engages in transactions involving an array of financial products, Zions is exposed to interest rate risk and market risk.
The Zions Asset/Liability Committee (“ALCOM”) measures and reviews the interest rate and market risk of the Company and establishes policies and procedures that are designed to limit the Company’s exposure to changes in interest rates. The Boards of Directors of the Company’s subsidiary banks also review and approve these policies. ALCOM’s objectives are as follows:
| • | Ensure the safety and soundness of bank deposits, while providing an appropriate return to shareholders; |
| • | Provide the basis for integrated balance sheet, net interest income and liquidity management; |
| • | Calculate the duration, dollar duration, and convexity of each class of assets, liabilities, and net equity, given defined interest rate scenarios; |
| • | Manage the Company’s exposure to changes in net interest income and market value of equity due to interest rate fluctuations; |
| • | Quantify the effect of hedging instruments on the market value of equity and net interest income under defined interest rate scenarios; and |
| • | Identify and report any risk exposures that exceed limitations approved by the Board of Directors of the Company or its subsidiaries. |
INTEREST RATE RISK
Interest rate risk is the most significant market risk to which the Company is regularly exposed. We monitor this risk through the use of two complementary measurement methods: duration of equity and income simulation. In the duration of equity method, we measure the changes in the market values of equity in response to changes in interest rates. In the income simulation method, we analyze the changes in income in response to changes in interest rates. The tool that we use to apply both of these methods is an asset-liability management system marketed by a third party company, QRM. In general, our goal in managing interest is to have net interest income increase in a rising interest rate environment, which tends to mitigate any declines in the market value of equity due to higher discount rates. This approach is based on our belief that in a rising interest rate environment, the market cost of equity, or implied rate at which future earnings are discounted, would also tend to rise. We refer to this position as “asset sensitive”.
Duration of equity is derived by first calculating the dollar duration of all assets, liabilities and derivative instruments. Dollar duration is determined by calculating the
59
market value of each instrument assuming interest rates sustain immediate and parallel movements up 1% and down 1%. The average of these two changes in market value is the dollar duration, which incorporates the value of embedded and explicit options within each instrument. Subtracting the dollar duration of liabilities from the dollar duration of assets and adding the net dollar duration of derivative instruments results in the dollar duration of equity. Duration of equity is computed by dividing the dollar duration of equity by the market value of equity.
Income simulation is an estimate of the net interest income that would be recognized under different rate environments. Net interest income is measured under several parallel and nonparallel interest rate environments, taking into account an estimate of the possible exercise of options within the portfolio.
Both of these measurement methods require that we assess a number of variables and make various assumptions in managing the Company’s exposure to changes in interest rates. The assessments address loan and security prepayments, early deposit withdrawals, and other imbedded options and noncontrollable events. As a result of the increased uncertainty about the maturity and repricing characteristics of both deposits and loans, the Company estimates ranges of duration and income simulation under a variety of assumptions and scenarios. The interest rate risk position is actively managed and changes frequently as the interest rate environment changes; therefore, positions at the end of any period may not be reflective of the Company’s position in any subsequent period.
At year-end 2003, the Company’s duration of equity was estimated to be within a range of negative 0.2 years and positive 2.3 years. We should note that duration of equity is highly sensitive to the assumptions used for deposits that do not have specific maturities, such as checking, savings, and money market accounts. Given the uncertainty of these durations, we view the duration of equity as falling within a range of possibilities. If interest rates were to sustain an immediate parallel increase of 200 basis points, the duration of equity would be estimated to fall within the range of 0.9 years and 3.4 years.
For income simulation, Company policy requires that net interest income be expected to decline by no more than 10% during one year if rates were to immediately rise or fall in parallel by 200 basis points. At year-end 2003, net interest income was expected to increase 0.7% if interest rates were to sustain an immediate parallel increase of 200 basis points and decline 2.8% if rates were to sustain an immediate parallel decrease of 200 basis points. It should be noted that LIBOR and U.S. Treasury rates with maturities of six months and less were below 2% at year-end 2003. In the scenario of interest rates decreasing 200 basis points, rates were not permitted to fall below 0.01%. At year-end 2002, net interest income was expected to increase 2.7% if rates were to increase in parallel 200 basis points and decline 9.0% if rates were to decrease in parallel 200 basis points. These estimates include management’s assumptions regarding loan and deposit pricing, security and loan prepayments, and changing relationships to market rates.
We attempt to control the effects that changes in interest rates will have on net interest income through the management of maturities and repricing of the Company’s assets and liabilities and also with the use of interest rate swaps. The prime lending rate and the London Interbank Offer Rate (“LIBOR”) curves are the primary indices used for pricing the Company’s loans, and the 91-day Treasury bill rate is the index used for pricing many of the Company’s deposits. The Company does not hedge the prime/LIBOR/Treasury Bill spread risk through the use of derivative instruments.
Our focus on business banking also determines the nature of the Company’s asset-liability management posture. Approximately 50% of the Company’s commercial loan and commercial real estate portfolios were floating rate and tied to either Prime or LIBOR. In addition, certain consumer loans have floating interest rates. This means that these loans reprice very quickly in response to changes in interest rates – more quickly on average than does its funding base. This posture results in a naturally “asset sensitive” position. We believe that maintaining an asset sensitive position is appropriate for a banking institution whose income is heavily dependent on the spread between interest received and interest
60
SCHEDULE 14
INTEREST RATE SWAPS (CASH FLOW AND NONHEDGE) – MATURITIES AND AVERAGE RATES
| | | | | | | | | | | | | | | |
(Amounts in millions) | | 2004
| | 2005
| | 2006
| | 2007
| | 2008
| | Thereafter
| | Total
|
Receive fixed rate/pay variable rate: | | | | | | | | | | | | | | | |
Notional amount | | $ | 176 | | 450 | | 423 | | 286 | | 854 | | – | | 2,189 |
Weighted average rate received | | | 7.10% | | 3.57 | | 4.93 | | 5.57 | | 5.95 | | – | | 5.31 |
Weighted average rate paid | | | 1.20% | | 1.19 | | 3.31 | | 3.69 | | 3.53 | | – | | 2.83 |
| | | | | | | |
Receive variable rate/pay fixed rate: | | | | | | | | | | | | | | | |
Notional amount | | $ | 225 | | 50 | | 35 | | 25 | | 75 | | – | | 410 |
Weighted average rate received | | | 1.16% | | 1.19 | | 1.19 | | 1.19 | | 1.17 | | – | | 1.17 |
Weighted average rate paid | | | 5.33% | | 1.98 | | 2.63 | | 3.15 | | 3.62 | | – | | 4.25 |
paid. This is because we believe that in a rising rate environment, the cost of equity (that is, the discount rate implicitly applied by equity investors to expected future earnings) also usually will be increasing. Thus, to stabilize the market value of the Company, we believe that an expanding interest margin in a rising rate environment is appropriate. The converse is true in a declining rate environment. However, we believe that the Company’s core banking business leads naturally to a position that is asset sensitive.
The Company attempts to mitigate this tendency toward asset sensitivity primarily through interest rate swaps. It has contracted to convert fixed-rate debt into floating-rate debt. More importantly, it engages in an ongoing program of swapping Prime-based loans for “received fixed” five year contracts. At year-end 2003 the Company had a notional amount of approximately $2.2 billion of such contracts, and throughout much of 2003 was adding an average of approximately $60 million per month. During 2004, approximately $400 million of swaps will mature, and are expected to be replaced with new swaps. However, in the present interest rate environment, the new swaps will have much lower spreads than the old, maturing swaps. As a result, for this and other reasons, the Company expects continued downward pressure on margins in 2004 unless interest rates rise above the levels of late 2003 and early 2004. These swaps also expose the Company to counter-party risk, which is a type of credit risk. The Company’s approach to managing this risk is discussed in “Credit Risk Management” on page 52.
In January 2004, the staff of FASB issued for comment a proposed interpretation of SFAS 133 that would disallow “Prime” as an acceptable index for cash flow hedges. We believe that a number of banks (including Zions), accounting firms and regulators will comment against this proposal. However, if it is issued in its current form, we would be required to significantly change the Company’s interest rate risk management practices.
Interest rate swap maturities and average rates are presented in Schedule 14. For additional information regarding derivative instruments, including fair values at December 31, 2003, refer to Notes 1 and 7 of the Notes to Consolidated Financial Statements.
MARKET RISK-FIXED INCOME
The Company engages in trading and market making of U.S. Treasury, U.S. Government Agency, municipal and corporate securities. This trading and market making exposes the Company to a risk of loss arising from adverse changes in the prices of these fixed income securities held by the Company.
At year-end 2003, the Company made a market in approximately 1,488 fixed income securities through ZFNB and its wholly-owned subsidiary, Zions Investment Securities, Inc. Seventy-six percent of all 2003 trades were executed electronically. The Company is an odd-lot securities dealer, which means that most U.S. Treasury and Government Agency trades are for less than $5 million and most corporate security trades are for less than $250,000. To see Zions’ current offerings, go towww.govrate.com.
61
The Company monitors risk in fixed income trading and market making through Value-at-Risk (“VAR”). VAR is the worst-case loss expected within a specified confidence level, based on statistical models using historical data. The models used by Zions are provided by Bloomberg, who also “back-tests” them. The confidence level used by Zions is 99%, which means that larger losses than the VAR would only be expected on 1% of trading days (or approximately 2.5 trading days per year), assuming that the Company maintained the same VAR on a daily basis. Reports of trading income and losses and VAR measurements are reviewed with the Executive Committee of ZFNB on a bi-weekly basis. The Company does not use VAR measurements to control risk for other than its market making, fixed income trading and non-hedge derivative portfolios. The following table shows the VAR statistics for the Company’s market making and trading portfolio during 2003 and 2002.
MARKET MAKING AND TRADING SUMMARY
| | | | | | | |
| (Dollar amounts in thousands) | | 2003
| | 2002
| | % Change
|
Value at Risk: | | | | | | | |
Average daily VAR | | $ | 920 | | 781 | | 17.8% |
Largest daily VAR during the year | | | 1,841 | | 1,533 | | 20.1 |
Smallest daily VAR during the year | | | 504 | | 294 | | 71.4 |
| | | |
Daily Trading Revenue: | | | | | | | |
Daily average trading revenue | | | 102 | | 100 | | 2.0% |
Largest daily trading revenue | | | 633 | | 411 | | 54.0 |
Largest daily trading loss | | | (86) | | (238) | | (63.9) |
| | | |
Number of Electronic Trades: | | | | | | | |
Average daily trade volume | | | 1,323 | | 955 | | 38.5% |
Highest daily trade volume | | | 2,082 | | 1,967 | | 5.8 |
Lowest daily trade volume | | | 715 | | 439 | | 62.9 |
| | | |
Total Annual Trades: | | | | | | | |
Total trades | | | 443,383 | | 367,933 | | 20.5% |
Total electronic trades | | | 330,785 | | 238,743 | | 38.6 |
| | |
| | | December 31, 2003
|
Electronic Market Making | | |
Number of issues: | | |
U.S. Treasury Bills, Notes and Bonds | | 169 |
U.S. Treasury Strips | | 125 |
U.S. Agency Notes and Bonds | | 177 |
U.S. Corporate Bonds | | 1,017 |
| | |
|
Total issues | | 1,488 |
| | |
|
The following graph depicts the number of days on which Zions’ trading and market making revenues fell within particular ranges:

62
MARKET RISK-EQUITY INVESTMENTS
Through its equity investment activities, the Company owns equity securities that are publicly traded and subject to fluctuations in their market prices or values. In addition, the Company owns equity securities in companies that are not publicly traded, that are accounted for under either fair value or equity methods of accounting, depending upon the Company’s ownership position and degree of involvement in influencing the investees’ affairs. In either event, the value of the Company’s investment is also subject to fluctuation. Since these market prices or values may fall below the Company’s investment costs, the Company is exposed to the possibility of loss.
The Company generally conducts minority investing in pre-public venture capital companies in which it does not have strategic involvement, through four funds collectively referred to by us as Wasatch Venture Funds (“Wasatch”). Wasatch screens investment opportunities and makes investment decisions based on its assessment of business prospects and potential returns. After an investment is made, Wasatch actively monitors the performance of the companies in which it has invested, and often has representation on the Board of Directors of the company. In the last three years, these investments have resulted in consistent losses to Zions. Net of minority interest and income tax effects, losses were $12.3 million in 2003, $11.2 million in 2002, and $20.3 million in 2001. As a result of these losses and a change in our strategy toward venture capital investing, the Company has decided to substantially reduce the level of this type of investing in the future. In addition, we do not believe that this type of investing constitutes a “core” strength of the Company. The Company’s remaining equity exposure to Wasatch, net of minority interest and Small Business Administration debt, at December 31, 2003 was approximately $38.0 million.
The Company also, from time to time, either starts and funds businesses of a strategic nature, or makes significant investments in companies of strategic interest. These investments may result in either minority or majority ownership positions, and usually give Zions or its subsidiaries board representation. These strategic investments are in companies that are financial services or financial technologies providers. Examples of these investments include ICAP and Lending Tree, which were both sold at substantial gains in 2003. Other examples include NetDeposit, Identrus, P5, and Roth Capital, which are ongoing.
LIQUIDITY RISK
OVERVIEW
Liquidity risk is the possibility that the Company’s cash flows may not be adequate to fund its ongoing operations and meet its commitments in a timely and cost-effective manner. Since liquidity risk is closely linked to both credit risk and market risk, many of the previously discussed risk control mechanisms also apply to the monitoring and management of liquidity risk. We manage the Company’s liquidity to provide adequate funds to meet its anticipated financial and contractual obligations, including withdrawals by depositors, debt service requirements and lease obligations, as well as to fund customers’ needs for credit.
Maintaining liquidity is the ultimate responsibility of ALCOM, which has established a corporate Liquidity and Funding Policy that must be adhered to by the Parent and the subsidiary banks. This policy includes guidelines by which liquidity and funding are to be managed. These guidelines address maintaining local liquidity needs, diversifying funding positions, monitoring liquidity at consolidated as well as subsidiary levels, and anticipating future funding needs. The policy also includes liquidity ratio guidelines that are used to monitor the liquidity positions of the Parent and bank subsidiaries.
Managing liquidity and funding is performed centrally by ZFNB’s Capital Markets/Investment Division under the direction of the Senior Investment Officer. The Senior Investment Officer is responsible for making any recommendations to existing funding plans, as well as to the policy guidelines. These recommendations must be submitted for approval to both ALCOM and the Company’s Board of Directors. The subsidiary banks only have authority to price deposits, borrow from their FHLB and sell/purchase Federal Funds to/from ZFNB. The banks may also make liquidity and funding recommendations to the Senior Investment Officer, but are not involved in any other funding decision processes.
63
CONTRACTUAL OBLIGATIONS
The following table summarizes the company’s contractual obligations at December 31, 2003:
| | | | | | | | | | | | | |
(Amounts in millions) | | One year or less
| | Over one year
through
three years
| | Over three years through five years
| | Over five years
| | Indeterminable maturity (1)
| | Total
|
Deposits | | $ | 2,056 | | 474 | | 204 | | 1 | | 18,162 | | 20,897 |
Commitments to extend credit | | | 4,984 | | 1,374 | | 182 | | 1,341 | | | | 7,881 |
Commitments to purchase loans | | | 50 | | | | | | | | | | 50 |
Standby letters of credit: | | | | | | | | | | | | | |
Performance | | | 65 | | 25 | | | | | | | | 90 |
Financial | | | 271 | | 36 | | 30 | | 3 | | | | 340 |
Commercial letters of credit | | | 22 | | 1 | | | | 2 | | | | 25 |
Commitments to make venture investments (2) | | | 26 | | | | | | | | | | 26 |
Commitments to securitization structure (3) | | | 4,692 | | | | | | | | | | 4,692 |
Commitments to purchase when-issued securities | | | 45 | | | | | | | | | | 45 |
Commitments to sell when-issued securities | | | (44) | | | | | | | | | | (44) |
Federal funds purchased and security repurchase agreements | | | 2,212 | | | | | | | | | | 2,212 |
Long-term debt, including capital lease obligations | | | | | 391 | | | | 1,221 | | | | 1,612 |
Operating leases, net of subleases | | | 31 | | 55 | | 46 | | 139 | | | | 271 |
| | |
|
| |
| |
| |
| |
| |
|
| | | $ | 14,410 | | 2,356 | | 462 | | 2,707 | | 18,162 | | 38,097 |
| | |
|
| |
| |
| |
| |
| |
|
| (1) | Indeterminable maturity includes noninterest-bearing demand, savings and money market, and foreign deposits. |
| (2) | Commitments to make venture investments do not have defined maturity dates. They have therefore been considered due on demand, maturing in one year or less. |
| (3) | The maximum size of the commitment to the securitization structure was $5.1 billion at December 31, 2003, maturing in September 2004. We are currently in the process of increasing the allowed size of the structure to $6.1 billion. |
In addition to the commitments specifically noted in table above, in the ordinary course of business, the Company enters into a number of contractual commitments. These include software licensing and maintenance, telecommunications services, facilities maintenance and equipment servicing, supplies purchasing, and other goods and services used in the operation of our business. Generally, these contracts are renewable or cancelable at least annually, although in some cases to secure favorable pricing concessions, the Company has committed to contracts that may extend to several years.
LIQUIDITY MANAGEMENT
Liquidity is managed centrally for both the Parent and bank subsidiaries. The Parent’s cash requirements consist primarily of debt service, operating expenses, income taxes, dividends to shareholders and share repurchases. The Parent’s cash needs are routinely met through dividends from its subsidiaries, investment income, subsidiaries’ proportionate share of current income taxes, management and other fees, unaffiliated bank lines, and debt issuances.
During 2003, the Parent received $296.9 million in dividends from various subsidiaries. At December 31, 2003, $236.8 million of dividend capacity was available for subsidiaries to pay to the Parent without having to obtain regulatory approval. The dividend capacity is dependent on the continued profitability of the subsidiary banks and no significant changes in the current regulatory environment. While we have no current expectation that these two conditions will change, should a change take place to either in the future, this source of funding to the parent may become more limited or even unavailable. See Note 21 of the Notes to
64
Consolidated Financial Statements for details of dividend capacities and limitations.
For the year 2003, issuances of long-term debt exceeded repayments, resulting in cash inflows of $893.4 million, partially offset by outflows of $364.0 million. Specific debt-related activities for 2003 are as follows:
| • | In October 2003, the Company repaid $50 million of its Senior Floating Rate Medium-Term Notes due in October 2004 and callable in 2003. |
| • | In September 2003, the Company conducted a “modified Dutch auction” tender offer in which $197.4 million of the Company’s notes due in May and October 2011 were repurchased. We chose to repurchase these notes because, under their terms, they could not be effectively swapped for floating-rate contracts, which was needed for interest rate risk management purposes. |
| • | In June 2003, the Company repaid $110 million of subordinated notes that were callable in 2003. The notes were called because based on their maturity, they would no longer have fully qualified as Tier 2 capital. |
| • | During the third quarter of 2002, the Company filed a shelf registration statement with the Securities and Exchange Commission for the issuance of up to $340 million of Senior Medium-Term Notes, Series A and Subordinated Medium-Term Notes, Series B. As of December 31, 2003 the Company had outstanding $240 million of Senior Medium-Term Notes under this registration statement. During the third quarter of 2003, the Company filed an additional registration statement increasing its aggregate capacity to $1,050 million of senior or subordinated debt securities at fixed or floating rates. In September 2003, the Company issued $500 million of 6.00% fixed rate Subordinated Notes due in September 2015 under this registration statement. The notes are not redeemable prior to maturity and require semi-annual interest payments and qualify as Tier 2 capital. The Company subsequently hedged these notes with LIBOR-based floating interest rate swaps. In November 2003, the Company issued under this registration statement an additional $150 million of 2.70% fixed rate Senior Notes due in May 2006. These notes were also hedged with LIBOR-based floating interest rate swaps. See Note 14 of the Notes to Consolidated Financial Statements for a complete summary of the Company’s long-term borrowings. |
The Parent also has a program to issue short-term commercial paper as a source of funding. At December 31, 2003, outstanding commercial paper was $126.1 million. In addition, at December 31, 2003, the Parent had a revolving credit facility with a bank totaling $40 million, which was unused at year-end 2003. On a consolidated basis, short-term borrowings added an additional $624.7 million to cash flows for 2003, net of repayments.
Access to funding markets for the Parent and subsidiary banks is directly tied to the credit ratings that they receive from various rating agencies. The ratings not only influence the costs associated with the borrowings but can also influence the sources of the borrowings. The Parent had the following ratings as of December 31, 2003:
| | | | | | | | |
Rating agency | | Outlook
| | Long-term issuer/ senior debt rating
| | Subordinated
debt rating
| | Short-term/ commercial
paper rating
|
S&P | | Positive | | BBB | | BBB- | | A-2 |
Moody’s | | Stable | | A3 | | Baa1 | | Not Rated |
Fitch | | Stable | | A- | | BBB+ | | F1 |
Any downgrade in these ratings could negatively impact the Parent’s ability to borrow, including higher costs of funds and access to fewer funding sources.
The subsidiaries’ primary source of liquidity is their core deposits, consisting of demand, savings and money market deposits, time deposits under $100,000 and foreign deposits. At December 31, 2003, these core deposits, in aggregate, constituted 94.1% of consolidated deposits, compared with 93.0% of consolidated deposits at December 31, 2002. For 2003, deposit increases resulted in net cash inflows of $763.6 million. We believe that the growth that we have experienced
65
in this funding source may decline during 2004 as a result of anticipated reductions in deposit account balances, and may need to be replaced with alternative, and more expensive, sources such as Federal Funds and other borrowings.
The FHLB system is also a major source of liquidity for each of the Company’s subsidiary banks. ZFNB and Commerce are members of the FHLB of Seattle. CB&T, NSB, and NBA are members of the FHLB of San Francisco. Vectra is a member of the FHLB of Topeka. The FHLB allows member banks to borrow against their eligible loans to satisfy liquidity requirements. During 2003, the subsidiary banks increased their funding from other sources and reduced their borrowings from the FHLB. For the year, repayments exceeded borrowings by $0.8 million. Borrowings from the FHLB may increase in the future, depending on availability of funding from other sources such as deposits. However, the subsidiary banks must maintain their FHLB memberships to continue accessing this source of funding.
As explained earlier, the Company uses asset securitizations to sell loans, which also provide an alternative source of funding for the subsidiaries and enhance the flexibility in meeting funding needs. During 2003, loan sales (other than loans held for sale) provided $1,116 million in cash inflows and we expect that securitizations will continue to be a tool that we are able to use for liquidity management purposes.
At year-end 2003, the Company managed approximately $2.8 billion of securitized assets that were originated by its subsidiary banks. Of these, approximately $1.5 billion were insured by a third party and held in Lockhart Funding, LLC, which is an important source of funding for the Company’s loans. ZFNB provides a Liquidity Facility for a fee to Lockhart, which purchases floating-rate U.S. Government and AAA-rated securities with funds from the issuance of commercial paper. Pursuant to the Liquidity Facility, ZFNB is required to purchase securities from Lockhart to provide funds for it to repay maturing commercial paper upon its inability to access the commercial paper market, or upon a commercial paper market disruption, as specified in the governing documents of Lockhart. At any given time, the maximum commitment of ZFNB is the lesser of the size of the liquidity facility commitment or the market value of Lockhart’s securities portfolio. At December 31, 2003, the market value of Lockhart’s securities portfolio was $4.7 billion. No amounts were outstanding under this liquidity facility at either December 31, 2003 or 2002. Lockhart is currently limited in size by agreements with rating agencies and by a $5.1 billion back-up liquidity facility from ZFNB. We are currently in the process of increasing the allowed size of Lockhart to $6.1 billion. In addition, we are in the process of restructuring Lockhart so that it will not be consolidated onto Zions Bancorporation’s balance sheet under FIN 46. While the Company believes that this can be done in a way that preserves most of the economic benefits of Lockhart, the FIN 46 rules are not yet final and, therefore, this cannot be assured at this time. Further discussion of Lockhart can be found in the section entitled “Off Balance Sheet Arrangements” on page 52 and in Note 6 of the Notes to Consolidated Financial Statements.
While not considered a primary source of funding, the Company’s investment activities can also provide or use cash, depending on the asset-liability management posture that is being observed. For 2003, investment securities activities resulted in an increase in investment securities holdings and a net use of cash in the amount of $1,141 million.
Maturing balances in the various loan portfolios also provide additional flexibility in managing cash flows. In most cases, however, loan growth has resulted in net cash outflows from a funding standpoint. For 2003, loan growth resulted in a net cash outflow of $2,180 million. While loan growth has been modest over the past two years, we expect that loans will continue to be a use of funding rather than a source.
CAPITAL MANAGEMENT
The Company’s basic financial objective is to consistently produce superior risk-adjusted returns on its shareholders’ capital. We believe that a strong capital position is vital to continued profitability and to promoting depositor and investor confidence. Our goal is to steadily achieve a high return on shareholders’ equi-
66
ty, while at the same time maintaining “risk-based capital” above the “well capitalized” threshold, as defined by federal banking regulators. Specifically, it is the goal of Zions Bancorporation and each of the subsidiary banks to:
| • | Maintain sufficient capital, at not less than the “well capitalized” threshold, to support current needs and to ensure that capital is available to support anticipated growth; |
| • | Consider the desirability of receiving an “investment grade” rating from major debt rating agencies on senior and subordinated unsecured debt when setting capital levels; |
| • | Return excess capital to shareholders through dividends and repurchases of common stock. |
See Note 21 of the Notes to Consolidated Financial Statements for additional information on risk-based capital.
Total shareholders’ equity at December 31, 2003 was $2,540 million, an increase of 7.0% over $2,374 million at December 31, 2002. The Company’s capital ratios were as follows at December 31, 2003 and 2002:
| | | | |
| | | December 31,
|
| | | 2003
| | 2002
|
Tangible common equity ratio | | 6.53% | | 6.06% |
Average common equity to average assets | | 8.75 | | 8.90 |
Risk-based capital ratios: | | | | |
Tier 1 leverage | | 8.06 | | 7.56 |
Tier 1 risk-based capital | | 9.42 | | 9.26 |
Total risk-based capital | | 13.52 | | 12.94 |
The increase in the tangible common equity and risk-based capital ratios for 2003 was primarily the result of earnings for 2003, as well as the net increase in qualifying subordinated debt for total risk-based capital. As discussed earlier in the Executive Summary, the Company’s capital ratios generally have increased steadily over the past five years. However, the Company believes that current capital levels are reasonable and no further material increases are anticipated at this time.
The Company repurchased and retired 2,083,101 shares of its common stock at a total cost of $106.8 million in 2003, 2,393,881 shares at a cost of $113.2 million in 2002, and 883,240 shares at a cost of $46.5 million in 2001. At December 31, 2003, the Company had authorization to repurchase an additional $20.4 million of common stock under its share repurchase program. During its January 2004 meeting, the Board of Directors replaced the then existing repurchase program with a new one authorizing the repurchase of up to $50 million of the Company’s common stock.
Prior to the enactment of federal tax law changes early in 2003, capital gains tax rates were significantly lower than tax rates on ordinary income, including dividend income. As a consequence, the Company historically has maintained a lower dividend pay-out ratio, and returned more capital to shareholders in the form of share repurchases. However, in 2003 tax rates on both capital gains and dividends were reduced and equalized. Consequently, in the third quarter of 2003, the Company increased its quarterly per share dividend 43% from $0.21 per share to the current rate of $0.30 per share. Further adjustments to either or both the dividend level and share repurchase level will be contemplated if the Company continues to generate capital through earnings at a rate faster than its ability to profitably deploy it.
The U.S. federal bank regulatory agencies’ risk-capital guidelines are based upon the 1988 capital accord of the Basel Committee on Banking Supervision (the “BIS”). The BIS is a committee of central banks and bank supervisors/regulators from the major industrialized countries that develops broad policy guidelines that each country’s supervisors can use to determine the supervisory policies they apply. In January 2001, the BIS released a proposal to replace the 1988 accord with a new capital accord that would set capital requirements for operational risk and materially change the existing capital requirements for credit risk and market risk exposures. Operational risk is defined by the proposal to mean the risk of direct or indirect loss resulting from inadequate or failed internal processes, people and systems or from external events. The 1988 accord does not include separate capital requirements for operational risk.
67
The BIS has stated that its objective is to finalize a new capital accord for implementation by the member countries at year-end 2006. Since the accord is not yet final, the ultimate timing for implementation and the specifics of capital assessments for addressing operational risk are still uncertain. However, the Company expects that a new capital accord will eventually be adopted by the BIS and implemented by the U.S. federal bank regulatory agencies. The Company is evaluating what effect the new capital requirements that may arise out of a new BIS capital accord may have on its minimum capital requirements. U. S. banking regulators have stated that the approximately ten largest U.S. bank holding companies will be required to adopt the new standard, and that others may “opt in”. The Company does not currently expect to be an early “opt in” bank and does not have in place the data collection and analytical capabilities necessary to adopt Basel II. However, it believes that competitive advantages afforded to banks that do adopt may make it necessary for the Company to adopt the new Basel II approach at some point, and it is currently investing in the required capabilities.
CRITICAL ACCOUNTING POLICIES AND SIGNIFICANT ESTIMATES
The Notes to Consolidated Financial Statements contain a summary of the Company’s significant accounting policies, including discussions on recently issued accounting pronouncements, the Company’s adoption of them and the related impact of their adoption. We believe that certain of these policies, along with the various estimates that we are required to make in recording the financial transactions of the Company, are important to have a complete picture of the Company’s financial condition. In addition, these estimates require us to make complex and subjective judgments, many of which include matters with a high degree of uncertainty. The following is a discussion of these critical accounting policies and significant estimates. We have also discussed each of these accounting policies and the related estimates with the Audit Committee of the Board of Directors. Additional information about these policies can be found in Note 1 of the Notes to Consolidated Financial Statements.
SECURITIZATION TRANSACTIONS
Securitization transactions involve periodic transfers of loans or other receivables to off-balance sheet Qualified Special Purpose Entities (“QSPEs”). The Company may retain a cash reserve account, an interest-only strip, or in some cases a subordinated tranche, all of which are considered to be retained interests in the securitized assets. Quoted market prices are generally not available to value the retained interests. As a result, we estimate the value of the retained interests based on the present value of future cash flows. The estimation of the value of the retained interests requires the Company to make assumptions that include:
| • | the anticipated method of prepayment; |
| • | the annualized prepayment speed; |
| • | the weighted average life of the loans in the securitization; |
| • | the expected annual net credit loss rate; and |
| • | the discount rate for residual cash flows. |
In addition to valuing the retained interests, a determination must be made as to whether the transfer of the assets constitutes a sale under generally accepted accounting principles. If it does, the assets are removed from the Company’s Consolidated Balance Sheet with a gain or loss recognized. Otherwise, the transfer is considered a financing resulting in the recording of a liability on the Consolidated Balance Sheet. All of the Company’s securitizations have been structured to meet the existing criteria for sale treatment.
Another determination that must be made is whether the special purpose entity should be considered a subsidiary of the Company and, as a result, included in its consolidated financial statements. If the entity’s activities meet certain criteria, no consolidation is required. Since all of the Company’s securitizations are considered to be QSPEs, they have met the criteria for non-consolidation.
See Schedule 9 on page 50 for details of amounts being serviced. Also see Notes 1 and 6 of the Notes to Consolidated Financial Statements for specific information regarding the Company’s policies on valuation and impairment assessments on asset securitizations, detail on the assumptions used and the sensitivity of the fair value of retained interests to adverse changes in the assumptions.
68
ALLOWANCE FOR LOAN LOSSES
The allowance for loan losses represents our estimate of the losses that are inherent in the loan and lease portfolios. In determining the appropriate level of the allowance, we are required to make numerous estimates. Volumes and trends of delinquencies, levels of nonaccruals, repossessions and bankruptcies, trends in criticized and classified loans, current and anticipated foreclosure losses, new products and policies, economic conditions and trends, concentrations of credit risk and experience and abilities of lending personnel are all part of making this determination. Changes in any of these estimates could have a direct impact on the allowance.
When we perform our review of the allowance, we generally arrive at a range that the allowance should fall within. This range results from equally likely scenarios being considered in our evaluations. As of December 31, 2003, our analyses indicated a range for the allowance of between $209.4 million and $279.7 million. The allowance for loan losses at December 31, 2003 was $268.5 million, which is near the upper end of the range. We believe that this level is appropriate in light of the uncertainties in the economic environment.
For more information on the methodology used by the Company to determine the allowance for loan losses, a discussion of risks associated with the process, and additional information regarding the allowance and associated provision, see “Credit Risk Management” on page 52 and Notes 1 and 5 of the Notes to Consolidated Financial Statements.
NONMARKETABLE SECURITIES
The Company, both directly and through its banking subsidiaries and SBICs, has investments in venture capital securities. Since these nonmarketable venture capital securities have no readily ascertainable fair values, they are reported at amounts that we consider to be their estimated fair values. In determining the fair values of each investment, we believe that the investment’s cost is initially the best indication of estimated fair value, provided that there have been no significant positive or negative developments subsequent to their acquisition that indicate the necessity of an adjustment to the fair value estimate. If and when such an event takes place, we adjust the investment’s cost by an amount that we believe reflects the nature of the event. In addition, any minority interests in the SBICs would reduce the Company’s share of any gains or losses incurred on these investments.
As of December 31, 2003, the Company’s equity exposure to the SBIC investments, net of minority interest and Small Business Administration debt, was approximately $38.0 million. In addition, exposure to non-SBIC investments was approximately $18.9 million.
The values that we have assigned to these securities where no market quotations exist are based upon available information and may not necessarily represent amounts that will ultimately be realized. Although we believe our estimates reasonably reflect the fair value of these securities, key assumptions regarding the projected financial performance of these companies, the evaluation of the investee company’s management team, and other economic and market factors may not necessarily reflect those of an active market for these investments. If there had been an active market for these securities at year-end, the carrying value may have been significantly different than the amounts reported. See Note 1 of the Notes to Consolidated Financial Statements for additional information regarding these investments.
ACCOUNTING FOR GOODWILL
With the adoption of SFAS 142, we perform an annual impairment test of the Company’s carrying value of goodwill. The first step in this process is to identify if a potential impairment exists and, if required from the results of this step, the second step measures the amount of any impairment loss. The computations required by step 1 and step 2 call for us to make a number of estimates and assumptions. In completing step 1, we determine the fair value of the reporting unit that is being evaluated, which includes projecting cash flows into the future and estimating a market value of the unit. Step 2 requires us to estimate the “implied fair value” of the reporting unit, which in essence, estimates the fair value of its individual assets and liabilities. Since estimates are an integral part of the impairment computations, changes in these estimates could have a
69
significant impact on any calculated impairment amount. See Notes 1 and 10 of the Notes to Consolidated Financial Statements for more details on the accounting for goodwill and other intangibles.
During 2003, approximately $75.6 million in impairment losses were recorded relating to the goodwill associated with Vectra. In determining the fair value of Vectra, with the assistance of an independent valuation consultant, we considered value based on comparable publicly traded banks and comparable bank acquisitions (both in the western states) and discounted present value of management’s estimates of future earnings. Critical assumptions included:
| • | Selection of the comparable publicly traded companies, based on location, size and business composition; |
| • | Selection of the comparable bank acquisition transactions, based on location, size, business composition and date of the transaction; |
| • | The discount rate applied to future earnings, based on an estimate of the cost of capital; |
| • | Various assumptions made by management about the potential future earnings of Vectra; |
| • | The relative weight given to the valuations derived by the three methods described. |
In addition, in determining the impairment, an estimate had to be made of the fair market value of all of the tangible assets, identifiable intangible assets and liabilities of Vectra. Loans and deposits were marked-to-market using the standard software and assumptions used by Zions in its interest rate risk management processes. Larger occupied properties were appraised, while for smaller properties and furniture, fixtures and equipment, it was assumed that depreciated book value approximated fair market value.
ACCOUNTING FOR DERIVATIVES
We consider it prudent to use certain derivative instruments to add stability to the Company’s interest income and expense, to modify the duration of specific assets and liabilities, and to manage the Company’s exposure to interest rate movements. We do not, however, participate in speculative derivatives trading. We make estimates of the fair value of these derivative instruments and generally use a methodology that is currently standard in the marketplace of netting discounted future cash receipts and cash payments. The estimated values of these derivatives will typically change over time as cash is received and cash is paid and also as market conditions change. As these changes take place, they may have a positive or negative impact on our estimated valuations.
We also face the risk that certain derivative instruments that we have designated as hedges and currently meet the strict hedge accounting requirements of SFAS 133, may not qualify in the future as “highly effective”, as defined by the Statement. In addition, the instruments may not meet the additional requirements of SFAS 133 to be accounted for as hedges. Further, new interpretations and guidance related to SFAS 133 continue to be issued and we cannot predict the possible impact that they will have on our use of derivative instruments in the future. See “Interest Rate and Market Risk Management” on page 59 and Notes 1 and 7 of the Notes to Consolidated Financial Statements for further information about the Company’s derivatives.
FORWARD-LOOKING INFORMATION
Statements in Management’s Discussion and Analysis that are based on other than historical data are forward-looking, within the meaning of the Private Securities Litigation Reform Act of 1995. Forward-looking statements provide current expectations or forecasts of future events, including, among others:
| • | Statements with respect to the Company’s beliefs, plans, objectives, goals, guidelines, expectations, anticipations, and future financial condition, results of operations and performance; |
| • | Statements concerning the projected growth of the population of the states in which the Company has operations, higher rates of business formation and growth and commercial real estate resulting from the projected populations growth, growth in our loan portfolio and the economic recovery in general; and |
70
| • | Statements preceded by, followed by or that include the words “may”, “could”, “should”, “would”, “believe”, “anticipate”, “estimate”, “expect”, “intend”, “plan”, or “projects” or similar expressions. |
These forward-looking statements are not guarantees of future performance, nor should they be relied upon as representing management’s views as of any subsequent date. Forward-looking statements involve significant risks and uncertainties and actual results may differ materially from those presented, either expressed or implied, in Management’s Discussion and Analysis. Factors that might cause such differences include, but are not limited to:
| • | the Company’s ability to successfully execute its business plans; |
| • | changes in population growth or reductions in the rates at which different populations are expected to grow; |
| • | changes in general economic and financial market conditions, either nationally or locally in areas in which the Company conducts its operations, including without limitation, reduced rates of business formation and growth and commercial real estate development; |
| • | changes in interest rates; |
| • | the timing of closing proposed acquisitions or divestitures being delayed or such acquisitions being prohibited; |
| • | losses, customer bankruptcies, claims and assessments; |
| • | continuing consolidation in the financial services industry; |
| • | new litigation or changes in existing litigation; |
| • | increased competitive pressures among financial institutions; |
| • | political developments, war or other hostilities or acts of terrorism; |
| • | legislation or regulatory changes which adversely affect the Company’s operations or business; and |
| • | changes in accounting policies or procedures as may be required by the Financial Accounting Standards Board or other regulatory agencies. |
The Company specifically disclaims any obligation to update any factors or to publicly announce the result of revisions to any of the forward-looking statements included herein to reflect future events or developments.
CONSOLIDATED CONDENSED STATEMENTS OF INCOME
| | | | | | | | | | | |
| (Amounts in millions) | | 2003
| | 2002
| | 2001
| | 2000
| | 1999
|
Net interest income | | $ | 1,095.5 | | 1,035.1 | | 949.8 | | 803.4 | | 741.5 |
Noninterest income | | | 490.1 | | 376.8 | | 412.2 | | 192.6 | | 266.8 |
| | |
|
| |
| |
| |
| |
|
Total revenue | | | 1,585.6 | | 1,411.9 | | 1,362.0 | | 996.0 | | 1,008.3 |
Provision for loan losses | | | 69.9 | | 71.9 | | 73.2 | | 31.8 | | 18.0 |
Noninterest expense | | | 893.9 | | 858.9 | | 836.1 | | 721.3 | | 681.8 |
Impairment loss on goodwill | | | 75.6 | | – | | – | | – | | – |
| | |
|
| |
| |
| |
| |
|
Income from continuing operations before income taxes and minority interest | | | 546.2 | | 481.1 | | 452.7 | | 242.9 | | 308.5 |
Income taxes | | | 213.8 | | 167.7 | | 161.9 | | 79.7 | | 109.5 |
Minority interest | | | (7.2) | | (3.7) | | (7.8) | | 1.5 | | 4.9 |
| | |
|
| |
| |
| |
| |
|
Income from continuing operations | | | 339.6 | | 317.1 | | 298.6 | | 161.7 | | 194.1 |
Loss on discontinued operations | | | (1.8) | | (28.4) | | (8.4) | | – | | – |
| | |
|
| |
| |
| |
| |
|
Income before cumulative effect adjustment | | | 337.8 | | 288.7 | | 290.2 | | 161.7 | | 194.1 |
Cumulative effect adjustment | | | – | | (32.4) | | (7.2) | | – | | – |
| | |
|
| |
| |
| |
| |
|
Net income | | $ | 337.8 | | 256.3 | | 283.0 | | 161.7 | | 194.1 |
| | |
|
| |
| |
| |
| |
|
Net income per share (diluted) | | $ | 3.72 | | 2.78 | | 3.07 | | 1.86 | | 2.26 |
| | |
|
| |
| |
| |
| |
|
71
REPORT OF INDEPENDENT AUDITORS
The Board of Directors and Shareholders of Zions Bancorporation
We have audited the accompanying consolidated balance sheets of Zions Bancorporation and subsidiaries as of December 31, 2003 and 2002, and the related consolidated statements of income, changes in shareholders’ equity and comprehensive income, and cash flows for each of the three years in the period ended December 31, 2003. These financial statements are the responsibility of the Company’s management. Our responsibility is to express an opinion on these financial statements based on our audits.
We conducted our audits in accordance with auditing standards generally accepted in the United States. Those standards require that we plan and perform the audit to obtain reasonable assurance about whether the financial statements are free of material misstatement. An audit includes examining, on a test basis, evidence supporting the amounts and disclosures in the financial statements. An audit also includes assessing the accounting principles used and significant estimates made by management, as well as evaluating the overall financial statement presentation. We believe that our audits provide a reasonable basis for our opinion.
In our opinion, the financial statements referred to above present fairly, in all material respects, the consolidated financial position of Zions Bancorporation and subsidiaries at December 31, 2003 and 2002, and the consolidated results of their operations and their cash flows for each of the three years in the period ended December 31, 2003, in conformity with accounting principles generally accepted in the United States.
As discussed in Notes 1 and 10 to the financial statements, effective January 1, 2002, Zions Bancorporation and subsidiaries adopted Statement of Financial Accounting Standards No. 142,Goodwill and Other Intangible Assets.

Salt Lake City, Utah
January 27, 2004
72
ZIONS BANCORPORATION AND SUBSIDIARIES
CONSOLIDATED BALANCE SHEETS
DECEMBER 31, 2003 AND 2002
| | | | | |
| (In thousands, except share amounts) | | 2003
| | 2002
|
ASSETS | | | | | |
Cash and due from banks | | $ | 1,119,351 | | 1,087,296 |
Money market investments: | | | | | |
Interest-bearing deposits | | | 884 | | 1,690 |
Federal funds sold | | | 54,850 | | 96,077 |
Security resell agreements | | | 512,960 | | 444,995 |
Investment securities: | | | | | |
Available for sale, at market | | | 4,437,793 | | 3,304,341 |
Trading account, at market (includes $211,943 and $110,886 transferred as collateral under repurchase agreements) | | | 380,224 | | 331,610 |
| | |
|
| |
|
| | | | 4,818,017 | | 3,635,951 |
Loans: | | | | | |
Loans held for sale | | | 176,886 | | 289,499 |
Loans, leases and other receivables | | | 19,839,755 | | 18,843,006 |
| | |
|
| |
|
| | | | 20,016,641 | | 19,132,505 |
Less: | | | | | |
Unearned income and fees, net of related costs | | | 96,280 | | 92,662 |
Allowance for loan losses | | | 268,506 | | 279,593 |
| | |
|
| |
|
Net loans | | | 19,651,855 | | 18,760,250 |
Other noninterest bearing investments | | | 584,377 | | 601,641 |
Premises and equipment, net | | | 407,825 | | 393,630 |
Goodwill | | | 654,152 | | 730,031 |
Core deposit and other intangibles | | | 68,747 | | 82,920 |
Other real estate owned | | | 18,596 | | 31,608 |
Other assets | | | 666,624 | | 699,600 |
| | |
|
| |
|
| | | $ | 28,558,238 | | 26,565,689 |
| | |
|
| |
|
LIABILITIES AND SHAREHOLDERS’ EQUITY | | | | | |
Deposits: | | | | | |
Noninterest-bearing demand | | $ | 5,882,929 | | 5,117,458 |
Interest-bearing: | | | | | |
Savings and money market | | | 12,044,499 | | 11,654,258 |
Time under $100,000 | | | 1,507,628 | | 1,766,844 |
Time $100,000 and over | | | 1,227,113 | | 1,402,189 |
Foreign | | | 234,526 | | 191,231 |
| | |
|
| |
|
| | | | 20,896,695 | | 20,131,980 |
Securities sold, not yet purchased | | | 263,379 | | 203,838 |
Federal funds purchased | | | 1,370,619 | | 819,807 |
Security repurchase agreements | | | 841,170 | | 861,177 |
Other liabilities | | | 442,020 | | 535,044 |
Commercial paper | | | 126,144 | | 291,566 |
Federal Home Loan Bank advances and other borrowings: | | | | | |
One year or less | | | 215,354 | | 15,554 |
Over one year | | | 231,440 | | 240,698 |
Long-term debt | | | 1,611,618 | | 1,069,505 |
| | |
|
| |
|
Total liabilities | | | 25,998,439 | | 24,169,169 |
| | |
|
| |
|
Minority interest | | | 19,776 | | 22,677 |
Shareholders’ equity: | | | | | |
Capital stock: | | | | | |
Preferred stock, without par value; authorized 3,000,000 shares; issued and outstanding, none | | | – | | – |
Common stock, without par value; authorized 350,000,000 shares; issued and outstanding 89,840,638 and 90,717,692 shares | | | 985,904 | | 1,034,888 |
Retained earnings | | | 1,538,677 | | 1,292,741 |
Accumulated other comprehensive income | | | 19,041 | | 46,214 |
Shares held in trust for deferred compensation, at cost | | | (3,599) | | – |
| | |
|
| |
|
Total shareholders’ equity | | | 2,540,023 | | 2,373,843 |
| | |
|
| |
|
| | | $ | 28,558,238 | | 26,565,689 |
| | |
|
| |
|
See accompanying notes to consolidated financial statements.
73
ZIONS BANCORPORATION AND SUBSIDIARIES
CONSOLIDATED STATEMENTS OF INCOME
YEARS ENDED DECEMBER 31, 2003, 2002 AND 2001
| | | | | | | |
(In thousands, except per share amounts) | | 2003
| | 2002
| | 2001
|
Interest income: | | | | | | | |
Interest and fees on loans | | $ | 1,178,767 | | 1,227,358 | | 1,292,955 |
Interest on loans held for sale | | | 8,280 | | 9,437 | | 13,080 |
Lease financing | | | 18,893 | | 20,589 | | 22,805 |
Interest on money market investments | | | 13,011 | | 18,625 | | 34,879 |
Interest on securities: | | | | | | | |
Held to maturity – taxable | | | – | | 2,292 | | 3,361 |
Available for sale – taxable | | | 126,592 | | 128,622 | | 169,224 |
Available for sale – nontaxable | | | 29,205 | | 26,889 | | 24,713 |
Trading account | | | 24,640 | | 22,107 | | 30,903 |
| | |
|
| |
| |
|
Total interest income | | | 1,399,388 | | 1,455,919 | | 1,591,920 |
| | |
|
| |
| |
|
Interest expense: | | | | | | | |
Interest on savings and money market deposits | | | 111,616 | | 164,594 | | 251,570 |
Interest on time and foreign deposits | | | 71,875 | | 114,128 | | 187,712 |
Interest on borrowed funds | | | 120,403 | | 142,055 | | 202,874 |
| | |
|
| |
| |
|
Total interest expense | | | 303,894 | | 420,777 | | 642,156 |
| | |
|
| |
| |
|
Net interest income | | | 1,095,494 | | 1,035,142 | | 949,764 |
Provision for loan losses | | | 69,940 | | 71,879 | | 73,191 |
| | |
|
| |
| |
|
Net interest income after provision for loan losses | | | 1,025,554 | | 963,263 | | 876,573 |
| | |
|
| |
| |
|
Noninterest income: | | | | | | | |
Service charges and fees on deposit accounts | | | 129,846 | | 118,994 | | 101,033 |
Loan sales and servicing income | | | 85,081 | | 70,153 | | 96,754 |
Other service charges, commissions and fees | | | 88,919 | | 81,175 | | 72,996 |
Trust and investment management income | | | 21,057 | | 18,479 | | 18,298 |
Income from securities conduit | | | 29,421 | | 20,317 | | 12,262 |
Dividends and other investment income | | | 28,508 | | 35,469 | | 28,299 |
Market making, trading and nonhedge derivative income | | | 29,358 | | 39,029 | | 34,136 |
Equity securities gains (losses), net | | | 63,807 | | (25,316) | | 37,239 |
Fixed income securities gains (losses), net | | | (17) | | 358 | | (3,781) |
Other | | | 14,115 | | 18,156 | | 14,952 |
| | |
|
| |
| |
|
Total noninterest income | | | 490,095 | | 376,814 | | 412,188 |
| | |
|
| |
| |
|
Noninterest expense: | | | | | | | |
Salaries and employee benefits | | | 491,563 | | 478,028 | | 432,937 |
Occupancy, net | | | 70,986 | | 68,627 | | 63,600 |
Furniture and equipment | | | 65,462 | | 63,429 | | 60,830 |
Legal and professional services | | | 26,039 | | 25,347 | | 30,532 |
Postage and supplies | | | 25,805 | | 27,582 | | 27,753 |
Advertising | | | 18,212 | | 20,577 | | 22,344 |
Debt extinguishment cost | | | 24,210 | | – | | – |
Impairment losses on long-lived assets | | | 2,652 | | 4,942 | | – |
Restructuring charges | | | 1,872 | | 3,349 | | – |
Merger related expense | | | – | | – | | 7,348 |
Amortization of core deposit and other intangibles | | | 14,190 | | 13,379 | | 12,770 |
Amortization of goodwill | | | – | | – | | 31,526 |
Other | | | 152,871 | | 153,668 | | 146,453 |
| | |
|
| |
| |
|
Total noninterest expense | | | 893,862 | | 858,928 | | 836,093 |
| | |
|
| |
| |
|
Impairment loss on goodwill | | | 75,628 | | – | | – |
| | |
|
| |
| |
|
Income from continuing operations before income taxes and minority interest | | | 546,159 | | 481,149 | | 452,668 |
Income taxes | | | 213,751 | | 167,702 | | 161,867 |
Minority interest | | | (7,185) | | (3,660) | | (7,798) |
| | |
|
| |
| |
|
Income from continuing operations | | | 339,593 | | 317,107 | | 298,599 |
| | |
|
| |
| |
|
74
ZIONS BANCORPORATION AND SUBSIDIARIES
CONSOLIDATED STATEMENTS OF INCOME (CONTINUED)
YEARS ENDED DECEMBER 31, 2003, 2002 AND 2001
| | | | | | | |
(In thousands, except per share amounts) | | 2003
| | 2002
| | 2001
|
Discontinued operations: | | | | | | | |
Loss from operations of discontinued subsidiaries | | $ | (466) | | (18,304) | | (12,487) |
Impairment losses and loss on sale | | | (2,407) | | (28,691) | | – |
Income tax benefit | | | (1,103) | | (18,535) | | (4,067) |
| | |
|
| |
| |
|
Loss on discontinued operations | | | (1,770) | | (28,460) | | (8,420) |
| | |
|
| |
| |
|
Income before cumulative effect of change in accounting principle | | | 337,823 | | 288,647 | | 290,179 |
Cumulative effect of change in accounting principle, net of tax | | | – | | (32,369) | | (7,159) |
| | |
|
| |
| |
|
Net income | | $ | 337,823 | | 256,278 | | 283,020 |
| | |
|
| |
| |
|
Weighted average shares outstanding during the year: | | | | | | | |
Basic shares | | | 90,048 | | 91,566 | | 91,202 |
Diluted shares | | | 90,734 | | 92,079 | | 92,174 |
Net income per common share: | | | | | | | |
Basic: | | | | | | | |
Income from continuing operations | | $ | 3.77 | | 3.46 | | 3.27 |
Loss on discontinued operations | | | (0.02) | | (0.31) | | (0.09) |
Cumulative effect of change in accounting principle | | | – | | (0.35) | | (0.08) |
| | |
|
| |
| |
|
Net income | | $ | 3.75 | | 2.80 | | 3.10 |
| | |
|
| |
| |
|
Diluted: | | | | | | | |
Income from continuing operations | | $ | 3.74 | | 3.44 | | 3.24 |
Loss on discontinued operations | | | (0.02) | | (0.31) | | (0.09) |
Cumulative effect of change in accounting principle | | | – | | (0.35) | | (0.08) |
| | |
|
| |
| |
|
Net income | | $ | 3.72 | | 2.78 | | 3.07 |
| | |
|
| |
| |
|
See accompanying notes to consolidated financial statements.
75
ZIONS BANCORPORATION AND SUBSIDIARIES
CONSOLIDATED STATEMENTS OF CHANGES IN SHAREHOLDERS’ EQUITY AND
COMPREHENSIVE INCOME
YEARS ENDED DECEMBER 31, 2003, 2002 AND 2001
| | | | | | | | | | | | | | | | | | | |
| | | | | | | | | Accumulated other comprehensive income (loss)
| | | | |
| | | | | | | Retained
earnings
| | Net unrealized
gains
(losses) on investments
and
retained
interests
| | Net
unrealized
gains (losses) on derivative
instruments
| | Minimum
pension
liability
| | Subtotal
| | Shares held in trust for deferred
compensation
| | Total
shareholders’
equity
|
| | | | | | | | | | | | |
| | | | | | | | | | | | |
| | | | | | | | | | | | |
| | | | | | | | | | | | |
(In thousands, except share amounts) | | Common stock
| | | | | | | |
| | Shares
| | Amount
| | | | | | | |
Balance, December 31, 2000 | | 87,100,188 | | $ | 907,604 | | 874,884 | | (3,644) | | – | | – | | (3,644) | | – | | 1,778,844 |
Comprehensive income: | | | | | | | | | | | | | | | | | | | |
Net income | | | | | | | 283,020 | | | | | | | | | | | | 283,020 |
Other comprehensive income, net of tax: | | | | | | | | | | | | | | | | | | | |
Net realized and unrealized holding gains during the year, net of income tax expense of $20,859 | | | | | | | | | 33,675 | | – | | – | | 33,675 | | | | |
Reclassification for net realized gains recorded in operations, net of income tax expense of $7,132 | | | | | | | | | (11,516) | | – | | – | | (11,516) | | | | |
Net unrealized gains on derivative instruments, net of reclassification to operations of $20,757 and income tax expense of $4,281 | | | | | | | | | – | | 6,911 | | – | | 6,911 | | | | |
Cumulative effect of change in accounting principle, adoption of SFAS 133, net of income tax expense of $21,245 | | | | | | | | | 13,259 | | 21,266 | | – | | 34,525 | | | | |
| | | | | | | | | |
| |
| |
| |
| | | | |
Other comprehensive income | | | | | | | | | 35,418 | | 28,177 | | – | | 63,595 | | | | 63,595 |
| | | | | | | | | | | | | | | | | | | |
|
Total comprehensive income | | | | | | | | | | | | | | | | | | | 346,615 |
Stock redeemed and retired | | (883,240) | | | (46,462) | | | | | | | | | | | | | | (46,462) |
Stock options exercised, net of shares tendered and retired | | 586,916 | | | 18,777 | | | | | | | | | | | | | | 18,777 |
Issuance of common shares for acquisitions | | 5,404,872 | | | 231,295 | | 25,699 | | | | | | | | | | | | 256,994 |
Cash dividends – common, $.80 per share | | | | | | | (73,899) | | | | | | | | | | | | (73,899) |
| | |
| |
|
| |
| |
| |
| |
| |
| |
| |
|
Balance, December 31, 2001 | | 92,208,736 | | | 1,111,214 | | 1,109,704 | | 31,774 | | 28,177 | | – | | 59,951 | | – | | 2,280,869 |
Comprehensive income: | | | | | | | | | | | | | | | | | | | |
Net income | | | | | | | 256,278 | | | | | | | | | | | | 256,278 |
Other comprehensive income, net of tax: | | | | | | | | | | | | | | | | | | | |
Net realized and unrealized holding losses during the year, net of income tax benefit of $1,880 | | | | | | | | | (3,035) | | – | | – | | (3,035) | | | | |
Reclassification for net realized losses recorded in operations, net of income tax benefit of $9,546 | | | | | | | | | 15,412 | | – | | – | | 15,412 | | | | |
Net unrealized losses on derivative instruments, net of reclassification to operations of $34,916 and income tax benefit of $1,708 | | | | | | | | | – | | (2,757) | | – | | (2,757) | | | | |
Minimum pension liability, net of income tax benefit of $15,128 | | | | | | | | | – | | – | | (23,357) | | (23,357) | | | | |
| | | | | | | | | |
| |
| |
| |
| | | | |
Other comprehensive income (loss) | | | | | | | | | 12,377 | | (2,757) | | (23,357) | | (13,737) | | | | (13,737) |
| | | | | | | | | | | | | | | | | | | |
|
Total comprehensive income | | | | | | | | | | | | | | | | | | | 242,541 |
Stock redeemed and retired | | (2,393,881) | | | (113,215) | | | | | | | | | | | | | | (113,215) |
Stock options exercised, net of shares tendered and retired | | 569,579 | | | 19,841 | | | | | | | | | | | | | | 19,841 |
Issuance of common shares for acquisitions | | 333,258 | | | 17,048 | | | | | | | | | | | | | | 17,048 |
Cash dividends – common, $.80 per share | | | | | | | (73,241) | | | | | | | | | | | | (73,241) |
| | |
| |
|
| |
| |
| |
| |
| |
| |
| |
|
Balance, December 31, 2002 | | 90,717,692 | | | 1,034,888 | | 1,292,741 | | 44,151 | | 25,420 | | (23,357) | | 46,214 | | – | | 2,373,843 |
76
ZIONS BANCORPORATION AND SUBSIDIARIES
CONSOLIDATED STATEMENTS OF CHANGES IN SHAREHOLDERS’ EQUITY AND
COMPREHENSIVE INCOME (CONTINUED)
YEARS ENDED DECEMBER 31, 2003, 2002 AND 2001
| | | | | | | | | | | | | | | | | | | |
| | | | | | | | | Accumulated other comprehensive income (loss)
| | | | |
| | | | | | | Retained
earnings
| | Net unrealized gains (losses) on investments and
retained Interests
| | Net unrealized gains (losses) on derivative instruments
| | Minimum pension liability
| | Subtotal
| | Shares held in trust for deferred compensation
| | Total shareholders’ equity
|
| | | | | | | | | | | | |
| | | | | | | | | | | | |
| | | | | | | | | | | | |
| | | | | | | | | | | | |
(In thousands, except share amounts) | | Common stock
| | | | | | | |
| | Shares
| | Amount
| | | | | | | |
Comprehensive income: | | | | | | | | | | | | | | | | | | | |
Net income | | | | $ | | | 337,823 | | | | | | | | | | | | 337,823 |
Other comprehensive income, net
of tax: | | | | | | | | | | | | | | | | | | | |
Net realized and unrealized holding losses during the year, net of income tax benefit of $3,225 | | | | | | | | | (5,207) | | – | | – | | (5,207) | | | | |
Reclassification for net realized gains recorded in operations, net of income tax expense of $9,248 | | | | | | | | | (14,929) | | – | | – | | (14,929) | | | | |
Net unrealized losses on derivative instruments, net of reclassification to operations of $42,990 and income tax benefit of $9,312 | | | | | | | | | – | | (14,704) | | – | | (14,704) | | | | |
Minimum pension liability, net of income tax expense of $4,965 | | | | | | | | | – | | – | | 7,667 | | 7,667 | | | | |
| | | | | | | | | |
| |
| |
| |
| | | | |
Other comprehensive income (loss) | | | | | | | | | (20,136) | | (14,704) | | 7,667 | | (27,173) | | | | (27,173) |
| | | | | | | | | | | | | | | | | | | |
|
Total comprehensive income | | | | | | | | | | | | | | | | | | | 310,650 |
Stock redeemed and retired | | (2,083,101) | | | (106,844) | | | | | | | | | | | | | | (106,844) |
Stock options exercised, net of shares tendered and retired | | 1,206,047 | | | 57,860 | | | | | | | | | | | | | | 57,860 |
Cash dividends – common, $1.02 per share | | | | | | | (91,887) | | | | | | | | | | | | (91,887) |
Cost of shares held in trust for deferred compensation | | | | | | | | | | | | | | | | | (3,599) | | (3,599) |
| | |
| |
|
| |
| |
| |
| |
| |
| |
| |
|
Balance, December 31, 2003 | | 89,840,638 | | $ | 985,904 | | 1,538,677 | | 24,015 | | 10,716 | | (15,690) | | 19,041 | | (3,599) | | 2,540,023 |
| | |
| |
|
| |
| |
| |
| |
| |
| |
| |
|
See accompanying notes to consolidated financial statements.
77
ZIONS BANCORPORATION AND SUBSIDIARIES
CONSOLIDATED STATEMENTS OF CASH FLOWS
YEARS ENDED DECEMBER 31, 2003, 2002 AND 2001
| | | | | | | |
| (In thousands) | | 2003
| | 2002
| | 2001
|
CASH FLOWS FROM OPERATING ACTIVITIES: | | | | | | | |
Net income | | $ | 337,823 | | 256,278 | | 283,020 |
Adjustments to reconcile net income to net cash provided by operating activities: | | | | | | | |
Cumulative effect of change in accounting principle, net of tax | | | – | | 32,369 | | 7,159 |
Impairment losses on goodwill, other intangibles and long-lived assets | | | 78,280 | | 33,633 | | – |
Debt extinguishment cost | | | 24,210 | | – | | – |
Provision for loan losses | | | 69,940 | | 71,879 | | 73,191 |
Depreciation of premises and equipment | | | 59,799 | | 59,131 | | 56,076 |
Amortization | | | 34,737 | | 37,906 | | 63,538 |
Loss to minority interest | | | (7,185) | | (3,660) | | (7,798) |
Equity securities losses (gains), net | | | (63,807) | | 25,316 | | (37,239) |
Fixed income securities losses (gains), net | | | 17 | | (358) | | 3,781 |
Net decrease (increase) in trading account securities | | | (48,614) | | (228,714) | | 611,711 |
Proceeds from sales of loans held for sale | | | 621,251 | | 566,643 | | 609,576 |
Additions to loans held for sale | | | (490,537) | | (558,183) | | (726,376) |
Net gains on sales of loans, leases and other assets | | | (66,993) | | (38,530) | | (69,702) |
Net increase in cash surrender value of bank owned life insurance | | | (18,978) | | (18,903) | | (16,590) |
Undistributed earnings of affiliates | | | (7,007) | | (13,702) | | (9,426) |
Change in accrued income taxes | | | (45,892) | | 27,565 | | 20,911 |
Change in accrued interest receivable | | | (10,819) | | 37,608 | | (1,329) |
Change in other assets | | | 29,858 | | (164,256) | | (73,421) |
Change in other liabilities | | | (67,189) | | 87,918 | | 46,758 |
Change in accrued interest payable | | | 2,232 | | (5,660) | | (12,475) |
Other, net | | | 9,061 | | (1,570) | | 27,073 |
| | |
|
| |
| |
|
Net cash provided by operating activities | | | 440,187 | | 202,710 | | 848,438 |
| | |
|
| |
| |
|
| | | |
CASH FLOWS FROM INVESTING ACTIVITIES: | | | | | | | |
Net decrease (increase) in money market investments | | | (26,910) | | (250,759) | | 377,387 |
Proceeds from maturities of investment securities held to maturity | | | – | | 1,415 | | 12,964 |
Purchases of investment securities held to maturity | | | – | | (29,400) | | (29,347) |
Proceeds from sales of investment securities available for sale | | | 5,927,160 | | 10,081,114 | | 7,072,531 |
Proceeds from maturities of investment securities available for sale | �� | | 1,083,462 | | 1,860,299 | | 2,591,160 |
Purchases of investment securities available for sale | | | (8,151,363) | | (11,830,782) | | (9,067,706) |
Proceeds from sales of loans and leases | | | 1,115,907 | | 1,380,430 | | 1,753,195 |
Securitized loans repurchased | | | (22,396) | | (430,164) | | – |
Net increase in loans and leases | | | (2,157,123) | | (2,679,817) | | (3,250,280) |
Proceeds from sales of other noninterest bearing investments | | | 116,918 | | 83,756 | | – |
Payments on leveraged leases | | | (9,118) | | (9,160) | | (8,012) |
Principal collections on leveraged leases | | | 9,118 | | 9,160 | | 8,012 |
Proceeds from sales of premises and equipment | | | 4,672 | | 10,037 | | 13,056 |
Purchases of premises and equipment | | | (83,272) | | (97,821) | | (91,924) |
Proceeds from sales of other assets | | | 50,585 | | 21,683 | | 23,431 |
Cash paid to reacquire minority interest | | | – | | – | | (66,044) |
Net cash received from acquisitions | | | – | | 9,690 | | 209,509 |
Net cash paid for net liabilities on branches sold | | | – | | (68,352) | | – |
| | |
|
| |
| |
|
Net cash used in investing activities | | | (2,142,360) | | (1,938,671) | | (452,068) |
| | |
|
| |
| |
|
78
ZIONS BANCORPORATION AND SUBSIDIARIES
CONSOLIDATED STATEMENTS OF CASH FLOWS (CONTINUED)
YEARS ENDED DECEMBER 31, 2003, 2002 AND 2001
| | | | | | | |
| (In thousands) | | 2003
| | 2002
| | 2001
|
CASH FLOWS FROM FINANCING ACTIVITIES: | | | | | | | |
Net increase in deposits | | $ | 763,633 | | 2,285,152 | | 747,218 |
Net change in short-term funds borrowed | | | 624,724 | | (523,316) | | (1,511,725) |
Proceeds from FHLB advances and other borrowings over one year | | | 3,141 | | 3,250 | | 250,000 |
Payments on FHLB advances and other borrowings over one year | | | (12,399) | | (3,010) | | (173,948) |
Proceeds from issuance of long-term debt | | | 893,395 | | 331,138 | | 402,218 |
Debt issuance costs | | | (4,019) | | (10,401) | | (5,061) |
Payments on long-term debt | | | (363,995) | | (68,616) | | (69,152) |
Debt extinguishment cost | | | (24,210) | | – | | – |
Proceeds from issuance of common stock | | | 52,689 | | 16,907 | | 15,798 |
Payments to redeem common stock | | | (106,844) | | (113,215) | | (46,462) |
Dividends paid | | | (91,887) | | (73,241) | | (73,899) |
| | |
|
| |
| |
|
Net cash provided by (used in) financing activities | | | 1,734,228 | | 1,844,648 | | (465,013) |
| | |
|
| |
| |
|
Net increase (decrease) in cash and due from banks | | | 32,055 | | 108,687 | | (68,643) |
Cash and due from banks at beginning of year | | | 1,087,296 | | 978,609 | | 1,047,252 |
| | |
|
| |
| |
|
Cash and due from banks at end of year | | $ | 1,119,351 | | 1,087,296 | | 978,609 |
| | |
|
| |
| |
|
SUPPLEMENTAL DISCLOSURES OF CASH FLOW INFORMATION: | | | | | | | |
Cash paid for: | | | | | | | |
Interest | | $ | 313,673 | | 424,735 | | 651,083 |
Income taxes | | | 245,698 | | 113,349 | | 156,307 |
Loans transferred to other real estate owned | | | 40,692 | | 43,987 | | 23,175 |
See accompanying notes to consolidated financial statements.
79
ZIONS BANCORPORATION AND SUBSIDIARIES
NOTES TO CONSOLIDATED FINANCIAL STATEMENTS
1. SUMMARY OF SIGNIFICANT ACCOUNTING POLICIES
BUSINESS
Zions Bancorporation (“the Parent”) is a financial holding company headquartered in Salt Lake City, Utah, which provides a full range of banking and related services through its subsidiaries operating primarily in Utah, Idaho, California, Nevada, Arizona, Colorado and Washington.
BASIS OF FINANCIAL STATEMENT PRESENTATION
The consolidated financial statements include the accounts of Zions Bancorporation and its majority-owned subsidiaries (“the Company,” “we,” “our,” “us”). Unconsolidated investments in which there is a greater than 20% ownership are accounted for by the equity method of accounting; those in which there is less than 20% ownership are generally carried at cost. All significant intercompany accounts and transactions have been eliminated in consolidation. Certain prior year amounts have been reclassified to conform to the current year presentation. The Financial Accounting Standards Board (“FASB”) has issued Interpretation No. 46, (“FIN 46”),Consolidation of Variable Interest Entities.FIN 46 requires consolidation of a variable interest entity (“VIE”) when a company is the primary beneficiary of the VIE. See Note 8 for further discussion.
The consolidated financial statements have been prepared in conformity with accounting principles generally accepted in the United States and prevailing practices within the financial services industry. In preparing the consolidated financial statements, we are required to make estimates and assumptions that affect the amounts reported in the financial statements and accompanying notes. Actual results could differ from those estimates.
SECURITY RESELL AGREEMENTS
Security resell agreements represent overnight and term agreements, the majority maturing within 30 days. These agreements are generally treated as collateralized financing transactions and are carried at amounts at which the securities were acquired plus accrued interest. Either the Company or, in some instances, third parties on our behalf take possession of the underlying securities. The market value of such securities is monitored throughout the contract term to ensure that asset values remain sufficient to protect counterparty default. We are permitted by contract to sell or repledge certain securities that we accept as collateral for security resell agreements. If sold, our obligation to return the collateral is recorded as a liability and included in the balance sheet as securities sold, not yet purchased. As of December 31, 2003, we held approximately $513 million of securities for which we were permitted by contract to sell or repledge. The majority of these securities have been either pledged or otherwise transferred to others in connection with our financing activities, or to satisfy our commitments under short sales. Security resell agreements averaged approximately $1.2 billion during 2003, and the maximum amount outstanding at any month-end during 2003 was $1.8 billion.
INVESTMENT SECURITIES
We classify our investment securities according to their purpose and holding period. Gains or losses on the sale of securities are recognized using the specific identification method and recorded in noninterest income.
Debt securities held for investment and marketable equity securities not accounted for under the equity method of accounting are classified as available for sale and are recorded at fair value. Unrealized gains and losses, after applicable taxes, are recorded as a component of other comprehensive income. Any declines in the value of debt securities and marketable equity securities that are considered other than temporary are recorded in noninterest income. The review for other-than-temporary declines takes into account current market conditions, offering prices, trends and volatility of earnings, current analysts’ evaluations, and other key measures.
80
Securities acquired for short-term appreciation or other trading purposes are classified as trading securities and are recorded at fair value. Realized and unrealized gains and losses resulting from such fair value adjustments and from recording the results of sales are recorded in trading income.
The market values of available for sale and trading securities are generally based on quoted market prices or dealer quotes. If a quoted market price is not available, market value is estimated using quoted market prices for similar securities.
LOANS
Loans are reported at the principal amount outstanding, net of unearned income. Unearned income, which includes deferred fees net of deferred direct incremental loan origination costs, is amortized to interest income generally over the life of the loan using the interest method.
Loans held for sale are carried at the lower of aggregate cost or market value. Gains and losses are recorded in noninterest income, based on the difference between sales proceeds and carrying value.
NONACCRUAL LOANS
Loans are generally placed on a nonaccrual status when principal or interest is past due 90 days or more unless the loan is both well secured and in the process of collection or when, in the opinion of management, full collection of principal or interest is unlikely. Generally, consumer loans are not placed on nonaccrual status inasmuch as they are normally charged off when they become 120 days past due. A loan may be returned to accrual status when all delinquent interest and principal become current in accordance with the terms of the loan agreement or when the loan is both well secured and in the process of collection.
IMPAIRED LOANS
Loans, other than those included in large groups of smaller-balance homogeneous loans, are considered impaired when, based on current information and events, it is probable that we will be unable to collect all amounts due according to the contractual terms of the loan agreement, including scheduled interest payments. For a loan that has been restructured, the contractual terms of the loan agreement refer to the contractual terms specified by the original loan agreement, not the contractual terms specified by the restructuring agreement.
The assessment for impairment occurs when and while such loans are on nonaccrual. When a loan has been identified as being impaired, the amount of impairment will be measured based on the present value of expected future cash flows discounted at the loan’s effective interest rate or, when appropriate, the loan’s observable market value or the fair value of the collateral (less any selling costs) if the loan is collateral-dependent.
If the measurement of the impaired loan is less than the recorded investment in the loan (including accrued interest, net of deferred loan fees or costs and unamortized premium or discount), an impairment is recognized by creating or adjusting an existing allocation of the allowance for loan losses.
RESTRUCTURED LOANS
In cases where a borrower experiences financial difficulty and we make certain concessionary modifications to contractual terms, the loan is classified as a restructured (accruing) loan. Loans restructured at a rate equal to or greater than that of a new loan with comparable risk at the time the contract is modified may be excluded from the impairment assessment and may cease to be considered impaired loans in the calendar years subsequent to the restructuring if they are not impaired based on the modified terms.
Generally, a nonaccrual loan that is restructured remains on nonaccrual for a period of six months to demonstrate that the borrower can meet the restructured terms. However, performance prior to the restructuring, or significant events that coincide with the restructuring, are included in assessing whether the borrower can meet the new terms and may result in the loan being returned to accrual at the time of restructuring or after a shorter performance period. If the borrower’s ability to meet the revised payment schedule is uncertain, the loan remains classified as a nonaccrual loan.
81
ALLOWANCE FOR LOAN LOSSES
In analyzing the adequacy of the allowance for loan and lease losses, we utilize a comprehensive loan grading system to determine risk potential in the portfolio and consider the results of independent internal credit reviews. To determine the adequacy of the allowance, our loan and lease portfolio is broken into segments based on loan type. Historical loss-experience factors by segment, adjusted for changes in trends and conditions, are used in determining the required allowance for each segment. Historical loss factors are evaluated and updated using migration analysis techniques and other considerations based on the makeup of the specific portfolio segment. Other considerations such as volumes and trends of delinquencies, nonaccruals, repossessions and bankruptcies, criticized and classified loan trends, current and anticipated foreclosure losses, new products and policies, economic conditions, and concentrations of credit risk are also considered in establishing the loan loss factors.
All loans graded substandard or doubtful in the amount of $500 thousand or more are individually evaluated based on facts and circumstances of the loan and a specific allowance amount may be designated. Specific allowances may also be established for loans in amounts below the specific thresholds when it is determined that the risk differs significantly from factor amounts established for the category.
After a preliminary allowance for credit losses has been established for the loan portfolio segments, we perform an additional review of the adequacy of the allowance based on the loan portfolio in its entirety. This enables us to mitigate the imprecision inherent in most estimates of expected credit losses and also supplement the allowance. This supplemental portion of the allowance includes our judgmental consideration of any additional amounts necessary for subjective factors such as economic uncertainties and excess concentration risks.
NONMARKETABLE SECURITIES
Nonmarketable securities are included in other noninterest bearing investments on the balance sheet. These securities include certain venture capital securities and securities acquired for various debt and regulatory requirements. Nonmarketable venture capital securities are reported at estimated fair values, in the absence of readily ascertainable market values. Changes in fair value and gains and losses from sales are recognized in noninterest income. The values assigned to the securities where no market quotations exist are based upon available information and may not necessarily represent amounts that will ultimately be realized. Such estimated amounts depend on future circumstances and will not be realized until the individual securities are liquidated. The valuation procedures applied include consideration of economic and market conditions, current and projected financial performance of the investee company, and the investee company’s management team. We believe that the cost of an investment is initially the best indication of estimated fair value unless there have been significant subsequent positive or negative developments that justify an adjustment in the fair value estimate. Other nonmarketable securities acquired for various debt and regulatory requirements are accounted for at cost.
ASSET SECURITIZATIONS
When we sell receivables in securitizations of home equity loans and small business loans, we may retain a cash reserve account, an interest-only strip, and in some cases a subordinated tranche, all of which are retained interests in the securitized receivables. Gain or loss on sale of the receivables depends in part on the previous carrying amount of the financial assets involved in the transfer, allocated between the assets sold and the retained interests based on their relative fair values at the date of transfer. Quoted market prices are generally not available for retained interests. To obtain fair values, we estimate the present value of future expected cash flows using our best judgment of key assumptions, including credit losses, prepayment speeds and methods, forward yield curves, and discount rates commensurate with the risks involved. Retained interests are included in other assets in the balance sheet.
PREMISES AND EQUIPMENT
Premises and equipment are stated at cost, net of accumulated depreciation and amortization. Depreciation,
82
computed primarily on the straight-line method, is charged to operations over the estimated useful lives of the properties, generally from 25 to 40 years for buildings and 3 to 10 years for furniture and equipment. Leasehold improvements are amortized over the terms of the respective leases or the estimated useful lives of the improvements, whichever are shorter.
GOODWILL AND IDENTIFIABLE INTANGIBLE ASSETS
Goodwill results from acquisitions we have made and represents the excess of the purchase price over the fair value of net assets and other identifiable intangible assets acquired. Beginning in January 2002, we adopted Statement of Financial Accounting Standards (“SFAS”) No. 142,Goodwill and Other Intangible Assets,issued by the FASB. As a result, we no longer amortize goodwill and intangible assets deemed to have indefinite lives. Such assets are now subject to annual specified impairment tests. Prior to the adoption of SFAS 142, substantially all of our goodwill was amortized using the straight-line method over 25 years. Core deposit assets and other intangibles are generally amortized on an accelerated basis using an estimated useful life of up to 10 years.
DERIVATIVE INSTRUMENTS
We use derivative instruments including interest rate swaps and basis swaps as part of our overall asset and liability duration and interest rate risk management strategy. These instruments enable us to manage desired asset and liability duration and to reduce interest rate exposure by matching estimated repricing periods of interest-sensitive assets and liabilities. We also enter into foreign exchange derivative transactions primarily as an accommodation to our customers. As required by SFAS No. 133,Accounting for Derivative Instruments and Hedging Activities,we record all derivatives at fair value in the balance sheet as either other assets or other liabilities. See further discussion in Note 7.
COMMITMENTS AND LETTERS OF CREDIT
In the ordinary course of business, we enter into commitments to extend credit, commercial letters of credit, and standby letters of credit. Such financial instruments are recorded in the financial statements when they become payable. The credit risk associated with these commitments, when indistinguishable from the underlying funded loan, is considered in our determination of the allowance for loan losses. As of December 31, 2003, we reclassified to other liabilities the portion of the allowance that related to undrawn commitments to extend credit.
STOCK-BASED COMPENSATION
The following disclosures are required by SFAS No. 148,Accounting for Stock-Based Compensation – Transition and Disclosure.This Statement provides guidance to transition from the intrinsic value method of accounting for stock-based compensation under Accounting Principles Board Opinion No. 25 (“APB 25”),Accounting for Stock Issued to Employees,to the fair value method of accounting under SFAS No. 123,Accounting for Stock-Based Compensation.At December 31, 2003, we had two stock-based employee compensation plans and a non-employee director stock-based compensation plan, which are described more fully in Note 19. We continue to account for our stock-based compensation plans under APB 25 and have not recorded any compensation expense, as the exercise price of the stock options was equal to the quoted market price of the stock on the date of grant.
The impact on net income and net income per common share if we had applied the provisions of SFAS 123 to stock-based employee compensation is as follows(in thousands, except per share amounts):
| | | | | | |
| | | 2003
| | 2002
| | 2001
|
Net income, as reported | | $337,823 | | 256,278 | | 283,020 |
Deduct: Total stock-based employee compensation expense determined under fair value based method for all awards, net of related tax effects | | (15,395) | | (17,225) | | (16,982) |
| | |
| |
| |
|
Pro forma net income | | $322,428 | | 239,053 | | 266,038 |
| | |
| |
| |
|
Net income per common share: | | | | | | |
Basic – as reported | | $ 3.75 | | 2.80 | | 3.10 |
Basic – pro forma | | 3.58 | | 2.61 | | 2.92 |
Diluted – as reported | | 3.72 | | 2.78 | | 3.07 |
Diluted – pro forma | | 3.55 | | 2.60 | | 2.89 |
83
The fair values of stock options granted were estimated at the date of grant using a Black-Scholes option-pricing model. The following table summarizes the weighted average of fair value and the assumptions used in applying the Black-Scholes option-pricing model to compute the estimated impact of employee compensation costs on net income and net income per share for options granted:
| | | | | | | | | | |
| | | 2003
| | | 2002
| | | 2001
| |
Weighted average of fair value for options granted | | $ | 9.05 | | | 11.54 | | | 14.89 | |
Weighted average assumptions used: | | | | | | | | | | |
Expected dividend yield | | | 1.9 | % | | 1.8 | % | | 1.5 | % |
Expected volatility | | | 28.0 | % | | 26.5 | % | | 32.6 | % |
Risk-free interest rate | | | 2.38 | % | | 3.77 | % | | 4.44 | % |
Expected life (in years) | | | 3.8 | | | 3.8 | | | 3.9 | |
INCOME TAXES
Deferred tax assets and liabilities are recognized for the future tax consequences attributable to differences between the financial statement carrying amounts of existing assets and liabilities and their respective tax bases and operating loss and tax credit carryforwards. Deferred tax assets and liabilities are measured using enacted tax rates expected to apply to taxable income in the years in which those temporary differences are expected to be recovered or settled. The effect on deferred tax assets and liabilities of a change in tax rates is recognized in income in the period that includes the enactment date.
NET INCOME PER COMMON SHARE
Diluted net income per common share is based on the weighted average outstanding common shares during each year, including common stock equivalents. Basic net income per common share is based on the weighted average outstanding common shares during each year.
2. OTHER RECENT ACCOUNTING PRONOUNCEMENTS
In May 2003, the FASB issued SFAS No. 150,Accounting for Certain Financial Instruments with Characteristics of both Liabilities and Equity.SFAS 150 affects the issuer’s accounting for certain freestanding financial instruments that have both debt and equity characteristics. Generally, it must be applied for interim financial reporting periods beginning after June 15, 2003. This Statement has not had a material impact on our financial position or results of operations.
In October 2002, the FASB issued SFAS No. 147,Acquisition of Certain Financial Institutions.SFAS 147 amends previous accounting guidance which required certain acquisitions of financial institutions where the fair market value of liabilities assumed was greater than the fair value of the tangible assets and identifiable intangible assets acquired to recognize and account for the excess as an unidentifiable intangible asset. Under the former guidance, this unidentifiable intangible asset was to be amortized over a period not greater than the life of the long-term interest bearing assets acquired. Under SFAS 147, this excess, if acquired in a business combination, represents goodwill that should be accounted for in accordance with SFAS 142. In addition, SFAS 147 amends SFAS 144 to include in its scope long-term customer-relationship intangible assets of financial institutions such as depositor and borrower relationship intangible assets and credit card intangible assets. Consequently, those intangible assets are subject to the same undiscounted cash flow recoverability test and impairment loss recognition and measurement provisions that SFAS 144 requires. We do not expect SFAS 147 to have a material impact on our financial position or results of operations.
Additional recent accounting pronouncements are discussed throughout the Notes to Consolidated Financial Statements.
3. MERGERS AND ACQUISITIONS ACTIVITY
We adopted SFAS No. 141,Business Combinations,for business combinations completed after June 30, 2001. SFAS 141 supersedes certain previous accounting guidance on business combinations, and eliminates the pooling of interests method of accounting. Although not significant to our results of operations, financial position, or liquidity, either individually or in the aggregate, we made the following acquisitions in 2002 and in 2001 subsequent to June 30, 2001; we did not make any acquisitions in 2003:
84
In November 2002, we acquired Frontier State Bank (“Frontier”), Show Low, Arizona, for 204 thousand shares of our common stock, valued at approximately $10.9 million based on the terms of the acquisition. Frontier had assets of approximately $94.4 million, total deposits of approximately $88.0 million, and six banking offices. Frontier was merged with and into our subsidiary, National Bank of Arizona. Goodwill amounted to approximately $3.9 million.
In November 2001, we acquired Minnequa Bancorp (“Minnequa”), Pueblo, Colorado, and its banking subsidiary, Minnequa Bank of Pueblo, for $43.6 million, consisting of $19.6 million cash and approximately 508 thousand shares of our common stock. Minnequa had assets of approximately $336 million, total deposits of approximately $314 million, and five banking offices. Minnequa Bank of Pueblo was merged with and into our subsidiary, Vectra Bank Colorado. Goodwill amounted to approximately $21.8 million.
In July 2001, we acquired Internet Commerce Express, Inc., Nashua, New Hampshire; ThinkXML, Inc., Rockville, Maryland; and Frontier Technologies Corporation (asset purchase only), Mequon, Wisconsin. Consideration of $55.0 million consisted of $48.5 million cash and approximately 100 thousand shares of our common stock. Goodwill amounted to approximately $35.8 million. These companies provided e-commerce solutions. They were subsequently merged into Internet Commerce Express, Inc., and in October 2001 the name was changed to Lexign, Inc. In September 2003, we sold Lexign, Inc., as discussed in Note 16.
Prior to July 1, 2001, we made the following acquisitions:
In April 2001, we acquired, in a purchase transaction, the Arizona operations of Pacific Century Bank, a subsidiary of Pacific Century Financial Corporation. These operations were merged with and into our subsidiary, National Bank of Arizona. We purchased approximately $231 million in loans, assumed approximately $447 million in deposits, acquired branch facilities with accompanying personnel, and received cash to satisfy assumed deposits. Goodwill and core deposit intangibles amounted to approximately $48.3 million.
On March 30, 2001, we acquired Eldorado Bancshares, Inc. (“Eldorado”), based in Laguna Hills, California, and its banking subsidiaries, Eldorado Bank and Antelope Valley Bank. Consideration consisted of 3.3 million shares of our common stock. Eldorado had assets of approximately $1.3 billion and shareholders’ equity of approximately $128 million. Eldorado Bank and Antelope Valley Bank were merged with and into our subsidiary, California Bank & Trust. The acquisition was accounted for as a purchase, and accordingly, our financial statements reflect combined operations from the date of acquisition. Goodwill amounted to approximately $105.7 million. The pro forma effect on prior period results of operations was not significant.
In January 2001, we acquired Draper Bancorp, based in Draper, Utah, and its banking subsidiary, Draper Bank, in exchange for approximately 1.4 million shares of our common stock. Draper Bancorp had assets of approximately $242 million and shareholders’ equity of approximately $26 million. Draper Bank was merged with and into our subsidiary, Zions First National Bank. The acquisition was accounted for as a pooling of interests and was not considered material to our historical results. Accordingly, our financial statements were not restated to reflect the pooling of interests.
85
4. INVESTMENT SECURITIES
Investment securities as of December 31, 2003 are summarized as follows(in thousands):
| | | | | | | | | |
| | | Available for sale
|
| | | Amortized
cost
| | Gross
unrealized
gains
| | Gross
unrealized
losses
| | Estimated
market
value
|
U.S. Treasury securities | | $ | 41,645 | | 1,620 | | 1 | | 43,264 |
U.S. government agencies and corporations: | | | | | | | | | |
Small Business Administration loan-backed securities | | | 737,564 | | 5,575 | | 2,232 | | 740,907 |
Other agency securities | | | 240,805 | | 1,785 | | 997 | | 241,593 |
Municipal securities | | | 715,486 | | 9,547 | | 7,164 | | 717,869 |
Mortgage/asset-backed and other debt securities | | | 2,351,002 | | 25,142 | | 7,921 | | 2,368,223 |
| | |
|
| |
| |
| |
|
| | | | 4,086,502 | | 43,669 | | 18,315 | | 4,111,856 |
Other securities: | | | | | | | | | |
Mutual funds | | | 317,831 | | 678 | | 67 | | 318,442 |
Stock | | | 8,264 | | 1,489 | | 2,258 | | 7,495 |
| | |
|
| |
| |
| |
|
| | | $ | 4,412,597 | | 45,836 | | 20,640 | | 4,437,793 |
| | |
|
| |
| |
| |
|
Investment securities as of December 31, 2002 are summarized as follows(in thousands):
| | | | | | | | | |
| | | Available for sale
|
| | | Amortized
cost
| | Gross
unrealized
gains
| | Gross
unrealized
losses
| | Estimated
market
value
|
U.S. Treasury Securities | | $ | 44,388 | | 2,532 | | 5 | | 46,915 |
U.S. government agencies and corporations: | | | | | | | | | |
Small Business Administration loan-backed securities | | | 752,139 | | 4,877 | | 1,245 | | 755,771 |
Other agency securities | | | 299,445 | | 3,391 | | 970 | | 301,866 |
Municipal securities | | | 639,607 | | 8,642 | | 2,580 | | 645,669 |
Mortgage/asset-backed and other debt securities | | | 1,186,623 | | 25,031 | | 3,523 | | 1,208,131 |
| | |
|
| |
| |
| |
|
| | | | 2,922,202 | | 44,473 | | 8,323 | | 2,958,352 |
Other securities: | | | | | | | | | |
Mutual funds | | | 317,309 | | 3,351 | | 94 | | 320,566 |
Stock | | | 14,651 | | 12,255 | | 1,483 | | 25,423 |
| | |
|
| |
| |
| |
|
| | | $ | 3,254,162 | | 60,079 | | 9,900 | | 3,304,341 |
| | |
|
| |
| |
| |
|
The amortized cost and estimated market value of investment securities as of December 31, 2003 by contractual maturity, excluding other securities, are shown below. Expected maturities will differ from contractual maturities because borrowers may have the right to call or prepay obligations with or without call or prepayment penalties(in thousands):
| | | | | |
| | | Available for sale
|
| | | Amortized
cost
| | Estimated
market
value
|
Due in one year or less | | $ | 443,807 | | 447,156 |
Due after one year through five years | | | 881,879 | | 891,801 |
Due after five years through ten years | | | 495,398 | | 506,921 |
Due after ten years | | | 2,265,418 | | 2,265,978 |
| | |
|
| |
|
| | | $ | 4,086,502 | | 4,111,856 |
| | |
|
| |
|
86
For investment securities with unrealized losses at December 31, 2003, the following is a summary of the number of investment securities, the amount of gross unrealized losses, and the estimated market value by length of time that the securities have been in an unrealized loss position(in thousands, except number of investment securities):
| | | | | | | | | | | | | | | | | | | | | |
| | | Less than 12 months
| | 12 months or more
| | Total
|
| | | Number of
investment
securities
| | Gross
unrealized
losses
| | Estimated
market
value
| | Number of
investment
securities
| | Gross
unrealized
losses
| | Estimated
market
value
| | Number of
investment
securities
| | Gross
unrealized
losses
| | Estimated
market
value
|
U.S. Treasury securities | | 3 | | $ | 1 | | 10,994 | | – | | $ | – | | – | | 3 | | $ | 1 | | 10,994 |
U.S. government agencies and corporations: | | | | | | | | | | | | | | | | | | | | | |
Small Business Administration loan-backed securities | | 23 | | | 1,309 | | 122,486 | | 141 | | | 924 | | 126,750 | | 164 | | | 2,233 | | 249,236 |
Other agency securities | | 24 | | | 851 | | 80,655 | | 7 | | | 145 | | 7,560 | | 31 | | | 996 | | 88,215 |
Municipal securities | | 495 | | | 5,703 | | 130,977 | | 116 | | | 1,461 | | 22,103 | | 611 | | | 7,164 | | 153,080 |
Mortgage/asset-backed and other debt securities | | 41 | | | 7,906 | | 561,987 | | 8 | | | 15 | | 1,535 | | 49 | | | 7,921 | | 563,522 |
| | |
| |
|
| |
| |
| |
|
| |
| |
| |
|
| |
|
| | | 586 | | | 15,770 | | 907,099 | | 272 | | | 2,545 | | 157,948 | | 858 | | | 18,315 | | 1,065,047 |
Other securities: | | | | | | | | | | | | | | | | | | | | | |
Mutual funds | | 2 | | | 51 | | 10,077 | | 3 | | | 16 | | 288 | | 5 | | | 67 | | 10,365 |
Stock | | 2 | | | 1,232 | | 1,186 | | 3 | | | 1,026 | | 2,128 | | 5 | | | 2,258 | | 3,314 |
| | |
| |
|
| |
| |
| |
|
| |
| |
| |
|
| |
|
| | | 590 | | $ | 17,053 | | 918,362 | | 278 | | $ | 3,587 | | 160,364 | | 868 | | $ | 20,640 | | 1,078,726 |
| | |
| |
|
| |
| |
| |
|
| |
| |
| |
|
| |
|
Unrealized losses on fixed income securities result from the current market yield on securities being higher than the book yield on the securities in the portfolio and/or a credit deterioration of the obligor. Based on past experience with these types of investments and our own financial performance, we have the ability and intent to hold these investments to maturity or until fair value recovers above cost. Unrealized losses on other securities, including stock, result from poor financial performance and adverse market valuations. We review these investments on an ongoing basis according to our policy described in Note 1. While our review did not result in an other-than-temporary impairment adjustment as of December 31, 2003, we will continue to review these investments for possible adjustment in the future.
Gross gains and losses from investment securities of $25.3 million and $1.2 million in 2003, $4.6 million and $0.9 million in 2002, and $11.1 million and $8.8 million in 2001, respectively, were recognized in equity and fixed income securities gains (losses) in the statement of income.
Net gains (losses) from securities held by our venture capital subsidiaries and included in equity securities gains (losses) were $(23.6) million in 2003, $(18.4) million in 2002, and $(39.6) million in 2001. Consolidated net income includes losses, net of income taxes and minority interest, of approximately $12.3 million in 2003, $11.4 million in 2002, and $20.3 million in 2001, from our venture capital subsidiaries. Nonmarketable securities held by our venture capital subsidiaries are included in other noninterest bearing investments in the balance sheet. The carrying value of these securities at December 31, 2003 and 2002 was $63.7 million and $69.7 million, respectively.
In 2003, gross gains of $70.3 million and gross losses of $7.0 million were recognized from sales and write-downs of other equity investments included in noninterest bearing investments. Included in the gross gains is $68.5 million we recognized from the sale of our investment in ICAP plc. In 2002, we recognized a loss of $10.3 million from the write-down of a minority interest in an investment banking firm. In 2001, we recognized gains of $70.8 million from the sale of our investment in Concord EFS, Inc. These gains and losses were also included in equity securities gains (losses) in their respective years.
As of December 31, 2003 and 2002, securities with an amortized cost of $1.76 billion and $1.59 billion,
87
respectively, were pledged to secure public and trust deposits, advances, and for other purposes as required by law. As described in Note 12, securities are also pledged as collateral for security repurchase agreements.
5. LOANS AND ALLOWANCE FOR LOAN LOSSES
Loans are summarized as follows at December 31(in thousands):
| | | | | |
| | | 2003
| | 2002
|
Loans held for sale | | $ | 176,886 | | 289,499 |
Commercial lending: | | | | | |
Commercial and industrial | | | 4,111,233 | | 4,123,558 |
Leasing | | | 376,775 | | 384,271 |
Owner occupied | | | 3,295,224 | | 3,017,475 |
| | |
|
| |
|
Total commercial lending | | | 7,783,232 | | 7,525,304 |
Commercial real estate: | | | | | |
Construction | | | 2,866,393 | | 2,946,887 |
Term | | | 3,426,208 | | 3,175,366 |
| | |
|
| |
|
Total commercial real estate | | | 6,292,601 | | 6,122,253 |
Consumer: | | | | | |
Home equity credit line | | | 838,495 | | 650,770 |
1-4 family residential | | | 3,873,688 | | 3,208,953 |
Bankcard and other revolving plans | | | 197,857 | | 204,714 |
Other | | | 749,175 | | 999,906 |
| | |
|
| |
|
Total consumer | | | 5,659,215 | | 5,064,343 |
Foreign loans | | | 14,717 | | 5,241 |
Other receivables | | | 89,990 | | 125,865 |
| | |
|
| |
|
Total loans | | $ | 20,016,641 | | 19,132,505 |
| | |
|
| |
|
As of December 31, 2003 and 2002, loans with a carrying value of $1.9 billion and $1.7 billion, respectively, were included as blanket pledges of security for Federal Home Loan Bank advances. As discussed in Note 13, amounts borrowed from Federal Home Loan Banks were $224 million and $225 million at December 31, 2003 and 2002, respectively.
We sold loans during 2003, 2002 and 2001 totaling $603 million, $567 million and $610 million, respectively, that were classified as held for sale. Income from loans sold, excluding servicing, of both loans held for sale and loan securitizations was $64.6 million in 2003, $48.2 million in 2002, and $80.3 million in 2001.
Changes in the allowance for loan losses are summarized as follows(in thousands):
| | | | | | | |
| | | 2003
| | 2002
| | 2001
|
Balance at beginning of year | | $ | 279,593 | | 260,483 | | 195,535 |
Allowance for loan losses of companies acquired | | | – | | 1,010 | | 30,178 |
Additions: | | | | | | | |
Provision for loan losses | | | 69,940 | | 71,879 | | 73,191 |
Allowance for securitized loans repurchased | | | – | | 9,874 | | – |
Recoveries | | | 16,791 | | 20,679 | | 16,139 |
Deductions: | | | | | | | |
Loan charge-offs | | | (85,603) | | (84,332) | | (54,560) |
| | |
|
| |
| |
|
| | | | 280,721 | | 279,593 | | 260,483 |
Reclassification of allowance for unfunded lending commitments | | | (12,215) | | – | | – |
| | |
|
| |
| |
|
Balance at end of year | | $ | 268,506 | | 279,593 | | 260,483 |
| | |
|
| |
| |
|
The reclassified allowance in 2003 is for potential credit losses related to undrawn commitments to extend credit. The reclassification was made as of December 31, 2003 to other liabilities. Prior year amounts were not restated.
Our recorded investment in impaired loans was $44 million at both December 31, 2003 and 2002. Impaired loans of $21 million and $20 million at December 31, 2003 and 2002 required an allowance of $5 million and $7 million, respectively, which is included in the allowance for loan losses. Contractual interest due and interest foregone on impaired loans were $6.2 million and $5.6 million, respectively, for 2003, $7.3 million and $5.8 million, respectively, for 2002, and $12.0 million and $5.9 million, respectively, for 2001. The average recorded investment in impaired loans was $51 million in 2003, $69 million in 2002, and $61 million in 2001.
Credit risk includes the loss that would be recognized subsequent to the reporting date if counterparties failed to perform as contracted. Concentrations of credit risk from financial instruments (whether on- or off-balance sheet) occur when groups of customers or counterparties having similar economic characteristics are unable to meet contractual obligations when similarly affected by changes in economic or other conditions. We limit our exposure to any individual customer or counterparty.
88
Most of our business activity is with customers located in the states of Utah, Idaho, California, Nevada, Arizona, Colorado, and Washington. The commercial loan portfolio is well diversified, consisting of 11 major industry classification groupings. As of December 31, 2003, the larger concentrations of risk in the commercial loan and leasing portfolios are represented by the real estate, construction, business services and transportation industry groupings. We have minimal credit exposure from lending transactions with highly leveraged entities. See discussion in Note 20 regarding commitments to extend additional credit.
6. ASSET SECURITIZATIONS
SFAS No. 140, Accounting for Transfers and Servicing of Financial Assets and Extinguishments of Liabilities,relates to the transfer and servicing of financial assets and extinguishments of liabilities. The Statement also provides guidance on the recognition and reclassification of collateral, including disclosures relating to collateral and securitization transactions.
We sold for cash home equity loans in 2003, 2002 and 2001 to revolving securitization structures, and in 2002 and 2001, we also sold automobile loans and credit card receivables. We retain servicing responsibilities and receive servicing fees. On an annualized basis, these fees approximate 0.5% of the outstanding loan balances for the home equity loans, 0.5% for the automobile loans, and 2% for the credit card receivables. We recognized pretax gains from these securitizations of $9.7 million, $6.3 million and $5.6 million in 2003, 2002 and 2001 for the home equity loans, and in 2002 and 2001, $5.8 million and $8.7 million for the automobile loans, and $6.2 million and $6.6 million for the credit card receivables.
We retain subordinated tranche interests or cash reserve accounts that serve as credit enhancements on the securitizations. These retained interests provide us with rights to future cash flows arising after the investors in the securitizations have received the return for which they contracted, and after administrative and other expenses have been paid. The investors and the securitization vehicles have no recourse to other assets of the Company for failure of debtors to pay when due. Our retained interests are subject to credit, prepayment, and interest rate risks on the transferred loans and receivables.
The gain or loss on the sale of loans and receivables is the difference between the proceeds from the sale and the basis of the assets sold. The basis is determined by allocating the previous carrying amount between the assets sold and the retained interests, based on their relative fair values at the date of transfer. Fair values are based upon market prices at the time of sale for the assets and the estimated present value of future cash flows for the retained interests.
In December 2002, the applicable purchase agreements for automobile loans and credit card receivables were terminated under the terms of the respective securitization agreements with the consent of the parties to the agreements and a majority of the beneficial interest holders. As a result, Zions First National Bank (“ZFNB”), one of our banking subsidiaries, repurchased $361.7 million of automobile loans and $68.5 million of credit card receivables at fair value under the terms of the agreements. No gain or loss was recognized as a result of these transactions.
In addition, we sold small business loans in 2003, 2002 and 2001 to securitization structures. In 2001, we also sold nonconforming residential real estate loans (jumbo mortgage loans) to securitization structures. Except for the revolving features, the general characteristics of the securitizations and rights of the Company described above also pertain to these transactions. Annualized servicing fees approximate 1% of the outstanding loan balances for the small business loans and 0.25% for the jumbo mortgage loans. We recognized pretax gains of $2.4 million, $6.7 million and $12.1 million in 2003, 2002 and 2001 for the small business loans, and $1.7 million in 2001 for the jumbo mortgage loans.
In November 2003, ZFNB as servicer exercised its “clean-up call” rights under the provisions of the applicable agreement to purchase back all of the remaining jumbo mortgage loans from the securitization structure. This election was allowed under the
89
terms of the agreement because the stated principal balance of the jumbo mortgage loans was less than 10% of the balance originally securitized. The amount paid of $22.4 million redeemed the stated balances plus any accrued interest, and approximated the fair value of the loans. No gain or loss was recognized as a result of this transaction.
Key economic assumptions used for measuring the retained interests at the date of securitization for sales during 2003, 2002 and 2001 are as follows:
| | | | | | | | | | |
| | | Automobile
loans
| | Credit card
receivables
| | Home equity
loans
| | Small business loans
| | Jumbo mortgage loans
|
2003: | | | | | | | | | | |
Prepayment method | | | | | | NA(1) | | CPR | | |
Annualized prepayment speed | | | | | | NA(1) | | 10, 15
Ramp up | | |
Weighted-average life (in months) | | | | | | 12 | | 62 | | |
Expected annual net loss rate | | | | | | 0.25% | | 0.50% | | |
Residual cash flows discounted at | | | | | | 15.0% | | 15.0% | | |
2002: | | | | | | | | | | |
Prepayment method | | ABS | | ABS | | CPR | | CPR | | |
Annualized prepayment speed | | 16.2% | | 5.0% | | 54.2% | | 15.0% | | |
Weighted-average life (in months) | | 18 | | 3 | | 14 | | 59 | | |
Expected annual net loss rate | | 1.25% | | 4.50% | | 0.25% | | 0.50% | | |
Residual cash flows discounted at | | 15.0% | | 15.0% | | 15.0% | | 15.0% | | |
2001: | | | | | | | | | | |
Prepayment method | | ABS | | ABS | | ABS | | CPR | | CPR |
Annualized prepayment speed | | 16.2% | | 5.0% | | 7.0% | | 5, 10, 15
Ramp up | | 50.0% |
Weighted-average life (in months) | | 18 | | 3 | | 25 | | 68 | | 17 |
Expected annual net loss rate | | 1.25% | | 4.50% | | 0.25% | | 0.50% | | 0.25% |
Residual cash flows discounted at | | 15.0% | | 15.0% | | 15.0% | | 15.0% | | 15.0% |
| (1) | The model for this securitization has been modified to respond to the current interest rate environment and the high volume of refinancings. As a result, there is no assumed prepayment speed. The weighted-average life assumption includes consideration of prepayment to determine the fair value of capitalized residual cash flows. |
Certain cash flows between the Company and the securitization structures are summarized as follows(in millions):
| | | | | | | |
| | | 2003
| | 2002
| | 2001
|
Proceeds from new securitizations | | $ | 587 | | 442 | | 728 |
Proceeds from loans sold into revolving securitizations | | | 331 | | 616 | | 539 |
Proceeds from collections reinvested in previous credit card securitizations | | | – | | 218 | | 227 |
Servicing fees received | | | 16 | | 16 | | 12 |
Other cash flows received on retained interests (1) | | | 87 | | 104 | | 73 |
Repurchase of securitizations | | | (22) | | (430) | | – |
| | |
|
| |
| |
|
| | | $ | 999 | | 966 | | 1,579 |
| | |
|
| |
| |
|
| (1) | Represents total cash flows received from retained interests other than servicing fees. Other cash flows include cash from interest-only strips and cash above the minimum required level in cash collateral accounts. |
We recognize interest income on retained interests in securitizations in accordance with the provisions of Emerging Issues Task Force (“EITF”) Issue No. 99-20,Recognition of Interest Income and Impairment on Purchased and Retained Beneficial Interests in Securitized Financial Assets.Interest income thus recognized, excluding revolving securitizations, was $23.3 million in 2003, $21.0 million in 2002 and $9.2 million in 2001.
Servicing fee income on all securitizations was $16.2 million in 2003, $16.1 million in 2002 and $12.0 million in 2001. All amounts of pretax gains, interest income, and servicing fee income are included in loan sales and servicing income in the statement of income.
90
Key economic assumptions and the sensitivity of the current fair value of capitalized residual cash flows to immediate 10% and 20% adverse changes in those assumptions are as follows at December 31, 2003(in millions of dollars and annualized percentage rates):
| | | | | | | |
| | | | | Home equity loans
| | Small business loans
|
Carrying amount/fair value of capitalized residual cash flows | | | | $ | 9.3 | | 95.8 |
Weighted-average life (in months) | | | | | 12 | | 36 – 61 |
Prepayment speed assumption | | | | | NA(1) | | 15.0% – 20.0%(2) |
Decrease in fair value due to adverse change | | -10% | | $ | NA(1) | | 0.9 |
| | | -20% | | $ | NA(1) | | 2.7 |
| | | |
Expected credit losses | | | | | 0.25% | | 0.50% – 1.3% |
Decrease in fair value due to adverse change | | -10% | | $ | 0.1 | | 1.9 |
| | | -20% | | $ | 0.2 | | 5.0 |
| | | |
Residual cash flows discount rate | | | | | 15.0% | | 15.0% |
Decrease in fair value due to adverse change | | -10% | | $ | 0.1 | | 2.4 |
| | | -20% | | $ | 0.3 | | 4.6 |
| (1) | The model for this securitization has been modified to respond to the current interest rate environment and the high volume of refinancings. As a result, there is no assumed prepayment speed. The weighted-average life assumption includes consideration of prepayment to determine the fair value of capitalized residual cash flows. |
| (2) | The prepayment speed assumption for the 2003 SBA securitization is CPR 10, 15 Ramp up. |
These sensitivities are hypothetical and should be used with caution. As the figures indicate, changes in fair value based on variations in assumptions cannot be extrapolated, as the relationship of the change in assumption to the change of fair value may not be linear. Also, the effect of a variation in one assumption is in reality, likely to further cause changes in other assumptions, which might magnify or counteract the sensitivities.
At December 31, 2003 and 2002, the weighted-average expected static pool credit losses for small business and jumbo mortgage loans (through the date of repurchase) was 2.90% and 2.19%. Static pool losses are calculated by summing the actual and projected future credit losses and dividing them by the original balance of each pool of assets.
The following table presents quantitative information about delinquencies and net credit losses for those categories of loans for which securitizations existed at December 31. The Company only securitizes loans originated or purchased by ZFNB. Therefore, only loans and related delinquencies and net credit losses of commonly managed ZFNB loans are included(in millions):
| | | | | | | | | | | | | | | |
| | | Principal balance
December 31,
| | Principal balance of
loans past due 30+
days(1) December 31,
| | Net credit losses(2)
|
| | | 2003
| | 2002
| | 2003
| | 2002
| | 2003
| | 2002
| | 2001
|
Automobile loans | | $ | NA | | NA | | NA | | NA | | NA | | NA | | 6.4 |
Credit card receivables | | | NA | | NA | | NA | | NA | | NA | | NA | | 4.4 |
Home equity loans | | | 611.6 | | 562.9 | | 0.8 | | 1.3 | | 0.1 | | 0.2 | | 0.7 |
Small business loans | | | 2,303.3 | | 1,843.0 | | 32.4 | | 34.8 | | 6.7 | | 4.0 | | 1.5 |
Jumbo mortgage loans | | | NA | | 109.8 | | NA | | 4.0 | | NA | | 0.4 | | – |
| | |
|
| |
| |
| |
| |
| |
| |
|
Total loans managed or securitized – ZFNB | | | 2,914.9 | | 2,515.7 | | 33.2 | | 40.1 | | 6.8 | | 4.6 | | 13.0 |
| | | | | | | |
| |
| |
| |
| |
|
Less loans securitized – ZFNB(3) | | | 2,145.7 | | 1,878.3 | | | | | | | | | | |
| | |
|
| |
| | | | | | | | | | |
Loans held in portfolio – ZFNB | | $ | 769.2 | | 637.4 | | | | | | | | | | |
| | |
|
| |
| | | | | | | | | | |
| (1) | Loans greater than 30 days past due based on end of period total loans. |
| (2) | Net credit losses are charge-offs net of recoveries and are based on total loans outstanding. |
| (3) | Represents the principal amount of the loans. Interest-only strips and other retained interests held for securitized assets are excluded because they are recognized separately. |
91
ZFNB provides a liquidity facility (“Liquidity Facility”) for a fee to Lockhart Funding, LLC (“Lockhart”), a qualifying special-purpose entity securities conduit. Lockhart purchases floating rate U.S. Government and AAA-rated securities with funds from the issuance of commercial paper. ZFNB also provides for a fee hedge support and administrative and investment advisory services. Pursuant to the Liquidity Facility contract, ZFNB is required to purchase securities from Lockhart to provide funds for Lockhart to repay maturing commercial paper upon Lockhart’s inability to access the commercial paper market, or upon a commercial paper market disruption as specified in governing documents for Lockhart. Under the liquidity agreement, ZFNB is required to purchase at book value any security in Lockhart that is downgraded below AA-. Prior to such purchase, ZFNB has the option to place its letter of credit on the security or obtain credit enhancement from a third party. At any given time, the maximum commitment of ZFNB is the lesser of the size of the Liquidity Facility commitment or the book value of Lockhart’s securities portfolio. At December 31, 2003, the size of the Liquidity Facility commitment was $5.1 billion and the book value of Lockhart’s securities portfolio was approximately $4.7 billion, which approximated market value. No amounts were outstanding under the Liquidity Facility at December 31, 2003. Subsequent to December 31, 2003, we are in the process of increasing the size of the Liquidity Facility commitment to $6.1 billion, subject to rating agency approval.
In June 2003, the FASB issued for public comment an Exposure Draft,Qualifying Special-Purpose Entities and Isolation of Transferred Assets,that would amend SFAS 140. This new guidance proposes to change the requirements that an entity must meet to be considered a qualifying special-purpose entity. If this guidance were adopted as presently proposed, we would be required to consolidate Lockhart in our financial statements. The FASB is looking at revising the Exposure Draft, but is currently determining the nature and extent of any revisions based on certain questions raised, including those by banking regulators. In light of these developments, we are considering our business options with regard to the ongoing operations of Lockhart.
7. DERIVATIVE INSTRUMENTS AND HEDGING ACTIVITIES
SFAS 133, as amended, establishes accounting and reporting standards for derivative instruments, including certain derivative instruments embedded in other contracts, and for hedging activities. The issuance in April 2003 of SFAS No. 149,Amendment of FASB Statement No. 133 on Derivatives and Hedging Transactions,did not materially impact our accounting for derivative instruments.
As required by SFAS 133, we record all derivatives on the balance sheet at fair value. The accounting for changes in the fair value of derivatives depends on the intended use of the derivative and the resulting designation. Derivatives used to hedge the exposure to changes in the fair value of an asset, liability, or firm commitment attributable to a particular risk, such as interest rate risk, are considered fair value hedges under SFAS 133. Derivatives used to hedge the exposure to variability in expected future cash flows, or other types of forecasted transactions, are considered cash flow hedges.
For derivatives designated as fair value hedges, changes in the fair value of the derivative and the hedged item related to the hedged risk are recognized in earnings. For derivatives designated as cash flow hedges, the effective portion of changes in the fair value of the derivative are recorded in other comprehensive income and recognized in earnings when the hedged transaction affects earnings. The ineffective portion of changes in the fair value of cash flow hedges is recognized directly in earnings. We assess the effectiveness of each hedging relationship by comparing the changes in fair value or cash flows on the derivative hedging instrument with the changes in fair value or cash flows on the designated hedged item or transaction. For derivatives not designated as hedges, changes in fair value are recognized in earnings. On January 1, 2001, all hedging relationships were designated anew by the Company in accordance with the provisions of SFAS 133.
Our objective in using derivatives is to add stability to interest income or expense, to modify the duration of specific assets or liabilities as we consider necessary, and to manage exposure to interest rate movements or
92
other identified risks. To accomplish this objective, we use interest rate swaps as part of our cash flow hedging strategy. The derivatives are used to hedge the variable cash flows associated with designated commercial loans and certain securities.
Exposure to credit risk arises from the possibility of nonperformance by counterparties. These counterparties primarily consist of financial institutions that are well established and well capitalized. We control this credit risk through credit approvals, limits, and monitoring procedures. No losses on derivative instruments have occurred as a result of counterparty nonperformance. Nevertheless, the related credit risk is considered and measured when and where appropriate.
Beginning in 2002, we used fair value hedges to manage interest rate exposure to certain long-term debt. In 2001, fair value hedge ineffectiveness of $4.3 million (a net gain) was recognized in other noninterest income from a qualifying fair value hedge of an investment. No other hedge ineffectiveness has since occurred for fair value hedges. As of December 31, 2003, no derivatives were designated for hedges of investments in foreign operations.
Interest rate swap agreements designated as cash flow hedges involve the receipt of fixed-rate amounts in exchange for variable-rate payments over the life of the agreements without exchange of the underlying principal amount. Basis swap agreements designated as cash flow hedges are used in conjunction with certain interest rate swaps and are used to convert the variable rate paid on an interest rate swap to match the variable rate received from a loan. Derivatives not designated as hedges are not speculative and are used to manage our exposure to interest rate movements and other identified risks, but do not meet the strict hedge accounting requirements of SFAS 133.
Our adoption of SFAS 133 resulted in transition adjustments presented as cumulative effect adjustments in the 2001 statement of income and in the statement of changes in shareholders’ equity and comprehensive income. The transition adjustments relate to the recording of the fair value of derivatives on the balance sheet, and the effect of transferring certain held to maturity investments to either the trading or available for sale categories, as allowed by the transition provisions of SFAS 133. The total amount of held to maturity securities transferred was approximately $3.1 billion.
The 2001 cumulative effect adjustments are summarized as follows(in thousands):
| | | | | | | | | | | | | | |
| | | In operations
| | In other comprehensive income
|
| | | Amount
| | Tax benefit
| | Net of tax
| | Amount
| | Tax
expense
| | Net of tax
|
Transfer of investments | | $ | (11,246) | | (4,355) | | (6,891) | | $ | 21,331 | | 8,072 | | 13,259 |
Derivative instruments: | | | | | | | | | | | | | | |
Basis swaps | | | (434) | | (166) | | (268) | | | | | | | |
| | |
|
| |
| |
| | | | | | | |
Cumulative effect in statement of income | | $ | (11,680) | | (4,521) | | (7,159) | | | | | | | |
| | |
|
| |
| |
| | | | | | | |
Interest rate swaps | | | | | | | | | | 34,439 | | 13,173 | | 21,266 |
| | | | | | | | | |
|
| |
| |
|
Cumulative effect in other comprehensive income | | | | | | | | | $ | 55,770 | | 21,245 | | 34,525 |
| | | | | | | | | |
|
| |
| |
|
93
Selected information with respect to notional amounts, recorded fair values, and related income of derivative instruments is summarized as follows(in thousands):
| | | | | | | | | | | | | | | | | | | | | | | | | |
| | | December 31, 2003
| | Year ended December 31, 2003
| | December 31, 2002
| | Year ended December 31, 2002
|
| | | Notional
amount
| | Fair value
| | Interest
income
| | Other
income
| | Offset to
interest
expense
| | Notional
amount
| | Fair value
| | Interest
income
| | Other
income
| | Offset to
interest
expense
|
| | | Asset
| | Liability
| | | | | | Asset
| | Liability
| | | |
Cash flow hedges | | | | | | | | | | | | | | | | | | | | | | | | | |
Interest rate swaps | | $ | 1,831,000 | | 20,482 | | 10,323 | | 43,167 | | | | | | 1,195,000 | | 33,409 | | | | 34,979 | | | | |
Basis swaps | | | 170,000 | | | | 23 | | (177) | | | | | | 245,000 | | 59 | | | | (63) | | | | |
| | |
|
| |
| |
| |
| | | | | |
| |
| | | |
| | | | |
| | | | 2,001,000 | | 20,482 | | 10,346 | | 42,990 | | | | | | 1,440,000 | | 33,468 | | | | 34,916 | | | | |
Nonhedges | | | | | | | | | | | | | | | | | | | | | | | | | |
Interest rate swaps | | | 767,621 | | 13,806 | | 2,954 | | | | 1,857 | | | | 1,501,848 | | 50,854 | | 33,490 | | | | 14,722 | | |
Basis swaps | | | 2,445,000 | | 272 | | 947 | | | | 132 | | | | 965,000 | | 158 | | 333 | | | | (347) | | |
| | |
|
| |
| |
| | | |
| | | |
| |
| |
| | | |
| | |
| | | | 3,212,621 | | 14,078 | | 3,901 | | | | 1,989 | | | | 2,466,848 | | 51,012 | | 33,823 | | | | 14,375 | | |
Fair value hedges | | | | | | | | | | | | | | | | | | | | | | | | | |
Long-term debt and
other borrowings | | | 960,125 | | 39,425 | | | | | | | | 22,561 | | 385,125 | | 24,913 | | | | | | | | 5,516 |
| | |
|
| |
| |
| |
| |
| |
| |
| |
| |
| |
| |
| |
|
Total | | $ | 6,173,746 | | 73,985 | | 14,247 | | 42,990 | | 1,989 | | 22,561 | | 4,291,973 | | 109,393 | | 33,823 | | 34,916 | | 14,375 | | 5,516 |
| | |
|
| |
| |
| |
| |
| |
| |
| |
| |
| |
| |
| |
|
Other income is included in market making, trading and nonhedge derivative income. Interest income on fair value hedges is used to offset interest expense on long-term debt. The change in net unrealized gains for derivatives designated as cash flow hedges is separately disclosed in the statement of changes in shareholders’ equity and comprehensive income. No hedge ineffectiveness on cash flow hedges was recognized in 2003, 2002 or 2001.
Amounts reported in accumulated other comprehensive income related to derivatives will be reclassified to interest income as interest payments are received on our variable rate loans. The change in net unrealized gains on cash flow hedges discussed above reflects a reclassification of net unrealized gains from accumulated other comprehensive income to interest income, as disclosed in the statement of changes in shareholders’ equity and comprehensive income. For 2004, we estimate that an additional $37 million will be reclassified.
In January 2004, the FASB issued for public comment SFAS 133 Implementation Issue No. G25,Cash Flow Hedges: Hedging the Variable Interest Payments on a Group of Prime-Rate Based Interest Bearing Loans(“Issue G25”). Issue G25 proposes to no longer allow companies to identify the hedged transaction on a specified level of prime-rate based interest payments that are received during a given time period on an unspecified portfolio of prime-rate based loans.
8. VARIABLE INTEREST ENTITIES
In January 2003, the FASB issued FIN 46, which provides guidance on identifying a variable interest entity (“VIE”) and determining when a company must consolidate in its financial statements the assets, liabilities, and results of activities of a VIE. A company is required to consolidate a VIE if it is determined to be the primary beneficiary. The primary beneficiary of a VIE is the party that absorbs a majority of the entity’s expected losses, receives a majority of its expected residual returns, or both.
In December 2003, the FASB issued a revised FIN 46 (“FIN 46R”) that replaced FIN 46 and effectively modified and clarified certain provisions of FIN 46 and modified the effective date for certain entities.
We have applied FIN 46 as of December 31, 2003 with respect to the trust preferred securities described in Note 14. The trusts involved in the borrowing arrangements are special-purpose entities that have been consolidated in the financial statements since their inception or acquisition.
We determined as of December 31, 2003 that we are the primary beneficiary of the trust preferred security structure. This determination was made based on the following: (1) we adopted FIN 46 (not FIN 46R) as of December 31, 2003, (2) we had not previously applied the provisions of FIN 46 and deconsolidated the trust, (3) we have the ability to call the preferred
94
securities, and (4) we are the primary beneficiary based on an analysis that the call option provides us with the majority of the expected residual returns of the trust. However, FIN 46R effectively removed the ability of companies in these same circumstances to make the above argument, and accordingly, the call option will not permit companies to be the primary beneficiary of the trusts. We will therefore deconsolidate the trusts in the first quarter of 2004 when FIN 46R is adopted. We estimate this deconsolidation will not have a material effect on our results of operations, financial position, or liquidity.
The following discusses our involvement with VIEs for which FIN 46 or FIN 46R was applicable, that have not been consolidated in our financial statements as of December 31, 2003:
Identrus, LLC is engaged in the development and sale of e-commerce digital certification and is owned by a global consortium of banks. In May 2002, we completed the sale of our Digital Signature Trust Co. subsidiary to Identrus for an approximate 33% ownership position. We provided an additional capital contribution of approximately $2.0 million in December 2003 increasing our ownership to approximately 36%. Our recorded investment in Identrus at December 31, 2003 is $6.4 million, which approximates our maximum exposure to loss. Based on an analysis of expected losses and residual returns, we have concluded that we are not the primary beneficiary. Accordingly, we continue to account for Identrus under the equity method of accounting.
ZCA Investment Trust is a special-purpose entity set up as a result of the sale of our investment in Concord EFS, Inc. The trust held shares of Concord stock and forward sales contracts contributed in September 2001 by the Company and an affiliate of the counterparty to the forward sales contracts. The affiliate prepaid 82% of the securities’ value and the trust purchased $78 million in certificates of deposit from the Company. Based on an analysis of expected losses and residual returns, we have concluded that we are not the primary beneficiary of this trust.
We continue to review the impact of adopting FIN 46R beginning in 2004. Based on the clarifications made in FIN 46R, we do not expect that any of our troubled debt restructurings will be subject to the provisions of FIN 46R, as our policy is to not take an equity position with a troubled borrower. We are in the process of analyzing the effect of FIN 46R on low income housing lending and other equity investments. As of December 31, 2003, we have not identified any other arrangements that will require consolidation or deconsolidation in 2004 under FIN 46R.
As described in Note 6, ZFNB holds variable interests in securitization structures. All of these structures are qualifying special-purpose entities, which are exempt from the consolidation requirements of FIN 46.
9. PREMISES AND EQUIPMENT
Premises and equipment are summarized as follows at December 31(in thousands):
| | | | | |
| | | 2003
| | 2002
|
Land | | $ | 82,536 | | 70,269 |
Buildings | | | 229,692 | | 218,638 |
Furniture and equipment | | | 360,345 | | 350,220 |
Leasehold improvements | | | 93,036 | | 90,569 |
| | |
|
| |
|
Total | | | 765,609 | | 729,696 |
Less accumulated depreciation and amortization | | | 357,784 | | 336,066 |
| | |
|
| |
|
Net book value | | $ | 407,825 | | 393,630 |
| | |
|
| |
|
95
10. GOODWILL AND OTHER INTANGIBLE ASSETS
Core deposit and other intangible assets and related amortization are as follows at December 31(in thousands):
| | | | | | | | | | | | | |
| | | Gross carrying amount
| | Accumulated
amortization
| | Net carrying amount
|
| | | 2003
| | 2002
| | 2003
| | 2002
| | 2003
| | 2002
|
Core deposit intangibles | | $ | 143,620 | | 143,620 | | (76,623) | | (62,650) | | 66,997 | | 80,970 |
Other intangibles | | | 2,016 | | 2,000 | | (266) | | (50) | | 1,750 | | 1,950 |
| | |
|
| |
| |
| |
| |
| |
|
| | | $ | 145,636 | | 145,620 | | (76,889) | | (62,700) | | 68,747 | | 82,920 |
| | |
|
| |
| |
| |
| |
| |
|
The amount of amortization expense of core deposit and other intangible assets is separately reflected in the statement of income. We have no intangible assets with indefinite lives.
Estimated amortization expense for core deposit and other intangible assets is as follows for the five years succeeding December 31, 2003(in thousands):
| | | |
2004 | | $ | 13,603 |
2005 | | | 13,415 |
2006 | | | 13,291 |
2007 | | | 11,752 |
2008 | | | 5,274 |
Changes in the carrying amount of goodwill by operating segment are as follows(in thousands):
| | | | | | | | | | | | | | | | | |
| | | Zions First National Bank and Subsidiaries
| | California Bank & Trust
| | Nevada State Bank
| | National Bank of Arizona
| | Vectra Bank Colorado
| | The Commerce Bank of Washington
| | Other
| | Consolidated Company
|
Balance as of January 1, 2002 | | $ | 11,533 | | 387,387 | | 21,051 | | 57,168 | | 239,232 | | – | | 54,392 | | 770,763 |
Goodwill acquired during the year | | | 1,782 | | | | | | 3,896 | | | | | | | | 5,678 |
Impairment losses | | | | | | | | | | | | | | | (46,682) | | (46,682) |
Goodwill reclassified to discontinued operations | | | | | | | | | | | | | | | (546) | | (546) |
Goodwill written off from sale of branch businesses | | | | | (1,082) | | | | | | | | | | | | (1,082) |
Goodwill pushdown from parent | | | 7,989 | | | | | | 1,142 | | 16 | | | | (9,147) | | – |
Other adjustments, including contingent consideration paid | | | (8) | | (474) | | | | 446 | | (47) | | | | 1,983 | | 1,900 |
| | |
|
| |
| |
| |
| |
| |
| |
| |
|
Balance as of December 31, 2002 | | | 21,296 | | 385,831 | | 21,051 | | 62,652 | | 239,201 | | – | | – | | 730,031 |
Impairment losses | | | | | | | | | | | (75,628) | | | | | | (75,628) |
Other adjustments | | | 4 | | | | | | (255) | | | | | | | | (251) |
| | |
|
| |
| |
| |
| |
| |
| |
| |
|
Balance as of December 31, 2003 | | $ | 21,300 | | 385,831 | | 21,051 | | 62,397 | | 163,573 | | – | | – | | 654,152 |
| | |
|
| |
| |
| |
| |
| |
| |
| |
|
96
In June 2002, we completed all goodwill impairment testing required under the transitional provisions of SFAS 142. Impairment losses of $32.4 million (net of income tax benefit of $2.7 million) were recognized as of January 1, 2002 as a cumulative effect adjustment in accordance with SFAS 142. This adjustment relates to the impairment in carrying value of our investments in certain e-commerce subsidiaries included in the “Other” operating segment. The impairment amount was determined by comparing the carrying value of these subsidiaries to their fair value at January 1, 2002, which was estimated from comparable market values including price-to-revenue multiples. In September 2002, additional impairment losses were recognized on these e-commerce subsidiaries, as discussed in Note 16.
In September 2003, we recognized an impairment loss on goodwill of $75.6 million related to the restructuring of Vectra Bank Colorado (“Vectra”). The restructuring resulted from steps that Vectra has taken to improve performance, including the engagement of a national consulting firm to analyze its operations and improve profitability. As a result of this analysis, Vectra is restructuring to refocus its marketing efforts.
Part of the impairment loss consisted of $7.1 million related to the pending sale of 11 branch businesses in Colorado, which is expected to close sometime in the first half of 2004. The amount was determined by comparing the carrying value of the branches to their fair value based on bids, letters of intent and current negotiations.
The remaining $68.5 million related to an impairment analysis on the retained operations of Vectra performed as part of the restructuring. The amount was determined based on the calculation process specified in SFAS 142, which compares carrying value to the determined fair values of assets and liabilities excluding the branches held for sale. The determination of the fair values was made with the assistance of independent valuation consultants by a combination of an income approach using a discounted projected cash flow analysis and market value approaches using guideline companies and acquisition transactions.
During the fourth quarter of 2003, we completed the annual impairment review required by SFAS 142 and did not recognize any additional impairment losses.
Transitional disclosures under SFAS 142 to adjust 2001 net income for the add back of goodwill amortization are as follows(in thousands, except per share amounts):
| | | | | | | |
| | | As reported
| | Goodwill amortization(1)
| | As adjusted
|
Net income for 2001 | | $ | 283,020 | | 33,056 | | 316,076 |
Net income per common share: | | | | | | | |
Basic | | $ | 3.10 | | 0.36 | | 3.46 |
Diluted | | $ | 3.07 | | 0.36 | | 3.43 |
| | | |
| (1) Net of income tax benefit. | | | | | | | |
Of the amount of goodwill amortization added back in 2001, $2.4 million was subsequently included with discontinued operations. See related discussion in Note 16.
11. DEPOSITS
At December 31, 2003, the scheduled maturities of all time deposits are as follows(in thousands):
| | | |
2004 | | $ | 2,055,757 |
2005 | | | 358,308 |
2006 | | | 115,339 |
2007 | | | 121,932 |
2008 and thereafter | | | 83,405 |
| | |
|
|
| | | $ | 2,734,741 |
| | |
|
|
At December 31, 2003, the contractual maturities of time deposits with a denomination of $100,000 and over were as follows: $405 million in 3 months or less, $221 million over 3 months through 6 months, $312 million over 6 months through 12 months, and $289 million over 12 months.
Deposit overdrafts reclassified as loan balances were $44 million and $77 million at December 31, 2003 and 2002, respectively.
97
12. SHORT-TERM BORROWINGS
Selected information for short-term borrowings is as follows(in thousands):
| | | | | | | |
| | | 2003
| | 2002
| | 2001
|
Federal funds purchased: | | | | | | | |
Average amount outstanding | | $ | 1,298,761 | | 1,167,762 | | 1,046,859 |
Weighted-average rate | | | 1.09% | | 1.67% | | 3.74% |
Highest month-end balance | | $ | 1,694,841 | | 1,991,882 | | 1,492,262 |
Year-end balance | | $ | 1,370,619 | | 819,807 | | 1,203,764 |
Weighted average rate on outstandings at year-end | | | 0.97% | | 1.03% | | 1.68% |
| | | |
Security repurchase agreements: | | | | | | | |
Average amount outstanding | | $ | 1,306,041 | | 1,360,395 | | 1,621,539 |
Weighted-average rate | | | 0.87% | | 1.44% | | 3.50% |
Highest month-end balance | | $ | 1,421,771 | | 1,871,728 | | 2,021,895 |
Year-end balance | | $ | 841,170 | | 861,177 | | 933,973 |
Weighted average rate on outstandings at year-end | | | 0.59% | | 0.83% | | 1.27% |
Short-term borrowings generally mature in less than 30 days. Our participation in security repurchase agreements is on an overnight or term basis. Certain overnight agreements are performed with sweep accounts in conjunction with a master repurchase agreement. In this case, securities under our control are pledged for and interest is paid on the collected balance of the customers’ accounts. For term repurchase agreements, securities are transferred to the applicable counterparty. The counterparty, in certain instances, is contractually entitled to sell or repledge securities accepted as collateral. As of December 31, 2003, overnight security repurchase agreements were $708.4 million and term security repurchase agreements were $132.8 million.
13. FEDERAL HOME LOAN BANK ADVANCES AND OTHER BORROWINGS
Federal Home Loan Bank (“FHLB”) advances and other borrowings over one year are summarized as follows at December 31(in thousands):
| | | | | |
| | | 2003
| | 2002
|
FHLB advances, 3.66% – 8.33% | | $ | 224,440 | | 225,198 |
SBA notes payable, 2.25% – 7.64% | | | 7,000 | | 15,500 |
| | |
|
| |
|
| | | $ | 231,440 | | 240,698 |
| | |
|
| |
|
The weighted-average interest rate on FHLB advances outstanding at December 31, 2003 and 2002 was 4.9% and 5.0%, respectively.
The FHLB advances are borrowed by banking subsidiaries under their lines of credit, which are secured under a blanket pledge arrangement. The subsidiaries maintain unencumbered collateral with a carrying amount adjusted for the types of collateral pledged, equal to at least 100% of outstanding advances.
Interest expense on FHLB advances and other borrowings over one year was $12.3 million in 2003, $12.5 million in 2002, and $11.1 million in 2001.
Maturities of FHLB advances and other borrowings with original maturities over one year are as follows at December 31, 2003(in thousands):
| | | |
2004 | | $ | 2,580 |
2005 | | | 2,343 |
2006 | | | 2,343 |
2007 | | | 2,335 |
2008 | | | 4,288 |
Thereafter | | | 217,551 |
| | |
|
|
| | | $ | 231,440 |
| | |
|
|
98
14. LONG-TERM DEBT
Long-term debt at December 31 is summarized as follows(in thousands):
| | | | | |
| | | 2003
| | 2002
|
Guaranteed preferred beneficial interests in junior subordinated deferrable interest debentures | | $ | 495,099 | | 511,172 |
Subordinated notes | | | 724,741 | | 510,000 |
Senior medium-term notes: | | | | | |
Floating rate | | | 239,833 | | 46,138 |
Fixed rate | | | 150,326 | | – |
Capital lease obligations and other | | | 1,619 | | 2,195 |
| | |
|
| |
|
| | | $ | 1,611,618 | | 1,069,505 |
| | |
|
| |
|
The amounts above represent the par value of the debt adjusted for any unamortized discount or other basis adjustments related to hedging the debt with derivative instruments.
The guaranteed preferred beneficial interests in junior subordinated deferrable interest debentures include $170.1 million of 8.536% trust preferred securities issued by Zions Institutional Capital Trust A (“ZICTA”), $22.0 million of 11.75% trust preferred securities issued by CSBI Capital Trust I (“CSBICT”), and $2.2 million of 10.25% trust preferred securities issued by GB Capital Trust (“GBCT”). Each series of trust preferred securities relates to a corresponding series of junior subordinated deferrable interest debentures issued by us or ZFNB (referred to as the “ZICTA debentures,” the “CSBICT debentures” and the “GBCT debentures,” respectively) to the trusts identified above. We became obligated with respect to the CSBICT and GBCT debentures as a result of the acquisitions of Eldorado Bancshares and GB Ban-corporation, respectively.
The ZICTA and GBCT debentures require semiannual interest payments and mature in December 2026 and January 2027, respectively. The CSBICT debentures require quarterly interest payments and mature in June 2027. All of these series of debentures are subject, with the approval of banking regulators, to early redemption beginning in 2006 and 2007. The CSBICT and GBCT debentures are direct and unsecured obligations subordinate to other indebtedness and general creditors of the Company. The ZICTA debentures are direct and unsecured obligations of ZFNB and are subordinate to the claims of depositors and general creditors. The Company has unconditionally guaranteed the obligations of ZICTA, CSBICT and GBCT with respect to their respective series of trust preferred securities to the extent set forth in the applicable guarantee agreements. The Company has also unconditionally guaranteed the obligations of ZFNB with respect to the ZICTA debentures to the extent set forth in the applicable guarantee agreement.
The preferred beneficial interests also include $285 million of 8.0% trust preferred securities issued in August 2002 by Zions Capital Trust B (“ZCTB”). These trust preferred securities relate to a corresponding series of junior subordinated deferrable interest debentures issued by us (the “ZCTB debentures”). The ZCTB debentures require quarterly interest payments and mature in September 2032. The debentures are subject, with the approval of banking regulators, to early redemption beginning in September 2007. These debentures are direct and unsecured obligations of the Company and are subordinate to other indebtedness and general creditors. The Company has unconditionally guaranteed the obligations of ZCTB with respect to the trust preferred securities issued by it to the extent set forth in the applicable guarantee agreement. The trust preferred securities, debentures and our guarantees are registered with the Securities and Exchange Commission.
We have agreements to hedge the ZICTA and $140 million of the ZCTB debentures. The fair value hedge derivatives are accounted for in accordance with SFAS 133, as discussed in Note 7. They are recorded at their fair value of $15.8 million at December 31, 2003 in the balance sheet with their related long-term debt amounts. These fair value hedges are interest rate swaps with early redemption dates consistent with the related debt.
As discussed in Note 8, we will deconsolidate the trusts involved in these trust preferred borrowing arrangements beginning in 2004.
99
The subordinated notes include $200 million of 6.95% notes issued through a subsidiary, Zions Financial Corp., and $200 million of 6.50% notes issued by the Company. In September 2003, we conducted a “modified Dutch auction” tender offer in which we repurchased $95.8 million of the 6.95% notes and $101.6 million of the 6.50% notes, or a total repurchase of $197.4 million. The associated debt extinguishment cost of $24.2 million is separately included in noninterest expense in the statement of income. Early redemption for these notes may occur beginning in May and October 2006, respectively. At that time, the notes will bear interest at one-month LIBOR plus 2.86% and one-month LIBOR plus 3.01% through maturity in May and October 2011, respectively. Each series of notes requires semiannual interest payments. The Company has unconditionally guaranteed the 6.95% notes.
Also included in subordinated notes are $500 million at par of 6.00% subordinated notes due in September 2015. These notes are not redeemable prior to maturity and require semiannual interest payments. We hedged these notes with LIBOR-based floating interest rate swaps whose recorded fair value was $23.1 million at December 31, 2003. This new debt is part of a $1,050 million shelf registration statement filed with the Securities and Exchange Commission in August 2003 for the issuance of senior or subordinated debt at fixed or floating rates.
The floating rate senior medium-term notes at December 31, 2003 consist of $240 million at par of notes that require quarterly interest payments at three-month LIBOR plus 50 basis points. Maturities for these notes range from January to August 2005; however, each issuance of notes is redeemable one year prior to its maturity.
The fixed rate senior medium-term notes consist of $150 million at par of notes that require semiannual interest payments at 2.70% commencing May 2004 through maturity in May 2006. These notes are not redeemable prior to maturity. We hedged these notes with LIBOR-based floating interest rate swaps whose recorded fair value was $0.5 million at December 31, 2003.
Interest expense on long-term debt was $57.3 million in 2003, $56.3 million in 2002, and $42.7 million in 2001. Interest expense was reduced by $22.6 million in 2003 and $5.5 million in 2002 as a result of the associated hedges.
Maturities on long-term debt are as follows for the years succeeding December 31, 2003(in thousands):
| | | | | |
| | | Consolidated
| | Parent only
|
2004 | | $ | 431 | | |
2005 | | | 240,168 | | 239,833 |
2006 | | | 150,592 | | 150,326 |
2007 | | | 92 | | |
2008 | | | 88 | | |
Thereafter | | | 1,220,247 | | 945,294 |
| | |
|
| |
|
| | | $ | 1,611,618 | | 1,335,453 |
| | |
|
| |
|
Parent only maturities on long-term debt include $324.7 million of subordinated debt payable to CSBICT, GBCT and ZCTB after 2008.
15. SHAREHOLDERS’ EQUITY
We have in place a Shareholder Rights Protection Plan (“Plan”) which contains provisions intended to protect our shareholders if certain events occur. These events include, but are not limited to, unsolicited offers or attempts to acquire the Company including offers that do not treat all shareholders equally, acquisitions in the open market of shares constituting control without offering fair value to all shareholders, and other coercive or unfair takeover tactics that could impair our Board of Directors’ ability to fully represent shareholders’ interests. The Plan provides that attached to each share of common stock is one right (“Right”) to purchase one one-hundredth of a share of participating preferred stock for an exercise price of $90, subject to adjustment. The Rights have certain antitakeover effects and may cause substantial dilution to a person who attempts to acquire the Company without the approval of the Board of Directors. The Rights, however, should not affect offers for all outstanding shares of common stock at a fair price or are otherwise in the best interests of the Company and its shareholders as determined by the Board of Directors. The Board of Directors may at its option redeem all, but not fewer than all, of the then outstanding Rights at any time until the 10th business day following a
100
public announcement that a person or a group had acquired beneficial ownership of 10% or more of our outstanding common stock or total voting power.
As authorized by our Board of Directors, we repurchased and retired 2,083,101 shares of our common stock in 2003 at a cost of $106.8 million, 2,393,881 shares in 2002 at a cost of $113.2 million, and 883,240 shares in 2001 at a cost of $46.5 million. In January 2004, the Board of Directors authorized $50 million for share repurchases, superseding the balance remaining under the prior authorization.
In April 2001, we reacquired the total minority interest of our California Bank & Trust subsidiary for $66.0 million. The amount was based on the terms of the applicable minority shareholder agreement. The carrying value of this minority interest at that time was $37.8 million.
During the second quarter of 2003, we began accounting for a new and a previously formed deferred compensation rabbi trust established for certain employees and directors. We followed the guidance in EITF Issue No. 97-14,Accounting for Deferred Compensation Arrangements Where Amounts Earned Are Held in a Rabbi Trust and Invested. Amounts deferred are held in rabbi trusts and invested in diversified assets or shares of the Company’s stock, subject to plan limitations. We consolidate the assets and obligations of the trusts in our financial statements. Amounts invested in the Company’s stock are recorded at cost in shareholders’ equity in a manner similar to the accounting for treasury stock. At December 31, 2003, total invested assets of the trusts were approximately $23.8 million and are included in other assets. The deferred compensation obligations were approximately $27.4 million and are included in other liabilities. There is no effect on net income. The previously formed rabbi trust had not been consolidated as the deferred amounts were not considered material.
16. DISCONTINUED OPERATIONS, IMPAIRMENT LOSSES, AND RESTRUCTURING CHARGES
In September 2002, we decided to discontinue the operations of the e-commerce subsidiaries discussed in Note 10. We determined that our plan to restructure and offer all or part of these subsidiaries for sale met the held for sale and discontinued operations criteria of SFAS No. 144,Accounting for the Impairment or Disposal of Long-Lived Assets. We adopted SFAS 144 effective January 1, 2002.
Summarized information for the loss from operations of discontinued subsidiaries is as follows(in thousands):
| | | | | | | |
| | | 2003
| | 2002
| | 2001
|
Noninterest income | | $ | 3,001 | | 7,414 | | 7,197 |
Noninterest expense | | | 3,467 | | 25,718 | | 19,684 |
| | |
|
| |
| |
|
Pretax loss from operations of discontinued subsidiaries | | $ | (466) | | (18,304) | | (12,487) |
| | |
|
| |
| |
|
Additional pretax impairment losses of $28.7 million in 2002 for these subsidiaries are included as a separate line item with discontinued operations. Of this amount, $11.6 million related to goodwill impairment. The amounts of these impairment losses were determined by comparing the carrying amounts of these subsidiaries to their fair values, less costs to sell. Fair values were determined based on amounts offered in sales negotiations and market comparables.
In December 2002, we completed the sale of one of these subsidiaries, Phaos Technology Corp., and recognized a $5.3 million income tax benefit, which is included with other income tax benefits in discontinued operations. In September 2003, we sold the remaining subsidiary, Lexign, Inc., and recognized a pretax loss on sale of $2.4 million.
101
No assets or liabilities of discontinued operations were included in the balance sheet at December 31, 2003. Assets and liabilities of discontinued operations included in other assets and other liabilities in the balance sheet at December 31, 2002 are summarized as follows(in thousands):
| | | |
Assets: | | | |
Cash and due from banks | | $ | 657 |
Interest-bearing deposits | | | 186 |
Premises and equipment, net | | | 334 |
Other intangibles | | | 358 |
Other assets | | | 1,506 |
| | |
|
|
Total assets | | | 3,041 |
| |
Liabilities: | | | |
Other liabilities | | | 3,788 |
| | |
|
|
Total liabilities | | | 3,788 |
Impairment losses on long-lived assets in continuing operations relate to certain software, including software of other continuing e-commerce activities, and to certain branch closings in 2003 by ZFNB. Recorded amounts of $2.7 million in 2003 and $4.9 million in 2002 include for 2003 and 2002, respectively, $1.2 million and $2.7 million in ZFNB, $1.0 million and $2.2 million in the Other operating segment, and in 2003, $0.5 million in Vectra. Impairment losses were determined by comparing the carrying value to fair value, estimated by using discounted cash flow approaches.
We follow the guidance of SFAS No. 146,Accounting for Costs Associated with Exit or Disposal Activities,to account for restructuring charges. This Statement requires companies to recognize costs associated with the exit or disposal of activities as they are incurred rather than at the date a plan or commitment to exit is initiated. The adoption of this Statement did not have a material impact on our results of operations.
In 2003, the restructuring charges of $1.9 million consist of $1.4 million in consulting fees for the Vectra restructuring discussed in Note 10 and $0.5 million for certain branch closings in Utah. In 2002, the restructuring charges related primarily to certain branch closings and to the restructuring of trust operations and administrative functions. The recorded amount of $3.3 million included severance costs of $1.8 million and occupancy-related costs of $1.5 million.
17. INCOME TAXES
Income taxes (benefit) are summarized as follows(in thousands):
| | | | | | | |
| | | 2003
| | 2002
| | 2001
|
Continuing operations: | | | | | | | |
Federal: | | | | | | | |
Current | | $ | 190,013 | | 136,050 | | 130,700 |
Deferred | | | (13,529) | | 2,837 | | 6,135 |
State | | | 37,267 | | 28,815 | | 25,032 |
| | |
|
| |
| |
|
| | | | 213,751 | | 167,702 | | 161,867 |
| | |
|
| |
| |
|
Discontinued operations: | | | | | | | |
Federal | | | (946) | | (15,150) | | (3,260) |
State | | | (157) | | (3,385) | | (807) |
| | |
|
| |
| |
|
| | | | (1,103) | | (18,535) | | (4,067) |
| | |
|
| |
| |
|
Cumulative effect adjustments: | | | | | | | |
Federal | | | – | | (2,143) | | (3,855) |
State | | | – | | (533) | | (666) |
| | |
|
| |
| |
|
| | | | – | | (2,676) | | (4,521) |
| | |
|
| |
| |
|
Income tax expense | | $ | 212,648 | | 146,491 | | 153,279 |
| | |
|
| |
| |
|
Income tax expense on continuing operations computed at the statutory federal income tax rate of 35% reconciles to actual income tax expense as follows(in thousands):
| | | | | | | |
| | | 2003
| | 2002
| | 2001
|
Income tax expense | | | | | | | |
at statutory federal rate | | $ | 191,156 | | 168,402 | | 158,434 |
State income taxes, net | | | 24,223 | | 18,730 | | 16,270 |
Nondeductible expenses | | | 32,051 | | 2,667 | | 12,178 |
Nontaxable interest | | | (17,445) | | (18,576) | | (12,870) |
Tax credits and other taxes | | | (2,116) | | (2,343) | | (2,056) |
Corporate reorganization | | | (10,923) | | – | | (6,416) |
Other | | | (3,195) | | (1,178) | | (3,673) |
| | |
|
| |
| |
|
| | | $ | 213,751 | | 167,702 | | 161,867 |
| | |
|
| |
| |
|
102
The tax effects of temporary differences that give rise to significant portions of the deferred tax assets and deferred tax liabilities at December 31 are presented below(in thousands):
| | | | | |
| | | 2003
| | 2002
|
Gross deferred tax assets: | | | | | |
Book loan loss deduction in excess of tax | | $ | 108,860 | | 108,726 |
Postretirement benefits | | | 3,724 | | 3,984 |
Deferred compensation | | | 22,016 | | 9,249 |
Deferred loan fees | | | 3,336 | | 1,613 |
Deferred agreements | | | 1,108 | | 1,484 |
Accrued severance costs | | | 2,226 | | 2,060 |
Minimum pension liability | | | 10,164 | | 15,128 |
Other | | | 30,182 | | 26,191 |
| | |
|
| |
|
Total deferred tax assets | | | 181,616 | | 168,435 |
| | |
|
| |
|
Gross deferred tax liabilities: | | | | | |
Core deposits and purchase accounting | | | (28,135) | | (28,412) |
Premises and equipment, due to differences in depreciation | | | (4,349) | | (4,760) |
FHLB stock dividends | | | (10,590) | | (10,383) |
Leasing operations | | | (77,630) | | (69,992) |
Security investments and derivative market adjustments | | | (53,012) | | (67,605) |
Prepaid pension reserves | | | (1,399) | | (1,734) |
Other | | | (2,920) | | (8,554) |
| | |
|
| |
|
Total deferred tax liabilities | | | (178,035) | | (191,440) |
| | |
|
| |
|
Net deferred tax assets (liabilities) | | $ | 3,581 | | (23,005) |
| | |
|
| |
|
The amount of net deferred tax assets at December 31, 2003 is included with other assets in the balance sheet. The amount of net deferred tax liabilities at December 31, 2002 is included with other liabilities. We have determined that a valuation reserve is not required for any deferred tax assets since it is “more likely than not” that such assets will be realized principally through future taxable income. This conclusion is based on the history of growth in earnings and the prospects for continued growth and profitability.
The exercise of stock options under our nonqualified stock option plan, and nonqualified exercises of options under the qualified plan, resulted in tax benefits reducing our current income tax payable and increasing common stock by $5.2 million in 2003, $2.9 million in 2002, and $3.0 million in 2001.
18. NET INCOME PER COMMON SHARE
Basic and diluted net income per common share, based on the weighted average outstanding shares, are summarized as follows(in thousands, except per share amounts):
| | | | | | | |
| | | 2003
| | 2002
| | 2001
|
Basic: | | | | | | | |
Income from continuing operations | | $ | 339,593 | | 317,107 | | 298,599 |
Loss on discontinued operations | | | (1,770) | | (28,460) | | (8,420) |
| | |
|
| |
| |
|
Income before cumulative effect adjustment | | | 337,823 | | 288,647 | | 290,179 |
Cumulative effect adjustment | | | – | | (32,369) | | (7,159) |
| | |
|
| |
| |
|
Net income applicable to common stock | | $ | 337,823 | | 256,278 | | 283,020 |
| | |
|
| |
| |
|
Average common shares outstanding | | | 90,048 | | 91,566 | | 91,202 |
| | |
|
| |
| |
|
Income from continuing operations per share | | $ | 3.77 | | 3.46 | | 3.27 |
Loss on discontinued operations per share | | | (0.02) | | (0.31) | | (0.09) |
Cumulative effect adjustment per share | | | – | | (0.35) | | (0.08) |
| | |
|
| |
| |
|
Net income per common share | | $ | 3.75 | | 2.80 | | 3.10 |
| | |
|
| |
| |
|
| | | |
Diluted: | | | | | | | |
Income from continuing operations | | $ | 339,593 | | 317,107 | | 298,599 |
Loss on discontinued operations | | | (1,770) | | (28,460) | | (8,420) |
| | |
|
| |
| |
|
Income before cumulative effect adjustment | | | 337,823 | | 288,647 | | 290,179 |
Cumulative effect adjustment | | | – | | (32,369) | | (7,159) |
| | |
|
| |
| |
|
Net income applicable to common stock | | $ | 337,823 | | 256,278 | | 283,020 |
| | |
|
| |
| |
|
Average common shares outstanding | | | 90,048 | | 91,566 | | 91,202 |
Stock option adjustment | | | 686 | | 513 | | 972 |
| | |
|
| |
| |
|
Average common shares outstanding | | | 90,734 | | 92,079 | | 92,174 |
| | |
|
| |
| |
|
Income from continuing operations per share | | $ | 3.74 | | 3.44 | | 3.24 |
Loss on discontinued operations per share | | | (0.02) | | (0.31) | | (0.09) |
Cumulative effect adjustment per share | | | – | | (0.35) | | (0.08) |
| | |
|
| |
| |
|
Net income per common share | | $ | 3.72 | | 2.78 | | 3.07 |
| | |
|
| |
| |
|
103
19. STOCK OPTIONS
We have a qualified stock option plan under which stock options may be granted to key employees, and a nonqualified plan under which options may be granted to nonemployee directors. At December 31, 2003, there were 2,569,910 and 141,000 additional shares available for grant under the qualified and nonqualified plans, respectively. Options equal to 2% of the issued and outstanding shares of our common stock as of the first day of the year are automatically reserved for issuance under the qualified plan.
Under the qualified plan, options vest at the rate of one third each year after the date of grant and expire seven years after the date of grant. Options granted prior to 2000 are exercisable in increments from one to four years after the date of grant and expire six years after the date of grant. Under the nonqualified plan, options are exercisable in increments from six months to three and a half years after the date of grant and expire ten years after the date of grant.
We also have a broad-based employee stock option plan. Participation in this plan requires employment for a full year prior to the option grant date with service of 20 hours per week or more. Executive officers are not eligible to participate in this plan. Stock options are granted to eligible employees based on an internal job grade structure. All options vest at the rate of one third each year and expire four years after the date of grant. At December 31, 2003, there were 1,983,472 additional shares available for grant.
Our stock-based compensation plans are accounted for based on the intrinsic value method of APB 25, as interpreted. No compensation expense has been recorded for these option plans, as the exercise price was equal to the quoted market price of the stock at the time of grant. The Stock-Based Compensation section of Note 1 illustrates the effect on net income and earnings per share if we had applied the fair value recognition provisions of SFAS 123 to stock-based employee compensation.
The following table is a summary of our stock option activity and related information for the three years ended December 31, 2003:
| | | | | |
| | | Number of
shares
| | Weighted-
average
exercise price
|
Balance at December 31, 2000 | | 4,733,591 | | $ | 43.98 |
Acquired | | 906,845 | | | 41.90 |
Granted | | 2,090,843 | | | 53.28 |
Exercised | | (611,174) | | | 28.04 |
Forfeited | | (655,449) | | | 47.12 |
| | |
| | | |
Balance at December 31, 2001 | | 6,464,656 | | | 47.89 |
Granted | | 2,086,595 | | | 52.17 |
Exercised | | (652,860) | | | 32.62 |
Expired | | (108,547) | | | 50.58 |
Forfeited | | (306,961) | | | 55.93 |
| | |
| | | |
Balance at December 31, 2002 | | 7,482,883 | | | 50.04 |
Granted | | 2,136,851 | | | 45.15 |
Exercised | | (1,319,892) | | | 44.01 |
Expired | | (196,373) | | | 56.04 |
Forfeited | | (532,824) | | | 50.78 |
| | |
| | | |
Balance at December 31, 2003 | | 7,570,645 | | | 49.51 |
| | |
| | | |
Outstanding options exercisable as of: | | | | | |
December 31, 2003 | | 3,913,524 | | $ | 50.35 |
December 31, 2002 | | 3,744,828 | | | 48.01 |
December 31, 2001 | | 3,315,756 | | | 44.50 |
Selected information on stock options as of December 31, 2003 follows:
| | | | | | | | | | |
Outstanding options
| | Exercisable options
|
Exercise price
range
| | Number of shares
| | Weighted-average
exercise price
| | Weighted-average
remaining contractual
life (years)
| | Number of
shares
| | Weighted-average
exercise price
|
| $ 2.37 to $ 6.91 | | 11,000 | | $ 3.57 | | 1.5 | | 11,000 | | $ 3.57 |
| $ 6.92 to $13.83 | | 25,367 | | 13.29 | | 1.8 | | 25,367 | | 13.29 |
| $13.84 to $20.74 | | 41,782 | | 16.21 | | 2.5 | | 41,782 | | 16.21 |
| $20.75 to $27.65 | | 16,727 | | 23.35 | | 3.8 | | 16,727 | | 23.35 |
| $27.66 to $34.56 | | 22,449 | | 29.82 | | 3.0 | | 22,449 | | 29.82 |
| $34.57 to $41.48 | | 183,974 | | 40.08 | | 2.9 | | 60,251 | | 40.08 |
| $41.49 to $48.39 | | 3,168,531 | | 42.94 | | 4.6 | | 1,410,072 | | 42.62 |
| $48.40 to $55.30 | | 3,237,824 | | 53.39 | | 4.2 | | 1,728,276 | | 53.05 |
| $55.31 to $62.21 | | 309,221 | | 58.55 | | 3.9 | | 43,830 | | 56.76 |
| $62.22 to $69.13 | | 553,770 | | 69.09 | | 1.5 | | 553,770 | | 69.09 |
| | |
| | | | | |
| | |
| | | 7,570,645 | | 49.51 | | 4.1 | | 3,913,524 | | 50.35 |
| | |
| | | | | |
| | |
104
The previous tables do not include options as of December 31, 2003 to purchase common stock of certain of our subsidiaries, NetDeposit, Inc. and Providus Software Solutions, Inc. For NetDeposit, there were options to purchase 5,525,333 shares at exercise prices from $0.50 to $1.00. For Providus, there were options to purchase 1,338,400 shares at an exercise price of $0.50. All of these options are excluded from earnings per share calculations because they are antidilutive. Issued and outstanding shares of common stock for NetDeposit and Providus were 36 million and 13 million, respectively, at December 31, 2003.
20. COMMITMENTS, GUARANTEES, CONTINGENT LIABILITIES, AND RELATED PARTIES
We use certain derivative instruments and other financial instruments in the normal course of business to meet the financing needs of our customers, to reduce our own exposure to fluctuations in interest rates, and to make a market in U.S. government, agency, corporate, and municipal securities. These financial instruments involve, to varying degrees, elements of credit, liquidity, and interest rate risk in excess of the amount recognized in the balance sheet. Derivative instruments are discussed in Note 7.
FASB Interpretation No. 45 (“FIN 45”),Guarantor’s Accounting and Disclosure Requirements for Guarantees, Including Indirect Guarantees of Indebtedness of Others,issued in November 2002, establishes guidance for guarantees and related obligations. Financial and performance standby letters of credit are guarantees that come under the provisions of FIN 45. The adoption of FIN 45 did not have a significant effect on our financial position or results of operations.
Contractual amounts of the off-balance sheet financial instruments used to meet the financing needs of our customers are as follows as of December 31(in thousands):
| | | | | |
| | | 2003
| | 2002
|
Commitments to extend credit | | $ | 7,880,741 | | 7,526,188 |
Standby letters of credit: | | | | | |
Financial | | | 340,475 | | 287,819 |
Performance | | | 90,412 | | 101,380 |
Commercial letters of credit | | | 25,095 | | 26,392 |
Commitments to extend credit are agreements to lend to a customer as long as there is no violation of any condition established in the contract. Commitments generally have fixed expiration dates or other termination clauses and may require the payment of a fee. The amount of collateral obtained, if deemed necessary by us upon extension of credit, is based on our credit evaluation of the counterparty. Types of collateral vary, but may include accounts receivable, inventory, property, plant and equipment, and income-producing properties.
While establishing commitments to extend credit creates credit risk, a significant portion of such commitments is expected to expire without being drawn upon. As of December 31, 2003, $5.0 billion of commitments expire in 2004. As a result, our credit exposure and liquidity requirements will be lower than the contractual amounts of the commitments. We use the same credit policies and procedures in making commitments to extend credit and conditional obligations as we do for on-balance sheet instruments. These policies and procedures include credit approvals, limits, and monitoring.
We issue standby and commercial letters of credit as conditional commitments generally to guarantee the performance of a customer to a third party. The guarantees are primarily issued to support public and private borrowing arrangements, including commercial paper, bond financing, and similar transactions. Standby letters of credit include remaining commitments of $336 million expiring in 2004 and $95 million expiring thereafter through 2024. The credit risk involved in issuing letters of credit is essentially the same as that involved in extending loan facilities to customers. We generally hold marketable securities and cash equivalents as collateral supporting those commitments for which collateral is deemed necessary.
At December 31, 2003, we had a contractual obligation to purchase $50 million of variable rate first mortgage residential real estate loans. We also had commitments to make venture investments of $26.4 million. These obligations have no stated maturity.
As a market maker in U.S. government, agency, corporate, and municipal securities, we enter into
105
agreements to purchase and sell such securities. As of December 31, 2003 and 2002, we had outstanding commitments to purchase securities of $45 million at both year-ends and outstanding commitments to sell securities of $44 million and $37 million, respectively. These agreements at December 31, 2003 have remaining terms of one month or less.
The contractual or notional amount of financial instruments indicates a level of activity associated with a particular class of financial instrument and is not a reflection of the actual level of risk. As of December 31, 2003 and 2002, the regulatory risk-weighted values assigned to all off-balance sheet financial instruments and derivative instruments described herein were $2.7 billion and $2.1 billion, respectively.
The Parent has a $40 million line of credit available, which was unused as of December 31, 2003. The interest rate is at LIBOR plus 50 basis points. There is no compensating balance requirement.
At December 31, 2003, we were required to maintain cash balances of $25 million with the Federal Reserve Banks to meet minimum balance requirements in accordance with Federal Reserve Board regulations.
As of December 31, 2003, the Parent has guaranteed approximately $583.4 million of debt issued by our subsidiaries, as discussed in Note 14. See Note 6 for the discussion of ZFNB’s commitment of $4.7 billion at December 31, 2003 to a qualifying special-purpose entity securities conduit.
We are a defendant in various legal proceedings arising in the normal course of business. We do not believe that the outcome of any such proceedings will have a material effect on our results of operations, financial position, or liquidity.
We have commitments for leasing premises and equipment under the terms of noncancelable capital and operating leases expiring from 2004 to 2068. Premises leased under capital leases at December 31, 2003 were $13.7 million and accumulated amortization was $13.0 million. Amortization applicable to premises leased under capital leases is included in depreciation expense.
Future aggregate minimum rental payments under existing noncancelable operating leases at December 31, 2003 are as follows(in thousands):
| | | |
2004 | | $ | 30,569 |
2005 | | | 28,071 |
2006 | | | 26,765 |
2007 | | | 24,395 |
2008 | | | 22,007 |
Thereafter | | | 139,390 |
| | |
|
|
| | | $ | 271,197 |
| | |
|
|
Future aggregate minimum rental payments have been reduced by noncancelable subleases as follows: 2004, $2.0 million; 2005, $1.3 million; 2006, $0.8 million; 2007, $0.6 million; 2008, $0.5 million; and thereafter $1.9 million. Aggregate rental expense on operating leases amounted to $40.1 million in 2003, $34.3 million in 2002, and $36.8 million in 2001.
In October 2003, we entered into a new lease agreement for our corporate headquarters. The lease is accounted for as an operating lease with an initial term of 20 years. The new minimum annual payments of approximately $3.2 million are included in the previous table.
We have no material related party transactions requiring disclosure. In compliance with applicable banking regulations, we may extend credit to certain officers and directors of the Company and its banking subsidiaries in the ordinary course of business under substantially the same terms as comparable third-party lending arrangements.
21. REGULATORY MATTERS
We are subject to various regulatory capital requirements administered by federal banking agencies. Failure to meet minimum capital requirements can initiate certain mandatory – and possibly additional discretionary – actions by regulators that, if undertaken, could have a direct material effect on our financial statements. Under capital adequacy guidelines and the regulatory framework for prompt corrective action, we must meet specific capital guidelines that involve quantitative measures of our assets, liabilities, and certain off-balance sheet items as calculated under regulatory accounting practices. Our capital amounts and classifi-
106
cation are also subject to qualitative judgments by regulators about components, risk weightings, and other factors.
Quantitative measures established by regulation to ensure capital adequacy require us to maintain minimum amounts and ratios (set forth in the following table) of Total and Tier I capital (as defined in the regulations) to risk-weighted assets (as defined), and of Tier I capital (as defined) to average assets (as defined). We believe, as of December 31, 2003, that we meet all capital adequacy requirements to which we are subject.
As of December 31, 2003, our capital ratios significantly exceeded the minimum capital levels, and we are considered well capitalized under the regulatory framework for prompt corrective action. To be categorized as well capitalized, we must maintain minimum Total risk-based, Tier I risk-based, and Tier I leverage ratios as set forth in the table. There are no conditions or events that we believe have changed our regulatory category.
Dividends declared by our banking subsidiaries in any calendar year may not, without the approval of the appropriate federal regulator, exceed their net earnings for that year combined with their net earnings less dividends paid for the preceding two years. At December 31, 2003, our subsidiaries had approximately $236.8 million available for the payment of dividends under the foregoing restrictions.
The actual capital amounts and ratios for the Company and our significant banking subsidiaries are as follows(in thousands):
| | | | | | | | | | | | | | | |
| | | Actual
| | Minimum for capital adequacy purposes
| | To be well capitalized
|
| | | Amount
| | Ratio
| | Amount
| | Ratio
| | Amount
| | Ratio
|
As of December 31, 2003: | | | | | | | | | | | | | | | |
Total capital (to risk-weighted assets) | | | | | | | | | | | | | | | |
The Company | | $ | 3,241,210 | | 13.52% | | $ | 1,918,101 | | 8.00% | | $ | 2,397,627 | | 10.00% |
Zions First National Bank | | | 942,159 | | 11.47 | | | 657,172 | | 8.00 | | | 821,465 | | 10.00 |
California Bank & Trust | | | 852,190 | | 11.23 | | | 607,270 | | 8.00 | | | 759,088 | | 10.00 |
Tier I capital (to risk-weighted assets) | | | | | | | | | | | | | | | |
The Company | | | 2,258,863 | | 9.42 | | | 959,051 | | 4.00 | | | 1,438,576 | | 6.00 |
Zions First National Bank | | | 657,175 | | 8.00 | | | 328,586 | | 4.00 | | | 492,879 | | 6.00 |
California Bank & Trust | | | 525,964 | | 6.93 | | | 303,635 | | 4.00 | | | 455,453 | | 6.00 |
Tier I capital (to average assets) | | | | | | | | | | | | | | | |
The Company | | | 2,258,863 | | 8.06 | | | 841,155 | | 3.00 | | | 1,401,925 | | 5.00 |
Zions First National Bank | | | 657,175 | | 6.09 | | | 323,774 | | 3.00 | | | 539,624 | | 5.00 |
California Bank & Trust | | | 525,964 | | 6.06 | | | 260,254 | | 3.00 | | | 433,756 | | 5.00 |
| | | | | | |
As of December 31, 2002: | | | | | | | | | | | | | | | |
Total capital (to risk-weighted assets) | | | | | | | | | | | | | | | |
The Company | | $ | 2,759,443 | | 12.94% | | $ | 1,705,937 | | 8.00% | | $ | 2,132,421 | | 10.00% |
Zions First National Bank | | | 854,485 | | 10.82 | | | 631,861 | | 8.00 | | | 789,827 | | 10.00 |
California Bank & Trust | | | 771,695 | | 11.06 | | | 558,359 | | 8.00 | | | 697,949 | | 10.00 |
Tier I capital (to risk-weighted assets) | | | | | | | | | | | | | | | |
The Company | | | 1,974,095 | | 9.26 | | | 852,969 | | 4.00 | | | 1,279,453 | | 6.00 |
Zions First National Bank | | | 596,529 | | 7.55 | | | 315,931 | | 4.00 | | | 473,896 | | 6.00 |
California Bank & Trust | | | 534,334 | | 7.66 | | | 279,179 | | 4.00 | | | 418,769 | | 6.00 |
Tier I capital (to average assets) | | | | | | | | | | | | | | | |
The Company | | | 1,974,095 | | 7.56 | | | 783,627 | | 3.00 | | | 1,306,044 | | 5.00 |
Zions First National Bank | | | 596,529 | | 5.63 | | | 317,833 | | 3.00 | | | 529,721 | | 5.00 |
California Bank & Trust | | | 534,334 | | 6.51 | | | 246,354 | | 3.00 | | | 410,590 | | 5.00 |
107
22. RETIREMENT PLANS
We have a noncontributory defined benefit pension plan for eligible employees. Plan benefits are based on years of service and employees’ compensation levels. Benefits vest under the plan upon completion of five years of vesting service. Plan assets consist principally of corporate equity securities, mutual fund investments, insurance separate accounts, and cash investments. Plan benefits are defined as a lump-sum cash value or an annuity at retirement age.
During 2002, our Board of Directors approved significant changes to the pension plan, which became effective January 1, 2003. The plan was amended so that effective January 1, 2003 new employees are not allowed to participate in the plan. Benefit accruals for existing participants ceased as of that date with the following grandfathering exceptions. Participants age 55 and over with 10 years of service by December 31, 2002 may receive reduced future earnings credits in accordance with a reduced schedule. Participants age 55 and over with 10 years of service as of March 31, 1997 continue to receive future earnings credits without reduction.
In December 2003, the FASB revised SFAS No. 132,Employers’ Disclosures about Pensions and Other Postretirement Benefits. The revised Statement requires additional disclosure about the assets, obligations, cash flows, and net periodic benefit cost of defined benefit pension plans and other postretirement benefit plans. The following information is presented according to the new requirements.
The following table presents the change in benefit obligation, fair value of plan assets, and funded status of the plan and amounts recognized in the balance sheet as of the measurement date of December 31(in thousands):
| | | | | |
| | | 2003
| | 2002
|
Change in benefit obligation: | | | | | |
Benefit obligation at beginning of year | | $ | 128,014 | | 135,032 |
Service cost | | | 636 | | 11,113 |
Interest cost | | | 8,426 | | 9,202 |
Plan amendments | | | – | | 501 |
Actuarial (gain) loss | | | 7,957 | | (8,116) |
Curtailments | | | – | | (11,934) |
Benefits paid | | | (6,599) | | (7,784) |
| | |
|
| |
|
Benefit obligation at end of year | | | 138,434 | | 128,014 |
| | |
|
| |
|
Change in plan assets: | | | | | |
Fair value of plan assets at beginning of year | | | 93,996 | | 119,033 |
Actual return on plan assets | | | 25,788 | | (17,253) |
Employer contributions | | | 2,600 | | – |
Benefits paid | | | (6,599) | | (7,784) |
| | |
|
| |
|
Fair value of plan assets at end of year | | | 115,785 | | 93,996 |
| | |
|
| |
|
Funded status | | | (22,649) | | (34,018) |
Unrecognized net actuarial loss | | | 26,337 | | 38,602 |
| | |
|
| |
|
Net amount recognized | | $ | 3,688 | | 4,584 |
| | |
|
| |
|
Amounts recognized in the | | | | | |
balance sheet consist of: | | | | | |
Accrued benefit liability | | $ | (22,165) | | (33,901) |
Accumulated other comprehensive income | | | 25,853 | | 38,485 |
| | |
|
| |
|
Net amount recognized | | $ | 3,688 | | 4,584 |
| | |
|
| |
|
The accumulated benefit obligation for the pension plan was $137.8 million and $127.9 million as of December 31, 2003 and 2002, respectively. We do not expect to contribute to the pension plan in 2004.
The following table presents the components of net periodic benefit cost for the plan(in thousands):
| | | | | | | |
| | | 2003
| | 2002
| | 2001
|
Service cost | | $ | 636 | | 11,113 | | 8,601 |
Interest cost | | | 8,426 | | 9,202 | | 8,659 |
Expected return on plan assets | | | (7,901) | | (10,398) | | (10,351) |
Amortization of prior service cost | | | – | | (404) | | (412) |
Amortization of net actuarial loss | | | 2,335 | | 1,299 | | – |
| | |
|
| |
| |
|
Net periodic benefit cost | | | 3,496 | | 10,812 | | 6,497 |
Curtailment gain | | | – | | (311) | | – |
| | |
|
| |
| |
|
Total cost | | $ | 3,496 | | 10,501 | | 6,497 |
| | |
|
| |
| |
|
108
Weighted-average assumptions used for the plan are as follows:
| | | | | | |
| | | 2003
| | 2002
| | 2001
|
Used to determine benefit obligation at year-end: | | | | | | |
Discount rate | | 6.25% | | 6.75% | | |
Rate of compensation increase | | 4.00% | | 4.00% | | |
Used to determine net periodic benefit cost for the years ended | | | | | | |
December 31: | | | | | | |
Discount rate | | 6.75% | | 7.25% | | 7.50% |
Expected long-term return on plan assets | | 8.60% | | 9.00% | | 9.00% |
Rate of compensation increase | | 4.00% | | 5.00% | | 5.00% |
The target asset allocation plan is reviewed to determine the overall expected long-term rate of return on plan assets. An expected long-term rate of return is assumed for each asset class, and an underlying inflation rate assumption is determined. The effects of asset diversification and periodic fund rebalancing, as well as an allowance for management expenses, are also considered.
Weighted-average asset allocations at December 31 for the pension plan are as follows:
| | | | |
| | | 2003
| | 2002
|
Equity securities | | 5% | | 5% |
Mutual funds: | | | | |
Equity funds | | 27% | | 23% |
Debt funds | | 16% | | 23% |
Other: | | | | |
Insurance company separate accounts – equity investments | | 44% | | 43% |
Guaranteed deposit account | | 8% | | 6% |
| | |
| |
|
| | | 100% | | 100% |
| | |
| |
|
The pension plan’s investment strategy is predicated on its investment objectives and the risk and return expectations of asset classes appropriate for the plan. Investment objectives have been established by considering the plan’s liquidity needs and time horizon and the fiduciary standards under ERISA. The asset allocation strategy is developed to meet the plan’s long-term needs in a manner designed to control volatility and to reflect risk tolerance. The plan’s asset allocation is designed using modern portfolio theory, which quantifies the impact of diversification among various asset classes. Current target allocation percentages are 75% invested in equities and 25% invested in fixed income assets.
Equity securities consist of 93,705 shares of Company common stock with a fair value of $5.7 million at December 31, 2003, and 123,744 shares with a fair value of $4.9 million at December 31, 2002. Dividends paid were approximately $127 thousand in 2003 and $99 thousand in 2002.
We are also obligated under several unfunded non-qualified supplemental retirement plans for certain current and former employees. At December 31, 2003 and 2002, our liability included in other liabilities totaled $17.3 million and $16.0 million, respectively, for these plans.
In addition to our defined benefit pension plan, we sponsor an unfunded defined benefit health care plan that provides postretirement medical benefits to full-time employees hired before January 1, 1993, who meet minimum age and service requirements. The plan is contributory, with retiree contributions adjusted annually, and contains other cost-sharing features such as deductibles and coinsurance. Plan coverage is provided by self-funding or health maintenance organizations (HMOs) options. Reductions in our obligations to provide benefits resulting from cost sharing changes have been applied to reduce the plan’s unrecognized transition obligation. In 2000, we increased our contribution toward retiree medical coverage and permanently froze our contributions. Retirees pay the difference between the full premium rates and our capped contribution.
109
The following table presents the change in benefit obligations, fair value of plan assets, and funded status of the plan and amounts recognized in the balance sheet as of the measurement date of December 31(in thousands):
| | | | | |
| | | 2003
| | 2002
|
Change in benefit obligation: | | | | | |
Benefit obligation at beginning of year | | $ | 7,501 | | 7,152 |
Service cost | | | 119 | | 104 |
Interest cost | | | 479 | | 495 |
Actuarial loss | | | 292 | | 359 |
Benefits paid | | | (717) | | (609) |
| | |
|
| |
|
Benefit obligation at end of year | | | 7,674 | | 7,501 |
| | |
|
| |
|
Change in plan assets: | | | | | |
Fair value of plan assets at beginning of year | | | – | | – |
Employer contributions | | | 717 | | 609 |
Benefits paid | | | (717) | | (609) |
| | |
|
| |
|
Fair value of plan assets at end of year | | | – | | – |
| | |
|
| |
|
Funded status | | | (7,674) | | (7,501) |
Unrecognized net actuarial gain | | | (1,391) | | (2,103) |
Unrecognized prior service cost | | | 85 | | 170 |
| | |
|
| |
|
Net amount recognized | | $ | (8,980) | | (9,434) |
| | |
|
| |
|
Amounts recognized in the balance sheet consist of: | | | | | |
Accrued benefit liability | | $ | (8,980) | | (9,434) |
| | |
|
| |
|
Net amount recognized | | $ | (8,980) | | (9,434) |
| | |
|
| |
|
The following table presents the components of net periodic benefit cost for the plan(in thousands):
| | | | | | | |
| | | 2003
| | 2002
| | 2001
|
Service cost | | $ | 119 | | 104 | | 110 |
Interest cost | | | 479 | | 495 | | 512 |
Amortization of prior service cost | | | 85 | | 85 | | 85 |
Amortization of net actuarial gain | | | (421) | | (596) | | (917) |
| | |
|
| |
| |
|
Net periodic benefit cost (credit) | | $ | 262 | | 88 | | (210) |
| | |
|
| |
| |
|
Weighted-average assumptions used for the plan are as follows:
| | | | | | |
| | | 2003
| | 2002
| | 2001
|
Used to determine benefit obligation at year-end: | | | | | | |
Discount rate | | 6.25% | | 6.75% | | |
Rate of compensation increase | | 4.00% | | 4.00% | | |
Used to determine net periodic benefit cost for the years ended December 31: | | | | | | |
Discount rate | | 6.75% | | 7.25% | | 7.50% |
Rate of compensation increase | | 4.00% | | 5.00% | | 5.00% |
Since our contribution rate is capped, there is no effect on the plan from assumed increases or decreases in health care cost trends.
We expect to contribute approximately $700 thousand to the postretirement medical plan for 2004.
We have a 401(k) plan (“PAYSHELTER”) under which employees select from several investment alternatives. For 2002, employees could contribute from 1 to 15% of compensation, which was matched up to 50% by us for contributions up to 5% and 25% for contributions greater than 5% up to 15%. Effective January 1, 2003, employees can contribute up to 50% of their earnings to the plan which will be matched by us 100% for the first 3% of employee contributions and 50% for the next 2% of employee contributions. Our contributions to the plan associated with the matching feature amounted to $9.8 million in 2003, $8.1 million in 2002, and $6.6 million in 2001.
Effective January 1, 2003, we added a profit sharing feature to the PAYSHELTER plan. The profit sharing contribution is discretionary and the contributions may range from 0% to 4.5% of eligible compensation based upon our return on average common equity for the year. For the year ended December 31, 2003, the contribution percentage was 3% and we recorded profit sharing expense of $9.2 million.
110
23. FAIR VALUE OF FINANCIAL INSTRUMENTS
The carrying value and estimated fair value of principal financial instruments are summarized as follows
(in thousands):
| | | | | | | | | |
| | | December 31, 2003
| | December 31, 2002
|
| | | Carrying
value
| | Estimated
fair value
| | Carrying
value
| | Estimated
fair value
|
Financial assets: | | | | | | | | | |
Cash and due from banks | | $ | 1,119,351 | | 1,119,351 | | 1,087,296 | | 1,087,296 |
Money market investments | | | 568,694 | | 568,694 | | 542,762 | | 542,762 |
Investment securities | | | 4,818,017 | | 4,818,017 | | 3,635,951 | | 3,635,951 |
Loans, net | | | 19,651,855 | | 19,759,519 | | 18,760,250 | | 19,810,336 |
Derivatives in other assets | | | 73,985 | | 73,985 | | 109,393 | | 109,393 |
| | |
|
| |
| |
| |
|
Total financial assets | | $ | 26,231,902 | | 26,339,566 | | 24,135,652 | | 25,185,738 |
| | |
|
| |
| |
| |
|
Financial liabilities: | | | | | | | | | |
Demand, savings, and money market deposits | | $ | 17,927,428 | | 17,927,428 | | 16,771,716 | | 16,771,716 |
Time deposits | | | 2,734,741 | | 2,768,148 | | 3,169,033 | | 3,320,343 |
Foreign deposits | | | 234,526 | | 234,472 | | 191,231 | | 191,215 |
Securities sold, not yet purchased | | | 263,379 | | 263,379 | | 203,838 | | 203,838 |
Federal funds purchased and security repurchase agreements | | | 2,211,789 | | 2,211,789 | | 1,680,984 | | 1,680,984 |
Derivatives in other liabilities | | | 14,247 | | 14,247 | | 33,823 | | 33,823 |
FHLB advances and other borrowings | | | 572,938 | | 600,039 | | 547,818 | | 584,860 |
Long-term debt | | | 1,611,618 | | 1,637,874 | | 1,069,505 | | 1,172,630 |
| | |
|
| |
| |
| |
|
Total financial liabilities | | $ | 25,570,666 | | 25,657,376 | | 23,667,948 | | 23,959,409 |
| | |
|
| |
| |
| |
|
FINANCIAL ASSETS
The estimated fair value approximates the carrying value of cash and due from banks and money market investments. For investment securities, the fair value is based on quoted market prices where available. If quoted market prices are not available, fair values are based on quoted market prices of comparable instruments or a discounted cash flow model based on established market rates. The fair value of fixed-rate loans is estimated by discounting future cash flows using the London Interbank Offer Rate (“LIBOR”) yield curve adjusted by a factor which reflects the credit and interest rate risk inherent in the loan. Variable-rate loans reprice with changes in market rates. As such, their carrying amounts are deemed to approximate fair value.
FINANCIAL LIABILITIES
The estimated fair value of demand, savings and money market deposits, securities sold not yet purchased, and federal funds purchased and security repurchase agreements, approximates the carrying value. The fair value of time and foreign deposits is estimated by discounting future cash flows using the LIBOR yield curve. The fair value of fixed rate FHLB advances is estimated by discounting future cash flows using the LIBOR yield curve. Variable rate FHLB advances reprice with changes in market rates. As such, their carrying amounts approximate their fair value. Other borrowings are not significant. The estimated fair value of long-term debt is based on discounting cash flows using the LIBOR yield curve plus credit spreads.
DERIVATIVE INSTRUMENTS
The fair value of the derivatives reflects the estimated amounts that we would receive or pay to terminate these contracts at the reporting date based upon pricing or valuation models applied to current market information. Interest rate swaps are valued using the market standard methodology of netting the discounted future fixed cash receipts (or payments) and the discounted expected variable cash payments (or receipts). The variable cash payments (or receipts) are based on an expectation of future interest rates derived from observed market interest rate curves.
111
OFF-BALANCE SHEET FINANCIAL INSTRUMENTS
The fair value of commitments to extend credit and letters of credit, based on fees currently charged for similar commitments, is not significant.
LIMITATIONS
These fair value disclosures represent our best estimates, based on relevant market information and information about the financial instruments. Fair value estimates are based on judgments regarding future expected loss experience, current economic conditions, risk characteristics of the various instruments, and other factors. These estimates are subjective in nature and involve uncertainties and matters of significant judgment and therefore cannot be determined with precision. Changes in the above methodologies and assumptions could significantly affect the estimates.
Further, certain financial instruments and all nonfinancial instruments are excluded from applicable disclosure requirements. Therefore, the fair value amounts shown in the table do not, by themselves, represent the underlying value of the Company as a whole.
24. OPERATING SEGMENT INFORMATION
We manage our operations and prepare management reports and other information with a primary focus on geographical area. This geographical emphasis allows us as a regional community banking system to assess performance and allocate resources. All segments presented, except for the segment identified as “Other,” are based on commercial banking operations. The operating segment identified as “Other” includes Zions Bancorporation, certain e-commerce subsidiaries, other smaller nonbank operating units, and eliminations of transactions between segments.
The accounting policies of the individual operating segments are the same as those of the Company described in Note 1. Transactions between operating segments are primarily conducted at fair value, resulting in profits that are eliminated for reporting consolidated results of operations. We allocate centrally provided services to the business segments based upon estimated usage of those services.
We initiated a program in 2002 to allocate income between certain of our banking subsidiaries to better match revenues from hedging strategies to the operating units which gave rise to the exposures being hedged. Allocated income (expense) from this program included in net interest income of the banking subsidiaries is as follows(in millions):
| | | | | |
| | | 2003
| | 2002
|
Zions First National Bank | | $ | (26.0) | | (47.0) |
Nevada State Bank | | | 2.6 | | 9.9 |
National Bank of Arizona | | | 6.7 | | 10.1 |
Vectra Bank Colorado | | | 12.3 | | 21.9 |
The Commerce Bank of Washington | | | 4.4 | | 5.1 |
| | |
|
| |
|
| | | $ | – | | – |
| | |
|
| |
|
Effective January 1, 2003, we changed the method by which this hedge program income (expense) is allocated. As a result, the amounts allocated to each segment for the years shown are not directly comparable. Further, the amounts allocated continue to decrease as the underlying hedges mature and new hedges are being recorded directly at the banking subsidiaries.
112
The following is a summary of selected operating segment information for the years ended December 31, 2003, 2002 and 2001(in thousands):
| | | | | | | | | | | | | | | | | |
| | | Zions First National Bank and Subsidiaries
| | California Bank & Trust
| | Nevada State Bank
| | National Bank of Arizona
| | Vectra Bank Colorado
| | The Commerce Bank of Washington
| | Other
| | Consolidated Company
|
2003: | | | | | | | | | | | | | | | | | |
Net interest income | | $ | 335,544 | | 385,389 | | 125,816 | | 128,572 | | 100,545 | | 24,705 | | (5,077) | | 1,095,494 |
Provision for loan losses | | | 46,300 | | 12,050 | | 5,650 | | 250 | | 5,910 | | 800 | | (1,020) | | 69,940 |
| | |
|
| |
| |
| |
| |
| |
| |
| |
|
Net interest income after provision for loan losses | | | 289,244 | | 373,339 | | 120,166 | | 128,322 | | 94,635 | | 23,905 | | (4,057) | | 1,025,554 |
Noninterest income | | | 233,797 | | 75,866 | | 31,692 | | 21,450 | | 38,079 | | 2,047 | | 87,164 | | 490,095 |
Noninterest expense | | | 318,260 | | 226,978 | | 86,898 | | 79,775 | | 100,450 | | 11,260 | | 70,241 | | 893,862 |
Impairment loss on goodwill | | | – | | – | | – | | – | | 75,628 | | – | | – | | 75,628 |
| | |
|
| |
| |
| |
| |
| |
| |
| |
|
Income from continuing operations before income taxes and minority interest | | | 204,781 | | 222,227 | | 64,960 | | 69,997 | | (43,364) | | 14,692 | | 12,866 | | 546,159 |
Income tax expense (benefit) | | | 65,019 | | 89,120 | | 22,073 | | 27,763 | | 16,188 | | 5,109 | | (11,521) | | 213,751 |
Minority interest | | | (539) | | – | | – | | – | | – | | – | | (6,646) | | (7,185) |
| | |
|
| |
| |
| |
| |
| |
| |
| |
|
Income from continuing operations | | | 140,301 | | 133,107 | | 42,887 | | 42,234 | | (59,552) | | 9,583 | | 31,033 | | 339,593 |
Loss on discontinued operations | | | – | | – | | – | | – | | – | | – | | (1,770) | | (1,770) |
| | |
|
| |
| |
| |
| |
| |
| |
| |
|
Net income (loss) | | $ | 140,301 | | 133,107 | | 42,887 | | 42,234 | | (59,552) | | 9,583 | | 29,263 | | 337,823 |
| | |
|
| |
| |
| |
| |
| |
| |
| |
|
Assets | | $ | 10,597,631 | | 9,216,033 | | 2,957,847 | | 3,067,424 | | 2,532,206 | | 705,055 | | (517,958) | | 28,558,238 |
Net loans and leases (1) | | | 6,887,973 | | 6,349,615 | | 2,161,681 | | 2,381,139 | | 1,691,556 | | 328,689 | | 119,708 | | 19,920,361 |
Deposits | | | 7,104,029 | | 7,637,559 | | 2,555,114 | | 2,539,140 | | 1,763,986 | | 452,691 | | (1,155,824) | | 20,896,695 |
Shareholder’s equity | | | 725,352 | | 956,091 | | 194,290 | | 240,750 | | 375,303 | | 52,224 | | (3,987) | | 2,540,023 |
| | | | | | | | |
2002: | | | | | | | | | | | | | | | | | |
Net interest income | | $ | 296,194 | | 377,916 | | 124,914 | | 115,990 | | 110,717 | | 24,556 | | (15,145) | | 1,035,142 |
Provision for loan losses | | | 41,300 | | 17,000 | | 4,750 | | 1,950 | | 5,000 | | 1,070 | | 809 | | 71,879 |
| | |
|
| |
| |
| |
| |
| |
| |
| |
|
Net interest income after provision for loan losses | | | 254,894 | | 360,916 | | 120,164 | | 114,040 | | 105,717 | | 23,486 | | (15,954) | | 963,263 |
Noninterest income | | | 199,727 | | 78,435 | | 28,071 | | 19,115 | | 34,222 | | 1,719 | | 15,525 | | 376,814 |
Noninterest expense | | | 310,097 | | 238,180 | | 81,854 | | 69,033 | | 100,123 | | 10,257 | | 49,384 | | 858,928 |
| | |
|
| |
| |
| |
| |
| |
| |
| |
|
Income from continuing operations before income taxes and minority interest | | | 144,524 | | 201,171 | | 66,381 | | 64,122 | | 39,816 | | 14,948 | | (49,813) | | 481,149 |
Income tax expense (benefit) | | | 42,420 | | 81,035 | | 22,607 | | 25,481 | | 14,189 | | 5,300 | | (23,330) | | 167,702 |
Minority interest | | | (1,153) | | – | | – | | – | | – | | – | | (2,507) | | (3,660) |
| | |
|
| |
| |
| |
| |
| |
| |
| |
|
Income from continuing operations | | | 103,257 | | 120,136 | | 43,774 | | 38,641 | | 25,627 | | 9,648 | | (23,976) | | 317,107 |
Loss on discontinued operations | | | – | | – | | – | | – | | – | | – | | (28,460) | | (28,460) |
| | |
|
| |
| |
| |
| |
| |
| |
| |
|
Income before cumulative effect adjustment | | | 103,257 | | 120,136 | | 43,774 | | 38,641 | | 25,627 | | 9,648 | | (52,436) | | 288,647 |
Cumulative effect adjustment | | | – | | – | | – | | – | | – | | – | | (32,369) | | (32,369) |
| | |
|
| |
| |
| |
| |
| |
| |
| |
|
Net income (loss) | | $ | 103,257 | | 120,136 | | 43,774 | | 38,641 | | 25,627 | | 9,648 | | (84,805) | | 256,278 |
| | |
|
| |
| |
| |
| |
| |
| |
| |
|
Assets | | $ | 10,529,580 | | 8,804,855 | | 2,683,207 | | 2,925,044 | | 2,767,660 | | 647,887 | | (1,792,544) | | 26,565,689 |
Net loans and leases (1) | | | 6,714,289 | | 6,129,171 | | 1,849,704 | | 1,978,623 | | 1,917,504 | | 320,958 | | 129,594 | | 19,039,843 |
Deposits | | | 7,116,514 | | 6,970,139 | | 2,348,623 | | 2,486,949 | | 1,910,889 | | 458,702 | | (1,159,836) | | 20,131,980 |
Shareholder’s equity | | | 682,287 | | 978,414 | | 173,246 | | 232,737 | | 440,929 | | 45,377 | | (179,147) | | 2,373,843 |
113
| | | | | | | | | | | | | | | | | |
| | | Zions First
National
Bank and
Subsidiaries
| | California
Bank &
Trust
| | Nevada
State Bank
| | National
Bank of
Arizona
| | Vectra
Bank
Colorado
| | The
Commerce
Bank of
Washington
| | Other
| | Consolidated
Company
|
2001: | | | | | | | | | | | | | | | | | |
Net interest income | | $ | 302,469 | | 343,736 | | 114,273 | | 102,950 | | 86,445 | | 21,847 | | (21,956) | | 949,764 |
Provision for loan losses | | | 41,900 | | 9,250 | | 10,080 | | 1,500 | | 9,350 | | 1,278 | | (167) | | 73,191 |
| | |
|
| |
| |
| |
| |
| |
| |
| |
|
Net interest income after provision for loan losses | | | 260,569 | | 334,486 | | 104,193 | | 101,450 | | 77,095 | | 20,569 | | (21,789) | | 876,573 |
Noninterest income | | | 234,798 | | 91,175 | | 23,719 | | 16,123 | | 27,490 | | 1,203 | | 17,680 | | 412,188 |
Noninterest expense | | | 286,789 | | 251,659 | | 79,951 | | 64,110 | | 94,253 | | 9,429 | | 49,902 | | 836,093 |
| | |
|
| |
| |
| |
| |
| |
| |
| |
|
Income from continuing operations before income taxes and minority interest | | | 208,578 | | 174,002 | | 47,961 | | 53,463 | | 10,332 | | 12,343 | | (54,011) | | 452,668 |
Income tax expense (benefit) | | | 69,900 | | 76,465 | | 16,350 | | 21,412 | | 6,947 | | 4,206 | | (33,413) | | 161,867 |
Minority interest | | | (2,053) | | – | | – | | – | | – | | – | | (5,745) | | (7,798) |
| | |
|
| |
| |
| |
| |
| |
| |
| |
|
Income from continuing operations | | | 140,731 | | 97,537 | | 31,611 | | 32,051 | | 3,385 | | 8,137 | | (14,853) | | 298,599 |
Loss on discontinued operations | | | – | | – | | – | | – | | – | | – | | (8,420) | | (8,420) |
| | |
|
| |
| |
| |
| |
| |
| |
| |
|
Income before cumulative effect adjustment | | | 140,731 | | 97,537 | | 31,611 | | 32,051 | | 3,385 | | 8,137 | | (23,273) | | 290,179 |
Cumulative effect adjustment | | | (5,318) | | (1,284) | | (616) | | – | | 59 | | – | | – | | (7,159) |
| | |
|
| |
| |
| |
| |
| |
| |
| |
|
Net income (loss) | | $ | 135,413 | | 96,253 | | 30,995 | | 32,051 | | 3,444 | | 8,137 | | (23,273) | | 283,020 |
| | |
|
| |
| |
| |
| |
| |
| |
| |
|
Assets | | $ | 8,580,293 | | 8,366,328 | | 2,480,884 | | 2,605,665 | | 2,639,118 | | 529,395 | | (897,519) | | 24,304,164 |
Net loans and leases (1) | | | 6,062,313 | | 5,707,772 | | 1,514,546 | | 1,796,279 | | 1,849,683 | | 294,443 | | 85,802 | | 17,310,838 |
Deposits | | | 5,318,078 | | 6,772,735 | | 2,139,606 | | 2,193,050 | | 1,763,613 | | 381,623 | | (727,015) | | 17,841,690 |
Shareholder’s equity | | | 636,266 | | 988,327 | | 160,953 | | 210,920 | | 439,115 | | 38,256 | | (192,968) | | 2,280,869 |
| (1) | Net of unearned income and fees, net of related costs. |
114
25. QUARTERLY FINANCIAL INFORMATION (UNAUDITED)
Financial information by quarter for 2003 and 2002 is as follows(in thousands, except per share amounts):
| | | | | | | | | | | |
| | | Quarters
| | |
| | | First
| | Second
| | Third
| | Fourth
| | Year
|
2003: | | | | | | | | | | | |
Gross interest income | | $ | 349,399 | | 353,537 | | 349,392 | | 347,060 | | 1,399,388 |
Net interest income | | | 266,208 | | 273,953 | | 277,079 | | 278,254 | | 1,095,494 |
Provision for loan losses | | | 17,550 | | 18,150 | | 18,260 | | 15,980 | | 69,940 |
Noninterest income | | | 96,361 | | 100,805 | | 190,176 | | 102,753 | | 490,095 |
Noninterest expense | | | 213,986 | | 216,403 | | 245,506 | | 217,967 | | 893,862 |
Impairment loss on goodwill | | | – | | – | | 75,628 | | – | | 75,628 |
Income from continuing operations before income taxes and minority interest | | | 131,033 | | 140,205 | | 127,861 | | 147,060 | | 546,159 |
Income from continuing operations | | | 87,376 | | 92,408 | | 64,199 | | 95,610 | | 339,593 |
Income (loss) on discontinued operations | | | 328 | | 17 | | (2,115) | | – | | (1,770) |
Net income | | | 87,704 | | 92,425 | | 62,084 | | 95,610 | | 337,823 |
Net income per common share: | | | | | | | | | | | |
Basic: | | | | | | | | | | | |
Income from continuing operations | | $ | 0.96 | | 1.03 | | 0.72 | | 1.06 | | 3.77 |
Income (loss) on discontinued operations | | | 0.01 | | – | | (0.03) | | – | | (0.02) |
Net income | | | 0.97 | | 1.03 | | 0.69 | | 1.06 | | 3.75 |
Diluted: | | | | | | | | | | | |
Income from continuing operations | | | 0.96 | | 1.02 | | 0.71 | | 1.05 | | 3.74 |
Income (loss) on discontinued operations | | | 0.01 | | – | | (0.03) | | – | | (0.02) |
Net income | | | 0.97 | | 1.02 | | 0.68 | | 1.05 | | 3.72 |
| | | | | |
2002: | | | | | | | | | | | |
Gross interest income | | $ | 364,990 | | 368,682 | | 366,620 | | 355,627 | | 1,455,919 |
Net interest income | | | 256,210 | | 259,044 | | 261,306 | | 258,582 | | 1,035,142 |
Provision for loan losses | | | 18,090 | | 15,705 | | 22,309 | | 15,775 | | 71,879 |
Noninterest income | | | 93,826 | | 101,605 | | 74,815 | | 106,568 | | 376,814 |
Noninterest expense | | | 205,254 | | 215,708 | | 219,158 | | 218,808 | | 858,928 |
Income from continuing operations before income taxes and minority interest | | | 126,692 | | 129,236 | | 94,654 | | 130,567 | | 481,149 |
Income from continuing operations | | | 82,817 | | 84,864 | | 65,368 | | 84,058 | | 317,107 |
Income (loss) on discontinued operations | | | (3,186) | | (2,789) | | (25,922) | | 3,437 | | (28,460) |
Income before cumulative effect adjustment | | | 79,631 | | 82,075 | | 39,446 | | 87,495 | | 288,647 |
Cumulative effect adjustment | | | (32,369) | | – | | – | | – | | (32,369) |
Net income | | | 47,262 | | 82,075 | | 39,446 | | 87,495 | | 256,278 |
Net income per common share: | | | | | | | | | | | |
Basic: | | | | | | | | | | | |
Income from continuing operations | | $ | 0.90 | | 0.92 | | 0.71 | | 0.92 | | 3.46 |
Income (loss) on discontinued operations | | | (0.03) | | (0.03) | | (0.28) | | 0.04 | | (0.31) |
Cumulative effect adjustment | | | (0.35) | | – | | – | | – | | (0.35) |
Net income | | | 0.52 | | 0.89 | | 0.43 | | 0.96 | | 2.80 |
Diluted: | | | | | | | | | | | |
Income from continuing operations | | | 0.89 | | 0.92 | | 0.71 | | 0.92 | | 3.44 |
Income (loss) on discontinued operations | | | (0.03) | | (0.03) | | (0.28) | | 0.04 | | (0.31) |
Cumulative effect adjustment | | | (0.35) | | – | | – | | – | | (0.35) |
Net income | | | 0.51 | | 0.89 | | 0.43 | | 0.96 | | 2.78 |
115
Our financial statements for the first quarter of 2002 were restated to reflect an impairment loss adjustment determined during the second quarter of 2002. This impairment charge resulted from the required adoption of SFAS 142 as discussed in Note 10 and related to the impairment in carrying value of certain e-commerce subsidiaries. The impairment charge was recognized as a cumulative effect adjustment. A reconciliation of originally reported amounts to restated amounts follows(in thousands, except per share amounts):
| | | | | | | |
| | | As originally reported
| | Adjustments
| | Restatement due to required change in accounting
|
Cumulative effect adjustment | | $ | – | | (32,369) | | (32,369) |
Net income | | | 79,631 | | (32,369) | | 47,262 |
Net income per common share: | | | | | | | |
Basic | | $ | 0.87 | | (0.35) | | 0.52 |
Diluted | | | 0.86 | | (0.35) | | 0.51 |
Previously reported amounts were also reclassified in 2002 to reflect the treatment of the operations of these e-commerce subsidiaries as discontinued operations. See Note 16.
26. PARENT COMPANY FINANCIAL INFORMATION
CONDENSED BALANCE SHEETS
DECEMBER 31, 2003 AND 2002
| | | | | |
| (In thousands) | | 2003
| | 2002
|
ASSETS | | | | | |
Cash and due from banks | | $ | – | | 1,867 |
Interest-bearing deposits | | | 35,683 | | 55,935 |
Investment securities – available for sale, at market | | | 615,874 | | 212,862 |
Loans and other receivables, net | | | 743 | | 1,632 |
Other noninterest bearing investments | | | 37,146 | | 61,876 |
Investments in subsidiaries: | | | | | |
Commercial banks | | | 2,542,827 | | 2,552,641 |
Other operating companies | | | 17,509 | | 3,602 |
Nonoperating – Zions Municipal Funding, Inc. (1) | | | 329,398 | | 259,664 |
Receivables from subsidiaries: | | | | | |
Commercial banks | | | 365,000 | | 165,000 |
Other | | | 20,857 | | 14,422 |
Other assets | | | 77,121 | | 56,283 |
| | |
|
| |
|
| | | $ | 4,042,158 | | 3,385,784 |
| | |
|
| |
|
LIABILITIES AND SHAREHOLDERS’ EQUITY | | | | | |
Other liabilities | | $ | 40,538 | | 39,528 |
Commercial paper | | | 126,144 | | 291,566 |
Subordinated debt to subsidiaries | | | 324,709 | | 324,709 |
Long-term debt | | | 1,010,744 | | 356,138 |
| | |
|
| |
|
Total liabilities | | | 1,502,135 | | 1,011,941 |
| | |
|
| |
|
Shareholders’ equity: | | | | | |
Common stock | | | 985,904 | | 1,034,888 |
Retained earnings | | | 1,538,677 | | 1,292,741 |
Accumulated other comprehensive income | | | 19,041 | | 46,214 |
Shares held in trust for deferred compensation, at cost | | | (3,599) | | – |
| | |
|
| |
|
Total shareholders’ equity | | | 2,540,023 | | 2,373,843 |
| | |
|
| |
|
| | | $ | 4,042,158 | | 3,385,784 |
| | |
|
| |
|
| (1) | Zions Municipal Funding, Inc. is a wholly-owned nonoperating subsidiary whose sole purpose is to hold a portfolio of municipal bonds, loans and leases. |
116
ZIONS BANCORPORATION AND SUBSIDIARIES
CONDENSED STATEMENTS OF INCOME
YEARS ENDED DECEMBER 31, 2003, 2002, AND 2001
| | | | | | | |
| (In thousands) | | 2003
| | 2002
| | 2001
|
Interest income – interest and fees on loans and securities | | $ | 24,923 | | 13,330 | | 9,988 |
Interest expense – interest expense on borrowed funds | | | 43,064 | | 39,557 | | 34,641 |
| | |
|
| |
| |
|
Net interest loss | | | (18,141) | | (26,227) | | (24,653) |
Provision for loan losses | | | (1,020) | | 816 | | (417) |
| | |
|
| |
| |
|
Net interest loss after provision for loan losses | | | (17,121) | | (27,043) | | (24,236) |
| | |
|
| |
| |
|
Other income: | | | | | | | |
Dividends from consolidated subsidiaries: | | | | | | | |
Commercial banks | | | 296,000 | | 272,250 | | 254,438 |
Other operating companies | | | 900 | | – | | – |
Equity and fixed income securities gains, net | | | 86,702 | | 2,686 | | 6,056 |
Other income | | | 8,414 | | 18,937 | | 10,615 |
| | |
|
| |
| |
|
| | | | 392,016 | | 293,873 | | 271,109 |
| | |
|
| |
| |
|
Expenses: | | | | | | | |
Salaries and employee benefits | | | 15,927 | | 13,429 | | 14,018 |
Merger related expense | | | – | | – | | 372 |
Debt extinguishment cost | | | 24,210 | | – | | – |
Other operating expenses | | | 9,122 | | 16,486 | | 12,782 |
| | |
|
| |
| |
|
| | | | 49,259 | | 29,915 | | 27,172 |
| | |
|
| |
| |
|
Income before income tax benefit and undistributed income of consolidated subsidiaries | | | 325,636 | | 236,915 | | 219,701 |
Income tax benefit | | | 5,642 | | 35,946 | | 29,429 |
| | |
|
| |
| |
|
Income before equity in undistributed income of consolidated subsidiaries | | | 31,278 | | 272,861 | | 249,130 |
Equity in undistributed income of consolidated subsidiaries: | | | | | | | |
Commercial banks | | | 11,727 | | 69,262 | | 50,164 |
Other operating companies | | | (16,514) | | (95,310) | | (25,429) |
Nonoperating – Zions Municipal Funding, Inc. | | | 11,332 | | 9,465 | | 9,155 |
| | |
|
| |
| |
|
Net income | | $ | 337,823 | | 256,278 | | 283,020 |
| | |
|
| |
| |
|
117
CONDENSED STATEMENTS OF CASH FLOWS
YEARS ENDED DECEMBER 31, 2003, 2002, AND 2001
| | | | | | | |
| (In thousands) | | 2003
| | 2002
| | 2001
|
CASH FLOWS FROM OPERATING ACTIVITIES: | | | | | | | |
Net income | | $ | 337,823 | | 256,278 | | 283,020 |
Adjustments to reconcile net income to net cash provided by operating activities: | | | | | | | |
Undistributed net (income) losses of consolidated subsidiaries | | | (6,545) | | 16,583 | | (33,890) |
Depreciation of premises and equipment | | | 35 | | 75 | | 81 |
Equity and fixed income securities gains, net | | | (86,702) | | (2,686) | | (6,056) |
Amortization of intangibles | | | – | | – | | 660 |
Other | | | 6,298 | | (3,160) | | (23,992) |
| | |
|
| |
| |
|
Net cash provided by operating activities | | | 250,909 | | 267,090 | | 219,823 |
| | |
|
| |
| |
|
CASH FLOWS FROM INVESTING ACTIVITIES: | | | | | | | |
Net decrease (increase) in interest-bearing deposits | | | 20,252 | | (43,157) | | (7,424) |
Collection of advances to subsidiaries | | | 49,853 | | 129,745 | | 21,885 |
Advances to subsidiaries | | | (256,288) | | (168,319) | | (23,689) |
Proceeds from sales and maturities of equity and fixed income securities | | | 170,028 | | 5,035 | | 9,531 |
Purchase of investment securities | | | (452,382) | | (196,392) | | (6,456) |
Increase of investment in subsidiaries | | | (93,318) | | (78,422) | | (237,584) |
Cash paid to reacquire minority interest | | | – | | – | | (66,044) |
Other | | | (4,495) | | (813) | | 19,964 |
| | |
|
| |
| |
|
Net cash used in investing activities | | | (566,350) | | (352,323) | | (289,817) |
| | |
|
| |
| |
|
CASH FLOWS FROM FINANCING ACTIVITIES: | | | | | | | |
Net change in commercial paper and other borrowings under one year | | | (165,422) | | (17,434) | | 41,761 |
Proceeds from issuance of long-term debt | | | 890,000 | | 339,952 | | 200,000 |
Payments on long-term debt | | | (264,975) | | (67,941) | | (67,100) |
Proceeds from issuance of common stock | | | 52,689 | | 16,907 | | 15,798 |
Payments to redeem common stock | | | (106,844) | | (113,215) | | (46,462) |
Dividends paid | | | (91,874) | | (73,232) | | (73,899) |
| | |
|
| |
| |
|
Net cash provided by financing activities | | | 313,574 | | 85,037 | | 70,098 |
| | |
|
| |
| |
|
Net increase (decrease) in cash and due from banks | | | (1,867) | | (196) | | 104 |
Cash and due from banks at beginning of year | | | 1,867 | | 2,063 | | 1,959 |
| | |
|
| |
| |
|
Cash and due from banks at end of year | | $ | – | | 1,867 | | 2,063 |
| | |
|
| |
| |
|
The Parent paid interest of $32.3 million in 2003, $36.5 million in 2002, and $32.8 million in 2001.
118