
2018 Investor Conference March 1, 2018 Exhibit 99.1
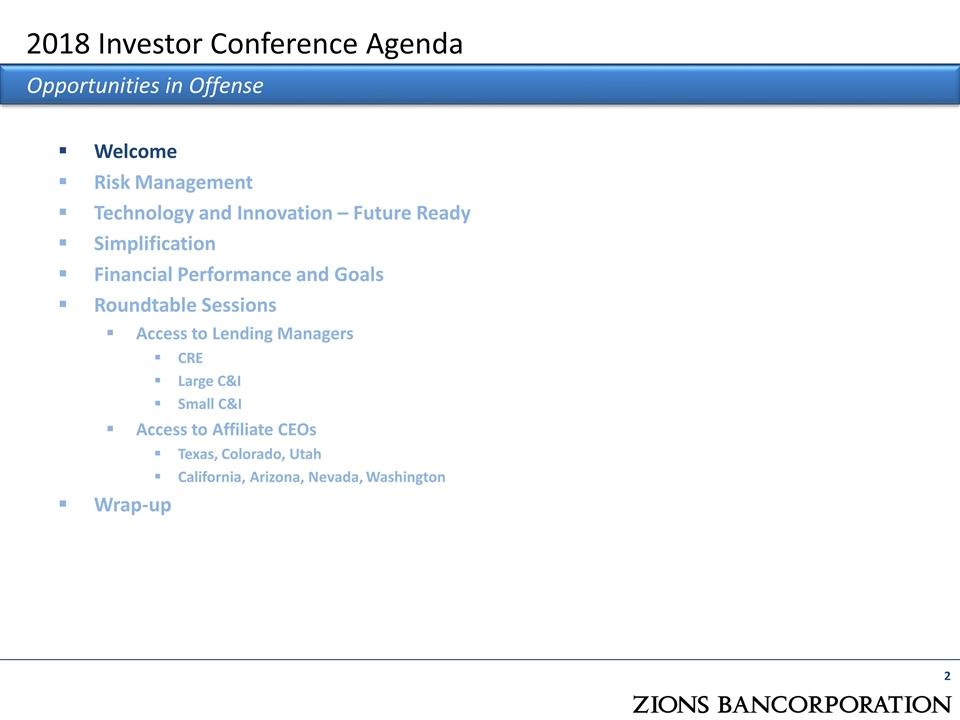
Welcome Risk Management Technology and Innovation – Future Ready Simplification Financial Performance and Goals Roundtable Sessions Access to Lending Managers CRE Large C&I Small C&I Access to Affiliate CEOs Texas, Colorado, Utah California, Arizona, Nevada, Washington Wrap-up 2018 Investor Conference Agenda Opportunities in Offense
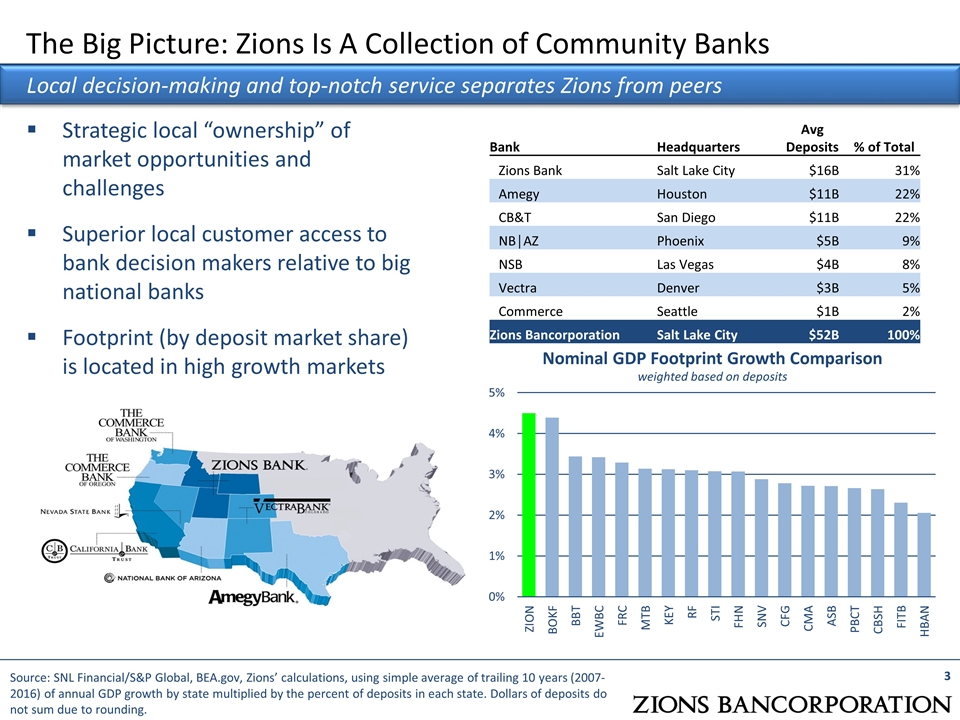
Local decision-making and top-notch service separates Zions from peers Source: SNL Financial/S&P Global, BEA.gov, Zions’ calculations, using simple average of trailing 10 years (2007-2016) of annual GDP growth by state multiplied by the percent of deposits in each state. Dollars of deposits do not sum due to rounding. Strategic local “ownership” of market opportunities and challenges Superior local customer access to bank decision makers relative to big national banks Footprint (by deposit market share) is located in high growth markets Nominal GDP Footprint Growth Comparison weighted based on deposits The Big Picture: Zions Is A Collection of Community Banks Bank Headquarters Avg Deposits % of Total Zions Bank Salt Lake City $16B 31% Amegy Houston $11B 22% CB&T San Diego $11B 22% NB│AZ Phoenix $5B 9% NSB Las Vegas $4B 8% Vectra Denver $3B 5% Commerce Seattle $1B 2% Zions Bancorporation Salt Lake City $52B 100%
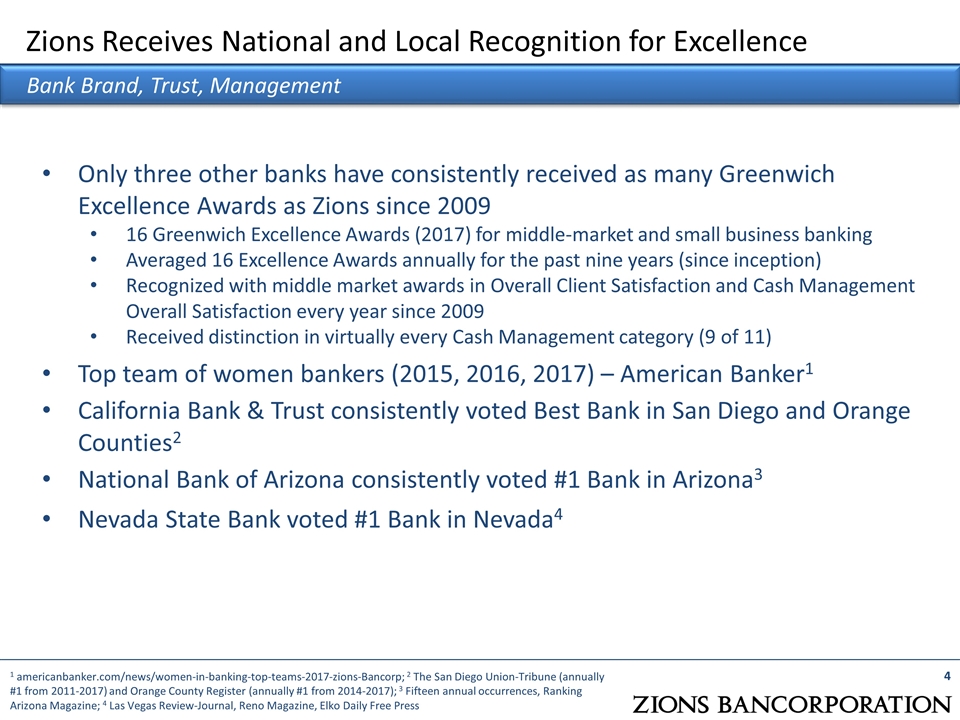
Zions Receives National and Local Recognition for Excellence Only three other banks have consistently received as many Greenwich Excellence Awards as Zions since 2009 16 Greenwich Excellence Awards (2017) for middle-market and small business banking Averaged 16 Excellence Awards annually for the past nine years (since inception) Recognized with middle market awards in Overall Client Satisfaction and Cash Management Overall Satisfaction every year since 2009 Received distinction in virtually every Cash Management category (9 of 11) Top team of women bankers (2015, 2016, 2017) – American Banker1 California Bank & Trust consistently voted Best Bank in San Diego and Orange Counties2 National Bank of Arizona consistently voted #1 Bank in Arizona3 Nevada State Bank voted #1 Bank in Nevada4 1. One of five winning teams, 2015, Zions Bank; 2. exim.gov, April 24, 2014; 3.Readers of the San Diego Union-Tribune, August 2015, for 5 years; Orange County Register, for two years in a row; 4.Ranking Arizona, 2015 Bank Brand, Trust, Management 1 americanbanker.com/news/women-in-banking-top-teams-2017-zions-Bancorp; 2 The San Diego Union-Tribune (annually #1 from 2011-2017) and Orange County Register (annually #1 from 2014-2017); 3 Fifteen annual occurrences, Ranking Arizona Magazine; 4 Las Vegas Review-Journal, Reno Magazine, Elko Daily Free Press
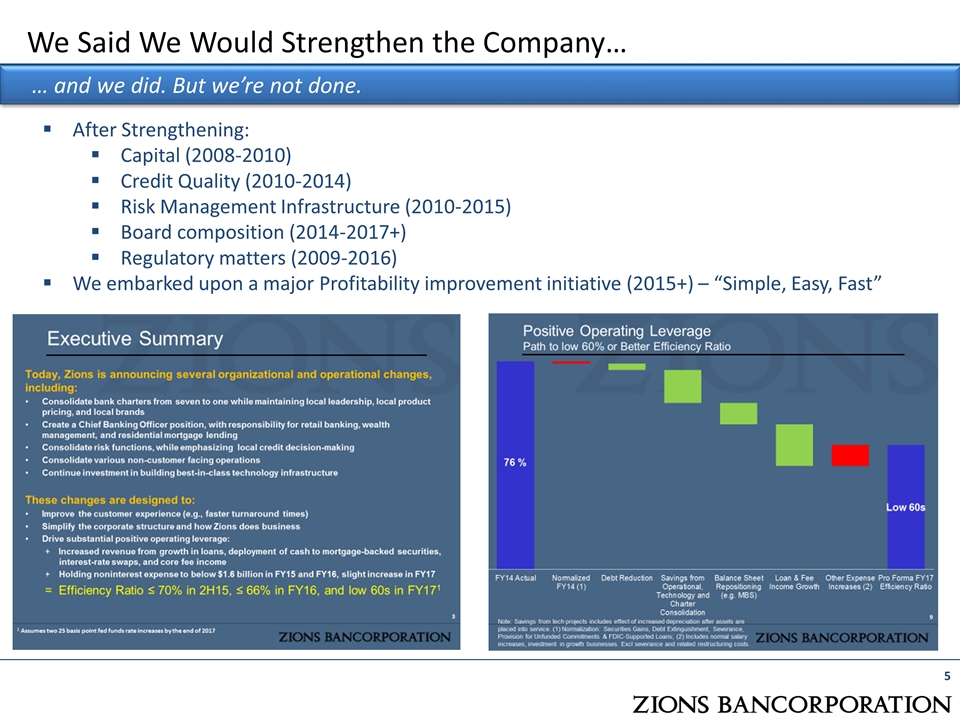
We Said We Would Strengthen the Company… 1 Assumes two 25 basis point fed funds rate increases by the end of 2017 After Strengthening: Capital (2008-2010) Credit Quality (2010-2014) Risk Management Infrastructure (2010-2015) Board composition (2014-2017+) Regulatory matters (2009-2016) We embarked upon a major Profitability improvement initiative (2015+) – “Simple, Easy, Fast” … and we did. But we’re not done.
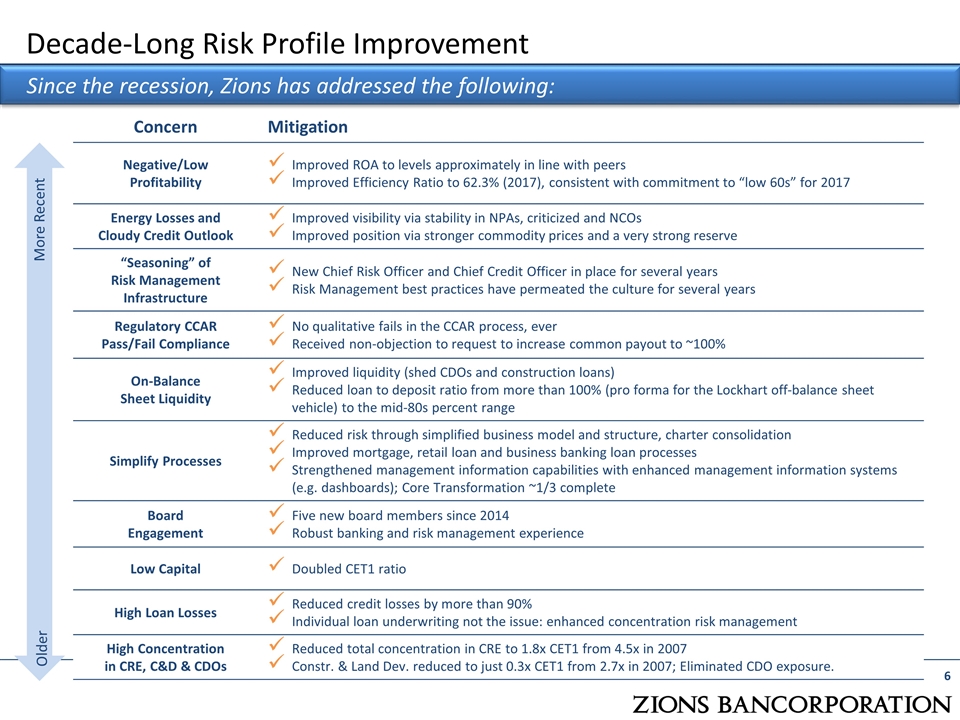
Decade-Long Risk Profile Improvement Since the recession, Zions has addressed the following: Concern Mitigation Negative/Low Profitability Improved ROA to levels approximately in line with peers Improved Efficiency Ratio to 62.3% (2017), consistent with commitment to “low 60s” for 2017 Energy Losses and Cloudy Credit Outlook Improved visibility via stability in NPAs, criticized and NCOs Improved position via stronger commodity prices and a very strong reserve “Seasoning” of Risk Management Infrastructure New Chief Risk Officer and Chief Credit Officer in place for several years Risk Management best practices have permeated the culture for several years Regulatory CCAR Pass/Fail Compliance No qualitative fails in the CCAR process, ever Received non-objection to request to increase common payout to ~100% On-Balance Sheet Liquidity Improved liquidity (shed CDOs and construction loans) Reduced loan to deposit ratio from more than 100% (pro forma for the Lockhart off-balance sheet vehicle) to the mid-80s percent range Simplify Processes Reduced risk through simplified business model and structure, charter consolidation Improved mortgage, retail loan and business banking loan processes Strengthened management information capabilities with enhanced management information systems (e.g. dashboards); Core Transformation ~1/3 complete Board Engagement Five new board members since 2014 Robust banking and risk management experience Low Capital Doubled CET1 ratio High Loan Losses Reduced credit losses by more than 90% Individual loan underwriting not the issue: enhanced concentration risk management High Concentration in CRE, C&D & CDOs Reduced total concentration in CRE to 1.8x CET1 from 4.5x in 2007 Constr. & Land Dev. reduced to just 0.3x CET1 from 2.7x in 2007; Eliminated CDO exposure. Older More Recent
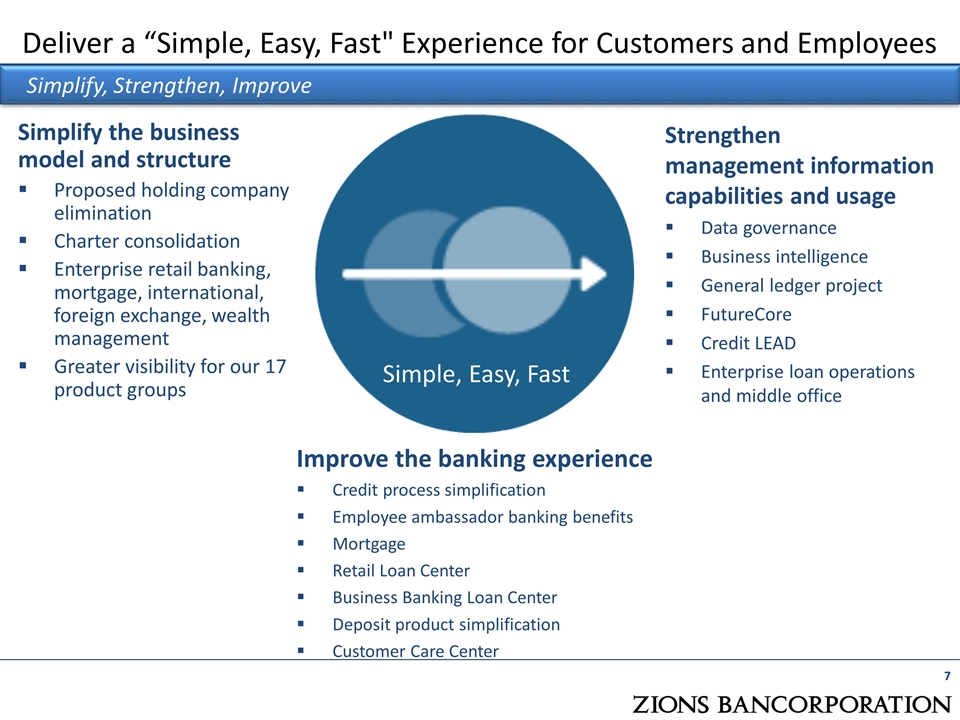
Simplify the business model and structure Proposed holding company elimination Charter consolidation Enterprise retail banking, mortgage, international, foreign exchange, wealth management Greater visibility for our 17 product groups Deliver a “Simple, Easy, Fast" Experience for Customers and Employees Strengthen management information capabilities and usage Data governance Business intelligence General ledger project FutureCore Credit LEAD Enterprise loan operations and middle office Improve the banking experience Credit process simplification Employee ambassador banking benefits Mortgage Retail Loan Center Business Banking Loan Center Deposit product simplification Customer Care Center Simple, Easy, Fast Simplify, Strengthen, Improve
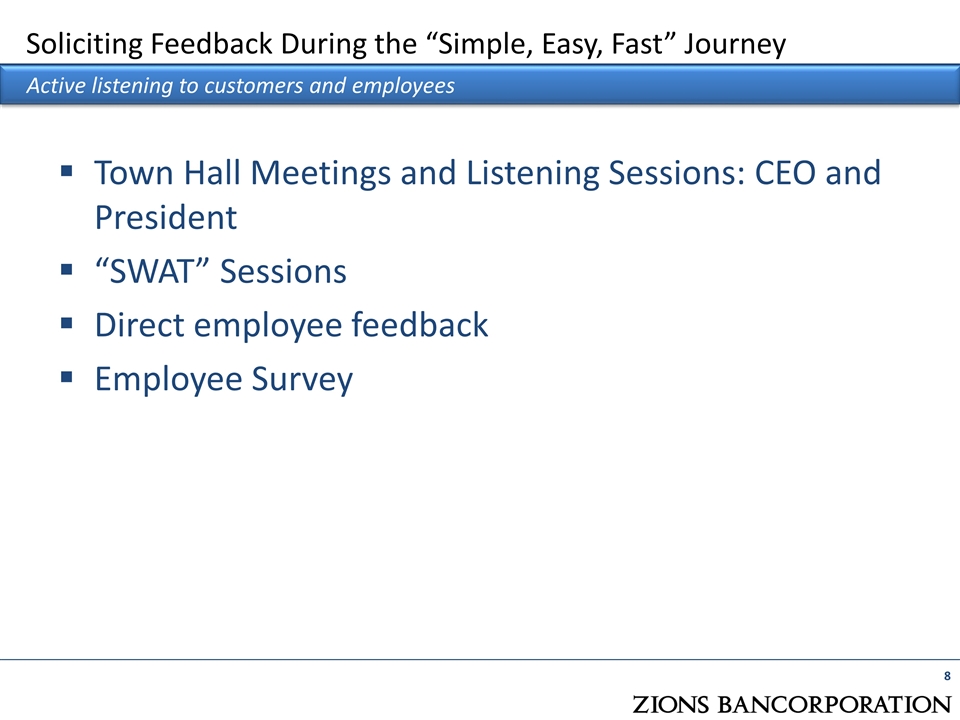
Soliciting Feedback During the “Simple, Easy, Fast” Journey Town Hall Meetings and Listening Sessions: CEO and President “SWAT” Sessions Direct employee feedback Employee Survey Active listening to customers and employees
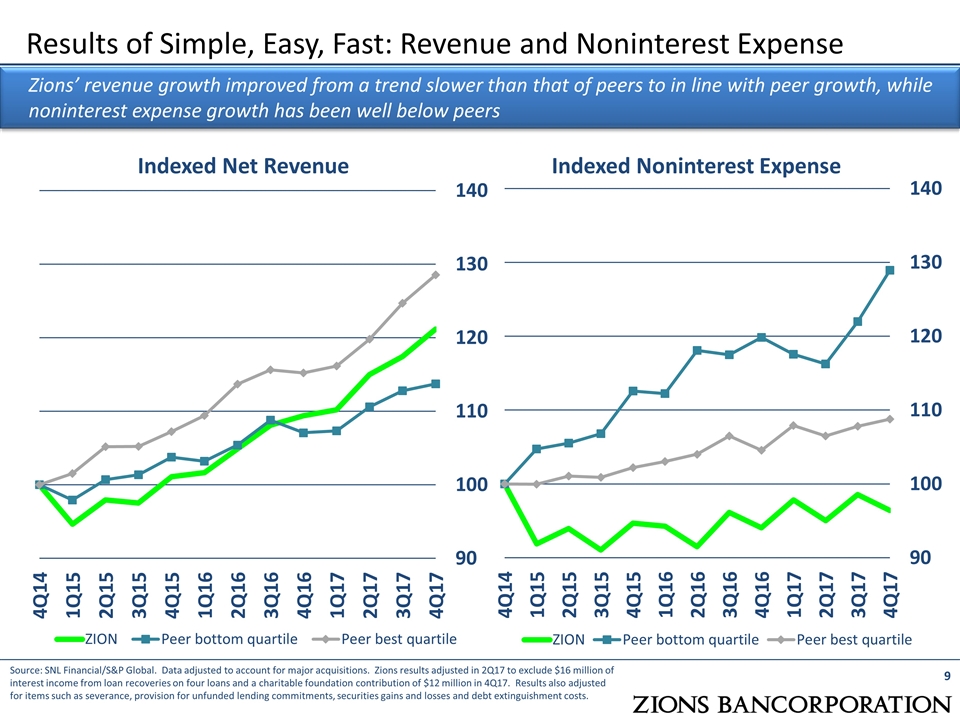
Results of Simple, Easy, Fast: Revenue and Noninterest Expense Zions’ revenue growth improved from a trend slower than that of peers to in line with peer growth, while noninterest expense growth has been well below peers Indexed Net Revenue Source: SNL Financial/S&P Global. Data adjusted to account for major acquisitions. Zions results adjusted in 2Q17 to exclude $16 million of interest income from loan recoveries on four loans and a charitable foundation contribution of $12 million in 4Q17. Results also adjusted for items such as severance, provision for unfunded lending commitments, securities gains and losses and debt extinguishment costs. Indexed Noninterest Expense
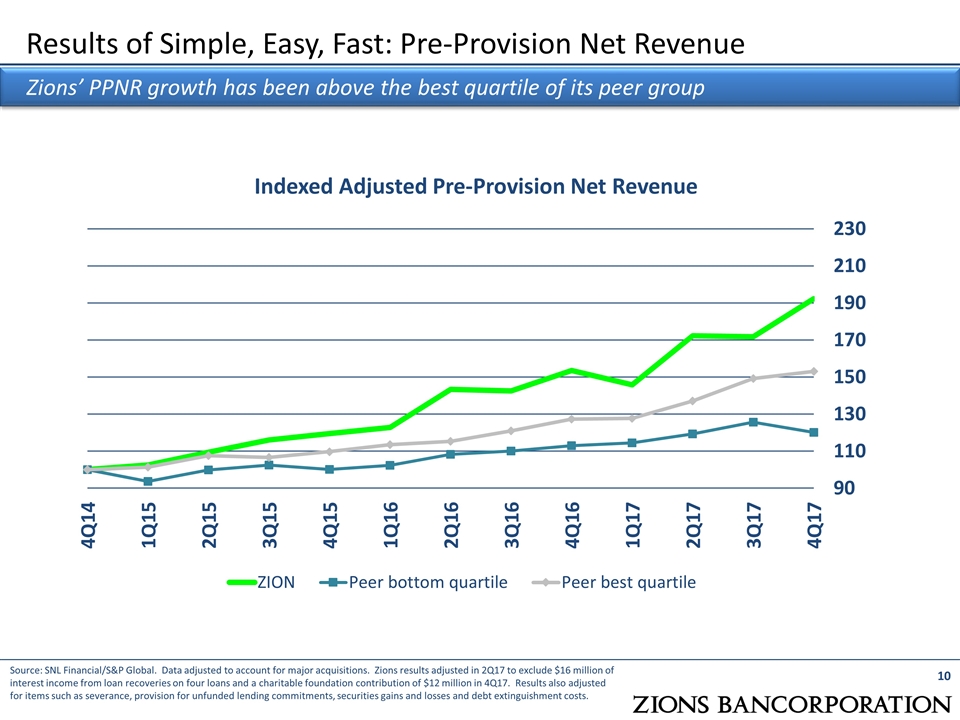
Results of Simple, Easy, Fast: Pre-Provision Net Revenue Zions’ PPNR growth has been above the best quartile of its peer group Indexed Adjusted Pre-Provision Net Revenue Source: SNL Financial/S&P Global. Data adjusted to account for major acquisitions. Zions results adjusted in 2Q17 to exclude $16 million of interest income from loan recoveries on four loans and a charitable foundation contribution of $12 million in 4Q17. Results also adjusted for items such as severance, provision for unfunded lending commitments, securities gains and losses and debt extinguishment costs.

Results of Simple, Easy, Fast: Efficiency Ratio Zions improved from an adverse outlier to within the peer group Efficiency Ratio Source: SNL Financial/S&P Global. Data adjusted to account for major acquisitions. Zions results adjusted in 2Q17 to exclude $16 million of interest income from loan recoveries on four loans and a charitable foundation contribution of $12 million in 4Q17. Results also adjusted for items such as severance, provision for unfunded lending commitments, securities gains and losses and debt extinguishment costs.
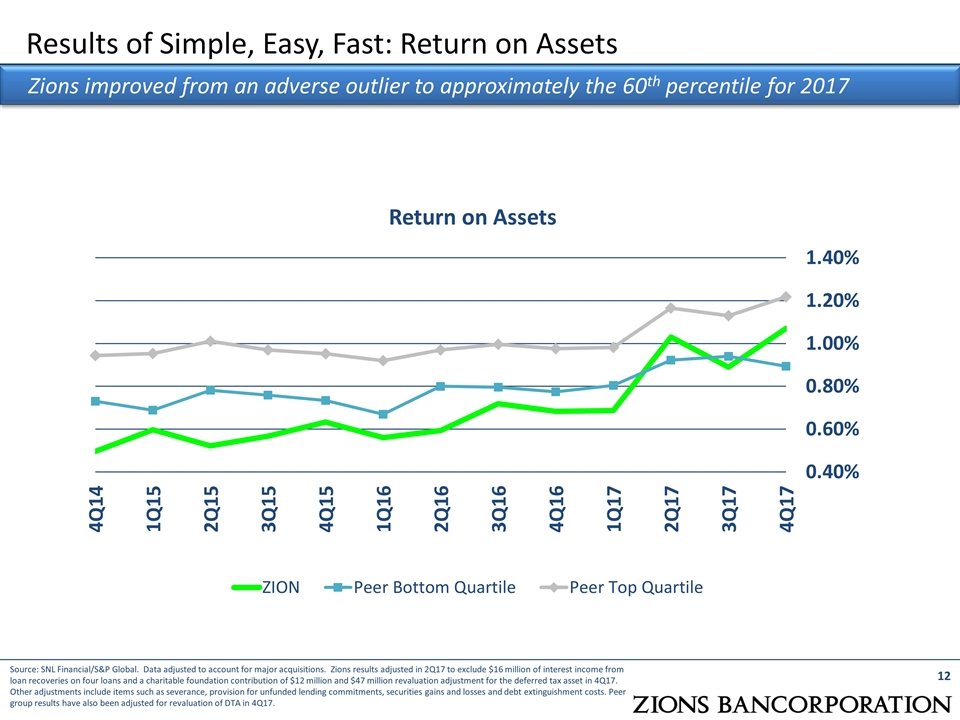
Results of Simple, Easy, Fast: Return on Assets Zions improved from an adverse outlier to approximately the 60th percentile for 2017 Return on Assets Source: SNL Financial/S&P Global. Data adjusted to account for major acquisitions. Zions results adjusted in 2Q17 to exclude $16 million of interest income from loan recoveries on four loans and a charitable foundation contribution of $12 million and $47 million revaluation adjustment for the deferred tax asset in 4Q17. Other adjustments include items such as severance, provision for unfunded lending commitments, securities gains and losses and debt extinguishment costs. Peer group results have also been adjusted for revaluation of DTA in 4Q17.
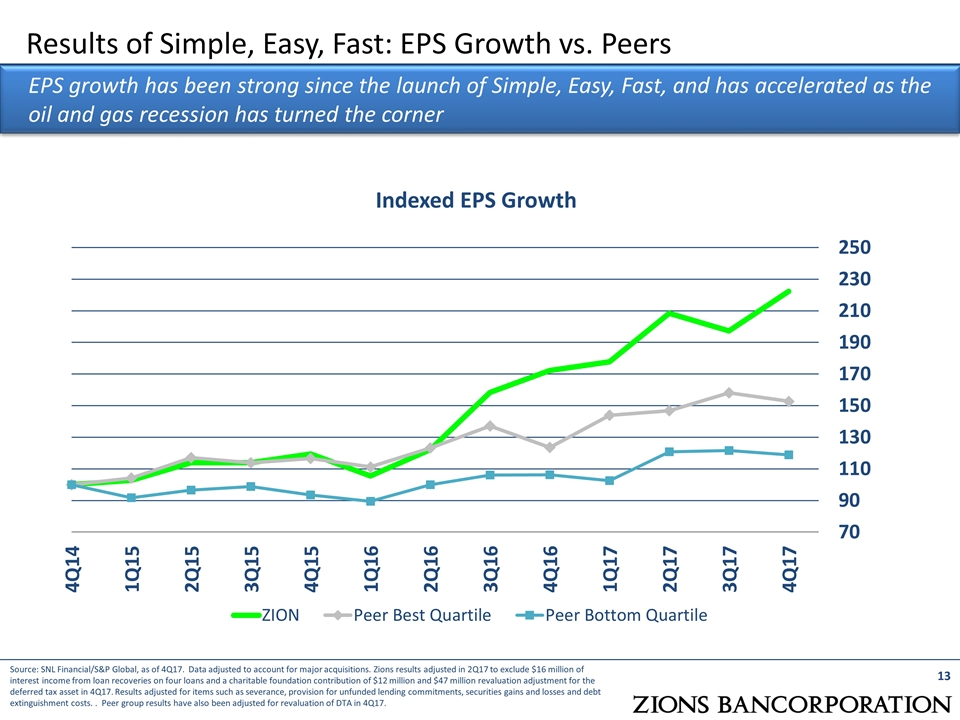
Results of Simple, Easy, Fast: EPS Growth vs. Peers EPS growth has been strong since the launch of Simple, Easy, Fast, and has accelerated as the oil and gas recession has turned the corner Indexed EPS Growth Source: SNL Financial/S&P Global, as of 4Q17. Data adjusted to account for major acquisitions. Zions results adjusted in 2Q17 to exclude $16 million of interest income from loan recoveries on four loans and a charitable foundation contribution of $12 million and $47 million revaluation adjustment for the deferred tax asset in 4Q17. Results adjusted for items such as severance, provision for unfunded lending commitments, securities gains and losses and debt extinguishment costs. . Peer group results have also been adjusted for revaluation of DTA in 4Q17.
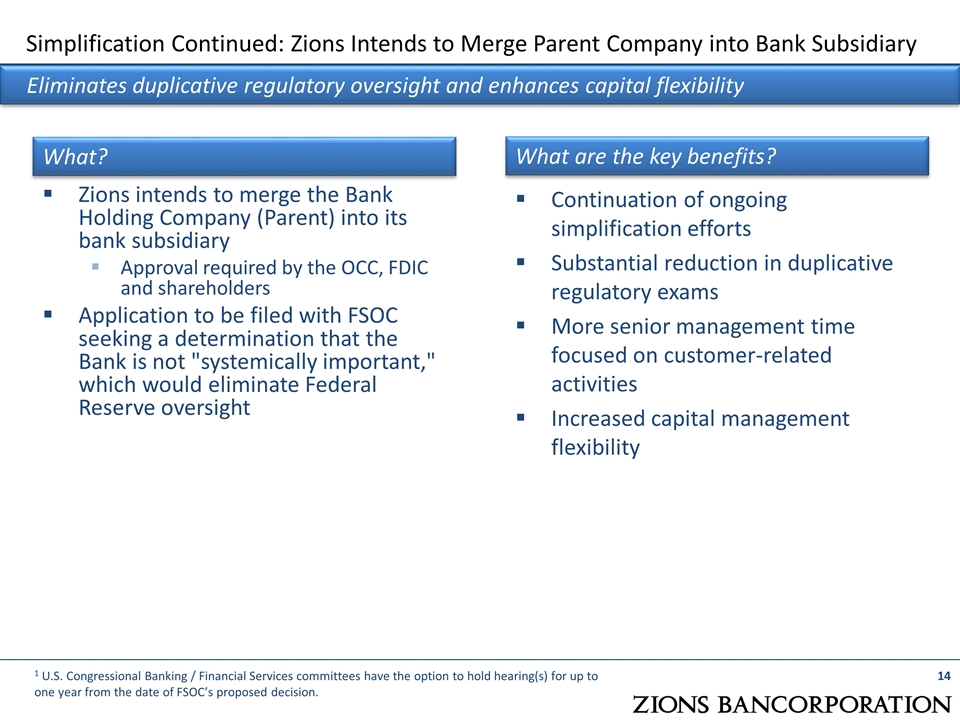
Simplification Continued: Zions Intends to Merge Parent Company into Bank Subsidiary Eliminates duplicative regulatory oversight and enhances capital flexibility Zions intends to merge the Bank Holding Company (Parent) into its bank subsidiary Approval required by the OCC, FDIC and shareholders Application to be filed with FSOC seeking a determination that the Bank is not "systemically important," which would eliminate Federal Reserve oversight Continuation of ongoing simplification efforts Substantial reduction in duplicative regulatory exams More senior management time focused on customer-related activities Increased capital management flexibility 1 U.S. Congressional Banking / Financial Services committees have the option to hold hearing(s) for up to one year from the date of FSOC’s proposed decision. What? What are the key benefits?
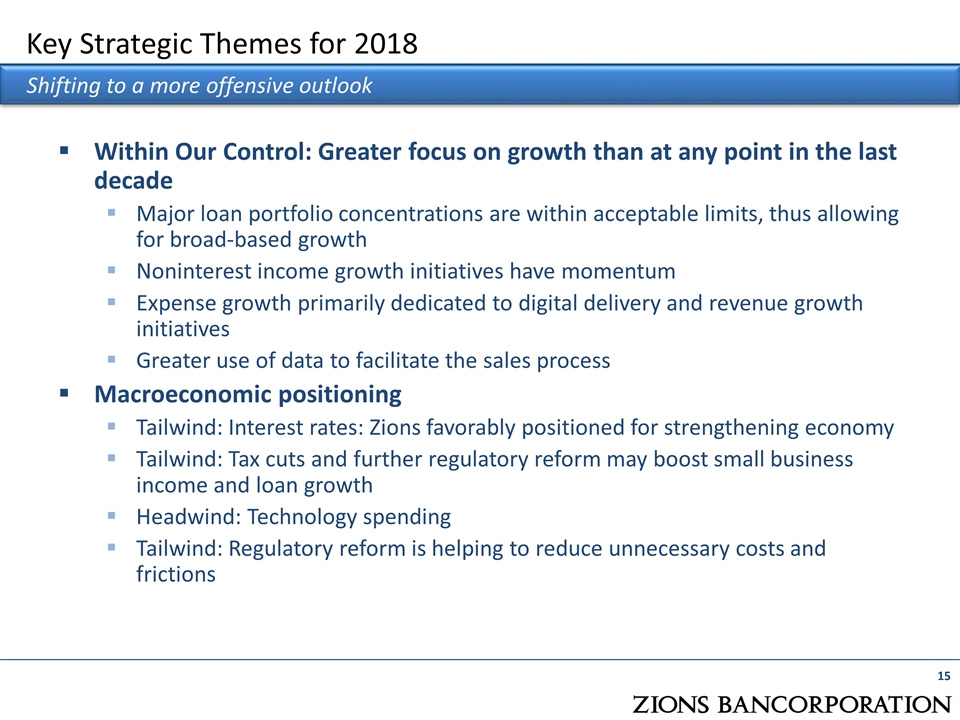
Within Our Control: Greater focus on growth than at any point in the last decade Major loan portfolio concentrations are within acceptable limits, thus allowing for broad-based growth Noninterest income growth initiatives have momentum Expense growth primarily dedicated to digital delivery and revenue growth initiatives Greater use of data to facilitate the sales process Macroeconomic positioning Tailwind: Interest rates: Zions favorably positioned for strengthening economy Tailwind: Tax cuts and further regulatory reform may boost small business income and loan growth Headwind: Technology spending Tailwind: Regulatory reform is helping to reduce unnecessary costs and frictions Key Strategic Themes for 2018 Shifting to a more offensive outlook
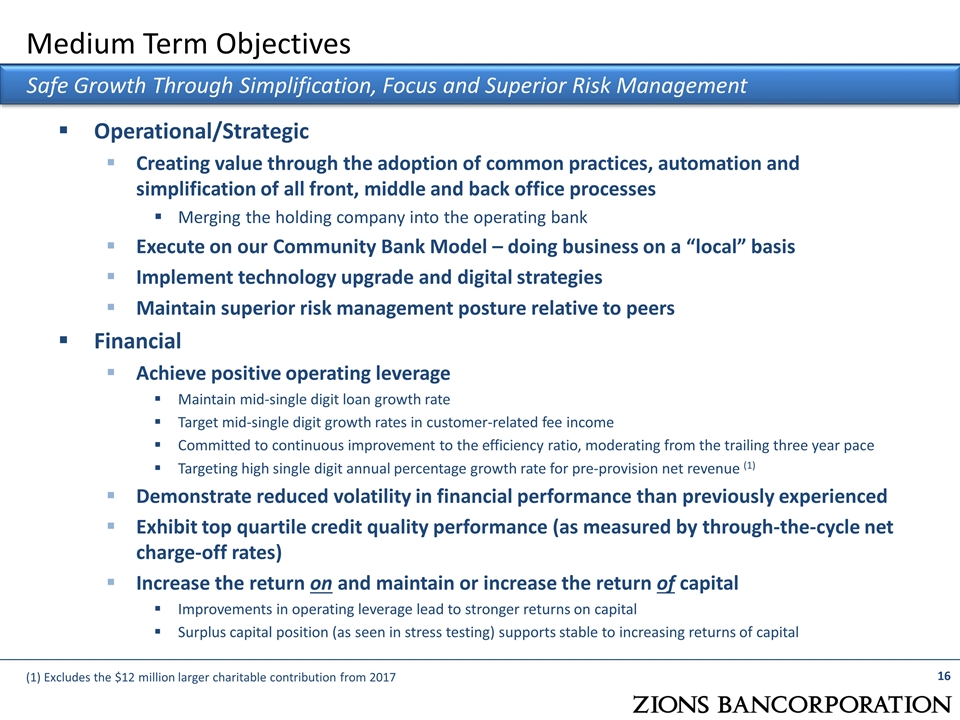
Operational/Strategic Creating value through the adoption of common practices, automation and simplification of all front, middle and back office processes Merging the holding company into the operating bank Execute on our Community Bank Model – doing business on a “local” basis Implement technology upgrade and digital strategies Maintain superior risk management posture relative to peers Financial Achieve positive operating leverage Maintain mid-single digit loan growth rate Target mid-single digit growth rates in customer-related fee income Committed to continuous improvement to the efficiency ratio, moderating from the trailing three year pace Targeting high single digit annual percentage growth rate for pre-provision net revenue (1) Demonstrate reduced volatility in financial performance than previously experienced Exhibit top quartile credit quality performance (as measured by through-the-cycle net charge-off rates) Increase the return on and maintain or increase the return of capital Improvements in operating leverage lead to stronger returns on capital Surplus capital position (as seen in stress testing) supports stable to increasing returns of capital Medium Term Objectives Safe Growth Through Simplification, Focus and Superior Risk Management (1) Excludes the $12 million larger charitable contribution from 2017
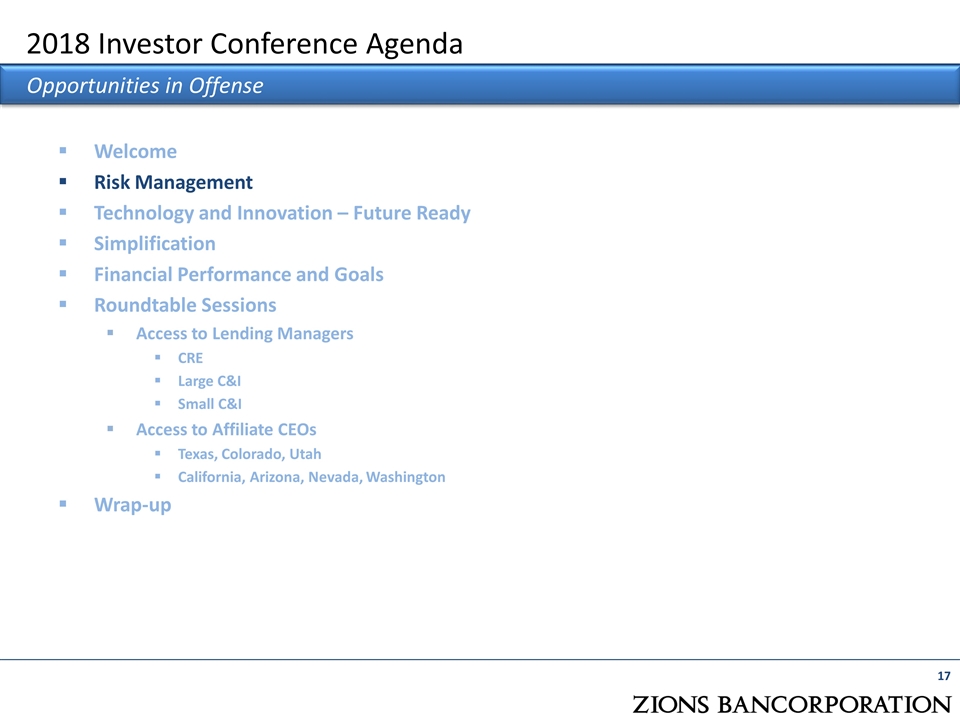
Welcome Risk Management Technology and Innovation – Future Ready Simplification Financial Performance and Goals Roundtable Sessions Access to Lending Managers CRE Large C&I Small C&I Access to Affiliate CEOs Texas, Colorado, Utah California, Arizona, Nevada, Washington Wrap-up 2018 Investor Conference Agenda Opportunities in Offense
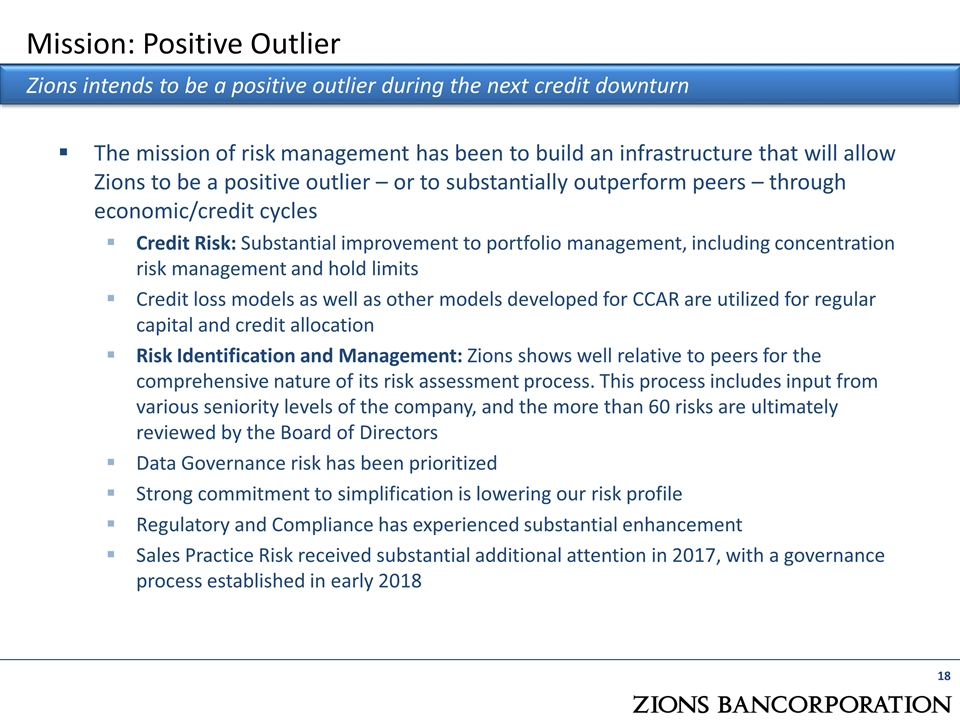
The mission of risk management has been to build an infrastructure that will allow Zions to be a positive outlier – or to substantially outperform peers – through economic/credit cycles Credit Risk: Substantial improvement to portfolio management, including concentration risk management and hold limits Credit loss models as well as other models developed for CCAR are utilized for regular capital and credit allocation Risk Identification and Management: Zions shows well relative to peers for the comprehensive nature of its risk assessment process. This process includes input from various seniority levels of the company, and the more than 60 risks are ultimately reviewed by the Board of Directors Data Governance risk has been prioritized Strong commitment to simplification is lowering our risk profile Regulatory and Compliance has experienced substantial enhancement Sales Practice Risk received substantial additional attention in 2017, with a governance process established in early 2018 Mission: Positive Outlier Zions intends to be a positive outlier during the next credit downturn
Strong Risk Management Infrastructure Substantial improvement in practices and policies that should lead to superior through-the-cycle performance Risk Matrix: dollar limits on different industries for lending and investments Strong concentration risk management Strong oversight of areas that are growing faster than expected levels, or of “hot spots” resulting in detailed white papers and reporting to the risk committee of the Board Prevented fast growth in energy loans in 2013-2014 Prevented strong CRE growth in Houston and California Prevented strong leverage lending growth Supply/demand outlook for CRE, by major MSA Strong subject matter experts in CRE / Consumer / C&I Reputable third party consultant engaged semi-annually Leveraged enhancement to stress testing loan loss models Active data governance program Training program for lenders and credit officers
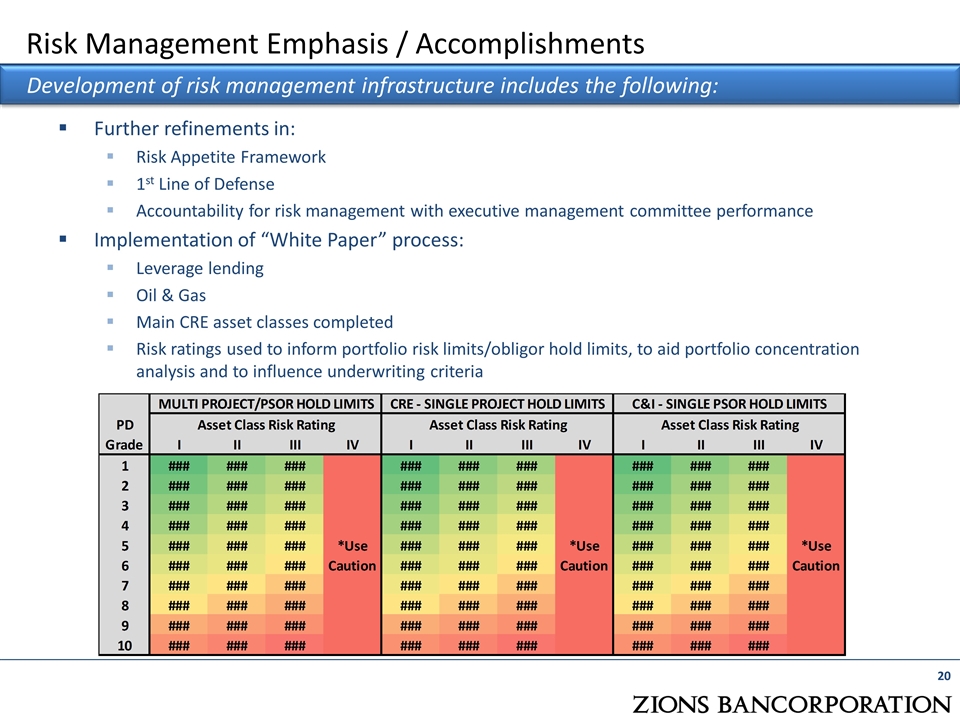
Risk Management Emphasis / Accomplishments Development of risk management infrastructure includes the following: Further refinements in: Risk Appetite Framework 1st Line of Defense Accountability for risk management with executive management committee performance Implementation of “White Paper” process: Leverage lending Oil & Gas Main CRE asset classes completed Risk ratings used to inform portfolio risk limits/obligor hold limits, to aid portfolio concentration analysis and to influence underwriting criteria
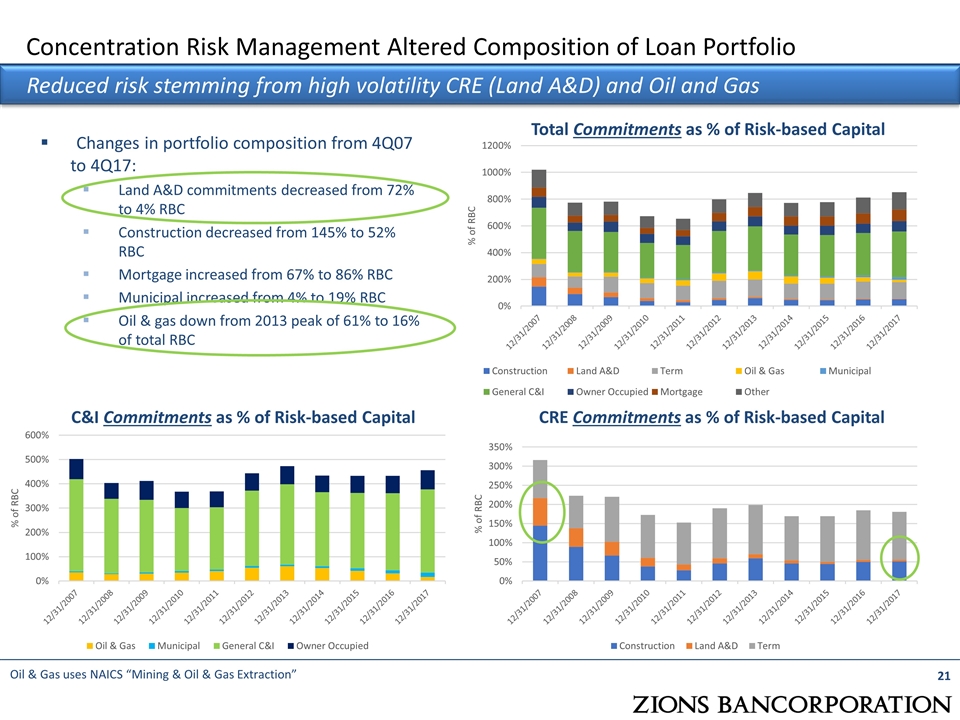
Concentration Risk Management Altered Composition of Loan Portfolio Oil & Gas uses NAICS “Mining & Oil & Gas Extraction” Total Commitments as % of Risk-based Capital C&I Commitments as % of Risk-based Capital CRE Commitments as % of Risk-based Capital Changes in portfolio composition from 4Q07 to 4Q17: Land A&D commitments decreased from 72% to 4% RBC Construction decreased from 145% to 52% RBC Mortgage increased from 67% to 86% RBC Municipal increased from 4% to 19% RBC Oil & gas down from 2013 peak of 61% to 16% of total RBC Reduced risk stemming from high volatility CRE (Land A&D) and Oil and Gas
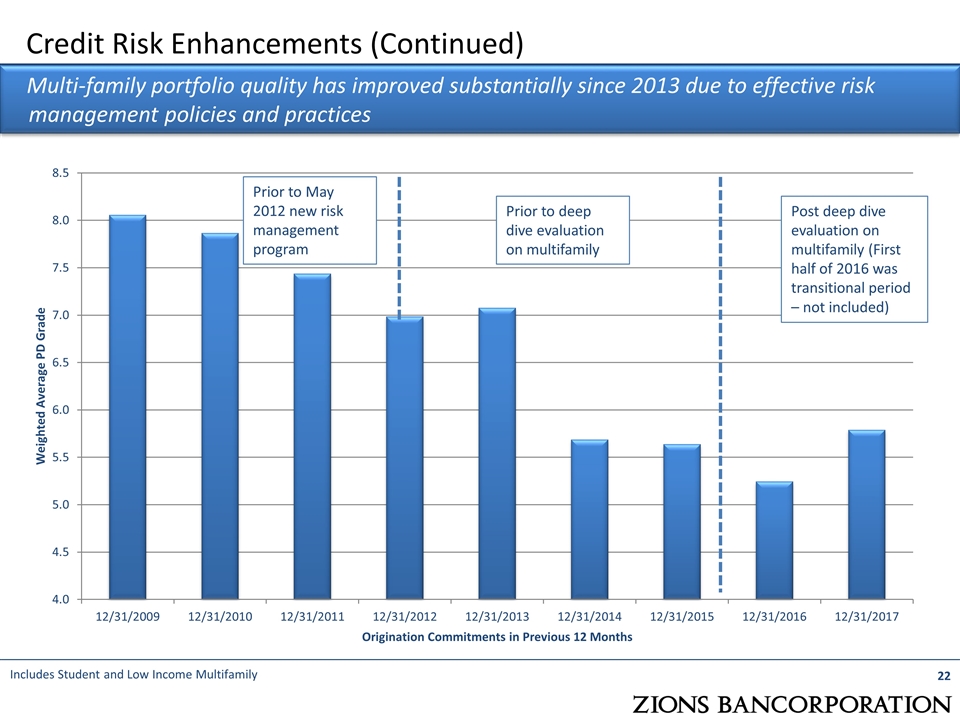
Credit Risk Enhancements (Continued) Multi-family portfolio quality has improved substantially since 2013 due to effective risk management policies and practices Prior to May 2012 new risk management program Prior to deep dive evaluation on multifamily Post deep dive evaluation on multifamily (First half of 2016 was transitional period – not included) Includes Student and Low Income Multifamily
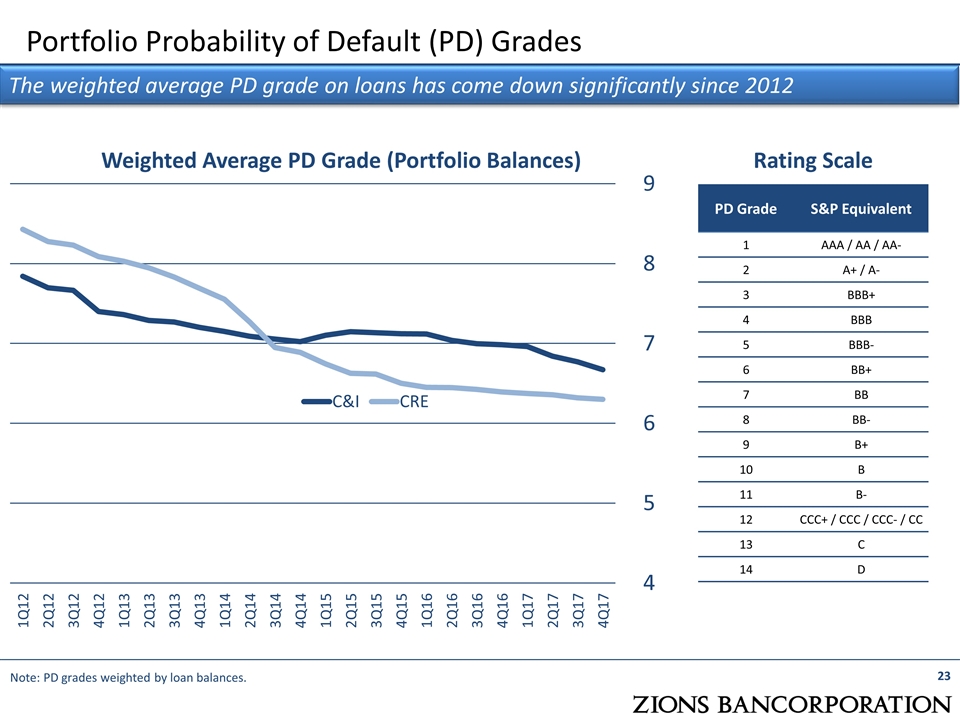
Portfolio Probability of Default (PD) Grades Note: PD grades weighted by loan balances. Weighted Average PD Grade (Portfolio Balances) Rating Scale PD Grade S&P Equivalent 1 AAA / AA / AA- 2 A+ / A- 3 BBB+ 4 BBB 5 BBB- 6 BB+ 7 BB 8 BB- 9 B+ 10 B 11 B- 12 CCC+ / CCC / CCC- / CC 13 C 14 D The weighted average PD grade on loans has come down significantly since 2012
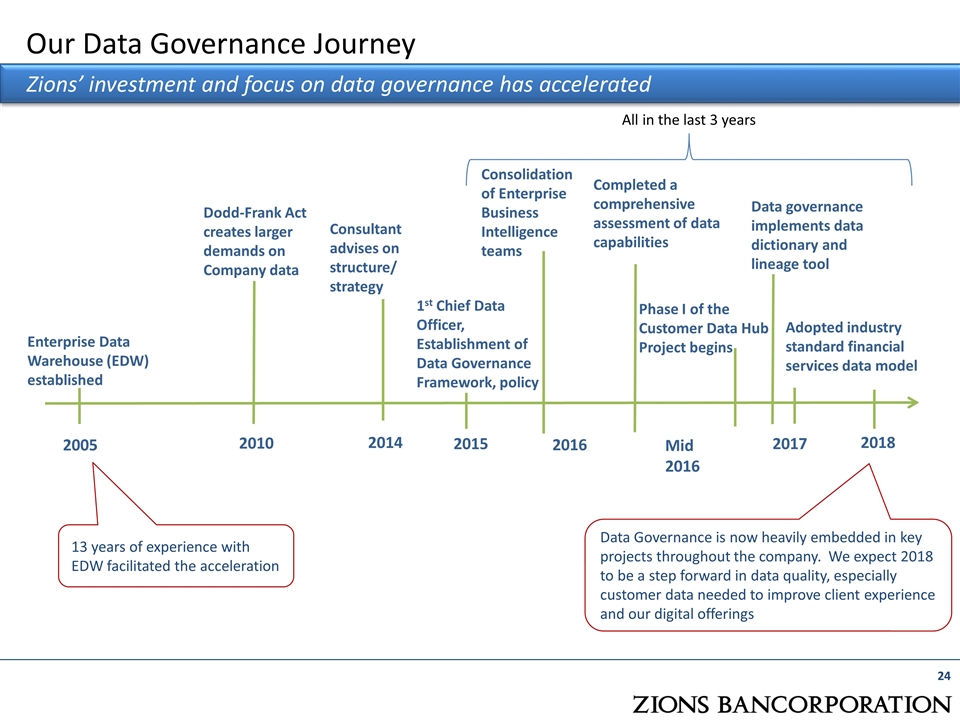
Our Data Governance Journey 2005 2010 2015 Enterprise Data Warehouse (EDW) established Dodd-Frank Act creates larger demands on Company data Consultant advises on structure/ strategy Consolidation of Enterprise Business Intelligence teams 2016 2017 Adopted industry standard financial services data model Mid 2016 Phase I of the Customer Data Hub Project begins Data governance implements data dictionary and lineage tool Completed a comprehensive assessment of data capabilities All in the last 3 years 13 years of experience with EDW facilitated the acceleration 1st Chief Data Officer, Establishment of Data Governance Framework, policy 2014 2018 Data Governance is now heavily embedded in key projects throughout the company. We expect 2018 to be a step forward in data quality, especially customer data needed to improve client experience and our digital offerings Zions’ investment and focus on data governance has accelerated
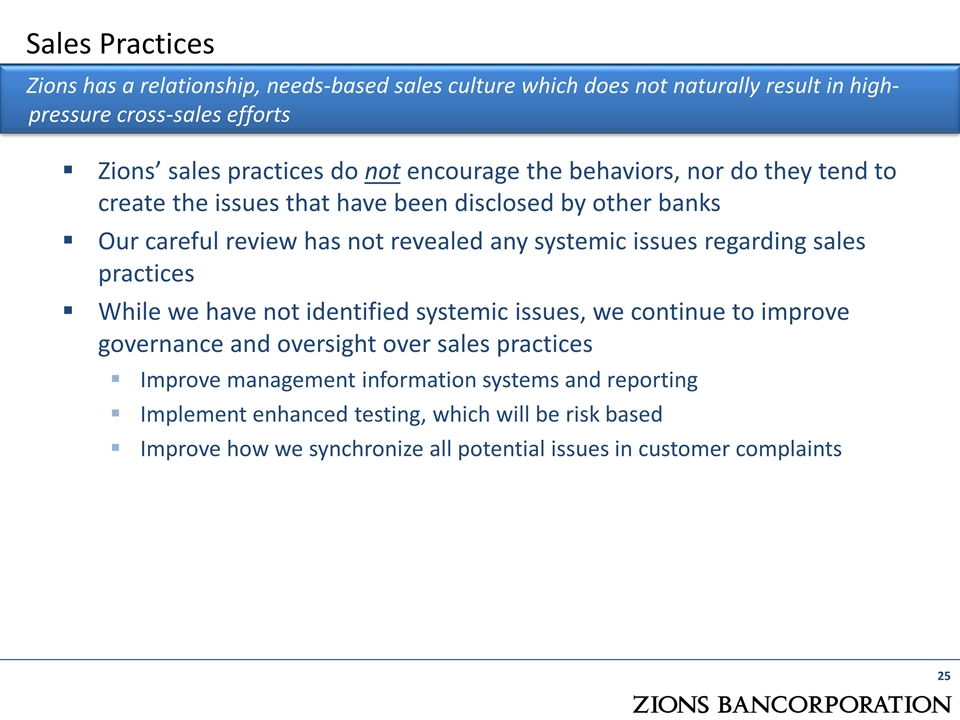
Sales Practices Zions’ sales practices do not encourage the behaviors, nor do they tend to create the issues that have been disclosed by other banks Our careful review has not revealed any systemic issues regarding sales practices While we have not identified systemic issues, we continue to improve governance and oversight over sales practices Improve management information systems and reporting Implement enhanced testing, which will be risk based Improve how we synchronize all potential issues in customer complaints Zions has a relationship, needs-based sales culture which does not naturally result in high- pressure cross-sales efforts
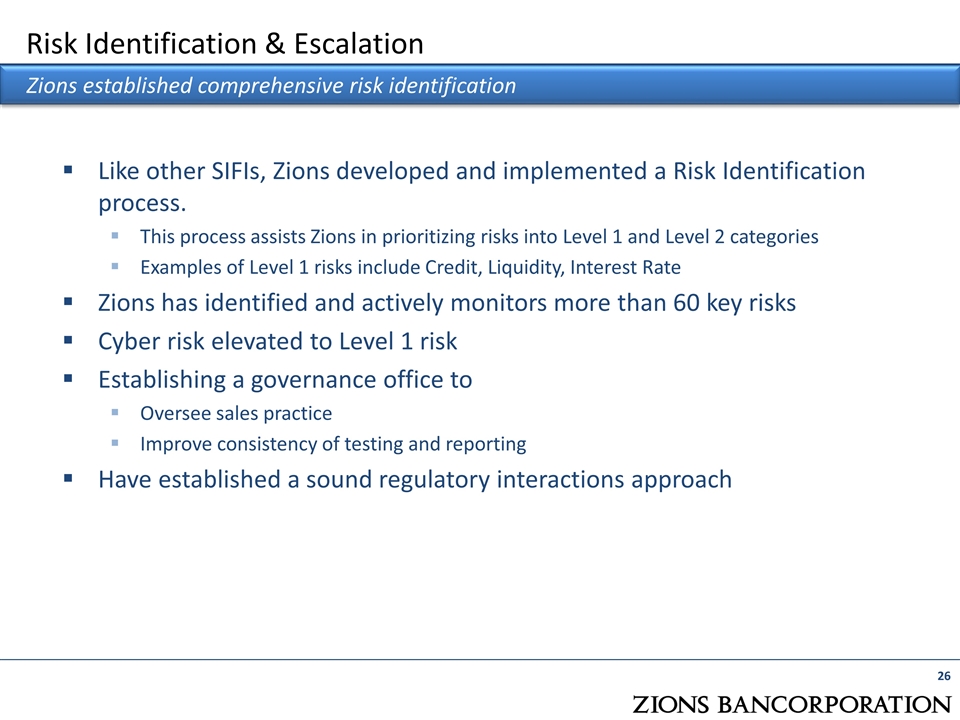
Risk Identification & Escalation Like other SIFIs, Zions developed and implemented a Risk Identification process. This process assists Zions in prioritizing risks into Level 1 and Level 2 categories Examples of Level 1 risks include Credit, Liquidity, Interest Rate Zions has identified and actively monitors more than 60 key risks Cyber risk elevated to Level 1 risk Establishing a governance office to Oversee sales practice Improve consistency of testing and reporting Have established a sound regulatory interactions approach Zions established comprehensive risk identification
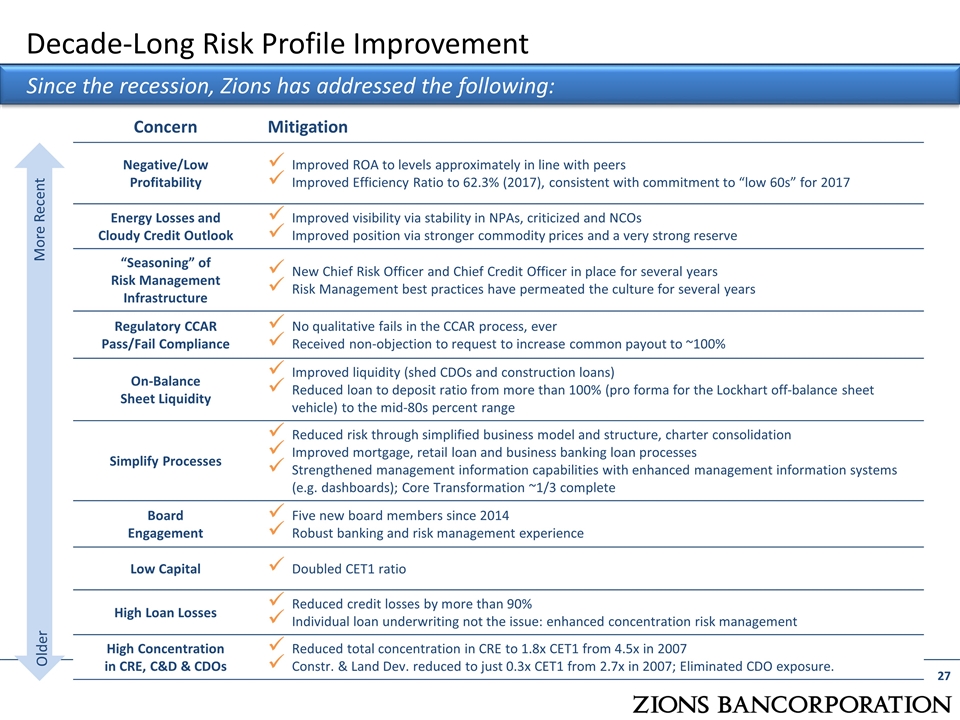
Decade-Long Risk Profile Improvement Since the recession, Zions has addressed the following: Concern Mitigation Negative/Low Profitability Improved ROA to levels approximately in line with peers Improved Efficiency Ratio to 62.3% (2017), consistent with commitment to “low 60s” for 2017 Energy Losses and Cloudy Credit Outlook Improved visibility via stability in NPAs, criticized and NCOs Improved position via stronger commodity prices and a very strong reserve “Seasoning” of Risk Management Infrastructure New Chief Risk Officer and Chief Credit Officer in place for several years Risk Management best practices have permeated the culture for several years Regulatory CCAR Pass/Fail Compliance No qualitative fails in the CCAR process, ever Received non-objection to request to increase common payout to ~100% On-Balance Sheet Liquidity Improved liquidity (shed CDOs and construction loans) Reduced loan to deposit ratio from more than 100% (pro forma for the Lockhart off-balance sheet vehicle) to the mid-80s percent range Simplify Processes Reduced risk through simplified business model and structure, charter consolidation Improved mortgage, retail loan and business banking loan processes Strengthened management information capabilities with enhanced management information systems (e.g. dashboards); Core Transformation ~1/3 complete Board Engagement Five new board members since 2014 Robust banking and risk management experience Low Capital Doubled CET1 ratio High Loan Losses Reduced credit losses by more than 90% Individual loan underwriting not the issue: enhanced concentration risk management High Concentration in CRE, C&D & CDOs Reduced total concentration in CRE to 1.8x CET1 from 4.5x in 2007 Constr. & Land Dev. reduced to just 0.3x CET1 from 2.7x in 2007; Eliminated CDO exposure. Older More Recent
Review of Credit Quality
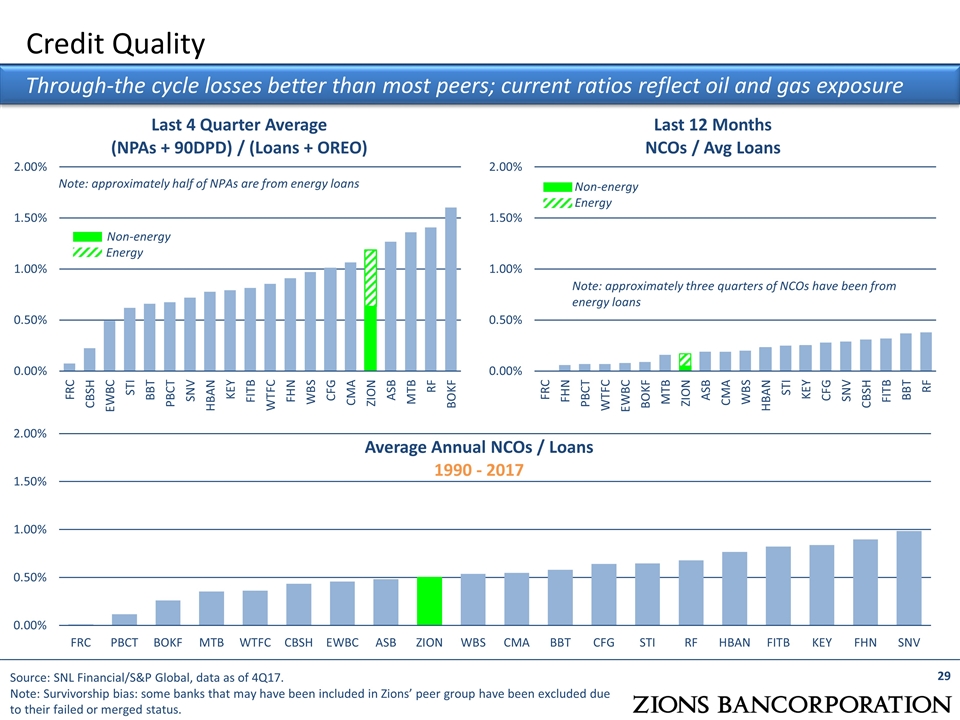
Credit Quality Last 4 Quarter Average (NPAs + 90DPD) / (Loans + OREO) Last 12 Months NCOs / Avg Loans Source: SNL Financial/S&P Global, data as of 4Q17. Note: Survivorship bias: some banks that may have been included in Zions’ peer group have been excluded due to their failed or merged status. Through-the cycle losses better than most peers; current ratios reflect oil and gas exposure Average Annual NCOs / Loans 1990 - 2017 Note: approximately half of NPAs are from energy loans Non-energy Energy
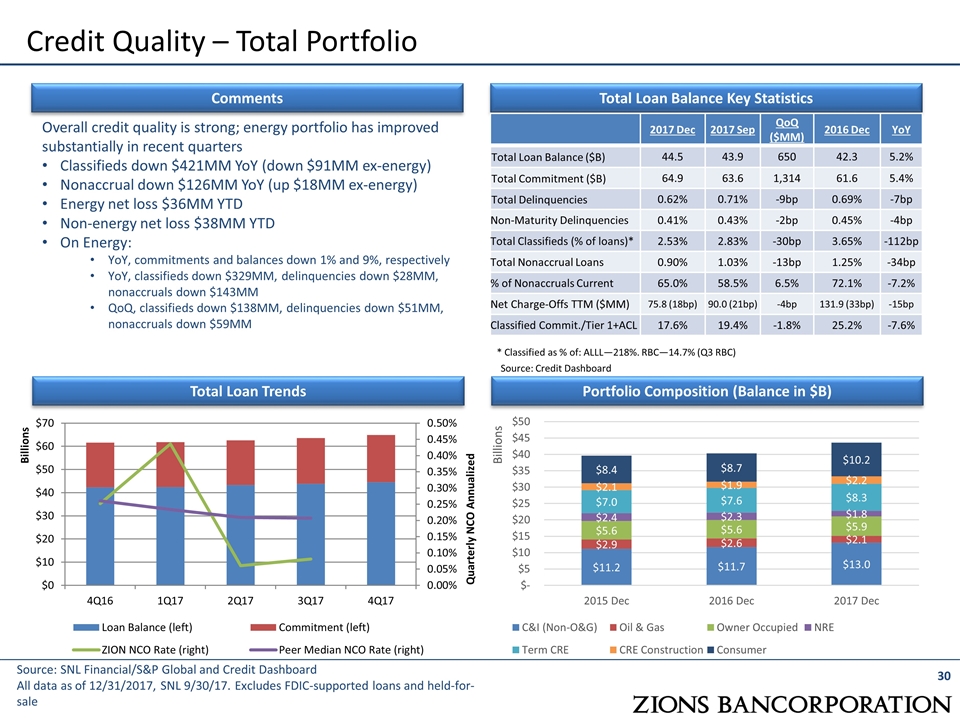
Credit Quality – Total Portfolio Overall credit quality is strong; energy portfolio has improved substantially in recent quarters Classifieds down $421MM YoY (down $91MM ex-energy) Nonaccrual down $126MM YoY (up $18MM ex-energy) Energy net loss $36MM YTD Non-energy net loss $38MM YTD On Energy: YoY, commitments and balances down 1% and 9%, respectively YoY, classifieds down $329MM, delinquencies down $28MM, nonaccruals down $143MM QoQ, classifieds down $138MM, delinquencies down $51MM, nonaccruals down $59MM Source: SNL Financial/S&P Global and Credit Dashboard All data as of 12/31/2017, SNL 9/30/17. Excludes FDIC-supported loans and held-for-sale Total Loan Balance Key Statistics Comments Portfolio Composition (Balance in $B) Total Loan Trends 2017 Dec 2017 Sep QoQ ($MM) 2016 Dec YoY Total Loan Balance ($B) 44.5 43.9 650 42.3 5.2% Total Commitment ($B) 64.9 63.6 1,314 61.6 5.4% Total Delinquencies 0.62% 0.71% -9bp 0.69% -7bp Non-Maturity Delinquencies 0.41% 0.43% -2bp 0.45% -4bp Total Classifieds (% of loans)* 2.53% 2.83% -30bp 3.65% -112bp Total Nonaccrual Loans 0.90% 1.03% -13bp 1.25% -34bp % of Nonaccruals Current 65.0% 58.5% 6.5% 72.1% -7.2% Net Charge-Offs TTM ($MM) 75.8 (18bp) 90.0 (21bp) -4bp 131.9 (33bp) -15bp Classified Commit./Tier 1+ACL 17.6% 19.4% -1.8% 25.2% -7.6% * Classified as % of: ALLL—218%. RBC—14.7% (Q3 RBC) Source: Credit Dashboard
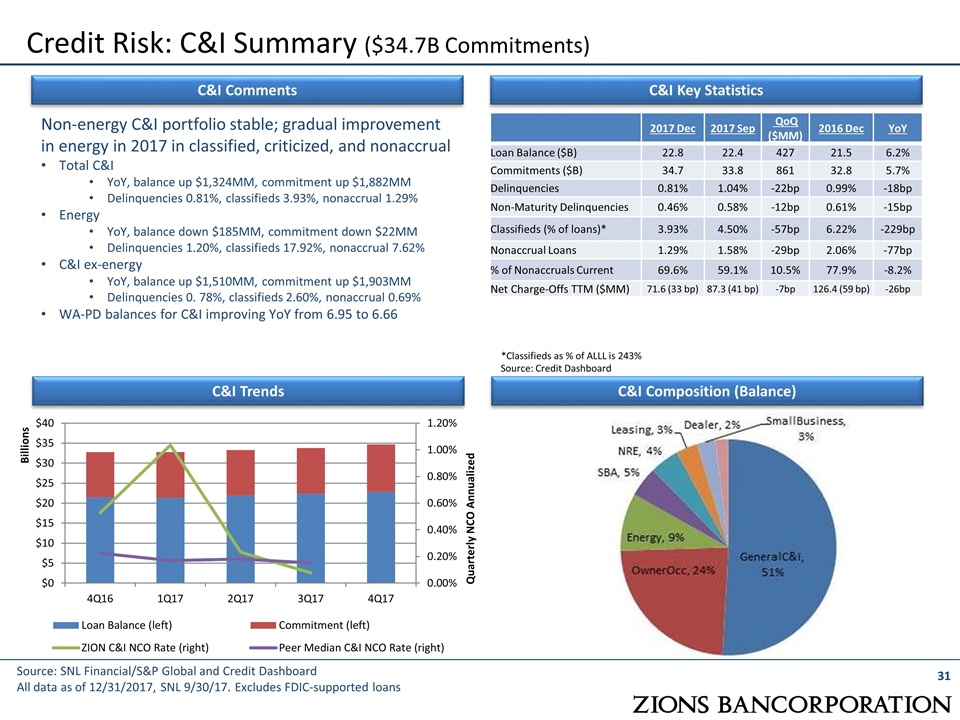
2017 Dec 2017 Sep QoQ ($MM) 2016 Dec YoY Loan Balance ($B) 22.8 22.4 427 21.5 6.2% Commitments ($B) 34.7 33.8 861 32.8 5.7% Delinquencies 0.81% 1.04% -22bp 0.99% -18bp Non-Maturity Delinquencies 0.46% 0.58% -12bp 0.61% -15bp Classifieds (% of loans)* 3.93% 4.50% -57bp 6.22% -229bp Nonaccrual Loans 1.29% 1.58% -29bp 2.06% -77bp % of Nonaccruals Current 69.6% 59.1% 10.5% 77.9% -8.2% Net Charge-Offs TTM ($MM) 71.6 (33 bp) 87.3 (41 bp) -7bp 126.4 (59 bp) -26bp Non-energy C&I portfolio stable; gradual improvement in energy in 2017 in classified, criticized, and nonaccrual Total C&I YoY, balance up $1,324MM, commitment up $1,882MM Delinquencies 0.81%, classifieds 3.93%, nonaccrual 1.29% Energy YoY, balance down $185MM, commitment down $22MM Delinquencies 1.20%, classifieds 17.92%, nonaccrual 7.62% C&I ex-energy YoY, balance up $1,510MM, commitment up $1,903MM Delinquencies 0. 78%, classifieds 2.60%, nonaccrual 0.69% WA-PD balances for C&I improving YoY from 6.95 to 6.66 Credit Risk: C&I Summary ($34.7B Commitments) C&I Key Statistics C&I Comments C&I Composition (Balance) C&I Trends *Classifieds as % of ALLL is 243% Source: SNL Financial/S&P Global and Credit Dashboard All data as of 12/31/2017, SNL 9/30/17. Excludes FDIC-supported loans Source: Credit Dashboard
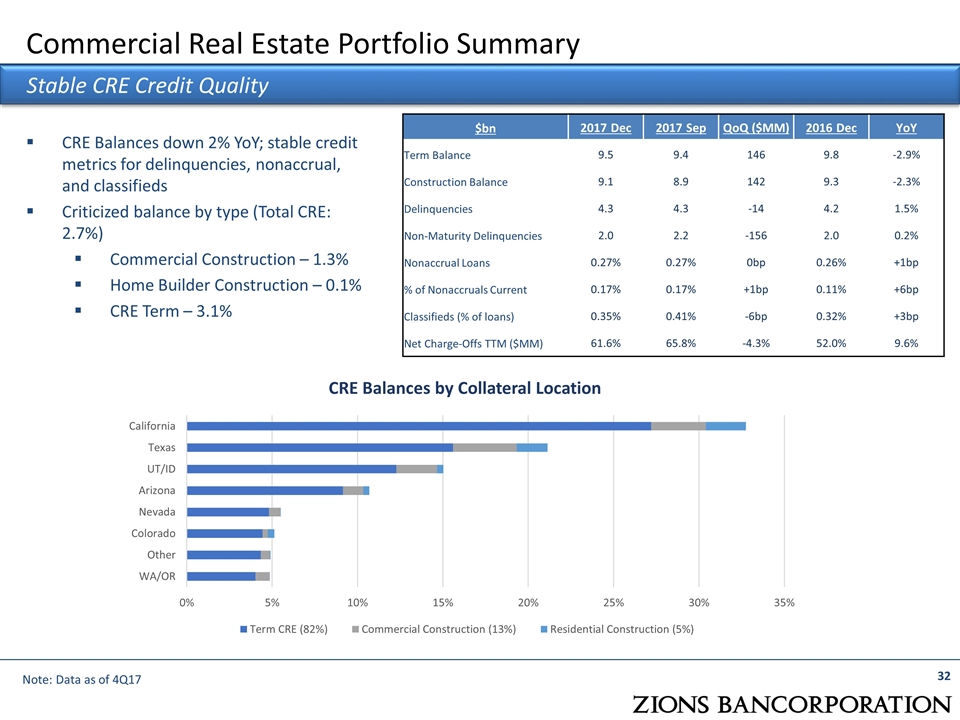
Commercial Real Estate Portfolio Summary Stable CRE Credit Quality Note: Data as of 4Q17 CRE Balances down 2% YoY; stable credit metrics for delinquencies, nonaccrual, and classifieds Criticized balance by type (Total CRE: 2.7%) Commercial Construction – 1.3% Home Builder Construction – 0.1% CRE Term – 3.1% $bn 2017 Dec 2017 Sep QoQ ($MM) 2016 Dec YoY Term Balance 9.5 9.4 146 9.8 -2.9% Construction Balance 9.1 8.9 142 9.3 -2.3% Delinquencies 4.3 4.3 -14 4.2 1.5% Non-Maturity Delinquencies 2.0 2.2 -156 2.0 0.2% Nonaccrual Loans 0.27% 0.27% 0bp 0.26% +1bp % of Nonaccruals Current 0.17% 0.17% +1bp 0.11% +6bp Classifieds (% of loans) 0.35% 0.41% -6bp 0.32% +3bp Net Charge-Offs TTM ($MM) 61.6% 65.8% -4.3% 52.0% 9.6%
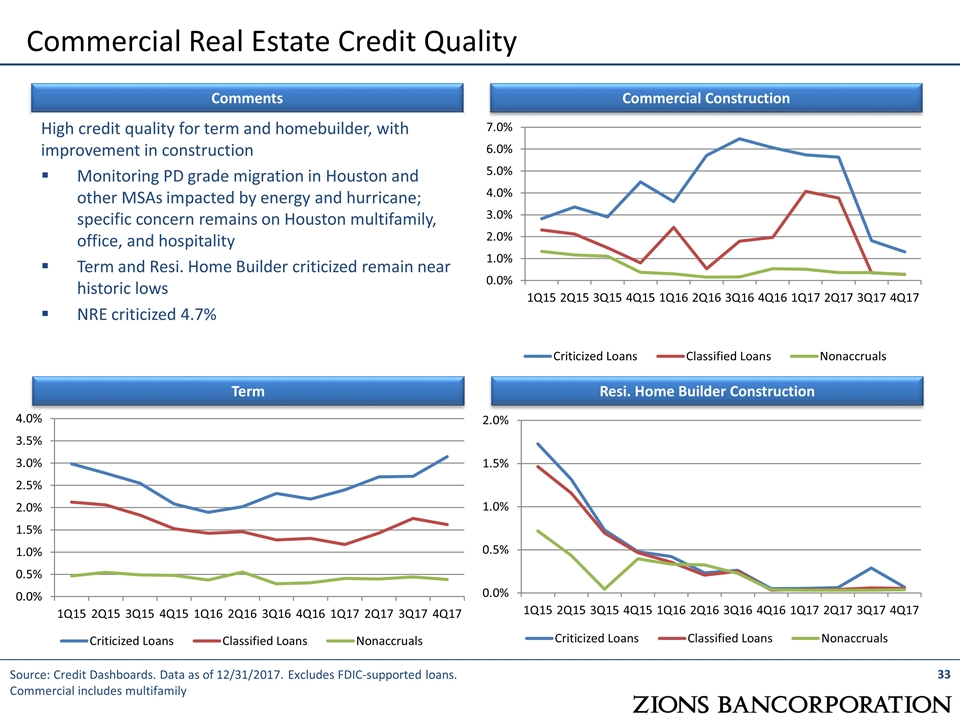
Comments Source: Credit Dashboards. Data as of 12/31/2017. Excludes FDIC-supported loans. Commercial includes multifamily Commercial Real Estate Credit Quality Commercial Construction Resi. Home Builder Construction Term High credit quality for term and homebuilder, with improvement in construction Monitoring PD grade migration in Houston and other MSAs impacted by energy and hurricane; specific concern remains on Houston multifamily, office, and hospitality Term and Resi. Home Builder criticized remain near historic lows NRE criticized 4.7%
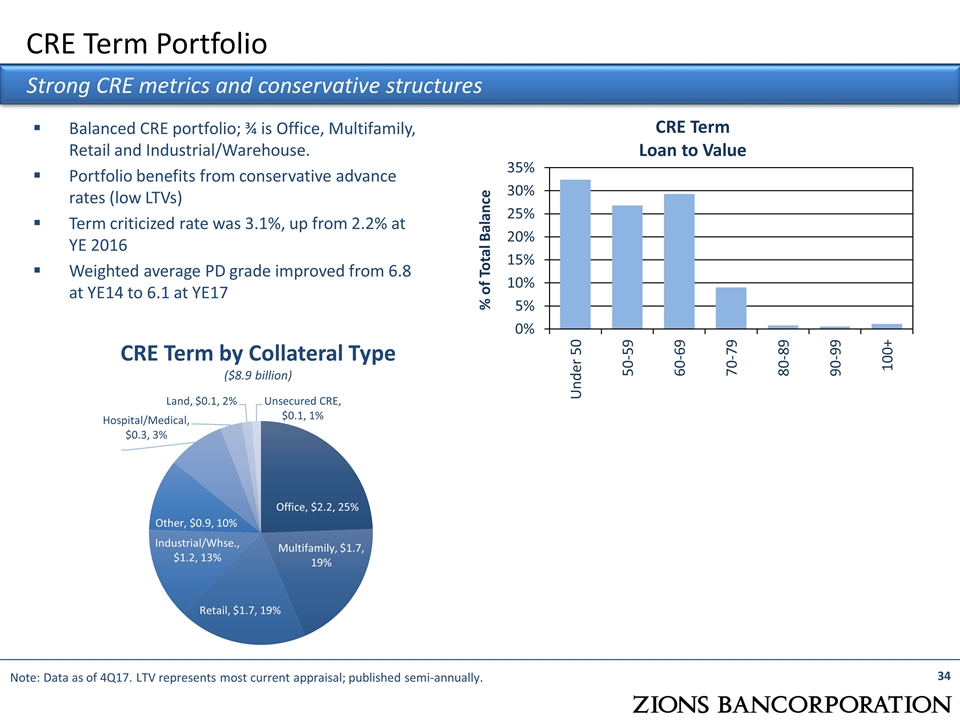
CRE Term Portfolio Strong CRE metrics and conservative structures Balanced CRE portfolio; ¾ is Office, Multifamily, Retail and Industrial/Warehouse. Portfolio benefits from conservative advance rates (low LTVs) Term criticized rate was 3.1%, up from 2.2% at YE 2016 Weighted average PD grade improved from 6.8 at YE14 to 6.1 at YE17 Note: Data as of 4Q17. LTV represents most current appraisal; published semi-annually. CRE Term by Collateral Type ($8.9 billion)
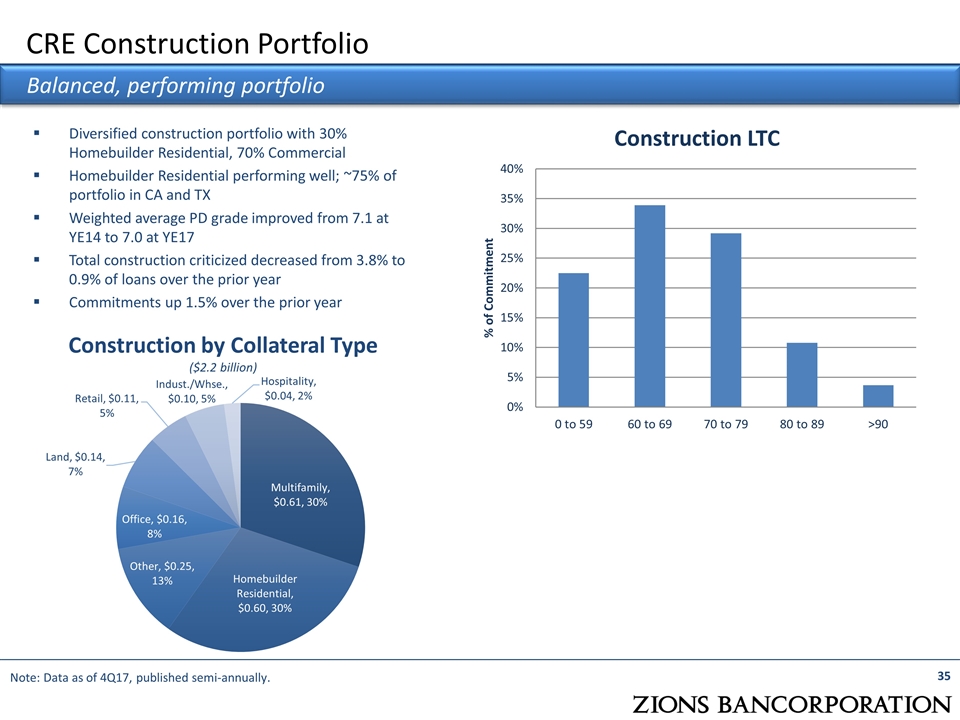
CRE Construction Portfolio Balanced, performing portfolio Note: Data as of 4Q17, published semi-annually. Diversified construction portfolio with 30% Homebuilder Residential, 70% Commercial Homebuilder Residential performing well; ~75% of portfolio in CA and TX Weighted average PD grade improved from 7.1 at YE14 to 7.0 at YE17 Total construction criticized decreased from 3.8% to 0.9% of loans over the prior year Commitments up 1.5% over the prior year Construction by Collateral Type ($2.2 billion)
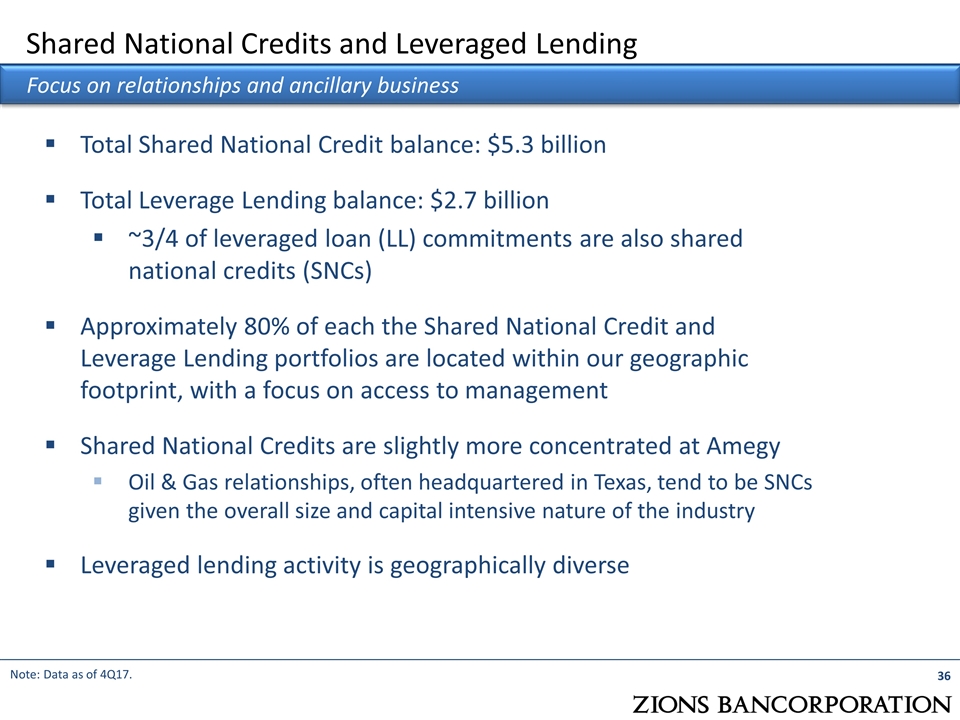
Shared National Credits and Leveraged Lending Total Shared National Credit balance: $5.3 billion Total Leverage Lending balance: $2.7 billion ~3/4 of leveraged loan (LL) commitments are also shared national credits (SNCs) Approximately 80% of each the Shared National Credit and Leverage Lending portfolios are located within our geographic footprint, with a focus on access to management Shared National Credits are slightly more concentrated at Amegy Oil & Gas relationships, often headquartered in Texas, tend to be SNCs given the overall size and capital intensive nature of the industry Leveraged lending activity is geographically diverse Note: Data as of 4Q17. Focus on relationships and ancillary business
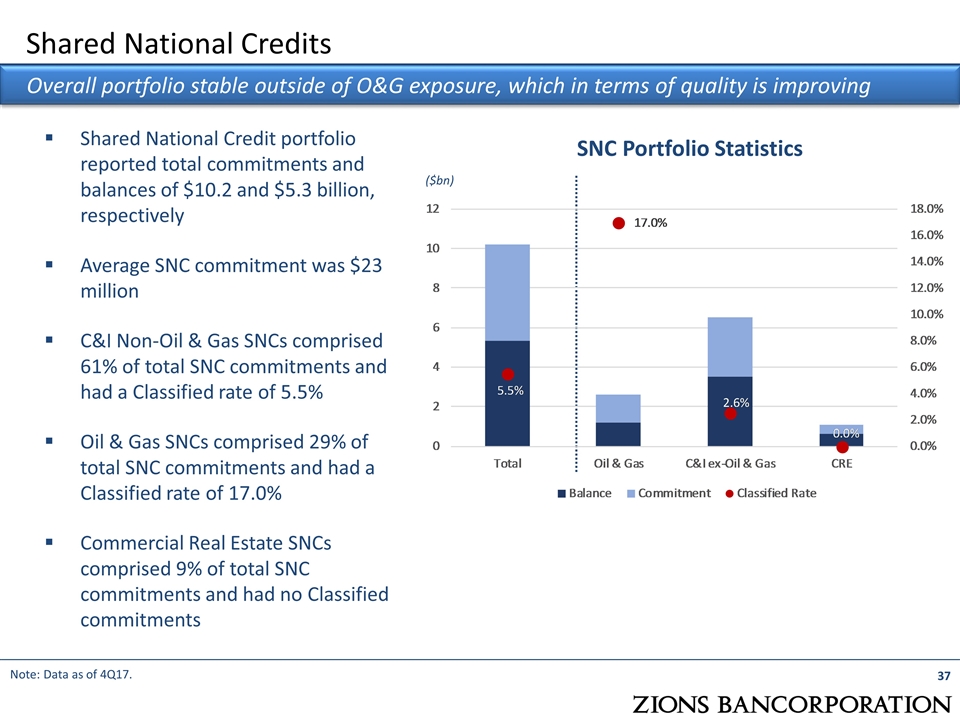
Shared National Credits Note: Data as of 4Q17. Shared National Credit portfolio reported total commitments and balances of $10.2 and $5.3 billion, respectively Average SNC commitment was $23 million C&I Non-Oil & Gas SNCs comprised 61% of total SNC commitments and had a Classified rate of 5.5% Oil & Gas SNCs comprised 29% of total SNC commitments and had a Classified rate of 17.0% Commercial Real Estate SNCs comprised 9% of total SNC commitments and had no Classified commitments SNC Portfolio Statistics ($bn) Overall portfolio stable outside of O&G exposure, which in terms of quality is improving
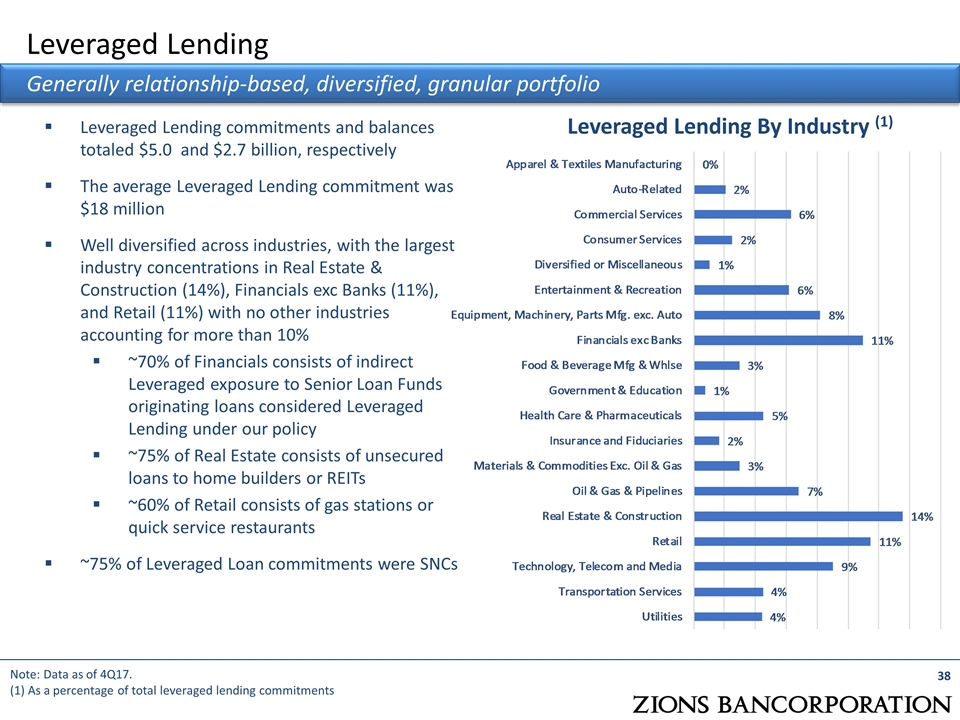
Leveraged Lending Note: Data as of 4Q17. (1) As a percentage of total leveraged lending commitments Leveraged Lending commitments and balances totaled $5.0 and $2.7 billion, respectively The average Leveraged Lending commitment was $18 million Well diversified across industries, with the largest industry concentrations in Real Estate & Construction (14%), Financials exc Banks (11%), and Retail (11%) with no other industries accounting for more than 10% ~70% of Financials consists of indirect Leveraged exposure to Senior Loan Funds originating loans considered Leveraged Lending under our policy ~75% of Real Estate consists of unsecured loans to home builders or REITs ~60% of Retail consists of gas stations or quick service restaurants ~75% of Leveraged Loan commitments were SNCs Leveraged Lending By Industry (1) Generally relationship-based, diversified, granular portfolio
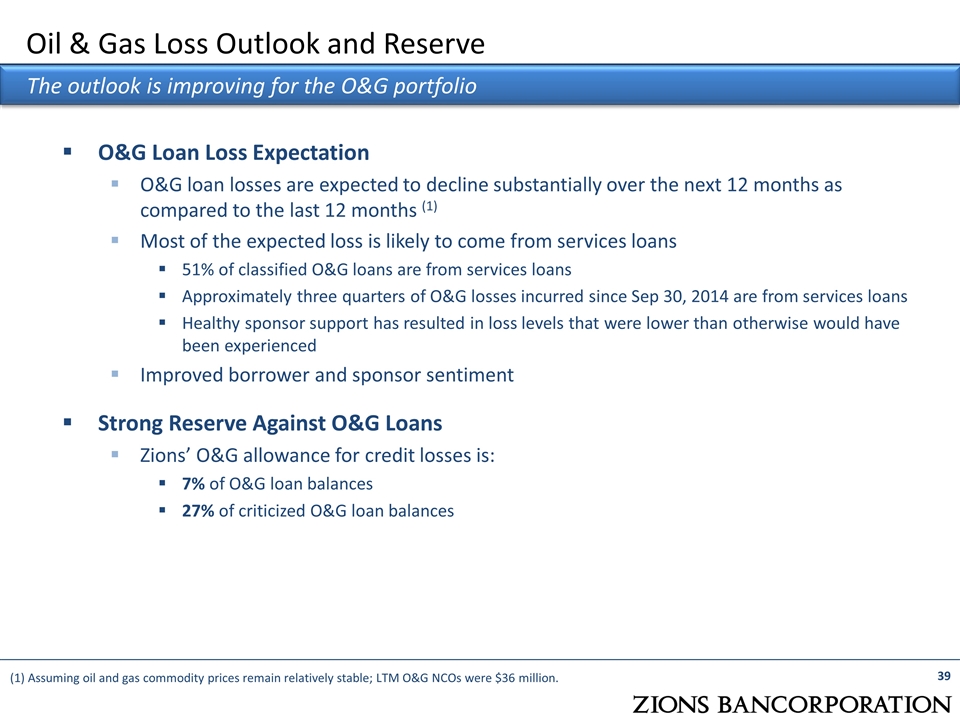
O&G Loan Loss Expectation O&G loan losses are expected to decline substantially over the next 12 months as compared to the last 12 months (1) Most of the expected loss is likely to come from services loans 51% of classified O&G loans are from services loans Approximately three quarters of O&G losses incurred since Sep 30, 2014 are from services loans Healthy sponsor support has resulted in loss levels that were lower than otherwise would have been experienced Improved borrower and sponsor sentiment Strong Reserve Against O&G Loans Zions’ O&G allowance for credit losses is: 7% of O&G loan balances 27% of criticized O&G loan balances Oil & Gas Loss Outlook and Reserve The outlook is improving for the O&G portfolio (1) Assuming oil and gas commodity prices remain relatively stable; LTM O&G NCOs were $36 million.
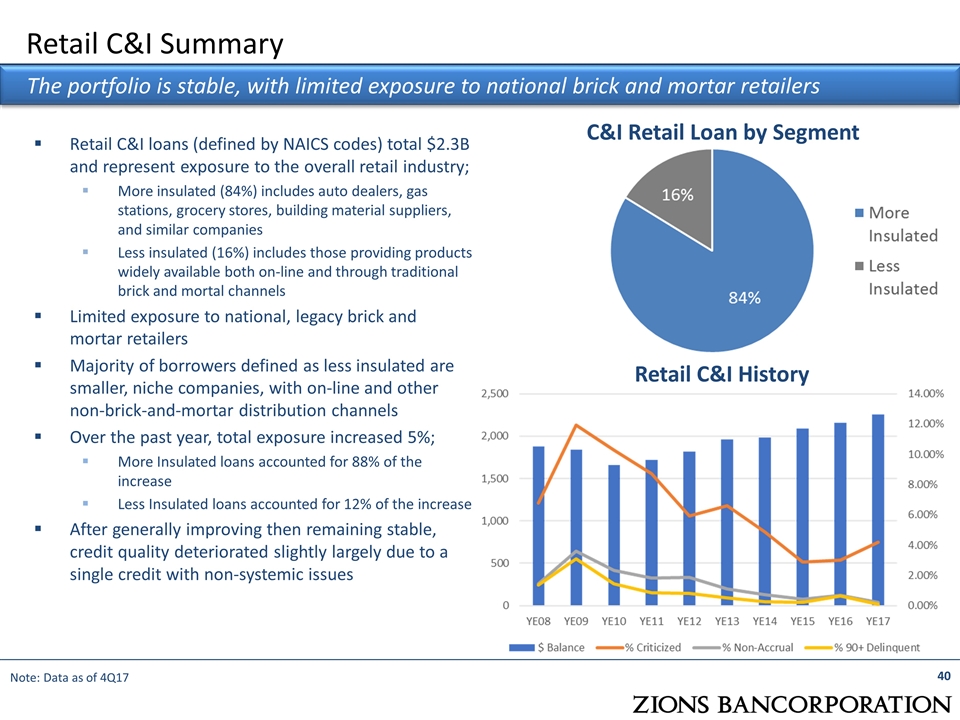
Retail C&I Summary The portfolio is stable, with limited exposure to national brick and mortar retailers Retail C&I loans (defined by NAICS codes) total $2.3B and represent exposure to the overall retail industry; More insulated (84%) includes auto dealers, gas stations, grocery stores, building material suppliers, and similar companies Less insulated (16%) includes those providing products widely available both on-line and through traditional brick and mortal channels Limited exposure to national, legacy brick and mortar retailers Majority of borrowers defined as less insulated are smaller, niche companies, with on-line and other non-brick-and-mortar distribution channels Over the past year, total exposure increased 5%; More Insulated loans accounted for 88% of the increase Less Insulated loans accounted for 12% of the increase After generally improving then remaining stable, credit quality deteriorated slightly largely due to a single credit with non-systemic issues C&I Retail Loan by Segment Retail C&I History Note: Data as of 4Q17
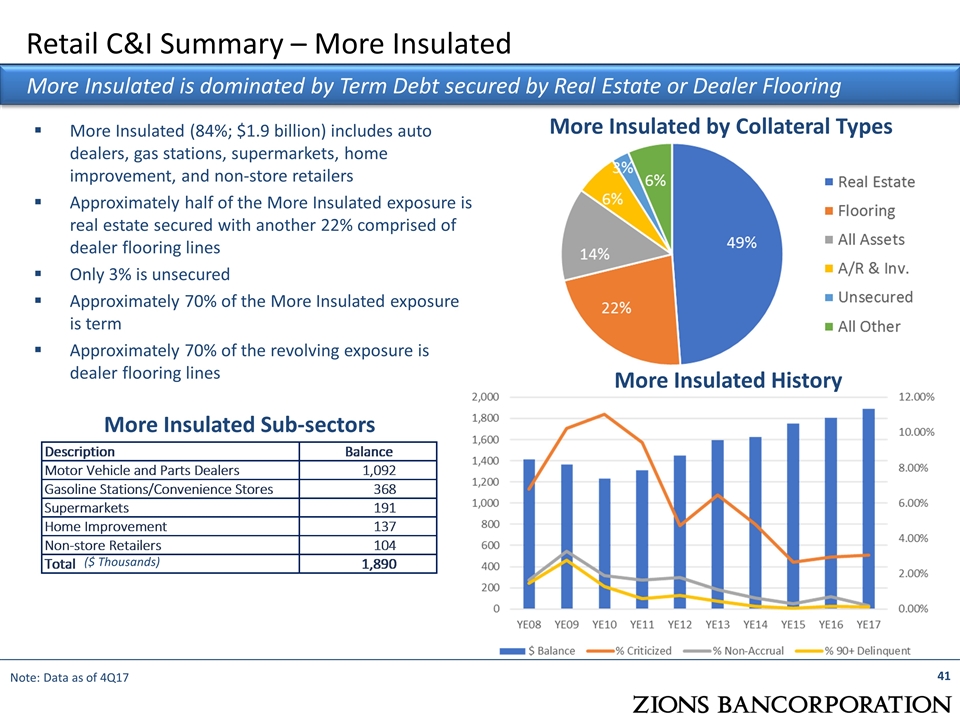
Retail C&I Summary – More Insulated More Insulated (84%; $1.9 billion) includes auto dealers, gas stations, supermarkets, home improvement, and non-store retailers Approximately half of the More Insulated exposure is real estate secured with another 22% comprised of dealer flooring lines Only 3% is unsecured Approximately 70% of the More Insulated exposure is term Approximately 70% of the revolving exposure is dealer flooring lines More Insulated is dominated by Term Debt secured by Real Estate or Dealer Flooring More Insulated Sub-sectors More Insulated History More Insulated by Collateral Types ($ Thousands) Note: Data as of 4Q17
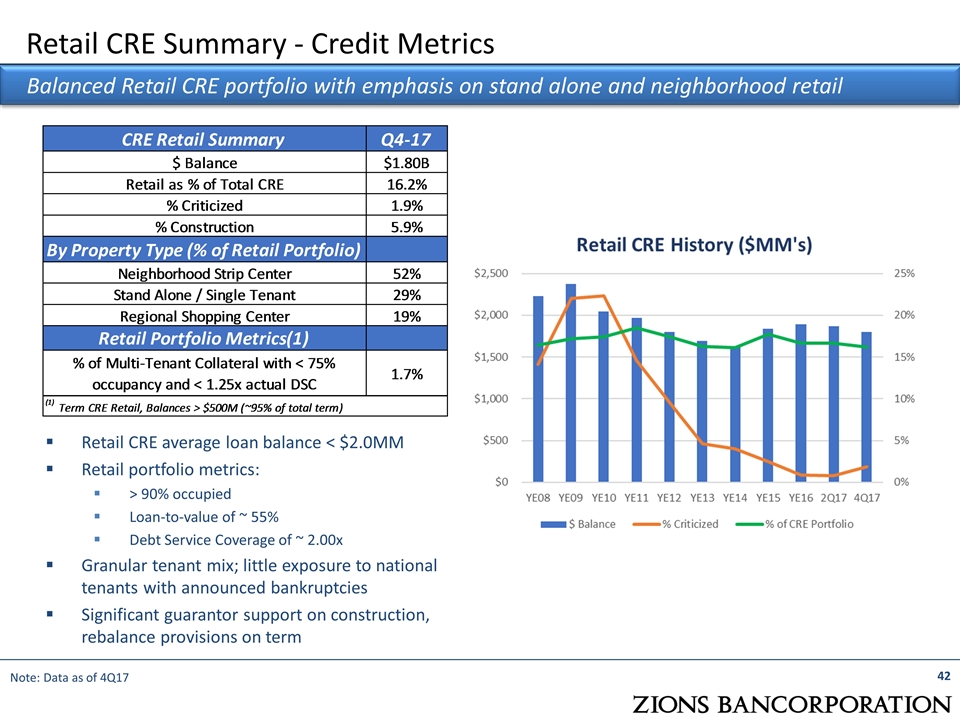
Retail CRE Summary - Credit Metrics Balanced Retail CRE portfolio with emphasis on stand alone and neighborhood retail Note: Data as of 4Q17 Retail CRE average loan balance < $2.0MM Retail portfolio metrics: > 90% occupied Loan-to-value of ~ 55% Debt Service Coverage of ~ 2.00x Granular tenant mix; little exposure to national tenants with announced bankruptcies Significant guarantor support on construction, rebalance provisions on term
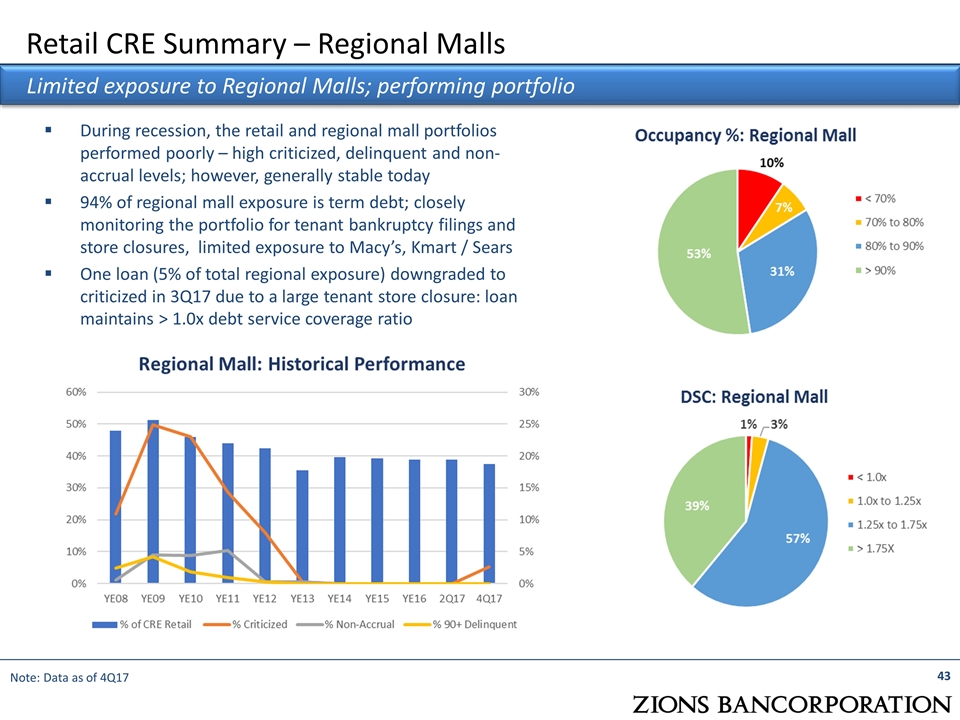
Retail CRE Summary – Regional Malls Limited exposure to Regional Malls; performing portfolio Note: Data as of 4Q17 During recession, the retail and regional mall portfolios performed poorly – high criticized, delinquent and non-accrual levels; however, generally stable today 94% of regional mall exposure is term debt; closely monitoring the portfolio for tenant bankruptcy filings and store closures, limited exposure to Macy’s, Kmart / Sears One loan (5% of total regional exposure) downgraded to criticized in 3Q17 due to a large tenant store closure: loan maintains > 1.0x debt service coverage ratio
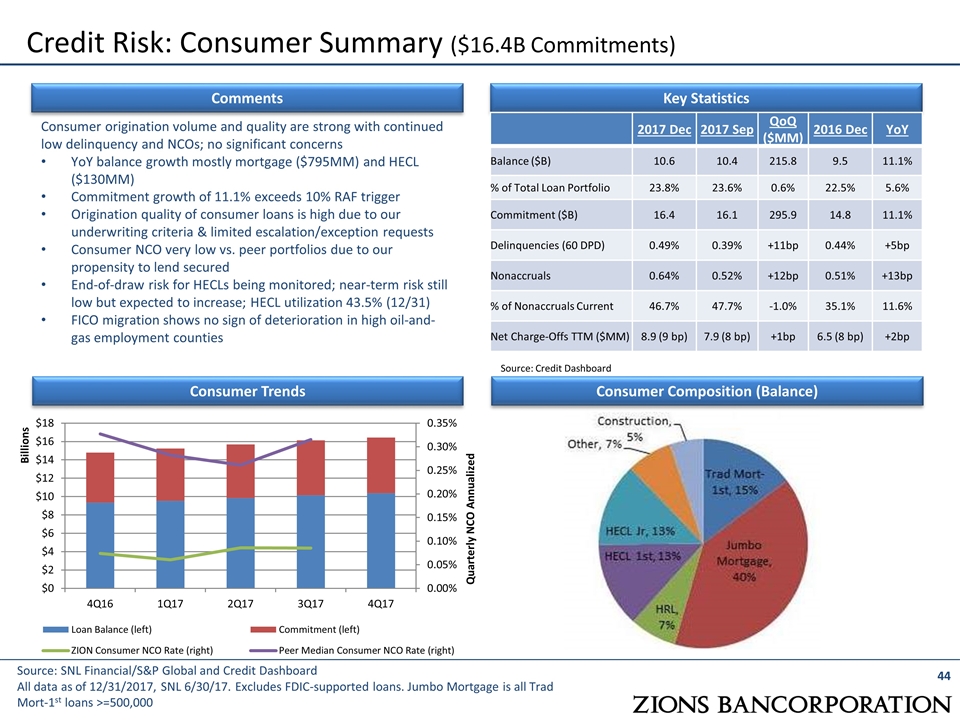
Consumer origination volume and quality are strong with continued low delinquency and NCOs; no significant concerns YoY balance growth mostly mortgage ($795MM) and HECL ($130MM) Commitment growth of 11.1% exceeds 10% RAF trigger Origination quality of consumer loans is high due to our underwriting criteria & limited escalation/exception requests Consumer NCO very low vs. peer portfolios due to our propensity to lend secured End-of-draw risk for HECLs being monitored; near-term risk still low but expected to increase; HECL utilization 43.5% (12/31) FICO migration shows no sign of deterioration in high oil-and-gas employment counties Credit Risk: Consumer Summary ($16.4B Commitments) Key Statistics Comments Consumer Composition (Balance) Consumer Trends 2017 Dec 2017 Sep QoQ ($MM) 2016 Dec YoY Balance ($B) 10.6 10.4 215.8 9.5 11.1% % of Total Loan Portfolio 23.8% 23.6% 0.6% 22.5% 5.6% Commitment ($B) 16.4 16.1 295.9 14.8 11.1% Delinquencies (60 DPD) 0.49% 0.39% +11bp 0.44% +5bp Nonaccruals 0.64% 0.52% +12bp 0.51% +13bp % of Nonaccruals Current 46.7% 47.7% -1.0% 35.1% 11.6% Net Charge-Offs TTM ($MM) 8.9 (9 bp) 7.9 (8 bp) +1bp 6.5 (8 bp) +2bp Source: SNL Financial/S&P Global and Credit Dashboard All data as of 12/31/2017, SNL 6/30/17. Excludes FDIC-supported loans. Jumbo Mortgage is all Trad Mort-1st loans >=500,000 Source: Credit Dashboard
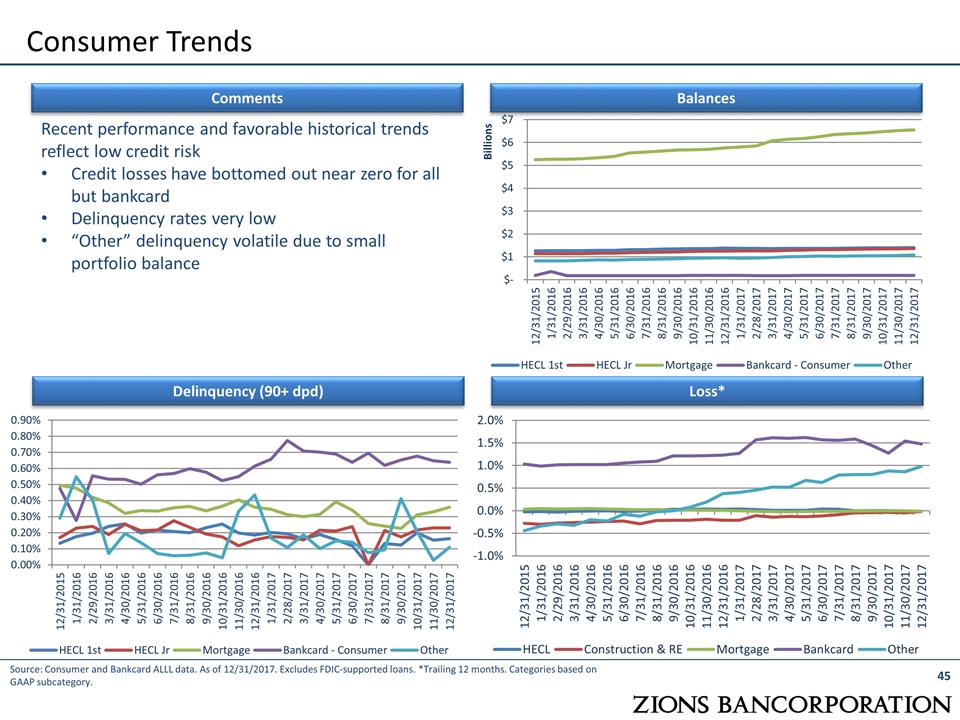
Source: Consumer and Bankcard ALLL data. As of 12/31/2017. Excludes FDIC-supported loans. *Trailing 12 months. Categories based on GAAP subcategory. Consumer Trends Recent performance and favorable historical trends reflect low credit risk Credit losses have bottomed out near zero for all but bankcard Delinquency rates very low “Other” delinquency volatile due to small portfolio balance Balances Comments Loss* Delinquency (90+ dpd)
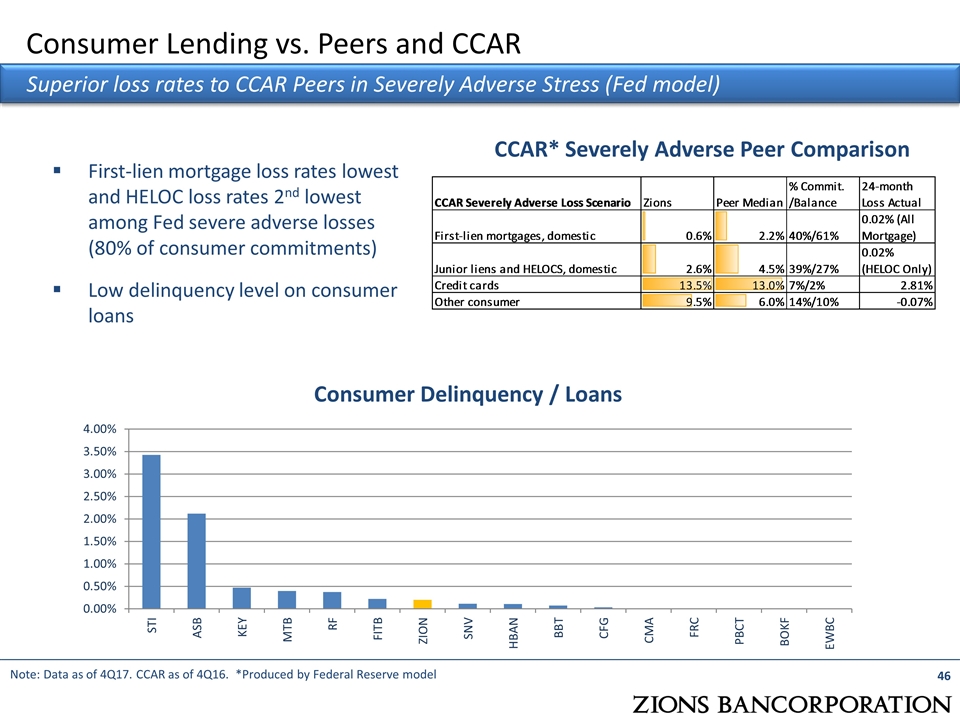
Consumer Lending vs. Peers and CCAR Note: Data as of 4Q17. CCAR as of 4Q16. *Produced by Federal Reserve model CCAR* Severely Adverse Peer Comparison First-lien mortgage loss rates lowest and HELOC loss rates 2nd lowest among Fed severe adverse losses (80% of consumer commitments) Low delinquency level on consumer loans Consumer Delinquency / Loans Superior loss rates to CCAR Peers in Severely Adverse Stress (Fed model)
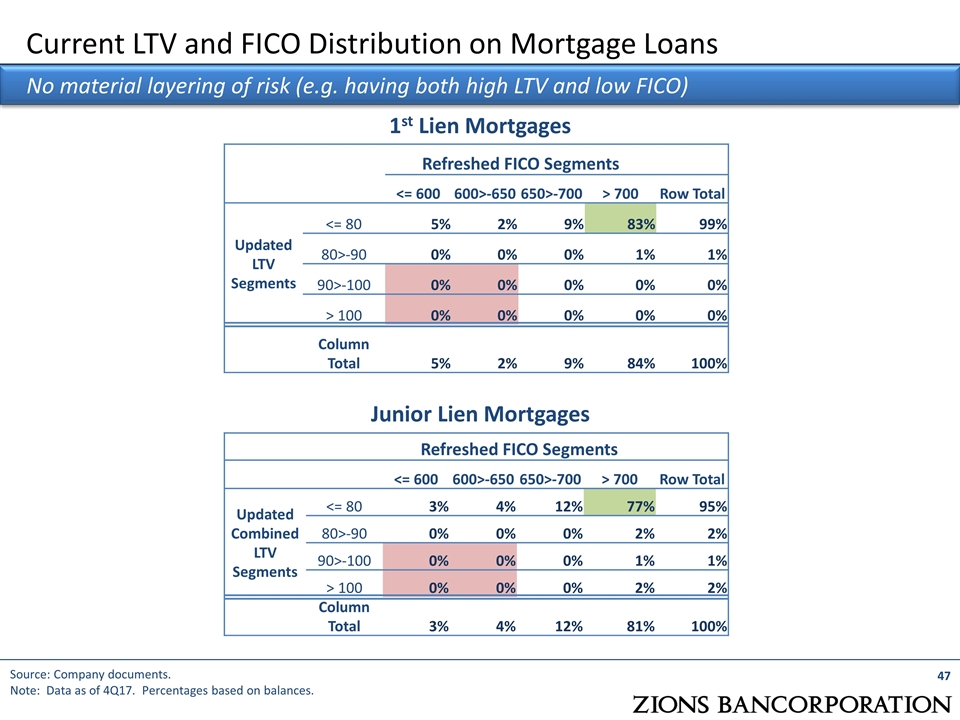
Current LTV and FICO Distribution on Mortgage Loans Source: Company documents. Note: Data as of 4Q17. Percentages based on balances. 1st Lien Mortgages Junior Lien Mortgages Refreshed FICO Segments <= 600 600>-650 650>-700 > 700 Row Total Updated LTV Segments <= 80 5% 2% 9% 83% 99% 80>-90 0% 0% 0% 1% 1% 90>-100 0% 0% 0% 0% 0% > 100 0% 0% 0% 0% 0% Column Total 5% 2% 9% 84% 100% Refreshed FICO Segments <= 600 600>-650 650>-700 > 700 Row Total Updated Combined LTV Segments <= 80 3% 4% 12% 77% 95% 80>-90 0% 0% 0% 2% 2% 90>-100 0% 0% 0% 1% 1% > 100 0% 0% 0% 2% 2% Column Total 3% 4% 12% 81% 100% No material layering of risk (e.g. having both high LTV and low FICO)
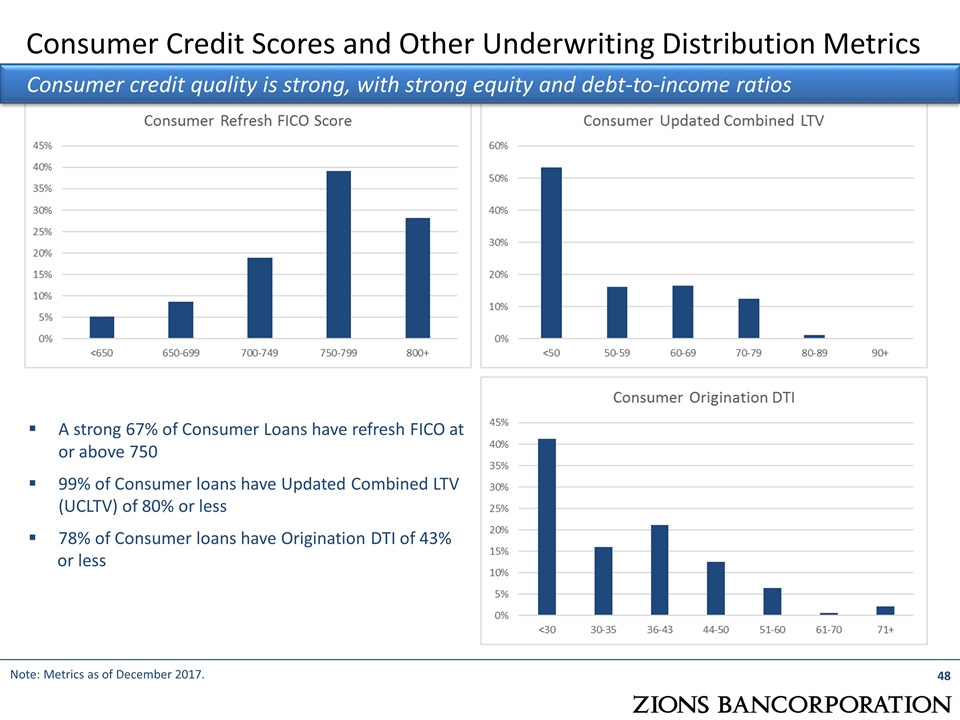
Consumer Credit Scores and Other Underwriting Distribution Metrics Note: Metrics as of December 2017. A strong 67% of Consumer Loans have refresh FICO at or above 750 99% of Consumer loans have Updated Combined LTV (UCLTV) of 80% or less 78% of Consumer loans have Origination DTI of 43% or less Consumer credit quality is strong, with strong equity and debt-to-income ratios
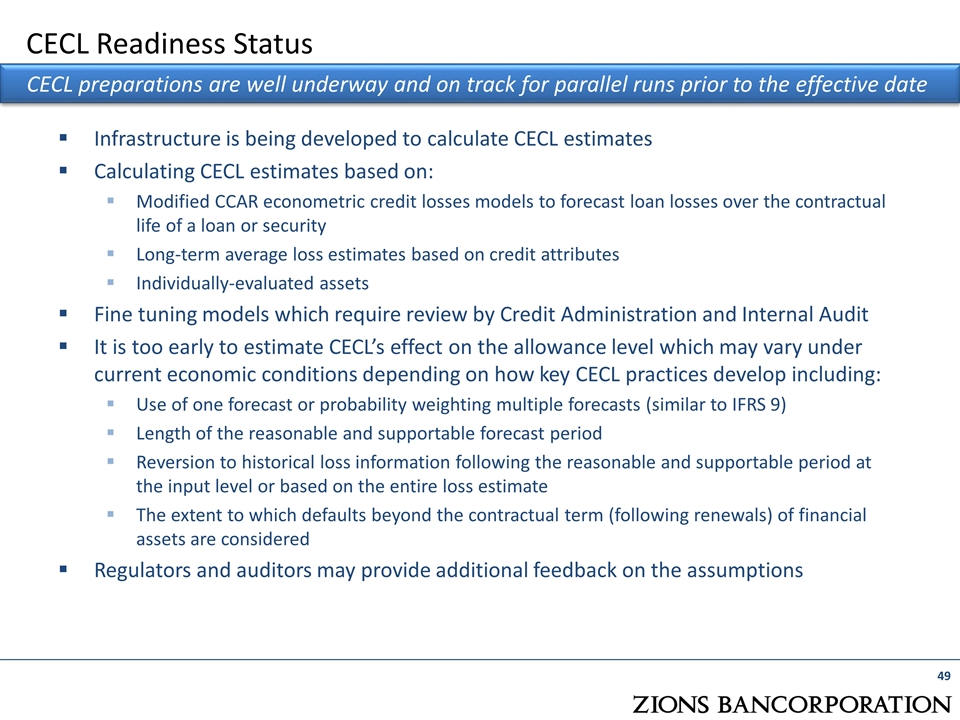
CECL Readiness Status Infrastructure is being developed to calculate CECL estimates Calculating CECL estimates based on: Modified CCAR econometric credit losses models to forecast loan losses over the contractual life of a loan or security Long-term average loss estimates based on credit attributes Individually-evaluated assets Fine tuning models which require review by Credit Administration and Internal Audit It is too early to estimate CECL’s effect on the allowance level which may vary under current economic conditions depending on how key CECL practices develop including: Use of one forecast or probability weighting multiple forecasts (similar to IFRS 9) Length of the reasonable and supportable forecast period Reversion to historical loss information following the reasonable and supportable period at the input level or based on the entire loss estimate The extent to which defaults beyond the contractual term (following renewals) of financial assets are considered Regulators and auditors may provide additional feedback on the assumptions CECL preparations are well underway and on track for parallel runs prior to the effective date
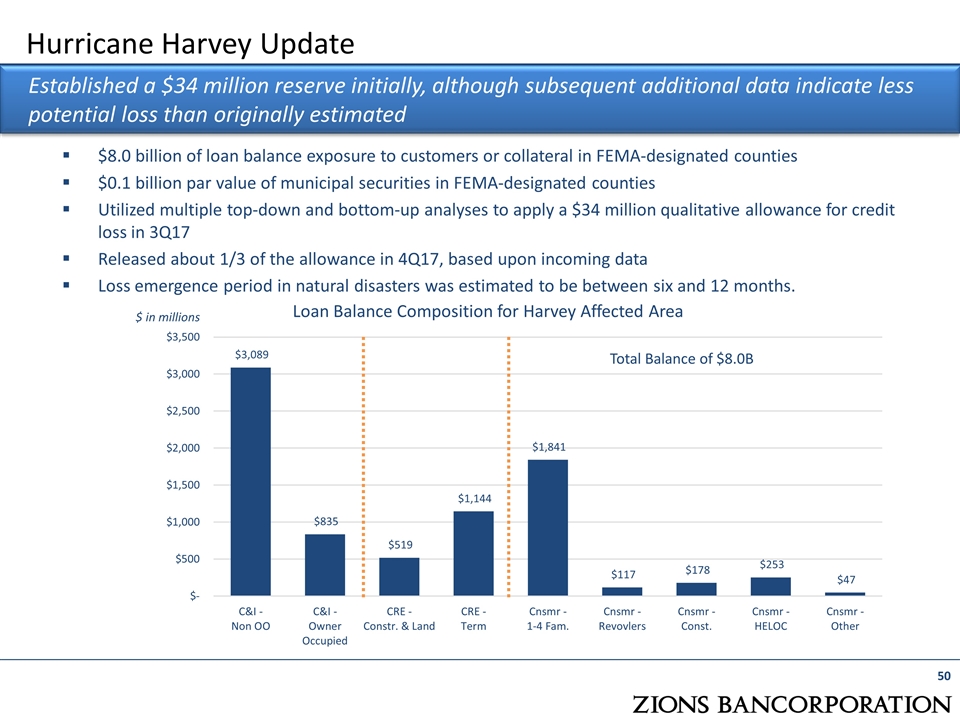
Hurricane Harvey Update $8.0 billion of loan balance exposure to customers or collateral in FEMA-designated counties $0.1 billion par value of municipal securities in FEMA-designated counties Utilized multiple top-down and bottom-up analyses to apply a $34 million qualitative allowance for credit loss in 3Q17 Released about 1/3 of the allowance in 4Q17, based upon incoming data Loss emergence period in natural disasters was estimated to be between six and 12 months. $ in millions Total Balance of $8.0B Established a $34 million reserve initially, although subsequent additional data indicate less potential loss than originally estimated
Welcome Risk Management Technology and Innovation – Future Ready Simplification Financial Performance and Goals Roundtable Sessions Access to Lending Managers CRE Large C&I Small C&I Access to Affiliate CEOs Texas, Colorado, Utah California, Arizona, Nevada, Washington Wrap-up 2018 Investor Conference Agenda Opportunities in Offense
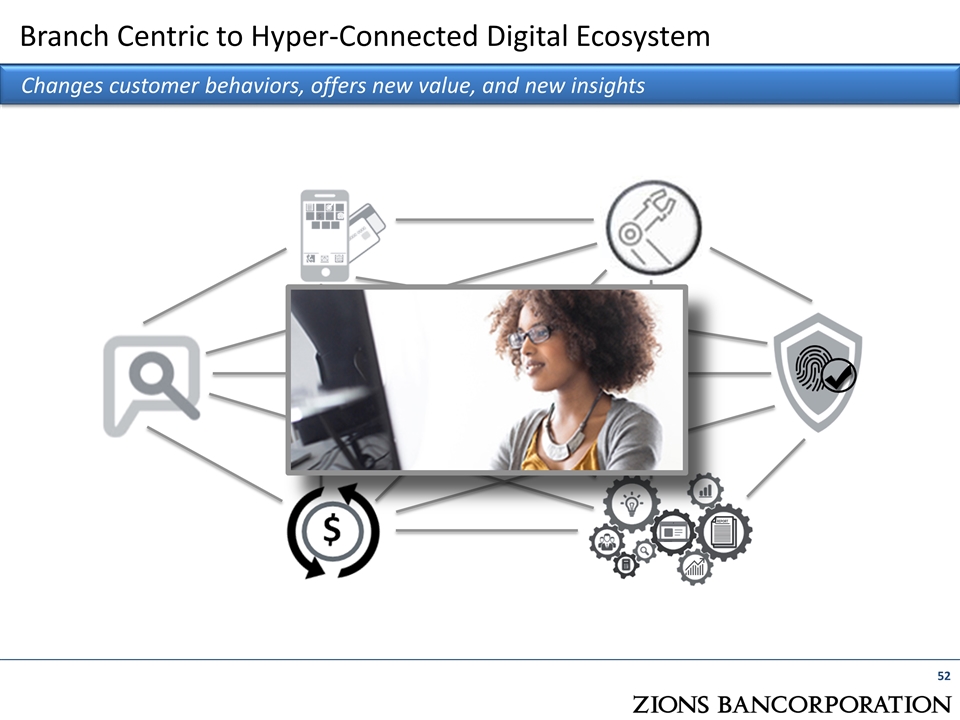
Branch Centric to Hyper-Connected Digital Ecosystem Changes customer behaviors, offers new value, and new insights
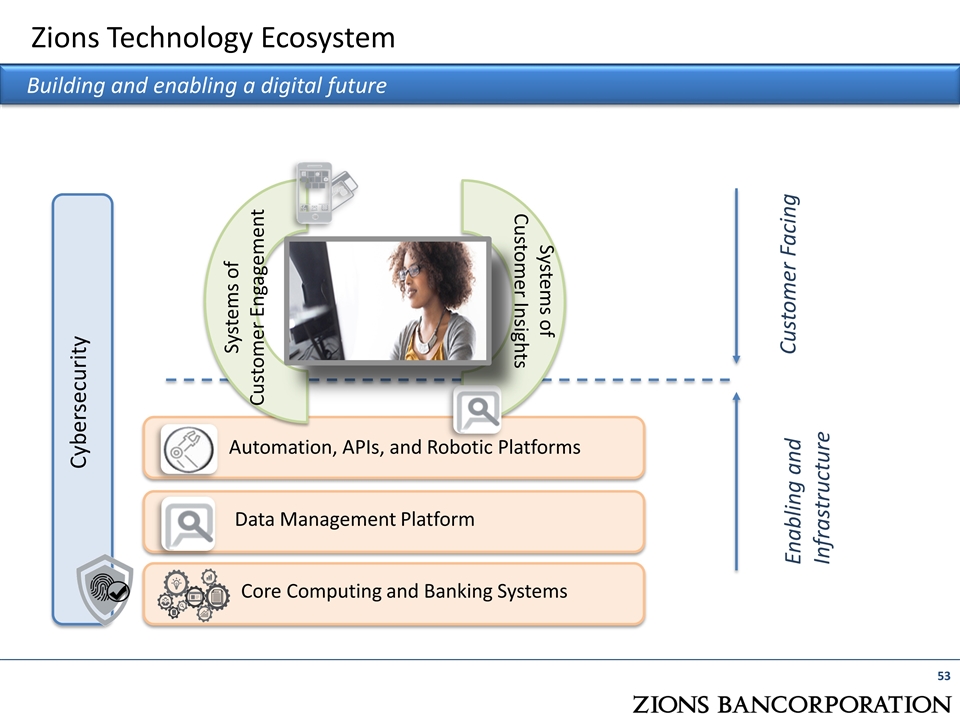
Zions Technology Ecosystem Building and enabling a digital future Core Computing Systems of Customer Insights Systems of Customer Engagement Core Computing and Banking Systems Data Management Platform Automation, APIs, and Robotic Platforms Cybersecurity Customer Facing Enabling and Infrastructure
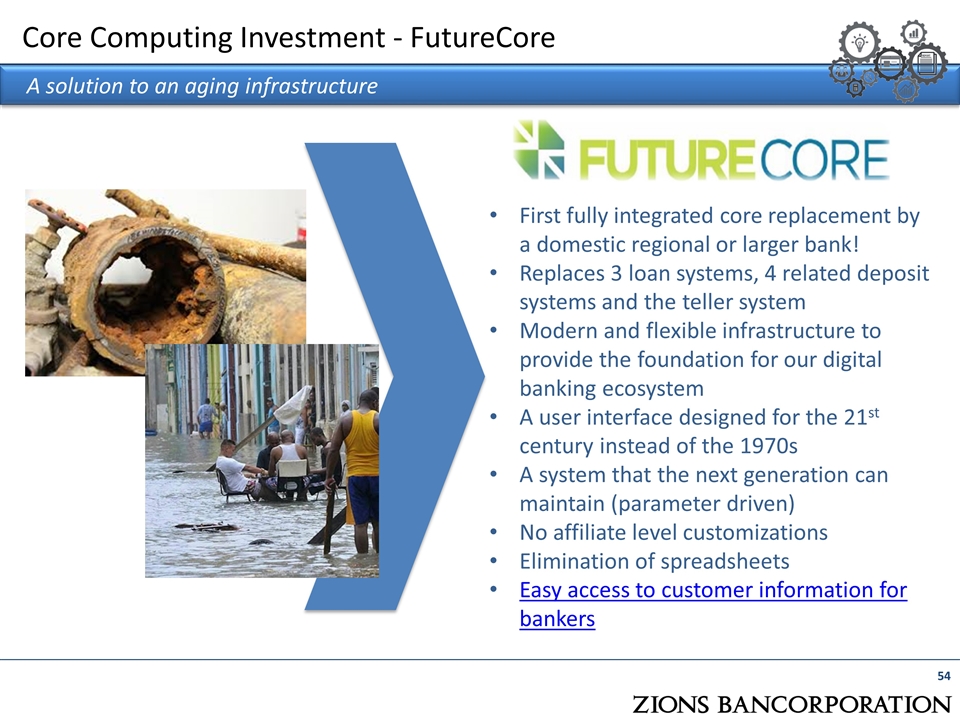
Core Computing Investment - FutureCore A solution to an aging infrastructure First fully integrated core replacement by a domestic regional or larger bank! Replaces 3 loan systems, 4 related deposit systems and the teller system Modern and flexible infrastructure to provide the foundation for our digital banking ecosystem A user interface designed for the 21st century instead of the 1970s A system that the next generation can maintain (parameter driven) No affiliate level customizations Elimination of spreadsheets Easy access to customer information for bankers
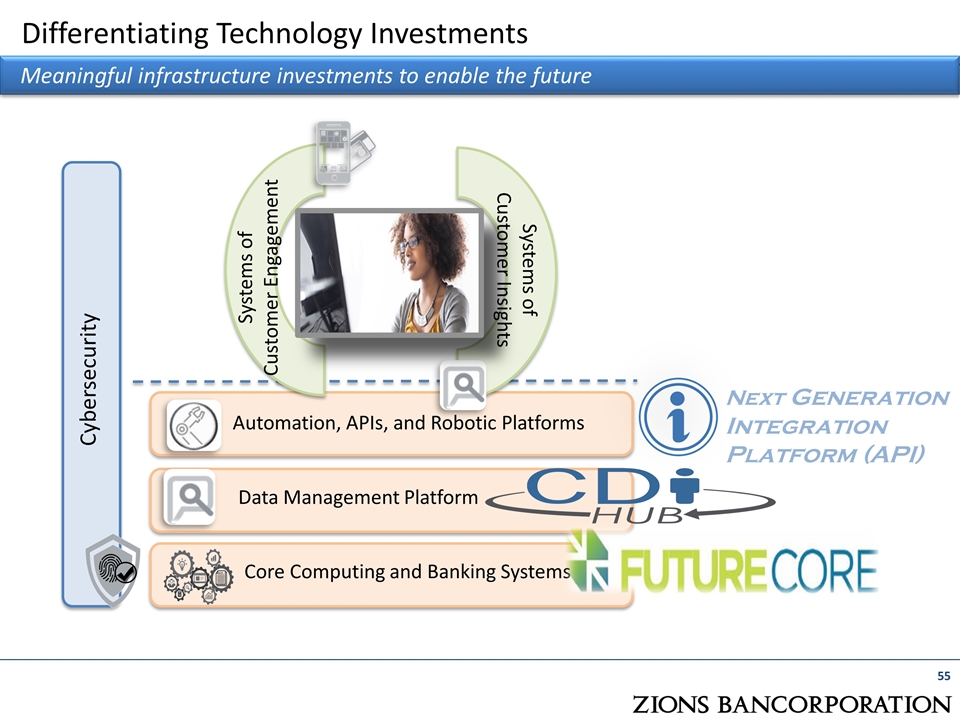
Core Computing Systems of Customer Insights Systems of Customer Engagement Core Computing and Banking Systems Data Management Platform Automation, APIs, and Robotic Platforms Cybersecurity Next Generation Integration Platform (API) Meaningful infrastructure investments to enable the future Differentiating Technology Investments
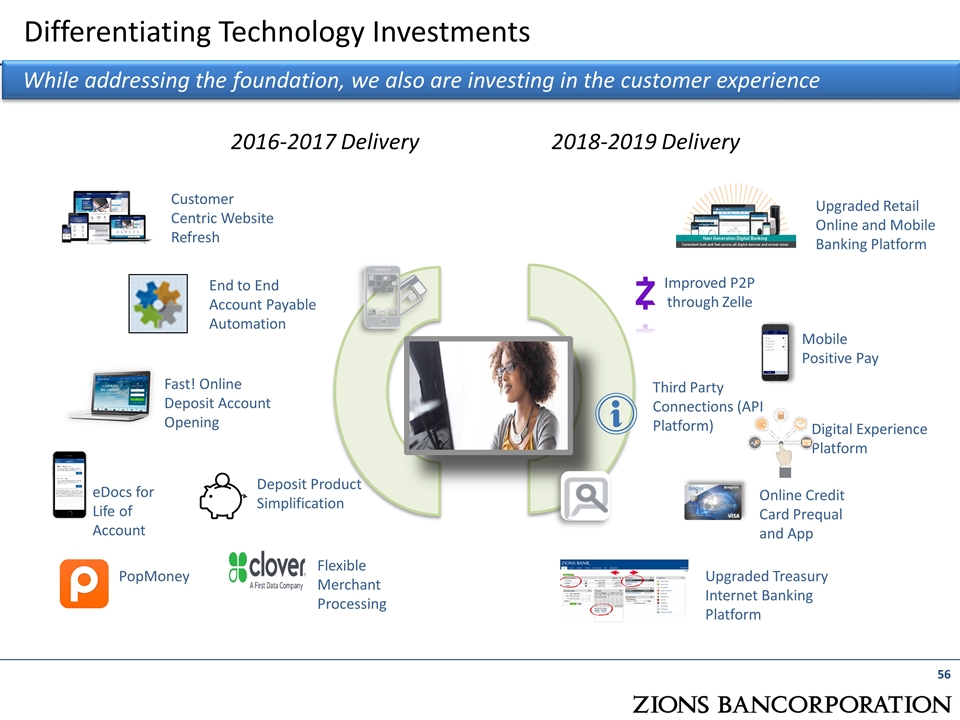
Fast! Online Deposit Account Opening Deposit Product Simplification Customer Centric Website Refresh Online Credit Card Prequal and App Mobile Positive Pay Improved P2P through Zelle Third Party Connections (API Platform) Digital Experience Platform End to End Account Payable Automation Upgraded Treasury Internet Banking Platform Upgraded Retail Online and Mobile Banking Platform Flexible Merchant Processing eDocs for Life of Account PopMoney 2016-2017 Delivery 2018-2019 Delivery While addressing the foundation, we also are investing in the customer experience Differentiating Technology Investments
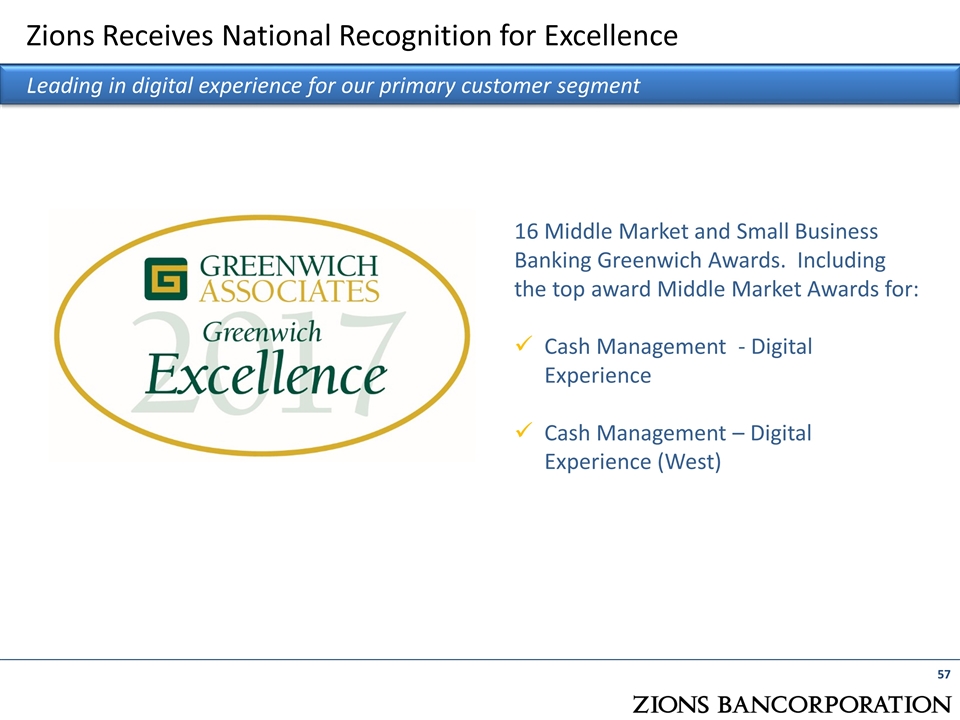
Zions Receives National Recognition for Excellence Leading in digital experience for our primary customer segment 16 Middle Market and Small Business Banking Greenwich Awards. Including the top award Middle Market Awards for: Cash Management - Digital Experience Cash Management – Digital Experience (West)
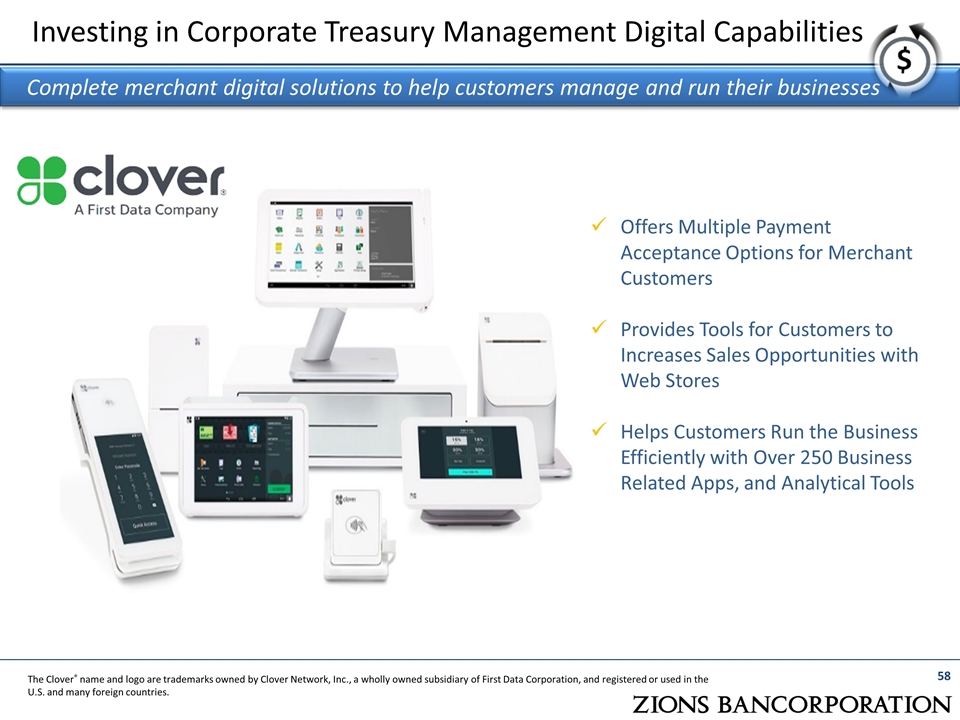
Investing in Corporate Treasury Management Digital Capabilities Complete merchant digital solutions to help customers manage and run their businesses Offers Multiple Payment Acceptance Options for Merchant Customers Provides Tools for Customers to Increases Sales Opportunities with Web Stores Helps Customers Run the Business Efficiently with Over 250 Business Related Apps, and Analytical Tools The Clover® name and logo are trademarks owned by Clover Network, Inc., a wholly owned subsidiary of First Data Corporation, and registered or used in the U.S. and many foreign countries.
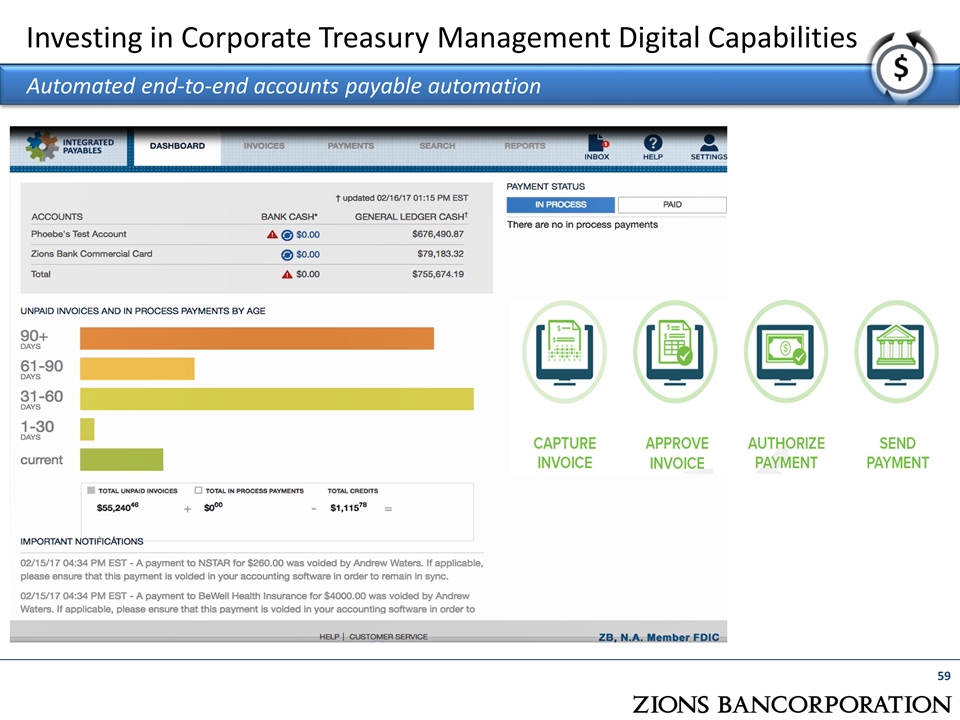
Investing in Corporate Treasury Management Digital Capabilities Automated end-to-end accounts payable automation
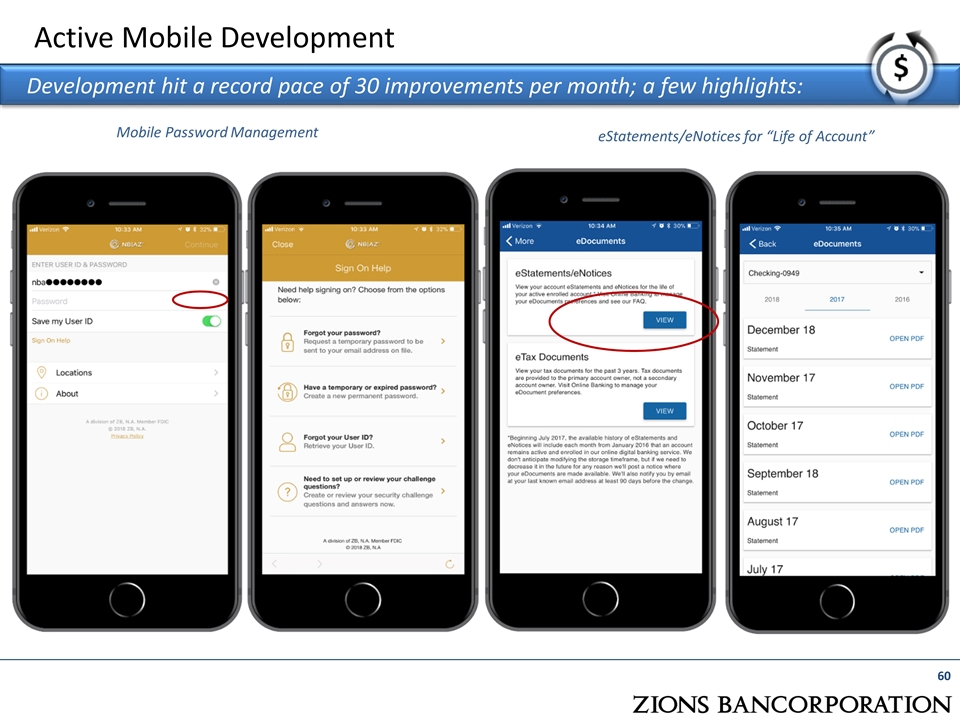
Active Mobile Development Development hit a record pace of 30 improvements per month; a few highlights: Mobile Password Management eStatements/eNotices for “Life of Account”
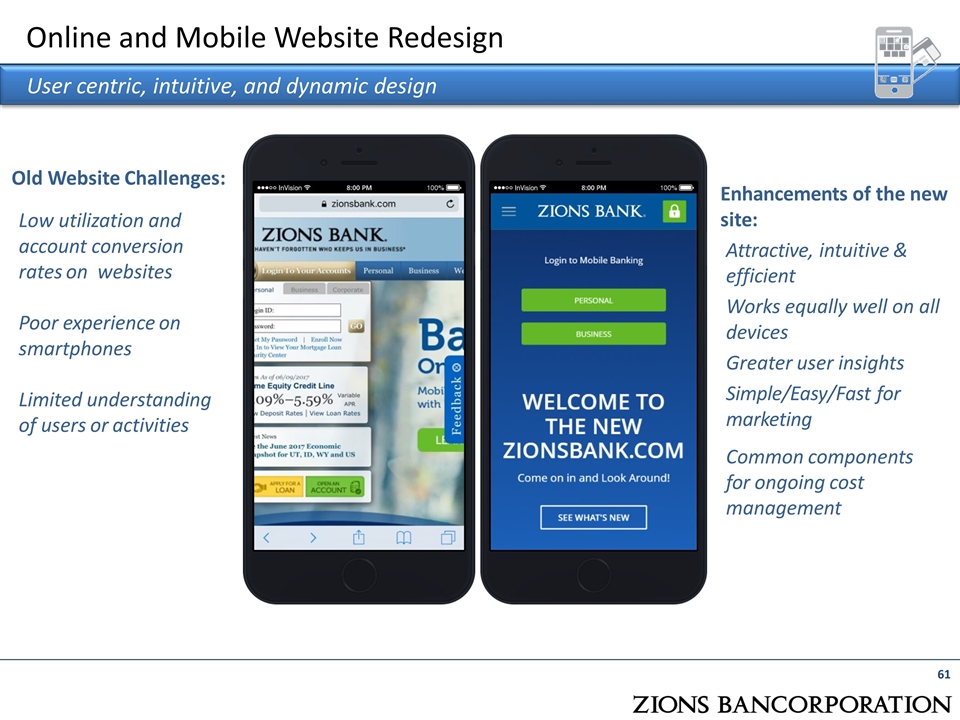
Enhancements of the new site: Attractive, intuitive & efficient Works equally well on all devices Greater user insights Simple/Easy/Fast for marketing Common components for ongoing cost management Old Website Challenges: Low utilization and account conversion rates on websites Poor experience on smartphones Limited understanding of users or activities Online and Mobile Website Redesign User centric, intuitive, and dynamic design
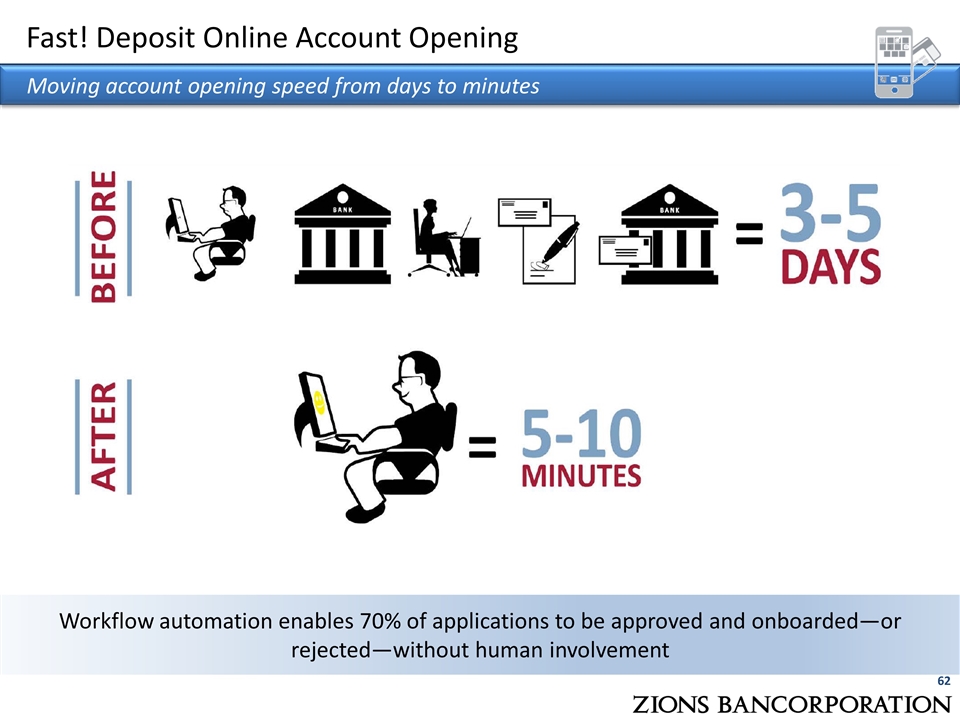
Fast! Deposit Online Account Opening Workflow automation enables 70% of applications to be approved and onboarded—or rejected—without human involvement Moving account opening speed from days to minutes
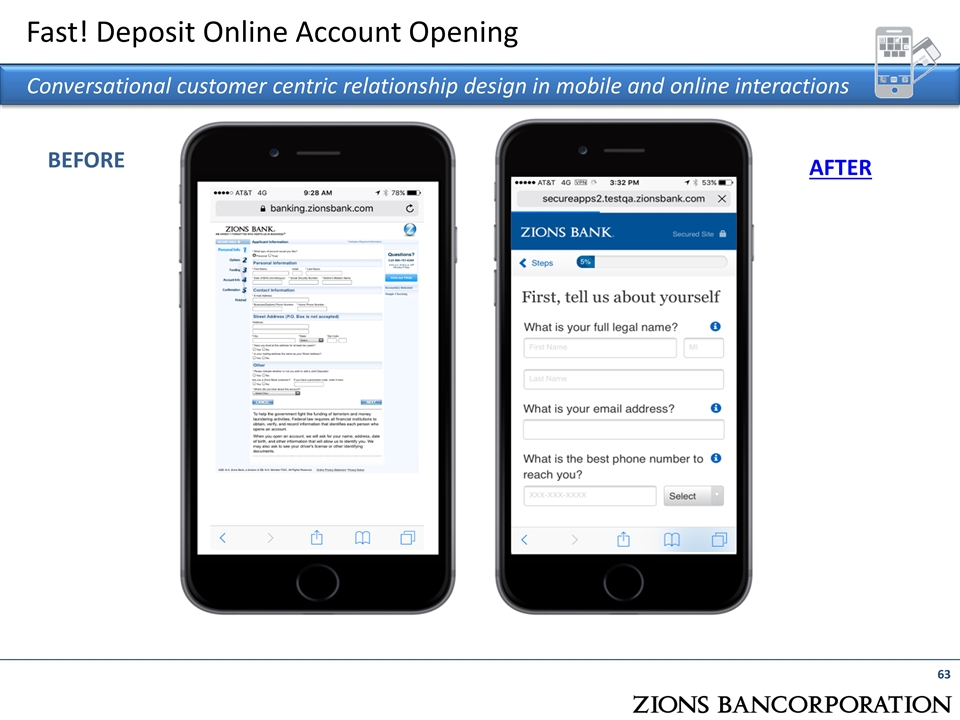
BEFORE AFTER Fast! Deposit Online Account Opening Conversational customer centric relationship design in mobile and online interactions
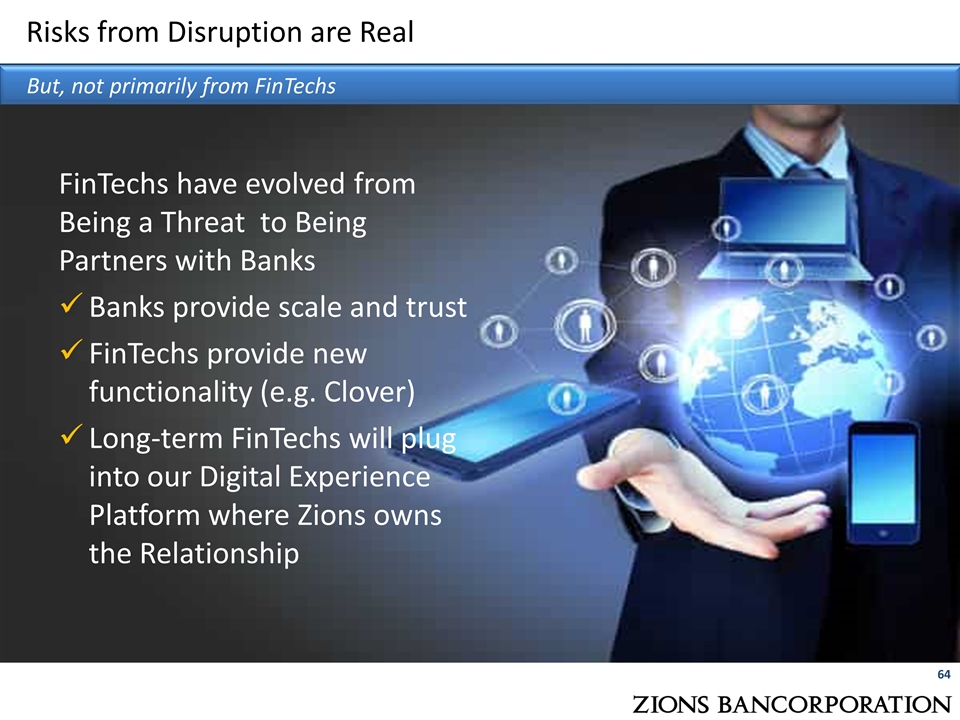
Risks from Disruption are Real But, not primarily from FinTechs FinTechs have evolved from Being a Threat to Being Partners with Banks Banks provide scale and trust FinTechs provide new functionality (e.g. Clover) Long-term FinTechs will plug into our Digital Experience Platform where Zions owns the Relationship
Mega banks, investing heavily in digital, are now beating regional and small banks in consumer satisfaction, but lag in Middle Market. Platform companies long term (Amazon, Google, Facebook) will play and are playing a larger role in the financial system ecosystem. Risk from Disruption are Real Our risks are from major players with scale Zions’ risk, considering rapidly changing customer digital behaviors, is if we move too slow to execute digital initiatives to maintain our market position, relationships, and low cost deposits. The primary threats are from mega banks and platform companies.
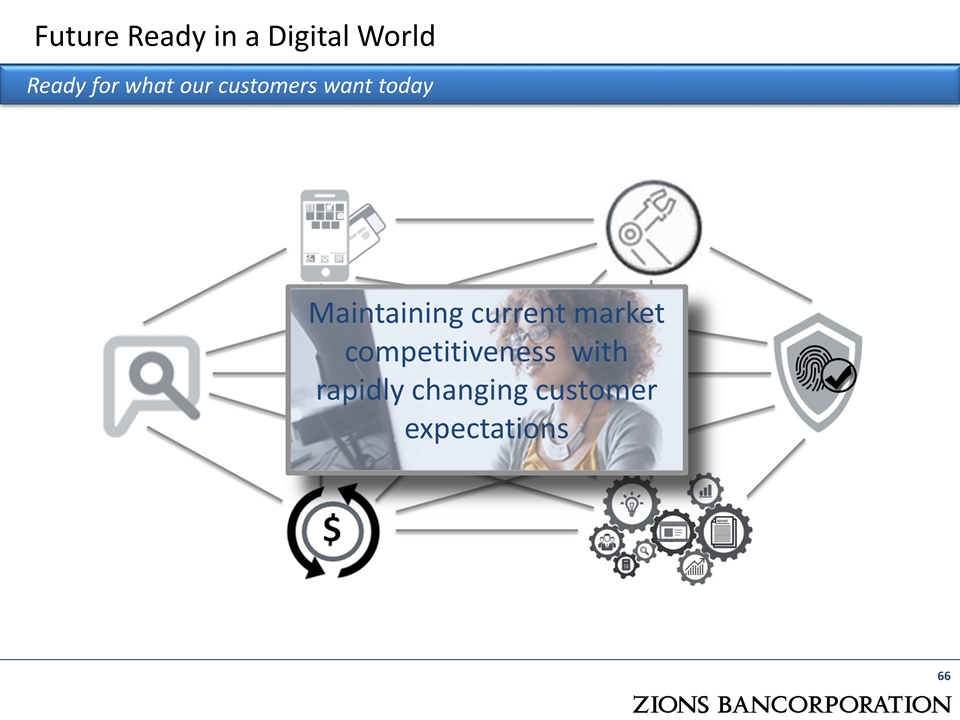
Future Ready in a Digital World Ready for what our customers want today Maintaining current market competitiveness with rapidly changing customer expectations

Future Ready in a Digital World Well ahead of peers in addressing aging legacy core systems Leading the way with long term and differentiated investments in replacing our core Servicing systems
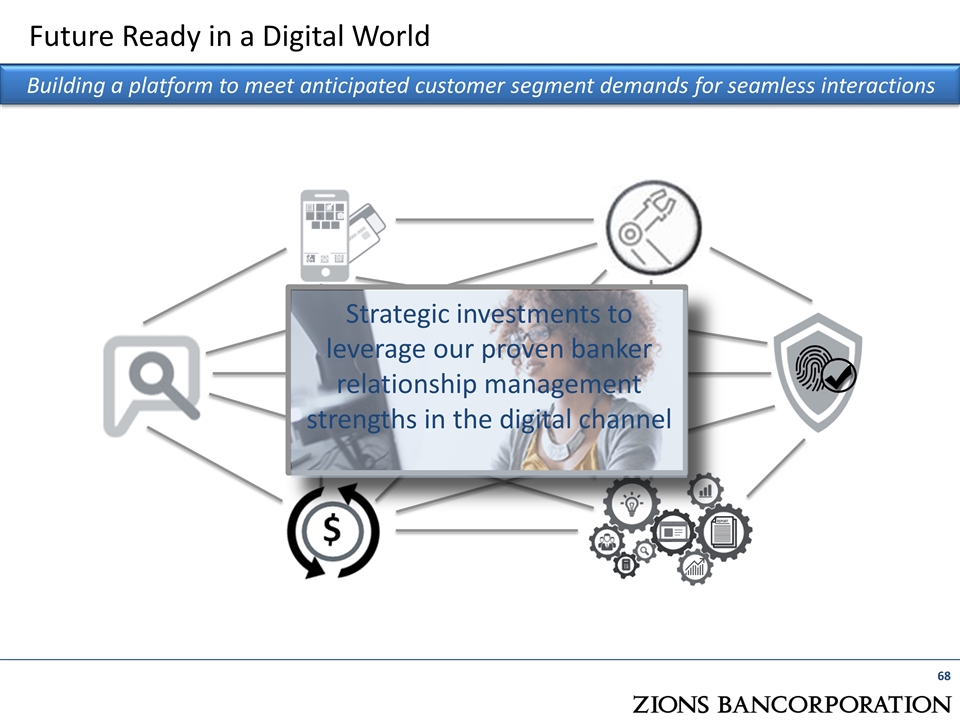
Future Ready in a Digital World Building a platform to meet anticipated customer segment demands for seamless interactions Strategic investments to leverage our proven banker relationship management strengths in the digital channel
Welcome Risk Management Technology and Innovation – Future Ready Simplification Financial Performance and Goals Roundtable Sessions Access to Lending Managers CRE Large C&I Small C&I Access to Affiliate CEOs Texas, Colorado, Utah California, Arizona, Nevada, Washington Wrap-up 2018 Investor Conference Agenda Opportunities in Offense
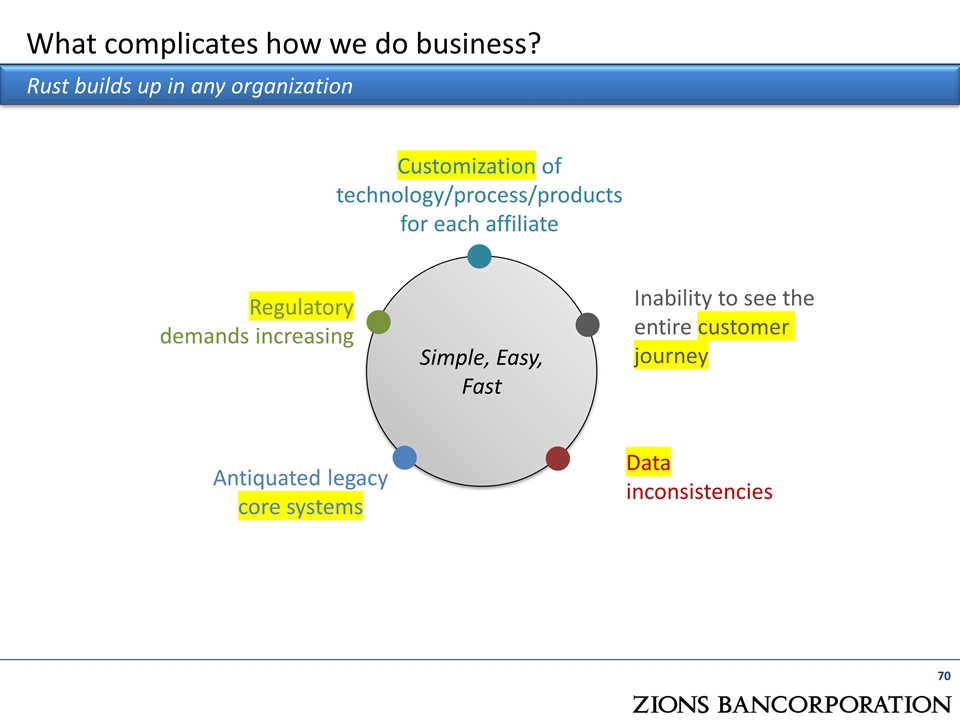
What complicates how we do business? Simple, Easy, Fast Rust builds up in any organization Antiquated legacy core systems Regulatory demands increasing Inability to see the entire customer journey Customization of technology/process/products for each affiliate Data inconsistencies
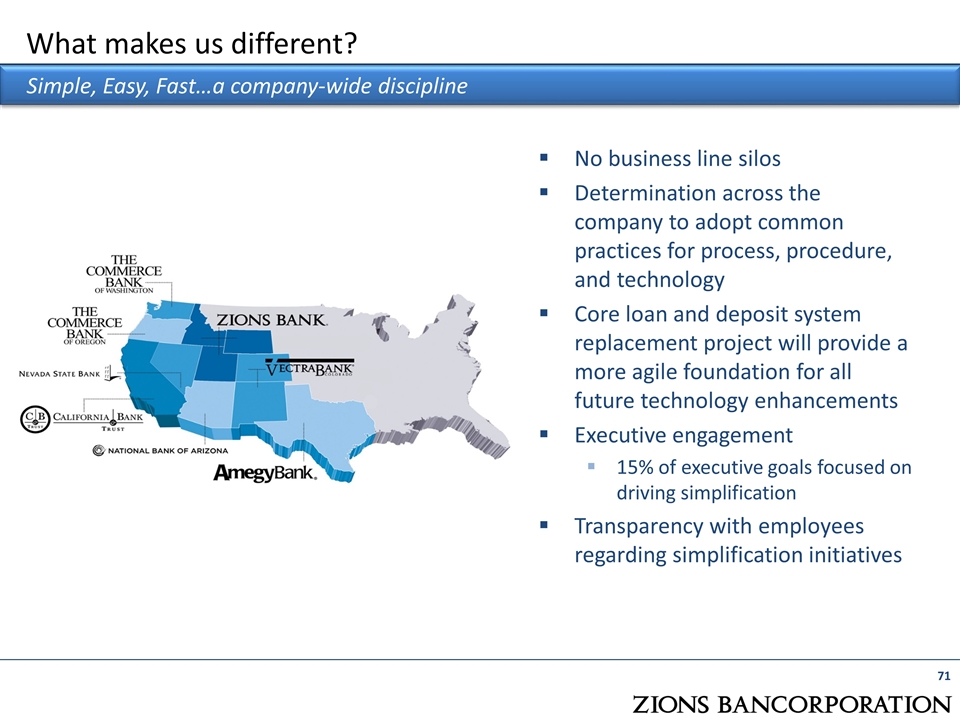
No business line silos Determination across the company to adopt common practices for process, procedure, and technology Core loan and deposit system replacement project will provide a more agile foundation for all future technology enhancements Executive engagement 15% of executive goals focused on driving simplification Transparency with employees regarding simplification initiatives What makes us different? Simple, Easy, Fast…a company-wide discipline
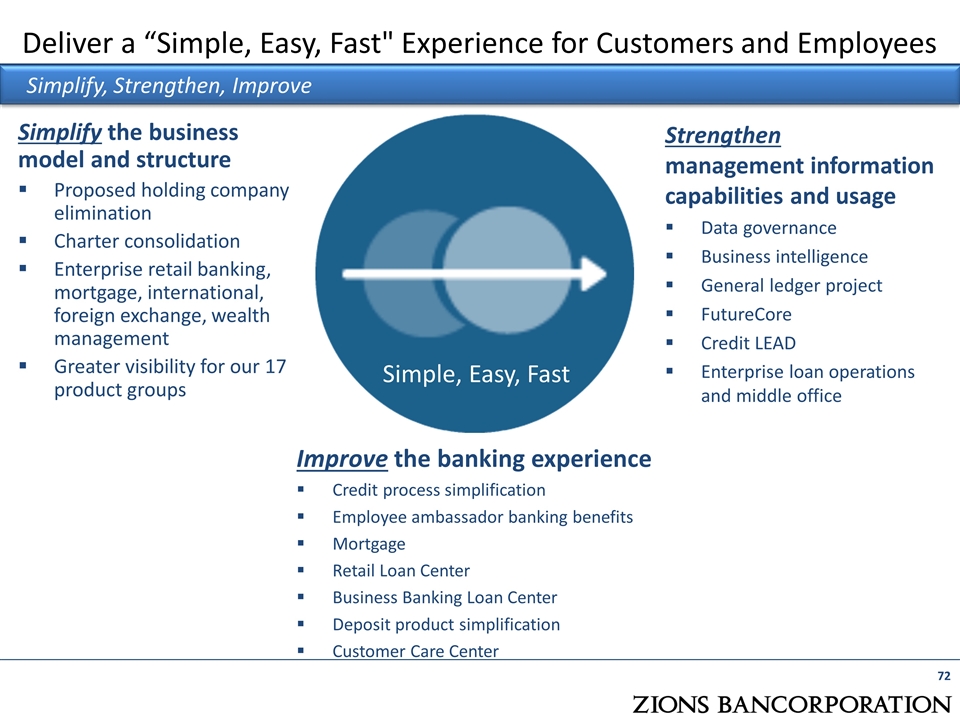
Simplify the business model and structure Proposed holding company elimination Charter consolidation Enterprise retail banking, mortgage, international, foreign exchange, wealth management Greater visibility for our 17 product groups Deliver a “Simple, Easy, Fast" Experience for Customers and Employees Strengthen management information capabilities and usage Data governance Business intelligence General ledger project FutureCore Credit LEAD Enterprise loan operations and middle office Improve the banking experience Credit process simplification Employee ambassador banking benefits Mortgage Retail Loan Center Business Banking Loan Center Deposit product simplification Customer Care Center Simple, Easy, Fast Simplify, Strengthen, Improve
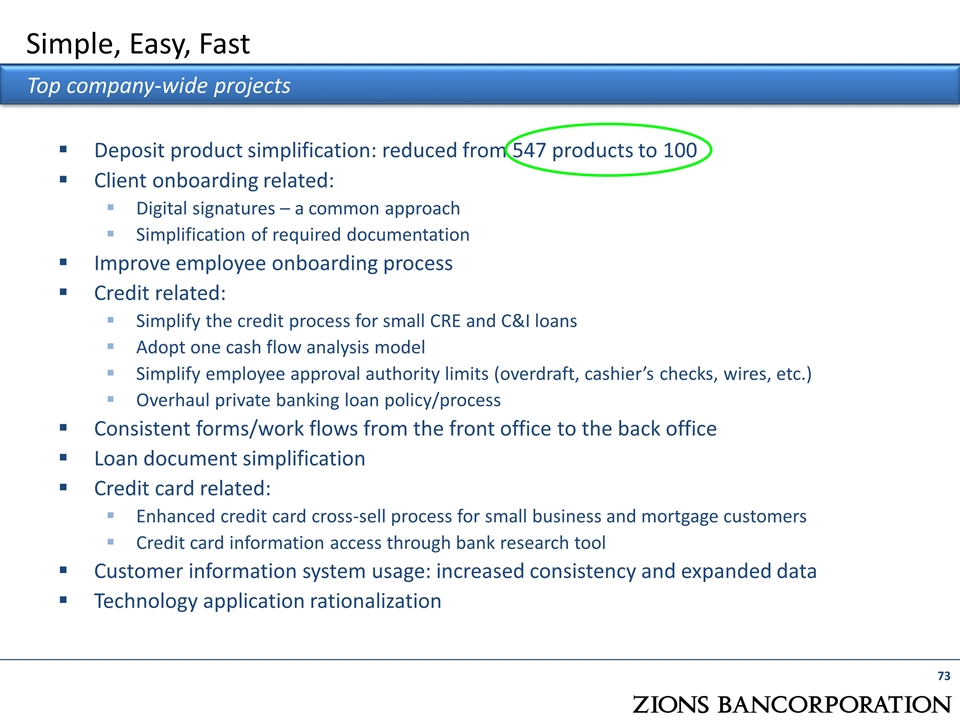
Deposit product simplification: reduced from 547 products to 100 Client onboarding related: Digital signatures – a common approach Simplification of required documentation Improve employee onboarding process Credit related: Simplify the credit process for small CRE and C&I loans Adopt one cash flow analysis model Simplify employee approval authority limits (overdraft, cashier’s checks, wires, etc.) Overhaul private banking loan policy/process Consistent forms/work flows from the front office to the back office Loan document simplification Credit card related: Enhanced credit card cross-sell process for small business and mortgage customers Credit card information access through bank research tool Customer information system usage: increased consistency and expanded data Technology application rationalization Simple, Easy, Fast Top company-wide projects
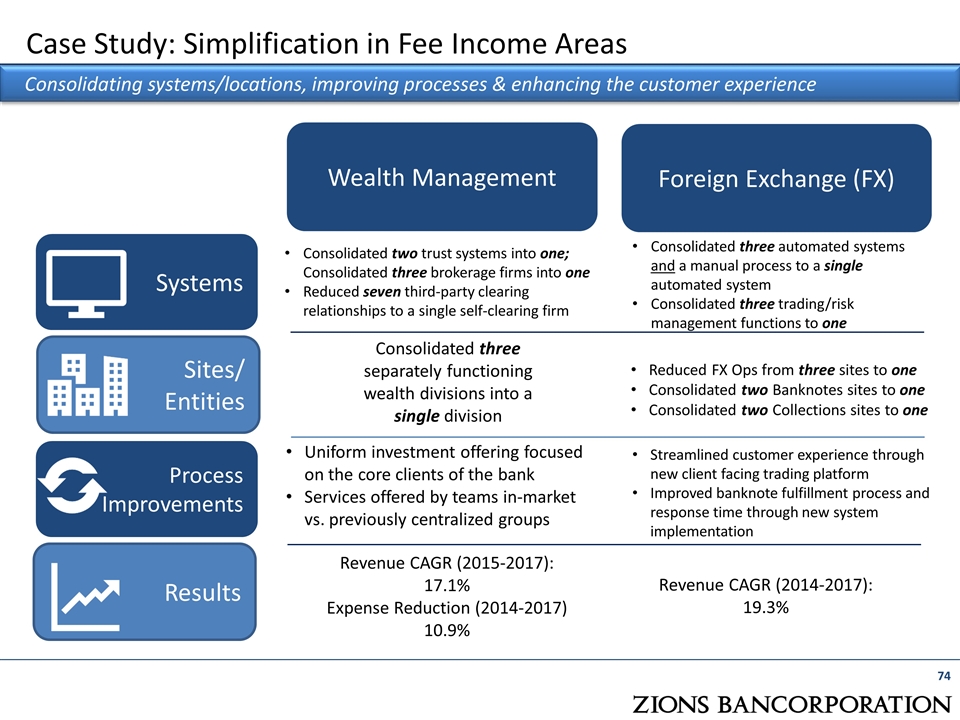
Case Study: Simplification in Fee Income Areas Consolidating systems/locations, improving processes & enhancing the customer experience Sites/ Entities Process Improvements Systems Wealth Management Foreign Exchange (FX) Consolidated two trust systems into one; Consolidated three brokerage firms into one Reduced seven third-party clearing relationships to a single self-clearing firm Consolidated three automated systems and a manual process to a single automated system Consolidated three trading/risk management functions to one Consolidated three separately functioning wealth divisions into a single division Reduced FX Ops from three sites to one Consolidated two Banknotes sites to one Consolidated two Collections sites to one Uniform investment offering focused on the core clients of the bank Services offered by teams in-market vs. previously centralized groups Streamlined customer experience through new client facing trading platform Improved banknote fulfillment process and response time through new system implementation Results Revenue CAGR (2015-2017): 17.1% Expense Reduction (2014-2017) 10.9% Revenue CAGR (2014-2017): 19.3%
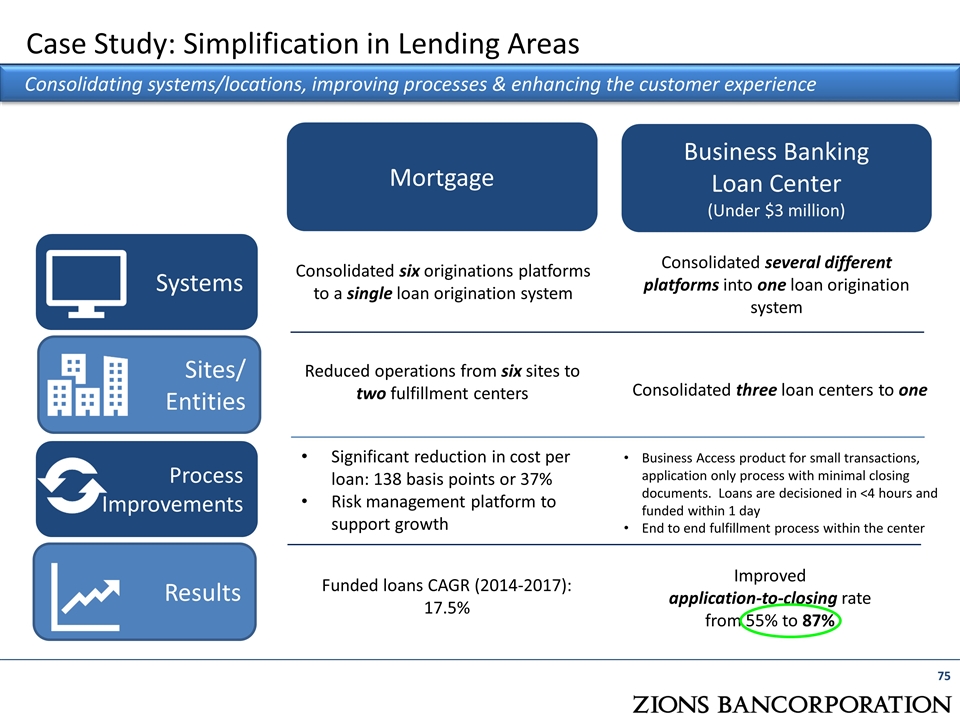
Case Study: Simplification in Lending Areas Consolidating systems/locations, improving processes & enhancing the customer experience Sites/ Entities Process Improvements Systems Mortgage Business Banking Loan Center (Under $3 million) Consolidated six originations platforms to a single loan origination system Consolidated several different platforms into one loan origination system Reduced operations from six sites to two fulfillment centers Consolidated three loan centers to one Significant reduction in cost per loan: 138 basis points or 37% Risk management platform to support growth Business Access product for small transactions, application only process with minimal closing documents. Loans are decisioned in <4 hours and funded within 1 day End to end fulfillment process within the center Results Funded loans CAGR (2014-2017): 17.5% Improved application-to-closing rate from 55% to 87%
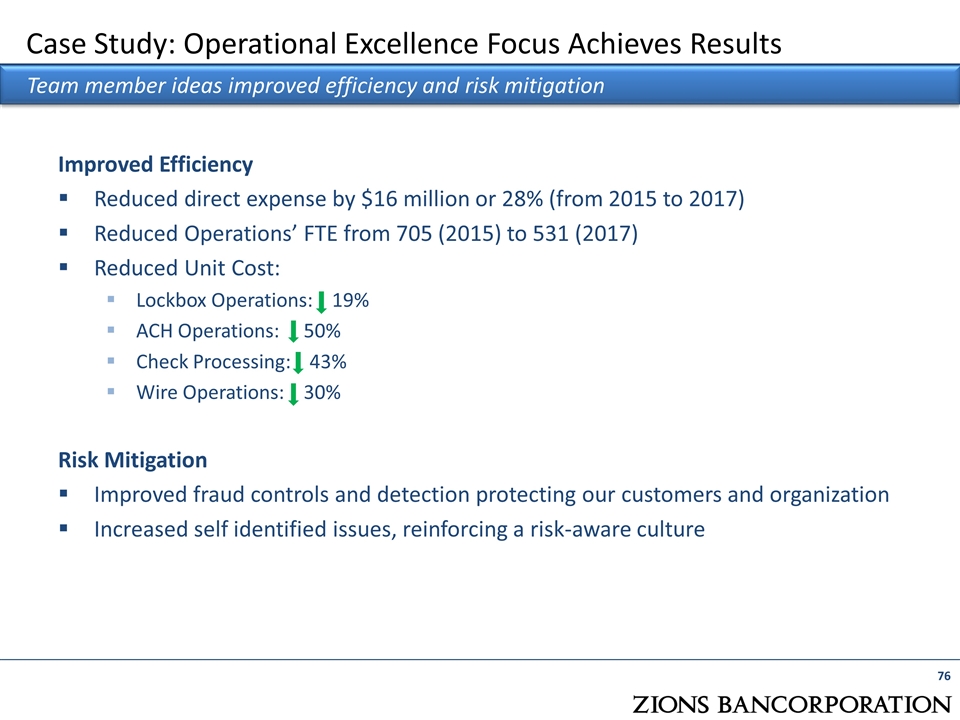
Improved Efficiency Reduced direct expense by $16 million or 28% (from 2015 to 2017) Reduced Operations’ FTE from 705 (2015) to 531 (2017) Reduced Unit Cost: Lockbox Operations: 19% ACH Operations: 50% Check Processing: 43% Wire Operations: 30% Risk Mitigation Improved fraud controls and detection protecting our customers and organization Increased self identified issues, reinforcing a risk-aware culture Case Study: Operational Excellence Focus Achieves Results Team member ideas improved efficiency and risk mitigation
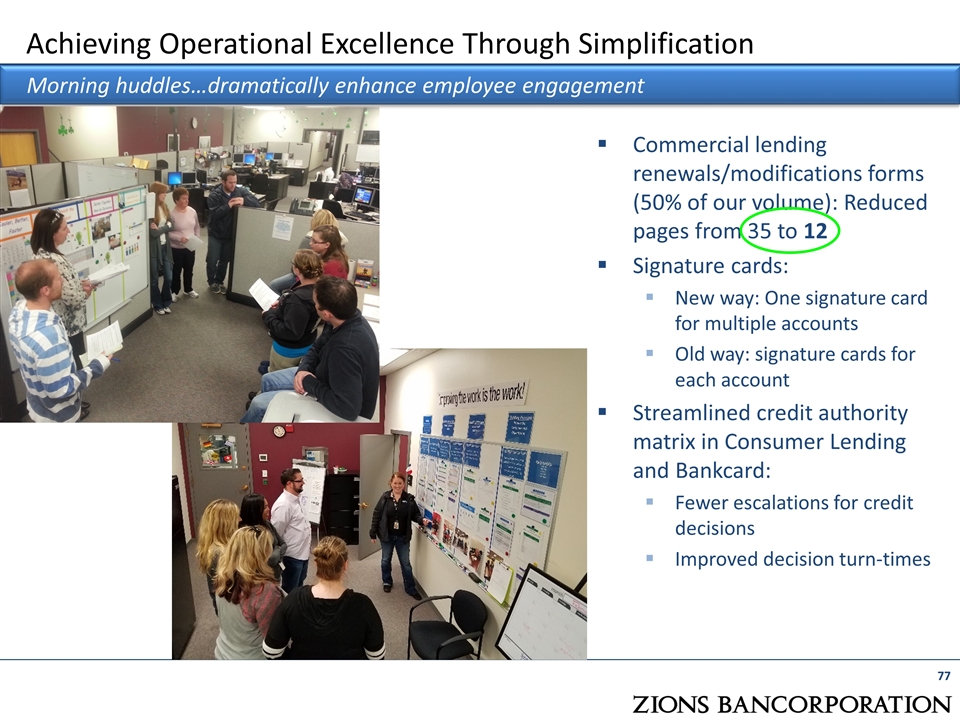
Commercial lending renewals/modifications forms (50% of our volume): Reduced pages from 35 to 12 Signature cards: New way: One signature card for multiple accounts Old way: signature cards for each account Streamlined credit authority matrix in Consumer Lending and Bankcard: Fewer escalations for credit decisions Improved decision turn-times Achieving Operational Excellence Through Simplification Morning huddles…dramatically enhance employee engagement
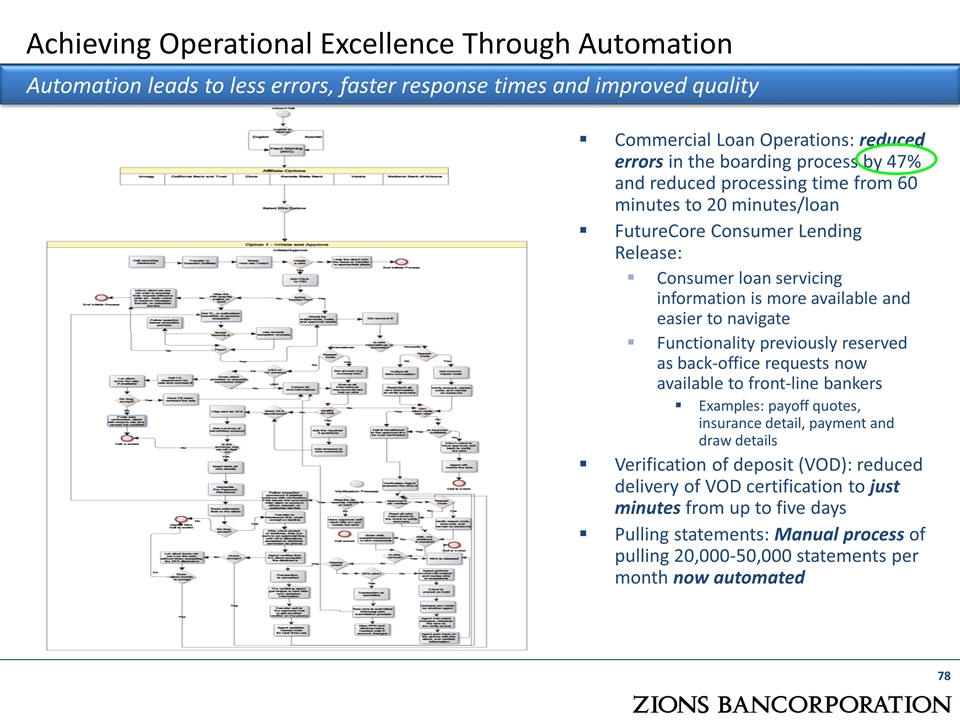
Commercial Loan Operations: reduced errors in the boarding process by 47% and reduced processing time from 60 minutes to 20 minutes/loan FutureCore Consumer Lending Release: Consumer loan servicing information is more available and easier to navigate Functionality previously reserved as back-office requests now available to front-line bankers Examples: payoff quotes, insurance detail, payment and draw details Verification of deposit (VOD): reduced delivery of VOD certification to just minutes from up to five days Pulling statements: Manual process of pulling 20,000-50,000 statements per month now automated Achieving Operational Excellence Through Automation Automation leads to less errors, faster response times and improved quality
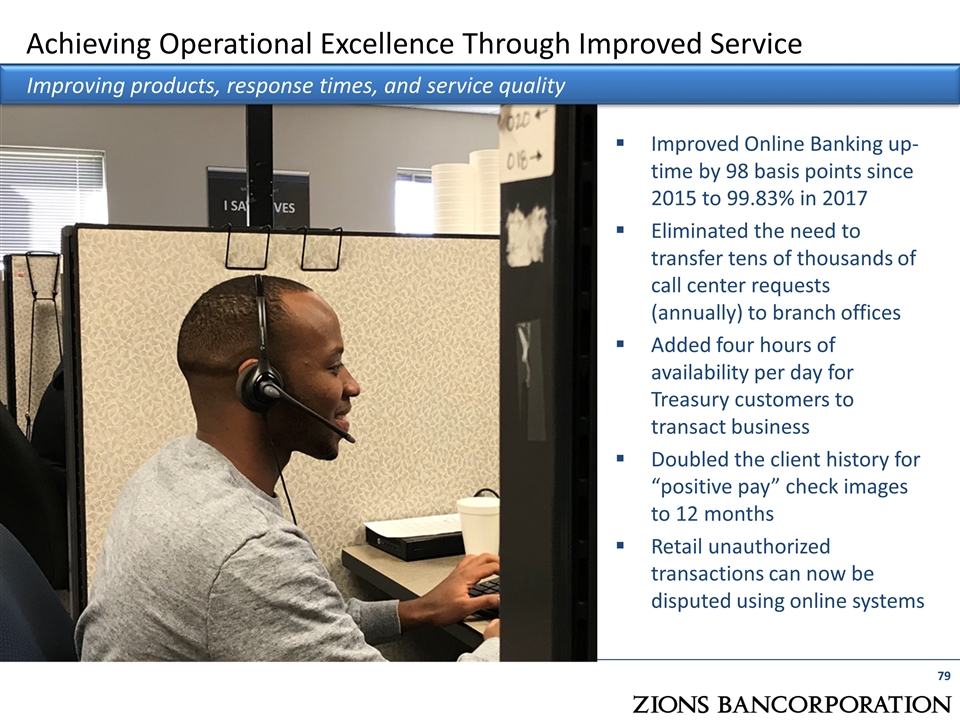
Improved Online Banking up-time by 98 basis points since 2015 to 99.83% in 2017 Eliminated the need to transfer tens of thousands of call center requests (annually) to branch offices Added four hours of availability per day for Treasury customers to transact business Doubled the client history for “positive pay” check images to 12 months Retail unauthorized transactions can now be disputed using online systems Achieving Operational Excellence Through Improved Service Improving products, response times, and service quality
Welcome Risk Management Technology and Innovation – Future Ready Simplification Financial Performance and Goals Roundtable Sessions Access to Lending Managers CRE Large C&I Small C&I Access to Affiliate CEOs Texas, Colorado, Utah California, Arizona, Nevada, Washington Wrap-up 2018 Investor Conference Agenda Opportunities in Offense
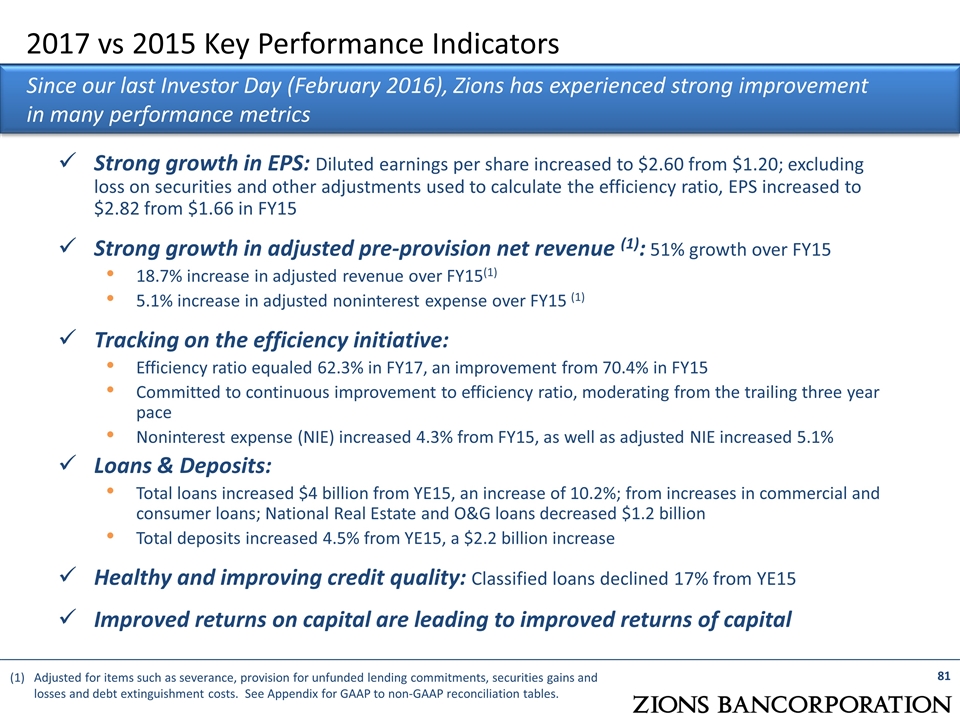
Strong growth in EPS: Diluted earnings per share increased to $2.60 from $1.20; excluding loss on securities and other adjustments used to calculate the efficiency ratio, EPS increased to $2.82 from $1.66 in FY15 Strong growth in adjusted pre-provision net revenue (1): 51% growth over FY15 18.7% increase in adjusted revenue over FY15(1) 5.1% increase in adjusted noninterest expense over FY15 (1) Tracking on the efficiency initiative: Efficiency ratio equaled 62.3% in FY17, an improvement from 70.4% in FY15 Committed to continuous improvement to efficiency ratio, moderating from the trailing three year pace Noninterest expense (NIE) increased 4.3% from FY15, as well as adjusted NIE increased 5.1% Loans & Deposits: Total loans increased $4 billion from YE15, an increase of 10.2%; from increases in commercial and consumer loans; National Real Estate and O&G loans decreased $1.2 billion Total deposits increased 4.5% from YE15, a $2.2 billion increase Healthy and improving credit quality: Classified loans declined 17% from YE15 Improved returns on capital are leading to improved returns of capital 2017 vs 2015 Key Performance Indicators Since our last Investor Day (February 2016), Zions has experienced strong improvement in many performance metrics Adjusted for items such as severance, provision for unfunded lending commitments, securities gains and losses and debt extinguishment costs. See Appendix for GAAP to non-GAAP reconciliation tables.
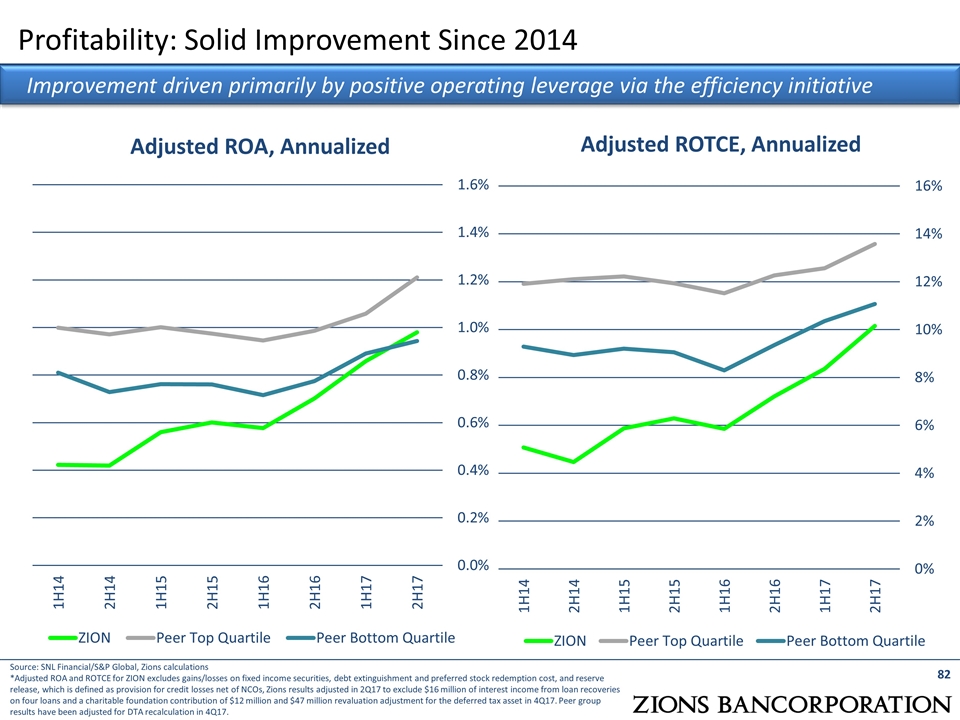
Profitability: Solid Improvement Since 2014 Source: SNL Financial/S&P Global, Zions calculations *Adjusted ROA and ROTCE for ZION excludes gains/losses on fixed income securities, debt extinguishment and preferred stock redemption cost, and reserve release, which is defined as provision for credit losses net of NCOs, Zions results adjusted in 2Q17 to exclude $16 million of interest income from loan recoveries on four loans and a charitable foundation contribution of $12 million and $47 million revaluation adjustment for the deferred tax asset in 4Q17. Peer group results have been adjusted for DTA recalculation in 4Q17. Improvement driven primarily by positive operating leverage via the efficiency initiative
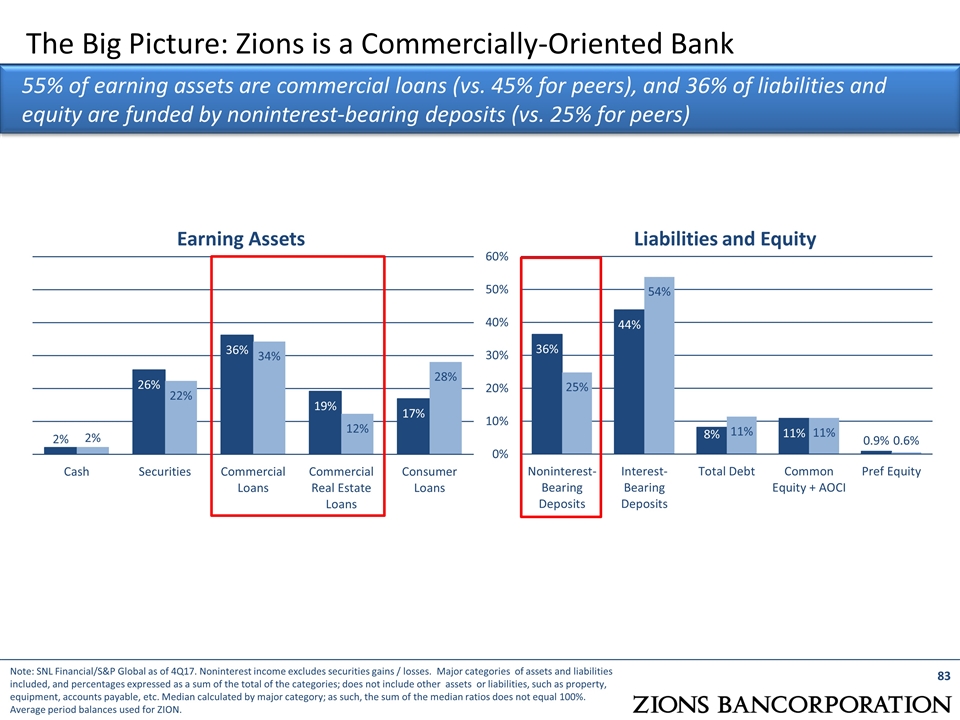
The Big Picture: Zions is a Commercially-Oriented Bank Earning Assets Liabilities and Equity 55% of earning assets are commercial loans (vs. 45% for peers), and 36% of liabilities and equity are funded by noninterest-bearing deposits (vs. 25% for peers) Note: SNL Financial/S&P Global as of 4Q17. Noninterest income excludes securities gains / losses. Major categories of assets and liabilities included, and percentages expressed as a sum of the total of the categories; does not include other assets or liabilities, such as property, equipment, accounts payable, etc. Median calculated by major category; as such, the sum of the median ratios does not equal 100%. Average period balances used for ZION.
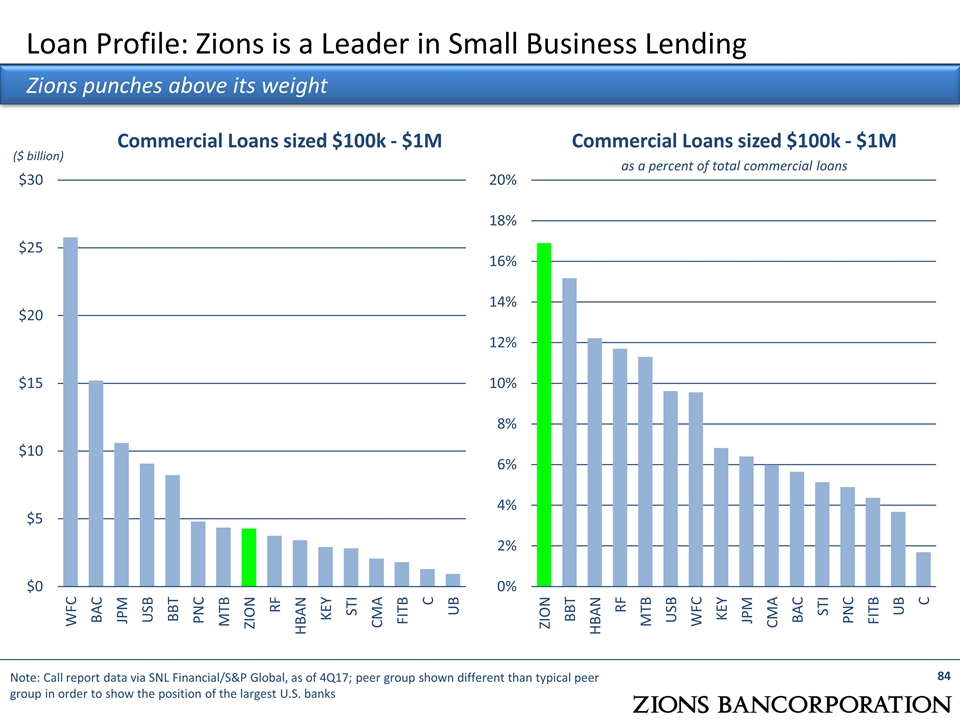
Loan Profile: Zions is a Leader in Small Business Lending Commercial Loans sized $100k - $1M Commercial Loans sized $100k - $1M as a percent of total commercial loans Note: Call report data via SNL Financial/S&P Global, as of 4Q17; peer group shown different than typical peer group in order to show the position of the largest U.S. banks Zions punches above its weight ($ billion)
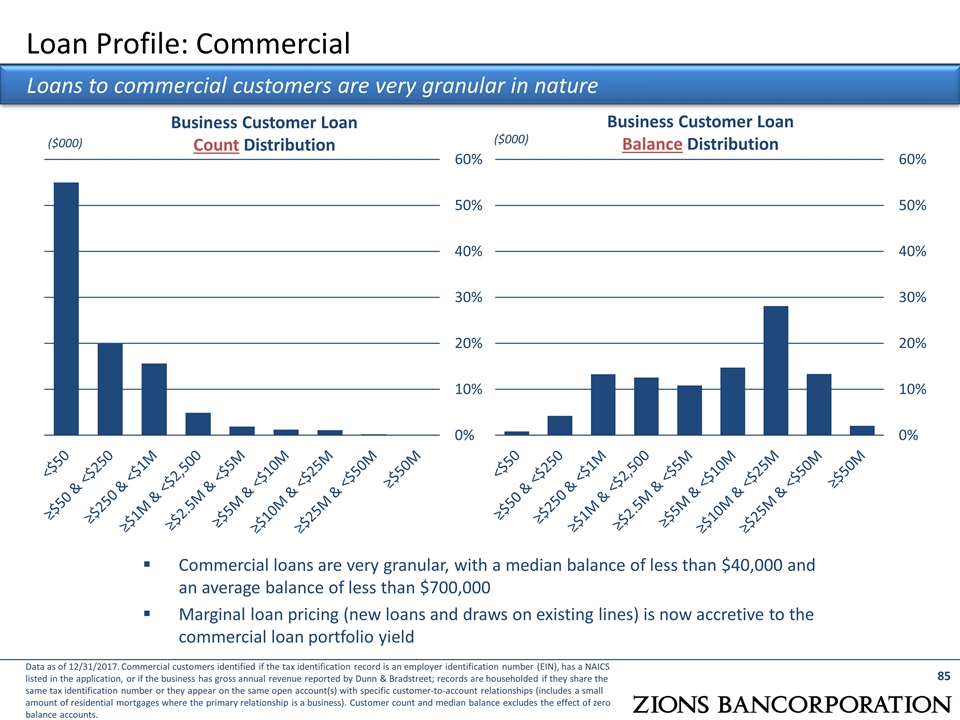
Loan Profile: Commercial Loans to commercial customers are very granular in nature Commercial loans are very granular, with a median balance of less than $40,000 and an average balance of less than $700,000 Marginal loan pricing (new loans and draws on existing lines) is now accretive to the commercial loan portfolio yield Business Customer Loan Balance Distribution Data as of 12/31/2017. Commercial customers identified if the tax identification record is an employer identification number (EIN), has a NAICS listed in the application, or if the business has gross annual revenue reported by Dunn & Bradstreet; records are householded if they share the same tax identification number or they appear on the same open account(s) with specific customer-to-account relationships (includes a small amount of residential mortgages where the primary relationship is a business). Customer count and median balance excludes the effect of zero balance accounts. Business Customer Loan Count Distribution ($000) ($000)
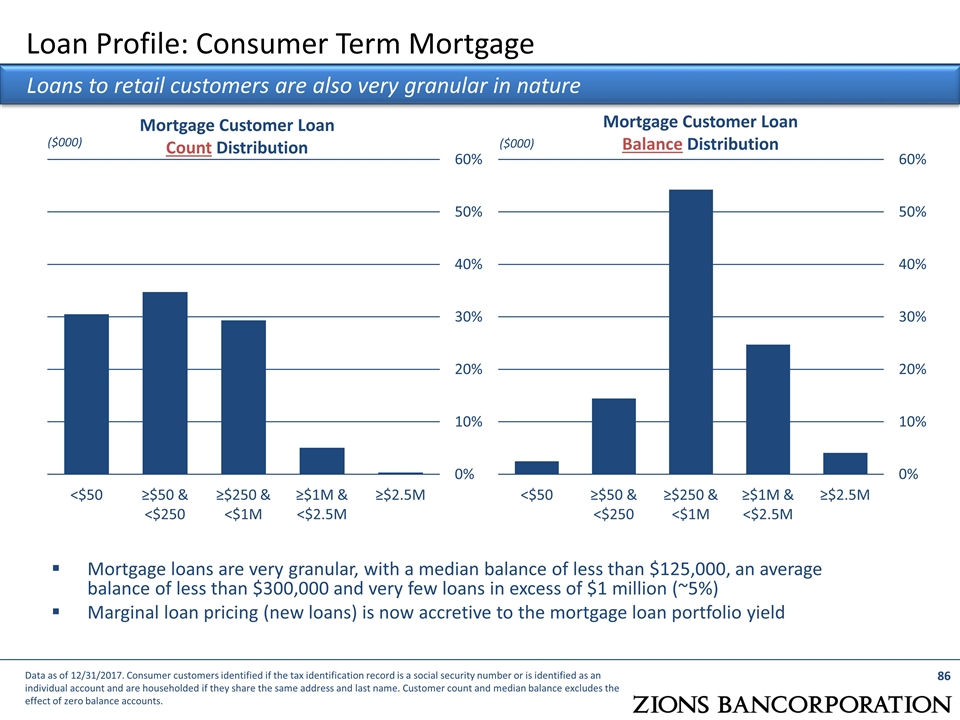
Loan Profile: Consumer Term Mortgage Loans to retail customers are also very granular in nature Mortgage Customer Loan Count Distribution Mortgage Customer Loan Balance Distribution Mortgage loans are very granular, with a median balance of less than $125,000, an average balance of less than $300,000 and very few loans in excess of $1 million (~5%) Marginal loan pricing (new loans) is now accretive to the mortgage loan portfolio yield Data as of 12/31/2017. Consumer customers identified if the tax identification record is a social security number or is identified as an individual account and are householded if they share the same address and last name. Customer count and median balance excludes the effect of zero balance accounts. ($000) ($000)
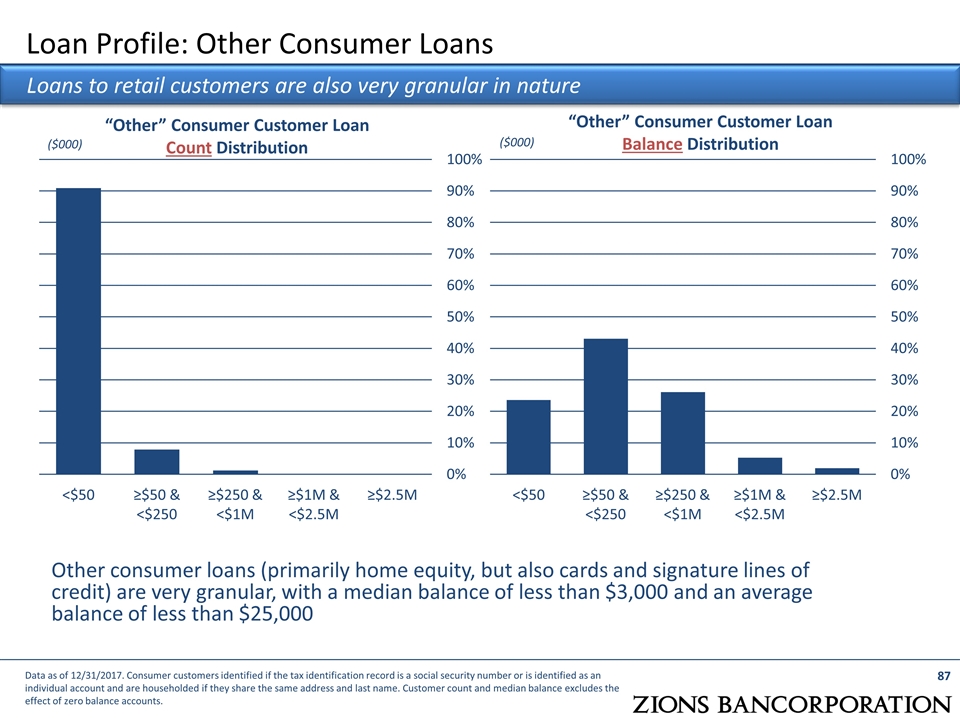
Loan Profile: Other Consumer Loans Loans to retail customers are also very granular in nature “Other” Consumer Customer Loan Count Distribution “Other” Consumer Customer Loan Balance Distribution Other consumer loans (primarily home equity, but also cards and signature lines of credit) are very granular, with a median balance of less than $3,000 and an average balance of less than $25,000 Data as of 12/31/2017. Consumer customers identified if the tax identification record is a social security number or is identified as an individual account and are householded if they share the same address and last name. Customer count and median balance excludes the effect of zero balance accounts. ($000) ($000)
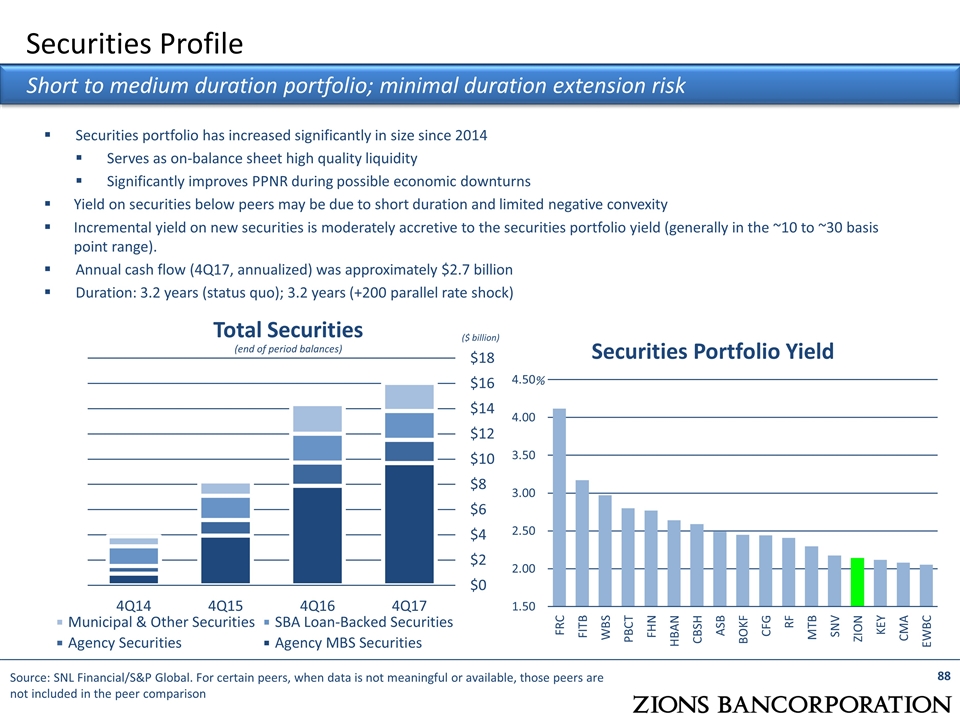
Securities Profile Short to medium duration portfolio; minimal duration extension risk Total Securities (end of period balances) ($ billion) Securities portfolio has increased significantly in size since 2014 Serves as on-balance sheet high quality liquidity Significantly improves PPNR during possible economic downturns Yield on securities below peers may be due to short duration and limited negative convexity Incremental yield on new securities is moderately accretive to the securities portfolio yield (generally in the ~10 to ~30 basis point range). Annual cash flow (4Q17, annualized) was approximately $2.7 billion Duration: 3.2 years (status quo); 3.2 years (+200 parallel rate shock) Securities Portfolio Yield % Source: SNL Financial/S&P Global. For certain peers, when data is not meaningful or available, those peers are not included in the peer comparison
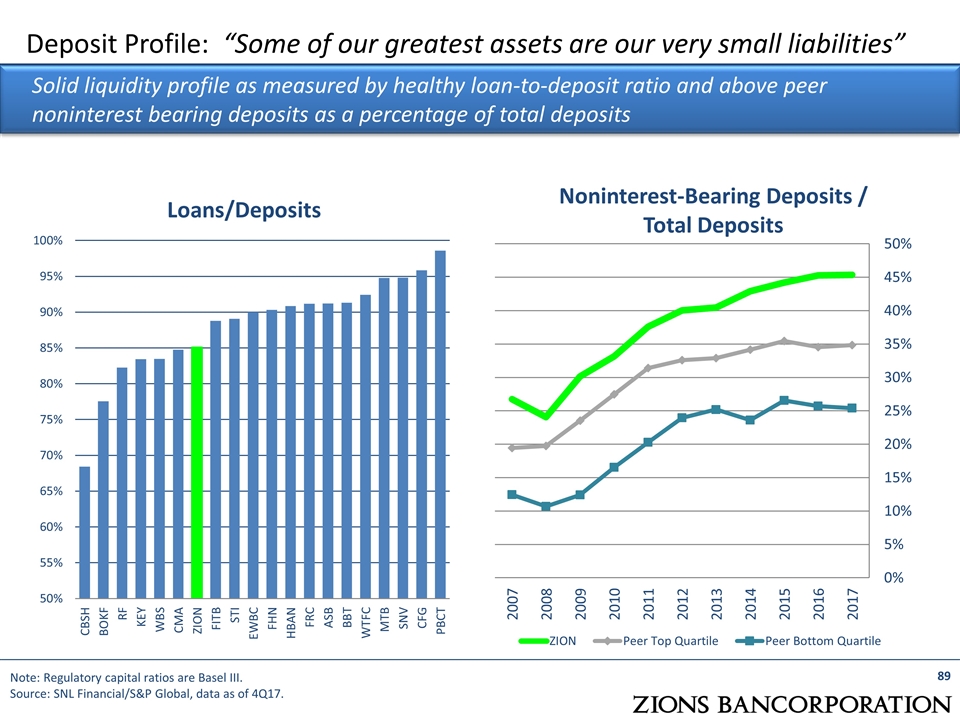
Deposit Profile: “Some of our greatest assets are our very small liabilities” Note: Regulatory capital ratios are Basel III. Source: SNL Financial/S&P Global, data as of 4Q17. Solid liquidity profile as measured by healthy loan-to-deposit ratio and above peer noninterest bearing deposits as a percentage of total deposits
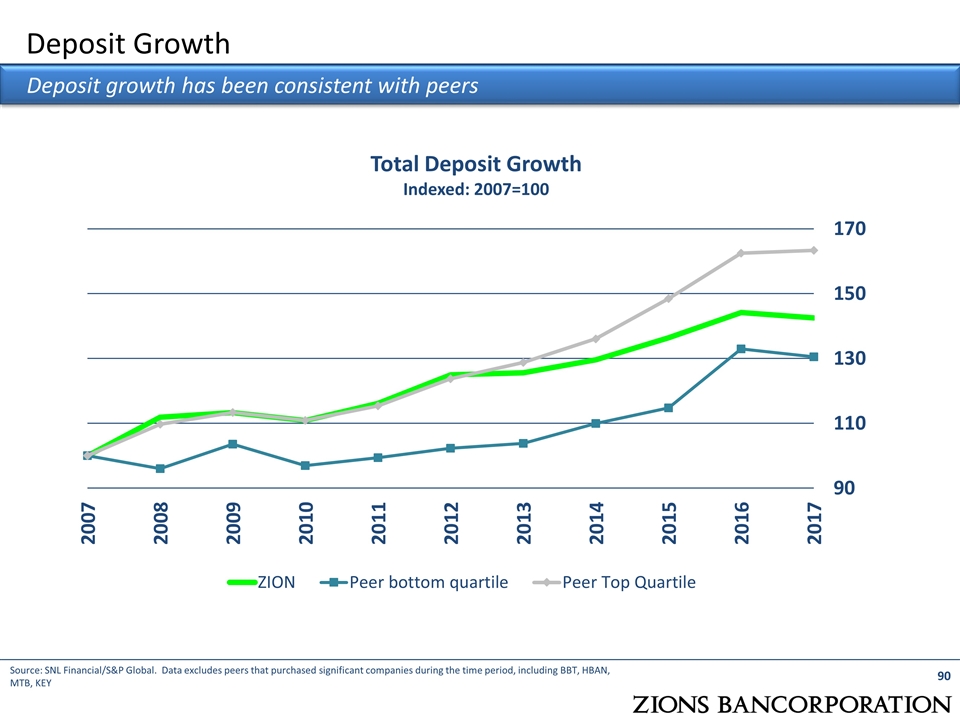
Deposit Growth Total Deposit Growth Indexed: 2007=100 Source: SNL Financial/S&P Global. Data excludes peers that purchased significant companies during the time period, including BBT, HBAN, MTB, KEY Deposit growth has been consistent with peers
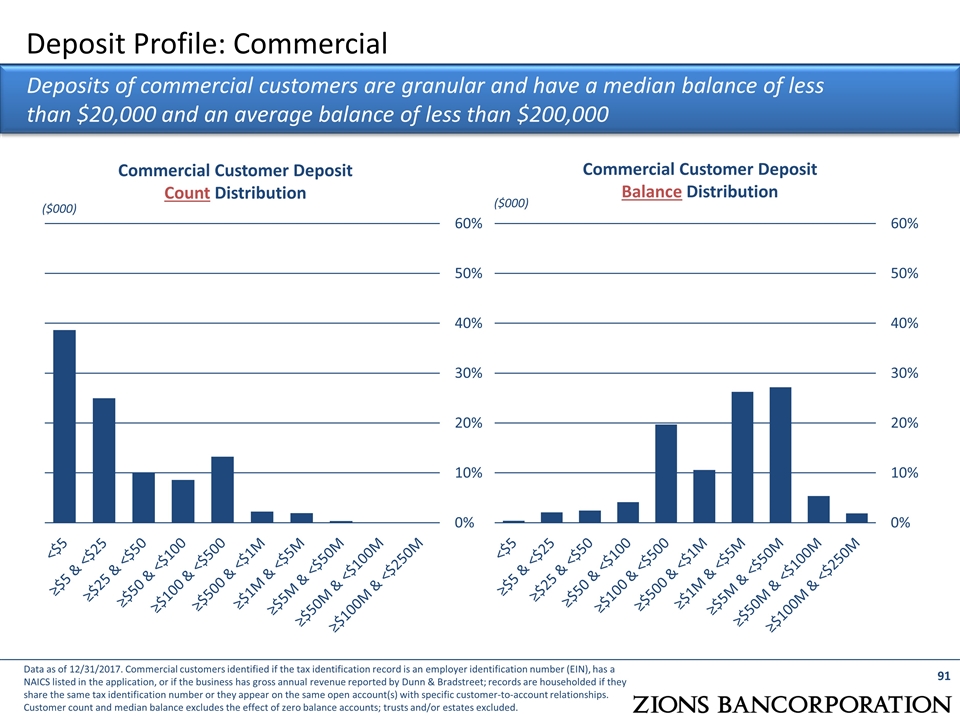
Deposit Profile: Commercial Deposits of commercial customers are granular and have a median balance of less than $20,000 and an average balance of less than $200,000 Commercial Customer Deposit Count Distribution ($000) Commercial Customer Deposit Balance Distribution Data as of 12/31/2017. Commercial customers identified if the tax identification record is an employer identification number (EIN), has a NAICS listed in the application, or if the business has gross annual revenue reported by Dunn & Bradstreet; records are householded if they share the same tax identification number or they appear on the same open account(s) with specific customer-to-account relationships. Customer count and median balance excludes the effect of zero balance accounts; trusts and/or estates excluded. ($000)
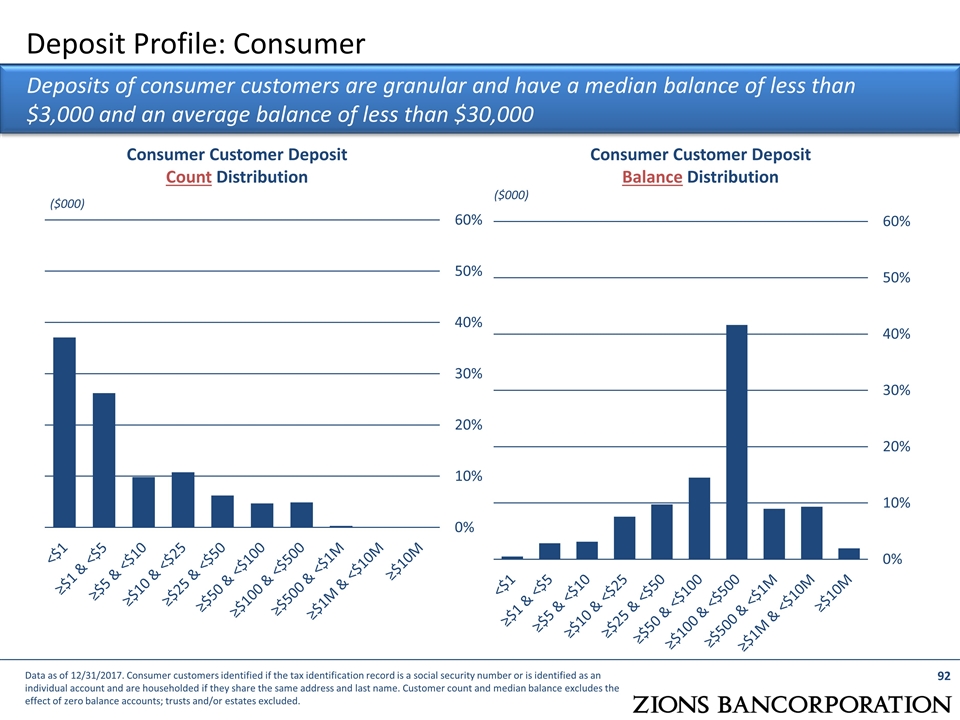
Deposit Profile: Consumer Deposits of consumer customers are granular and have a median balance of less than $3,000 and an average balance of less than $30,000 Consumer Customer Deposit Count Distribution ($000) Consumer Customer Deposit Balance Distribution Data as of 12/31/2017. Consumer customers identified if the tax identification record is a social security number or is identified as an individual account and are householded if they share the same address and last name. Customer count and median balance excludes the effect of zero balance accounts; trusts and/or estates excluded. ($000)
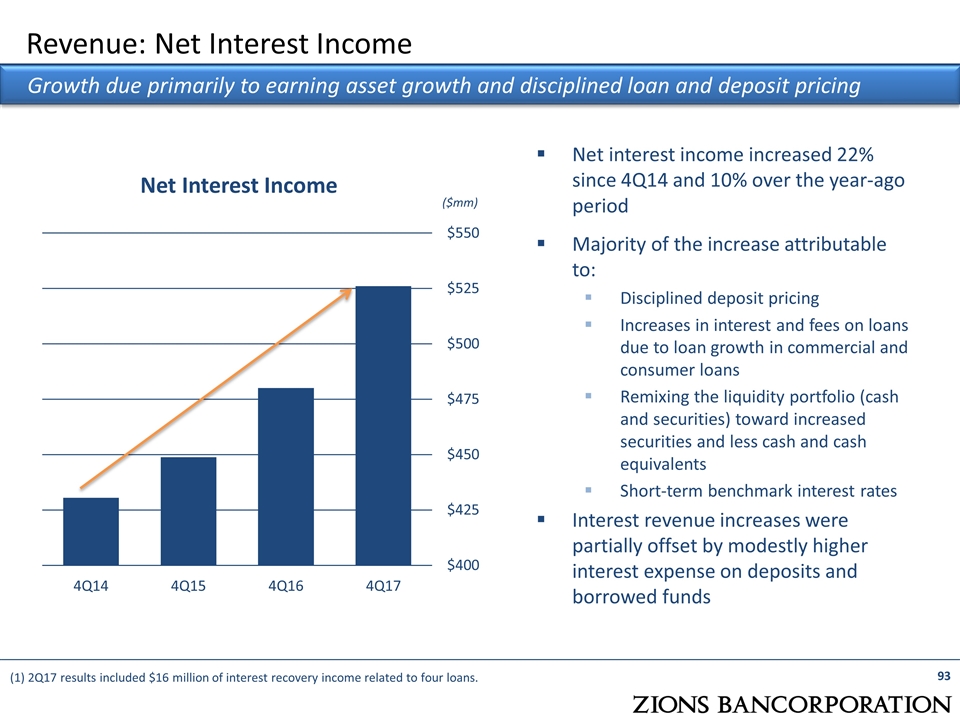
Net interest income increased 22% since 4Q14 and 10% over the year-ago period Majority of the increase attributable to: Disciplined deposit pricing Increases in interest and fees on loans due to loan growth in commercial and consumer loans Remixing the liquidity portfolio (cash and securities) toward increased securities and less cash and cash equivalents Short-term benchmark interest rates Interest revenue increases were partially offset by modestly higher interest expense on deposits and borrowed funds Revenue: Net Interest Income Net Interest Income Growth due primarily to earning asset growth and disciplined loan and deposit pricing ($mm) (1) 2Q17 results included $16 million of interest recovery income related to four loans.
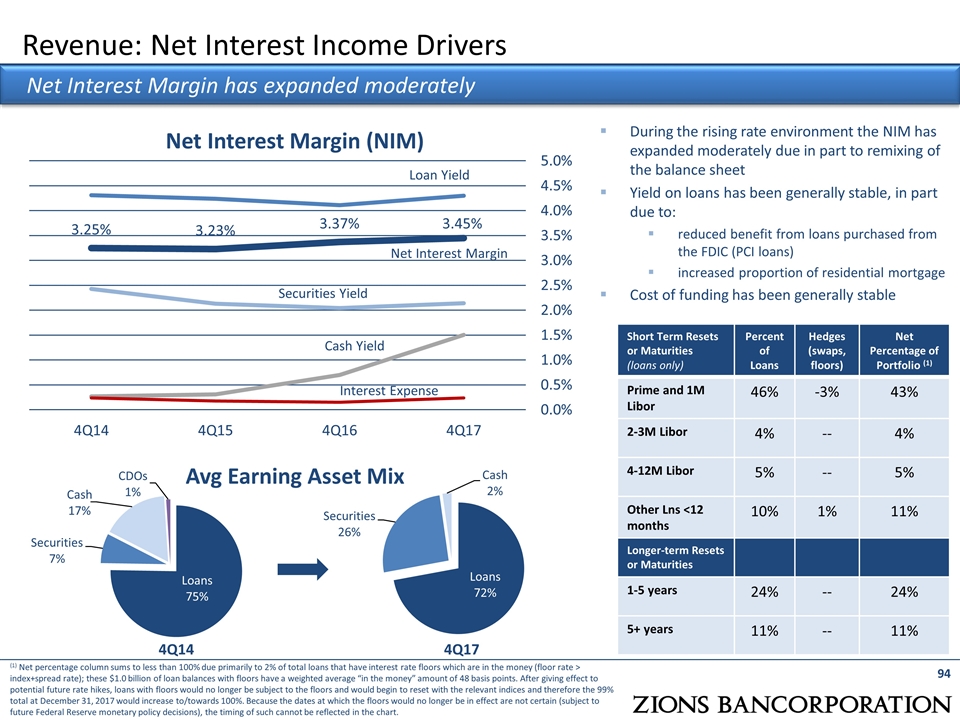
Revenue: Net Interest Income Drivers Net Interest Margin has expanded moderately Net Interest Margin (NIM) Avg Earning Asset Mix During the rising rate environment the NIM has expanded moderately due in part to remixing of the balance sheet Yield on loans has been generally stable, in part due to: reduced benefit from loans purchased from the FDIC (PCI loans) increased proportion of residential mortgage Cost of funding has been generally stable Loan Yield Securities Yield Interest Expense Net Interest Margin Cash Yield 4Q14 4Q17 Short Term Resets or Maturities (loans only) Percent of Loans Hedges (swaps, floors) Net Percentage of Portfolio (1) Prime and 1M Libor 46% -3% 43% 2-3M Libor 4% -- 4% 4-12M Libor 5% -- 5% Other Lns <12 months 10% 1% 11% Longer-term Resets or Maturities 1-5 years 24% -- 24% 5+ years 11% -- 11% (1) Net percentage column sums to less than 100% due primarily to 2% of total loans that have interest rate floors which are in the money (floor rate > index+spread rate); these $1.0 billion of loan balances with floors have a weighted average “in the money” amount of 48 basis points. After giving effect to potential future rate hikes, loans with floors would no longer be subject to the floors and would begin to reset with the relevant indices and therefore the 99% total at December 31, 2017 would increase to/towards 100%. Because the dates at which the floors would no longer be in effect are not certain (subject to future Federal Reserve monetary policy decisions), the timing of such cannot be reflected in the chart.
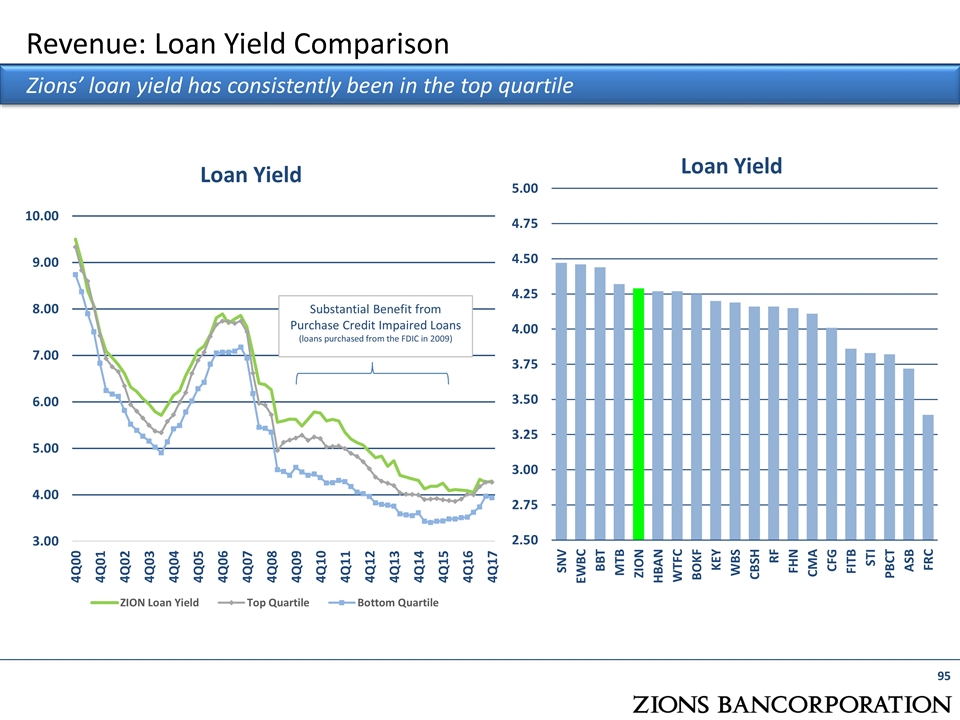
Revenue: Loan Yield Comparison Zions’ loan yield has consistently been in the top quartile Loan Yield Loan Yield Substantial Benefit from Purchase Credit Impaired Loans (loans purchased from the FDIC in 2009)
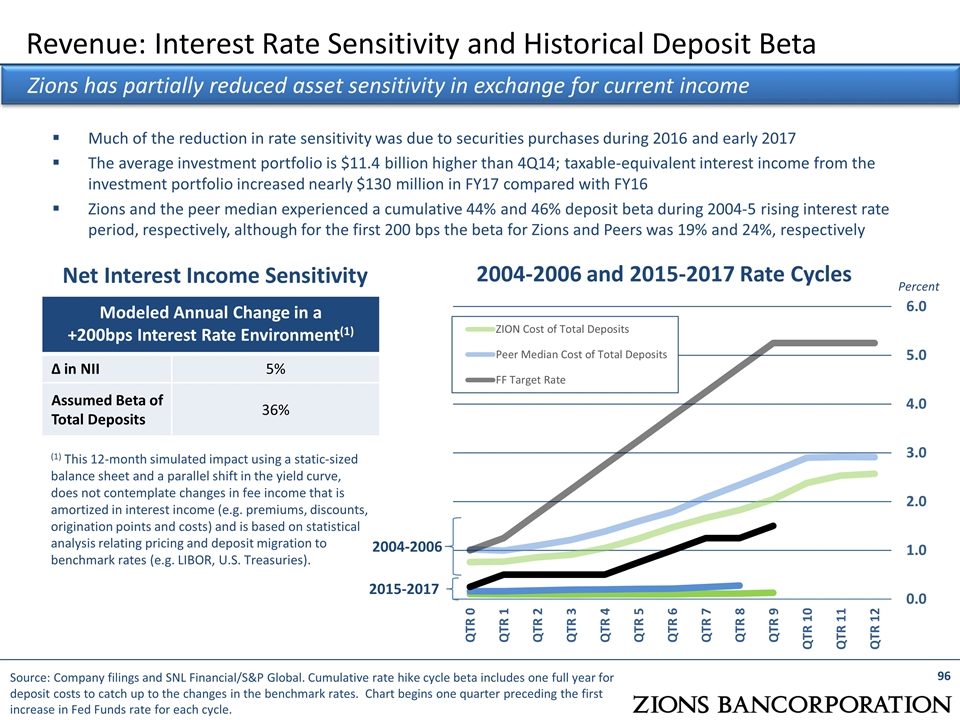
Much of the reduction in rate sensitivity was due to securities purchases during 2016 and early 2017 The average investment portfolio is $11.4 billion higher than 4Q14; taxable-equivalent interest income from the investment portfolio increased nearly $130 million in FY17 compared with FY16 Zions and the peer median experienced a cumulative 44% and 46% deposit beta during 2004-5 rising interest rate period, respectively, although for the first 200 bps the beta for Zions and Peers was 19% and 24%, respectively Revenue: Interest Rate Sensitivity and Historical Deposit Beta Zions has partially reduced asset sensitivity in exchange for current income Source: Company filings and SNL Financial/S&P Global. Cumulative rate hike cycle beta includes one full year for deposit costs to catch up to the changes in the benchmark rates. Chart begins one quarter preceding the first increase in Fed Funds rate for each cycle. (1) This 12-month simulated impact using a static-sized balance sheet and a parallel shift in the yield curve, does not contemplate changes in fee income that is amortized in interest income (e.g. premiums, discounts, origination points and costs) and is based on statistical analysis relating pricing and deposit migration to benchmark rates (e.g. LIBOR, U.S. Treasuries). Net Interest Income Sensitivity 2004-2006 and 2015-2017 Rate Cycles Percent Modeled Annual Change in a +200bps Interest Rate Environment(1) ∆ in NII 5% Assumed Beta of Total Deposits 36% 2004-2006 2015-2017
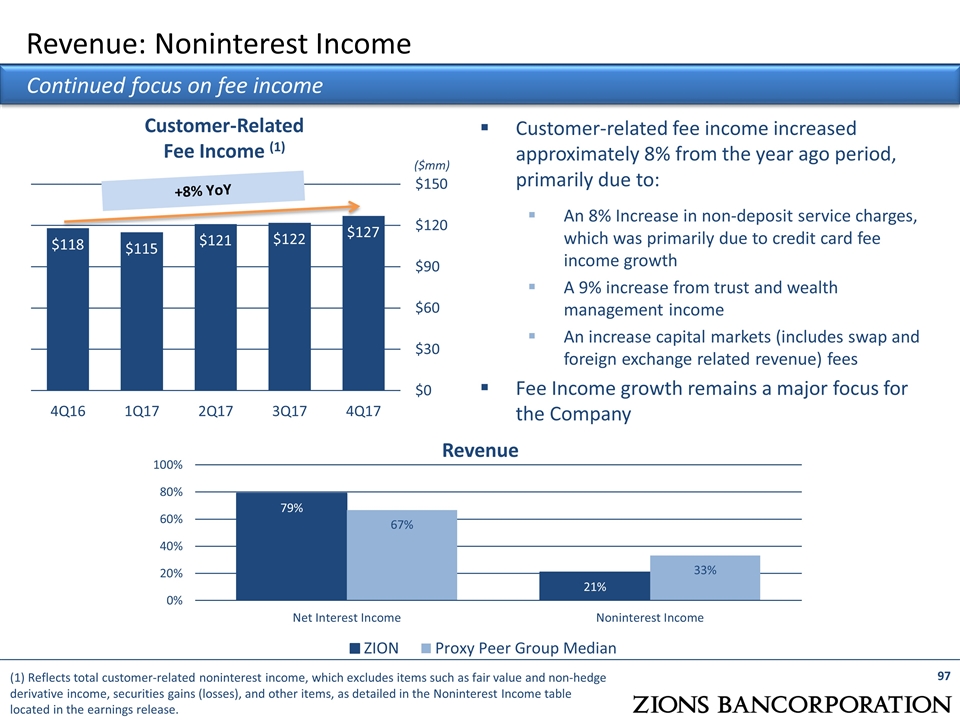
Customer-related fee income increased approximately 8% from the year ago period, primarily due to: An 8% Increase in non-deposit service charges, which was primarily due to credit card fee income growth A 9% increase from trust and wealth management income An increase capital markets (includes swap and foreign exchange related revenue) fees Fee Income growth remains a major focus for the Company Revenue: Noninterest Income Continued focus on fee income (1) Reflects total customer-related noninterest income, which excludes items such as fair value and non-hedge derivative income, securities gains (losses), and other items, as detailed in the Noninterest Income table located in the earnings release. Customer-Related Fee Income (1) ($mm) +8% YoY Revenue
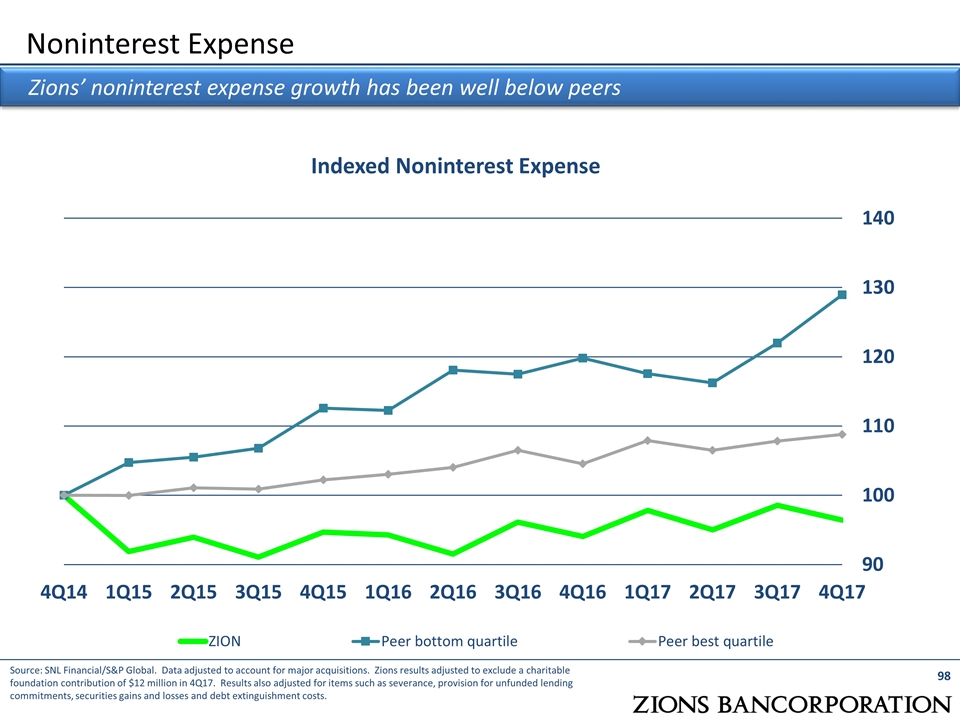
Noninterest Expense Zions’ noninterest expense growth has been well below peers Source: SNL Financial/S&P Global. Data adjusted to account for major acquisitions. Zions results adjusted to exclude a charitable foundation contribution of $12 million in 4Q17. Results also adjusted for items such as severance, provision for unfunded lending commitments, securities gains and losses and debt extinguishment costs. Indexed Noninterest Expense
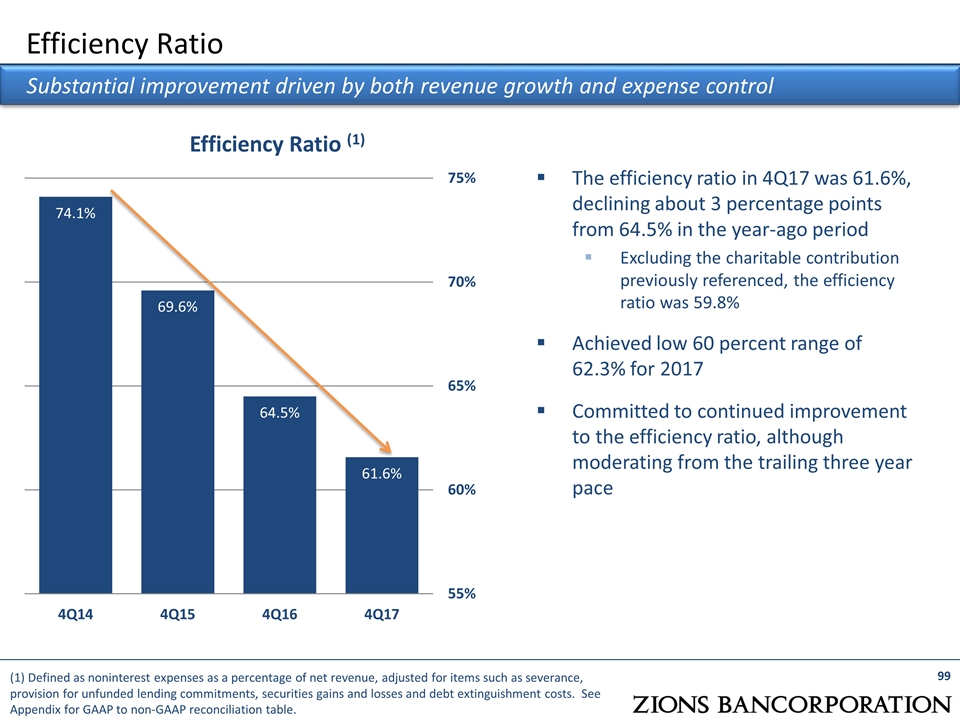
The efficiency ratio in 4Q17 was 61.6%, declining about 3 percentage points from 64.5% in the year-ago period Excluding the charitable contribution previously referenced, the efficiency ratio was 59.8% Achieved low 60 percent range of 62.3% for 2017 Committed to continued improvement to the efficiency ratio, although moderating from the trailing three year pace Efficiency Ratio Efficiency Ratio (1) Substantial improvement driven by both revenue growth and expense control (1) Defined as noninterest expenses as a percentage of net revenue, adjusted for items such as severance, provision for unfunded lending commitments, securities gains and losses and debt extinguishment costs. See Appendix for GAAP to non-GAAP reconciliation table.
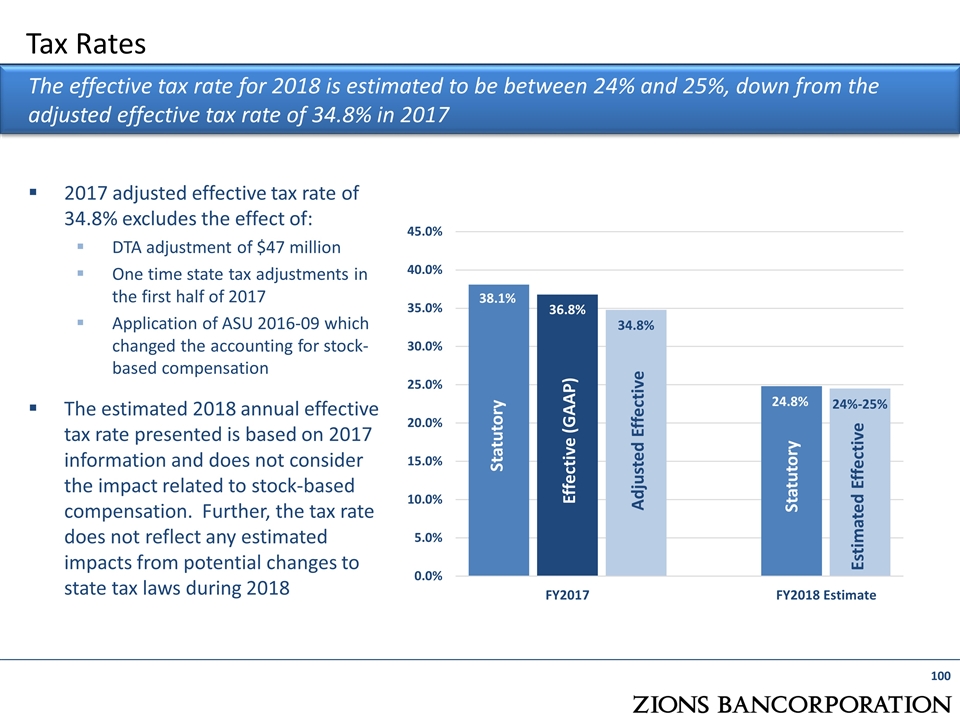
Tax Rates The effective tax rate for 2018 is estimated to be between 24% and 25%, down from the adjusted effective tax rate of 34.8% in 2017 2017 adjusted effective tax rate of 34.8% excludes the effect of: DTA adjustment of $47 million One time state tax adjustments in the first half of 2017 Application of ASU 2016-09 which changed the accounting for stock-based compensation The estimated 2018 annual effective tax rate presented is based on 2017 information and does not consider the impact related to stock-based compensation. Further, the tax rate does not reflect any estimated impacts from potential changes to state tax laws during 2018 Statutory Statutory Effective (GAAP) Adjusted Effective Estimated Effective
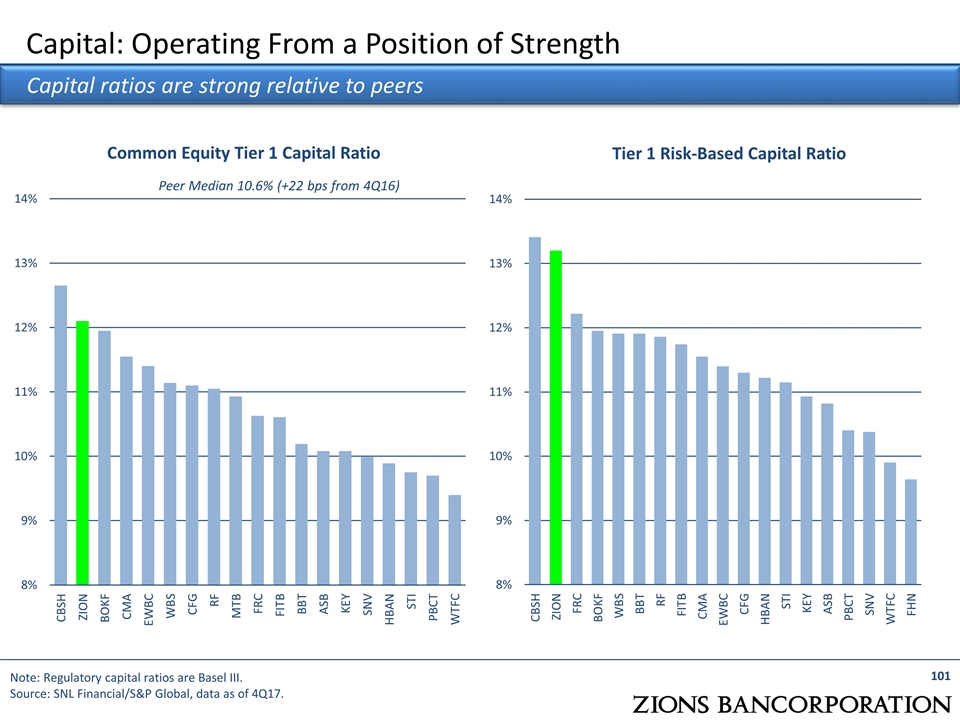
Capital: Operating From a Position of Strength Common Equity Tier 1 Capital Ratio Tier 1 Risk-Based Capital Ratio Note: Regulatory capital ratios are Basel III. Source: SNL Financial/S&P Global, data as of 4Q17. Capital ratios are strong relative to peers Peer Median 10.6% (+22 bps from 4Q16)
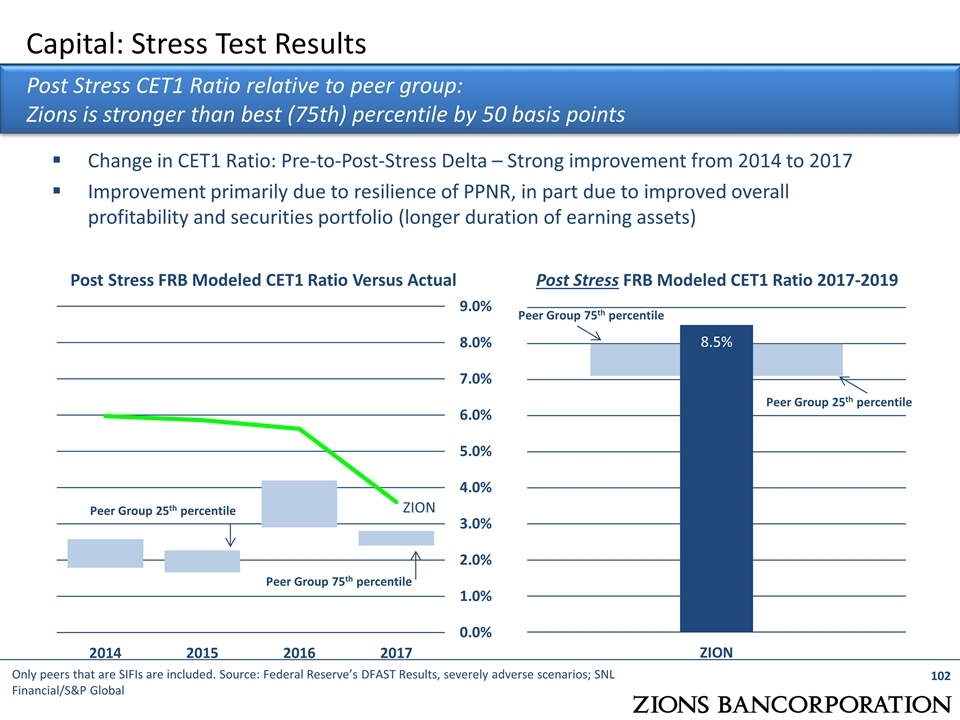
Change in CET1 Ratio: Pre-to-Post-Stress Delta – Strong improvement from 2014 to 2017 Improvement primarily due to resilience of PPNR, in part due to improved overall profitability and securities portfolio (longer duration of earning assets) Capital: Stress Test Results Post Stress FRB Modeled CET1 Ratio Versus Actual Peer Group 75th percentile Peer Group 25th percentile Post Stress FRB Modeled CET1 Ratio 2017-2019 Only peers that are SIFIs are included. Source: Federal Reserve’s DFAST Results, severely adverse scenarios; SNL Financial/S&P Global Peer Group 75th percentile Peer Group 25th percentile ZION Post Stress CET1 Ratio relative to peer group: Zions is stronger than best (75th) percentile by 50 basis points
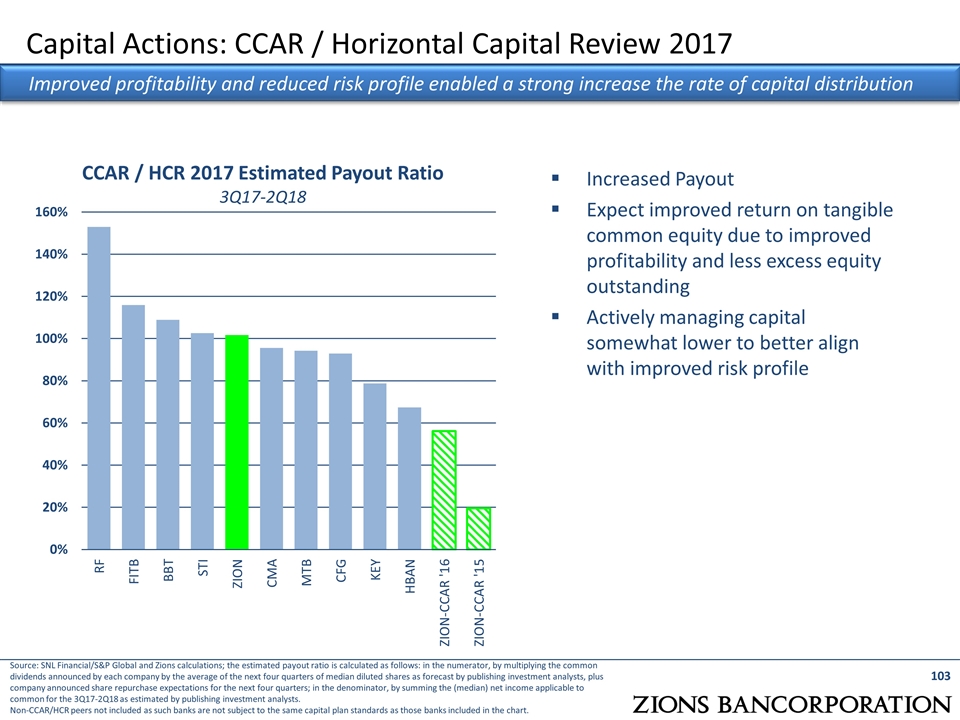
Increased Payout Expect improved return on tangible common equity due to improved profitability and less excess equity outstanding Actively managing capital somewhat lower to better align with improved risk profile Capital Actions: CCAR / Horizontal Capital Review 2017 Improved profitability and reduced risk profile enabled a strong increase the rate of capital distribution CCAR / HCR 2017 Estimated Payout Ratio 3Q17-2Q18 Source: SNL Financial/S&P Global and Zions calculations; the estimated payout ratio is calculated as follows: in the numerator, by multiplying the common dividends announced by each company by the average of the next four quarters of median diluted shares as forecast by publishing investment analysts, plus company announced share repurchase expectations for the next four quarters; in the denominator, by summing the (median) net income applicable to common for the 3Q17-2Q18 as estimated by publishing investment analysts. Non-CCAR/HCR peers not included as such banks are not subject to the same capital plan standards as those banks included in the chart.
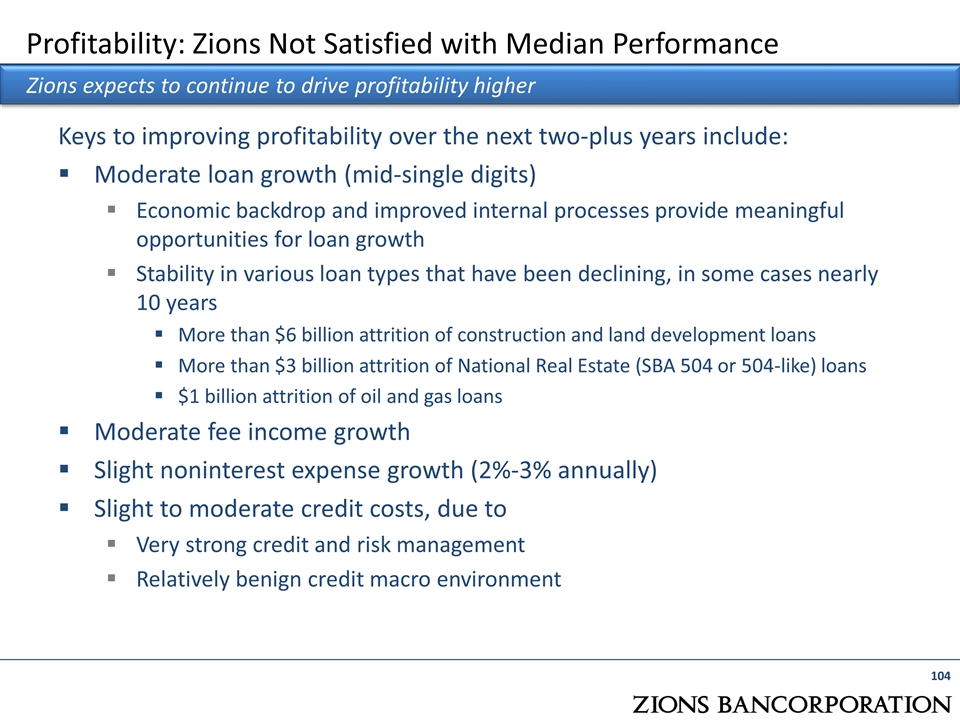
Profitability: Zions Not Satisfied with Median Performance Zions expects to continue to drive profitability higher Keys to improving profitability over the next two-plus years include: Moderate loan growth (mid-single digits) Economic backdrop and improved internal processes provide meaningful opportunities for loan growth Stability in various loan types that have been declining, in some cases nearly 10 years More than $6 billion attrition of construction and land development loans More than $3 billion attrition of National Real Estate (SBA 504 or 504-like) loans $1 billion attrition of oil and gas loans Moderate fee income growth Slight noninterest expense growth (2%-3% annually) Slight to moderate credit costs, due to Very strong credit and risk management Relatively benign credit macro environment
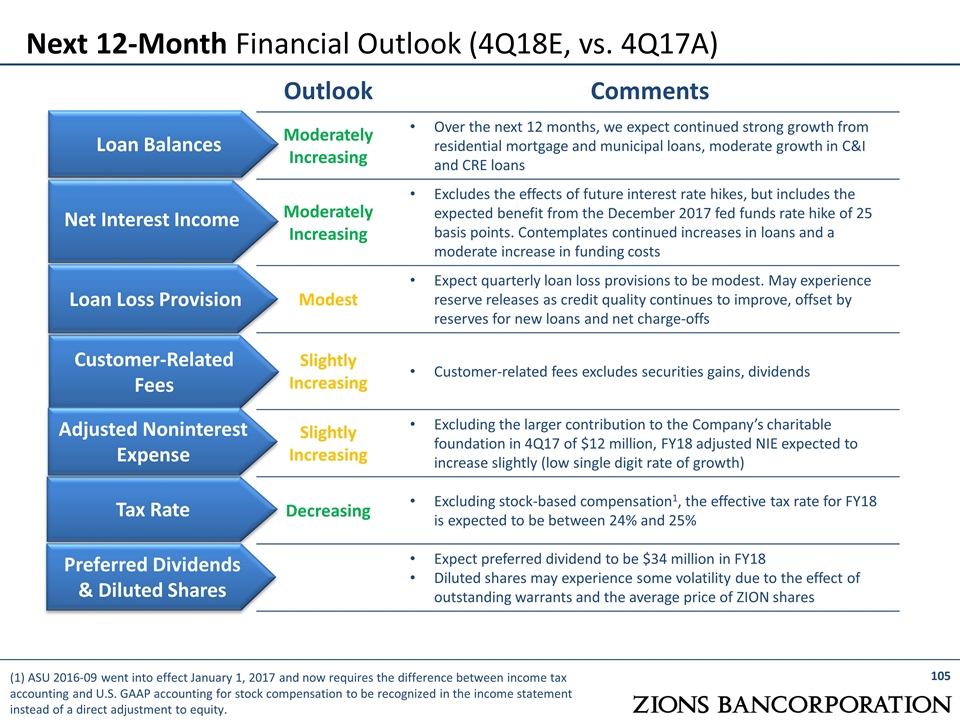
Next 12-Month Financial Outlook (4Q18E, vs. 4Q17A) Outlook Comments Moderately Increasing Over the next 12 months, we expect continued strong growth from residential mortgage and municipal loans, moderate growth in C&I and CRE loans Moderately Increasing Excludes the effects of future interest rate hikes, but includes the expected benefit from the December 2017 fed funds rate hike of 25 basis points. Contemplates continued increases in loans and a moderate increase in funding costs Modest Expect quarterly loan loss provisions to be modest. May experience reserve releases as credit quality continues to improve, offset by reserves for new loans and net charge-offs Slightly Increasing Customer-related fees excludes securities gains, dividends Slightly Increasing Excluding the larger contribution to the Company’s charitable foundation in 4Q17 of $12 million, FY18 adjusted NIE expected to increase slightly (low single digit rate of growth) Decreasing Excluding stock-based compensation1, the effective tax rate for FY18 is expected to be between 24% and 25% Expect preferred dividend to be $34 million in FY18 Diluted shares may experience some volatility due to the effect of outstanding warrants and the average price of ZION shares Customer-Related Fees Loan Balances Net Interest Income Loan Loss Provision Tax Rate Preferred Dividends & Diluted Shares Adjusted Noninterest Expense (1) ASU 2016-09 went into effect January 1, 2017 and now requires the difference between income tax accounting and U.S. GAAP accounting for stock compensation to be recognized in the income statement instead of a direct adjustment to equity.
Welcome Risk Management Technology and Innovation – Future Ready Simplification Financial Performance and Goals Roundtable Sessions Access to Lending Managers CRE Large C&I Small C&I Access to Affiliate CEOs Texas, Colorado, Utah California, Arizona, Nevada, Washington Wrap-up 2018 Investor Conference Agenda Opportunities in Offense
Welcome Risk Management Technology and Innovation – Future Ready Simplification Financial Performance and Goals Roundtable Sessions Access to Lending Managers CRE Large C&I Small C&I Access to Affiliate CEOs Texas, Colorado, Utah California, Arizona, Nevada, Washington Wrap-up 2018 Investor Conference Agenda Opportunities in Offense
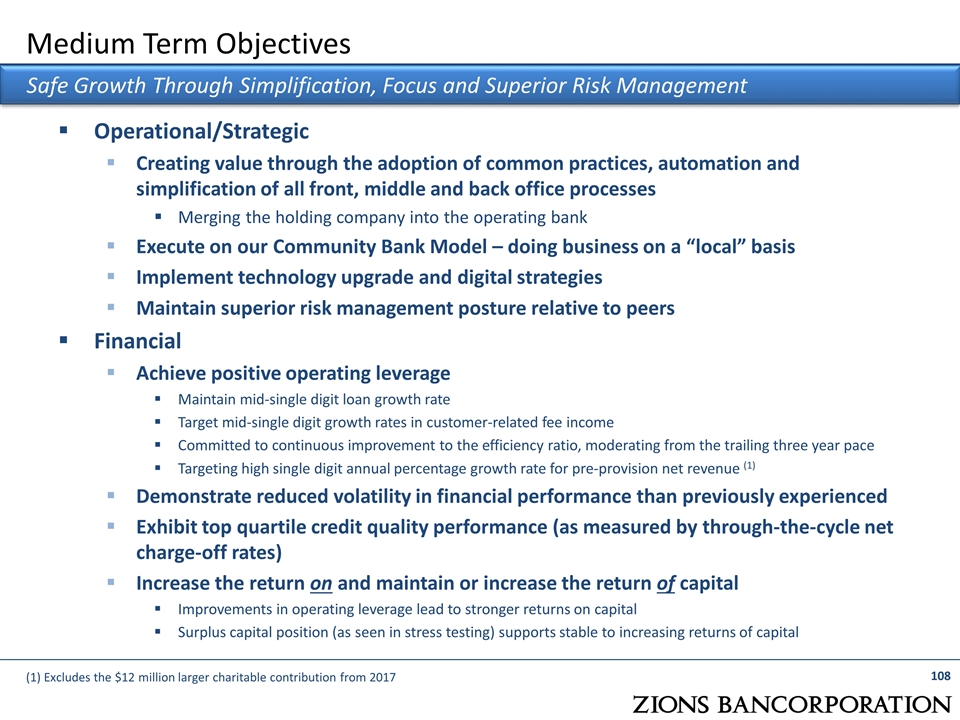
Operational/Strategic Creating value through the adoption of common practices, automation and simplification of all front, middle and back office processes Merging the holding company into the operating bank Execute on our Community Bank Model – doing business on a “local” basis Implement technology upgrade and digital strategies Maintain superior risk management posture relative to peers Financial Achieve positive operating leverage Maintain mid-single digit loan growth rate Target mid-single digit growth rates in customer-related fee income Committed to continuous improvement to the efficiency ratio, moderating from the trailing three year pace Targeting high single digit annual percentage growth rate for pre-provision net revenue (1) Demonstrate reduced volatility in financial performance than previously experienced Exhibit top quartile credit quality performance (as measured by through-the-cycle net charge-off rates) Increase the return on and maintain or increase the return of capital Improvements in operating leverage lead to stronger returns on capital Surplus capital position (as seen in stress testing) supports stable to increasing returns of capital Medium Term Objectives Safe Growth Through Simplification, Focus and Superior Risk Management (1) Excludes the $12 million larger charitable contribution from 2017
Appendix
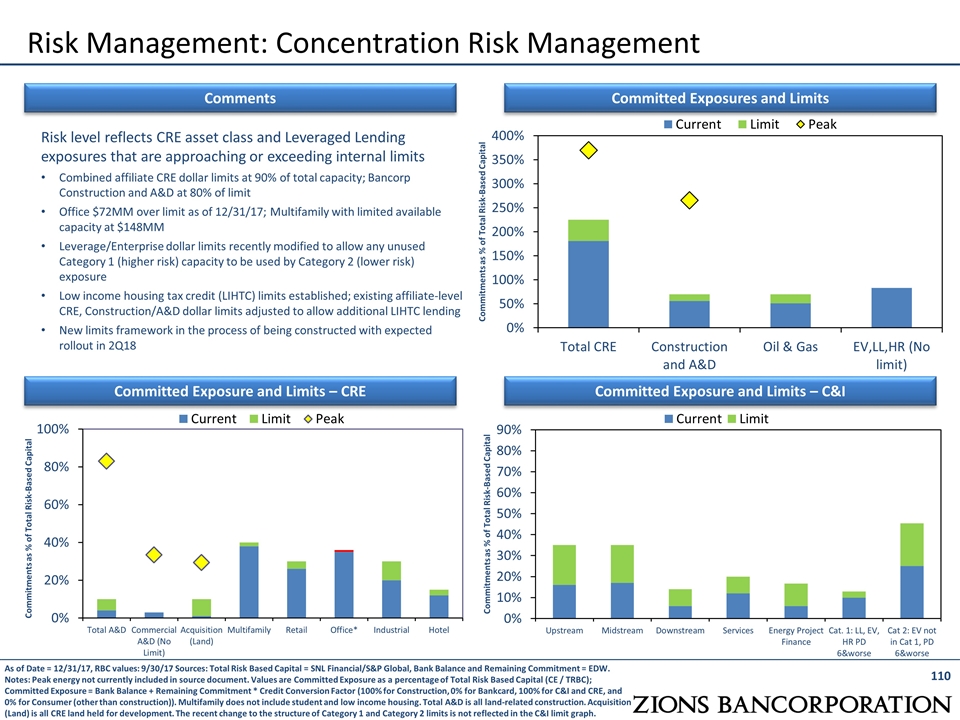
As of Date = 12/31/17, RBC values: 9/30/17 Sources: Total Risk Based Capital = SNL Financial/S&P Global, Bank Balance and Remaining Commitment = EDW. Notes: Peak energy not currently included in source document. Values are Committed Exposure as a percentage of Total Risk Based Capital (CE / TRBC); Committed Exposure = Bank Balance + Remaining Commitment * Credit Conversion Factor (100% for Construction, 0% for Bankcard, 100% for C&I and CRE, and 0% for Consumer (other than construction)). Multifamily does not include student and low income housing. Total A&D is all land-related construction. Acquisition (Land) is all CRE land held for development. The recent change to the structure of Category 1 and Category 2 limits is not reflected in the C&I limit graph. Committed Exposures and Limits Comments Committed Exposure and Limits – C&I Committed Exposure and Limits – CRE Risk Management: Concentration Risk Management Risk level reflects CRE asset class and Leveraged Lending exposures that are approaching or exceeding internal limits Combined affiliate CRE dollar limits at 90% of total capacity; Bancorp Construction and A&D at 80% of limit Office $72MM over limit as of 12/31/17; Multifamily with limited available capacity at $148MM Leverage/Enterprise dollar limits recently modified to allow any unused Category 1 (higher risk) capacity to be used by Category 2 (lower risk) exposure Low income housing tax credit (LIHTC) limits established; existing affiliate-level CRE, Construction/A&D dollar limits adjusted to allow additional LIHTC lending New limits framework in the process of being constructed with expected rollout in 2Q18
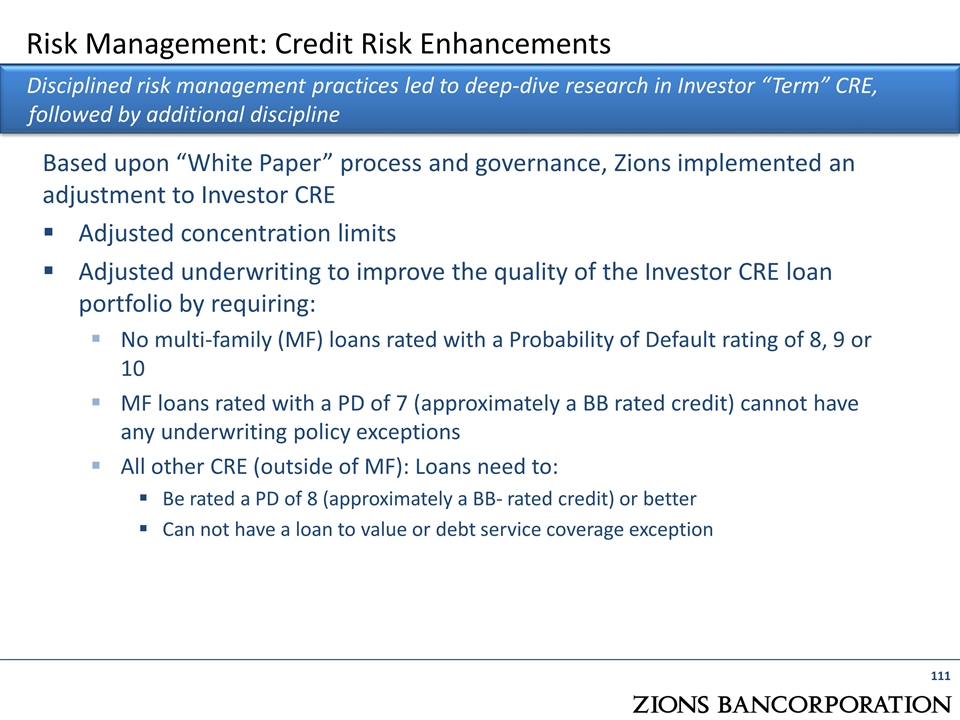
Risk Management: Credit Risk Enhancements Based upon “White Paper” process and governance, Zions implemented an adjustment to Investor CRE Adjusted concentration limits Adjusted underwriting to improve the quality of the Investor CRE loan portfolio by requiring: No multi-family (MF) loans rated with a Probability of Default rating of 8, 9 or 10 MF loans rated with a PD of 7 (approximately a BB rated credit) cannot have any underwriting policy exceptions All other CRE (outside of MF): Loans need to: Be rated a PD of 8 (approximately a BB- rated credit) or better Can not have a loan to value or debt service coverage exception Disciplined risk management practices led to deep-dive research in Investor “Term” CRE, followed by additional discipline
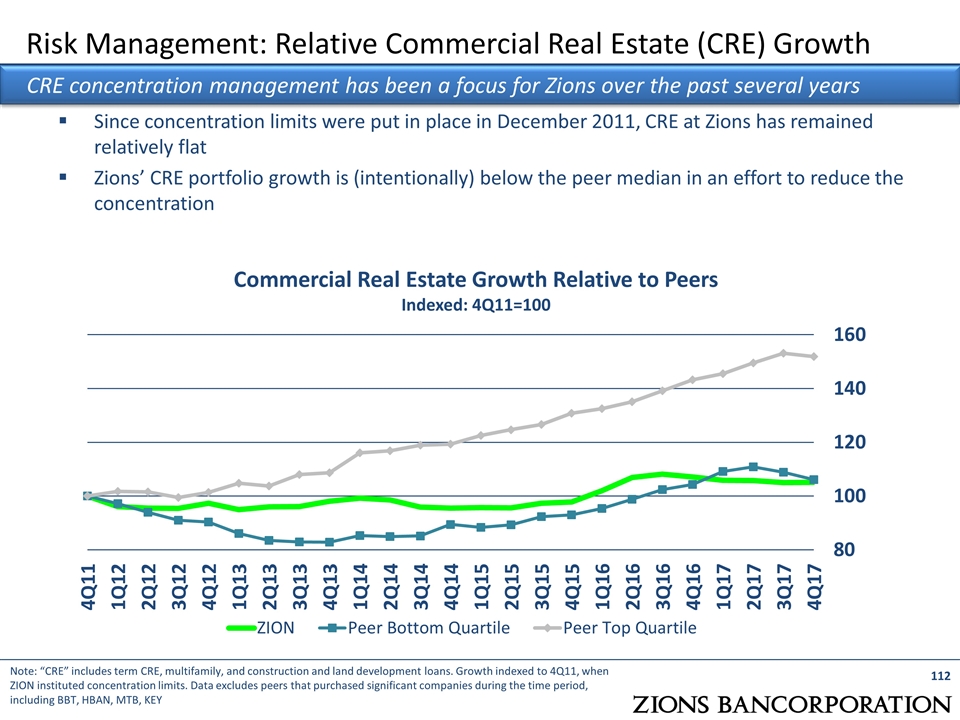
Risk Management: Relative Commercial Real Estate (CRE) Growth CRE concentration management has been a focus for Zions over the past several years Note: “CRE” includes term CRE, multifamily, and construction and land development loans. Growth indexed to 4Q11, when ZION instituted concentration limits. Data excludes peers that purchased significant companies during the time period, including BBT, HBAN, MTB, KEY Since concentration limits were put in place in December 2011, CRE at Zions has remained relatively flat Zions’ CRE portfolio growth is (intentionally) below the peer median in an effort to reduce the concentration Commercial Real Estate Growth Relative to Peers Indexed: 4Q11=100
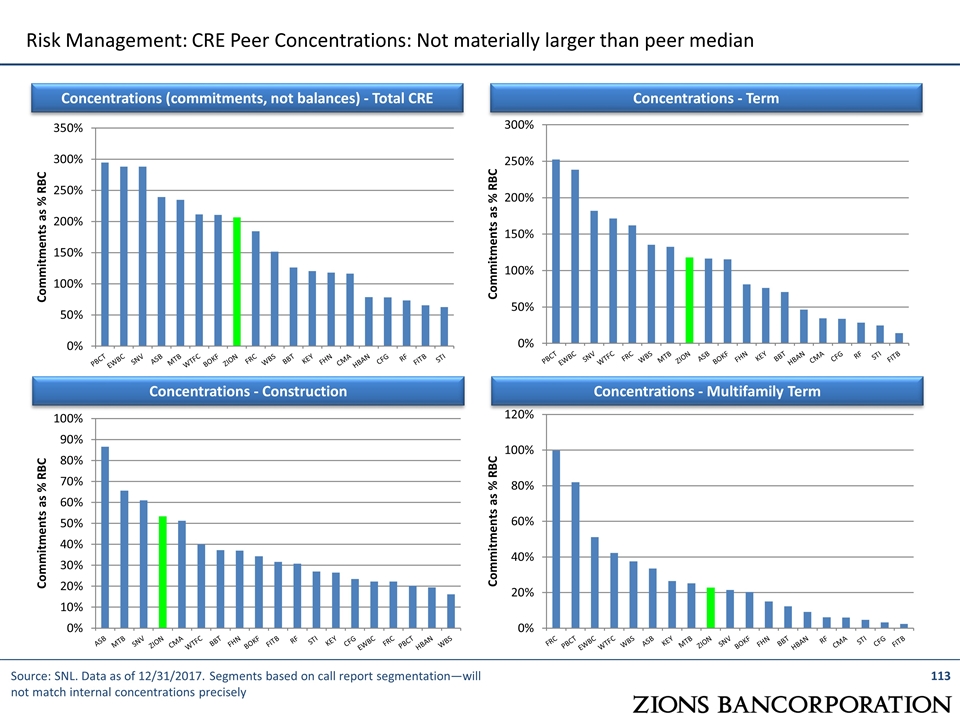
Source: SNL. Data as of 12/31/2017. Segments based on call report segmentation—will not match internal concentrations precisely Risk Management: CRE Peer Concentrations: Not materially larger than peer median Concentrations - Term Concentrations (commitments, not balances) - Total CRE Concentrations - Construction Concentrations - Multifamily Term
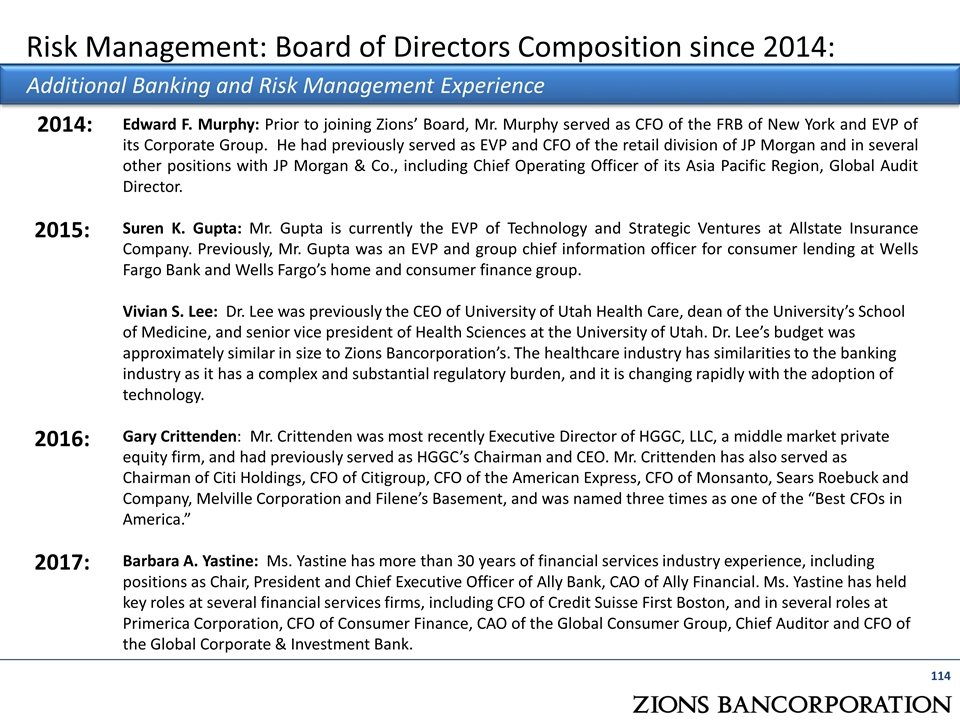
Risk Management: Board of Directors Composition since 2014: Edward F. Murphy: Prior to joining Zions’ Board, Mr. Murphy served as CFO of the FRB of New York and EVP of its Corporate Group. He had previously served as EVP and CFO of the retail division of JP Morgan and in several other positions with JP Morgan & Co., including Chief Operating Officer of its Asia Pacific Region, Global Audit Director. Suren K. Gupta: Mr. Gupta is currently the EVP of Technology and Strategic Ventures at Allstate Insurance Company. Previously, Mr. Gupta was an EVP and group chief information officer for consumer lending at Wells Fargo Bank and Wells Fargo’s home and consumer finance group. Vivian S. Lee: Dr. Lee was previously the CEO of University of Utah Health Care, dean of the University’s School of Medicine, and senior vice president of Health Sciences at the University of Utah. Dr. Lee’s budget was approximately similar in size to Zions Bancorporation’s. The healthcare industry has similarities to the banking industry as it has a complex and substantial regulatory burden, and it is changing rapidly with the adoption of technology. Gary Crittenden: Mr. Crittenden was most recently Executive Director of HGGC, LLC, a middle market private equity firm, and had previously served as HGGC’s Chairman and CEO. Mr. Crittenden has also served as Chairman of Citi Holdings, CFO of Citigroup, CFO of the American Express, CFO of Monsanto, Sears Roebuck and Company, Melville Corporation and Filene’s Basement, and was named three times as one of the “Best CFOs in America.” Barbara A. Yastine: Ms. Yastine has more than 30 years of financial services industry experience, including positions as Chair, President and Chief Executive Officer of Ally Bank, CAO of Ally Financial. Ms. Yastine has held key roles at several financial services firms, including CFO of Credit Suisse First Boston, and in several roles at Primerica Corporation, CFO of Consumer Finance, CAO of the Global Consumer Group, Chief Auditor and CFO of the Global Corporate & Investment Bank. 2014: 2016: 2017: 2015: Additional Banking and Risk Management Experience
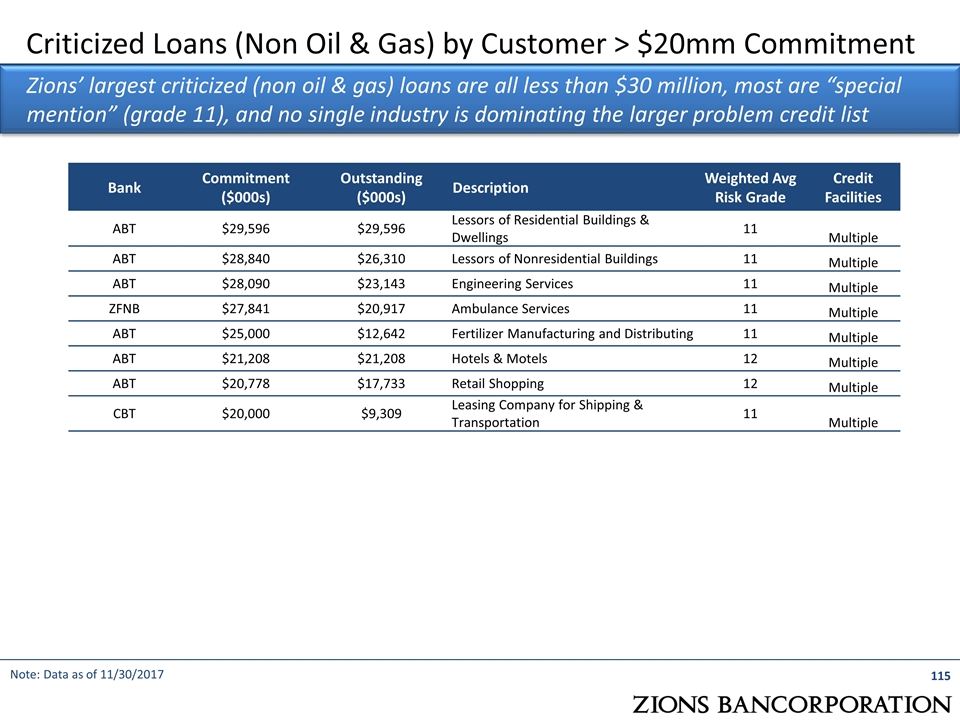
Criticized Loans (Non Oil & Gas) by Customer > $20mm Commitment Note: Data as of 11/30/2017 Bank Commitment ($000s) Outstanding ($000s) Description Weighted Avg Risk Grade Credit Facilities ABT $29,596 $29,596 Lessors of Residential Buildings & Dwellings 11 Multiple ABT $28,840 $26,310 Lessors of Nonresidential Buildings 11 Multiple ABT $28,090 $23,143 Engineering Services 11 Multiple ZFNB $27,841 $20,917 Ambulance Services 11 Multiple ABT $25,000 $12,642 Fertilizer Manufacturing and Distributing 11 Multiple ABT $21,208 $21,208 Hotels & Motels 12 Multiple ABT $20,778 $17,733 Retail Shopping 12 Multiple CBT $20,000 $9,309 Leasing Company for Shipping & Transportation 11 Multiple Zions’ largest criticized (non oil & gas) loans are all less than $30 million, most are “special mention” (grade 11), and no single industry is dominating the larger problem credit list
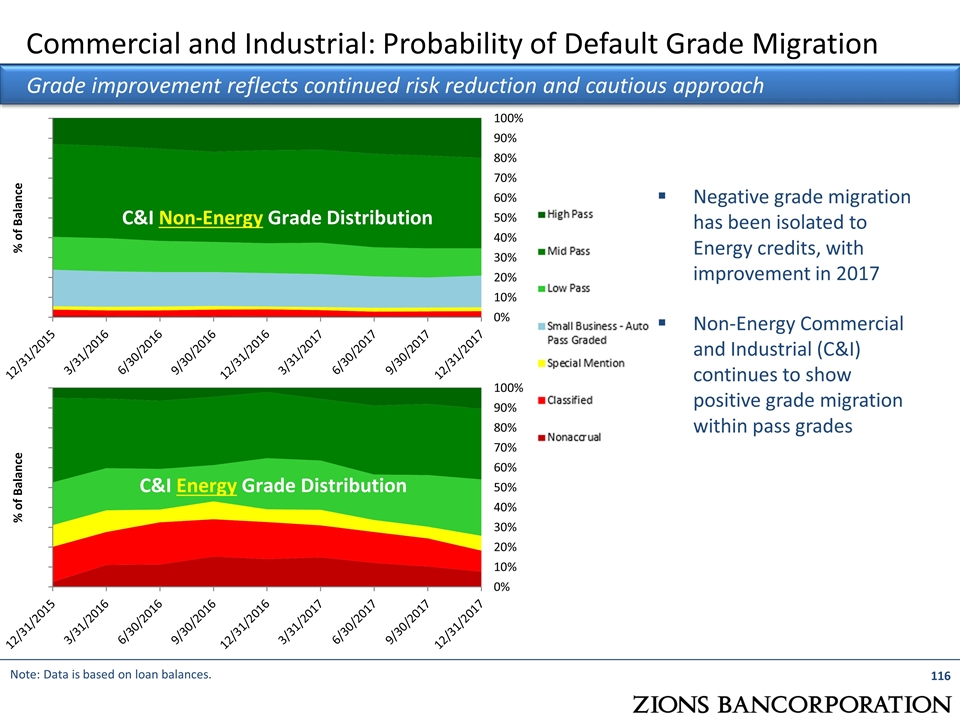
Commercial and Industrial: Probability of Default Grade Migration Grade improvement reflects continued risk reduction and cautious approach Note: Data is based on loan balances. Negative grade migration has been isolated to Energy credits, with improvement in 2017 Non-Energy Commercial and Industrial (C&I) continues to show positive grade migration within pass grades
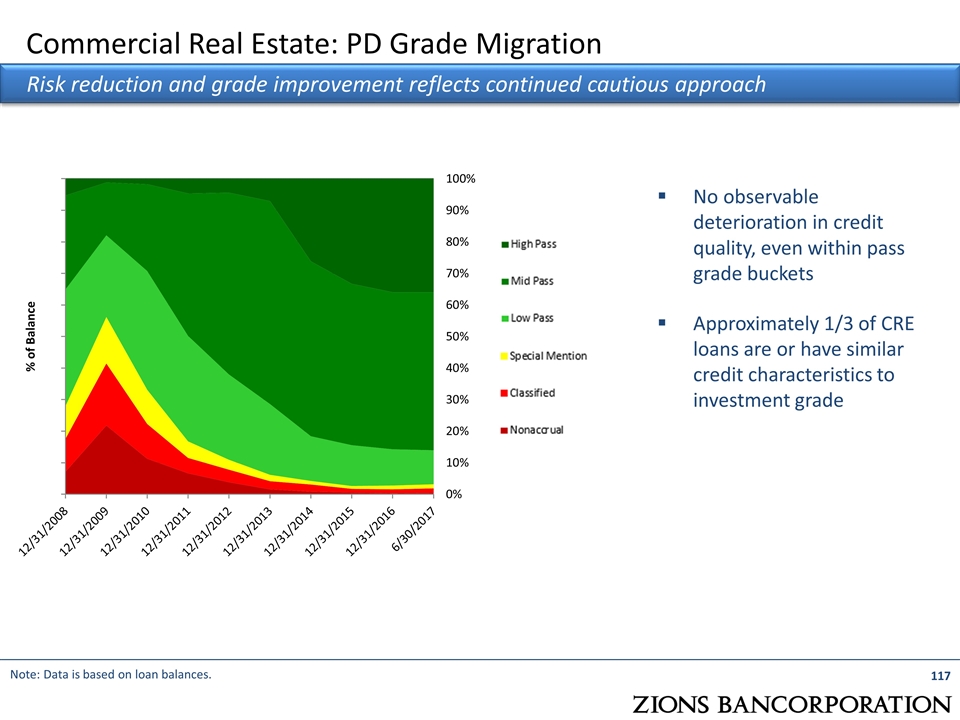
Commercial Real Estate: PD Grade Migration No observable deterioration in credit quality, even within pass grade buckets Approximately 1/3 of CRE loans are or have similar credit characteristics to investment grade Note: Data is based on loan balances. Risk reduction and grade improvement reflects continued cautious approach
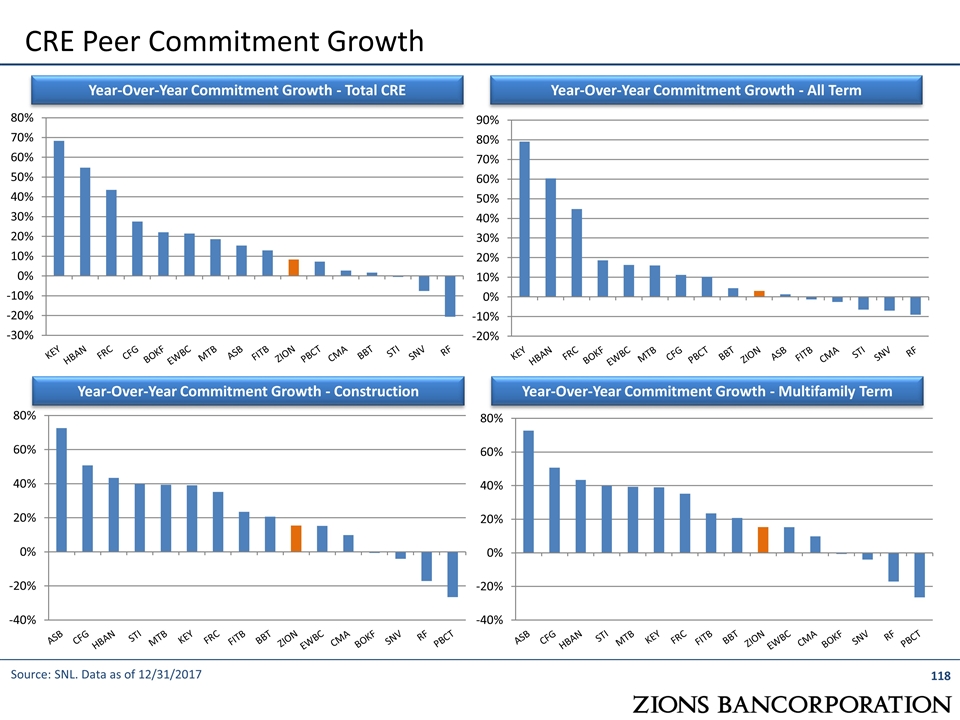
Source: SNL. Data as of 12/31/2017 CRE Peer Commitment Growth Year-Over-Year Commitment Growth - All Term Year-Over-Year Commitment Growth - Total CRE Year-Over-Year Commitment Growth - Construction Year-Over-Year Commitment Growth - Multifamily Term
Oil and Gas: Benefits of 2012-2013 Risk Management Enhancements Due to enhanced risk management practices, losses were less than otherwise would have been Zions’ concentration limits had been in place years before the downturn Risk Management lowered the loan-to-risk-based capital ratio prior to the downturn Risk Management, during the downturn, reduced the allowable mix of services loans relative to total RBC, which improves the current and prospective risk profile Comments from outside parties have had positive things to say about Zions’ risk management practices Zions was proactive and aggressive in addressing the downturn in oil and gas due to its risk management policies O&G portfolio was aggressively reviewed to determine every issue and adjustments were made early in PD ratings
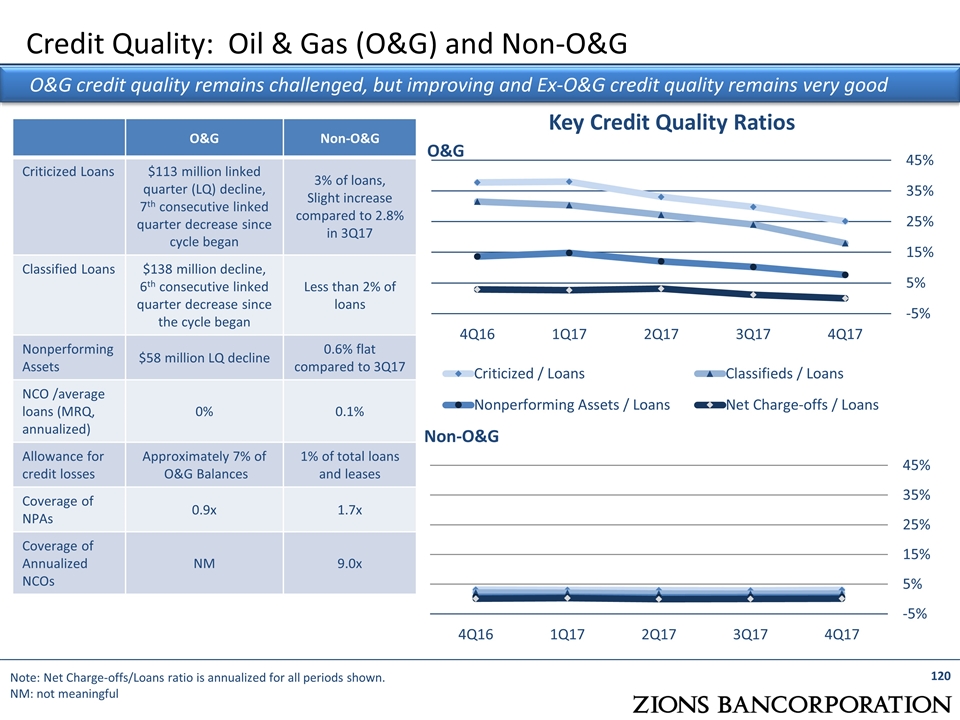
Credit Quality: Oil & Gas (O&G) and Non-O&G Key Credit Quality Ratios O&G credit quality remains challenged, but improving and Ex-O&G credit quality remains very good Note: Net Charge-offs/Loans ratio is annualized for all periods shown. NM: not meaningful O&G Non-O&G Criticized Loans $113 million linked quarter (LQ) decline, 7th consecutive linked quarter decrease since cycle began 3% of loans, Slight increase compared to 2.8% in 3Q17 Classified Loans $138 million decline, 6th consecutive linked quarter decrease since the cycle began Less than 2% of loans Nonperforming Assets $58 million LQ decline 0.6% flat compared to 3Q17 NCO /average loans (MRQ, annualized) 0% 0.1% Allowance for credit losses Approximately 7% of O&G Balances 1% of total loans and leases Coverage of NPAs 0.9x 1.7x Coverage of Annualized NCOs NM 9.0x O&G Non-O&G
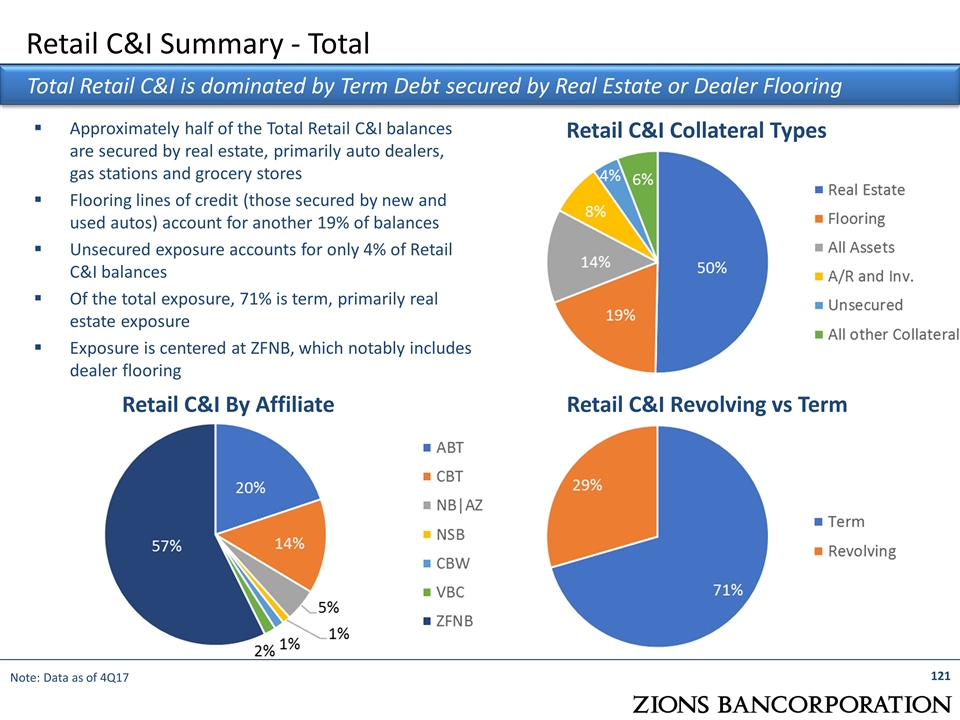
Retail C&I Summary - Total Total Retail C&I is dominated by Term Debt secured by Real Estate or Dealer Flooring Approximately half of the Total Retail C&I balances are secured by real estate, primarily auto dealers, gas stations and grocery stores Flooring lines of credit (those secured by new and used autos) account for another 19% of balances Unsecured exposure accounts for only 4% of Retail C&I balances Of the total exposure, 71% is term, primarily real estate exposure Exposure is centered at ZFNB, which notably includes dealer flooring Retail C&I Revolving vs Term Retail C&I Collateral Types Retail C&I By Affiliate Note: Data as of 4Q17
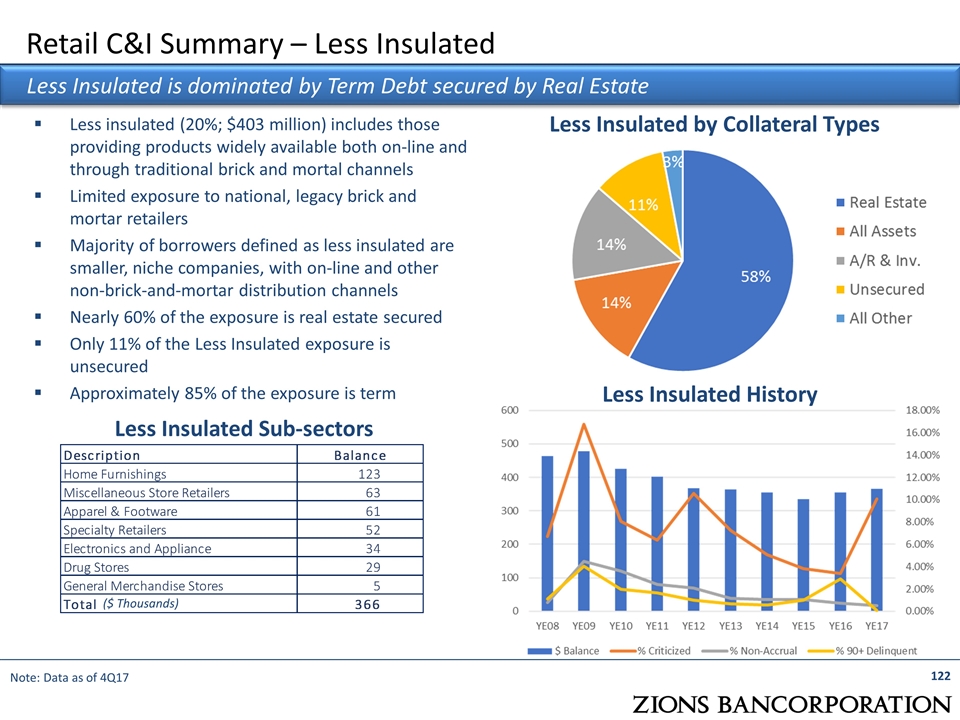
Retail C&I Summary – Less Insulated Less insulated (20%; $403 million) includes those providing products widely available both on-line and through traditional brick and mortal channels Limited exposure to national, legacy brick and mortar retailers Majority of borrowers defined as less insulated are smaller, niche companies, with on-line and other non-brick-and-mortar distribution channels Nearly 60% of the exposure is real estate secured Only 11% of the Less Insulated exposure is unsecured Approximately 85% of the exposure is term Less Insulated by Collateral Types Less Insulated Sub-sectors Less Insulated is dominated by Term Debt secured by Real Estate ($ Thousands) Less Insulated History Note: Data as of 4Q17
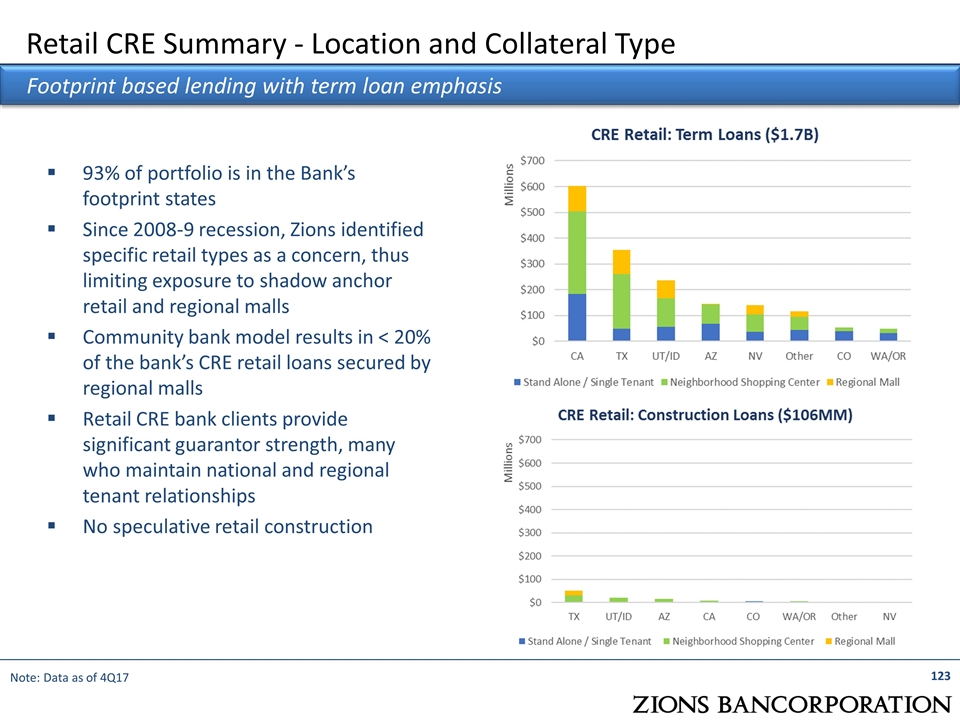
Retail CRE Summary - Location and Collateral Type Footprint based lending with term loan emphasis Note: Data as of 4Q17 93% of portfolio is in the Bank’s footprint states Since 2008-9 recession, Zions identified specific retail types as a concern, thus limiting exposure to shadow anchor retail and regional malls Community bank model results in < 20% of the bank’s CRE retail loans secured by regional malls Retail CRE bank clients provide significant guarantor strength, many who maintain national and regional tenant relationships No speculative retail construction
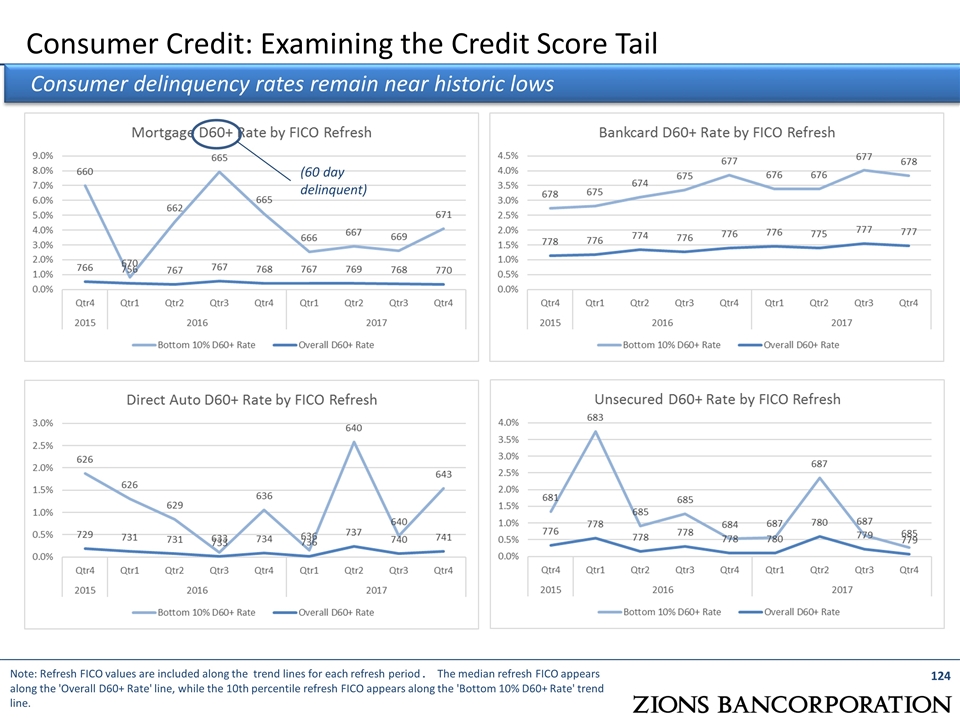
Consumer Credit: Examining the Credit Score Tail Note: Refresh FICO values are included along the trend lines for each refresh period. The median refresh FICO appears along the 'Overall D60+ Rate' line, while the 10th percentile refresh FICO appears along the 'Bottom 10% D60+ Rate' trend line. (60 day delinquent) Consumer delinquency rates remain near historic lows
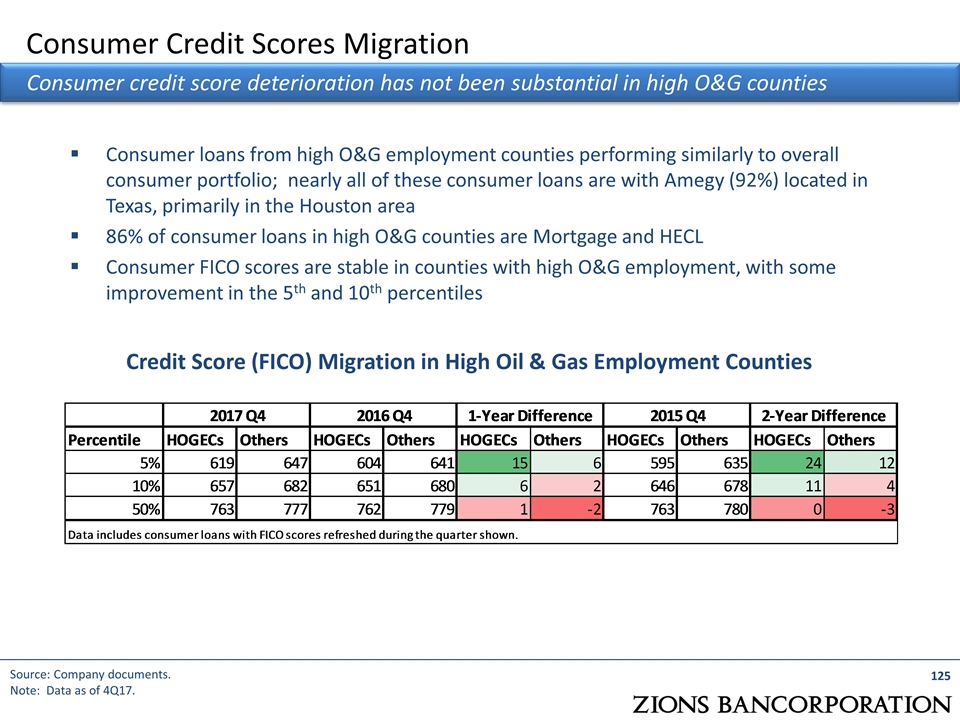
Consumer loans from high O&G employment counties performing similarly to overall consumer portfolio; nearly all of these consumer loans are with Amegy (92%) located in Texas, primarily in the Houston area 86% of consumer loans in high O&G counties are Mortgage and HECL Consumer FICO scores are stable in counties with high O&G employment, with some improvement in the 5th and 10th percentiles Consumer Credit Scores Migration Credit Score (FICO) Migration in High Oil & Gas Employment Counties Source: Company documents. Note: Data as of 4Q17. Consumer credit score deterioration has not been substantial in high O&G counties
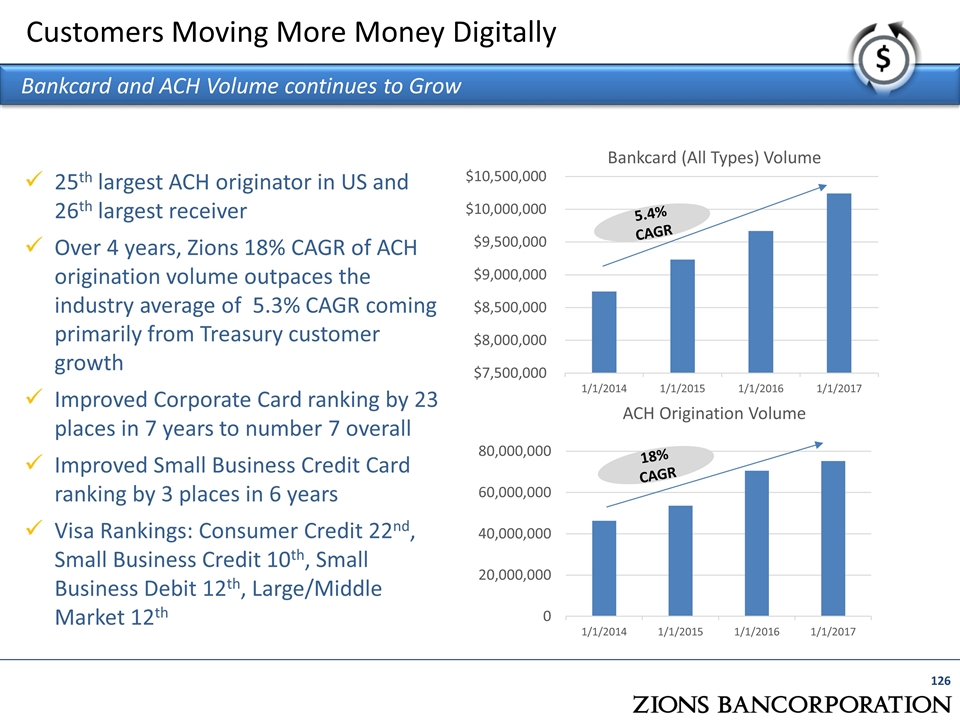
5.4% CAGR 18% CAGR 25th largest ACH originator in US and 26th largest receiver Over 4 years, Zions 18% CAGR of ACH origination volume outpaces the industry average of 5.3% CAGR coming primarily from Treasury customer growth Improved Corporate Card ranking by 23 places in 7 years to number 7 overall Improved Small Business Credit Card ranking by 3 places in 6 years Visa Rankings: Consumer Credit 22nd, Small Business Credit 10th, Small Business Debit 12th, Large/Middle Market 12th Customers Moving More Money Digitally Bankcard and ACH Volume continues to Grow
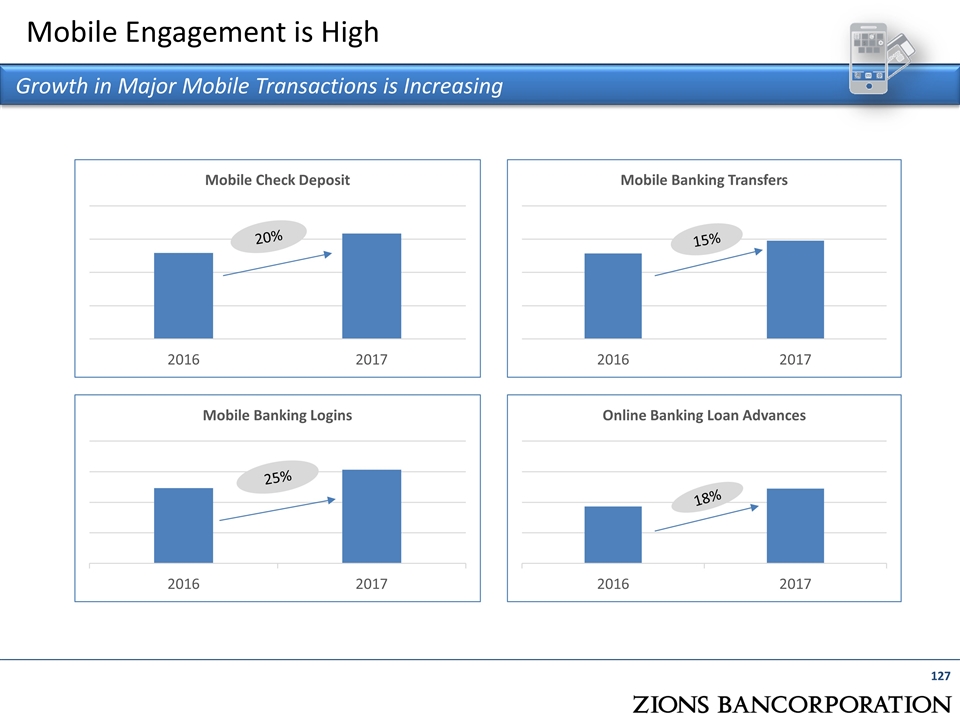
25% 20% 15% Mobile Engagement is High Growth in Major Mobile Transactions is Increasing
Forward-Looking Statements; Use of Non-GAAP Financial Measures Forward Looking Information This presentation includes forward-looking statements within the meaning of Section 21E of the Securities Exchange Act of 1934, as amended, or the Exchange Act. Statements in this presentation that are based on other than historical information or that express Zions Bancorporation’s expectations regarding future events or determinations are forward-looking within the meaning of the Private Securities Litigation Reform Act of 1995. Forward-looking statements reflect, among other things, our current expectations, all of which are subject to known and unknown risks, uncertainties and other factors that may cause our actual results, performance or achievements, market trends, industry results or regulatory outcomes to differ materially from those expressed or implied by such forward-looking statements. Without limiting the foregoing, the words “anticipates,” “believes,” “can,” “continue,” “could,” “estimates,” “expects,” “intends,” “may,” “might,” “plans,” “projects,” “should,” “would,” “targets,” “will” and the negative thereof and similar words and expressions are intended to identify forward-looking statements. Forward-looking statements by their nature address matters that are, to different degrees, uncertain, such as statements about future financial and operating results, the potential timing or consummation of the proposed transaction described in the presentation and receipt of regulatory approvals or determinations, or the anticipated benefits thereof, including, without limitation, future financial and operating results. Actual results and outcomes may differ materially from those presented, either expressed or implied, in the presentation. Important risk factors that may cause such material differences include, but are not limited to, the rate of change of interest sensitive assets and liabilities relative to changes in benchmark interest rates; growth rates of revenue or expense; risks and uncertainties related to the ability to obtain shareholder and regulatory approvals or determinations for various matters, including the proposed merger of the holding company with and into the operating bank, or the possibility that such approvals or determinations may be delayed; the imposition by regulators of conditions or requirements that are not favorable to Zions; the ability of Zions Bancorporation to achieve anticipated benefits from the consolidation and regulatory determinations; and legislative, regulatory and economic developments that may diminish or eliminate the anticipated benefits of the consolidation. These risks, as well as other factors, are discussed in Zions Bancorporation’s most recent Annual Report on Form 10-K and Quarterly Report on Form 10-Q, filed with the Securities and Exchange Commission (SEC) and available at the SEC’s Internet site (http://www.sec.gov), and other risks associated with the proposed transaction will be more fully discussed in the proxy statement that will be filed with the Securities and Exchange Commission in connection with the proposed transaction. Use of Non-GAAP Financial Measures: This document contains several references to non-GAAP measures, including pre-provision net revenue and the “efficiency ratio,” which are common industry terms used by investors and financial services analysts. Certain of these non-GAAP measures are key inputs into Zions’ management compensation and are used in Zions’ strategic goals that have been and may continue to be articulated to investors. Therefore, the use of such non-GAAP measures are believed by management to be of substantial interest to the consumers of these financial disclosures and are used prominently throughout the disclosures. A full reconciliation of the difference between such measures and GAAP financials is provided within the document, and users of this document are encouraged to carefully review this reconciliation.
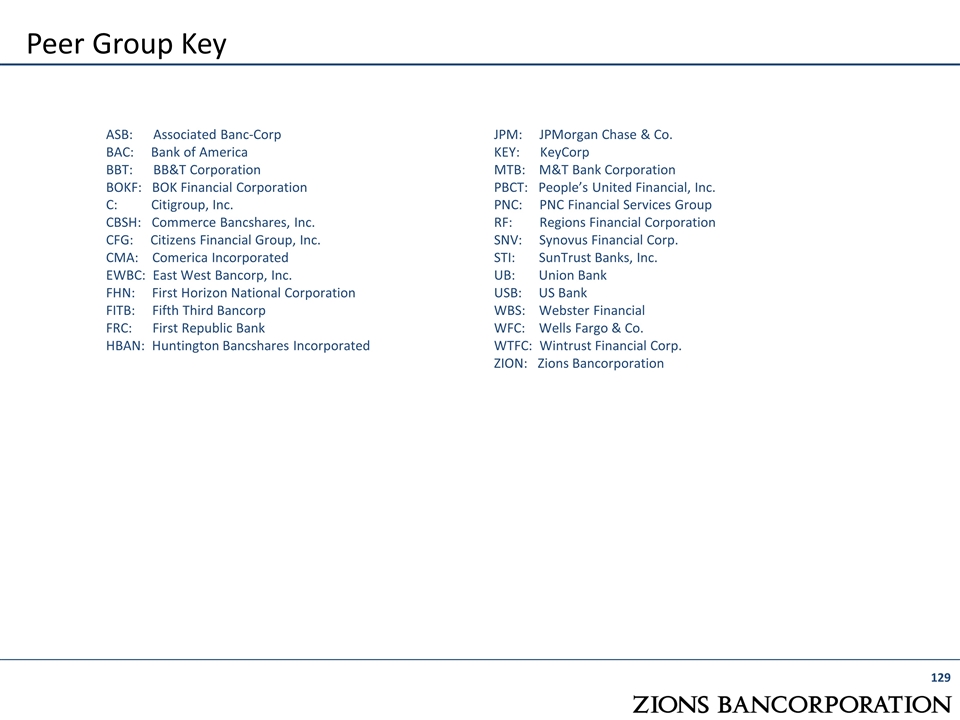
Peer Group Key ASB: Associated Banc-Corp BAC: Bank of America BBT: BB&T Corporation BOKF: BOK Financial Corporation C: Citigroup, Inc. CBSH: Commerce Bancshares, Inc. CFG: Citizens Financial Group, Inc. CMA: Comerica Incorporated EWBC: East West Bancorp, Inc. FHN: First Horizon National Corporation FITB: Fifth Third Bancorp FRC: First Republic Bank HBAN: Huntington Bancshares Incorporated JPM: JPMorgan Chase & Co. KEY: KeyCorp MTB: M&T Bank Corporation PBCT: People’s United Financial, Inc. PNC: PNC Financial Services Group RF: Regions Financial Corporation SNV: Synovus Financial Corp. STI: SunTrust Banks, Inc. UB: Union Bank USB: US Bank WBS: Webster Financial WFC: Wells Fargo & Co. WTFC: Wintrust Financial Corp. ZION: Zions Bancorporation
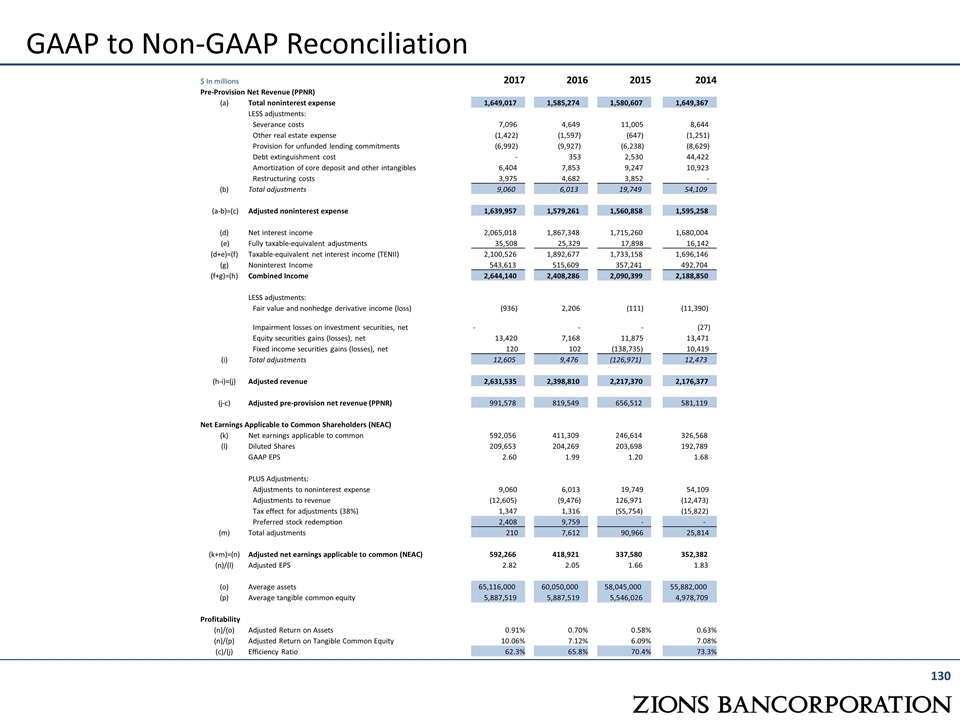
GAAP to Non-GAAP Reconciliation $ In millions 2017 2016 2015 2014 Pre-Provision Net Revenue (PPNR) (a) Total noninterest expense 1,649,017 1,585,274 1,580,607 1,649,367 LESS adjustments: Severance costs 7,096 4,649 11,005 8,644 Other real estate expense (1,422) (1,597) (647) (1,251) Provision for unfunded lending commitments (6,992) (9,927) (6,238) (8,629) Debt extinguishment cost - 353 2,530 44,422 Amortization of core deposit and other intangibles 6,404 7,853 9,247 10,923 Restructuring costs 3,975 4,682 3,852 - (b) Total adjustments 9,060 6,013 19,749 54,109 (a-b)=(c) Adjusted noninterest expense 1,639,957 1,579,261 1,560,858 1,595,258 (d) Net interest income 2,065,018 1,867,348 1,715,260 1,680,004 (e) Fully taxable-equivalent adjustments 35,508 25,329 17,898 16,142 (d+e)=(f) Taxable-equivalent net interest income (TENII) 2,100,526 1,892,677 1,733,158 1,696,146 (g) Noninterest Income 543,613 515,609 357,241 492,704 (f+g)=(h) Combined Income 2,644,140 2,408,286 2,090,399 2,188,850 LESS adjustments: Fair value and nonhedge derivative income (loss) (936) 2,206 (111) (11,390) Impairment losses on investment securities, net - - - (27) Equity securities gains (losses), net 13,420 7,168 11,875 13,471 Fixed income securities gains (losses), net 120 102 (138,735) 10,419 (i) Total adjustments 12,605 9,476 (126,971) 12,473 (h-i)=(j) Adjusted revenue 2,631,535 2,398,810 2,217,370 2,176,377 (j-c) Adjusted pre-provision net revenue (PPNR) 991,578 819,549 656,512 581,119 Net Earnings Applicable to Common Shareholders (NEAC) (k) Net earnings applicable to common 592,056 411,309 246,614 326,568 (l) Diluted Shares 209,653 204,269 203,698 192,789 GAAP EPS 2.60 1.99 1.20 1.68 PLUS Adjustments: Adjustments to noninterest expense 9,060 6,013 19,749 54,109 Adjustments to revenue (12,605) (9,476) 126,971 (12,473) Tax effect for adjustments (38%) 1,347 1,316 (55,754) (15,822) Preferred stock redemption 2,408 9,759 - - (m) Total adjustments 210 7,612 90,966 25,814 (k+m)=(n) Adjusted net earnings applicable to common (NEAC) 592,266 418,921 337,580 352,382 (n)/(l) Adjusted EPS 2.82 2.05 1.66 1.83 (o) Average assets 65,116,000 60,050,000 58,045,000 55,882,000 (p) Average tangible common equity 5,887,519 5,887,519 5,546,026 4,978,709 Profitability (n)/(o) Adjusted Return on Assets 0.91% 0.70% 0.58% 0.63% (n)/(p) Adjusted Return on Tangible Common Equity 10.06% 7.12% 6.09% 7.08% (c)/(j) Efficiency Ratio 62.3% 65.8% 70.4% 73.3%


