![]() CONFIDENTIAL Investor Presentation November 2010 It all starts here with a promise for a future that can be healthier, better and stronger than today. Copyright 2010 eDiets.com, Inc. All Rights Reserved Exhibit 99.1 |
![]() CONFIDENTIAL 2 Forward-Looking Statements Forward-Looking Statements Copyright 2010 eDiets.com, Inc. All Rights Reserved This presentation contains “forward-looking statements” within the meaning of the federal securities laws and is intended to qualify for the Safe Harbor from liability established by the Private Securities Litigation Reform Act of 1995, including statements regarding the outlook for eDiets.com’s markets, assumptions regarding the cost of acquiring customers; the ability to meet targeted revenue by segment within the next 3-5 years, that eDiets.com is well positioned to compete and capture market share, eDiet's growth strategy and business model, the timing of product launches, projected results and the demand for its products and services. These projections and statements are based on management’s estimates and assumptions with respect to future events and financial performance and are believed to be reasonable, though are inherently uncertain and difficult to predict. Actual results could differ materially from those projected as a result of certain factors, including eDiets.com’s ability to raise additional capital through a private placement or public offering of its common stock or securities convertible into its common stock, or through a sale of strategic or non-strategic assets; its ability to improve its meal delivery margin and its effect on total gross margins; fluctuations in advertising costs; its ability to sufficiently increase its revenues and maintain expenses and cash capital expenditures at appropriate levels; the state of the credit markets and capital markets, including the level of volatility, illiquidity and interest rates; eDiets.com's ability to rapidly secure alternate technology infrastructure vendors if it experiences Web site service interruption; and its ability to maintain compliance with applicable regulatory requirements. A discussion of factors that could cause results to vary is included in the Company’s filings with the Securities and Exchange Commission. All forward-looking statements in this presentation speak only as of the date of this presentation. The Company expressly disclaims any obligation or undertaking to update or revise any forward-looking statements. This presentation also contains non-GAAP financial measures. For a reconciliation of the non-GAAP measures to the most comparable GAAP measure, please refer to the eDiets.com website at www.ediets.com, under the Events and Presentation section of the Investor Relations page. |
![]() CONFIDENTIAL 3 Company Overview Company Overview • Diet Plans – Award winning diet meal delivery program providing weekly fresh prepared meals • Estimated market size: $1.0 billion annually for home delivery of diet food; $350 million market in our price range – State of the art digital diet program including menus, recipes, shopping lists and tools • Estimated market size: $250 million annually • Corporate Services – White label corporate wellness sites focused on diets and diet- related tools • Estimated market size: $50-$100 million annually Copyright 2010 eDiets.com, Inc. All Rights Reserved Market estimates made by eDiets based on data from MarketData 2007 survey |
![]() CONFIDENTIAL 4 Key Facts Key Facts Copyright 2010 eDiets.com, Inc. All Rights Reserved Symbol DIET Corporate Headquarters Ft. Lauderdale, FL Stock Price 11/18/10 || 52-week Range $0.68 || $0.47 - $2.00 Shares Outstanding (11/18/10) 57,418,520 Market Capitalization (11/18/10) $39,044,594 Volume (daily 30 day average at 11/18/10)) 18,150 Debt (09/30/10) $0.0 Cash (09/30/10) $900,000 Revenue TTM (09/30/10) $20,333,000 Net Loss TTM (09/30/10) 1 $(45,294,767) EBITDA TTM (09/30/10) $(7,454,000) Insider Ownership 5.8% Institutional Ownership Shares 2.4% Full Time Employees 70 Fiscal Year December 31 Accounting Firm Ernst & Young 1 Net Loss TTM reflects non-cash charges for goodwill impairment and the debt conversion |
![]() CONFIDENTIAL 5 Management Team Management Team Copyright 2010 eDiets.com, Inc. All Rights Reserved Name Title Previous Experience Kevin McGrath CEO DIRECTV, Co-Founder DIRECTV Latin America, Chairman & CEO Digital Angel, President & CEO General Motors Electronic Data Systems Hughes Communications Dartmouth, MBA Princeton, BA Thomas Hoyer CFO Digital Angel, CFO Nationsrent Companies, CFO GLOBEquip, CFO Fluor Corporation Clemson, MBA, BS Joseph Leonardo VP, Meal Delivery EPI Bregos, VP Operations Meyers Bakeries, VP Operations & Logistics Edwards Fine Foods, VP Manufacturing Quaker Oats Cornell, BS |
![]() CONFIDENTIAL 6 Markets Markets • Over 72 million people are estimated to be dieting – Aging population will increase this population for years to come – Growing diabetic population, estimated at 23 million, further grows the target market • Dieting products and services provide a necessary aid and convenience to healthy dieting – Typical dieters on our plans lose 1 to 2 pounds per week • The market for weight loss products averaged 7%-8% growth per year in the middle of the decade – Recession has slowed growth in market but should return to historical pattern as economy recovers • Barriers to market are significant – These include brand recognition and reputation, direct response television and internet marketing skills, expertise in meal creation and fulfillment, expertise in nutritional design of diets, and capital Copyright 2010 eDiets.com, Inc. All Rights Reserved Market estimates and dieting population estimate based on data from MarketData 2007 survey |
![]() CONFIDENTIAL 7 Revenue By Segment Revenue By Segment Copyright 2010 eDiets.com, Inc. All Rights Reserved Online Diet Plans 28% Home Meal Delivery 43% Corporate Services 22% Other 7% Target* 2009 Actual Online Diet Plans 15% Home Meal Delivery 74% Corporate Services 7% Other 4% * Management believes this target can be achieved within the next 3-5 years. |
![]() CONFIDENTIAL 8 Copyright 2010 eDiets.com, Inc. All Rights Reserved Meal Delivery - Meal Delivery - Overview Overview • Healthy, delicious meals delivered to your door • Offers both 5-day ($21.99/day) and 7-day plans ($19.99/day) • Over 100 different meals freshly prepared by our chefs Meal Delivery LTM 09/30/2010 Revenue $12.5 Million Shipments Per Week 1,900 Gross Margin 1,2 39% Adjusted EBITDA Margin 1,2 -27% ¹ Excludes depreciation and revenue share 2 The reconciliation for these non-GAAP measures are on our website Est. $350M Meal Delivery Market at our Price Level Significant Market Opportunity |
![]() CONFIDENTIAL 9 Meal Delivery Opportunity Meal Delivery Opportunity • Large market • Significant revenue growth driven by increased advertising • Improved gross margin • Improved customer retention Copyright 2010 eDiets.com, Inc. All Rights Reserved |
![]() CONFIDENTIAL 10 Copyright 2010 eDiets.com, Inc. All Rights Reserved Online Diet Plans - Online Diet Plans - Overview Overview • Offers a personalized fitness and eating plan designed by dietitians and personal trainers • Live 24 hour / 7 day support by certified and registered dietitians • Online community and motivating member challenges • Subscription cost – $17.96 per month or $149.95 per year (annual plan) • Offers plans that are tailored for individual needs including diabetic, hypoglycemic, high fiber, vegetarian, lactose-free and many more Diet Plans LTM 09/30/2010 Revenue $4.1 Million Subscribers 18,000 Gross Margin 1,2 92% EBITDA Margin 1,2 26% Est. $250M Total Online Diet Market Large Addressable Market ¹ Excludes depreciation and revenue share 2 The reconciliation for these non-GAAP measures are on our website |
![]() CONFIDENTIAL 11 Copyright 2010 eDiets.com, Inc. All Rights Reserved Business Model – Business Model – Online Diet Plans Online Diet Plans * Sample Better Retention Improves Customer Business Model Retention* 6 Months 8 Months Average Revenue Per Customer $ 104 $ 139 Cost of Goods $ (8) $ (11) Margin Before Customer Acquisition Cost $ 96 $ 128 Revenue Share (1.2%) $ (1) $ (2) Customer Acquisition Cost $ (43) $ (50) Net Cash Flow $ 52 $ 76 Cash Flow Margin 50.0% 54.7% * Retention based on active customer pool * Investments in advertising for Online Diet Plans cycles 4 times per year |
![]() CONFIDENTIAL 12 Online Store Online Store • Launched new store in August 2009 • Store is being integrated into sales process for home- delivered meals and online weight loss • Opportunity – Cross sell new customers, re-sell current customers – Recurring revenue stream – High margins on supplements Copyright 2010 eDiets.com, Inc. All Rights Reserved |
![]() CONFIDENTIAL 13 Copyright 2010 eDiets.com, Inc. All Rights Reserved Corporate Services - Corporate Services - Overview Overview • White-label online nutrition and fitness plans for corporate clientele • Offers website design & hosting capabilities • Powering some of the largest brands in health & wellness • Clients mainly comprised of Fortune 500 businesses • Exploring opportunities to monetize this division Revenue by Client Type Corporate Services LTM 09/30/2010 Revenue $2.8 Million Gross Margin 1,2 95% EBITDA Margin 1,2 26% ¹ Excludes depreciation and revenue share 2 The reconciliation for these non-GAAP measures are on our website |
![]() CONFIDENTIAL 14 Competitive Landscape Competitive Landscape Meal Delivery Online Diet Plan Advertising eCommerce Retail Licensing B2B eDiets.com Meal Delivery NutriSystem Jenny Craig Medifast Other Weight Watchers SlimFast Spark People WebMD Everyday Health Nutrihand eDiets is well-positioned to compete and capture market share eDiets is well-positioned to compete and capture market share Copyright 2010 eDiets.com, Inc. All Rights Reserved |
![]() CONFIDENTIAL 15 Key Relationships Key Relationships Copyright 2010 eDiets.com, Inc. All Rights Reserved Whitsons Meal Plan Manufacturer iMarketing Internet Marketing cMedia Television Marketing FedEx / UPS Meal Delivery Shipper NBC/Reveille Biggest Loser Licensor |
![]() CONFIDENTIAL 16 Capitalization Capitalization Copyright 2010 eDiets.com, Inc. All Rights Reserved Note: In November 2010, three company insiders invested a total of $1.0 million in exchange for promissory notes which will constitute debt 30-Sep-10 Equity (100,000,000 authorized) Issued Shares Strike Price Fully Diluted Common Stock 57,418,520 57,418,520 Warrants $1.20 1,689,370 Options $2.36 5,066,084 Restricted Stock Units 499,000 Total 64,672,974 Debt Principal Balance $ - |
![]() CONFIDENTIAL 17 Historical Income Statement Historical Income Statement Copyright 2010 eDiets.com, Inc. All Rights Reserved Year Ended December 31, Year-to-Date 2007 2008 2009 Q3-2010 REVENUE Digital Plans $ 19,482 $ 9,345 $ 4,970 $ 2,970 Meal Delivery 3,994 9,405 7,839 10,836 Business-to-business 2,573 3,646 4,054 1,987 Other 3,680 1,539 1,245 674 TOTAL REVENUE 29,729 23,935 18,108 16,467 COSTS AND EXPENSES Cost of Revenue Digital Plans 3,112 2,610 863 421 Meal Delivery 3,665 9,358 5,912 7,123 Business-to-business 200 136 198 95 Other 245 321 236 142 Total cost of revenue 7,222 12,425 7,209 7,781 Technology and development 3,723 4,297 3,710 2,410 Sales, marketing and support 17,029 11,664 8,896 10,852 General and administrative 6,984 6,070 4,882 3,636 Amortization of intangible assets 1,213 882 295 27 Impairment of goodwill and intangible assets 2,296 5,191 - 6,865 Total costs and expenses 38,467 40,529 24,992 31,571 Loss from operations (8,738) (16,594) (6,884) (15,104) Interest Income 282 109 11 2 Interest Expense (781) (3,357) (5,170) (2,733) Interest expense incurred wih debt conversion - - - (23,961) Loss on extinguishment of related party debt - - - (213) Loss before income tax provision (9,237) (19,842) (12,043) (42,009) Income tax provision (171) (6) (18) 1 Net loss $ (9,408) $ (19,848) $ (12,061) $ (42,008) EBITDA $ (2,270) $ (7,452) $ (3,349) $ (6,214) Note: In November 2010, three company insiders invested a total of $1.0 million in exchange for promissory notes which will constitute debt |
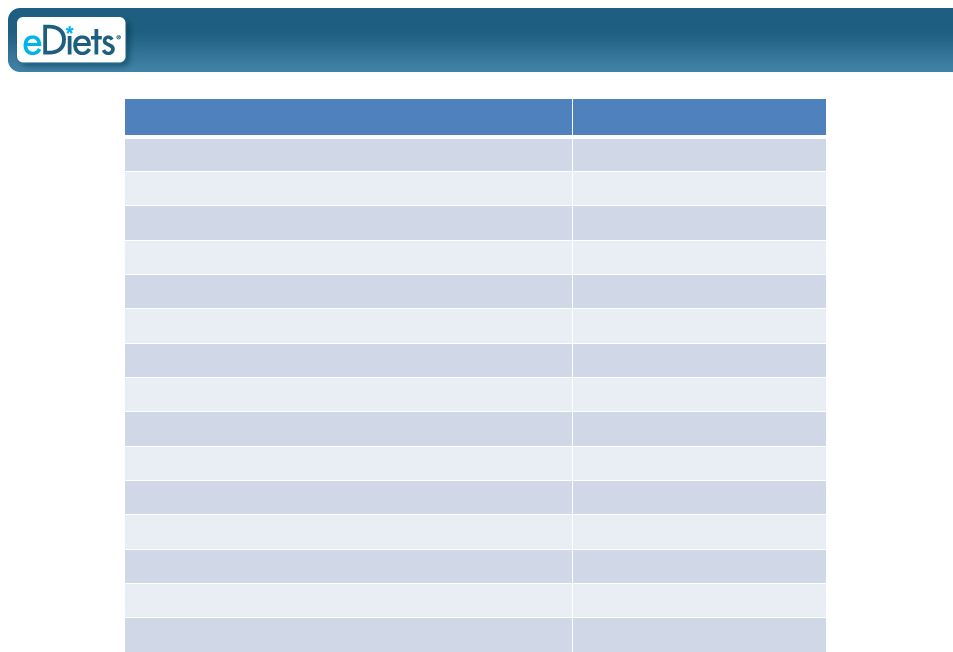
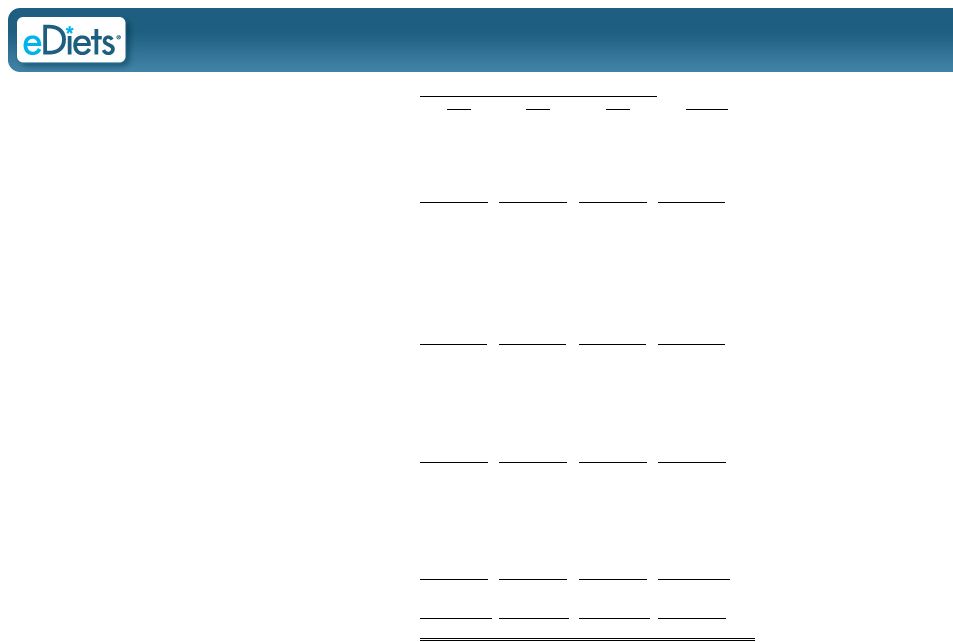
![]() CONFIDENTIAL 18 Historical Balance Sheet Historical Balance Sheet Copyright 2010 eDiets.com, Inc. All Rights Reserved December 30, December 30, December 30, September 30, 2007 2008 2009 2010 CURRENT ASSETS Cash and cash equivalents $ 7,132 $ 2,523 $ 1,475 $ 900 Accounts receivable, net 1,178 574 546 346 Prepaid advertising costs 321 18 - - Prepaid meal delivery and inventory 270 497 359 220 Prepaid expenses and other current assets 493 437 264 722 Total current assets 9,394 4,049 2,644 2,188 Restricted Cash 1,174 544 544 720 Property and office equipment, net 3,633 3,665 2,185 1,452 Intangible assets, net 1,209 334 47 7 Goodwill 12,026 6,835 6,835 - Other assets 255 244 201 41 Total assets $ 27,691 $ 15,671 $ 12,456 $ 4,408 CURRENT LIABILITIES Accounts payable $ 1,339 $ 1,410 $ 1,117 $ 2,040 Accrued liabilities 2,797 1,748 1,855 1,412 Current portion of capital lease obligations 479 83 23 20 Deferred revenue 1,674 1,612 1,242 1,317 Senior secured note, net - related party - - 11,959 - Total current liabilities 6,289 4,853 16,196 4,789 Capital lease obligations, net of current portion 303 67 43 28 Deferred revenue 1,990 1,724 922 438 Senior secured notes, net - related party 6,247 11,808 4,865 - STOCKHOLDERS' DEFICIT Common Stock 25 25 29 57 Additional paid-in capital 41,191 45,307 50,596 101,207 Accumulated other comprehensive loss (150) (61) (82) 10 Accumulated deficit (28,204) (48,052) (60,113) (102,121) Total stockholders' deficit 12,862 (2,781) (9,570) (847) Total liabilities and stockholders' deficit $ 27,691 $ 15,671 $ 12,456 $ 4,408 Note: In November 2010, three company insiders invested a total of $1.0 million in exchange for promissory notes which will constitute debt |
![]() CONFIDENTIAL 19 Growth Strategy Growth Strategy 1. Meal Delivery • High cash velocity = relatively low investment • Rapidly grow meal delivery • Achieve positive EBITDA and cash flow 2. Online Weight Loss • Leverage meal delivery infrastructure (IT platform, call center, TV advertising) to grow online subscription business • Leverage meal delivery TV advertising to keep CPA low and returns high 3. Health/Wellness Services for Companies • Build broad-based health wellness platform based on meal delivery, online programs and website design/support; • combine with other services developed in-house and through partnerships or acquisitions to build comprehensive health/wellness services targeted at reducing companies’ healthcare expenses – Exploring opportunities to monetize this division Copyright 2010 eDiets.com, Inc. All Rights Reserved |
![]() CONFIDENTIAL 20 Customer Acquisition Cost Strategy Customer Acquisition Cost Strategy Blended Meal Delivery and Online Digital Customer Acquisition Costs Copyright 2010 eDiets.com, Inc. All Rights Reserved As meal delivery has grown in the revenue mix, the blended cost of acquisition has increased because meal delivery acquisition costs are higher than the cost of acquiring digital customers |
![]() CONFIDENTIAL 21 Customer Retention Customer Retention Meal Delivery Online Focused on issues which negatively impacted retention: • Physical state of meals upon receipt by customer • Temperature of cooler upon delivery • Involuntary menu substitutions • On-time delivery Focused on issues which negatively impacted retention: • Restored tools such as editable shopping lists • Implemented better program introduction • Instituted low-cost “customer save” campaigns • Implemented an annual plan Copyright 2010 eDiets.com, Inc. All Rights Reserved |
![]() CONFIDENTIAL 22 92% 95% 93% 91% 91% 92% 93% 89% 90% 91% 92% 93% 94% 95% 96% Q1-09 Q2-09 Q3-09 Q4-09 Q1-10 Q2-10 Q3-10 Meal Delivery Gross Margin Before Depreciation and CAC (Excludes Revenue Share) Online Subscription Gross Margin Before Depreciation and CAC (Excludes Revenue Share) Improved Gross Margins Improved Gross Margins • Raised price of meal delivery service • Moved to lower-cost manufacturer • Negotiated lower shipping rates • Stabilized IT platform; reduced customer attrition Copyright 2010 eDiets.com, Inc. All Rights Reserved 30% 35% 37% 35% 40% 39% 41% 0% 5% 10% 15% 20% 25% 30% 35% 40% 45% Q1-09 Q2-09 Q3-09 Q4-09 Q1-10 Q2-10 Q3-10 |
![]() ![]() ![]() CONFIDENTIAL 23 Meal Delivery Revenue By Quarter Meal Delivery Revenue By Quarter $1,907 $2,289 $1,945 $1,698 $2,997 $3,526 $4,313 Q109 Q209 Q309 Q409 Q110 Q210 Q310E Q410 Q111 Q211 Copyright 2010 eDiets.com, Inc. All Rights Reserved Focused on growing the meal delivery business with good results Launched Biggest Loser Meal Program Launch Value Plan Launch Men’s Plan |
![]() CONFIDENTIAL 24 Improving the Revenue/Ad Spend Ratio Improving the Revenue/Ad Spend Ratio • Hired new media purchasing firm to improve auction bidding and ad placement processes (March 2010) • Shifted focus from web sales to call center sales (April 2010) • Upgraded email capabilities to improve remarketing (June 2010) • Developed new TV ads (August 2010) • Add “value plan” to product lineup to increase conversion (January 2011) • Pursuing low cost/no cost opportunities for media exposure (Shop NBC, Revshare, PR) Copyright 2010 eDiets.com, Inc. All Rights Reserved |
![]() CONFIDENTIAL 25 $3.0 Million Investment in Advertising $3.0 Million Investment in Advertising (assume advertising investment turns 10X annually) (assume advertising investment turns 10X annually) Copyright 2010 eDiets.com, Inc. All Rights Reserved Meal Delivery Business Model $ Millions Ad Spend Scenarios (TV + Online) $30.0 $30.0 $30.0 $30.0 Revenue/Ad Spend Ratio (revenue / advertising) 2.00 2.50 3.00 4.00 Implied Revenue 60.0 75.0 90.0 120.0 Variable Cost of Food and Fulfillment 52.0% (31.2) (39.0) (46.8) (62.4) Variable Cost of Acquisition Advertising 25% - 50% (30.0) (30.0) (30.0) (30.0) Call Center, Promotions 7.5% (4.5) (5.6) (6.8) (9.0) Fixed Cost of Staff and Other Expense (0.6) (0.6) (0.6) (0.6) EBITDA ($6.3) ($0.2) $5.9 $18.0 EBITDA Margin -10.5% -0.3% 6.5% 15.0% Ad Spend Working Capital Investment Required, assuming 10 turns per year $3.0 $3.0 $3.0 $3.0 |
![]() CONFIDENTIAL 26 Investment Highlights Investment Highlights • $60 billion weight loss market – eDiets markets comprise approximately $1.4 billion of total • Growth strategy – focus on meal delivery – Significantly grow meal delivery business in 2011 by expanding and increasing TV ad spending – Tolerate high customer acquisition cost to achieve critical mass customer base – Eventually allow customer acquisition cost to settle into profitable range – Improve gross margins through shipping cost reductions, volume discounts on food, and a price increase – Target sustainable positive EBITDA and cash flow in 2012 – Key drivers are meal delivery margins, retention and customer acquisition cost • A meal delivery company with $100 million in sales could achieve 5-15% EBITDA margins in steady-state Copyright 2010 eDiets.com, Inc. All Rights Reserved |
![]() CONFIDENTIAL 27 Next Steps Next Steps • Order your free sample of food • Key vendor calls (we’ll provide contact information for our key advertisers and food manufacturer) • Meetings with management and review of detailed forecast (upon signing non- disclosure agreement) Copyright 2010 eDiets.com, Inc. All Rights Reserved 27 |
![]() Copyright 2010 eDiets.com, Inc. All Rights Reserved ************************** ************************** ************************** ************************** ************************** ************************** ************************** **************** |