
Analyst Day 2017 Welcome Mike Sheaffer
Safe Harbor This presentation contains forward-looking statements within the meaning of the Private Securities Litigation Reform Act of 1995 (the “Act”) which include Rudolph’s business momentum and future growth; the benefit to customers of Rudolph’s products and customer service; Rudolph’s ability to both deliver products and services consistent with our customers’ demands and expectations and strengthen its market position; Rudolph’s expectations regarding semiconductor market outlook; as well as other matters that are not purely historical data. Rudolph wishes to take advantage of the “safe harbor” provided for by the Act and cautions that actual results may differ materially from those projected as a result of various factors, including risks and uncertainties, many of which are beyond Rudolph’s control. Such factors include, but are not limited to, the Company’s ability to leverage its resources to improve its position in its core markets; its ability to weather difficult economic environments; its ability to open new market opportunities and target high-margin markets; the strength/weakness of the back-end and/or front-end semiconductor market segments; and fluctuations in customer capital spending. Additional information and considerations regarding the risks faced by Rudolph are available in Rudolph’s Form 10-K report for the year ended December 31, 2016 and other filings with the Securities and Exchange Commission. As the forward-looking statements are based on Rudolph’s current expectations, the Company cannot guarantee any related future results, levels of activity, performance or achievements. Rudolph does not assume any obligation to update the forward-looking information contained in this presentation. 2

Agenda 9:30 a.m. Welcome Mike Sheaffer 9:35 a.m. Introduction and Achievements Mike Plisinski 9:50 a.m. Core Markets Update and OLED Update Elvino da Silveira 10:10 a.m. Growth in Lithography for Packaging Rich Rogoff 10:25 a.m. Growth Impact of New Inspection Products Mike Goodrich 10:40 a.m. Software Group Update Thomas Sonderman 10:50 a.m. Break / Technology Row 11:15 a.m. Financial Model Update Steven Roth 11:30 a.m. Q&A Panel 11:45 a.m. Closing Remarks Mike Plisinski 11:50 a.m. Lunch 3

Introductions and Achievements Mike Plisinski, CEO
Welcome! 5 TECHNOLOGY ROW MARKET DRIVERS OLED UPDATE FINANCIAL MODEL Q&A BUSINESS UNITS Secular growth continues! Solutions that matter! Pace of innovation to increase pace of growth! Relentless focus on shareholder returns!
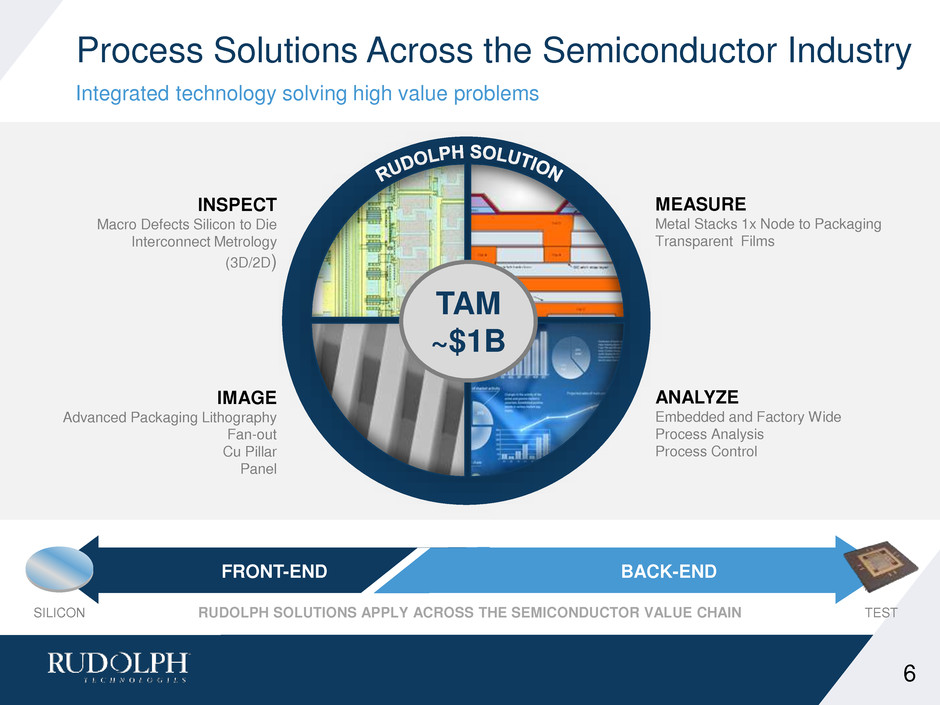
Process Solutions Across the Semiconductor Industry Integrated technology solving high value problems 6 INSPECT Macro Defects Silicon to Die Interconnect Metrology (3D/2D) IMAGE Advanced Packaging Lithography Fan-out Cu Pillar Panel MEASURE Metal Stacks 1x Node to Packaging Transparent Films ANALYZE Embedded and Factory Wide Process Analysis Process Control FRONT-END BACK-END SILICON RUDOLPH SOLUTIONS APPLY ACROSS THE SEMICONDUCTOR VALUE CHAIN TEST TAM ~$1B
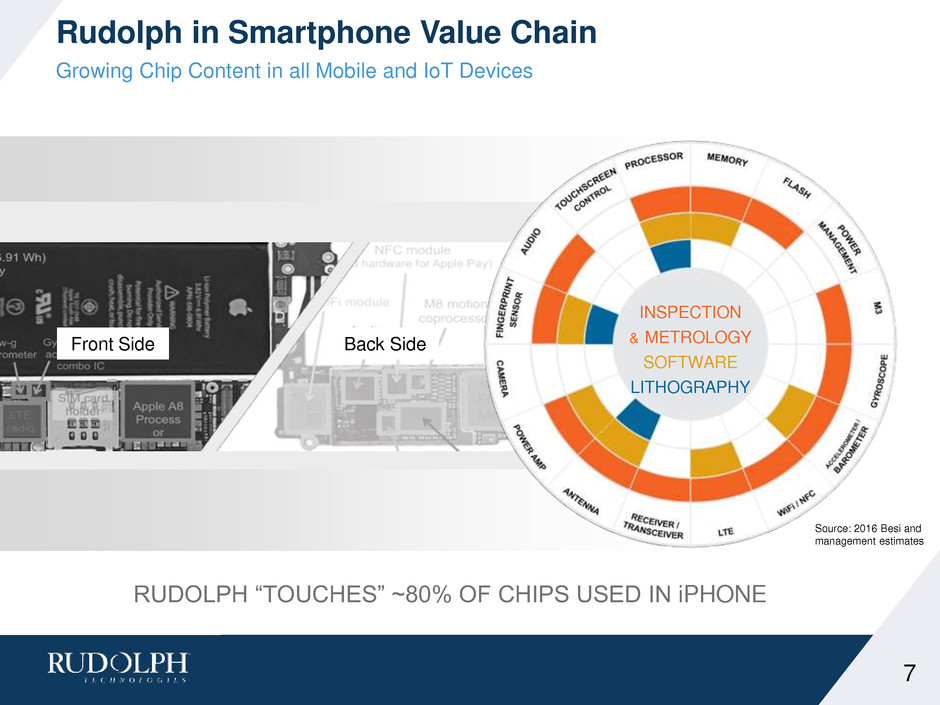
Rudolph in Smartphone Value Chain Growing Chip Content in all Mobile and IoT Devices 7 Front Side INSPECTION & METROLOGY SOFTWARE LITHOGRAPHY Back Side RUDOLPH “TOUCHES” ~80% OF CHIPS USED IN iPHONE Source: 2016 Besi and management estimates

Rudolph’s Diversified Growth Drivers Sustainable growth derived from multiple end markets 8 2018 CapEx: a Record $58B Source: SEMI WW Forecast 9/17 Server Cloud Internet of Things AutomotiveMobility Multiplier from the >20B IoT Devices predicted by 2020… Source: Gartner, 2017
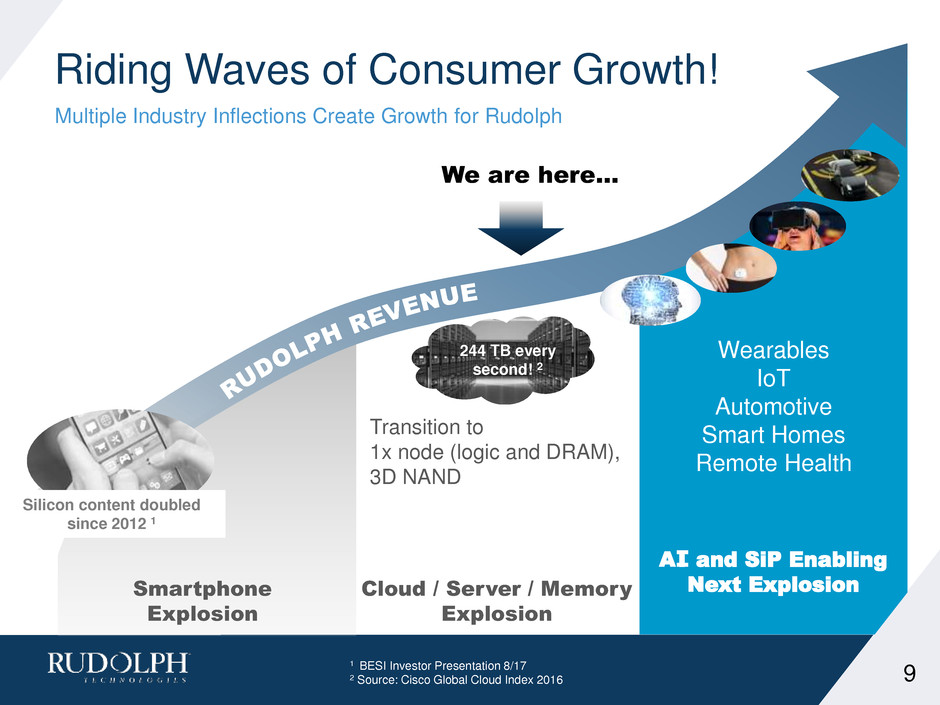
Riding Waves of Consumer Growth! Multiple Industry Inflections Create Growth for Rudolph Transition to 1x node (logic and DRAM), 3D NAND Smartphone Explosion Wearables IoT Automotive Smart Homes Remote Health Cloud / Server / Memory Explosion Silicon content doubled since 2012 1 244 TB every second! 2 We are here… AI and SiP Enabling Next Explosion 9 1 BESI Investor Presentation 8/17 2 Source: Cisco Global Cloud Index 2016
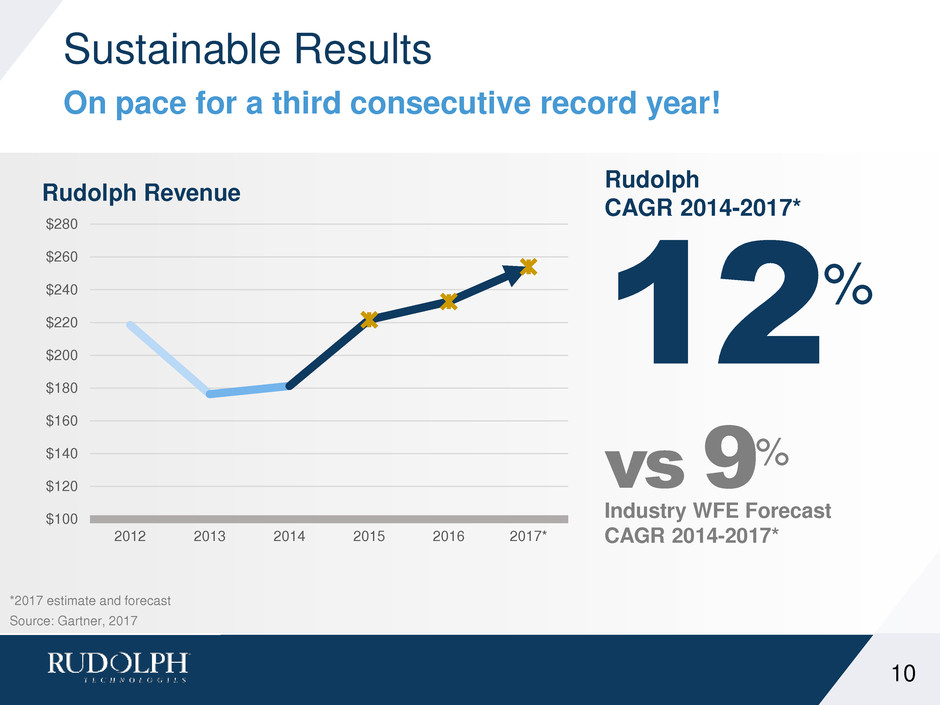
Sustainable Results On pace for a third consecutive record year! 10 $100 $120 $140 $160 $180 $200 $220 $240 $260 $280 2012 2013 2014 2015 2016 2017* Rudolph Revenue Source: Gartner, 2017 *2017 estimate and forecast 12% Rudolph CAGR 2014-2017* Industry WFE Forecast CAGR 2014-2017* vs 9%

Sustainable Results Driving profitability to fuel growth! 11 43.7% CAGR $0 $5,000 $10,000 $15,000 $20,000 $25,000 $30,000 $35,000 $40,000 2013 2014 2015 2016 2017* Operating Income and Net Income (Non-GAAP) * Based on Analyst Estimates More Improvements Ahead! with 12% Revenue CAGR
Increasing the Pace of Innovation Increases our pace of growth 0 1 2 3 4 2012 2013 2014 2015 2016 2017* New Product Releases are Increasing! New Pace 3-4 products annually Old Pace 1-2 products annually 12
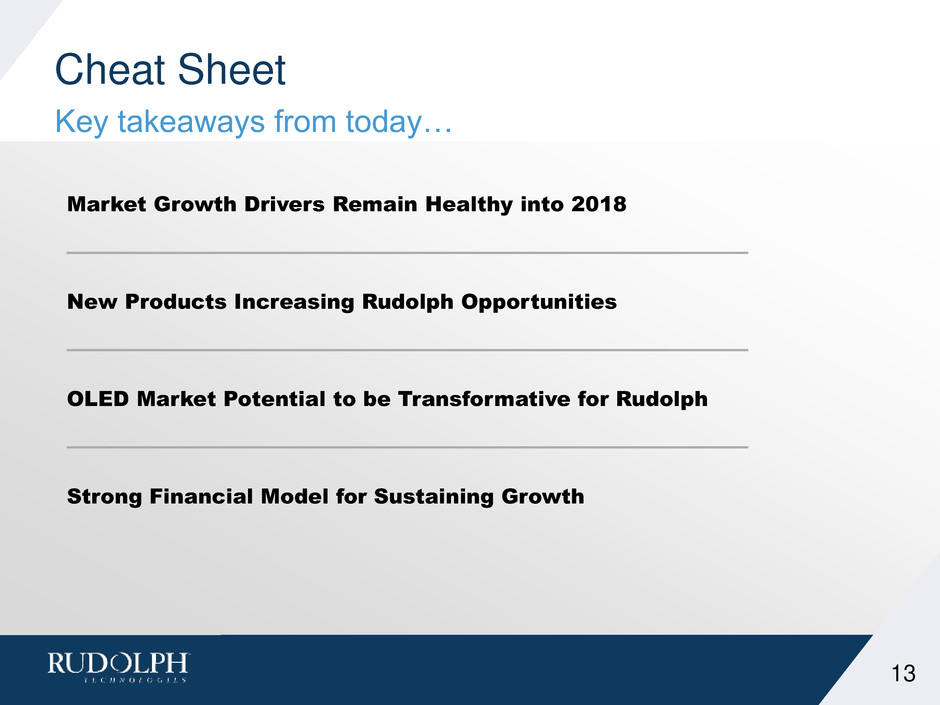
Cheat Sheet Key takeaways from today… Market Growth Drivers Remain Healthy into 2018 New Products Increasing Rudolph Opportunities OLED Market Potential to be Transformative for Rudolph Strong Financial Model for Sustaining Growth 13
Agenda 9:30 a.m. Welcome Mike Sheaffer 9:35 a.m. Introduction and Achievements Mike Plisinski 9:50 a.m. Core Markets Update and OLED Update Elvino da Silveira 10:10 a.m. Growth in Lithography for Packaging Rich Rogoff 10:25 a.m. Growth Impact of New Inspection Products Mike Goodrich 10:40 a.m. Software Group Update Thomas Sonderman 10:50 a.m. Break / Technology Row 11:15 a.m. Financial Model Update Steven Roth 11:30 a.m. Q&A Panel 11:45 a.m. Closing Remarks Mike Plisinski 11:50 a.m. Lunch 14
Core Markets Update OLED Update Elvino da Silveira
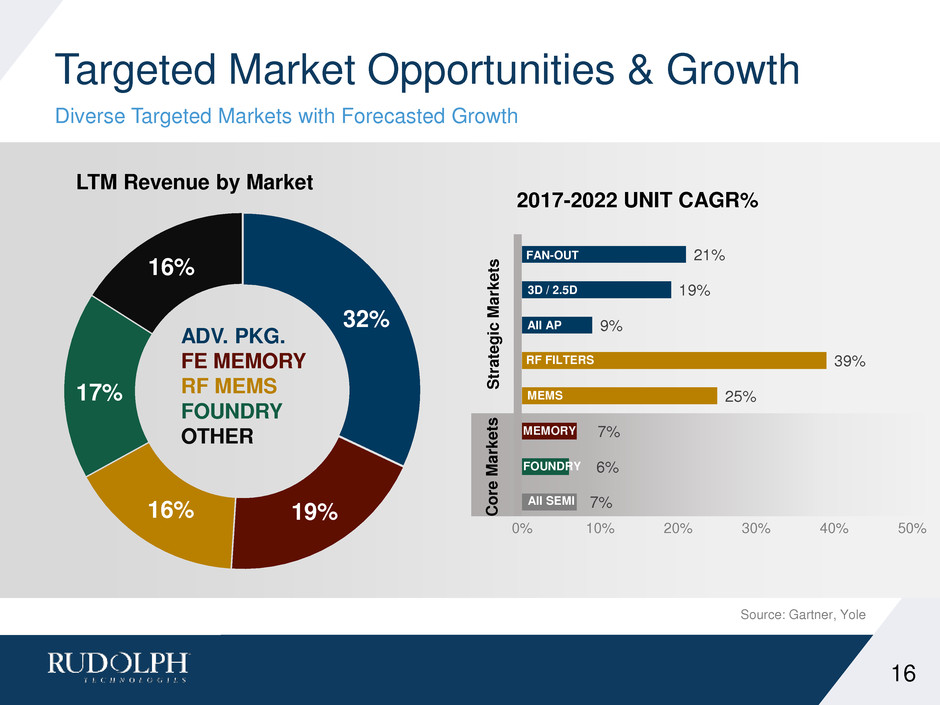
Targeted Market Opportunities & Growth Diverse Targeted Markets with Forecasted Growth 16 32% ADV. PKG. FE MEMORY RF MEMS FOUNDRY OTHER 7% 6% 7% 25% 39% 9% 19% 21% 0% 10% 20% 30% 40% 50% 2017-2022 UNIT CAGR% All SEMI 3D / 2.5D RF FILTERS MEMS FOUNDRY FAN-OUT All AP Source: Gartner, Yole MEMORY 16% 17% 16% 19% LTM Revenue by Market S trat e gi c M a rk e ts C o re M a rk e ts
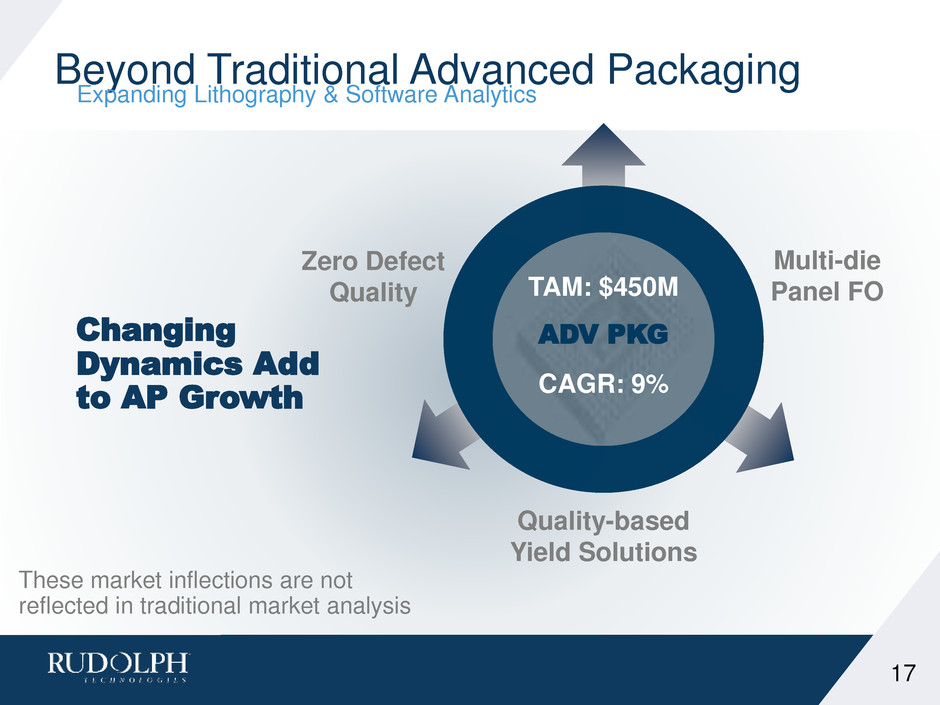
Beyond Traditional Advanced Packaging Expanding Lithography & Software Analytics TAM: $450M ADV PKG CAGR: 9% Multi-die Panel FO Quality-based Yield Solutions Zero Defect Quality Changing Dynamics Add to AP Growth These market inflections are not reflected in traditional market analysis 17
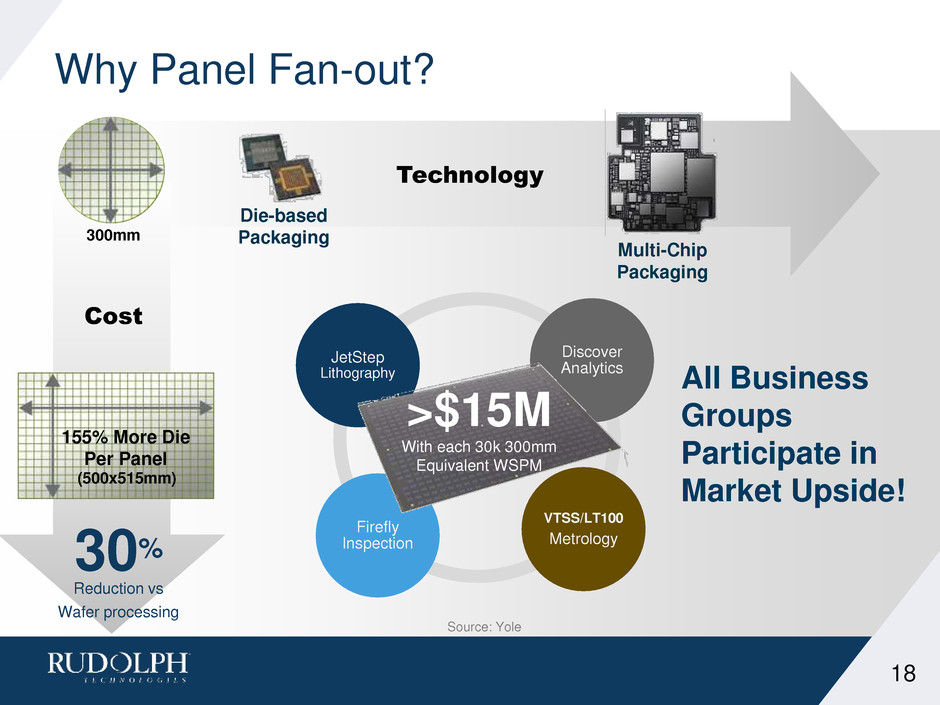
30% Reduction vs Wafer processing 300mm (500x515mm) 155% More Die Per Panel Why Panel Fan-out? Multi-Chip Packaging Die-based Packaging Source: Yole JetStep Lithography Discover Analytics VTSS/LT100 Metrology Firefly Inspection All Business Groups Participate in Market Upside! Technology Cost >$15M With each 30k 300mm Equivalent WSPM 18
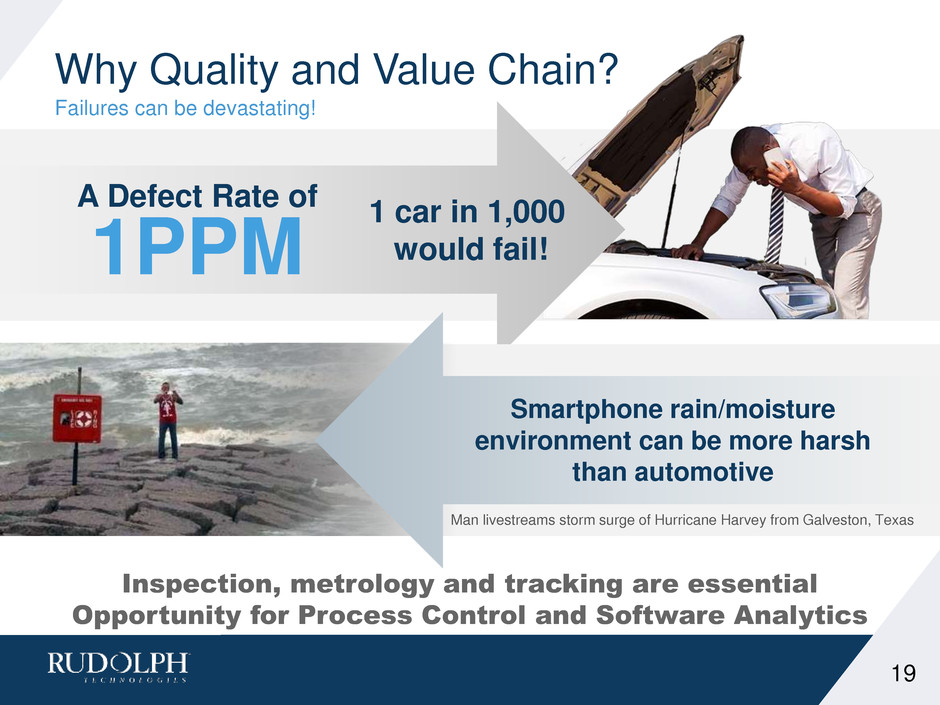
Why Quality and Value Chain? Failures can be devastating! A Defect Rate of 1PPM 1 car in 1,000 would fail! Smartphone rain/moisture environment can be more harsh than automotive Man livestreams storm surge of Hurricane Harvey from Galveston, Texas 19 Inspection, metrology and tracking are essential Opportunity for Process Control and Software Analytics
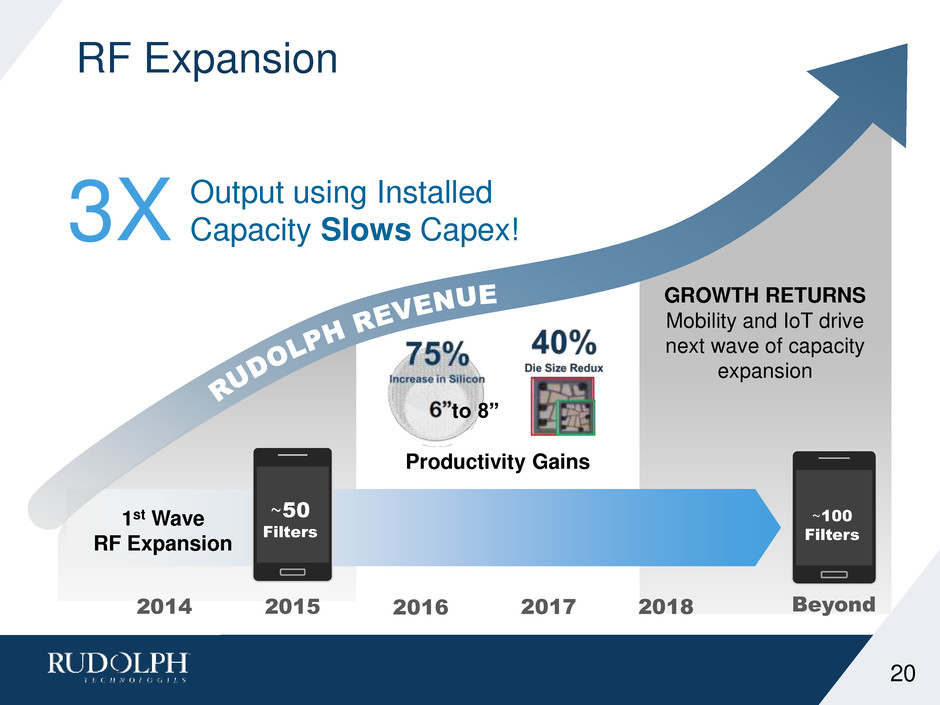
RF Expansion 20 2014 2015 2016 2017 2018 Beyond Output using Installed Capacity Slows Capex! 1st Wave RF Expansion GROWTH RETURNS Mobility and IoT drive next wave of capacity expansion Filters ~100 Filters ~50 Filters Productivity Gains 3X to 8”

Growth in the RF Supply Chain Src: Akoustis, Management estimates RF Supply Chain 8 RF Filters Power 50% Increase in Customer Adoption between ’15-’17
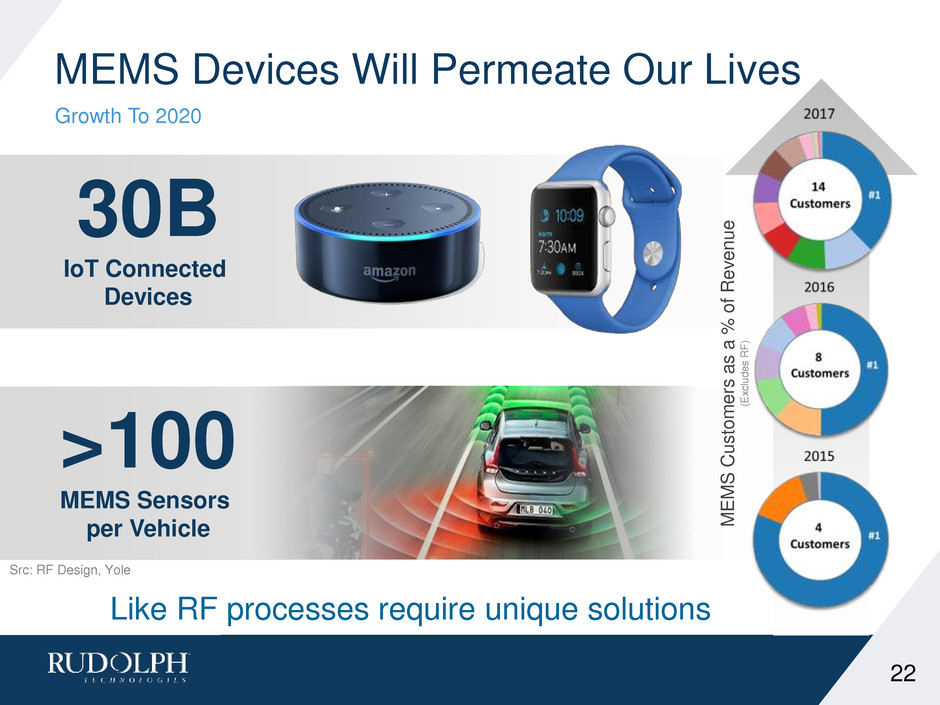
MEMS Devices Will Permeate Our Lives Growth To 2020 M E M S C u s to m er s a s a % o f R e venu e (E xc lu d e s R F ) 30B IoT Connected Devices >100 MEMS Sensors per Vehicle 22 Src: RF Design, Yole Like RF processes require unique solutions

Building Up the Model AMOLED opportunity 23
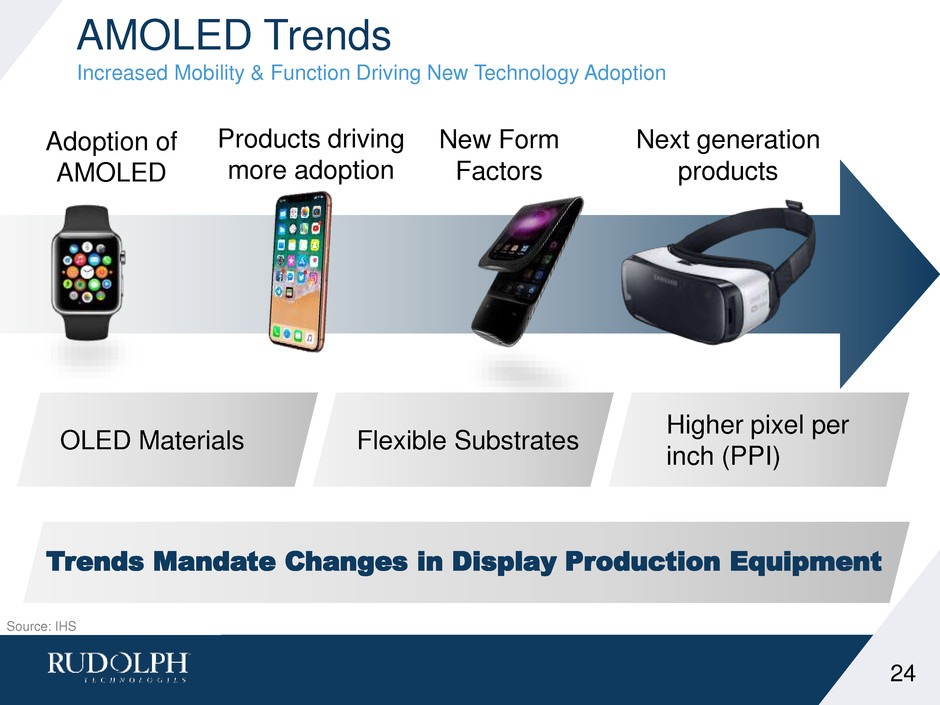
AMOLED Trends Increased Mobility & Function Driving New Technology Adoption Higher pixel per inch (PPI) OLED Materials Flexible Substrates Source: IHS Trends Mandate Changes in Display Production Equipment Adoption of AMOLED Products driving more adoption Next generation products New Form Factors 24
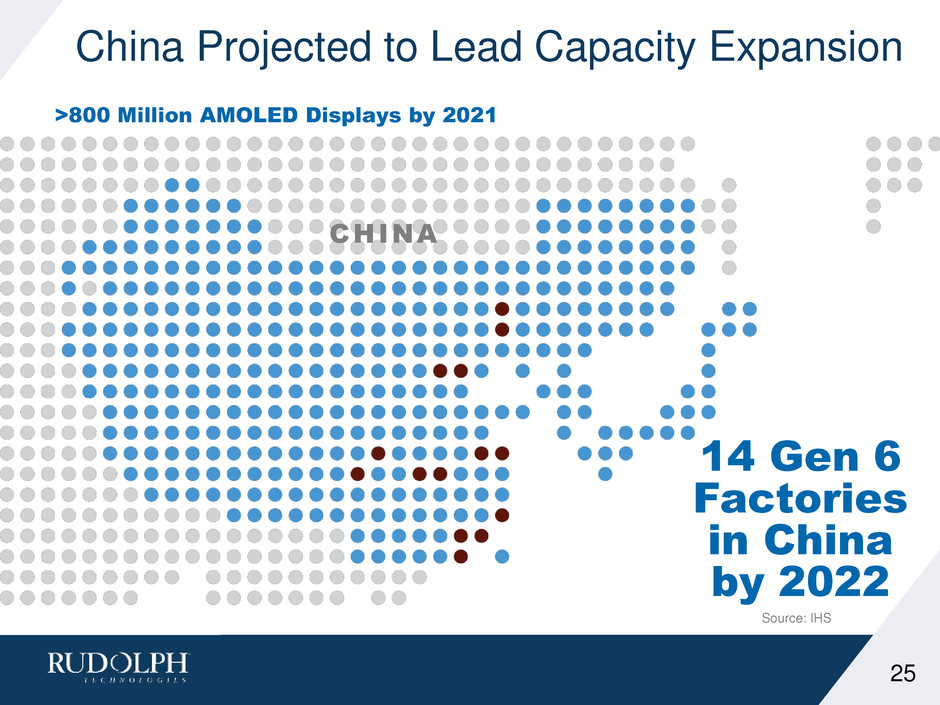
China Projected to Lead Capacity Expansion 25 CHINA Source: IHS 14 Gen 6 Factories in China by 2022 >800 Million AMOLED Displays by 2021
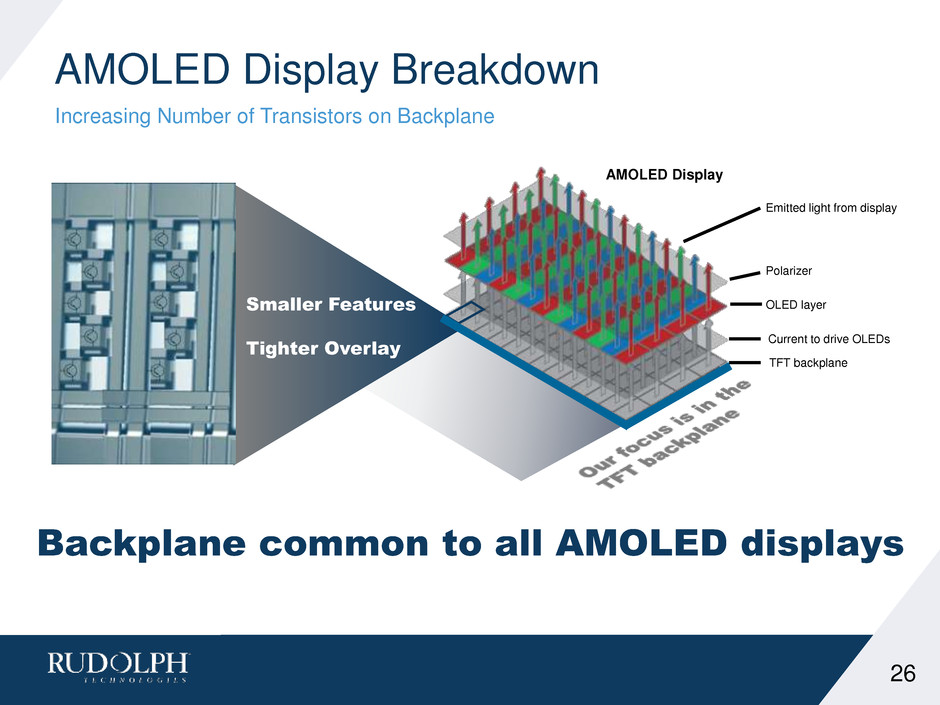
AMOLED Display Breakdown Increasing Number of Transistors on Backplane 26 AMOLED Display Emitted light from display Polarizer OLED layer Current to drive OLEDs TFT backplane Backplane common to all AMOLED displays Smaller Features Tighter Overlay
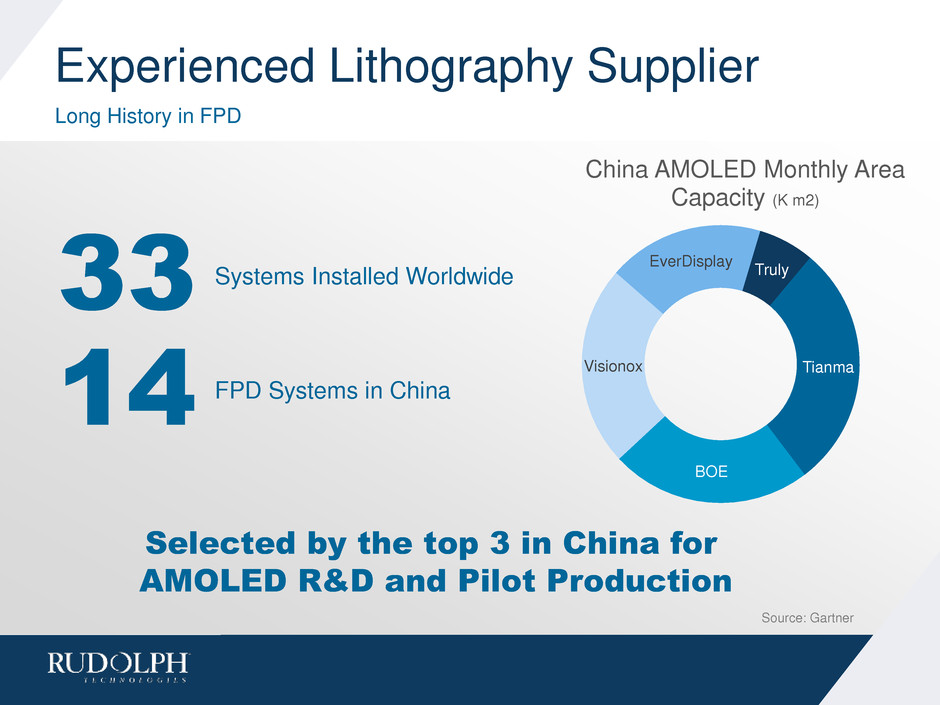
Experienced Lithography Supplier Long History in FPD 27 33 Selected by the top 3 in China for AMOLED R&D and Pilot Production Source: Gartner Tianma BOE Visionox EverDisplay Truly China AMOLED Monthly Area Capacity (K m2) Systems Installed Worldwide 14 FPD Systems in China

R&D and Pilot Opportunities for Rudolph Continued interest in G4.5 and below systems Source: Management Estimates 1 1 2 2 0 1 2 3 4 5 2016 2017 2018 Projected G4.5 Orders 28 Ongoing Customer Engagement to Validate G6 Opportunity 2 to 4 Systems in 2018
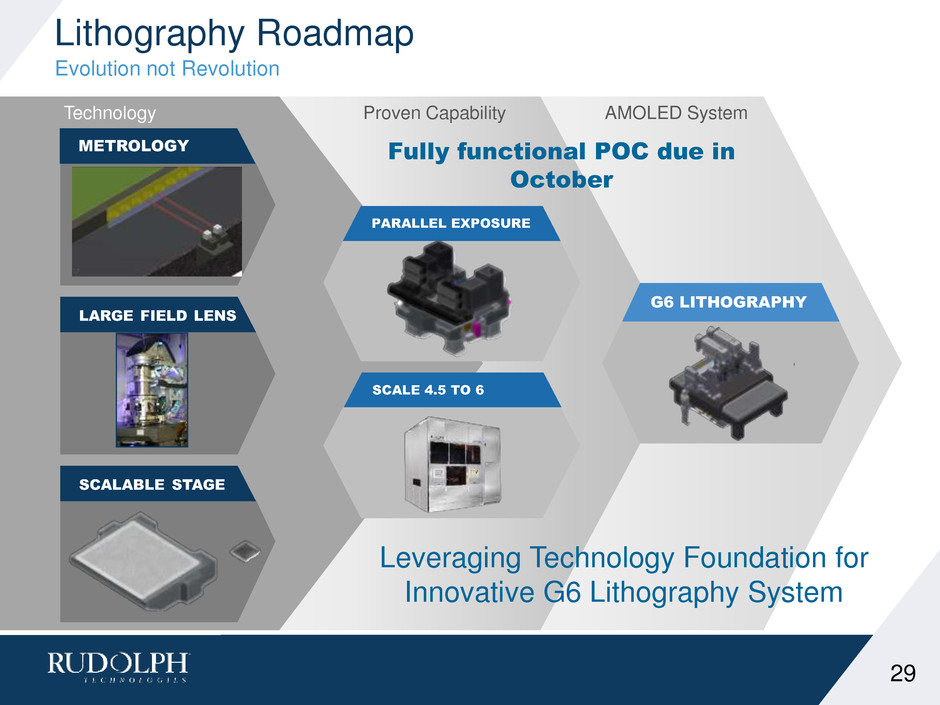
AMOLED SystemProven CapabilityTechnology Lithography Roadmap Evolution not Revolution 29 SCALABLE STAGE LARGE FIELD LENS METROLOGY PARALLEL EXPOSURE SCALE 4.5 TO 6 Fully functional POC due in October G6 LITHOGRAPHY Leveraging Technology Foundation for Innovative G6 Lithography System
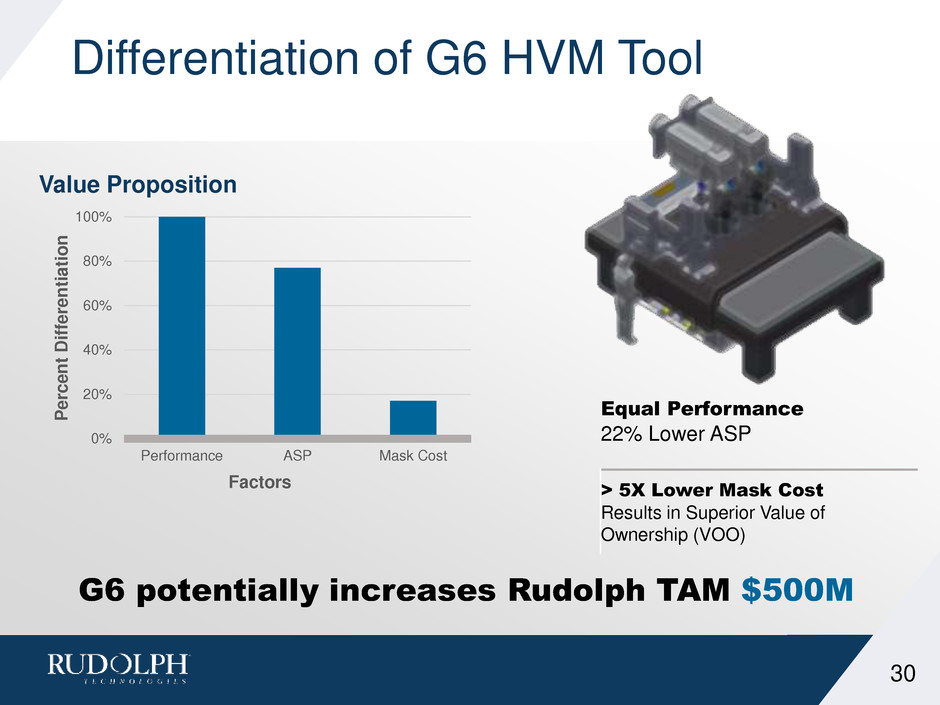
Differentiation of G6 HVM Tool 0% 20% 40% 60% 80% 100% Performance ASP Mask Cost Per c e n t Diff e rent iat io n Value Proposition Factors Equal Performance 22% Lower ASP > 5X Lower Mask Cost Results in Superior Value of Ownership (VOO) 30 G6 potentially increases Rudolph TAM $500M

What Are We Waiting For? Completing technology and market validation Completion of the POC to provide initial customer hardware demonstrations Customer commitment (CPO) for G6 systems Projected for Q1 of 2018 31
Agenda 9:30 a.m. Welcome Mike Sheaffer 9:35 a.m. Introduction and Achievements Mike Plisinski 9:50 a.m. Core Markets Update and OLED Update Elvino da Silveira 10:10 a.m. Growth in Lithography for Packaging Rich Rogoff 10:25 a.m. Growth Impact of New Inspection Products Mike Goodrich 10:40 a.m. Software Group Update Thomas Sonderman 10:50 a.m. Break / Technology Row 11:15 a.m. Financial Model Update Steven Roth 11:30 a.m. Q&A Panel 11:45 a.m. Closing Remarks Mike Plisinski 11:50 a.m. Lunch 32

Lithography Systems Group Rich Rogoff

AP Demand Continues to Increase 34 Source: Yole Develop and Management data 0 5,000 10,000 15,000 20,000 25,000 30,000 35,000 2017 2021 K W a fe rs p e r y e a r AP Demand Grows FO WLP FI WLP FC 2.5/3D 40% 13% 33% 4% 10% TSMC Amkor/Nanium JCET/StatsChippac ASE Other ~50% JetStep® System Delivering Today’s FO-WLP Production Fan-out market slowed a bit in 2017, but expected to regain momentum Technology and Cost Enhancements enable growth
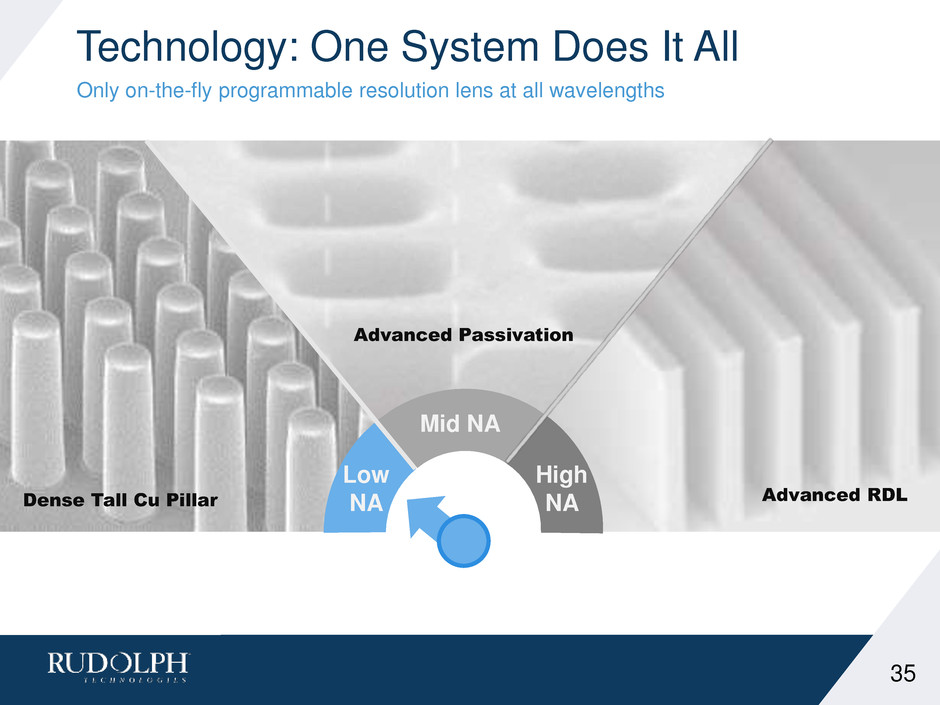
Technology: One System Does It All Only on-the-fly programmable resolution lens at all wavelengths 35 Dense Tall Cu Pillar Advanced RDL Advanced Passivation Low NA Mid NA High NA
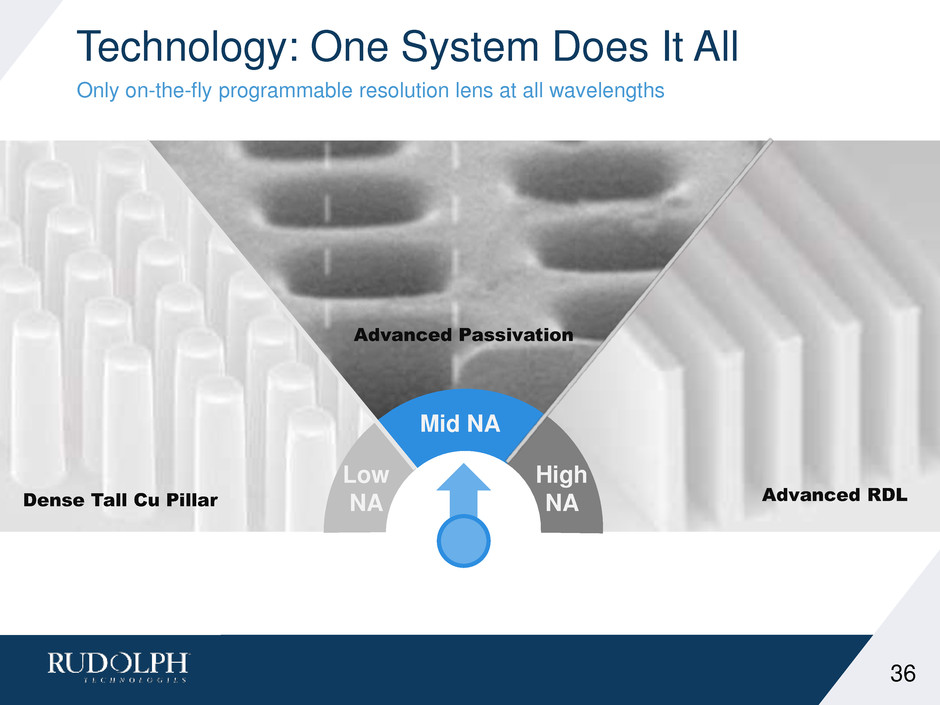
Technology: One System Does It All Only on-the-fly programmable resolution lens at all wavelengths 36 Dense Tall Cu Pillar Advanced RDL Advanced Passivation Low NA Mid NA High NA
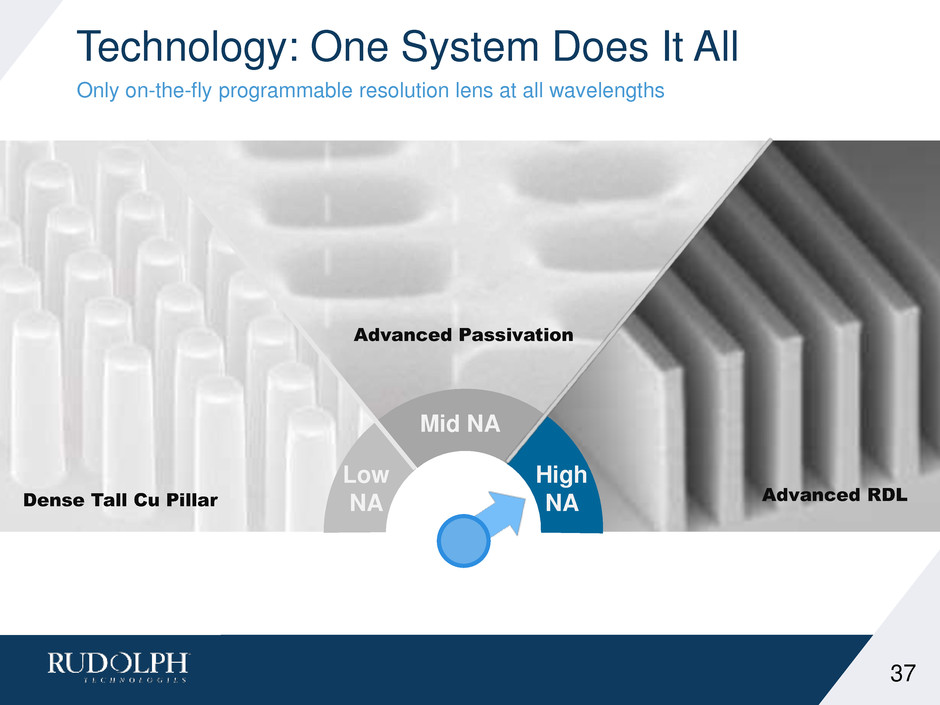
Technology: One System Does It All Only on-the-fly programmable resolution lens at all wavelengths 37 Dense Tall Cu Pillar Advanced RDL Advanced Passivation Low NA Mid NA High NA
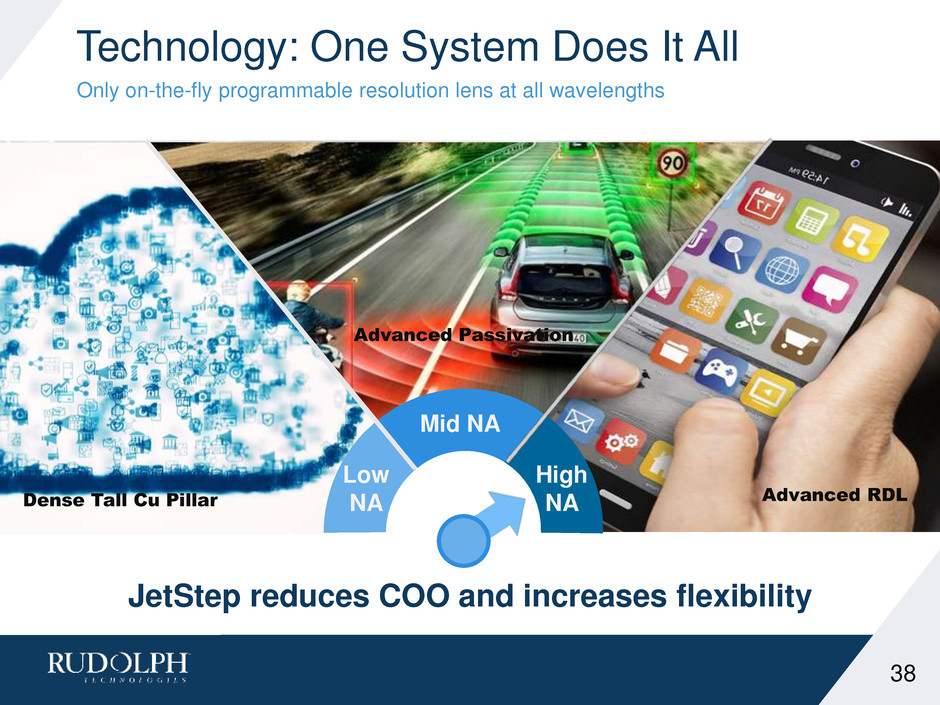
Technology: One System Does It All Only on-the-fly programmable resolution lens at all wavelengths 38 Dense Tall Cu Pillar Advanced RDL Advanced Passivation JetStep reduces COO and increases flexibility Low NA Mid NA High NA
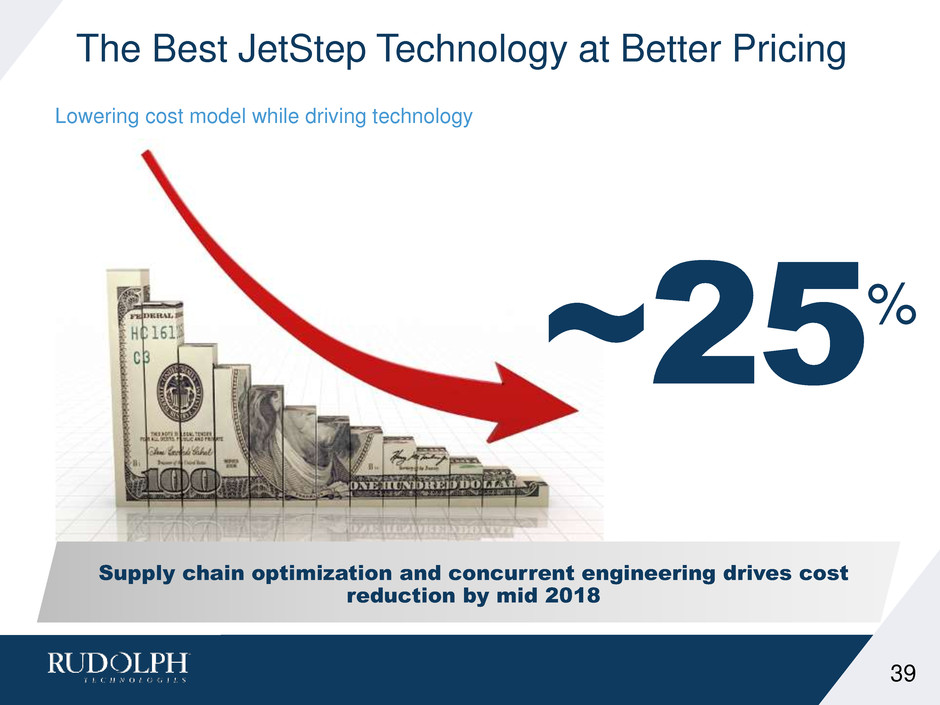
The Best JetStep Technology at Better Pricing Lowering cost model while driving technology 39 Supply chain optimization and concurrent engineering drives cost reduction by mid 2018 ~25%

System Flexibility Boosts Competitiveness Example: Cu Pillar 40 0 10 20 30 40 50 60 70 80 90 100 Depth of Focus DEPTH OF FOCUS JetStep High NA Only competitor 0 10 20 30 40 50 60 70 80 90 100 Profile IMAGE FIDELITY JetStep High NA Only competitor 0 10 20 30 40 50 60 70 80 90 100 Productivity PRODUCTIVITY JetStep High NA Only competitor

Break the Barrier to Displace Incumbent! VOO >25% better than competition 41 Competitor 1 Competitor 2 JetStep System (Current) Jetstep System 2018 CO S T OF O W N E RSHI P New Product to be Released in 2018 Barrier

JetStep Already Positioned for Growth in Panel No incumbency to overcome, JetStep’s benefits shine! 42 ASE/Deca Nepes SamsungStats Intel PowerTech ANNOUNCED PANEL PLAYERS Source: Semiconductor Engineering and Management Data >60% Select the JetStep System 0 5 10 15 20 25 30 2016 2017 2018 2019 2020 2021 Un it s Potential TAM Based on Ramp Scenario OSAT Semi MODELING ASSUMPTIONS Estimates based on typical FO ramp. We estimate at least 50% of planned investment will occur. ~$>65M

~$80 Million Annually Lithography Continues to Gain Panel Expansion and Improved Value of Ownership Drive 2018 43 Programmable Resolution Increased Productivity Handling COST Supply Chain Design for cost PERFORMANCE Look for Exciting New Developments by Mid - 2018 INCREASED SAM
Agenda 9:30 a.m. Welcome Mike Sheaffer 9:35 a.m. Introduction and Achievements Mike Plisinski 9:50 a.m. Core Markets Update and OLED Update Elvino da Silveira 10:10 a.m. Growth in Lithography for Packaging Rich Rogoff 10:25 a.m. Growth Impact of New Inspection Products Mike Goodrich 10:40 a.m. Software Group Update Thomas Sonderman 10:50 a.m. Break / Technology Row 11:15 a.m. Financial Model Update Steven Roth 11:30 a.m. Q&A Panel 11:45 a.m. Closing Remarks Mike Plisinski 11:50 a.m. Lunch 44

Process Control Business Mike Goodrich
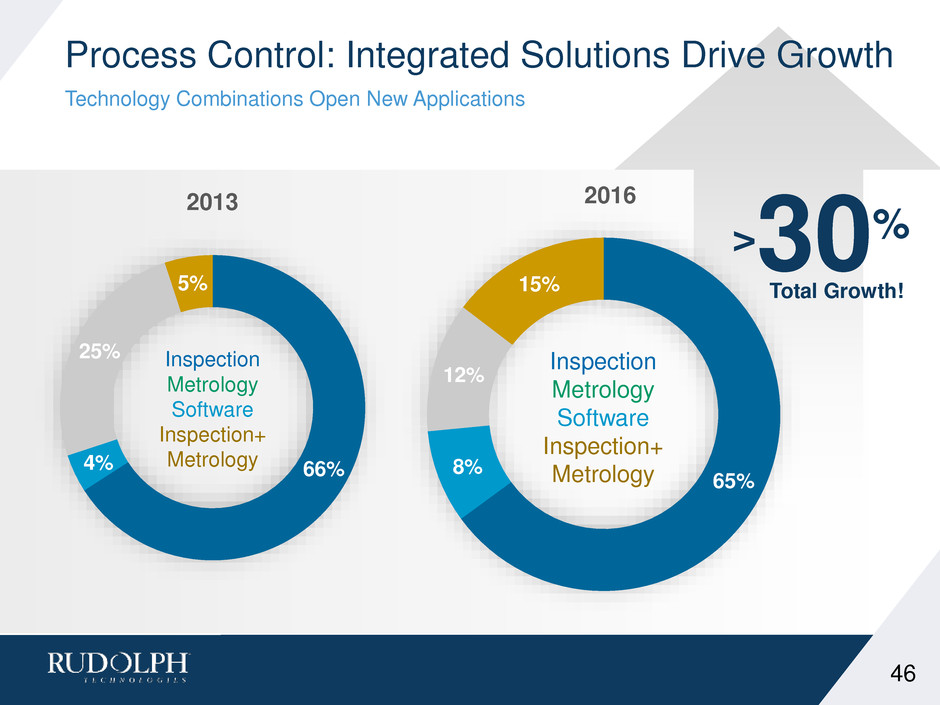
65% 8% 12% 15% 2016 66%4% 25% 5% 2013 Process Control: Integrated Solutions Drive Growth Technology Combinations Open New Applications 46 Inspection Metrology Software Inspection+ Metrology Inspection Metrology Software Inspection+ Metrology Total Growth! >30%

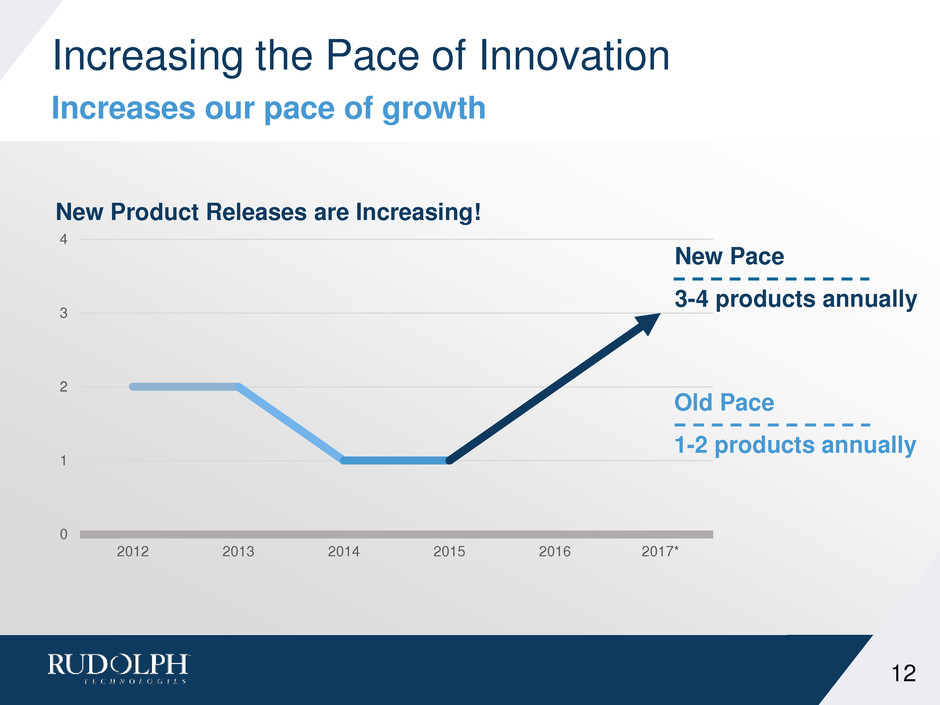
Dragonfly™ 2D Inspection High speed High sensitivity Firefly™ Clearfind™ Technology Organic contamination Sub-micron inspection 3D Truebump™ Technology Accurate bump height High throughput Post-saw Integrated SAW control Yield improvement Increasing the Pace of Innovation Refreshed Product Portfolio to Address Critical Customer Challenges 47 Via Residue RDL ShortsBridging Defects 3D Metrology Bump CoplanarityProbe Mark Metrology 2017 Q2 Q3 Q4 Q1
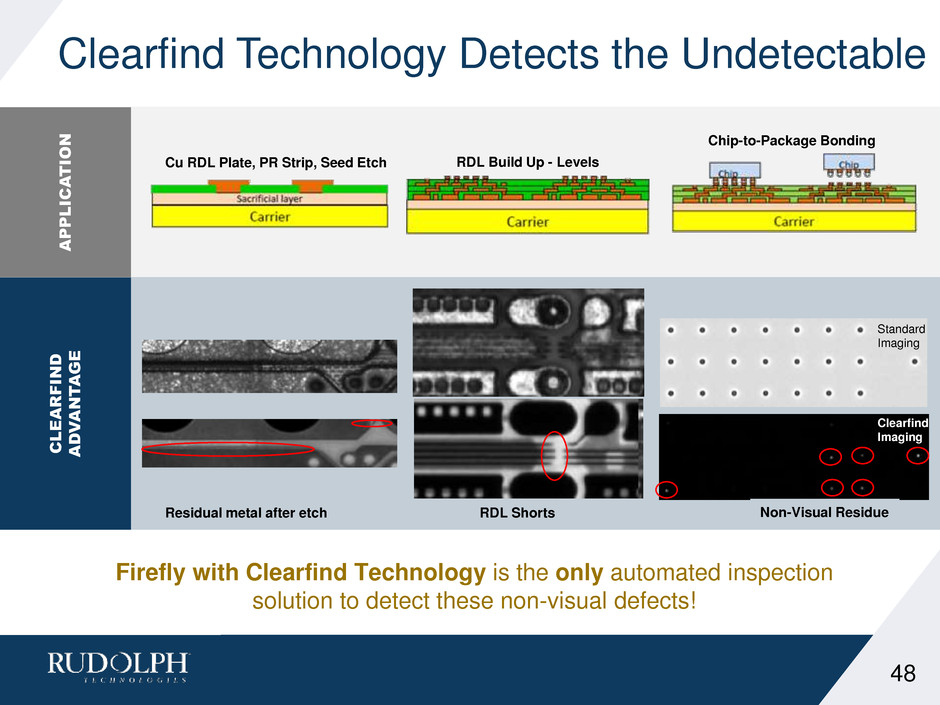
Firefly with Clearfind Technology is the only automated inspection solution to detect these non-visual defects! Clearfind Technology Detects the Undetectable 48 APPLI C A TI O N C L EAR F IN D A D V A N T A G E Standard Imaging Clearfind Imaging Cu RDL Plate, PR Strip, Seed Etch RDL Build Up - Levels Chip-to-Package Bonding Residual metal after etch RDL Shorts Non-Visual Residue
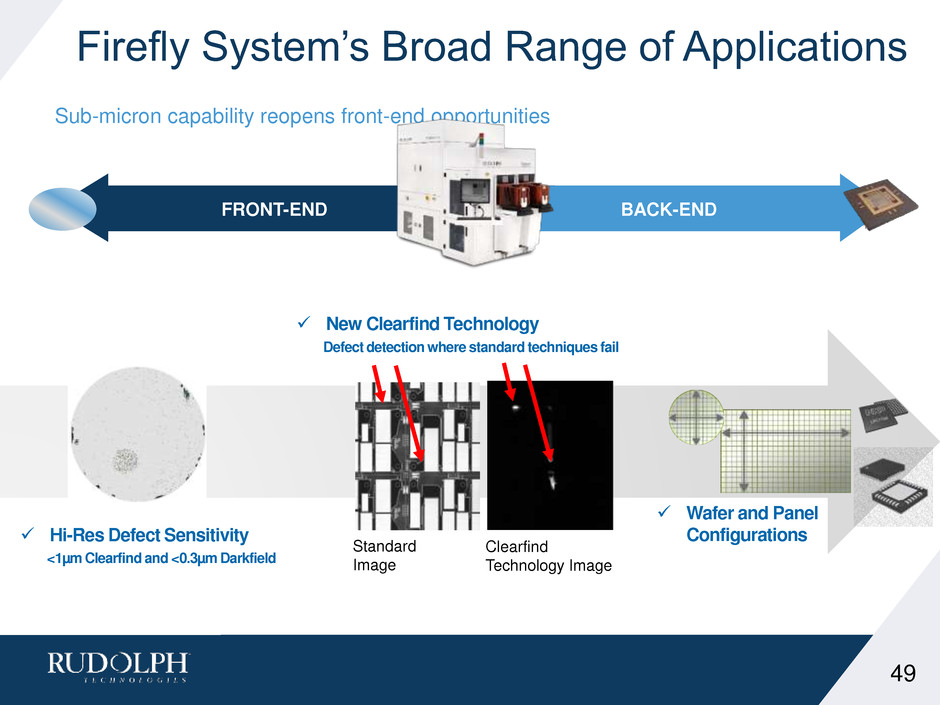
Firefly System’s Broad Range of Applications Sub-micron capability reopens front-end opportunities 49 FRONT-END BACK-END Hi-Res Defect Sensitivity <1µm Clearfind and <0.3µm Darkfield Standard Image Clearfind Technology Image New Clearfind Technology Defect detection where standard techniques fail Wafer and Panel Configurations

Firefly System’s Broad Range of Applications Sub-micron capability reopens front-end opportunities 50 FRONT-END BACK-END Source: Gartner Clearfind Technology expands opportunities ~$30M over three years $0 $50 $100 $150 $200 $250 2015 2017 ($ M ) Front-end Macro Market High resolution and throughput create market share gain ADVANCED SUBSTRATES MULTI-CHIP PACKAGING SHRINKING FEATURES

Targeting 3D Bump Share Growth Flip Chip Bumping Trend Source: Yole 38% SHARE MOMENTUM IN 3D BUMP Increase in Bumped Wafers 15% 2015 5% 2014 35% 2016 2017 Truebump™ Technology 51 Source: Management Estimate

Next Generation Bump Control High I/O devices drive increased need for fast accurate 3D metrology RUDOLPH’S 3D BUMP SOLUTION… Protection Layer (PL) Other Supplier Measurement Rudolph Accurately Penetrates PL Layer High speed 2D/3D TDI inspection 3X increase in throughput 3D bump solution – Improves yield with superior accuracy NSX System + LT80 Competition Dragonfly System + Truebump Technology Significant Throughput Improvement to Lead the Industry Faster and more accurate metrology 52
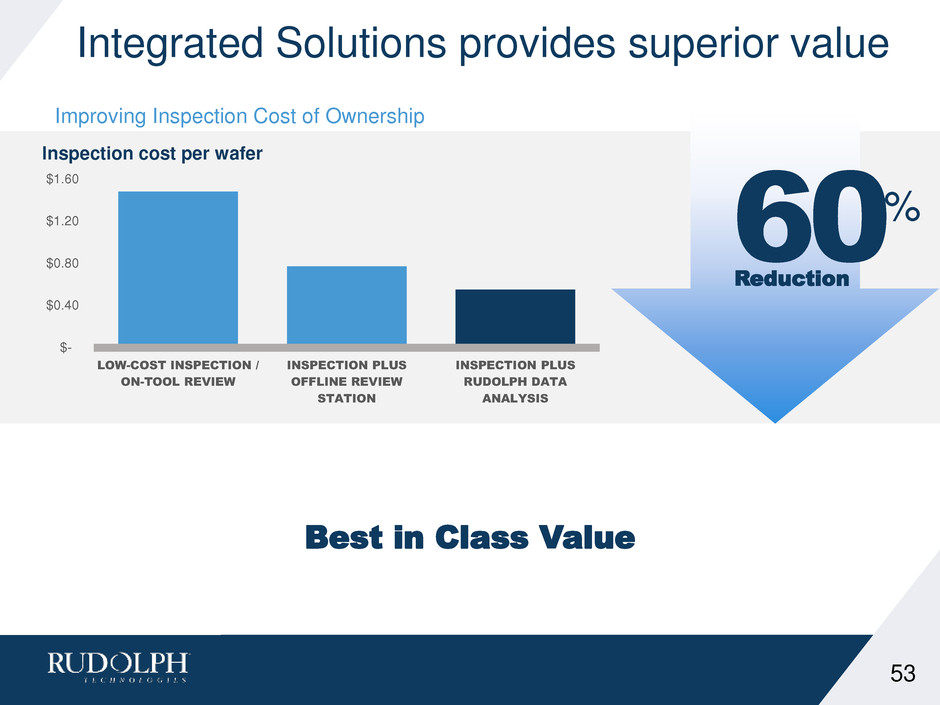
Integrated Solutions provides superior value Improving Inspection Cost of Ownership 53 $- $0.40 $0.80 $1.20 $1.60 LOW-COST INSPECTION / ON-TOOL REVIEW INSPECTION PLUS OFFLINE REVIEW STATION INSPECTION PLUS RUDOLPH DATA ANALYSIS Inspection cost per wafer Best in Class Value 60% Reduction
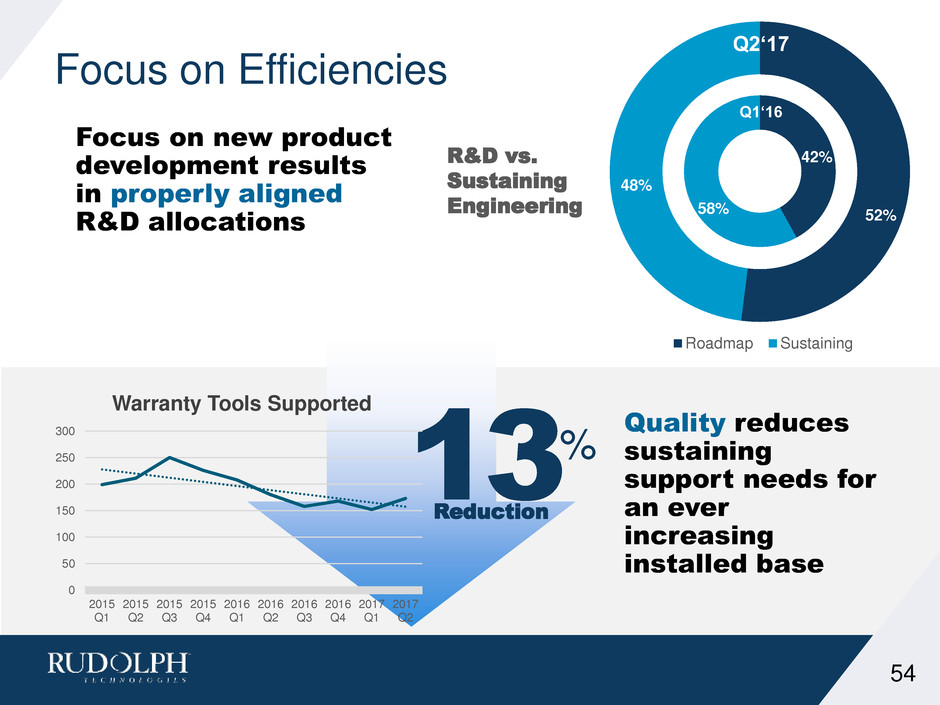
Focus on Efficiencies Focus on new product development results in properly aligned R&D allocations 52% 48% Roadmap Sustaining Q2‘17 42% 58% Q1‘16 R&D vs. Sustaining Engineering 54 13% Reduction Quality reduces sustaining support needs for an ever increasing installed base 0 50 100 150 200 250 300 2015 Q1 2015 Q2 2015 Q3 2015 Q4 2016 Q1 2016 Q2 2016 Q3 2016 Q4 2017 Q1 2017 Q2 Warranty Tools Supported

Summary 55 The increased pace of targeted innovation is building a market focused pipeline of new products Clearfind Technology provides access to new applications driving an increased TAM and SAM in key markets Dragonfly System and Firefly System with Clearfind Technology positions Rudolph to leverage AP growth and take market share Continued focus on operational efficiencies will support our long- term financial model

Agenda 9:30 a.m. Welcome Mike Sheaffer 9:35 a.m. Introduction and Achievements Mike Plisinski 9:50 a.m. Core Markets Update and OLED Update Elvino da Silveira 10:10 a.m. Growth in Lithography for Packaging Rich Rogoff 10:25 a.m. Growth Impact of New Inspection Products Mike Goodrich 10:40 a.m. Software Group Update Thomas Sonderman 10:50 a.m. Break / Technology Row 11:15 a.m. Financial Model Update Steven Roth 11:30 a.m. Q&A Panel 11:45 a.m. Closing Remarks Mike Plisinski 11:50 a.m. Lunch 56

Integrated Solutions Group Thomas Sonderman
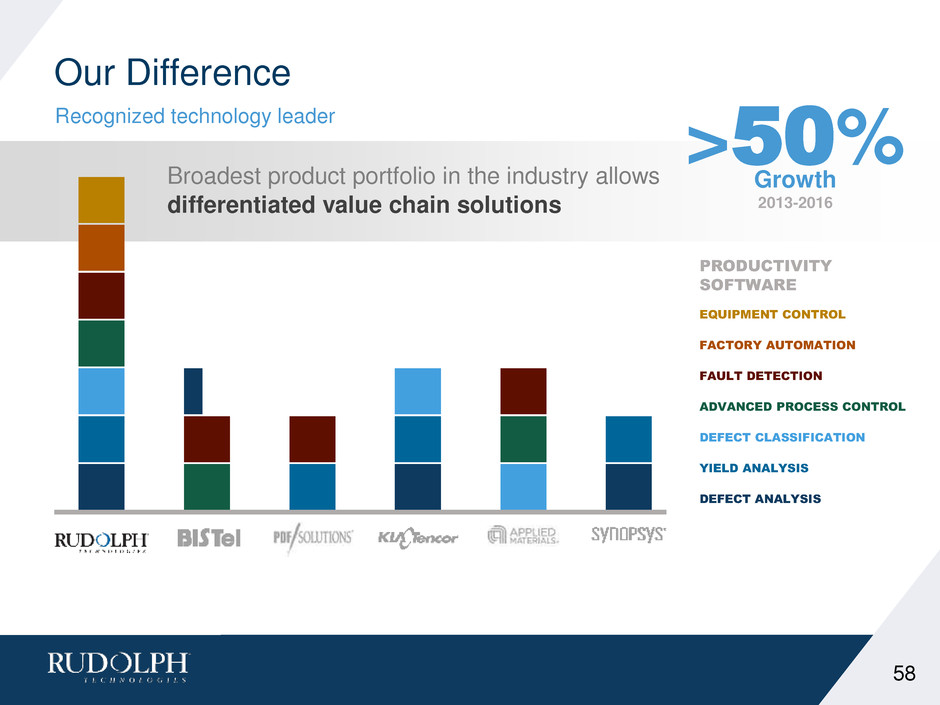
Our Difference Recognized technology leader 58 Broadest product portfolio in the industry allows differentiated value chain solutions >50% Growth 2013-2016 EQUIPMENT CONTROL FACTORY AUTOMATION FAULT DETECTION ADVANCED PROCESS CONTROL DEFECT CLASSIFICATION YIELD ANALYSIS DEFECT ANALYSIS PRODUCTIVITY SOFTWARE

Software Expanding Rudolph Value Innovative software solutions contributing to Rudolph growth 59 Connected Data End to End Analytics RUDOLPH/OEM Integration EMBEDDED TOOL SOLUTIONS Expanding across the value chain INTELLIGENT DIAGNOSTICS ACTIONABLE INTELLIGENCE MINIMIZING RISK CREATING VALUE
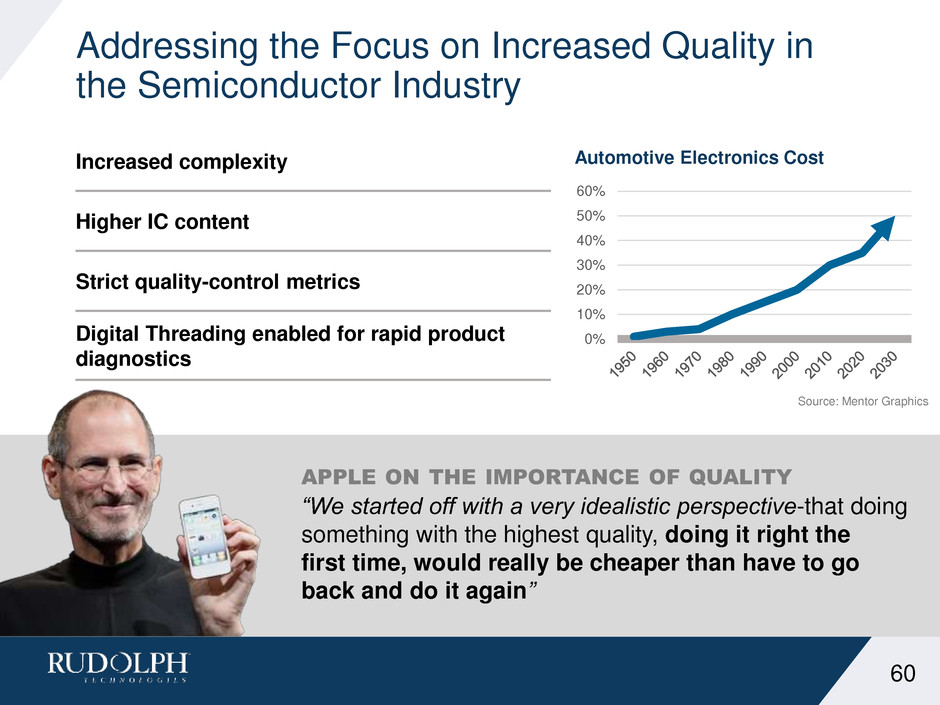
Addressing the Focus on Increased Quality in the Semiconductor Industry 60 Increased complexity Higher IC content Strict quality-control metrics Digital Threading enabled for rapid product diagnostics 0% 10% 20% 30% 40% 50% 60% Automotive Electronics Cost APPLE ON THE IMPORTANCE OF QUALITY “We started off with a very idealistic perspective-that doing something with the highest quality, doing it right the first time, would really be cheaper than have to go back and do it again” Source: Mentor Graphics

METROLOGY PROBE/TEST PROCESS Product StateWafer StateTool state Rudolph’s Unique Value Converting data into actionable intelligence 4 Rudolph’s solutions rapidly decompose the entire value chain, reducing risk & accelerating time to market

Rudolph’s Value Chain Analytics Making the complex understandable 62 Actively Engaged with Tier 1 Fabless and Automotive Companies RAPID VALUE CHAIN ANALYTICS! Wafer Panel Package $7-10M Incremental Revenue over next 3 years Disaggregated Value Chain w/ Limited Traceability
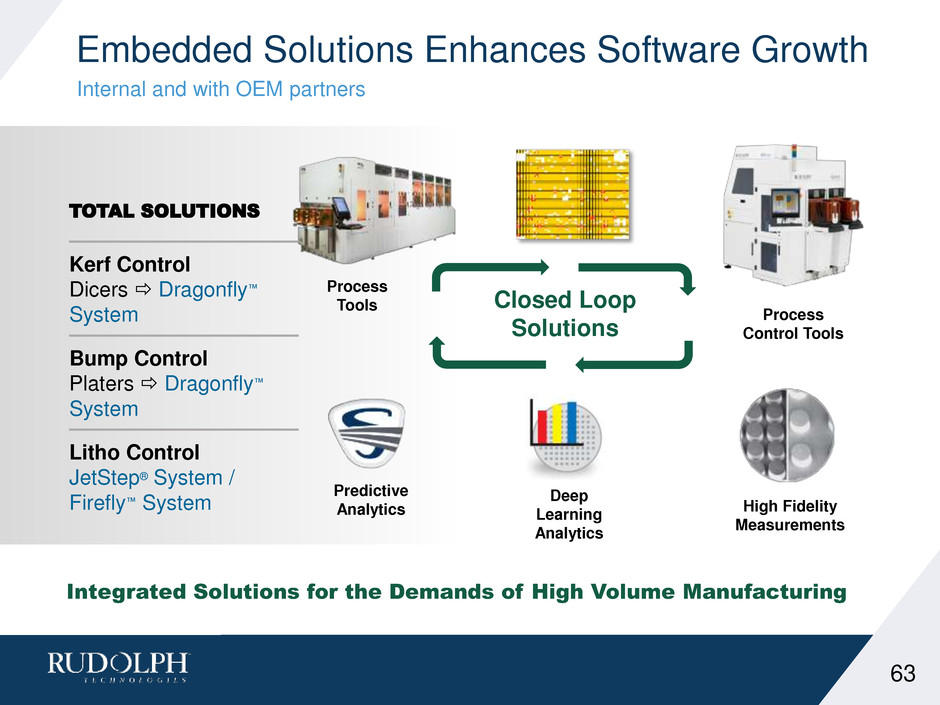
Embedded Solutions Enhances Software Growth Internal and with OEM partners 63 Process Tools High Fidelity Measurements Closed Loop Solutions Predictive Analytics Deep Learning Analytics Process Control Tools TOTAL SOLUTIONS Kerf Control Dicers Dragonfly™ System Bump Control Platers Dragonfly™ System Litho Control JetStep® System / Firefly™ System Integrated Solutions for the Demands of High Volume Manufacturing
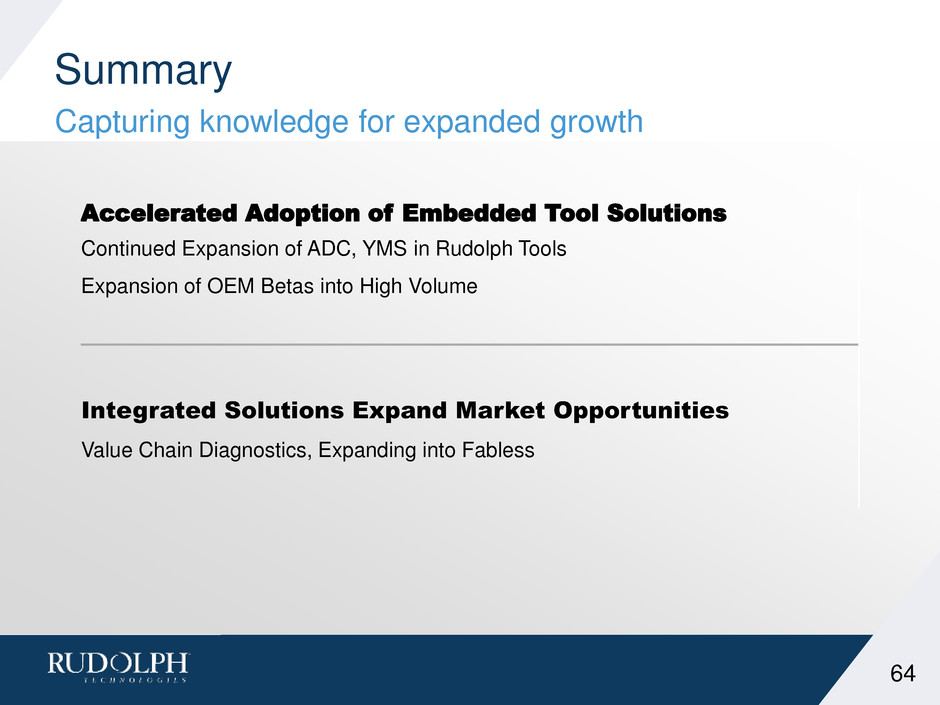
Summary Capturing knowledge for expanded growth 64 Accelerated Adoption of Embedded Tool Solutions Continued Expansion of ADC, YMS in Rudolph Tools Expansion of OEM Betas into High Volume Integrated Solutions Expand Market Opportunities Value Chain Diagnostics, Expanding into Fabless
Agenda 9:30 a.m. Welcome Mike Sheaffer 9:35 a.m. Introduction and Achievements Mike Plisinski 9:45 a.m. Core Markets Update and OLED Vision Elvino da Silveira 10:05 a.m. Lithography Group Update Rich Rogoff 10:20 a.m. Process Control Group Update Mike Goodrich 10:35 a.m. Software Group Update Thomas Sonderman 10:45 a.m. Break / Technology Row 11:10 a.m. Financial Model Update Steven Roth 11:25 a.m. Q&A Panel 11:40 a.m. Closing Remarks Mike Plisinski 11:45 a.m. Lunch 65

Financial Model Update Steven Roth, Chief Financial Officer

Operational Efficiencies Yielding Results Increased Focus on Supply Chain Contributes to Strong Operating Model 67 SUPPLY CHAIN INITIATIVES Third Party Outsourcing Generic Builds Procurement Inventory Control Quality Preferential Pricing and Lead-times Multi-faceted approach optimized for next stage of growth Improved internal coordination results in more effective planning and purchasing Consolidated vendor base enhances our value to suppliers, making us more critical across supply chain
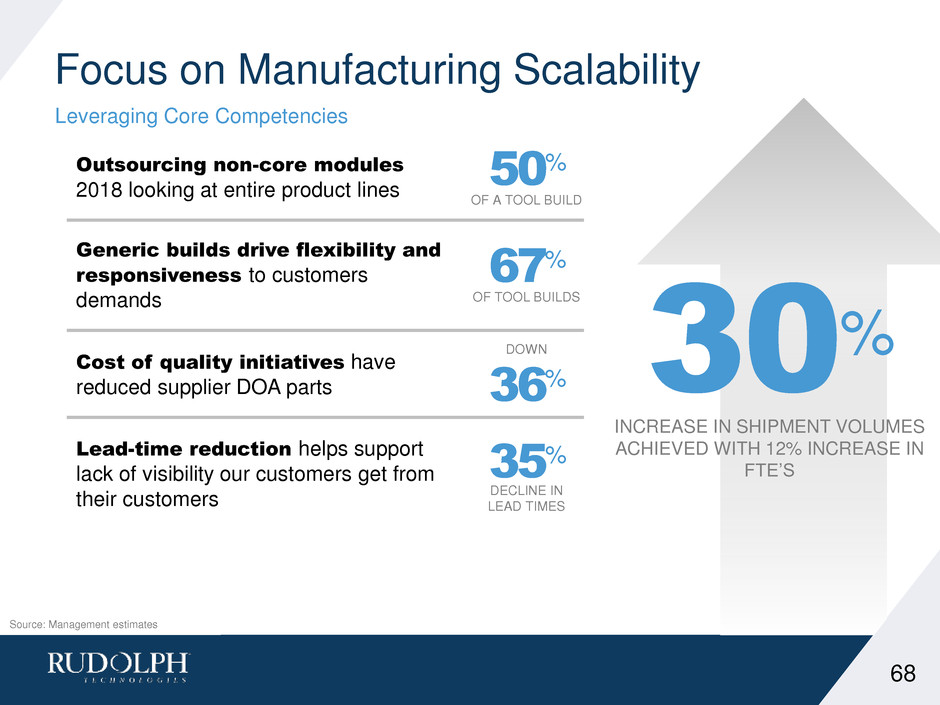
Focus on Manufacturing Scalability Leveraging Core Competencies INCREASE IN SHIPMENT VOLUMES ACHIEVED WITH 12% INCREASE IN FTE’S Source: Management estimates 30% 68 Outsourcing non-core modules 2018 looking at entire product lines Generic builds drive flexibility and responsiveness to customers demands Cost of quality initiatives have reduced supplier DOA parts Lead-time reduction helps support lack of visibility our customers get from their customers 35% DECLINE IN LEAD TIMES DOWN 36% 67% OF TOOL BUILDS 50% OF A TOOL BUILD
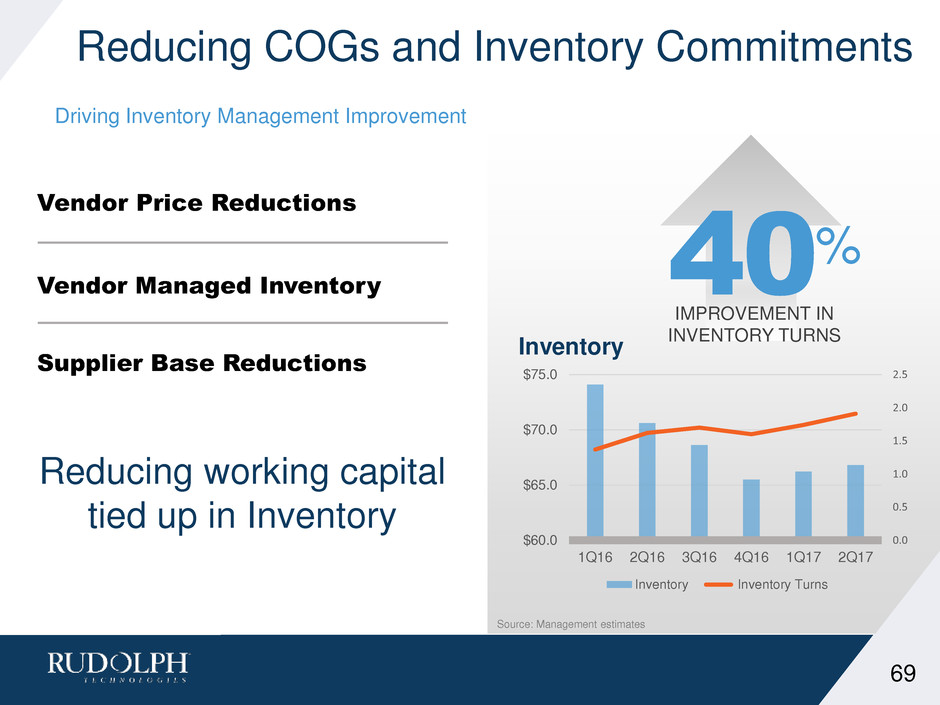
Reducing COGs and Inventory Commitments Driving Inventory Management Improvement 0.0 0.5 1.0 1.5 2.0 2.5 $60.0 $65.0 $70.0 $75.0 1Q16 2Q16 3Q16 4Q16 1Q17 2Q17 Inventory Inventory Inventory Turns Reducing working capital tied up in Inventory Vendor Price Reductions Vendor Managed Inventory Supplier Base Reductions Source: Management estimates 69 40% IMPROVEMENT IN INVENTORY TURNS

Driving Margin Expansion Consistent Industry Leading Margins 70 Operating Margin Today 21% TTM Tomorrow 30% GM New products Product outsourcing Cost reductions Firefly and Dragonfly Core competencies >$6 million R&D New products cadence Operating efficiencies Releases 12-18 months Leverage programs SG&A Facilities consolidation ERP implementation 4 in year last 3 years 2018 initiatives Source: Management estimates

Operating Financial Model 71 $250M MODEL $300M MODEL $350M MODEL $400M MODEL Gross Margin 53% 54% 55% 55% Model excludes the impact of OLED Initiative which is expected to be accretive to operating margins. 21% 25% 28% 30% Existing Operations Operating Margin Source: Management estimates based on a Non-GAAP model

Free Cash Flow/Capital Allocation Priorities How we deploy our strong cash generation 72 $(20.0) $(10.0) $- $10.0 $20.0 $30.0 $40.0 $50.0 $60.0 $70.0 Free Cash Flow Cash from Ops CAPEX FCF Capital Priorities Fund organic growth initiatives Strategic M&A Return to shareholders ~10 % of shares repurchased through buy backs Source: 2017 estimate based on first half of year results repeating in the second half of year.
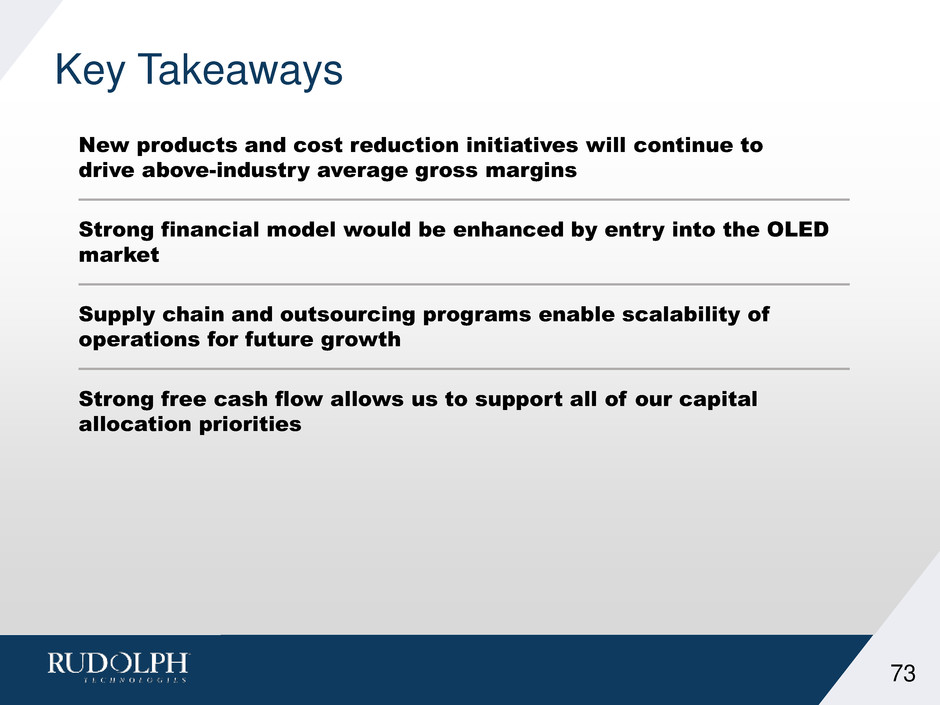
Key Takeaways New products and cost reduction initiatives will continue to drive above-industry average gross margins Strong financial model would be enhanced by entry into the OLED market Supply chain and outsourcing programs enable scalability of operations for future growth Strong free cash flow allows us to support all of our capital allocation priorities 73
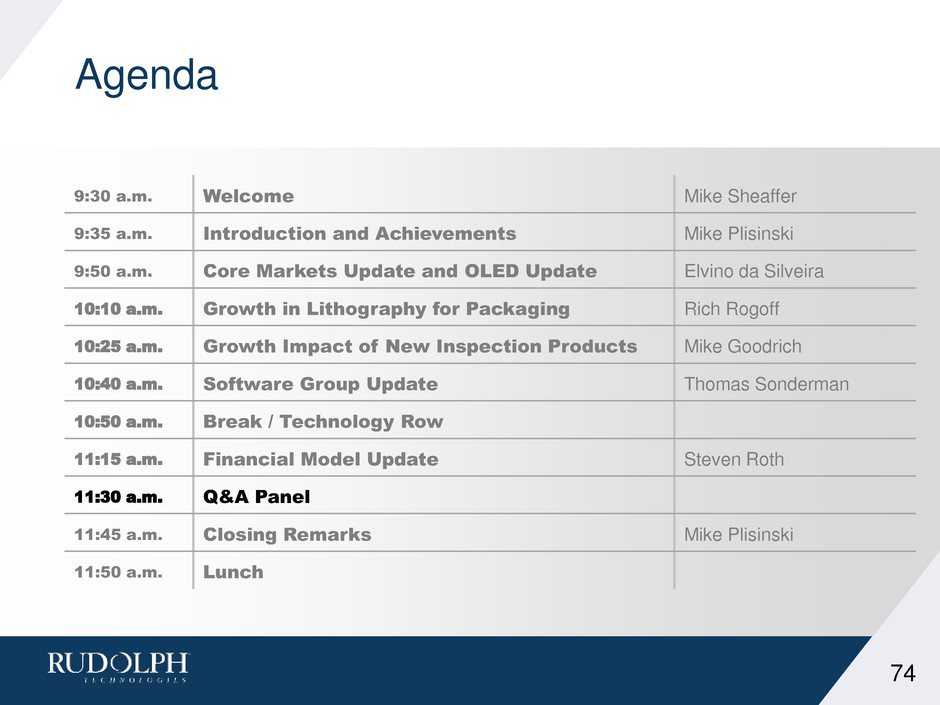
Agenda 9:30 a.m. Welcome Mike Sheaffer 9:35 a.m. Introduction and Achievements Mike Plisinski 9:50 a.m. Core Markets Update and OLED Update Elvino da Silveira 10:10 a.m. Growth in Lithography for Packaging Rich Rogoff 10:25 a.m. Growth Impact of New Inspection Products Mike Goodrich 10:40 a.m. Software Group Update Thomas Sonderman 10:50 a.m. Break / Technology Row 11:15 a.m. Financial Model Update Steven Roth 11:30 a.m. Q&A Panel 11:45 a.m. Closing Remarks Mike Plisinski 11:50 a.m. Lunch 74

Q&A 75

Closing Mike Plisinski

Rudolph Growth Tied to Chip Volume 13 Straight Quarters of Year over Year Growth! $35 $40 $45 $50 $55 $60 $65 $70 Q1 Q2 Q3 Q4 Year over Year Revenue by Quarter 2013 2014 2015 2016 2017* *Analyst Estimates Technology +22% +5% +10%* 77

Cheat Sheet Key takeaways from today… 78 Market Growth Drivers Remain Healthy into 2018 SEMI WFE RTEC ~5 % to ↑ New Products Increasing Rudolph Opportunities SAM +$100M OLED market potential to be transformative for Rudolph TAM +$500M Strong Financial Model for Sustaining Growth LTOM OI 30%

info@rudolphtech.com www.rudolphtech.com Thank You


