Table of Contents
UNITED STATES
SECURITIES AND EXCHANGE COMMISSION
WASHINGTON, D.C. 20549
FORM 10-K
(Mark One)
☒ | ANNUAL REPORT PURSUANT TO SECTION 13 OR 15(d) OF THE SECURITIES EXCHANGE ACT OF 1934 |
For the Fiscal Year Ended December 31, 2018
OR
☐ | TRANSITION REPORT PURSUANT TO SECTION 13 OR 15(d) OF THE SECURITIES EXCHANGE ACT OF 1934 |
For the transition period from to
Commission File No. 001-36226
RUDOLPH TECHNOLOGIES, INC.
(Exact name of registrant as specified in its charter)
Delaware | | 22-3531208 |
(State or other jurisdiction of incorporation or organization) | | (I.R.S. Employer Identification Number) |
16 Jonspin Road, Wilmington, MA 01887
(Address of principal executive offices) (Zip Code)
Registrant’s telephone number, including area code: (978) 253-6200
SECURITIES REGISTERED PURSUANT TO SECTION 12(b) OF THE ACT:
Title of Each Class | | Name of Exchange on Which Registered |
Common Stock, $0.001 par value per share (including attached Series A Junior Participating Preferred Stock Purchase Rights) | | New York Stock Exchange (NYSE) |
SECURITIES REGISTERED PURSUANT TO SECTION 12(g) OF THE ACT:
None
Indicate by check mark if the registrant is a well-known seasoned issuer, as defined in Rule 405 of the Securities Act. Yes ☐ No ☒
Indicate by check mark if the registrant is not required to file reports pursuant to Section 13 or Section 15(d) of the Act. Yes ☐ No ☒
Indicate by check mark whether the registrant: (1) has filed all reports required to be filed by Section 13 or 15(d) of the Securities Exchange Act of 1934 during the preceding 12 months (or for such shorter period that the registrant was required to file such reports), and (2) has been subject to such filing requirements for the past 90 days. Yes ☒ No ☐
Indicate by check mark whether the registrant has submitted electronically every Interactive Data File required to be submitted pursuant to Rule 405 of Regulation S-T during the preceding 12 months (or for such shorter period that the registrant was required to submit such files). Yes ☒ No ☐
Indicate by check mark if disclosure of delinquent filers pursuant to Item 405 of Regulation S-K is not contained herein, and will not be contained, to the best of registrant’s knowledge, in definitive proxy or information statements incorporated by reference in Part III of this Form 10-K or any amendment to this Form 10-K. ☐
Indicate by check mark whether the registrant is a large accelerated filer, an accelerated filer, a non-accelerated filer, a smaller reporting company, or an emerging growth company. See the definitions of “large accelerated filer,” “accelerated filer,” “smaller reporting company” and “emerging growth company” in Rule 12b-2 of the Exchange Act.:
Large accelerated filer | ☒ | | Accelerated filer | ☐ |
Non-accelerated filer | ☐ | | Smaller reporting company | ☐ |
| | | Emerging growth company | ☐ |
If an emerging growth company, indicate by check mark if the registrant has elected not to use the extended transition period for complying with any new or revised financial accounting standards provided pursuant to Section 13(a) of the Exchange Act. ☐
Indicate by check mark whether the registrant is a shell company (as defined in Rule 12b-2 of the Act). Yes ☐ No ☒
The aggregate market value of the voting stock held by non-affiliates of the registrant based on the closing price of the registrant’s stock price on June 30, 2018 of $29.60 was approximately $926,907,335.
The registrant had 30,907,380 shares of Common Stock outstanding as of January 23, 2019.
DOCUMENTS INCORPORATED BY REFERENCE
Items 10, 11, 12, 13 and 14 of Part III of this Annual Report on Form 10-K incorporate by reference information from the definitive proxy statement for the registrant’s annual meeting of stockholders scheduled to be held on May 15, 2019.
Table of Contents
TABLE OF CONTENTS
Table of Contents
FORWARD-LOOKING STATEMENTS
Certain statements in this Annual Report on Form 10-K of Rudolph Technologies, Inc. (the “Company” or “Rudolph”) are forward-looking statements, including those concerning our business momentum and future growth, acceptance of our products and services, our ability to deliver both products and services consistent with our customers’ demands and expectations and to strengthen our market position, our expectations of the semiconductor market outlook, future revenue, gross profits, research and development and engineering expenses, selling, general and administrative expenses, product introductions, technology development, manufacturing practices, cash requirements, our dependence on certain significant customers and anticipated trends and developments in and management plans for our business and the markets in which we operate, our anticipated revenue as a result of acquisitions, and our ability to be successful in managing our cost structure and cash expenditures. The statements contained in this Annual Report on Form 10-K that are not purely historical are forward-looking statements within the meaning of Section 27A of the Securities Act of 1933, as amended (the “Securities Act”), Section 21E of the Securities Exchange Act of 1934, as amended (the “Exchange Act”), and within the meaning of the Private Securities Litigation Reform Act of 1995. Forward-looking statements may be identified by words such as, but not limited to, “anticipate,” “believe,” “expect,” “intend,” “plan,” “should,” “may,” “could,” “will” and words or phrases of similar meaning, as they relate to our management or us.
The forward-looking statements contained herein reflect our expectations with respect to future events and are subject to certain risks, uncertainties and assumptions. Actual results may differ materially from those included in such forward-looking statements for a number of reasons including, but not limited to, the following: variations in the level of orders which can be affected by general economic conditions, seasonality and growth rates in the semiconductor manufacturing industry and in the markets served by our customers, the global economic and political climates, difficulties or delays in product functionality or performance, the delivery performance of sole source vendors, the timing of future product releases, failure to respond adequately to either changes in technology or customer preferences, changes in pricing by us or our competitors, our ability to manage growth, changes in management, risk of nonpayment of accounts receivable, changes in budgeted costs, our ability to leverage our resources to improve our position in our core markets, our ability to weather difficult economic environments, our ability to open new market opportunities and target high-margin markets, the strength/weakness of the back-end and/or front-end semiconductor market segments, our ability to successfully integrate acquired businesses into our business and fully realize, or realize within the expected time frame, the expected combination benefits from the acquisitions, and the “Risk Factors” set forth in Item 1A. You should carefully review the cautionary statements and “Risk Factors” contained in this Annual Report on Form 10-K. You should also review any additional disclosures and cautionary statements and “Risk Factors” we include from time to time in our quarterly reports on Form 10-Q, current reports on Form 8-K and other filings we make with the Securities and Exchange Commission (the “SEC”). The forward-looking statements reflect our position as of the date of this report and we undertake no obligation to update any forward-looking statements, whether as a result of new information, future events or otherwise, except as required by law.
1
Table of Contents
PART I
General
Rudolph Technologies, Inc. is a worldwide leader in the design, development, manufacture and support of process control tools that perform macro defect inspections and metrology, lithography systems, and process control analytical software used by semiconductor and advanced packaging device manufacturers. Rudolph’s proprietary products offer comprehensive solutions for all phases/segments of the semiconductor fabrication process. Our products that provide critical yield-enhancing information, which is used by microelectronic device manufacturers to drive down costs and to decrease the time to market of their devices. We provide process and yield management solutions used in bare silicon wafer production and wafer processing facilities, often referred to as “front-end” manufacturing and device packaging and test facilities, (or “back-end” manufacturing), respectively through a portfolio of standalone systems for macro-defect inspection, packaging lithography, probe card test and analysis, as well as transparent and opaque thin film measurements. All Rudolph systems feature sophisticated software and production-worthy automation. In addition, our advanced process control software portfolio includes powerful solutions for standalone tools, groups of tools, factory-wide, and enterprise-wide suites to enhance productivity and achieve significant cost savings. Rudolph’s systems are backed by worldwide customer service and applications support.
Rudolph continues to drive the technological innovation of its inspection and metrology products to deliver solutions that address the demanding needs across the front-end and back-end processes of semiconductor manufacturing. In 2018, Rudolph introduced two newly configured macro defect inspection tools, the second generation Dragonfly™G2 system and the NovusEdge™ tool for bare wafer inspection. The Dragonfly G2 systems use high-resolution, two-dimensional (2D) inspection technology for front-end and back-end applications as well as high-resolution three-dimensional (3D) inspection and metrology. Rudolph’s Clearfind™ technology is a patented option available for enhancing the detection of defects that often escape conventional illumination techniques by revealing organic materials, thereby reducing a source of yield-robbing interconnect failures that can occur within advanced packages. The Dragonfly G2 system is a high-speed multi-dimensional tool that also features TrueBump™ technology to accurately measure the height of millions of micro bumps that may be deposited on a wafer in order to make electrical connections. This critical dimension must be accurately controlled to assure that eventual connections are reliably created. The new NovusEdge system provides macro level quality measurements for manufacturers of bare silicon wafers that are supplied to semiconductor manufacturers for subsequent processing. Certain defects, such as backside particles and hairline cracks on the edge of the wafer, were previously considered minor flaws. However, the latest extreme ultra-violet (“EUV”) lithography systems are extremely sensitive to backside particles and manufacturing of large integrated circuit chips can have significant yield losses when edge cracks propagate into the chips near the wafer’s edge. The NovusEdge system is able to detect and classify wafers so that the wafer suppliers can assure their customers of the proper quality levels needed for subsequent processing and chip type.
These newly released products supplement Rudolph’s established product portfolio of extensive 2D and 3D process control solutions for a variety of device types of advanced packaging, such as second generation high bandwidth memory (“HBM2”) devices, double data rate Dynamic Random Access Memory (“DRAM”) (DDR4 and DDR5), 3D Not And (“NAND”) memory, advanced packaging for radio frequency (“RF”) modules, Complimentary Metaloxide Semiconductor (“CMOS”) image sensors, Microelectromechanical Systems (“MEMs”), etc. that are used in smartphones, wearable devices, tablets and personal computers, automotive, Internet of Things (“IoT”) and others. The need for more process monitoring and control continues to increase for semiconductor and related industries as the required levels of quality and reliability continue to rise. Predictive analytics can lower maintenance costs, rate of scrap wafers, unscheduled tool downtime and material costs. Rudolph’s established fault detection and classification software, which is also incorporated into tools manufactured by others companies, allows customers to seamlessly turn equipment data into actionable operational information. This collaboration is designed to enhance etch and deposition tool performance.
2
Table of Contents
Industry Trends
Advanced Packaging refers to a variety of technologies that enable the miniaturization of electronic products, such as portable consumer devices, including smartphones, watches, and tablets. In electronics manufacturing, integrated circuit packaging is the final stage of semiconductor device fabrication, in which a single circuit made from semiconducting material (a die or chip) is encased in a molded package that provides external connections to a printed circuit board and also prevents physical damage to the chip and corrosion. Advanced Packaging refers loosely to the conductors and other structures that often interconnect multiple die, feed them with electric power and create signal paths to and from the PC board, dissipate their heat, and protect them from damage. Today, the drive to pack more functions into a small space and reduce their power requirements demands that chip packages do much more than ever before to combine multiple functions into a single molded package.
One example of the technology used in Advanced Packaging is the 3D integration of semiconductors and other devices. The technology involves stacking individual die in one integrated package. Through-silicon vias (“TSVs”) are vertical copper interconnects that are embedded from the bottom surface of a die to the top surface, which allows power and communication to be shared among the individually stacked components. This offers the advantages of shorter signal paths and, in turn, reduced power consumption, enhanced bandwidths, integration of heterogeneous components such as memory and logic chips, and smaller surface area. The processes required for 3D integration vary from one manufacturer to another and many continue to be optimized for yield and to ensure the functioning of individual stacked chips.
Fan-out wafer level packages are another advanced packaging technology using copper pillars/bumps to vertically connect a wide variety of stacked die for 2.5D, and 3D integration techniques and are considered the next disruptive technology for several reasons. First, fan-out wafer level packages significantly reduce the space needed inside an electronic device, such as a smartphone, by combining multiple chips/functions into a single package, often called a system in a package (“SIP”). Next, it improves the system’s performance by reducing power and signal conductor lengths, which previously were routed from package to package through a printed circuit (“PC”) board. Using thin redistribution layers to “fan out” power and signal connections to the larger contacts on the PC board eliminates the need for a ceramic or laminated substrate, which accounts for 35 percent of the packaging cost. Lastly, the technology is currently considered the preferred vehicle for next generation uses, such as system in package, and package on package formats. As a result of the small overall form factor, fan-out wafer level packages provide the functionality needed in high-end mobile and wearable products.
The current and projected adoption of smart mobile devices with designed-in capability to enable multiple functions in a single device continues to grow. In reality, there are no longer single function devices, but instead, a combined single device provides multiple functions such as phone, GPS, camera, and internet browser. Aided by a myriad of available “apps,” the potential uses seem endless. As a result, these added functions in mobile products are driving semiconductor advanced packaging and display manufacturers to implement next-generation technologies, such as 5G communications, to meet these requirements. These technology shifts encompass multiple high-value process steps that are creating opportunities for Rudolph solutions.
Panel Manufacturing. The current process to manufacture advanced packaging involves attaching known good die to a 300mm wafer, used as a temporary carrier when adding components such as redistribution layers (“RDLs”) and copper pillars. SIP packages can often contain side-by-side die, meaning the package can be large and limit the number of packages being placed on a reconstituted wafer. In order to meet the growing demand at reduced average selling prices, manufacturers are looking to scalable technology. Advanced packaging facilities looking to improve Cost of Ownership (“COOs”) and increase productivity are transitioning from 300mm wafers to large rectangular panels, which can be as large as 600mm x 600mm. This larger size enables companies manufacturing large area packages to increase the number of devices being processed at each step as they are no longer limited to operating within the constraints of a round wafer. By responding to market opportunities and addressing the stringent demands of customers’ technical roadmaps, we believe that Rudolph is optimally positioned to capitalize on the emerging market of high volume panel manufacturing. For example, the JetStep® S lithography system, having emerged from the flat panel display market, is readily capable of processing RDLs on both glass and organic laminate panels in the semiconductor advanced packaging market. The Firefly™S Series, designed for high
3
Table of Contents
resolution inspection, can provide location information to the JetStep S tool for each die, which greatly improves lithography throughput using Rudolph’s exclusive StepFast™ process. It also delivers a combination of defect detection and substrate flexibility in a single platform. It reduces capital investment requirements and provides a reliable pathway to transition from wafer to panel-based processes.
Technology
We believe that our expertise in engineering and our continued investment in research and development enable us to rapidly develop new technologies and products in order to quickly respond to emerging industry trends and competitive challenges. The breadth of our technology enables us to offer a diverse combination of process and process control solutions. Unique features have been designed into our lithography systems to meet our customers’ changing process requirements. Our metrology and inspection technologies provide process control for the majority of wafers processed today in a semiconductor wafer fab. In front-end processes, thin film metrology and defect detection and classification technologies allow yield enhancement for critical processes such as photolithography, diffusion, etch, CMP and outgoing quality control. Within the final manufacturing (back-end) processes, our 2D/3D advanced macro defect inspection provides our customers with critical quality assurance and process information. Defects may be created during probing, bumping, dicing, assembly processes (RDLs, TSVs, copper pillars, etc.) or general handling and can have a major impact on device and process quality. Lastly, we turn all of the data gathered into useful knowledge for our customers to make yield-enhancing decisions, which lower their cost of goods sold (“COGS”) and improve their margins.
Process Control Business
Macro Defect Inspection. Chip manufacturers deploy advanced macro defect inspection throughout the production line to monitor key process steps, gather process-enhancing information and ultimately, lower manufacturing costs. Field-established tools such as the F30™ and NSX® inspection systems are found in the wafer fab (front-end) and packaging (back-end) facilities around the world. These high-speed tools incorporate features such as wafer-less recipe creation, tool-to-tool correlation and multiple inspection resolutions. In addition to wafer frontside inspection, Rudolph’s NovusEdge system allows wafer edge and backside inspection in one integrated platform to enhance productivity and continuously improve fab yield. Using Discover® yield management software, the vast amounts of data gathered through automated inspection can be analyzed and classified to determine trends and locate root causes that directly affect yield.
All-Surface Inspection. All-surface refers to inspection of the wafer frontside, edge, and backside as well as back-end die. The edge inspection process focuses on the area near the wafer edge, an area that poses difficulty for traditional wafer frontside inspection technology due to its varied topography and process variation. Edge bevel inspection looks for defects on the side edge of a wafer. Edge bead removal and edge exclusion metrology involve a topside surface measurement required exclusively in the photolithography process, primarily to determine if wafers have been properly aligned for the edge exclusion region. The primary reason for wafer backside inspection is to determine if contamination has been created that may spread throughout the wafer fab. For instance, it is critical that the wafer backside be free of defects prior to the photolithography process to prevent focus and exposure problems on the wafer frontside.
Residue Detection. Residue is difficult or impossible to see with conventional bright field or dark field imaging techniques using white light. Residue contaminants, such as residual photo resist, are often the root cause of field failures, which occur after the material has been exposed to normal operating conditions for extended periods. Rudolph’s established Clearfind™ technology highlights residue on bumps and bond pads or RDL vias so that they are easy to detect. On metals, it eliminates the high-contrast graininess seen under conventional illumination, resulting in an obvious defect signal against a featureless background. This same graininess in conventional imaging can also cause false positives, which are especially costly at this stage of the process where secondary inspections must be initiated to verify real defects and allow the false defects to continue through packaging. Finally, Clearfind technology readily detects shorts and opens in metal lines when inspected with an underlying organic layer.
4
Table of Contents
Automated Defect Classification and Pattern Analysis. Automating the defect detection and classification process is best done by a system that can mimic, or even extend, the response of the human eye, but at a much higher speed, with higher resolution and more consistency. To do this, our systems capture full-color whole wafer images using simultaneous dark and bright field illumination. The resulting bright and dark field images are compared to those from an “ideal” wafer having no defects. When a difference is detected, its image is broken down into mathematical vectors that allow rapid and accurate comparison with a library of known classified defects stored in the tool’s database. Patented and proprietary enhancements of this approach enable very fast and highly repeatable image classification. The system is pre-programmed with an extensive library of local, global, and color defects and can also store a virtually unlimited amount of new defect classes. This allows customers to define defects based on their existing defect classification system, provides more reliable automated rework decisions and enables more accurate statistical process control data. Reviewing defects off-line enables automated inspection systems to maintain their utilization for high throughput inspection. Using defect image files captured by automated inspection systems, operators are able to view high-resolution defect images to determine defects that cause catastrophic failure of a device, known as killer defects. Combining the review process with classifying defects enables faster analysis by grouping defects found together as one larger defect, a scratch for example, and defects of similar types across a wafer lot to be grouped based on size, repeating defects, and other user-defined specifications.
Yield Analysis. Using wafer maps, charts and graphs, the massive amounts of data gathered through automated inspection can be analyzed to determine trends across bumps, die, wafers and lots. This analysis may determine where a process variation or deviation has occurred, allowing process engineers to make corrections or enhancements to increase yields. Defect data analysis is performed to identify, analyze and locate the source of defects and other manufacturing process excursions. Using either a single wafer map or a composite map created from multiple wafer maps, this analysis enables identification of defect patterns and distribution. When combined with inspection data from strategically-placed inspection points, this analysis may pinpoint the source of the defects so corrective action can be taken.
Optical Acoustic Metrology. Optical acoustic metrology involves the use of ultra-fast laser induced sonar for metal and opaque thin film measurement. This technology sends ultrasonic waves into multi-layer opaque films and then analyzes the resulting reflected acoustic waves (echoes) to simultaneously determine the thickness of each individual layer in complex multi-layer metal film stacks. The reflected signal’s amplitude and phase can be used to detect film properties, missing layers and interlayer problems. Since different phenomena affect amplitude and phase uniquely, a variety of process critical interlayer problems can be detected in a single measurement. The use of optical acoustics to measure multi-layer metal and opaque films was pioneered by scientists at Brown University (“Brown”) in collaboration with engineers at Rudolph. The proprietary optical acoustic technology in our PULSE Technology™ systems measures the thickness of single or multi-layer opaque films, with a huge range of less than 40 Angstroms to greater than five microns. It provides these measurements at a rate of up to 70 wafers per hour within one to two percent accuracy and typically greater than 99 percent repeatability. This range of thicknesses covers the majority of thick and thin metal films projected by the International Roadmap for Semiconductors. Our non-contact, non-destructive optical acoustic technology and small spot size enable our PULSE Technology systems to measure film properties directly on product wafers.
Opaque Film Metrology. The MetaPULSE® systems allow customers to simultaneously measure the thickness and other properties of up to six metal or non-metallic opaque film layers without physically contacting product wafers in a non-destructive manner. PULSE Technology uses an ultra-fast laser to generate acoustic waves that pass down through a stack of opaque films such as those used in copper or aluminum interconnect processes, as well as the hard mask layer in 3D NAND chips, sending back to the surface a reflected signal (echo) that indicates film thickness, density, and other process critical parameters. We believe we are a leader in providing systems that can measure opaque thin-film stacks non-destructively with the speed and accuracy semiconductor device manufacturers demand in order to achieve high yields with the latest fabrication processes. The technology is ideal for characterizing copper interconnect structures. The MetaPULSE systems, used initially for fast and accurate measurements of metal interconnect in front-end wafer fabs, have now been chosen by back-end manufacturers to perform system measurements in new process applications such as RF filters and modules, driven by the need for on-product metrology as feature sizes decrease and pattern densities increase.
5
Table of Contents
Ellipsometry. Ellipsometry is a non-contact, non-destructive optical technique for transparent thin film measurement. We have been an industry leader in ellipsometry technology for the last three decades. We hold patents on several ellipsometry technologies, including our proprietary technique that uses four lasers for multiple-angle of incidence, multiple wavelength ellipsometry. Laser ellipsometry technology enables our transparent film systems to provide the increasingly higher level of accuracy needed as thinner films and newer materials are introduced for future generations of semiconductor devices. We extended this same optical technology to characterize the scatterometry signal from patterned surfaces, allowing measurement of critical dimensions.
Reflectometry. For applications requiring broader spectral coverage, some of our ellipsometry tools are also equipped with a reflectometer. Reflectometry uses a white or ultraviolet light source to determine the properties of transparent thin films by analyzing the wavelength and intensity of light reflected from the surface of a wafer. This optical information is processed with software algorithms to determine film thickness and other material properties. By combining data from both the laser ellipsometer and broad spectrum reflectometer, it is possible to characterize films and film stacks that cannot be adequately analyzed by either method individually.
Transparent Film Metrology. Rudolph’s patented transparent film technology uses up to four lasers operating simultaneously at multiple angles and multiple wavelengths, providing powerful analysis and measurement capabilities. Unlike the white-light sources used in spectroscopic ellipsometers, laser light sources make our metrology tools inherently stable, increase measurement speed and accuracy, and reduce maintenance costs by minimizing the time required to re-qualify a light source when it is replaced. Rudolph’s S3000SX™ System is targeted for transparent films in advanced semiconductor fabrication applications at the 28nm node and below. The S3000™ product family uses Rudolph’s proprietary Focused Beam Ellipsometry (“FBE”) and newly-designed Small Site Measurement Optics (“SSMO”) to measure the thickness of single layer and multi-layer films on product wafers, including device area at site sizes as small as 30x30 nanometers.
Probe Card Test and Analysis. The combination of fast 3D-OCM (optical comparative metrology) technology with improved testing accuracy and repeatability is designed to reduce total test time for even the most advanced large area probe cards. The 3D capabilities enable users to analyze probe marks and probe tips in a rapid and information-rich format.
Lithography Business
Step and Repeat Technology. Rudolph steppers use projection optics to expose circuit patterns from a mask or reticle onto a substrate to expose images with optimal fidelity. These systems employ light from a mercury arc lamp that is transmitted through a mask or reticle containing display circuit patterns. Substrates are aligned on the system and the mask is imaged through a projection lens onto photoresist material coated on the substrate. The substrate is then moved, or “stepped,” to a second position to expose an adjacent area. Images can be “stitched” together precisely to form larger circuit patterns without any noticeable change in circuit performance. The system repeats the step and exposure process until the entire substrate is patterned. Once the exposure process has been completed, the substrate is developed with an alkali solution to reveal the underlying material. The imaged photoresist serves as a stencil barrier that allows for the processing of the underlying metal or insulating layers. The substrates then continue through the etching, stripping and deposition processes until multi-layer circuits are completed.
Advanced Packaging Lithography Systems. In order to deal with increased input/output (“I/O”) resulting from devices with enhanced functionality, power distribution efficiency, and higher frequency, integrated device manufacturers (“IDMs”) and outsourced semiconductor assembly and test (“OSATs”) facilities must incorporate lithography capabilities to create RDLs for their advanced packaging technologies. However, the associated substrates and processes are significantly different than those used in front-end wafer processing. For advanced packaging, the lithography system must perform in a completely different application, with significantly different operating parameters. For example, most packaging is an additive process, while wafer processing is subtractive, and thick films, rather than thin films, are used to enable the creation of features. In order for equipment to effectively function in this environment, it must overcome these challenges. Rudolph’s JetStep Systems have been specifically designed to meet these challenges head on. The JetStep W Series is designed for wafers and
6
Table of Contents
other round substrates while the JetStep S Series is designed for rectangular substrates (panels). Both systems boast a large printable field, which when combined with user-selectable wavelength options, maximizes throughput while not limiting resolution when needed. High-fidelity optics are able to image the fine features required while at the same time achieving superior depth of field to minimize non-flatness that is typical for advanced packaging applications. On-the-fly auto focus and an innovative reticle management system improve yield and utilization. These features result in a revolutionary lithography system specifically designed to meet advanced packaging challenges.
Flat Panel Display (“FPD”) Lithography. A critical aspect of any leading mobile device is the display. The display serves as the window to the user. Therefore, it must effectively present graphics from a variety of apps, such as detailed maps, high resolution photos, and streaming video in order to provide an enhanced user experience. To accomplish this, the display’s thin film transistor (“TFT”) backplane, which controls the individual pixels, must operate at a high frequency and not limit the pixel resolution. As a result, the transistors must have high mobility and only use a small portion of the pixel aperture. The backplane is manufactured on a sheet of glass; like the packaging substrate, it is non-flat and tends to distort further during processing. Additionally, the displays are getting larger. Manufacturers are looking to utilize larger glass substrates, making throughput a challenge for the lithography equipment. To overcome this, Rudolph’s JetStep G Series uses high-fidelity optics and the largest printable stepper field available, enabling more displays per exposure. This feature, combined with on-the-fly auto-focus and magnification compensation, maximizes throughput and yield. Finally, our patented grid stage allows the system to be easily configurable to meet the customer desired substrate size.
Integrated Software Solutions
Process Control Software. We provide a wide range of advanced process control solutions, all designed to improve factory profitability, including run-to-run control, fault detection, classification and tool automation. Rudolph is a leading provider of Process Control Software in the semiconductor industry. Advanced process control (“APC”) employs software to automatically detect or predict tool failure (fault detection) as well as calculate recipe settings for a process that will drive the yielded output to meet and exceed the target, despite variations in the incoming material and minor instabilities within the process equipment. Process control software enables the factory to increase capacity and yield while decreasing rework and scrap. It enables reduced production costs by lowering consumables, process engineering time and manufacturing cycle time.
Yield Management Software. Semiconductor manufacturers use yield management software (“YMS”) to obtain valuable process yield and equipment productivity information. The data necessary to generate productivity information comes from many different sources throughout the wafer fab: inspection and metrology systems, tool sensors, tool recipes, electrical tests and the fab environment. As the complexity and cost of manufacturing processes increase, the value of faster, better analysis to support critical manufacturing decisions grows. As a result, customers are demanding robust yield management systems that can analyze large, complex data sets quickly and effectively. Rudolph’s fully-integrated YMS are designed to analyze data from disparate sources and multiple sites to maximize productivity across the entire value chain.
7
Table of Contents
Products
Rudolph markets and sells products to major analog, logic, memory, RF, CMOS Image Sensors, MEMs, and flat panel display manufacturers. These customers are IDMs, OSAT manufacturers, and foundries that are producing wafers and packages for fabless design companies. Our customers rely on us for versatile inspection, lithography and metrology systems as well as process control software solutions. These products are designed for high-volume production facilities and offer automated wafer handling for 200mm and 300mm configurations and panel handling up to 720 x 930mm. Our systems operate at high throughput in an ultra-clean operating mode with high reliability.
| | | | | | |
| | PROCESS CONTROL SYSTEMS | | |
| | | | Location of Process |
| First | | | | |
Product | Introduced | Functionality | Front-end | Back-end |
Dragonfly™G2 Inspection System | 2018 | — | | 2D/3D Advanced Packaging inspection and metrology | X | X |
NovusEdge™ Wafer Inspection System | 2018 | — | | Bare wafer edge and backside inspection | X | |
Dragonfly™ Inspection System | 2016 | — | | 2D/3D inspection and metrology | X | X |
Firefly™ Inspection Series | 2016 | — | | Sub-micron defect and residue inspection | X | X |
AWX™ Series | 2011 | — | | Unpatterned wafer inspection and process monitoring system | X | X |
F30™ Inspection Module | 2011 | — | | Front-side macro defect inspection system | X | |
Explorer® Inspection Platform | 2009 | — | | Handling platform that supports a family of multi surface inspection tools, using one or more inspection modules | X | |
B30™ Inspection Module | 2003 | — | | Defect inspection module for the wafer’s backside | X | X |
E30™ Inspection Module | 2003 | — | | Defect inspection module for the wafer’s edge | X | X |
PrecisionWoRx® System | 2008 | — | | Probe card test and analysis system | | X |
S3000™ System | 2006 | — | | Transparent thin film metrology system | X | |
MetaPULSE® System | 1997 | — | | Opaque (metal) thin film metrology system | X | X |
NSX® Inspection System | 1997 | — | | 2D/3D wafer, die and bump inspection system | | X |
8
Table of Contents
| | | | | | |
| | | | | | |
| | LITHOGRAPHY SYSTEMS | | |
| | | | Location of Process |
| First | | | | |
Product | Introduced | | Functionality | Front-end | Back-end |
JetStep® S Lithography System | 2013 | — | | 2x reduction step and repeat system for advanced packaging lithography on square or rectangular substrates up to Gen 3.5 size | | X |
JetStep® W Lithography System | 2012 | — | | 2x reduction step and repeat system for advanced packaging applications on wafers or round substrates | | X |
JetStep® G45 FPD Lithography System | 2007 | — | | Step and repeat lithography printer for Gen 4.5 substrates | X | |
JetStep® G35 FPD Lithography System | 2006 | — | | Step and repeat lithography printer for Gen 3.5 substrates | X | |
| | | | | | | |
| | INTEGRATED SOFTWARE SOLUTIONS SOFTWARE | | |
| | | | Location of Process |
| First | | | | |
Product | Introduced | Functionality | Front-end | Back-end |
Equipment Sentinel™ Software | 2015 | — | | Fault detection and classification software | X | X |
Discover® Software | 2007 | — | | Tool-centric yield management system | X | X |
TrueADC® Enterprise Software | 2007 | — | | Automatic defect classification software | X | X |
Process Sentinel® Software | 2006 | — | | Fab-wide spatial process control system | X | |
Yield Optimizer™ Software | 2006 | — | | Yield enhancement model software | X | |
Discover® Enterprise Software | 2005 | — | | Fabwide yield management system | X | X |
GateWay™ Software | 2003 | — | | Data collection and facilitation to FDC software | X | X |
9
Table of Contents
| | | | | | |
| | | | | | |
| | INTEGRATED SOFTWARE SOLUTIONS SOFTWARE | | |
| | | | Location of Process |
| First | | | | |
Product | Introduced | Functionality | Front-end | Back-end |
ProcessWORKS® Software | 1998 | — | | Run-to-run process control software | X | |
RecipeWORKS™ Software | 1998 | — | | Factory-level client-server based recipe management system | X | X |
AutoShell® Software | 1998 | — | | Equipment and factory automation software | X | X |
Genesis® Software | 1997 | — | | Off-line yield management system | X | |
ControlWORKS® Software | 1994 | — | | Advanced equipment control software | X | |
Customers
Over 150 microelectronic device manufacturers have purchased Rudolph tools and software for installation at multiple sites. We support a diverse customer base in terms of both geographic location and type of device manufactured. Our customers are located in 20 countries. See Note 14 to our consolidated financial statements in this Annual Report on Form 10-K for information concerning our geographic information.
In 2018, sales to SK Hynix Inc. accounted for 12.2% of our revenue. No individual end user customer accounted for more than 10% of our revenue in 2017 and 2016. We do not have purchase contracts with any of our customers that obligate them to continue to purchase our products.
Research and Development
The markets for equipment and systems for manufacturing semiconductor devices and for performing macro-defect inspection, advanced packaging lithography and thin film transparent and opaque process control metrology are characterized by continuous technological development and product innovations. We believe that the rapid and ongoing development of new products and enhancements to existing products is critical to our success. Accordingly, we devote a significant portion of our technical, management and financial resources to research and development programs. As of December 31, 2018, we employed 199 engineering personnel.
Our research and development expenditures in 2018, 2017 and 2016 were $49.1 million, $47.0 million and $45.0 million, respectively. We expect to continue our strong commitment to new product development and will continue to allocate significant resources to these efforts in the future.
Sales, Customer Service and Application Support
We maintain an extensive network of direct sales, customer service and application support offices in the United States, Europe and Asia.
We provide our customers with comprehensive support before, during and after the delivery of our products. For example, in order to facilitate the smooth integration of our tools into our customers’ operations, we often assign dedicated, site-specific field service and applications engineers to provide long-term support at selected customer sites. We also provide comprehensive service and applications training for customers at our training facilities in Bloomington, Minnesota and Budd Lake, New Jersey and at customer locations. In addition, we maintain a group of highly skilled applications scientists at strategically located facilities throughout the world and at selected customer locations. As of December 31, 2018, we employed 282 sales and marketing, service and applications support personnel.
10
Table of Contents
Manufacturing
Our principal manufacturing activities include assembly, final test and calibration. These activities are conducted in our manufacturing facilities in Bloomington, Minnesota and Wilmington, Massachusetts. Our core manufacturing competencies include electrical, optical and mechanical assembly and testing, as well as the management of new product transitions. While we use standard components and subassemblies wherever possible, most mechanical parts, metal fabrications and critical components used in our products are engineered and manufactured to our specifications. We continue to rely on subcontractors and turnkey suppliers to fabricate components, build assemblies and perform other non-core activities in a cost-effective manner. As of December 31, 2018, we employed 94 manufacturing personnel.
We rely on a number of limited source suppliers for certain parts and subassemblies. This reliance creates a potential inability to obtain an adequate supply of required components, and reduced control over pricing and time of delivery of components. An inability to obtain adequate supplies would require us to seek alternative sources of supply or might require us to redesign our systems to accommodate different components or subassemblies. To date, we have not experienced any significant delivery delays. However, if we were forced to seek alternative sources of supply, manufacture such components or subassemblies internally, or redesign our products, this could prevent us from shipping our products to our customers on a timely basis, which could have a material adverse effect on our operations.
Intellectual Property
We have a policy of seeking patents on inventions governing new products or technologies as part of our ongoing research, development, and manufacturing activities. As of December 31, 2018, we have been granted, or hold exclusive licenses to, 276 U.S. and foreign patents. The patents we own, jointly own or exclusively license have expiration dates ranging from 2019 to 2036. We also have 56 pending regular and provisional applications in the U.S. and other countries. Our patents and applications principally cover various aspects of macro-defect detection and classification, transparent thin film measurement, altered material characterization, lithography techniques and automation.
We have been granted patent licenses by organizations such as Brown and the University of Colorado. These licenses are subject to rights retained by these organizations and, where applicable the United States government, for their own non-commercial uses. These patents relate to opto-acoustic metrology technology that underlies our opaque film products such as the MetaPULSE product family. The terms of these licenses are equal to the lives of the patents. We pay royalties to Brown and the University of Colorado based upon a percentage of our revenue from the sale of systems that incorporate the licensed technology. We continue to work with Brown and the University of Colorado on the development of advancements in relevant technical areas. We also continue to pursue intellectual property protection, including exclusive licenses to this technology. Note that third party licensees may terminate a license if we fail to pay royalties or if we materially breach our license agreements with those third parties.
Our pending patents may never be issued, and even if they are, these patents, our existing patents and the patents we license may not provide sufficiently broad protection to protect our proprietary rights, or they may prove to be unenforceable. To protect our proprietary rights, we also rely on a combination of copyrights, trademarks, trade secret laws, contractual provisions and licenses. There can be no assurance that any patents issued to or licensed by us will not be challenged, invalidated or circumvented or that the rights granted thereunder will provide us with a competitive advantage.
The laws of some foreign countries do not protect our proprietary rights to the same degree as do the laws of the United States, and many U.S. companies have encountered substantial infringement problems in protecting their proprietary rights against infringement in such countries, some of which are countries in which we have sold and continue to sell products. There is a risk that our means of protecting our proprietary rights may not be adequate. For example, our competitors may independently develop similar technology or duplicate our products. If we fail to adequately protect our intellectual property, it would be easier for our competitors to sell competing products.
Competition
The market for semiconductor capital equipment is highly competitive. We face substantial competition from established companies in each of the markets that we serve. We principally compete with KLA Corporation, Camtek and Veeco Instruments. We compete to a lesser extent with companies such as Nanometrics, Nova Measuring Instruments and Nikon. Each of our products also competes with products that use different metrology and inspection techniques. Some of our competitors have greater financial, engineering, manufacturing and marketing resources, broader product offerings and service capabilities and larger installed customer bases than we do.
11
Table of Contents
Significant competitive factors in the market for inspection and metrology systems include system performance, ease of use, reliability, cost of ownership, technical support and customer relationships. We believe that, while price and delivery are important competitive factors, the customers’ overriding requirement is for a product that meets their technical capabilities. To remain competitive, we believe we will need to maintain a high level of investment in research and development and process applications. No assurances can be given that we will continue to be competitive in the future.
Backlog
We schedule production of our systems based upon order backlog and informal customer forecasts. We use the term “backlog” to refer to only those orders to which the customer has been assigned a purchase order number and for which delivery is anticipated within 12 months. Because shipment dates may be changed and customers may cancel or delay orders with little or no penalty, our backlog as of any particular date may not be a reliable indicator of actual sales for any succeeding period. At December 31, 2018, we had a backlog of approximately $62.7 million compared with a backlog of approximately $87.8 million at December 31, 2017.
Employees
As of December 31, 2018, we had 651 employees. Our employees are not represented by any collective bargaining agreements, and we have never experienced a work stoppage. We believe our employee relations are good.
Available Information
We were incorporated in Delaware in 1999. The Internet website address of Rudolph Technologies, Inc. is http://www.rudolphtech.com. The information on our website is not incorporated into this Annual Report. The Company’s Annual Reports on Form 10-K, Quarterly Reports on Form 10-Q and Current Reports on Form 8-K (and any amendments to those reports) are made available free of charge, on or through our Internet website, as soon as reasonably practicable after such material is electronically filed with or furnished to the SEC. All filings we make with the SEC are also available free of charge via EDGAR through the SEC’s website at http://www.sec.gov.
We also make available, free of charge, through the investors page on our corporate website, Rudolph Technologies’ corporate summary, Code of Business Conduct and Ethics and Financial Code of Ethics, charters of the committees of our Board of Directors, as well as other information and materials, including information about how to contact our Board of Directors, its committees and their members. To find this information and obtain copies, visit our website at http://www.rudolphtech.com.
12
Table of Contents
Risks Related to Rudolph
Our operating results have varied, and will likely continue to vary significantly from quarter to quarter in the future, causing volatility in our stock price.
Our quarterly operating results have varied in the past and will likely continue to vary significantly from quarter to quarter in the future, causing volatility in our stock price. Some of the factors that may influence our operating results and subject our stock to extreme price and volume fluctuations include:
| • | changes in customer demand for our systems, which is influenced by economic conditions in the semiconductor device industry, demand for products that use semiconductors, market acceptance of our systems and products of our customers and changes in our product offerings; |
| • | seasonal variations in customer demand; |
| • | the timing, cancellation or delay of customer orders, shipments and acceptance; |
| • | a significant portion of our revenue may be derived from the sale of a relatively small number of systems; accordingly, a small change in the number of systems we sell may cause significant changes in our operating results; |
| • | product development costs, including increased research, development, engineering and marketing expenses associated with our introduction of new products and product enhancements; and |
| • | the levels of our fixed expenses, including research and development costs associated with product development, relative to our revenue levels. |
In light of these factors and the cyclical nature of the semiconductor industry, we expect to continue to experience significant fluctuations in quarterly and annual operating results. Moreover, many of our expenses are fixed in the short-term which, together with the need for continued investment in research and development, marketing and customer support, limits our ability to reduce expenses quickly. As a result, declines in net sales could harm our business and the price of our common stock could substantially decline.
Our largest customers account for a substantial portion of our revenue, and our revenue and cash flows could decline considerably if one or more of these customers were to purchase significantly fewer of our systems or delay or cancel a large order.
Sales to end user customers that individually represent at least five percent of our revenue typically account for, in the aggregate, a considerable amount of our revenue. We operate in the highly concentrated, capital-intensive semiconductor device manufacturing industry. Historically, a substantial portion of our revenue in each quarter and year has been derived from sales to relatively few customers, and this trend is expected to continue. If any of our key customers were to purchase significantly fewer of our systems in the future, or if they delay or cancel a large order, our revenue and cash flows could meaningfully decline. We expect that we will continue to depend on a small number of large customers for a sizable portion of our revenue. In addition, as large semiconductor device manufacturers seek to establish closer relationships with their suppliers, we expect that our customer base will become even more concentrated.
Our customers may be unable to pay us for our products and services.
Our customers include some companies that may, from time to time, encounter financial difficulties. If a customer’s financial difficulties become severe, the customer may be unwilling or unable to pay our invoices in the ordinary course of business, which could adversely affect collections of both our accounts receivable balance and unbilled services. The bankruptcy of a customer with a substantial account balance owed to us could have a material adverse effect on our financial condition and results of operations. In addition, if a customer declares bankruptcy after paying us certain invoices, a court may determine that we are not properly entitled to that payment and may require repayment of some or all of the amount we received, which could adversely affect our financial condition and results of operations.
Variations in the amount of time it takes for us to sell our systems may cause fluctuations in our operating results, which could cause our stock price to decline.
Variations in the length of our sales cycles could cause our revenue and cash flows, and consequently, our business, financial condition, operating results and cash flows to fluctuate widely from period to period. This variation could cause our
13
Table of Contents
stock price to decline. Our customers generally take a long time to evaluate our inspection and/or film metrology systems and many people are involved in the evaluation process. We expend significant resources educating and providing information to our prospective customers regarding the uses and benefits of our systems in the semiconductor fabrication process. The length of time it takes for us to make a sale depends upon many factors, including, but not limited to:
| • | the efforts of our sales force; |
| • | the complexity of the customer’s fabrication processes; |
| • | the internal technical capabilities and sophistication of the customer; |
| • | the customer’s budgetary constraints; and |
| • | the quality and sophistication of the customer’s current metrology, inspection or lithography equipment. |
Because of the number of factors influencing the sales process, the period between our initial contact with a customer and the time when we recognize revenue from that customer and receive payment, if ever, varies widely in length. Our sales cycles, including the time it takes for us to build a product to customer specifications after receiving an order to the time we recognize revenue, typically range from six to twenty-four months. Sometimes our sales cycles can be much longer, particularly with customers in Japan. During these cycles, we commit substantial resources to our sales efforts in advance of receiving any revenue, and we may never receive any revenue from a customer despite our sales efforts. If we do make a sale, our customers often purchase only one of our systems, the performance of which they then evaluate for a lengthy period before purchasing any more of our systems. The number of additional products a customer purchases, if any, depends on many factors, including the customer’s capacity requirements. The period between a customer’s initial purchase and any subsequent purchases can vary from six months to a year or longer, and variations in the length of this period could cause further fluctuations in our operating results and, possibly, in our stock price.
Most of our revenue has been derived from customers outside of the United States, subjecting us to operational, financial and political risks, such as unexpected changes in regulatory requirements, tariffs, political and economic instability, outbreaks of hostilities, and difficulties in managing foreign sales representatives and foreign branch operations, as well as risks associated with foreign currency fluctuations.
Due to the significant level of our international sales, we are subject to a number of material risks, including:
Compliance with foreign laws. Our business is subject to risks inherent in doing business internationally, including compliance with, inconsistencies among, and unexpected changes in, a wide variety of foreign laws and regulatory environments with which we are not familiar, including, among other issues, with respect to employees, protection of our intellectual property, and a wide variety of operational regulations and trade and export controls under domestic, foreign, and international law.
Unexpected changes in regulatory requirements including tariffs and other market barriers. The semiconductor device industry is a high-visibility industry in many of the European and Asian countries in which we sell our products. Because the governments of these countries have provided extensive financial support to our semiconductor device manufacturing customers in these countries, we believe that our customers could be disproportionately affected by any trade embargoes, excise taxes, tariffs or other restrictions imposed by their governments on trade with United States companies such as ourselves, particularly with respect to the ongoing trade negotiations between the United States and China. If the United States and China do not reach agreement on a trade policy, tariffs imposed by China may result in lower sales to customers in China as the costs of our products become more expensive to such customers. In addition, tariffs imposed by the United States will increase the cost of raw materials that we import from China. Any restrictions of these types could result in a reduction in our sales to customers in these countries.
Political and economic instability. We are subject to various global risks related to political and economic instabilities in countries in which we derive sales. If terrorist activities, armed conflict, civil or military unrest or political instability occurs outside of the U.S., these events may result in reduced demand for our products. There is considerable political instability in Taiwan related to its disputes with China and in South Korea related to its disputes with North Korea. In addition, several Asian countries, particularly Japan, have experienced significant economic instability. An outbreak of hostilities or other political upheaval in China, Taiwan or South Korea, or an economic downturn in Japan or other countries, would likely harm the operations of our customers in these countries. The effect of these types of events on our revenue and cash flows could be material because we derive substantial revenue from sales to semiconductor device foundries in Taiwan such as Taiwan Semiconductor Manufacturing Company Ltd., from memory chip manufacturers in South Korea such as Samsung Electronics Co., Ltd., and from semiconductor device manufacturers in Japan such as Toshiba Corporation.
14
Table of Contents
Difficulties in staffing and managing foreign branch operations. During periods of tension between the governments of the United States and certain other countries, it is often difficult for United States companies such as ourselves to staff and manage operations in such countries. Language and other cultural differences may also inhibit our sales and marketing efforts and create internal communication problems among our U.S. and foreign research and development teams, increasing the difficulty of managing multiple remote locations performing various development, quality assurance, and yield ramp analysis projects.
Currency fluctuations as compared to the U.S. Dollar. A substantial portion of our international sales are denominated in U.S. dollars. As a result, if the dollar rises in value in relation to foreign currencies, our systems will become more expensive to customers outside the United States and less competitive with systems produced by competitors outside the United States. These conditions could negatively impact our international sales. Foreign sales also expose us to collection risk in the event it becomes more expensive for our foreign customers to convert their local currencies into U.S. dollars. Additionally, in the event a larger portion of our revenue becomes denominated in foreign currencies, we would be subject to a potentially significant exchange rate risk.
If we deliver systems with defects, our credibility will be harmed and the sales and market acceptance of our systems will decrease.
Our systems are complex and have occasionally contained errors, defects and bugs when introduced. Defects may be created during probing, bumping, dicing or general handling, and can have a major impact on device and process quality. When this occurs, our credibility and the market acceptance and sales of our systems could be harmed. Further, if our systems contain errors, defects or bugs, computer viruses or malicious code as a result of cyber-attacks to our computer networks, we may be required to expend significant capital and resources to alleviate these problems. Defects could also lead to product liability as a result of product liability lawsuits against us or against our customers. We have agreed to indemnify our customers under certain circumstances against liability arising from defects in our systems. Our product liability insurance policy currently provides $2.0 million of aggregate coverage, with an overall umbrella limit of $20.0 million. In the event of a successful product liability claim, we could be obligated to pay damages significantly in excess of our product liability insurance limits.
If we are not successful in developing new and enhanced products for the semiconductor device manufacturing industry, we will lose sales and market share to our competitors.
We operate in an industry that is highly competitive and subject to evolving industry standards, rapid technological changes, rapid changes in consumer demands and the rapid introduction of new, higher performance systems with shorter product life cycles. To be competitive in our demanding market, we must continually design, develop and introduce in a timely manner new lithography, inspection and metrology process control systems that meet the performance and price demands of semiconductor device manufacturers. We must also continue to refine our current systems so that they remain competitive. We expect to continue to make significant investments in our research and development activities. We may experience difficulties or delays in our development efforts with respect to new systems, and we may not ultimately be successful in our product enhancement efforts to improve and advance products or in responding effectively to technological change, as not all research and development activities result in viable commercial products. In addition, we cannot provide assurance that we will be able to develop new products for the most opportunistic new markets and applications. Any significant delay in releasing new systems could cause our products to become obsolete, adversely affect our reputation, give a competitor a first-to-market advantage or cause a competitor to achieve greater market share.
If new products developed by us do not gain general market acceptance, we will be unable to generate revenue and recover our research and development costs.
Inspection, lithography and metrology product development is inherently risky because it is difficult to foresee developments in semiconductor device manufacturing technology, coordinate technical personnel, and identify and eliminate system design flaws. Further, our products are complex and often the applications to our customers’ businesses are unique. Any new systems we introduce may not achieve or sustain a significant degree of market acceptance and sales.
We expect to spend a significant amount of time and resources developing new systems and refining our existing systems. In light of the long product development cycles inherent in our industry, these expenditures will be made well in advance of the prospect of deriving revenue from the sale of those systems. Our ability to commercially introduce and successfully market new systems are subject to a wide variety of challenges during the development cycle, including start-up bugs, design defects, and other matters that could delay introduction of these systems. In addition, since our customers are not obligated by long-term contracts to purchase our systems, our anticipated product orders may not materialize, or orders
15
Table of Contents
that are placed may be canceled. As a result, if we do not achieve market acceptance of new products, we may be unable to generate sufficient revenue and cash flow to recover our research and development costs and our market share, revenue, operating results or stock price would be negatively impacted.
Even if we are able to develop new products that gain market acceptance, sales of these new products could impair our ability to sell existing products.
Competition from our new systems could have a negative effect on sales of our existing systems and the prices that we could charge for these systems. We may also divert sales and marketing resources from our current systems in order to successfully launch and promote our new or next generation systems. This diversion of resources could have a further negative effect on sales of our current systems and the value of inventory.
If our relationships with our large customers deteriorate, our product development activities could be adversely affected.
The success of our product development efforts depends on our ability to anticipate market trends and the price, performance and functionality requirements of semiconductor device manufacturers. In order to anticipate these trends and ensure that critical development projects proceed in a coordinated manner, we must continue to collaborate closely with our largest customers. Our relationships with these and other customers provide us with access to valuable information regarding trends in the semiconductor device industry, which enables us to better plan our product development activities. If our current relationships with our large customers are impaired, or if we are unable to develop similar collaborative relationships with important customers in the future, our product development activities could be adversely affected.
Our ability to reduce costs is limited by our ongoing need to invest in research and development and to provide customer support activities.
Our industry is characterized by the need for continual investment in research and development as well as customer service and support. As a result, our operating results could be materially affected if operating costs associated with our research and development as well as customer support activities increase in the future or we are unable to reduce those activities.
We may fail to adequately protect our intellectual property and, therefore, lose our competitive advantage.
Our future success and competitive position depend in part upon our ability to obtain and maintain proprietary technology for our principal product families, and we rely, in part, on patent and trade secret law and confidentiality agreements to protect that technology. If we fail to adequately protect our intellectual property, it will give our competitors a significant advantage. We own or have licensed a number of patents relating to our transparent and opaque thin film metrology, lithography and macro-defect inspection systems, and have filed applications for additional patents. Any of our pending patent applications may be rejected, and we may be unable to develop additional proprietary technology that is patentable in the future.
In addition, the patents that we do own or that have been issued or licensed to us may not provide us with competitive advantages and may be challenged by third parties. Further, third parties may also design around these patents. In addition to patent protection, we rely upon trade secret protection for our confidential and proprietary information and technology. We routinely enter into confidentiality agreements with our employees and other third parties. Even though these agreements are in place, there can be no assurances that trade secrets and proprietary information will not be disclosed, that others will not independently develop substantially equivalent proprietary information and techniques or otherwise gain access to our trade secrets, or that we can fully protect our trade secrets and proprietary information. Violations by others of our confidentiality agreements and the loss of employees who have specialized knowledge and expertise could harm our competitive position and cause our sales and operating results to decline as a result of increased competition. Costly and time-consuming litigation might be necessary to enforce and determine the scope of our proprietary rights, and failure to obtain or maintain trade secret protection might adversely affect our ability to continue our research or bring products to market.
16
Table of Contents
Protection of our intellectual property rights, or the efforts of third parties to enforce their own intellectual property rights against us, may result in costly and time-consuming litigation, substantial damages, lost product sales and/or the loss of important intellectual property rights.
We may be required to initiate litigation in order to enforce any patents issued to or licensed by us or to determine the scope or validity of a third party’s patent or other proprietary rights. Any litigation, regardless of outcome, could be expensive and time consuming and could subject us to significant liabilities or require us to re-engineer our products or obtain expensive licenses from third parties. There can be no assurance that any patents issued to or licensed by us will not be challenged, invalidated or circumvented, or that the rights granted thereunder will provide us with a competitive advantage.
In addition, our commercial success depends in part on our ability to avoid infringing or misappropriating patents or other proprietary rights owned by third parties. From time to time, we may receive communications from third parties asserting that our products or systems infringe, or may infringe, on the proprietary rights of these third parties. These claims of infringement may lead to protracted and costly litigation, which could require us to pay substantial damages or have the sale of our products or systems stopped by an injunction. Infringement claims could also cause product or system delays or require us to redesign our products or systems, and these delays could result in the loss of substantial revenue. We may also be required to obtain a license from the third party or cease activities utilizing the third party’s proprietary rights. We may not be able to enter into such a license or such a license may not be available on commercially reasonable terms. Accordingly, the loss of important intellectual property rights could hinder our ability to sell our systems or to make the sale of these systems more expensive.
Our efforts to protect our intellectual property may be less effective in certain foreign countries where intellectual property rights are not as well protected as in the United States.
The laws of some foreign countries do not protect our proprietary rights to as great an extent as do the laws of the United States, and many U.S. companies have encountered substantial problems in protecting their proprietary rights against infringement abroad. For example, Taiwan is not a signatory of the Patent Cooperation Treaty, which is designed to specify rules and methods for defending intellectual property internationally. The publication of a patent in Taiwan prior to the filing of a patent in Taiwan would invalidate the ability of a company to obtain a patent in Taiwan. Similarly, in contrast to the United States where the contents of patents remain confidential during the patent application process, in Taiwan, the contents of a patent are published upon filing, which provides competitors an advance view of the contents of a patent application prior to the establishment of patent rights. Consequently, there is a risk that we may be unable to adequately protect our proprietary rights in certain foreign countries. If this occurs, it would be easier for our competitors to develop and sell competing products in these countries.
Some of our current and potential competitors have significantly greater resources than we do, and increased competition could impair sales of our products or cause us to reduce our prices.
The market for semiconductor capital equipment is highly competitive. We face substantial competition from established companies in each of the markets we serve. We principally compete with KLA Corporation, Camtek and Veeco Instruments. We compete to a lesser extent with companies such as Nanometrics, Nova Measuring Instruments and Nikon. Each of our products also competes with products that use different metrology, inspection or lithography techniques. Some of our competitors have greater financial, engineering, manufacturing and marketing resources, broader product offerings and service capabilities and larger installed customer bases than we do. As a result, these competitors may be able to respond more quickly to new or emerging technologies or market developments by devoting greater resources to the development, promotion and sale of products, which, in turn, could impair sales of our products. Further, there may be significant merger and acquisition activity among our competitors and potential competitors, which, in turn, may provide them with a competitive advantage over us by enabling them to rapidly expand their product offerings and service capabilities to meet a broader range of customer needs.
Many of our customers and potential customers in the semiconductor device manufacturing industry are large companies that require global support and service for their semiconductor capital equipment. We believe that our global support and service infrastructure is sufficient to meet the needs of our customers and potential customers. However, some of our competitors have more extensive infrastructures than we do, which could place us at a disadvantage when competing for the business of global semiconductor device manufacturers. Many of our competitors are investing heavily in the development of new systems that will compete directly with our systems. We have, from time to time, selectively reduced prices on our systems in order to protect our market share, and competitive pressures may necessitate further price reductions. We expect our competitors in each product area to continue to improve the design and performance of their products and to
17
Table of Contents
introduce new products with competitive prices and performance characteristics. These product introductions would likely require us to decrease the prices of our systems and increase the level of discounts that we grant our customers. Price reductions or lost sales as a result of these competitive pressures would reduce our total revenue and could adversely impact our financial results.
Because of the high cost of switching equipment vendors in our markets, it is sometimes difficult for us to win new customers from our competitors even if our systems are superior to theirs.
We believe that once a semiconductor device manufacturer has selected one vendor’s capital equipment for a production-line application, the manufacturer generally relies upon that capital equipment and, to the extent possible, subsequent generations of the same vendor’s equipment for the life of the application. Once a vendor’s equipment has been installed in a production line application, a semiconductor device manufacturer must often make substantial technical modifications and may experience production-line downtime in order to switch to another vendor’s equipment. Accordingly, unless our systems offer performance or cost advantages that outweigh a customer’s expense of switching to our systems, it will be difficult for us to achieve significant sales to that manufacturer once it has selected another vendor’s capital equipment for an application.
We must attract and retain experienced senior executives and other key personnel with knowledge of semiconductor device manufacturing and inspection, metrology or lithography equipment and related software to help support our future growth, and competition for such personnel in our industry is high.
Our success depends, to a significant degree, upon the continued contributions of our key executive management, engineering, sales and marketing, customer support, finance and manufacturing personnel. The loss of any of these key personnel through resignations, retirement or other circumstances, each of whom would be extremely difficult to replace, could harm our business and operating results. Although we have employment and noncompetition agreements with key members of our senior management team, these individuals or other key employees may still leave us, which could have a material adverse effect on our business. We do not have key person life insurance on any of our executives. In addition, to support our future growth, we will need to attract and retain additional qualified employees. Competition for such personnel in our industry is intense, and we may not be successful in attracting and retaining qualified employees.
We obtain some of the components and subassemblies included in our systems from a limited group of suppliers, and the partial or complete loss of one of these suppliers could cause production delays and a substantial loss of revenue.
We obtain some of the components and subassemblies included in our systems from a limited group of suppliers and do not have long-term contracts with many of our suppliers. Our dependence on limited source suppliers of components and our lack of long-term contracts with many of our suppliers expose us to several risks, including a potential inability to obtain an adequate supply of components, price increases, late deliveries and poor component quality. Disruption or termination of the supply of these components could delay shipments of our systems, damage our customer relationships and reduce our sales. From time to time in the past, we have experienced temporary difficulties in receiving shipments from our suppliers. The lead-time required for shipments of some of our components can be as long as six months. In addition, the lead time required to qualify new suppliers for lasers and certain optics could be as long as a year, and the lead time required to qualify new suppliers of other components could be as long as nine months. If we are unable to accurately predict our component needs, or if our component supply is disrupted, we may miss market opportunities by not being able to meet the demand for our systems. Further, a significant increase in the price of one or more of these components or subassemblies could seriously harm our results of operations and cash flows.
Any prolonged disruption in the operations of our manufacturing facility could have a material adverse effect on our revenue.
Our manufacturing processes are highly complex and require sophisticated and costly equipment and a specially designed facility. As a result, any prolonged disruption in the operations of our manufacturing facility, whether due to technical or labor difficulties, or destruction, or damage as a result of a fire or any other reason, could seriously harm our ability to satisfy our customer order deadlines. If we cannot timely deliver our systems, our results from operations and cash flows could be materially and adversely affected.
18
Table of Contents
Our business is subject to cybersecurity risks.
Information technology systems are increasingly threatened by cybersecurity risks and cyber incidents or attacks. Cybersecurity attacks could include, but are not limited to, malicious software, viruses, attempts to gain unauthorized access, whether through malfeasance or error, either from within or outside of our organization, to our data or that of our customers or our customers’ customers which may be in our possession, and the unauthorized release, corruption or loss of the data, loss of the intellectual property, theft of the proprietary or licensed technology, whether ours, that of our customers or their customers, loss or damage to our data delivery systems, other electronic security breaches that could lead to disruptions in our critical systems, and increased costs to prevent, respond to or mitigate cybersecurity events. It is possible that our business, financial and other systems could be compromised, which might not be noticed for some period of time. Although we utilize various procedures and controls to mitigate our exposure to such risk, cybersecurity attacks are evolving and unpredictable and we cannot guarantee that any risk prevention measures implemented will be successful. The occurrence of such an attack could lead to financial losses and have a material adverse effect on our reputation, business, financial condition and results of operations.
Failure to adjust our orders for parts and subcomponents in an accurate and timely manner in response to changing market conditions or customer acceptance of our products could adversely affect our financial position and results of operations.
Our earnings could be negatively affected and our inventory levels could materially increase if we are unable to predict our inventory needs in an accurate and timely manner and adjust our orders for parts and subcomponents in the event that our needs increase or decrease materially due to unexpected increases or decreases in demand for our products. Any material increase in our inventories could result in an adverse effect on our financial position, while any material decrease in our ability to procure needed inventories could result in an inability to supply customer demand for our products, thus adversely affecting our revenue.
Our ability to fulfill our backlog may have an effect on our long term ability to procure contracts and fulfill current contracts.
Our ability to fulfill our backlog may be limited by our ability to devote sufficient financial and human capital resources and may be limited by available material supplies. If we do not fulfill our backlog in a timely manner, we may experience delays in product delivery, which would postpone receipt of revenue from those delayed deliveries. Additionally, if we are consistently unable to fulfill our backlog, this may be a disincentive to customers to award large contracts to us in the future until they are comfortable that we can effectively manage our backlog.
We may choose to acquire new and complementary businesses, products or technologies instead of developing them ourselves, and we may be unable to complete these acquisitions or may not be able to successfully integrate an acquired business in a cost-effective and non-disruptive manner.
Our success depends on our ability to continually enhance and broaden our product offerings in response to changing technologies, customer demands and competitive pressures. To this end, we have, from time to time, engaged in the process of identifying, analyzing and negotiating possible acquisition transactions, and, from time to time, acquiring one or more businesses, and we expect to continue to do so in the future. We may choose to acquire new and complementary businesses, products, technologies and/or services instead of developing them ourselves. We may, however, face competition for acquisition targets from larger and more established companies with greater financial resources, making it more difficult for us to complete acquisitions. We cannot provide any assurance that we will be successful in consummating future acquisitions on favorable terms or that we will realize the benefits that we anticipate from one or more acquisitions that we consummate. Integrating any business, product, technology or service into our current operations could be expensive and time-consuming and/or disrupt our ongoing business. Further, there are numerous risks associated with acquisitions and potential acquisitions, including, but not limited to:
| • | diversion of management’s attention from day-to-day operational matters and current products and customers; |
| • | lack of synergy or the inability to successfully integrate the new business or to realize expected synergies; |
| • | failure to commercialize the new technology or business; |
| • | failure to meet the expected performance of the new technology or business; |
| • | failure to retain key employees and customer or supplier relationships; |
19
Table of Contents
| • | lower-than-expected market opportunities or market acceptance of any new products; and |
| • | unexpected reduction of sales of existing products as a result of the introduction of new products. |
Our inability to consummate one or more acquisitions on favorable terms, or our failure to realize the intended benefits from one or more acquisitions, could have a material adverse effect on our business, liquidity, financial position and/or results of operations, including as a result of our incurrence of indebtedness and related interest expense and our assumption of unforeseen contingent liabilities. We might need to raise additional funds through public or private equity or debt financings to finance any acquisition. In that event, we could be forced to obtain financing on terms that are not favorable to us and, in the case of equity financing, that result in dilution to our stockholders. In addition, any impairment of goodwill or other intangible assets, amortization of intangible assets, write-down of other assets or charges resulting from the costs of acquisitions and purchase accounting could harm our business and operating results.
If we cannot effectively manage growth, our business may suffer.
Over the long-term, we intend to grow our business by increasing our sales efforts and completing strategic acquisitions. To effectively manage growth, we must, among other things:
| • | engage, train and manage a larger sales force and additional service personnel; |
| • | expand the geographic coverage of our sales force; |
| • | expand our information systems; |
| • | identify and successfully integrate acquired businesses into our operations; and |
| • | administer appropriate financial and administrative control procedures. |
Growth of our business will likely place a significant strain on our management, financial, operational, technical, sales and administrative resources. Any failure to effectively manage our growth may cause our business to suffer and our stock price to decline.
Changes in tax rates or tax liabilities could affect results.
As a global company, we are subject to taxation in the United States and various other countries. Significant judgment is required to determine and estimate worldwide tax liabilities. Our future annual and quarterly tax rates could be affected by numerous factors, including changes in the (1) applicable tax laws; (2) composition of earnings in countries with differing tax rates; or (3) recoverability of our deferred tax assets and liabilities. In addition, we are subject to regular examination of our income tax returns by the Internal Revenue Service and other tax authorities. We regularly assess the likelihood of favorable or unfavorable outcomes resulting from these examinations to determine the adequacy of our provision for income taxes. Although we believe our tax estimates are reasonable, there can be no assurance that any final determination will not be materially different from the treatment reflected in our historical income tax provisions and accruals, which could materially and adversely affect our results of operations.
The Organization for Economic Co-operation and Development (“OECD”), released guidance covering various topics, including country-by-country reporting, definitional changes to permanent establishment and Base Erosion and Profit Shifting (“BEPS”), an initiative that aims to standardize and modernize global tax policy. Depending on the final form of guidance adopted by OECD members and legislation ultimately enacted, if any, there may be significant consequences for us due to our international business activities.
Turmoil or fluctuations in the credit markets and the financial services industry may negatively impact our business, results of operations, financial condition or liquidity.
In the past, global credit markets and the financial services industry have experienced a period of unprecedented turmoil and upheaval characterized by the tightening of the credit markets, the weakening of the global economy and an unprecedented level of intervention from the United States and other governments. Adverse economic conditions, such as sustained periods of economic uncertainty or a crisis in the financial markets may have a material adverse effect on our liquidity and financial condition if our ability to obtain credit from the capital financial markets, or from trade creditors was impaired. In addition, a worsening economy or an economic crisis could also adversely impact our customers’ ability to
20
Table of Contents
finance the purchase of systems from us or our suppliers’ ability to provide us with product, either of which may negatively impact our business and results of operations.
Risks Related to the Semiconductor Industry
Cyclicality in the semiconductor device industry has led to substantial decreases in demand for our systems and may, from time to time, continue to do so.
Our operating results are subject to significant variation due to the cyclical nature of the semiconductor device industry. Our business depends upon the capital expenditures of semiconductor device manufacturers, which, in turn, depend upon the current and anticipated market demand for semiconductors and products using semiconductors. The timing, length and severity of the up-and-down cycles in the semiconductor equipment industry are difficult to predict. In recent years, the industry has experienced significant downturns, generally in connection with declines in economic conditions. This cyclical nature of the industry in which we operate affects our ability to accurately predict future revenue and, thus, future expense levels. When cyclical fluctuations result in lower than expected revenue levels, operating results may be adversely affected and cost reduction measures may be necessary in order for us to remain competitive and financially sound. During a down cycle, we must be in a position to adjust our cost and expense structure to prevailing market conditions and to continue to motivate and retain our key employees. In addition, during periods of rapid growth, we must be able to increase manufacturing capacity and personnel to meet customer demand. We can provide no assurance that these objectives can be met in a timely manner in response to industry cycles. If we fail to respond to industry cycles, our business could be seriously harmed.
Our future rate of growth is highly dependent on the development and growth of the market for microelectronic device inspection, lithography and metrology equipment.
We target our products to address the needs of microelectronic device manufacturers for defect inspection, metrology and lithography. If for any reason the market for microelectronic device inspection, lithography or metrology equipment fails to grow in the long term, we may be unable to maintain current revenue levels in the short term and maintain our historical growth in the long term. Growth in the inspection market is dependent to a large extent upon microelectronic manufacturers replacing manual inspection with automated inspection technology. Growth in the metrology market is dependent to a large extent upon new chip designs and capacity expansion of microelectronic manufacturers. Growth in the lithography market is dependent on the development of cost-effective packaging with high fine pitch RDLs, ultimately migrating to multi-die, large, form-factor packages. There can be no assurance that manufacturers will undertake these actions at the rate we expect.
Risks Related to our Stock
Provisions of our charter documents and of Delaware law could discourage potential acquisition proposals and/or delay, deter or prevent a change in control of our company.
Provisions of our certificate of incorporation and by-laws may inhibit changes in control of our company not approved by our Board of Directors. These provisions also limit the circumstances in which a premium can be paid for our common stock and in which a proxy contest for control of our board may be initiated. These provisions provide for:
| • | a prohibition on stockholder actions through written consent; |
| • | a requirement that special meetings of stockholders be called only by our chief executive officer or Board of Directors; |
| • | advance notice requirements for stockholder proposals and director nominations by stockholders; |
| • | limitations on the ability of stockholders to amend, alter or repeal our by-laws; and |
| • | the authority of our board to issue, without stockholder approval, preferred stock with such terms as the board may determine; and |
| • | The authority of our board, without stockholder approval, to adopt a stockholder rights plan. |
We are also entitled to avail ourselves of the protections of Section 203 of the Delaware General Corporation Law, which could inhibit changes in control of the Company.
21
Table of Contents
Our stock price is volatile.
The market price of our common stock has fluctuated widely. From the beginning of 2014 through the end of 2018, our stock price fluctuated between a high of $34.55 per share and a low of $8.10 per share. Consequently, the current market price of our common stock may not be indicative of future market prices, and we may be unable to sustain or increase the value of an investment in our common stock. Factors affecting our stock price may include:
| • | variations in operating results from quarter to quarter; |
| • | changes in earnings estimates by analysts or our failure to meet analysts’ expectations; |
| • | changes in the market price per share of our public company customers; |
| • | market conditions in the semiconductor and other industries into which we sell products; |
| • | general economic conditions; |
| • | political changes, hostilities or natural disasters such as hurricanes and floods; |
| • | low trading volume of our common stock; and |
| • | the number of firms making a market in our common stock. |
In addition, the stock market has experienced periods of significant price and volume fluctuations. These fluctuations have particularly affected the market prices of the securities of high technology companies like ours. Any such market fluctuations in the future could adversely affect the market price of our common stock.
There are various risks related to the legal and regulatory environments in which we perform our operations and conduct our business that may expose us to risk.
We are faced with various risks that may be associated with our compliance with existing, new, different, inconsistent or conflicting laws, regulations and rules enacted by governments and/or their regulatory agencies in the countries in which we operate as well as rules and policies implemented at our customer sites. These laws, regulations, rules and policies could relate to any of an array of issues including, but not limited to, environmental, tax, intellectual property, trade secrets, product liability, contracts, antitrust, employment, securities, import/export and unfair competition. In the event that we fail to comply with or violate U.S. or foreign laws or regulations or customer policies, we could be subject to civil or criminal claims or proceedings that may result in monetary fines, penalties or other costs against us or our employees, which may adversely affect our operating results, financial condition, customer relations and ability to conduct our business.
Item 1B. | Unresolved Staff Comments. |
None.
22
Table of Contents
Our principal executive office building is located at 16 Jonspin Road in Wilmington, Massachusetts. We own and lease facilities for corporate, engineering, manufacturing, sales and service related purposes in the United States and six other countries - China, Japan, South Korea, Singapore, Taiwan and Scotland. The following table indicates the location, the general purpose and the square footage of our principal facilities. The expiration years of the leases covering the leased facilities are also indicated.
Location | | Facility Purpose | | Approximate Square Footage | | | Lease Expiration Year, Unless Owned |
Wilmington, Massachusetts | | Corporate, Engineering, Manufacturing and Service | | | 50,000 | | | 2027 |
Budd Lake, New Jersey | | Corporate, Engineering and Service | | | 49,000 | | | 2023 |
Bloomington, Minnesota | | Engineering, Manufacturing and Service | | | 98,500 | | | 2029 |
Richardson, Texas | | Engineering | | | 21,000 | | | Owned |
Bohemia, New York | | Engineering | | | 6,000 | | | 2019 |
Snoqualmie, Washington | | Engineering and Service | | | 20,500 | | | 2020 |
Tianjin, China | | Engineering | | | 5,000 | | | 2019 |
Hsin-Chu, Taiwan | | Sales and Service | | | 10,500 | | | 2019 |
Takatsu, Japan | | Sales and Service | | | 4,000 | | | 2019 |
Sungnam-si, South Korea | | Sales and Service | | | 9,000 | | | 2021 |
Shanghai, China | | Sales and Service | | | 2,500 | | | 2020 |
Singapore | | Sales and Service | | | 2,500 | | | 2019 |
Scotland, United Kingdom | | Sales and Service | | | 1,000 | | | 2020 |
We also lease office space for other smaller sales and service offices in several locations throughout the world.
We believe that our existing facilities and capital equipment are adequate to meet our current requirements and that suitable additional or substitute space is available on commercially reasonable terms if needed.
Item 3. | Legal Proceedings. |
From time to time, we are subject to ordinary routine litigation incidental to our business. As of December 31, 2018, there are no legal proceedings pending or threatened against us that management believes are likely to have a material adverse effect on our consolidated financial position or otherwise.
Item 4. | Mine Safety Disclosures. |
None.
23
Table of Contents
PART II
Item 5. | Market for Registrant’s Common Equity, Related Stockholder Matters and Issuer Purchases of Equity Securities. |
Our common stock is traded on the New York Stock Exchange (“NYSE”) under the symbol “RTEC.” Set forth below is a line graph comparing the annual percentage change in the cumulative return to the stockholders of the Company’s common stock with the cumulative return of the NYSE Composite Index and the Research Data Group (“RDG”) Semiconductor Composite Index for the period commencing on December 31, 2013 and ending on December 31, 2018.
The information contained in the performance graph shall not be deemed to be “soliciting material” or to be “filed” with the SEC, nor shall such information be incorporated by reference into any future filing under the Securities Act or the Exchange Act, except to the extent that the Company specifically incorporates it by reference into such filing.
The graph assumes that $100 was invested on December 31, 2013 in the Company’s common stock in each index, and that all dividends were reinvested. No cash dividends have been declared or paid on the Company’s common stock. Stockholder returns over the indicated period should not be considered indicative of future stockholder returns.
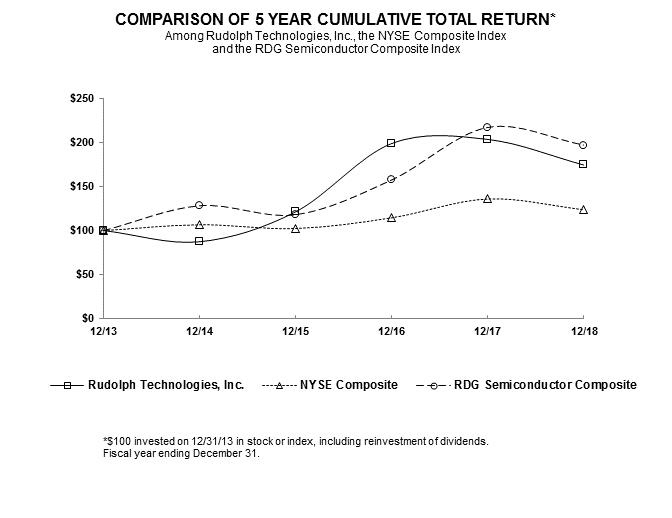
| | 12/13 | | | 12/14 | | | 12/15 | | | 12/16 | | | 12/17 | | | 12/18 | |
RTEC | | | 100.0 | | | | 87.1 | | | | 121.1 | | | | 198.9 | | | | 203.6 | | | | 174.4 | |
NYSE Composite | | | 100.0 | | | | 106.8 | | | | 102.4 | | | | 114.6 | | | | 136.1 | | | | 123.9 | |
RDG Semiconductor Composite | | | 100.0 | | | | 128.3 | | | | 118.0 | | | | 157.4 | | | | 217.0 | | | | 197.0 | |
24
Table of Contents
As of January 23, 2019, there were 56 stockholders of record of our common stock and approximately 8,482 beneficial stockholders.
We have never declared or paid a cash dividend on our common stock and currently do not anticipate paying any cash dividends in the foreseeable future. We currently intend to retain our earnings, if any, for the development of our business and the share repurchase of our common stock. The declaration of any future dividends by us is within the discretion of our Board of Directors and will be dependent on our earnings, financial condition and capital requirements as well as any other factors deemed relevant by our Board of Directors.
In October 2018, the Board of Directors approved a new share repurchase authorization, which allows us to repurchase up to $40 million worth of shares of our common stock. The authorization provides for repurchases to be made in the open market or through negotiated transactions from time to time. The share repurchase authorization has no expiration date and may be discontinued at any time. In addition, during the fourth quarter of 2018, we completed the purchase of the remaining shares available under the prior 3.0 million share repurchase authorization. During the twelve months ended December 31, 2018, we repurchased 1.1 million shares of common stock under our two share repurchase authorizations and those shares were subsequently retired. At December 31, 2018, there were $33.2 million available for future share repurchases. For further information, see Note 16 in the accompanying Notes to the Consolidated Financial Statements.
In addition to the our share repurchase program, we withhold common stock shares associated with net share settlements to cover tax withholding obligations upon the vesting of restricted stock unit awards and stock option exercises under the Company’s equity incentive program. During the three and twelve months ended December 31, 2018, we withheld 45.5 thousand and 81.8 thousand shares through net share settlements, respectively. For the three and twelve month periods ended December 31, 2018, net share settlements cost $0.9 million and $1.9 million, respectively. Please refer to Note 10 of the Notes to Consolidated Financial Statements for further discussion regarding our equity incentive plan.
The following table provides details of common stock purchased during the three month period ended December 31, 2018 (in thousands, except per share data):
Period | | Total Number of Shares Purchased (1) | | | Average Price Paid per Share | | | Total Number of Shares Purchased as Part of Publicly Announced Program | | | Maximum Approximate Dollar Value of Shares that May Yet Be Purchased Under the Program | |
October 1, 2018 to October 31, 2018 | | | 710 | | | $ | 20.12 | | | | 709 | | | $ | 40,000 | |
November 1, 2018 to November 30, 2018 | | | 126 | | | $ | 20.12 | | | | 82 | | | $ | 38,380 | |
December 1, 2018 to December 31, 2018 | | | 269 | | | $ | 19.16 | | | | 268 | | | $ | 33,239 | |
Three Months Ended December 31, 2018 | | | 1,105 | | | | | | | | 1,059 | | | | | |
| | | | | | | | | | | | | | | | |
1 Includes shares withheld through net share settlements. | | | | | | | | | | | | | | | | |
25
Table of Contents
Item 6. | Selected Financial Data. |
The following selected financial data should be read in conjunction with our Consolidated Financial Statements and the related Notes thereto appearing elsewhere in this Annual Report on Form 10-K, and under Item 7. “Management’s Discussion and Analysis of Financial Condition and Results of Operations.” The balance sheet data as of December 31, 2018 and 2017 and the statement of operations data for the years ended December 31, 2018, 2017 and 2016 set forth below were derived from our audited consolidated financial statements included elsewhere in this Form 10-K. The balance sheet data as of 2016, 2015 and 2014, and the statement of operations data for the years ended December 31, 2015 and 2014 were derived from our audited consolidated financial statements not included herein.
| | Year Ended December 31, | |
| | 2018 | | | 2017 | | | 2016 | | | 2015 | | | 2014 | |
| | (In thousands, except per share data) | |
Statement of Operations Data: | | | | | | | | | | | | | | | | | | | | |
Revenue | | $ | 273,784 | | | $ | 255,098 | | | $ | 232,780 | | | $ | 221,690 | | | $ | 181,218 | |
Cost of revenue | | | 125,505 | | | | 120,503 | | | | 109,229 | | | | 102,284 | | | | 85,730 | |
Gross profit | | | 148,279 | | | | 134,595 | | | | 123,551 | | | | 119,406 | | | | 95,488 | |
Operating expenses: | | | | | | | | | | | | | | | | | | | | |
Research and development | | | 49,053 | | | | 46,986 | | | | 44,964 | | | | 41,233 | | | | 40,576 | |
Selling, general and administrative | | | 46,608 | | | | 39,381 | | | | 38,562 | | | | 43,235 | | | | 53,799 | |
Amortization | | | 1,534 | | | | 1,940 | | | | 2,320 | | | | 2,145 | | | | 2,422 | |
Patent litigation income | | | — | | | | (13,000 | ) | | | (14,643 | ) | | | — | | | | — | |
Total operating expenses | | | 97,195 | | | | 75,307 | | | | 71,203 | | | | 86,613 | | | | 96,797 | |
Operating income (loss) | | | 51,084 | | | | 59,288 | | | | 52,348 | | | | 32,793 | | | | (1,309 | ) |
Interest (income) expense, net | | | (2,206 | ) | | | (971 | ) | | | 2,834 | | | | 5,688 | | | | 5,317 | |
Other (income) expense, net | | | (56 | ) | | | 457 | | | | (354 | ) | | | 293 | | | | 65 | |
Income (loss) before provision (benefit) for income taxes | | | 53,346 | | | | 59,802 | | | | 49,868 | | | | 26,812 | | | | (6,691 | ) |
Provision (benefit) for income taxes | | | 8,250 | | | | 26,893 | | | | 12,916 | | | | 8,856 | | | | (2,051 | ) |
Net income (loss) | | $ | 45,096 | | | $ | 32,909 | | | $ | 36,952 | | | $ | 17,956 | | | $ | (4,640 | ) |
Earnings (loss) per share: | | | | | | | | | | | | | | | | | | | | |
Basic | | $ | 1.42 | | | $ | 1.05 | | | $ | 1.19 | | | $ | 0.57 | | | $ | (0.14 | ) |
Diluted | | $ | 1.40 | | | $ | 1.02 | | | $ | 1.16 | | | $ | 0.56 | | | $ | (0.14 | ) |
Weighted average shares outstanding: | | | | | | | | | | | | | | | | | | | | |
Basic | | | 31,671 | | | | 31,491 | | | | 31,128 | | | | 31,408 | | | | 33,124 | |
Diluted | | | 32,200 | | | | 32,162 | | | | 31,790 | | | | 32,166 | | | | 33,124 | |
| | December 31, | |
| | 2018 | | | 2017 | | | 2016 | | | 2015 (1) | | | 2014 (1)(2)(3) | |
Balance Sheet Data: | | | | | | | | | | | | | | | | | | | | |
Cash and cash equivalents | | $ | 112,388 | | | $ | 67,770 | | | $ | 37,859 | | | $ | 44,554 | | | $ | 43,114 | |
Marketable securities | | | 62,684 | | | | 109,589 | | | | 87,872 | | | | 116,924 | | | | 113,871 | |
Working capital | | | 305,916 | | | | 279,775 | | | | 226,668 | | | | 197,266 | | | | 245,707 | |
Total assets | | | 418,040 | | | | 385,922 | | | | 338,699 | | | | 379,563 | | | | 365,944 | |
Convertible senior notes | | | — | | | | — | | | | — | | | | 57,846 | | | | 54,080 | |
Accumulated deficit | | | (6,773 | ) | | | (51,869 | ) | | | (84,706 | ) | | | (121,658 | ) | | | (139,614 | ) |
Total stockholders’ equity | | | 361,888 | | | | 333,154 | | | | 293,735 | | | | 270,678 | | | | 267,328 | |
(1) Effective in the first quarter of 2016, the Company adopted Accounting Standards Update (ASU) No. 2015-03, “Interest - Imputation of Interest (Subtopic 835-30), Simplifying the Presentation of Debt Issuance Costs,” which requires entities to present debt issuance costs related to a debt liability as a direct deduction from the carrying amount of that debt liability on the balance sheet as opposed to being presented as a deferred charge. Prior to adoption, the Company reported the unamortized debt issuance costs in “Other Assets” on the Consolidated Balance Sheets.
26
Table of Contents
(2) Effective December 31, 2015, we early adopted provisions prescribed by the Financial Account Standards Board (FASB) in ASU No. 2015-17, “Income Taxes (Topic 740), Balance Sheet Classification of Deferred Taxes.” Consequently, we reclassified net current deferred income tax assets to net long term deferred income tax assets for each period presented.
(3) Working capital data for 2014 reflects reclassifications of a portion of deferred revenue to other non-current liabilities.
Item 7. | Management’s Discussion and Analysis of Financial Condition and Results of Operations. |
Overview
We are a worldwide leader in the design, development, manufacture and support of process control tools that perform macro-defect inspections and metrology, lithography systems, and process control analytical software used by semiconductor and advanced packaging device manufacturers. We deliver comprehensive solutions throughout the semiconductor fabrication process with our families of proprietary products that provide critical yield-enhancing information, enabling microelectronic device manufacturers to drive down costs and time to market of their devices. We provide process and yield management solutions used in both wafer processing facilities, often referred to as “front-end” and device packaging and test facilities, or “back-end” manufacturing, through a portfolio of standalone systems for macro-defect inspection, lithography, probe card test and analysis, and transparent and opaque thin film measurements. All of our systems feature sophisticated software and production-worthy automation. In addition, our advanced process control software portfolio includes powerful solutions for standalone tools, groups of tools, or factory-wide suites to enhance productivity and achieve significant cost savings. Our systems are backed by worldwide customer service and applications support.
Our business is affected by the annual spending patterns of our customers on semiconductor capital equipment. The amount that our customers devote to capital equipment spending depends on a number of factors, including general worldwide economic conditions as well as other economic drivers such as personal computers, mobile devices, data centers, artificial intelligence and automotive sales. Current forecasts by industry analysts for the semiconductor device manufacturing industry project capital equipment spending to be down approximately 15%-18% for 2019 as compared to 2018. Our revenue and profitability tend to follow the trends of certain segments within the semiconductor market.
Historically, a significant portion of our revenue in each quarter and year has been derived from sales to relatively few customers, and we expect this trend to continue. For the years ended December 31, 2018, 2017 and 2016, aggregate sales to customers that individually represented at least five percent of our revenue accounted for 18.3%, 27.2%, and 34.5% of our revenue, respectively.
We do not have purchase contracts with any of our customers that obligate them to continue to purchase our products, and they could cease purchasing products from us at any time. A delay in purchase or cancellation by any of our large customers could cause quarterly revenue to vary significantly. In addition, during a given quarter, a significant portion of our revenue may be derived from the sale of a relatively small number of systems. The following table presents the average selling price range for our systems in 2018.
System | | Average Selling Price Per System |
Process control | | $250,000 to $2.6 million |
Lithography steppers | | $2.6 million to $8.5 million |
A significant portion of our revenue is derived from customers outside of the United States. A substantial portion of our international sales are denominated in U.S dollars. We expect that revenue generated from customers outside of the United States will continue to account for a significant percentage of our revenue.
The sales cycle for our systems typically ranges from six to twenty-four months and can be longer when our customers are evaluating new technology. Due to the length of these cycles, we invest significantly in research and development and sales and marketing in advance of generating revenue related to these investments.
27
Table of Contents
Results of Operations
The following table sets forth, for the periods indicated, our results of operations as percentages of our revenue. Our results of operations are reported as one business segment.
| | Year Ended December 31, | |
| | 2018 | | | 2017 | | | 2016 | |
Revenue | | | 100.0 | % | | | 100.0 | % | | | 100.0 | % |
Cost of revenue | | | 45.8 | % | | | 47.2 | % | | | 46.9 | % |
Gross profit | | | 54.2 | % | | | 52.8 | % | | | 53.1 | % |
Operating expenses: | | | | | | | | | | | | |
Research and development | | | 17.9 | % | | | 18.4 | % | | | 19.3 | % |
Selling, general and administrative | | | 17.0 | % | | | 15.4 | % | | | 16.6 | % |
Amortization | | | 0.6 | % | | | 0.8 | % | | | 1.0 | % |
Patent litigation income | | | — | % | | | (5.1 | )% | | | (6.3 | )% |
Total operating expenses | | | 35.5 | % | | | 29.5 | % | | | 30.6 | % |
Operating income | | | 18.7 | % | | | 23.3 | % | | | 22.5 | % |
Interest (income) expense, net | | | (0.8 | )% | | | (0.4 | )% | | | 1.2 | % |
Other expense (income), net | | | — | % | | | 0.2 | % | | | (0.2 | )% |
Income before provision for income taxes | | | 19.5 | % | | | 23.5 | % | | | 21.5 | % |
Provision for income taxes | | | 3.0 | % | | | 10.6 | % | | | 5.6 | % |
Net income | | | 16.5 | % | | | 12.9 | % | | | 15.9 | % |
Results of Operations for 2018, 2017 and 2016
Revenue. Our revenue is derived from the sale of our systems, services, spare parts and software licensing. Our revenue was $273.8 million, $255.1 million and $232.8 million for the years ended December 31, 2018, 2017 and 2016, respectively. This represents an increase of 7.3% from 2017 to 2018 and an increase of 9.6% from 2016 to 2017. The increase in revenue from 2017 to 2018 was due to an increase in capital spending by front-end memory manufacturers. The increase in revenue from 2016 to 2017 was due to a significant increase in capital spending by front-end memory manufacturers, as well as continued strength in capital spending by back-end foundry and Advanced Packaging customers in the OSAT markets.
The following table lists, for the periods indicated, the different sources of our revenue in dollars (thousands) and as percentages of our total revenue:
| | Year Ended December 31, | |
| | 2018 | | | 2017 | | | 2016 | |
Systems and Software: | | | | | | | | | | | | | | | | | | | | | | | | |
Process control | | $ | 190,098 | | | | 70 | % | | $ | 177,177 | | | | 70 | % | | $ | 146,652 | | | | 63 | % |
Lithography | | | 14,975 | | | | 5 | % | | | 14,234 | | | | 5 | % | | | 18,949 | | | | 8 | % |
Software licensing, support and maintenance | | | 29,168 | | | | 11 | % | | | 25,473 | | | | 10 | % | | | 29,795 | | | | 13 | % |
Parts | | | 28,658 | | | | 10 | % | | | 27,143 | | | | 11 | % | | | 25,343 | | | | 11 | % |
Services | | | 10,885 | | | | 4 | % | | | 11,071 | | | | 4 | % | | | 12,041 | | | | 5 | % |
Total revenue | | $ | 273,784 | | | | 100 | % | | $ | 255,098 | | | | 100 | % | | $ | 232,780 | | | | 100 | % |
Total systems and software revenue increased for the year ended December 31, 2018 as compared to the year ended December 31, 2017 due to increased demand for our products in front-end process control systems. The year-over-year increases in process control systems revenue totaled $12.9 million, primarily due to higher metrology system sales in the 2018 period. Lithography system revenue increased $0.7 million, primarily due to the shipment of a JetStep G system offset by lower shipments of our JetStep W systems in 2018. Licensing revenue from software increased $3.7 million primarily due to an increase in revenue from our process control and yield management software. The average selling price of similarly configured systems has been consistent and, therefore, did not have a material impact on our revenue for the same period. Systems revenue generated by our latest product releases and major enhancements in each of our product families amounted to 74% of total revenue for 2018 compared to 70% of total revenue for 2017. The year-over-year increase in parts and services revenue in absolute dollars from 2017 to 2018 was primarily due to increased spending by our customers on repairs of existing systems. Parts and services revenue is generated from part sales, maintenance service contracts, system upgrades, as well as time and material billable service calls.
28
Table of Contents
Total systems and software revenue increased for the year ended December 31, 2017 as compared to the year ended December 31, 2016 due to increased demand for our products in both front-end and back-end process control systems. The year-over-year increases in process control systems revenue totaled $30.5 million, which was partially offset by decreases in lithography systems and software revenue of $4.7 million and $4.3 million, respectively. The increase in systems revenue was attributed to a greater number of process control units sold, which was partially offset by fewer lithography units sold. Licensing revenue from software decreased $4.3 million primarily due to a decrease in revenue from our process control software. The average selling price of similarly configured systems has been consistent and, therefore, did not have a material impact on our revenue for the same period. Systems revenue generated by our latest product releases and major enhancements in each of our product families amounted to 70% of total revenue for 2017 compared to 72% of total revenue for 2016. The year-over-year increase in parts and services revenue in absolute dollars from 2016 to 2017 was primarily due to increased spending by our customers on repairs of existing systems. Parts and services revenue is generated from part sales, maintenance service contracts, system upgrades, as well as time and material billable service calls.
Deferred revenue of $6.8 million was recorded in the Consolidated Balance Sheets under the Caption “Current liabilities” and $1.3 million was recorded under the caption “Other non-current liabilities” at December 31, 2018. Deferred revenue primarily consisted of $5.6 million for deferred maintenance agreements and $2.5 million for outstanding deliverables. At December 31, 2017, deferred revenue of $6.2 million was recorded under the caption “Current liabilities” and $1.0 million was recorded under the caption “Other non-current liabilities”. Deferred maintenance agreements of $4.7 million and outstanding deliverables of $2.5 million were the two main components of deferred revenue at December 31, 2017.
Gross Profit. Our gross profit has been and will continue to be affected by a variety of factors, including manufacturing efficiencies, provision for excess and obsolete inventory, pricing by competitors or suppliers, new product introductions, production volume, customization and reconfiguration of systems, international and domestic sales mix, system and software product mix, and parts and services margins. Our gross profit was $148.3 million, $134.6 million and $123.6 million for the years ended December 31, 2018, 2017 and 2016, respectively. Our gross profit represented 54.2%, 52.8% and 53.1% for the years ended December 31, 2018, 2017 and 2016, respectively. The increase in gross profit as a percentage of revenue from 2017 to 2018 was primarily due to a change in our systems and software product sales mix and the sale of a lithography system that had previously been partially written down. The decrease in gross profit as a percentage of revenue from 2016 to 2017 was primarily due to a change in our systems and software product sales mix.
Operating Expenses
Our operating expenses consist of:
| • | Research and Development. The process control defect inspection and metrology, advanced packaging lithography, and data analysis systems and software market is characterized by continuous technological development and product innovations. We believe that the rapid and ongoing development of new products and enhancements of existing products, including the transition to copper and low-k dielectrics, wafer level packaging, the continuous shrinkage in critical dimensions, and the evolution of ultra-thin gate process control is critical to our success. Accordingly, we devote a significant portion of our technical, management and financial resources to research and development programs. Research and development expenditures consist primarily of salaries and related expenses of employees engaged in research, design and development activities. They also include consulting fees, the cost of related supplies and legal costs to defend our patents. Our research and development expenses were $49.1 million, $47.0 million and $45.0 million in 2018, 2017 and 2016, respectively. The year-over-year dollar increase from 2017 to 2018 was primarily due to increased compensation and development initiatives. These costs were partially offset by decreased litigation expenses. The year-over-year dollar increase from 2016 to 2017 was primarily due to increased compensation and project costs. We continue to maintain our commitment to investing in new product development and enhancement to existing products. |
| • | Selling, General and Administrative. Selling, general and administrative expenses are primarily comprised of salaries and related costs for sales, marketing, and general administrative personnel, as well as commissions and other non-personnel related expenses. Our selling, general and administrative expenses were $46.6 million, $39.4 million and $38.6 million in 2018, 2017 and 2016, respectively. The year-over-year dollar increase from 2017 to 2018 was primarily due to compensation costs resulting from headcount and salary increases. In addition, the year-over-year increase was partially due to an increase in sales commissions and a loss recorded for the misappropriation of payroll taxes by a third party accountant. The year-over-year dollar increase from 2016 to 2017 was primarily due to an increase in compensation costs. |
29
Table of Contents
| • | Amortization of Identifiable Intangible Assets. Amortization of identifiable intangible assets was $1.5 million, $1.9 million and $2.3 million in 2018, 2017 and 2016, respectively. The year-over-year decreases in amortization expense from 2017 to 2018 and from 2016 to 2017 were due to certain intangible assets becoming fully amortized during these periods. |
| • | Patent Litigation Income. During the twelve months ended December 31, 2018, there was no patent litigation income. During the twelve months ended December 31, 2017, we recorded income and received cash of $13.0 million from a comprehensive settlement regarding a patent infringement litigation with Camtek. We received $13.0 million in the fourth quarter of 2017 and subsequently remitted $2.3 million of withholding tax to the Israel Tax Authority associated with the settlement and the prior year patent litigation judgment. During the twelve months ended December 31, 2016, we recorded income and received cash from a patent litigation judgment of $14.6 million in conjunction with the final court ruling in the patent infringement litigation case against Camtek with the expiration of all opportunities to appeal. |
Interest income (expense), net. In 2018 and 2017, net interest income was $2.2 million and $1.0 million, respectively. In 2016, net interest expense was $2.8 million. The increase in net interest income from 2017 to 2018 was due to higher interest earned on our marketable securities. The change in interest income (expense), net from 2016 to 2017, was primarily due to the redemption of the Senior Convertible Notes in July 2016.
Income taxes. The following table provides details of income tax (dollars in millions):
| | Year Ended December 31, | |
| | 2018 | | | 2017 | | | 2016 | |
Income before income taxes | | $ | 53.3 | | | $ | 59.8 | | | $ | 49.9 | |
Provision for income taxes | | $ | 8.3 | | | $ | 26.9 | | | $ | 12.9 | |
Effective tax rate | | | 15.5 | % | | | 45.0 | % | | | 25.9 | % |
The income tax provision differs from the federal statutory income tax rate of 21% for 2018 primarily due to Foreign Derived Intangible Income Deduction (“FDII”) from the Tax Act of $2.2 million, tax benefits for research and development credits of $2.3 million, offset by a Section 162(m) limitation on the deductibility of executive compensation of $0.5 million and additional ASC 740-10 tax reserves of $0.6 million.
The income tax provision differs from the federal statutory income tax rate of 35% for 2017 primarily due to new regulations resulting from Public law No. 115-97, known as the Tax Cuts and Jobs Act (“Tax Act”) of $9.5 million, offset by tax benefits for research and development credits of $1.6 million, section 199 manufacturing deduction of $1.6 million and excess tax benefits on vesting of restricted stock of $1.6 million.
The income tax provision differs from the federal statutory income tax rate of 35% for 2016, primarily due to research and development credits of $0.7 million, section 199 manufacturing deduction of $1.2 million, the foreign taxes net of federal benefit of $1.6 million and deferred tax true-ups of $1.7 million from prior periods.
The Tax Act, which was enacted and signed into law on December 22, 2017, reduced the U.S. federal corporate tax rate from 35% to 21%, effective January 1, 2018. Also on December 22, 2017, the SEC issued Staff Accounting Bulletin No. 118 (“SAB 118”), which provides guidance on accounting for tax effects of the Tax Act. SAB 118 provides a measurement period of up to one year from the enactment date to complete the accounting. Any adjustments during this measurement period will be included in net earnings from continuing operations as an adjustment to income tax expense in the reporting period when such adjustments are determined. Based on the information available and current interpretation of the rules, we estimated the impact of the reduction in the corporate tax rate and remeasurement of certain deferred tax assets and liabilities. The provisional amount recorded in the fourth quarter of 2017 related to the remeasurement of our deferred tax balance resulted in additional income tax expense of $8.0 million. During the fourth quarter of 2018, we completed the accounting for such revaluation and recorded an additional $0.8 million in tax expense. Despite the completion of our accounting for the Tax Act under SAB 118, many aspects of the law remain unclear and we expect ongoing guidance to be issued at both the federal and state levels. We will continue to monitor and assess the impact of any new developments. The prior year provisional impact and current year finalization of the Tax Act summarized below, which is included as a component of the provision from income taxes is further described in Note 12 in the accompanying Notes to the Consolidated Financial Statements (dollars in millions).
30
Table of Contents
| | Year Ended December 31, | |
| | 2018 | | | 2017 | |
Re-measurement of U.S. deferred tax assets and liabilities | | $ | — | | | $ | 8.0 | |
Transition tax on non-U.S. subsidiaries’ earnings | | | 0.1 | | | | 1.5 | |
Foreign tax credits applied against transition tax | | | — | | | | (1.5 | ) |
Valuation allowance for unused foreign tax credits | | | 0.7 | | | | 1.5 | |
Total impact of the Tax Act on the provision for income taxes | | $ | 0.8 | | | $ | 9.5 | |
Our future effective income tax rate depends on various factors, such as future impacts of the Tax Act, possible further tax legislation, the geographic composition of our pre-tax income, the amount of our pre-tax income as business activities fluctuate, non-deductible expenses incurred in connection with acquisitions and research and development credits as a percentage of aggregate pre-tax income.
Liquidity and Capital Resources
At December 31, 2018, we had $175.1 million of cash, cash equivalents and marketable securities and $305.9 million in working capital. At December 31, 2017, our cash, cash equivalents and marketable securities totaled $177.4 million, while working capital amounted to $279.8 million.
Typically, during periods of revenue growth, changes in accounts receivable and inventories represent a use of cash as we incur costs and expend cash in advance of receiving cash from our customers. Similarly, during periods of declining revenue, changes in accounts receivable and inventories represent a source of cash as inventory purchases decline and revenue from prior periods are collected.
Net cash and cash equivalents provided by operating activities for the years ended December 31, 2018, 2017 and 2016 totaled $35.1 million, $64.2 million and $47.4 million, respectively. During the year ended December 31, 2018, cash provided by operating activities was primarily due to net income, adjusted to exclude the effect of non-cash charges, of $64.3 million, an increase in accounts payable of $3.5 million, a decrease in income taxes of $1.1 million, a decrease in account receivable of $0.7 million and an increase in deferred revenue of $0.5 million, which were partially offset by an increase in inventories of $31.5 million, an increase in prepaid expenses and other assets of $3.1 million and a decrease in other liabilities of $0.4 million. The increase in inventories of $31.5 million was primarily due to increased sales projections of our latest products and new product initiatives.
During the year ended December 31, 2017, cash provided by operating activities was primarily due to net income, adjusted to exclude the effect of non-cash charges, of $65.9 million, an increase in other liabilities of $6.4 million, an increase in accounts payable of $3.2 million and a decrease in account receivable of $0.4 million, which were partially offset by an increase in income taxes of $4.7 million, an increase in inventory of $4.2 million, an increase in prepaid expenses and other assets of $1.7 million and a decrease in deferred revenue of $1.1 million.
During the year ended December 31, 2016, cash provided by operating activities was primarily due to net income, adjusted to exclude the effect of non-cash charges, of $57.7 million, a decrease in inventories of $4.0 million, a decrease in prepaid expenses and other assets of $2.0 million, an increase in accounts payable of $1.2 million and an increase in deferred revenue of $0.9 million, which were partially offset by an increase in accounts receivable of $9.3 million, a decrease in other liabilities of $6.1 million, and a net increase in income tax receivable of $3.0 million.
Net cash and cash equivalents provided by investing activities for the years ended December 31, 2018 and 2016 was $33.8 and $24.5 million, respectively. Net cash and cash equivalents used in investing activities for the year ended December 31, 2017 totaled $32.5 million. During the year ended December 31, 2018, net cash provided by investing activities included proceeds from sales of marketable securities of $186.3 million, which was partially offset by purchases of marketable securities of $140.0 million, purchases of property, plant and equipment of $7.5 million, and cash advanced on a convertible note receivable of $5.0 million. During the year ended December 31, 2017, net cash used in investing activities included purchases of marketable securities of $164.7 million, purchases of property, plant and equipment of $10.2 million, and purchase of intangible assets of $1.0 million, which were partially offset by proceeds from sales of marketable securities of $143.3 million. During the year ended December 31, 2016, net cash provided by investing activities included proceeds from sales of marketable securities of $175.5 million and proceeds from sale of property, plant and equipment of $1.2 million, which were partially offset by purchases of marketable securities of $146.9 million, purchases of property, plant and equipment of $3.3 million, and purchase of intangible assets of $2.0 million.
31
Table of Contents
Net cash used in financing activities was $23.9 million, $2.6 million and $78.9 million in 2018, 2017 and 2016, respectively. During the year ended December 31, 2018, financing activities used cash to purchase shares of our common stock under share repurchase authorizations of $21.1 million, pay taxes related to shares withheld for share based compensation plans of $1.9 million and pay contingent consideration for acquired business of $1.5 million. These uses of cash were partially offset by proceeds from sales of shares through employee stock plans of $0.6 million. During the year ended December 31, 2017, financing activities included the redemption of stock warrants of $1.0 million, tax payments related to shares withheld for share-based compensation plans of $1.4 million and payment of contingent consideration for acquired businesses of $0.8 million, which were partially offset by proceeds from sales of shares through employee stock plans of $0.6 million. During the year ended December 31, 2016, financing activities included the redemption of senior convertible debt of $60.0 million, redemption of stock warrants of $9.5 million, purchase of shares under the share repurchase authorization of $8.0 million, tax payments related to shares withheld for share based compensation plans of $1.6 million and payment of contingent consideration for acquired business of $0.6 million, which were partially offset by proceeds from sales of shares through employee stock plans of $0.9 million.
From time to time, we evaluate whether to acquire new or complementary businesses, products and/or technologies. We may fund all of or a portion of the price of these investments or acquisitions in cash, stock, or a combination of cash and stock.
We entered into a convertible loan agreement with Simax Precision Technologies Limited (“Simax”) on May 31, 2018. Simax may borrow up to $15 million in multiple promissory notes from us, subject to limitations. We expect to be a supplier of lithography modules to Simax which is focused on the manufacture, sale and service of lithography systems. As of December 31, 2018, Simax has borrowed $5 million from us under the convertible loan agreement. See Note 6 in the accompanying Notes to the Consolidated Financial Statements included in this Form 10-K for further information.
In October 2018, the Board of Directors approved a new share repurchase authorization, which allows us to repurchase up to $40 million worth of shares of our common stock. The authorization provides for repurchases to be made in the open market or through negotiated transactions from time to time. The share repurchase authorization has no expiration date and may be discontinued at any time. In addition, during the fourth quarter of 2018, we completed the purchase of the remaining shares available under the prior 3.0 million share repurchase authorization. During the twelve months ended December 31, 2018, we repurchased 1.1 million shares of common stock under our two share repurchase authorizations and those shares were subsequently retired. At December 31, 2018, there were $33.2 million available for future share repurchases. For further information, see Note 16 in the accompanying Notes to the Consolidated Financial Statements.
We have a credit agreement with a bank that provides for a line of credit that is secured by the marketable securities we have with the bank. We are permitted to borrow up to 70% of the value of eligible securities held at the time the line of credit is accessed. As of December 31, 2018, the available line of credit was approximately $93.9 million with an available interest rate of 4.0%. The credit agreement is available to us until such time that either party terminates the arrangement at its discretion. To date, we have not utilized the line of credit.
Our future capital requirements will depend on many factors, including the timing and amount of our revenue and our investment decisions, which will affect our ability to generate additional cash. We expect that our existing cash, cash equivalents, marketable securities and availability under our line of credit will be sufficient to meet our anticipated cash requirements for working capital, capital expenditures and other cash needs for the next 12 months following the filing of this Form 10-K. Thereafter, if cash generated from operations and financing activities is insufficient to satisfy our working capital requirements, we may seek additional funding through bank borrowings, sales of securities or other means. There can be no assurance that we will be able to raise any such capital on terms acceptable to us or at all.
Contractual Obligations
The following table summarizes our significant contractual obligations at December 31, 2018, and the effect such obligations are expected to have on our liquidity and cash flows in future periods. This table excludes the liability for unrecognized tax benefits that totaled approximately $5.5 million at December 31, 2018. We are currently unable to provide a reasonably reliable estimate of the amount or periods when cash settlement of this liability may occur.
32
Table of Contents
| | Payments due by period | |
| | Total | | | Less than 1 year | | | 1-3 years | | | 3-5 years | | | More than 5 years | |
Operating lease obligations | | $ | 19,337 | | | $ | 3,170 | | | $ | 4,908 | | | $ | 3,775 | | | $ | 7,484 | |
Open and committed purchase orders | | | 71,752 | | | | 50,015 | | | | 21,737 | | | | — | | | | — | |
Total | | $ | 90,799 | | | $ | 52,997 | | | $ | 26,557 | | | $ | 3,761 | | | $ | 7,484 | |
Off-Balance Sheet Arrangements
The Company does not have any significant off-balance sheet arrangements that have or are reasonably likely to have a material effect on our financial condition, results of operations or liquidity and capital resources.
Critical Accounting Policies
Management’s discussion and analysis of our financial condition and results of operations are based upon our consolidated financial statements, which have been prepared in accordance with accounting principles generally accepted in the United States. We review the accounting policies we use in reporting our financial results on a regular basis. The preparation of these financial statements requires us to make estimates and judgments that affect the reported amounts of assets, liabilities, revenue and expenses and related disclosure of contingent assets and liabilities. On an ongoing basis, we evaluate our estimates, including those related to revenue recognition, accounts receivable, inventories, business acquisitions, intangible assets, share-based payments, income taxes and warranty obligations. We base our estimates on historical experience and on various other assumptions that are believed to be reasonable under the circumstances, the results of which form the basis for making judgments about the carrying value of assets and liabilities that are not readily apparent from other sources. Results may differ from these estimates due to actual outcomes being different from those on which we based our assumptions. These estimates and judgments are regularly reviewed by management on an ongoing basis at the end of each quarter prior to the public release of our financial results. We believe the following critical accounting policies affect our more significant judgments and estimates used in the preparation of our consolidated financial statements.
Revenue Recognition. Effective January 1, 2018, we adopted the requirements of ASU No. 2014-09, “Revenue from Contracts with Customers (Topic 606).” For additional information on the new standard and the impact to our results of operations, refer to Impact of Recent Accounting Pronouncements below and Note 2 of the Notes to the Consolidated Financial Statements.
Revenue is recognized when control of the promised goods or services are transferred to our customers in an amount that reflects the consideration we expect to be entitled to receive in exchange for those goods or services. We account for a contract when it has approval and commitment from both parties, the rights of the parties and payment terms are identified, the contract has commercial substance and collectability of consideration is probable.
We account for shipping and handling activities as the fulfillment of a promise to transfer goods to the customer and therefore record these activities under the caption “Cost of revenue.” Sales tax and any other taxes collected concurrent with revenue producing activities are excluded from revenue. Incidental items that are immaterial in the context of the contract are recognized as expense.
Contracts with customers may include multiple performance obligations. For such arrangements, we allocate revenue to each performance obligation based on its relative standalone selling price. We generally determine standalone selling prices based on the prices charged to customers or the expected cost plus margin.
Revenue from systems is recognized when we transfer control of the product to our customer. To indicate transfer of control, we must have a present right to payment, legal title must have passed to the customer and the customer must have the significant risks and rewards of ownership. We generally transfer control for system sales when the customer or the customer’s agent picks up the system at our facility. Payment for the majority of our systems have 80-90% of the invoice amount due within 30 days and the remaining amount due upon completion of installation, recalibration and qualification by the customer. We provide an assurance warranty on our systems for a period of twelve to fifteen months against defects in material and workmanship. We provide for the estimated cost of product warranties at the time revenue is recognized.
Depending on the terms of the systems arrangement, we may also defer the recognition of a portion of the consideration expected to be received because we have to satisfy a future obligation (e.g., installation, training and extended warranties). We use an observable price to determine the standalone selling price for separate performance obligations or a cost plus margin approach when one is not available.
33
Table of Contents
Revenue from software licenses is recognized upfront at the point in time when the software is made available to the customer. Software licenses provide the customer with limited rights to use the software. Revenue from licensing support and maintenance is recognized as the support and maintenance are provided, which is over the contract period. Payment for software licensing, support and maintenance is generally due in 30 days.
Revenue from parts is recognized when we transfer control of the product, which typically occurs when we ship the product from our facilities to the customer. Payment for parts is generally due in 30 days.
Revenue from services primarily consists of service contracts, which provide additional maintenance coverage beyond our assurance warranty on our products, service labor, consulting and training. Revenue from service contracts is recognized ratably over the term of the service contract. Revenue from service labor, consulting and training is recognized as services are performed. Payment for services is generally due in 30 days.
We record contract liabilities when the customer has been billed in advance of completing our performance obligations. These amounts are recorded as deferred revenue in the Consolidated Balance Sheets.
Excess and Obsolete Inventory. We maintain reserves for our excess and obsolete inventory equal to the difference between the cost of inventory and the estimated market value based upon assumptions about future product life-cycles, product demand and market conditions. If actual product life-cycles, product demand and market conditions are less favorable than those originally projected by management, additional inventory write-downs may be required.
Long-Lived Assets and Acquired Intangible Assets. We periodically review long-lived assets, other than goodwill, for impairment whenever changes in events or circumstances indicate that the carrying amount of an asset may not be recoverable. Assumptions and estimates used in the determination of impairment losses, such as future cash flows and disposition costs, may affect the carrying value of long-lived assets and the impairment of such long-lived assets, if any, could have a material effect on our consolidated financial statements. No such indicators were noted in 2018, 2017 or 2016.
Accounting for Income Taxes. As part of the process of preparing our consolidated financial statements, we are required to estimate our actual current tax exposure together with our temporary differences resulting from differing treatment of items for tax and accounting purposes. These temporary differences result in deferred tax assets and liabilities, which are included within our consolidated balance sheet. We must then assess the likelihood that our deferred tax assets will be recovered from future taxable income and to the extent we believe that recovery is not likely, we must establish a valuation allowance. Significant management judgment is required in determining our provision for income taxes and any valuation allowance recorded against our deferred tax assets. The need for a valuation allowance is based on our estimates of taxable income by jurisdiction in which we operate and the period over which our deferred taxes will be recoverable. In the event that actual results differ from these estimates or we adjust these estimates in future periods, we may need to adjust the valuation allowance, which could materially impact our financial position and results of operations. At December 31, 2018 and 2017, we had recorded valuation allowances of $3.2 million and $2.4 million on certain of our deferred tax assets to reflect the deferred tax assets at the net amount that is more likely than not to be realized. We evaluated the realizability of the deferred tax assets based on positive earnings as well as the projected earnings in future years and believe it is more likely than not that the substantial majority of our deferred tax asset will be realized in the future years. We will continue to monitor the realizability of the deferred tax assets and evaluate the valuation allowance.
We recognize liabilities for uncertain tax positions based on a two-step process. The first step requires us to determine if the weight of available evidence indicates that the tax position has met the threshold for recognition; therefore, we must evaluate whether it is more likely than not that the position will be sustained on audit, including resolution of any related appeals or litigation processes. The second step requires us to measure the tax benefit of the tax position taken, or expected to be taken, in an income tax return as the largest amount that is more than 50% likely of being realized when effectively settled. This measurement step is inherently difficult and requires subjective estimations of such amounts to determine the probability of various possible outcomes. We reevaluate the uncertain tax positions each quarter based on factors including, but not limited to, changes in facts or circumstances, changes in tax law, effectively settled issues, and new audit activity. Such a change in recognition or measurement could result in the recognition of a tax benefit or an additional charge to the tax provision in the period.
Although we believe the measurement of our liabilities for uncertain tax positions is reasonable, no assurance can be given that the final outcome of these matters will not be different than what is reflected in the historical income tax provisions and accruals. If additional taxes are assessed as a result of an audit or litigation, it could have a material effect on our income tax provision and net income in the period or periods for which that determination is made.
34
Table of Contents
Impact of Recent Accounting Pronouncements
Recently Adopted
Effective January 1, 2018, the we adopted ASU No. 2016-16, “Income Tax (Topic 740): Intra-Entity Transfers of Assets Other Than Inventory.” This ASU, which is part of the simplification initiative of the FASB, is intended to reduce the complexity of U.S. GAAP and diversity in practice related to the tax consequences of certain types of intra-entity asset transfers, particularly those involving intellectual property. The adoption of ASU No. 2016-16 did not have any impact on our consolidated financial position, results of operations, and cash flows.
Effective January 1, 2018, we adopted ASU No. 2016-15, “Statement of Cash Flows (Topic 230): Classification of Certain Cash Receipts and Cash Payments.” This ASU provides guidance on statement of cash flows presentation for eight specific cash flow issues where diversity in practice exists. We retrospectively adopted ASU No. 2018-15 resulting in a reclassification related to contingent consideration payments made after a business combination. The reclassification of $0.2 million from cash flows from financing activities to cash flows from operating activities is reflected in our Consolidated Statement of Cash Flows for the twelve month ended December 31, 2017. Adoption of additional guidance under ASU No. 2016-15 did not have a material impact on our consolidated financial position, results of operations, and cash flows.
Effective January 1, 2018, we adopted ASU No. 2014-09, “Revenue from Contracts with Customers (Topic 606),” which supersedes nearly all existing revenue recognition guidance. The core principle of this ASU is that revenue should be recognized to depict the transfer of promised goods or services to customers in an amount that reflects the consideration to which the entity expects to be entitled in exchange for those goods or services. As a result of the adoption of ASU No. 2014-09, we changed our accounting policy for revenue recognition. Refer to Note 2 of the Notes to the Consolidated Financial Statements, “Summary of Significant Accounting Policies” for further information.
Recently Issued
In August 2018, the FASB issued ASU No. 2018-13, “Fair Value Measurement (Topic 820): Disclosure Framework – Changes to the Disclosure Requirements for Fair Value Measurement.” This ASU is part of the FASB’s larger disclosure framework project intended to improve the effectiveness of financial statement footnote disclosure. ASU No. 2018-13 modifies required fair value disclosures related primarily to level 3 investments. This ASU is effective for annual periods beginning after December 15, 2019 and interim periods within those annual periods. The adoption of ASU No. 2018-13 is not expected to have a material effect on our consolidated financial position, results of operations, and cash flows.
In June 2018, the FASB issued ASU No. 2018-07, “Compensation – Stock Compensation (Topic 718): Improvements to Nonemployee Share-Based Payment Accounting.” This ASU expands the scope of Topic 718 to include share-based payment transactions for acquiring goods and services from nonemployees. An entity should apply the requirements of Topic 718 to nonemployee awards except for specific guidance on inputs to an option pricing model and the attribution of cost. The ASU is effective for the fiscal years beginning after December 15, 2018, including interim periods within that fiscal year. The adoption of ASU No. 2018-07 is not expected to have a material effect on our consolidated financial position, results of operations, and cash flows.
In February 2018, the FASB issued ASU No. 2018-02, “Income Statement – Reporting Comprehensive Income (Topic 220): Reclassification of Certain Tax Effects from Accumulated Other Comprehensive Income.” The new guidance allows companies to reclassify stranded tax effects resulting from the Tax Act from accumulated other comprehensive income to retained earnings. The guidance also requires certain new disclosures regardless of a company’s election. The standard is effective for annual periods beginning after December 15, 2018 and for interim periods within those annual periods, with earlier adoption permitted. The adoption of ASU No. 2018-02 is not expected to have a material effect on our consolidated financial position, results of operations, and cash flows.
In May 2017, the FASB issued ASU No. 2017-09, “Compensation - Stock Compensation (Topic 718): Scope of Modification Accounting.” This ASU amends the scope of modification accounting for share-based payment arrangements and provides guidance on the types of changes to the terms or conditions of share-based payment awards to which an entity would be required to apply modification accounting under Accounting Standards Codification (“ASC”) 718. The ASU is effective for the fiscal years beginning after December 15, 2019 and for interim periods within those fiscal years. The adoption of ASU No. 2017-09 is not expected to have a material effect on our consolidated financial position, results of operations, and cash flows, if any.
In January 2017, the FASB issued ASU No. 2017-04, “Intangibles – Goodwill and Other (Topic 350): Simplifying the Test for Goodwill Impairment.” This ASU eliminates Step 2 from the goodwill impairment test. Accordingly, if the carrying amount of a reporting unit exceeds its fair value, an impairment loss will be recognized in an amount equal to the excess, limited to the total amount of goodwill allocated to the reporting unit. The ASU is effective for the fiscal years beginning
35
Table of Contents
after December 15, 2019 and for interim periods within those fiscal years. We are currently evaluating the effect the adoption of ASU No. 2017-04 will have on our consolidated financial position, results of operations, and cash flows, if any.
In June 2016, the FASB issued ASU No. 2016-13, “Financial Instruments – Credit Losses (Topic 326),” which introduces new guidance for the accounting for credit losses on instruments within its scope. Given the breadth of that scope, this ASU will impact both financial services and non-financial services entities. The standard is effective for fiscal years beginning after December 15, 2020. We are currently evaluating the effect the adoption of ASU No. 2016-13 will have on our consolidated financial position, results of operations, and cash flows, if any.
In February 2016, the FASB issued ASU No. 2016-02, “Leases (Topic 842).” ASU 2016-02 requires that lessees recognize virtually all of their leases on the balance sheet, by recording a right-of-use asset and lease liability. The provisions of this guidance are effective for annual periods beginning after December 31, 2018, and for interim periods therein. We expect to adopt ASU No. 2016-02 upon its effective date of January 1, 2019 using the modified retrospective method and we will also elect the package of practical expedients. We anticipate the impact of adoption will be an increase to long-term assets and total liabilities of $14 million to $15 million as of January 1, 2019.
Recently issued accounting guidance not discussed above is not applicable or did not have, or is not expected to have, a material impact to the Company.
Item 7A.Quantitative and Qualitative Disclosures About Market Risk.
Interest Rate and Credit Market Risk
We are exposed to changes in interest rates and market liquidity including our investments in certain available-for-sale securities. Our available-for-sale securities consist of fixed and variable rate income investments, such as municipal notes, municipal bonds and corporate bonds. We continually monitor our exposure to changes in interest rates, market liquidity and credit ratings of issuers for our available-for-sale securities. It is possible that we are at risk if interest rates, market liquidity or credit ratings of issuers change in an unfavorable direction. The magnitude of any gain or loss will be a function of the difference between the fixed or variable rate of the financial instrument and the market rate, and our financial condition and results of operations could be materially affected. Based on a sensitivity analysis performed on our financial investments held as of December 31, 2018, an immediate adverse change of 10% in interest rates (e.g. 3.00% to 3.30%) would result in an immaterial decrease in the fair value of our available-for-sale debt securities and would not have a material impact on our consolidated financial position, results of operations or cash flows.
Foreign Currency Risk
A substantial portion of our systems and software sales are denominated in U.S. dollars with the exception of Japan. As a result, we have relatively little exposure to foreign currency exchange risk with respect to these sales. Substantially all of our sales in Japan are denominated in Japanese yen. From time to time, we may enter into forward exchange contracts to economically hedge a portion, but not all, of the existing and anticipated foreign currency denominated transactions expected to occur within 12 months. The change in fair value of the forward exchange contracts is recognized under the caption “Other (income) expense” in the Consolidated Statements of Operations for each reporting period. As of December 31, 2018 and 2017, we had twenty-seven and thirty-one outstanding forward contracts with a total notional contract value of $6.7 million and $8.4 million, respectively. We do not use derivative financial instruments for trading or speculative purposes.
We have branch operations in Taiwan, Singapore and South Korea and wholly-owned subsidiaries in Europe, Japan and China. Our international subsidiaries and branches operate primarily using local functional currencies. Our exposure to foreign currency exchange rate fluctuations arise from intercompany balances between our U.S. headquarters and that of our foreign owned entities. Our intercompany balances are denominated in U.S. dollars. Since each foreign entity’s functional currency is generally denominated in its local currency, there is exposure to foreign exchange risk when the foreign entity’s intercompany balance is remeasured at a reporting date, resulting in transaction gains or losses. The intercompany balance, exposed to foreign currency risk, as of December 31, 2018 was approximately $20.7 million. A hypothetical change of 10% in the relative value of the U.S. dollar versus local functional currencies could result in approximately $2.4 million in foreign currency exchange losses / (gains) which would be recorded as non-operating expense under the caption “Other (income) expense” in our Consolidated Statements of Operations. We cannot accurately predict future exchange rates or the overall impact of future exchange rate fluctuations on our business, results of operations and consolidated financial condition.
Item 8. | Financial Statements and Supplementary Data. |
The consolidated financial statements and related information required by this Item are set forth on the pages indicated in Item 15(a) of this Annual Report on Form 10-K.
36
Table of Contents
Item 9. | Changes in and Disagreements with Accountants on Accounting and Financial Disclosure. |
None.
Item 9A. | Controls and Procedures. |
Evaluation of Disclosure Controls and Procedures
We maintain disclosure controls and procedures that are designed to ensure that information we are required to disclose in reports that we file or submit under the Exchange Act is recorded, processed, summarized and reported within the time period specified in SEC rules and forms. These controls and procedures are also designed to ensure that such information is accumulated and communicated to our management, including our principal executive officer and principal financial officer, as appropriate, to allow timely decisions regarding required disclosure. In designing and evaluating disclosure controls and procedures, we have recognized that any controls and procedures, no matter how well designed and operated, can provide only reasonable assurance of achieving the desired control objectives. Management is required to apply judgment in evaluating its controls and procedures.
We performed an evaluation under the supervision and with the participation of our management, including our principal executive officer and principal financial officer, to assess the effectiveness of the design and operation of our disclosure controls and procedures under the Exchange Act as of December 31, 2018. Based on that evaluation, our management, including our principal executive officer and principal financial officer, concluded that our disclosure controls and procedures were effective as of December 31, 2018 at the reasonable assurance level.
Management’s Report on Internal Control Over Financial Reporting
Our management is responsible for establishing and maintaining adequate internal control over financial reporting, as such term is defined in Exchange Act Rules 13a-15(f) and 15d-15(f). Internal control over financial reporting is a process designed to provide reasonable assurance regarding the reliability of financial reporting and the preparation of financial statements for external purposes in accordance with accounting principles generally accepted in the United States of America. Under the supervision and with the participation of our management, including our principal executive officer and principal financial officer, we conducted an evaluation of the effectiveness of our internal control over financial reporting based on the framework in Internal Control — Integrated Framework issued by the Committee of Sponsoring Organizations of the Treadway Commission (2013 framework) (“COSO”). Based on our evaluation, our management concluded that our internal control over financial reporting was effective as of December 31, 2018.
Because of its inherent limitations, internal control over financial reporting may not prevent or detect misstatements. Also, projections of any evaluation of effectiveness to future periods are subject to the risk that controls may become inadequate because of changes in conditions, or that the degree of compliance with the policies or procedures may deteriorate.
Attestation Report of the Registered Public Accounting Firm
Our consolidated financial statements as of and for the year ended December 31, 2018 have been audited by Ernst & Young LLP, our independent registered public accounting firm, in accordance with the standards of the Public Company Accounting Oversight Board (United States). Ernst & Young LLP has also audited our internal control over financial reporting as of December 31, 2018, as stated in its attestation report included elsewhere in this Annual Report on Form 10-K.
Changes in Internal Control over Financial Reporting
There have been no changes in the Company’s internal control over financial reporting (as defined in Rule 13a-15(f) under the Exchange Act) that occurred during the Company’s quarter ended December 31, 2018 that have materially affected, or are reasonably likely to materially affect, its internal control over financial reporting.
Item 9B. | Other Information. |
None.
37
Table of Contents
PART III
Certain information required by Part III is omitted from this Annual Report on Form 10-K because we expect to file a definitive proxy statement within one hundred twenty (120) days after the end of our fiscal year pursuant to Regulation 14A (the “Proxy Statement”) for our Annual Meeting of Stockholders currently scheduled for May 15, 2019, and the information included in the Proxy Statement is incorporated herein by reference.
Item 10. | Directors, Executive Officers and Corporate Governance. |
The information required by this Item with respect to directors and executive officers is included under the headings “Proposal One: Election of Directors,” “Executive Officers” and “Corporate Governance Principles and Practices” in the Proxy Statement, which is incorporated herein by reference. Information regarding compliance with Section 16 of the Exchange Act is incorporated by reference to the information under the heading “Section 16(a) Beneficial Ownership Reporting Compliance” in the Proxy Statement.
Code of Ethics. We have adopted a code of ethics that applies to our principal executive officer, principal financial officer and controller. This code of ethics is posted on our internet website address at http://www.rudolphtech.com. We will post on our website any amendment to or waiver from a provision of our code of ethics as may be required, and within the time period specified, by applicable SEC rules.
Item 11. | Executive Compensation. |
The information required by this Item is included under the headings “Executive Compensation,” “Compensation of Directors,” “Compensation Committee Report on Executive Compensation,” “Stock Ownership/Retention Guidelines for Directors” and “Compensation Committee Interlocks and Insider Participation” in the Proxy Statement, which is incorporated herein by reference.
Item 12. | Security Ownership of Certain Beneficial Owners and Management and Related Stockholder Matters. |
The information required by this Item is included under the headings “Security Ownership” and “Equity Compensation Plan Information” in the Proxy Statement, which is incorporated herein by reference.
Item 13. | Certain Relationships and Related Transactions, and Director Independence. |
The information required by this Item is included under the headings “Related Persons Transactions Policy” and “Board Independence” in the Proxy Statement, which is incorporated herein by reference.
Item 14. | Principal Accounting Fees and Services. |
The information required by this Item is included under the heading “Proposal 3: Ratification of Appointment of Independent Registered Public Accounting Firm” in the Proxy Statement, which is incorporated herein by reference.
38
Table of Contents
PART IV
Item 15. | Exhibits and Financial Statement Schedule. |
| (a) | The following documents are filed as part of this Annual Report on Form 10-K: |
The consolidated financial statements and consolidated financial statement information required by this Item are included on pages F-1 through F-9 of this report. The Reports of Independent Registered Public Accounting Firm appear on pages F-2 through F-3 of this report.
| 2. | Financial Statement Schedule |
See Index to financial statements on page F-1 of this report.
Exhibits are as set forth in the “Exhibit Index”, provided below. Where so indicated, exhibits, which were previously filed, are incorporated by reference.
Exhibit No. | | Description |
| | |
3.1 | | Restated Certificate of Incorporation of Registrant, as amended (Conformed Version) (incorporated by reference to Exhibit 3.1 to the Registrant’s Quarterly Report on Form 10-Q(SEC File No. 000-27965) filed on August 2, 2013). |
| | |
3.2 | | Restated Bylaws of Registrant as amended, filed with this report. |
| | |
| | |
10.1+ | | License Agreement, dated June 28, 1995, between the Registrant and Brown University Research Foundation (incorporated by reference to Exhibit 10.1 to the Registrant’s Registration Statement on Form S-1, as amended (SEC File No. 333-86821), filed on September 9, 1999). |
| | |
10.2* | | Form of Indemnification Agreement (incorporated by reference to Exhibit 10.3 to the Registrant’s Registration Statement on Form S-1/A, as amended (SEC File No. 333-86821) filed on October 14, 1999). |
| | |
10.3* | | Management Agreement, dated as of July 24, 2000 by and between Rudolph Technologies, Inc. and Steven R. Roth as restated and amended on July 29, 2014 (incorporated by reference to Exhibit 10.2 to the Registrant’s Quarterly Report on Form 10-Q (SEC File No. 001-36226) filed on August 6, 2014). |
| | |
10.4* | | Employment Agreement, dated as of November 9, 2015, by and between Rudolph Technologies, Inc. and Michael Plisinski (incorporated by reference to Exhibit 10.1 to the Registrant’s Current Report on Form 8-K (SEC File No. 001-36226) filed on November 9, 2015). * |
| | |
10.5* | | Executive Change of Control Agreement, dated February 7, 2014, by and between Rudolph Technologies, Inc. and Richard Rogoff (incorporated by reference to Exhibit 10.10 to the Registrant’s Annual Report on Form 10-K (SEC File No. 001-36226) filed on February 20, 2015. |
+ Confidential treatment has been granted with respect to portions of this exhibit.
* Management contract, compensatory plan or arrangement.
39
Table of Contents
Exhibit No. | | Description |
| | |
10.6* | | Executive Change of Control Agreement, dated August 20, 2009, by and between Rudolph Technologies, Inc. and Robert A. Koch (incorporated by reference to Exhibit 10.3 to the Registrant’s Quarterly Report on Form 10-Q (SEC File No. 000-27965) filed on November 06, 2009). |
| | |
10.7* | | Rudolph Technologies, Inc. 2009 Stock Plan (incorporated by reference to Appendix A of the Registrant’s revised Proxy Statement on Form DEFR14A (SEC File No. 000-27965) filed on May 8, 2009). |
| | |
10.8* | | Amended form of Employee Restricted Stock Unit Purchase Agreement pursuant to the Rudolph Technologies, Inc. 2009 Stock Plan (incorporated by reference to Exhibit 10.12 to the Registrant’s Current Report on Form 10-Q (SEC File No. 001-36226), filed on August 3, 2017). |
| | |
10.9 | | Confirmation of Issuer Warrant Transaction, dated July 19, 2011, by and between Rudolph Technologies, Inc. and Credit Suisse International (incorporated by reference to Exhibit 10.4 to the Registrant’s Current Report on Form 8-K (SEC File No. 000-27965) filed on July 25, 2011). |
| | |
10.10 | | Amendment to Confirmation of Issuer Warrant Transaction, dated July 22, 2011, by and between Rudolph Technologies, Inc. and Credit Suisse International (incorporated by reference to Exhibit 10.5 to the Registrant’s Current Report on Form 8-K (SEC File No. 000-27965) filed on July 25, 2011). |
| | |
10.11 | | Rudolph Technologies, Inc. 2018 Stock Plan (incorporated by reference to Exhibit 10.1 to the Registrant’s Current Report on Form 8-K, (SEC File No. 001-36226) filed on May 16, 2018). |
| | |
10.12 | | Form of Employee Performance Stock Unit Purchase Agreement pursuant to the Rudolph Technologies, Inc. 2018 Stock Plan (incorporated by reference to Exhibit 10.1 to the Registrant’s Quarterly Report on Form 10-Q (SEC File No. 333-224969) filed on August 2, 2018). |
| | |
10.13 | | Form of Employee Stock Option Agreement pursuant to the Rudolph Technologies, Inc. 2018 Stock Plan (incorporated by reference to Exhibit 10.2 to the Registrant’s Quarterly Report on Form 10-Q (SEC File No. 001-36226) filed on August 2, 2018). |
| | |
10.14 | | Rudolph Technologies, Inc. 2018 Employee Stock Purchase Plan (incorporated by reference to Exhibit 10.2 to the Registrant’s Registration Statement on Form S-8, (SEC File No. 001-36226) filed on May 16, 2018. |
| | |
21.1 | | Subsidiaries. |
| | |
23.1 | | Consent of Ernst & Young LLP, Independent Registered Public Accounting Firm. |
| | |
31.1 | | Rule 13a-14(a) Certification of Chief Executive Officer of the Registrant pursuant to Section 302 of the Sarbanes-Oxley Act of 2002. |
| | |
31.2 | | Rule 13a-14(a) Certification of Chief Financial Officer of the Registrant pursuant to Section 302 of the Sarbanes-Oxley Act of 2002. |
| | |
32.1 | | Certification of the Chief Executive Officer pursuant to 18 U.S.C. Section 1350, as adopted pursuant to Section 906 of the Sarbanes-Oxley Act of 2002. |
| | |
32.2 | | Certification of the Chief Financial Officer pursuant to 18 U.S.C. Section 1350, as adopted pursuant to Section 906 of the Sarbanes-Oxley Act of 2002. |
| | |
101.INS | | XBRL Instance Document |
| | |
101.SCH | | XBRL Taxonomy Extension Schema Document |
| | |
101.CAL | | XBRL Taxonomy Extension Calculation Linkbase Document |
| | |
101.DEF | | XBRL Taxonomy Extension Definition Linkbase Document |
| | |
101.LAB | | XBRL Taxonomy Extension Label Linkbase Document |
| | |
101.PRE | | XBRL Taxonomy Extension Presentation Linkbase Document |
* Management contract, compensatory plan or arrangement.
40
Table of Contents
RUDOLPH TECHNOLOGIES, INC.
INDEX TO CONSOLIDATED FINANCIAL STATEMENTS AND
FINANCIAL STATEMENT SCHEDULE
F-1
Table of Contents
Report of Independent Registered Public Accounting Firm
To the Stockholders and the Board of Directors of Rudolph Technologies, Inc.
Opinion on the Financial Statements
We have audited the accompanying consolidated balance sheets of Rudolph Technologies, Inc. (the Company) as of December 31, 2018 and 2017, the related consolidated statements of operations, comprehensive income, stockholders' equity and cash flows for each of the three years in the period ended December 31, 2018, and the related notes and financial statement schedule listed in the Index at Item 15(a) (collectively referred to as the “consolidated financial statements”). In our opinion, the consolidated financial statements present fairly, in all material respects, the financial position of the Company at December 31, 2018 and 2017, and the results of its operations and its cash flows for each of the three years in the period ended December 31, 2018, in conformity with U.S. generally accepted accounting principles.
We also have audited, in accordance with the standards of the Public Company Accounting Oversight Board (United States) (PCAOB), the Company's internal control over financial reporting as of December 31, 2018, based on criteria established in Internal Control-Integrated Framework issued by the Committee of Sponsoring Organizations of the Treadway Commission (2013 framework) and our report dated February 15, 2019 expressed an unqualified opinion thereon.
Basis for Opinion
These financial statements are the responsibility of the Company's management. Our responsibility is to express an opinion on the Company’s financial statements based on our audits. We are a public accounting firm registered with the PCAOB and are required to be independent with respect to the Company in accordance with the U.S. federal securities laws and the applicable rules and regulations of the Securities and Exchange Commission and the PCAOB.
We conducted our audits in accordance with the standards of the PCAOB. Those standards require that we plan and perform the audit to obtain reasonable assurance about whether the financial statements are free of material misstatement, whether due to error or fraud. Our audits included performing procedures to assess the risks of material misstatement of the financial statements, whether due to error or fraud, and performing procedures that respond to those risks. Such procedures included examining, on a test basis, evidence regarding the amounts and disclosures in the financial statements. Our audits also included evaluating the accounting principles used and significant estimates made by management, as well as evaluating the overall presentation of the financial statements. We believe that our audits provide a reasonable basis for our opinion.
/s/ Ernst & Young LLP
We have served as the Company’s auditor since 2008.
Iselin, New Jersey
February 15, 2019
F-2
Table of Contents
Report of Independent Registered Public Accounting Firm
To the Stockholders and the Board of Directors of Rudolph Technologies, Inc.
Opinion on Internal Control over Financial Reporting
We have audited Rudolph Technologies, Inc. internal control over financial reporting as of December 31, 2018, based on criteria established in Internal Control— Integrated Framework issued by the Committee of Sponsoring Organizations of the Treadway Commission (2013 framework) (the COSO criteria). In our opinion, Rudolph Technologies, Inc. (the Company) maintained, in all material respects, effective internal control over financial reporting as of December 31, 2018, based on the COSO criteria.
We also have audited, in accordance with the standards of the Public Company Accounting Oversight Board (United States) (PCAOB), the consolidated balance sheets of the Company as of December 31, 2018 and 2017, the related consolidated statements of operations, comprehensive income, stockholders' equity and cash flows for each of the three years in the period ended December 31, 2018, and the related notes and financial statement schedule listed in the Index at Item 15(a) and our report dated February 15, 2019 expressed an unqualified opinion thereon.
Basis for Opinion
The Company’s management is responsible for maintaining effective internal control over financial reporting and for its assessment of the effectiveness of internal control over financial reporting included in the accompanying Management’s Report on Internal Control Over Financial Reporting. Our responsibility is to express an opinion on the Company’s internal control over financial reporting based on our audit. We are a public accounting firm registered with the PCAOB and are required to be independent with respect to the Company in accordance with the U.S. federal securities laws and the applicable rules and regulations of the Securities and Exchange Commission and the PCAOB.
We conducted our audit in accordance with the standards of the PCAOB. Those standards require that we plan and perform the audit to obtain reasonable assurance about whether effective internal control over financial reporting was maintained in all material respects.
Our audit included obtaining an understanding of internal control over financial reporting, assessing the risk that a material weakness exists, testing and evaluating the design and operating effectiveness of internal control based on the assessed risk, and performing such other procedures as we considered necessary in the circumstances. We believe that our audit provides a reasonable basis for our opinion.
Definition and Limitations of Internal Control Over Financial Reporting
A company’s internal control over financial reporting is a process designed to provide reasonable assurance regarding the reliability of financial reporting and the preparation of financial statements for external purposes in accordance with generally accepted accounting principles. A company’s internal control over financial reporting includes those policies and procedures that (1) pertain to the maintenance of records that, in reasonable detail, accurately and fairly reflect the transactions and dispositions of the assets of the company; (2) provide reasonable assurance that transactions are recorded as necessary to permit preparation of financial statements in accordance with generally accepted accounting principles, and that receipts and expenditures of the company are being made only in accordance with authorizations of management and directors of the company; and (3) provide reasonable assurance regarding prevention or timely detection of unauthorized acquisition, use, or disposition of the company’s assets that could have a material effect on the financial statements.
Because of its inherent limitations, internal control over financial reporting may not prevent or detect misstatements. Also, projections of any evaluation of effectiveness to future periods are subject to the risk that controls may become inadequate because of changes in conditions, or that the degree of compliance with the policies or procedures may deteriorate.
/s/ Ernst & Young LLP
Iselin, New Jersey
February 15, 2019
F-3
Table of Contents
RUDOLPH TECHNOLOGIES, INC.
CONSOLIDATED BALANCE SHEETS
(In thousands, except per share data)
| | December 31, 2018 | | | December 31, 2017 | |
ASSETS | | | | | | | | |
Current Assets: | | | | | | | | |
Cash and cash equivalents | | $ | 112,388 | | | $ | 67,770 | |
Marketable securities | | | 62,684 | | | | 109,589 | |
Accounts receivable, less allowance of $691 in 2018 and $460 in 2017 | | | 64,194 | | | | 65,283 | |
Inventories | | | 96,820 | | | | 67,521 | |
Income taxes receivable | | | 6,111 | | | | 7,220 | |
Prepaid expenses and other current assets | | | 8,710 | | | | 4,699 | |
Total current assets | | | 350,907 | | | | 322,082 | |
Property, plant and equipment, net | | | 18,874 | | | | 17,342 | |
Goodwill | | | 22,495 | | | | 22,495 | |
Identifiable intangible assets, net | | | 7,448 | | | | 8,632 | |
Deferred income taxes | | | 12,810 | | | | 14,879 | |
Other assets | | | 5,506 | | | | 492 | |
Total assets | | $ | 418,040 | | | $ | 385,922 | |
LIABILITIES AND STOCKHOLDERS’ EQUITY | | | | | | | | |
Current liabilities: | | | | | | | | |
Accounts payable | | $ | 16,981 | | | $ | 13,471 | |
Accrued liabilities: | | | | | | | | |
Payroll and related expenses | | | 10,648 | | | | 10,408 | |
Royalties | | | 611 | | | | 494 | |
Warranty | | | 2,441 | | | | 2,427 | |
Deferred revenue | | | 6,767 | | | | 6,223 | |
Other current liabilities | | | 7,543 | | | | 9,284 | |
Total current liabilities | | | 44,991 | | | | 42,307 | |
Other non-current liabilities | | | 11,161 | | | | 10,461 | |
Total liabilities | | | 56,152 | | | | 52,768 | |
Commitments and contingencies (Note 9) | | | | | | | | |
Stockholders’ equity: | | | | | | | | |
Preferred stock, $0.001 par value, 5,000 shares authorized, no shares issued and outstanding at December 31, 2018 and 2017 | | | — | | | | — | |
Common stock, $0.001 par value, 100,000 shares authorized, 30,906 and 31,604 issued and outstanding at December 31, 2018 and 2017, respectively. | | | 31 | | | | 32 | |
Additional paid-in capital | | | 369,893 | | | | 386,196 | |
Accumulated other comprehensive loss | | | (1,263 | ) | | | (1,205 | ) |
Accumulated deficit | | | (6,773 | ) | | | (51,869 | ) |
Total stockholders’ equity | | | 361,888 | | | | 333,154 | |
Total liabilities and stockholders’ equity | | $ | 418,040 | | | $ | 385,922 | |
The accompanying notes are an integral part of these consolidated financial statements.
F-4
Table of Contents
RUDOLPH TECHNOLOGIES, INC.
CONSOLIDATED STATEMENTS OF OPERATIONS
(In thousands, except per share data)
| | Year Ended December 31 | |
| | 2018 | | | 2017 | | | 2016 | |
Revenue | | $ | 273,784 | | | $ | 255,098 | | | $ | 232,780 | |
Cost of revenue | | | 125,505 | | | | 120,503 | | | | 109,229 | |
Gross profit | | | 148,279 | | | | 134,595 | | | | 123,551 | |
Operating expenses: | | | | | | | | | | | | |
Research and development | | | 49,053 | | | | 46,986 | | | | 44,964 | |
Selling, general and administrative | | | 46,608 | | | | 39,381 | | | | 38,562 | |
Amortization | | | 1,534 | | | | 1,940 | | | | 2,320 | |
Patent litigation income | | | — | | | | (13,000 | ) | | | (14,643 | ) |
Total operating expenses | | | 97,195 | | | | 75,307 | | | | 71,203 | |
Operating income | | | 51,084 | | | | 59,288 | | | | 52,348 | |
Interest (income) expense, net | | | (2,206 | ) | | | (971 | ) | | | 2,834 | |
Other expense (income), net | | | (56 | ) | | | 457 | | | | (354 | ) |
Income before provision for income taxes | | | 53,346 | | | | 59,802 | | | | 49,868 | |
Provision for income taxes | | | 8,250 | | | | 26,893 | | | | 12,916 | |
Net income | | $ | 45,096 | | | $ | 32,909 | | | $ | 36,952 | |
Earnings per share: | | | | | | | | | | | | |
Basic | | $ | 1.42 | | | $ | 1.05 | | | $ | 1.19 | |
Diluted | | $ | 1.40 | | | $ | 1.02 | | | $ | 1.16 | |
Weighted average number of shares outstanding: | | | | | | | | | | | | |
Basic | | | 31,671 | | | | 31,491 | | | | 31,128 | |
Diluted | | | 32,200 | | | | 32,162 | | | | 31,790 | |
| | | | | | | | | | | | |
The accompanying notes are an integral part of these consolidated financial statements.
F-5
Table of Contents
RUDOLPH TECHNOLOGIES, INC.
CONSOLIDATED STATEMENTS OF COMPREHENSIVE INCOME
(In thousands)
| | Year Ended December 31, | |
| | 2018 | | | 2017 | | | 2016 | |
Net income | | $ | 45,096 | | | $ | 32,909 | | | $ | 36,952 | |
Other comprehensive income (loss): | | | | | | | | | | | | |
Change in net unrealized gains (losses) on investments, net of tax | | | 136 | | | | (89 | ) | | | (37 | ) |
Change in currency translation adjustments | | | (194 | ) | | | 1,663 | | | | (119 | ) |
Total comprehensive income | | $ | 45,038 | | �� | $ | 34,483 | | | $ | 36,796 | |
The accompanying notes are an integral part of these consolidated financial statements.
F-6
Table of Contents
RUDOLPH TECHNOLOGIES, INC.
CONSOLIDATED STATEMENTS OF STOCKHOLDERS’ EQUITY
For the years ended December 31, 2018, 2017 and 2016
(In thousands)
| | Common Stock | | | Additional Paid-in | | | Accumulated Other Comprehensive | | | Accumulated | | | | | |
| | Shares | | | Amount | | | Capital | | | Loss | | | Deficit | | | Total | |
Balance at December 31, 2015 | | | 30,949 | | | $ | 31 | | | $ | 394,928 | | | $ | (2,623 | ) | | $ | (121,658 | ) | | $ | 270,678 | |
Issuance of shares through share-based compensation plans, net | | | 713 | | | | — | | | | 850 | | | | — | | | | — | | | | 850 | |
Repurchase of common stock | | | (615 | ) | | | — | | | | (8,044 | ) | | | — | | | | — | | | | (8,044 | ) |
Net income | | | — | | | | — | | | | — | | | | — | | | | 36,952 | | | | 36,952 | |
Share-based compensation | | | — | | | | — | | | | 4,775 | | | | — | | | | — | | | | 4,775 | |
Tax benefit for share-based compensation plans | | | — | | | | — | | | | 792 | | | | — | | | | — | | | | 792 | |
Share-based compensation plan withholdings | | | — | | | | — | | | | (1,587 | ) | | | — | | | | — | | | | (1,587 | ) |
Redemption of stock warrants | | | 80 | | | | — | | | | (10,525 | ) | | | — | | | | — | | | | (10,525 | ) |
Currency translation | | | — | | | | — | | | | — | | | | (119 | ) | | | — | | | | (119 | ) |
Unrealized loss on investments | | | — | | | | — | | | | — | | | | (37 | ) | | | — | | | | (37 | ) |
Balance at December 31, 2016 | | | 31,127 | | | | 31 | | | | 381,189 | | | | (2,779 | ) | | | (84,706 | ) | | | 293,735 | |
Issuance of shares through share-based compensation plans, net | | | 375 | | | | 1 | | | | 623 | | | | — | | | | — | | | | 624 | |
Net income | | | — | | | | — | | | | — | | | | — | | | | 32,909 | | | | 32,909 | |
Share-based compensation | | | — | | | | — | | | | 5,670 | | | | — | | | | — | | | | 5,670 | |
Cumulative effect of a change in accounting for share-based compensation | | | — | | | | — | | | | 72 | | | | — | | | | (72 | ) | | | — | |
Share-based compensation plan withholdings | | | — | | | | — | | | | (1,358 | ) | | | — | | | | — | | | | (1,358 | ) |
Redemption of stock warrants | | | 102 | | | | — | | | | — | | | | — | | | | — | | | | — | |
Currency translation | | | — | | | | — | | | | — | | | | 1,663 | | | | — | | | | 1,663 | |
Unrealized loss on investments | | | — | | | | — | | | | — | | | | (89 | ) | | | — | | | | (89 | ) |
Balance at December 31, 2017 | | | 31,604 | | | | 32 | | | | 386,196 | | | | (1,205 | ) | | | (51,869 | ) | | | 333,154 | |
Issuance of shares through share-based compensation plans, net | | | 363 | | | | — | | | | 624 | | | | — | | | | — | | | | 624 | |
Repurchase of common stock | | | (1,061 | ) | | | (1 | ) | | | (21,068 | ) | | | — | | | | — | | | | (21,069 | ) |
Net income | | | — | | | | — | | | | — | | | | — | | | | 45,096 | | | | 45,096 | |
Share-based compensation | | | — | | | | — | | | | 6,062 | | | | — | | | | — | | | | 6,062 | |
Share-based compensation plan withholdings | | | — | | | | — | | | | (1,921 | ) | | | — | | | | — | | | | (1,921 | ) |
Currency translation | | | — | | | | — | | | | — | | | | (194 | ) | | | — | | | | (194 | ) |
Unrealized gain on investments | | | — | | | | — | | | | — | | | | 136 | | | | — | | | | 136 | |
Balance at December 31, 2018 | | | 30,906 | | | $ | 31 | | | $ | 369,893 | | | $ | (1,263 | ) | | $ | (6,773 | ) | | $ | 361,888 | |
The accompanying notes are an integral part of these consolidated financial statements
F-7
Table of Contents
RUDOLPH TECHNOLOGIES, INC.
CONSOLIDATED STATEMENTS OF CASH FLOWS
(In thousands)
| | Year Ended December 31, | |
| | 2018 | | | 2017 | | | 2016 | |
Cash flows from operating activities: | | | | | | | | | | | | |
Net income | | $ | 45,096 | | | $ | 32,909 | | | $ | 36,952 | |
Adjustments to reconcile net income to net cash and cash equivalents provided by operating activities: | | | | | | | | | | | | |
Depreciation | | | 4,848 | | | | 3,990 | | | | 3,677 | |
Amortization of convertible note discount and issuance costs | | | — | | | | — | | | | 2,154 | |
Amortization of intangibles | | | 1,534 | | | | 1,940 | | | | 2,320 | |
Foreign currency exchange loss | | | 255 | | | | 457 | | | | 592 | |
Gain on disposal of property, plant and equipment | | | — | | | | — | | | | (946 | ) |
Change in fair value of contingent consideration | | | 1,010 | | | | 133 | | | | 170 | |
Share-based compensation | | | 6,062 | | | | 5,670 | | | | 4,775 | |
Provision for doubtful accounts and inventory valuation | | | 3,335 | | | | 3,608 | | | | 2,971 | |
Deferred income taxes | | | 2,163 | | | | 17,207 | | | | 5,011 | |
Change in operating assets and liabilities: | | | | | | | | | | | | |
Accounts receivable | | | 706 | | | | 430 | | | | (9,279 | ) |
Income taxes | | | 1,056 | | | | (4,727 | ) | | | (3,021 | ) |
Inventories | | | (31,545 | ) | | | (4,218 | ) | | | 4,003 | |
Prepaid expenses and other assets | | | (3,101 | ) | | | (1,686 | ) | | | 2,038 | |
Accounts payable | | | 3,512 | | | | 3,198 | | | | 1,169 | |
Deferred revenue | | | 545 | | | | (1,122 | ) | | | 896 | |
Other liabilities | | | (382 | ) | | | 6,382 | | | | (6,057 | ) |
Net cash and cash equivalents provided by operating activities | | | 35,094 | | | | 64,171 | | | | 47,425 | |
Cash flows from investing activities: | | | | | | | | | | | | |
Purchases of marketable securities | | | (140,018 | ) | | | (164,661 | ) | | | (146,865 | ) |
Proceeds from sales of marketable securities | | | 186,332 | | | | 143,349 | | | | 175,460 | |
Purchases of property, plant and equipment | | | (7,542 | ) | | | (10,210 | ) | | | (3,291 | ) |
Cash advance on convertible note receivable | | | (5,000 | ) | | | — | | | | — | |
Purchase of intangible assets | | | — | | | | (1,000 | ) | | | (2,000 | ) |
Proceeds from sale of property, plant & equipment | | | — | | | | — | | | | 1,165 | |
Net cash and cash equivalents provided by (used in) investing activities | | | 33,772 | | | | (32,522 | ) | | | 24,469 | |
Cash flows from financing activities: | | | | | | | | | | | | |
Payment of senior convertible debt | | | — | | | | — | | | | (60,000 | ) |
Redemption of stock warrants | | | — | | | | (1,025 | ) | | | (9,500 | ) |
Purchases of common stock | | | (21,069 | ) | | | — | | | | (8,044 | ) |
Tax payments related to shares withheld for share-based compensation plans | | | (1,921 | ) | | | (1,358 | ) | | | (1,587 | ) |
Payment of contingent consideration for acquired business | | | (1,543 | ) | | | (792 | ) | | | (622 | ) |
Issuance of shares through share-based compensation plans | | | 624 | | | | 623 | | | | 850 | |
Net cash and cash equivalents used in financing activities | | | (23,909 | ) | | | (2,552 | ) | | | (78,903 | ) |
Effect of exchange rate changes on cash and cash equivalents | | | (339 | ) | | | 814 | | | | 314 | |
Net increase (decrease) in cash and cash equivalents | | | 44,618 | | | | 29,911 | | | | (6,695 | ) |
Cash and cash equivalents at beginning of year | | | 67,770 | | | | 37,859 | | | | 44,554 | |
Cash and cash equivalents at end of year | | $ | 112,388 | | | $ | 67,770 | | | $ | 37,859 | |
Supplemental disclosure of cash flow information: | | | | | | | | | | | | |
Income taxes paid, net | | $ | 4,301 | | | $ | 14,605 | | | $ | 10,980 | |
Interest paid | | $ | — | | | $ | — | | | $ | 2,250 | |
Litigation settlement received | | $ | — | | | $ | 13,000 | | | $ | 14,643 | |
The accompanying notes are an integral part of these consolidated financial statements.
F-8
Table of Contents
RUDOLPH TECHNOLOGIES, INC.
NOTES TO THE CONSOLIDATED FINANCIAL STATEMENTS
(In thousands, except per share data)
1. | Organization and Nature of Operations: |
Rudolph Technologies, Inc. is a worldwide leader in the design, development, manufacture and support of process control tools that perform macro-defect inspections and metrology, lithography systems, and process control analytical software used by semiconductor and advanced packaging device manufacturers. The Company has branch sales and service offices in South Korea, Taiwan and Singapore and wholly-owned sales and service subsidiaries in the United States, Europe, Japan and China. The Company operates in a single reportable segment and is a provider of process characterization equipment and software for wafer fabs and advanced packaging facilities.
2. | Summary of Significant Accounting Policies: |
A. Consolidation:
The consolidated financial statements reflect the accounts of the Company and its wholly-owned subsidiaries. All intercompany accounts and transactions have been eliminated.
B. Revenue Recognition:
Adoption of ASC Topic 606, “Revenue from Contracts with Customers”
On January 1, 2018, the Company adopted Topic 606 using the modified retrospective method applied to those contracts which were not completed as of January 1, 2018. Results for reporting periods beginning after January 1, 2018 are presented under Topic 606, while comparative information has not been restated and continues to be reported under the accounting standards in effect for those periods. The Company did not record a cumulative impact due to the adoption of Topic 606.
Revenue Recognition
Revenue is recognized when control of the promised goods or services are transferred to the Company’s customers in an amount that reflects the consideration the Company expects to be entitled to receive in exchange for those goods or services. The Company accounts for a contract when it has approval and commitment from both parties, the rights of the parties and payment terms are identified, the contract has commercial substance and collectability of consideration is probable.
The Company has elected to account for shipping and handling activities as the fulfillment of a promise to transfer goods to the customer and therefore records these activities under the caption “Cost of revenue.” Sales tax and any other taxes collected concurrent with revenue producing activities are excluded from revenue. Incidental items that are immaterial in the context of the contract are recognized as expense. These accounting policy elections are consistent with the manner in which the Company has historically recorded these items.
Contracts with customers may include multiple performance obligations. For such arrangements, the Company allocates revenue to each performance obligation based on its relative standalone selling price. The Company generally determines standalone selling prices based on the prices charged to customers or the expected cost plus margin.
F-9
Table of Contents
RUDOLPH TECHNOLOGIES, INC.
NOTES TO THE CONSOLIDATED FINANCIAL STATEMENTS—(Continued)
(In thousands, except per share data)
Disaggregated Revenue
The following table presents the Company’s revenue disaggregated by revenue source:
| | Year Ended December 31, | |
| | 2018 | | | 2017 | | | 2016 | |
Systems | | $ | 205,073 | | | $ | 191,411 | | | $ | 165,601 | |
Software licensing, support and maintenance | | | 29,168 | | | | 25,473 | | | | 29,795 | |
Parts | | | 28,658 | | | | 27,143 | | | | 25,343 | |
Services | | | 10,885 | | | | 11,071 | | | | 12,041 | |
Total revenue | | $ | 273,784 | | | $ | 255,098 | | | $ | 232,780 | |
The following table represents a disaggregation of revenue by timing of revenue:
| | Year Ended December 31, | |
| | 2018 | |
Point-in-time | | $ | 257,124 | |
Over-time | | | 16,660 | |
Total revenue | | $ | 273,784 | |
See Note 14 of the Notes to the Consolidated Financial Statements for additional discussion of the Company’s disaggregated revenue in detail.
Systems Revenue
Revenue from systems is recognized when the Company transfers control of the product to the customer. To indicate transfer of control, the Company must have a present right to payment, legal title must have passed to the customer and the customer must have the significant risks and rewards of ownership. The Company generally transfers control for system sales when the customer or the customer’s agent picks up the system at the Company’s facility. Payment for the majority of the Company’s systems have 80-90% of the invoice amount due within 30 days and the remaining amount due upon completion of installation, recalibration and qualification by the customer. The Company provides an assurance warranty on its systems for a period of twelve to fifteen months against defects in material and workmanship. The Company provides for the estimated cost of product warranties at the time revenue is recognized.
Depending on the terms of the systems arrangement, the Company may also defer the recognition of a portion of the consideration expected to be received because the Company has to satisfy a future obligation (e.g., installation, training and extended warranties). The Company uses an observable price to determine the standalone selling price for separate performance obligations or a cost plus margin approach when one is not available.
Software Licensing, Support and Maintenance Revenue
Revenue from software licenses provides the customer with a right to use the software as it exists when made available to the customer. Revenue from software licenses are recognized upfront at the point in time when the software is made available to the customer. Revenue from licensing support and maintenance is recognized as the support and maintenance are provided, which is over the contract period. Payment for software licensing, support and maintenance is generally due in 30 days.
Parts Revenue
Revenue from parts is recognized when the Company transfers control of the product, which typically occurs when the Company ships the product from its facilities to the customer. Payment for parts is generally due in 30 days.
Services Revenue
Revenue from services primarily consists of service contracts, which provide additional maintenance coverage beyond the Company’s assurance warranty on its products, service labor, consulting and training. Revenue from service contracts is
F-10
Table of Contents
RUDOLPH TECHNOLOGIES, INC.
NOTES TO THE CONSOLIDATED FINANCIAL STATEMENTS—(Continued)
(In thousands, except per share data)
recognized ratably over the term of the service contract. Revenue from service labor, consulting and training is recognized as services are performed. Payment for services is generally due in 30 days.
Contract Liabilities
The Company records contract liabilities when the customer has been billed in advance of the Company completing its performance obligations. These amounts are recorded as deferred revenue in the Consolidated Balance Sheets.
Changes in deferred revenue were as follows:
| | Year Ended December 31, | |
| | 2018 | |
Balance, beginning of the period | | $ | 7,206 | |
Deferral of revenue | | | 19,326 | |
Recognition of deferred revenue | | | (18,452 | ) |
Balance, ending of the period | | $ | 8,080 | |
Practical Expedients
The Company generally expenses sales commissions when incurred because the amortization period is one year or less. These costs are recorded within selling, general and administrative expenses.
The Company does not adjust the amount of consideration for the effects of a significant financing component as the payment terms are generally one year or less.
The Company does not disclose the value of remaining performance obligations for contracts with an original expected length of one year or less and contracts for which the Company recognizes revenue in the amount to which it has the right to invoice.
C. Estimates:
The preparation of financial statements in conformity with accounting principles generally accepted in the United States of America requires management to make estimates and assumptions that affect the reported amounts of assets and liabilities and disclosure of contingent assets and liabilities as of the date of the financial statements and the reported amounts of revenue and expenses during the reporting period. Significant estimates made by management include the allowance for doubtful accounts, excess and obsolete inventory, fair value of assets acquired and liabilities assumed in a business combination (including contingent consideration), recoverability and useful lives of property, plant and equipment and identifiable intangible assets, recoverability of goodwill, recoverability of deferred tax assets, liabilities for product warranty, contingencies, including litigation reserves and share-based payments and liabilities for tax uncertainties. Actual results could differ from those estimates.
D. Cash and Cash Equivalents:
Cash and cash equivalents include cash and highly liquid debt instruments with original maturities of three months or less when purchased.
E. Marketable Securities:
The Company determined that all of its investment securities are to be classified as available-for-sale. Available-for-sale debt securities are carried at fair value, with the unrealized gains and losses reported in stockholders’ equity under the caption “Accumulated other comprehensive loss.” Realized gains and losses and, interest and dividends on available-for-sale securities are included in interest income and other, net. Available-for-sale securities are classified as current assets regardless of their maturity date if they are available for use in current operations. The Company reviews its investment portfolio to identify and evaluate investments that have indications of possible impairment. Factors considered in determining whether a loss is other-than-temporary include the length of time and extent to which fair value has been less than the cost basis, credit quality and the Company’s ability and intent to hold the investment for a period of time sufficient to allow for any anticipated
F-11
Table of Contents
RUDOLPH TECHNOLOGIES, INC.
NOTES TO THE CONSOLIDATED FINANCIAL STATEMENTS—(Continued)
(In thousands, except per share data)
recovery in market value. When a decline in fair value is determined to be other-than-temporary, unrealized losses on available-for-sale securities are charged against earnings. The specific identification method is used to determine the gains and losses on marketable securities.
For additional information on the Company’s marketable securities, see Note 4 of Notes to the Consolidated Financial Statements.
F. Allowance for Doubtful Accounts:
The Company evaluates the collectability of accounts receivable based on a combination of factors. Where the Company is aware of circumstances that may impair a specific customer’s ability to meet its financial obligation, the Company records a specific allowance against amounts due, thereby reducing the net recognized receivable to the amount management reasonably believes will be collected. For all other customers, the Company recognizes allowances for doubtful accounts based on the length of time the receivables are outstanding, industry and geographic concentrations, the current business environment and historical experience.
G. Inventories:
Inventories are stated at the lower of cost or net realizable value. Net realizable value is the estimated selling prices in the ordinary course of business, less predictable costs of completion, disposal and transportation. Cost is generally determined on a first-in, first-out basis, and includes material, labor and manufacturing overhead costs. The Company reviews and sets standard costs as needed, but at a minimum, on an annual basis, at current manufacturing costs in order to approximate actual costs.
The Company evaluates inventories for excess quantities and obsolescence. The Company establishes inventory reserves when conditions exist that suggest that inventory may be in excess of anticipated demand or is obsolete based upon assumptions about historical and future demand for the Company’s products and market conditions. In addition, inventories are evaluated for potential obsolescence due to the effect of known and anticipated engineering design changes. Once a reserve has been established, it is maintained until the item to which it relates is scrapped or sold.
H. Property, Plant and Equipment:
Property, plant and equipment are stated at cost. Depreciation of property, plant and equipment is computed using the straight-line method over the estimated useful lives of the assets, which are fifteen years for buildings, four to seven years for machinery and equipment, seven years for furniture and fixtures, and three years for computer equipment. Leasehold improvements are amortized using the straight-line method over the lesser of the lease term or the estimated useful life of the related asset. Repairs and maintenance costs are expensed as incurred and major renewals and betterments are capitalized.
I. Impairment of Long-Lived Assets:
Long-lived assets, such as property, plant, and equipment, and identifiable acquired intangible assets with definite useful lives, are reviewed for impairment whenever events or changes in circumstances indicate that the carrying amount of an asset may not be recoverable. Recoverability of assets to be held and used is measured by a comparison of the carrying amount of an asset to estimated undiscounted future cash flows expected to be generated by the asset. If the carrying amount of an asset exceeds its estimated future cash flows, an impairment charge is recognized in the amount by which the carrying amount of the asset exceeds the fair value of the asset, which is generally based on discounted cash flows.
J. Goodwill and Intangible Assets:
Intangible assets with finite useful lives are amortized using the straight-line method over their estimated useful lives. Goodwill and intangible assets with indefinite useful lives are not amortized but are tested for impairment at least annually and when there are indications of impairment. Goodwill impairment is deemed to exist if the net book value of a reporting unit exceeds its estimated fair value. The Company has the option to first assess qualitative factors to determine whether the
F-12
Table of Contents
RUDOLPH TECHNOLOGIES, INC.
NOTES TO THE CONSOLIDATED FINANCIAL STATEMENTS—(Continued)
(In thousands, except per share data)
existence of events or circumstances leads to a determination that it is more likely than not that the fair value of a reporting unit is less than its carrying amount. If the Company elects this option and after assessing the totality of events or circumstances, the Company determines that it is not likely that the fair value of its reporting unit is less than its carrying amount, then performing the two-step impairment test is unnecessary. The Company has not elected this option to date. The Company estimates the fair value of its reporting unit using the market value of its common stock at October 31 multiplied by the number of outstanding common shares (market capitalization) and an implied control premium as if it were to be acquired by a single stockholder. The Company also obtains information on completed sales of similar companies in the related industry to estimate the implied control premium for the Company. If the results of the initial market capitalization test produce results that are below the reporting unit carrying value, the Company will also consider if the market capitalization is temporarily low and, if so, we may also perform a discounted cash flow test. The Company tested for goodwill impairment on October 31, 2018. No impairments were noted.
For additional information on the Company’s goodwill and purchased intangible assets, see Note 5 of Notes to the Consolidated Financial Statements.
K. Concentration of Credit Risk:
Financial instruments, which potentially subject the Company to concentrations of credit risk, consist primarily of accounts receivable, cash and cash equivalents and marketable securities. The Company performs ongoing credit evaluations of its customers and generally does not require collateral for sales on credit. The Company maintains allowances for potential credit losses. The Company maintains cash and cash equivalents and marketable securities with higher credit quality issuers and monitors the amount of credit exposure to any one issuer.
L. Warranties:
The Company generally provides a warranty on its products for a period of twelve to fifteen months against defects in material and workmanship. The Company provides for the estimated cost of product warranties at the time revenue is recognized.
M. Income Taxes:
The Company accounts for income taxes using the asset and liability approach for deferred taxes which requires the recognition of deferred tax assets and liabilities for the expected future tax consequences of events that have been recognized in the Company’s consolidated financial statements or tax returns. A valuation allowance is recorded to reduce a deferred tax asset to that portion which more likely than not will be realized. The Company does not record tax expense impact for foreign withholding taxes and outside basis differences on the undistributed earnings of its foreign operations as it is the Company’s intention to permanently re-invest undistributed earnings.
For additional information on the Company’s income taxes, see Note 12 of Notes to the Consolidated Financial Statements.
N. Translation of Foreign Currencies:
The Company has branch operations in Taiwan, Singapore and South Korea and wholly-owned subsidiaries in the United States, Europe, Japan and China. Its international subsidiaries and branches operate primarily through the use of local functional currencies. A substantial portion of the Company’s international systems sales are denominated in U.S. dollars with the exception of Japan. Consequently, we have relatively little exposure to foreign currency exchange risk with respect to these sales.
Assets and liabilities are translated at exchange rates in effect at the balance sheet date, and income and expense accounts and cash flow items are translated at average monthly exchange rates during the period. Net exchange gains or losses resulting from the translation of foreign financial statements and the effect of exchange rates on intercompany transactions of a long-term investment nature are recorded directly as a separate component of stockholders’ equity under the
F-13
Table of Contents
RUDOLPH TECHNOLOGIES, INC.
NOTES TO THE CONSOLIDATED FINANCIAL STATEMENTS—(Continued)
(In thousands, except per share data)
caption, “Accumulated other comprehensive loss.” Any foreign currency gains or losses related to transactions are included in operating results. The Company had accumulated exchange losses resulting from the translation of foreign operation financial statements of $1,273 and $1,079 as of December 31, 2018 and 2017, respectively.
O. Share-based Compensation:
Share-based awards are measured based on the grant-date fair value of the award and recognized over the period from the service inception date through the date the employee is no longer required to provide service to earn the award. Effective upon the Company’s adoption of Accounting Standards Update (“ASU”) No. 2016-09, “Improvements to Employee Share-Based Payment Accounting” on January 1, 2017, forfeitures are accounted for as they occur. Prior to the adoption of ASU No. 2016-09, expected forfeitures were included in determining share-based compensation expense.
For additional information on the Company’s share-based compensation plans, see Note 10 of Notes to the Consolidated Financial Statements.
P. Research and Development Costs:
Expenditures for research and development are expensed as incurred.
Q. Fair Value of Financial Instruments:
The carrying amounts of the Company’s financial instruments, including cash and cash equivalents, accounts receivable, accounts payable and accrued liabilities, approximate fair value due to their short maturities. The estimated fair value of these obligations is based, primarily, on a market approach, comparing the Company’s interest rates to those rates the Company believes it would reasonably receive upon re-entry into the market. Judgment is required to estimate the fair value using available market information and appropriate valuation methods.
For additional information on the Company’s fair value of financial instruments, see Note 3 of Notes to the Consolidated Financial Statements.
R. Derivative Instruments and Hedging Activities:
The Company, when it considers it to be appropriate, enters into forward contracts to hedge the economic exposures arising from foreign currency denominated transactions. At December 31, 2018 and 2017, these contracts included the future sale of Japanese Yen to purchase U.S. dollars. The foreign currency forward contracts were entered into by the Company’s Japanese subsidiary to hedge a portion of certain intercompany obligations. The forward contracts are not designated as hedges for accounting purposes and therefore, the change in fair value is recorded in selling, general and administrative expenses in the Consolidated Statements of Operations. The Company records its forward contracts at fair value in either prepaid expenses and other current assets or other current liabilities in the Consolidated Balance Sheets.
The dollar equivalent of the U.S. dollar forward contracts and related fair values as of December 31, 2018 and 2017 were as follows:
| | December 31, | |
| | 2018 | | | 2017 | |
Notional amount | | | 6,746 | | | | 8,417 | |
Fair value of asset (liability) | | | (32 | ) | | | 45 | |
During the year ended December 31, 2018, the Company recognized a loss of $81 on maturities of forward contracts. For the years ended December 31, 2017 and 2016, the Company recorded gains of $105 and $417 on maturities of forward contracts, respectively. The aggregate notional amounts of matured contracts were $8,465, $9,582 and $6,641 for 2018, 2017 and 2016, respectively.
F-14
Table of Contents
RUDOLPH TECHNOLOGIES, INC.
NOTES TO THE CONSOLIDATED FINANCIAL STATEMENTS—(Continued)
(In thousands, except per share data)
S. Contingencies and Litigation
The Company is subject to the possibility of losses from various contingencies, including certain legal proceedings, lawsuits and other claims. The Company accrues for a loss contingency when it concludes that the likelihood of a loss is probable and the amount of the loss can be reasonably estimated. If the Company concludes that loss contingencies that could be material to any one of its financial statements are not probable, but are reasonably possible, or are probable, but cannot be estimated, then the Company discloses the nature of the loss contingencies, together with an estimate of the range of possible loss or a statement that such loss is not reasonably estimable. The Company expenses as incurred the costs of defending legal claims against the Company. The Company does not recognize gain contingencies until realized. See Note 9 of the Notes to the Consolidated Financial Statements, “Commitments and Contingencies” for a detailed description.
T. Recent Accounting Pronouncements:
Recently Adopted
Effective January 1, 2018, the Company adopted ASU No. 2016-16, “Income Tax (Topic 740): Intra-Entity Transfers of Assets Other Than Inventory.” This ASU, which is part of the simplification initiative of the Financial Accounting Standards Board (“FASB”), is intended to reduce the complexity of U.S. GAAP and diversity in practice related to the tax consequences of certain types of intra-entity asset transfers, particularly those involving intellectual property. The adoption of ASU No. 2016-16 did not have any impact on the Company’s consolidated financial position, results of operations, and cash flows.
Effective January 1, 2018, the Company adopted ASU No. 2016-15, “Statement of Cash Flows (Topic 230): Classification of Certain Cash Receipts and Cash Payments.” This ASU provides guidance on statement of cash flows presentation for eight specific cash flow issues where diversity in practice exists. The Company retrospectively adopted ASU No. 2018-15 resulting in a reclassification related to contingent consideration payments made after a business combination. The reclassification of $0.2 million from cash flows from financing activities to cash flows from operating activities is reflected in the Consolidated Statement of Cash Flows for the twelve month period ended December 31, 2017. Adoption of additional guidance under ASU No. 2016-15 did not have a material impact on the Company’s consolidated financial position, results of operations, and cash flows.
Effective January 1, 2018, the Company adopted ASU No. 2014-09, “Revenue from Contracts with Customers (Topic 606),” which supersedes nearly all existing revenue recognition guidance. The core principle of this ASU is that revenue should be recognized to depict the transfer of promised goods or services to customers in an amount that reflects the consideration to which the entity expects to be entitled in exchange for those goods or services. As a result of the adoption of ASU No. 2014-09, the Company changed its accounting policy for revenue recognition. Refer to Item B of this Note to the Consolidated Financial Statements, “Summary of Significant Accounting Policies” for further information.
Recently Issued
In August 2018, the FASB issued ASU No. 2018-13, “Fair Value Measurement (Topic 820): Disclosure Framework – Changes to the Disclosure Requirements for Fair Value Measurement.” This ASU is part of the FASB’s larger disclosure framework project intended to improve the effectiveness of financial statement footnote disclosure. ASU No. 2018-13 modifies required fair value disclosures related primarily to level 3 investments. This ASU is effective for annual periods beginning after December 15, 2019 and interim periods within those annual periods. The adoption of ASU No. 2018-13 is not expected to have a material effect on the Company’s consolidated financial position, results of operations, and cash flows.
In June 2018, the FASB issued ASU No. 2018-07, “Compensation – Stock Compensation (Topic 718): Improvements to Nonemployee Share-Based Payment Accounting.” This ASU expands the scope of Topic 718 to include share-based payment transactions for acquiring goods and services from nonemployees. An entity should apply the requirements of Topic 718 to nonemployee awards except for specific guidance on inputs to an option pricing model and the attribution of cost. The ASU is effective for the fiscal years beginning after December 15, 2018, including interim periods within that fiscal year. The adoption of ASU No. 2018-07 is not expected to have a material effect on the Company’s consolidated financial position, results of operations, and cash flows.
In February 2018, the FASB issued ASU No. 2018-02, “Income Statement – Reporting Comprehensive Income (Topic 220): Reclassification of Certain Tax Effects from Accumulated Other Comprehensive Income.” The new guidance allows
F-15
Table of Contents
RUDOLPH TECHNOLOGIES, INC.
NOTES TO THE CONSOLIDATED FINANCIAL STATEMENTS—(Continued)
(In thousands, except per share data)
companies to reclassify stranded tax effects resulting from the Tax Cuts and Jobs Act (the “Tax Act”) from accumulated other comprehensive income to retained earnings. The guidance also requires certain new disclosures regardless of a company’s election. The standard is effective for annual periods beginning after December 15, 2018 and for interim periods within those annual periods, with earlier adoption permitted. The adoption of ASU No. 2018-02 is not expected to have a material effect on the Company’s consolidated financial position, results of operations, and cash flows.
In May 2017, the FASB issued ASU No. 2017-09, “Compensation - Stock Compensation (Topic 718): Scope of Modification Accounting.” This ASU amends the scope of modification accounting for share-based payment arrangements and provides guidance on the types of changes to the terms or conditions of share-based payment awards to which an entity would be required to apply modification accounting under Accounting Standards Codification (“ASC”) 718. The ASU is effective for the fiscal years beginning after December 15, 2019 and for interim periods within those fiscal years. The adoption of ASU No. 2017-09 is not expected to have a material effect on the Company’s consolidated financial position, results of operations, and cash flows, if any.
In January 2017, the FASB issued ASU No. 2017-04, “Intangibles – Goodwill and Other (Topic 350): Simplifying the Test for Goodwill Impairment.” This ASU eliminates Step 2 from the goodwill impairment test. Accordingly, if the carrying amount of a reporting unit exceeds its fair value, an impairment loss will be recognized in an amount equal to the excess, limited to the total amount of goodwill allocated to the reporting unit. The ASU is effective for the fiscal years beginning after December 15, 2019 and for interim periods within those fiscal years. The Company is currently evaluating the effect the adoption of ASU No. 2017-04 will have on its consolidated financial position, results of operations, and cash flows, if any.
In June 2016, the FASB issued ASU No. 2016-13, “Financial Instruments – Credit Losses (Topic 326),” which introduces new guidance for the accounting for credit losses on instruments within its scope. Given the breadth of that scope, this ASU will impact both financial services and non-financial services entities. The standard is effective for fiscal years beginning after December 15, 2020. The Company is currently evaluating the effect the adoption of ASU No. 2016-13 will have on its consolidated financial position, results of operations, and cash flows, if any.
In February 2016, the FASB issued ASU No. 2016-02, “Leases (Topic 842).” ASU No. 2016-02 requires that lessees recognize virtually all of their leases on the balance sheet, by recording a right-of-use asset and lease liability. The provisions of this guidance are effective for annual periods beginning after December 31, 2018, and for interim periods therein. The Company expects to adopt ASU No. 2016-02 upon its effective date of January 1, 2019 using the modified retrospective method and the Company will also elect the package of practical expedients. The Company anticipates the impact of adoption will be an increase to long-term assets and total liabilities of $14,000 to $15,000 as of January 1, 2019.
Recently issued accounting guidance not discussed above is not applicable or did not have, or is not expected to have, a material impact to the Company.
3. | Fair Value Measurements: |
The Company applies a three-level valuation hierarchy for fair value measurements. This hierarchy prioritizes the inputs into three broad levels. Level 1 inputs are quoted prices (unadjusted) in active markets for identical assets or liabilities. Level 2 inputs are quoted prices for similar assets and liabilities in active markets or inputs that are observable for the asset or liability, either directly or indirectly through market corroboration, for substantially the full term of the asset or liability. Level 3 inputs are unobservable inputs based on management’s assumptions used to measure assets and liabilities at fair value. A financial asset’s or liability’s fair value measurement classification within the hierarchy is determined based on the lowest level input that is significant to the fair value measurement.
F-16
Table of Contents
RUDOLPH TECHNOLOGIES, INC.
NOTES TO THE CONSOLIDATED FINANCIAL STATEMENTS—(Continued)
(In thousands, except per share data)
The following tables provide the assets and liabilities carried at fair value measured on a recurring basis at December 31, 2018 and December 31, 2017:
| | Fair Value Measurements Using | |
| | Carrying Value | | | Quoted Prices in Active Markets for Identical Assets (Level 1) | | | Significant Other Observable Inputs (Level 2) | | | Significant Unobservable Inputs (Level 3) | |
December 31, 2018 | | | | | | | | | | | | | | | | |
Assets: | | | | | | | | | | | | | | | | |
Available-for-sale debt securities: | | | | | | | | | | | | | | | | |
Municipal notes and bonds | | $ | 62,684 | | | $ | — | | | $ | 62,684 | | | $ | — | |
Total assets | | $ | 62,684 | | | $ | — | | | $ | 62,684 | | | $ | — | |
Liabilities: | | | | | | | | | | | | | | | | |
Contingent consideration - acquisitions | | $ | 2,060 | | | $ | — | | | $ | — | | | $ | 2,060 | |
Foreign currency forward contracts | | | 32 | | | | — | | | | 32 | | | | — | |
Total liabilities | | $ | 2,092 | | | $ | — | | | $ | 32 | | | $ | 2,060 | |
December 31, 2017 | | | | | | | | | | | | | | | | |
Assets: | | | | | | | | | | | | | | | | |
Available-for-sale debt securities: | | | | | | | | | | | | | | | | |
Municipal notes and bonds | | $ | 109,589 | | | $ | — | | | $ | 109,589 | | | $ | — | |
Foreign currency forward contracts | | | 45 | | | | — | | | | 45 | | | | — | |
Total assets | | $ | 109,634 | | | $ | — | | | $ | 109,634 | | | $ | — | |
Liabilities: | | | | | | | | | | | | | | | | |
Contingent consideration - acquisitions | | $ | 2,593 | | | $ | — | | | $ | — | | | $ | 2,593 | |
Total liabilities | | $ | 2,593 | | | $ | — | | | $ | — | | | $ | 2,593 | |
The Company’s available-for-sale debt securities classified as Level 2 are valued using observable inputs to quoted market prices, benchmark yields, reported trades, broker/dealer quotes or alternative pricing sources with reasonable levels of price transparency. The foreign currency forward contracts are primarily measured based on the foreign currency spot and forward rates quoted by the banks or foreign currency dealers. Investment prices are obtained from third party pricing providers, which model prices utilizing the above observable inputs, for each asset class.
Level 3 liabilities consisted of contingent consideration related to an acquisition for which the Company uses a discounted cash flow model to value these liabilities. The Level 3 assumptions used in the discounted cash flow model for the contingent consideration included projected revenue, timing of cash flows and estimates of discount rates of 9.2% and 8.6% for the years ended December 31, 2018 and 2017, respectively. A significant decrease in the projected revenue or increase in discount rates could result in a significantly lower fair value measurement for the contingent consideration.
F-17
Table of Contents
RUDOLPH TECHNOLOGIES, INC.
NOTES TO THE CONSOLIDATED FINANCIAL STATEMENTS—(Continued)
(In thousands, except per share data)
This table presents a reconciliation of all liabilities measured at fair value on a recurring basis using significant unobservable inputs (Level 3) for the year ended December 31, 2018:
| | Fair Value Measurements Using Significant Unobservable Inputs (Level 3) | |
Balance at December 31, 2017 | | $ | 2,593 | |
Total loss due to remeasurement included in selling, general and administrative expense | | | 1,010 | |
Additions | | | — | |
Payments | | | (1,543 | ) |
Transfer into (out of) Level 3 | | | — | |
Balance at December 31, 2018 | | $ | 2,060 | |
See Note 4 for additional discussion regarding the fair value of the Company’s marketable securities.
Fair Value of Other Financial Instruments
The carrying value of cash and cash equivalents, accounts receivable, accounts payable and accrued liabilities approximates fair value because of the short-term maturity of these instruments. The estimated fair value of these obligations is based, primarily, on a market approach, comparing the Company’s interest rates to those rates the Company believes it would reasonably receive upon re-entry into the market. Judgment is required to estimate the fair value using available market information and appropriate valuation methods.
The carrying amount of the convertible notes receivable approximates fair value based on current interest rates for instruments with similar characteristics. Convertible notes receivable are initially recognized at fair value. The Company does not subsequently adjust the fair value of these convertible notes receivable unless it is determined that the convertible note receivable is impaired. The Company considers the issuer’s financial condition, payment history, and other relevant factors when assessing the collectability of the convertible note and to reserve the portion of such convertible note for which collection does not appear likely. Interest income is recognized as earned.
The Company has evaluated its investment policies and determined that all of its marketable securities, which are comprised of debt securities, are to be classified as available-for-sale. The Company’s available-for-sale debt securities are carried at fair value, with the unrealized gains and losses reported in Stockholders’ equity under the caption “Accumulated other comprehensive loss.” Realized gains and losses on available-for-sale securities are included in “Other expense (income)” on the Consolidated Statements of Operations. The Company records other-than-temporary impairment charges for its available-for-sale debt securities when it intends to sell the securities, it is more-likely-than not that it will be required to sell the securities before a recovery, or when it does not expect to recover the entire amortized cost basis of the securities. The cost of securities sold is based on the specific identification method.
The Company has determined that the gross unrealized losses on its marketable securities at December 31, 2018 and 2017 are temporary in nature. The Company reviews its investment portfolio to identify and evaluate marketable securities that have indications of possible impairment. Factors considered in determining whether a loss is other-than-temporary include the length of time and extent to which fair value has been less than the cost basis, credit quality and the Company’s ability and intent to hold the securities for a period of time sufficient to allow for any anticipated recovery in market value.
F-18
Table of Contents
RUDOLPH TECHNOLOGIES, INC.
NOTES TO THE CONSOLIDATED FINANCIAL STATEMENTS—(Continued)
(In thousands, except per share data)
At December 31, 2018 and 2017, marketable securities are categorized as follows:
| | Amortized Cost | | | Gross Unrealized Holding Gains | | | Gross Unrealized Holding Losses | | | Fair Value | |
December 31, 2018 | | | | | | | | | | | | | | | | |
Municipal notes and bonds | | $ | 62,681 | | | $ | 43 | | | $ | 40 | | | $ | 62,684 | |
Total marketable securities | | $ | 62,681 | | | $ | 43 | | | $ | 40 | | | $ | 62,684 | |
December 31, 2017 | | | | | | | | | | | | | | | | |
Municipal notes and bonds | | $ | 109,750 | | | $ | — | | | $ | 161 | | | $ | 109,589 | |
Total marketable securities | | $ | 109,750 | | | $ | — | | | $ | 161 | | | $ | 109,589 | |
The amortized cost and estimated fair value of marketable securities classified by the maturity date listed on the security, regardless of the Consolidated Balance Sheet classification, is as follows at December 31, 2018 and 2017:
| | December 31, 2018 | | | December 31, 2017 | |
| | Amortized Cost | | | Fair Value | | | Amortized Cost | | | Fair Value | |
Due within one year | | $ | 47,767 | | | $ | 47,732 | | | $ | 104,742 | | | $ | 104,605 | |
Due after one through five years | | | 14,914 | | | | 14,952 | | | | 5,008 | | | | 4,984 | |
Due after five through ten years | | | — | | | | — | | | | — | | | | — | |
Due after ten years | | | — | | | | — | | | | — | | | | — | |
Total marketable securities | | $ | 62,681 | | | $ | 62,684 | | | $ | 109,750 | | | $ | 109,589 | |
The following table summarizes the estimated fair value and gross unrealized holding losses of marketable securities, aggregated by investment instrument and period of time in an unrealized loss position, at December 31, 2018 and 2017.
| | In Unrealized Loss Position For Less Than 12 Months | | | In Unrealized Loss Position For Greater Than 12 Months | |
| | Fair Value | | | Gross Unrealized Losses | | | Fair Value | | | Gross Unrealized Losses | |
December 31, 2018 | | | | | | | | | | | | | | | | |
Municipal notes and bonds | | $ | 27,952 | | | $ | 30 | | | $ | 4,671 | | | $ | 10 | |
Total marketable securities | | $ | 27,952 | | | $ | 30 | | | $ | 4,671 | | | $ | 10 | |
December 31, 2017 | | | | | | | | | | | | | | | | |
Municipal notes and bonds | | $ | 98,805 | | | $ | 161 | | | $ | — | | | $ | — | |
Total marketable securities | | $ | 98,805 | | | $ | 161 | | | $ | — | | | $ | — | |
See Note 3 for additional discussion regarding the fair value of the Company’s marketable securities.
5. | Goodwill and Purchased Intangible Assets: |
Goodwill
The gross amount of goodwill at both December 31, 2018 and 2017 was $215,367. Reflecting an impairment charge of $192,872 in 2008, the carrying amount of goodwill totaled $22,495 and remained unchanged over both the years ended December 31, 2018 and 2017.
Purchased Intangible Assets
Purchased intangible assets as of December 31, 2018 and 2017 are as follows:
F-19
Table of Contents
RUDOLPH TECHNOLOGIES, INC.
NOTES TO THE CONSOLIDATED FINANCIAL STATEMENTS—(Continued)
(In thousands, except per share data)
| | Gross Carrying Amount | | | Accumulated Amortization | | | Net | |
December 31, 2018 | | | | | | | | | | | | |
Finite-lived intangibles: | | | | | | | | | | | | |
Developed technology | | $ | 66,177 | | | $ | 59,692 | | | $ | 6,485 | |
Customer and distributor relationships | | | 9,560 | | | | 9,082 | | | | 478 | |
Trade names | | | 4,361 | | | | 3,876 | | | | 485 | |
Total identifiable intangible assets | | $ | 80,098 | | | $ | 72,650 | | | $ | 7,448 | |
| | | | | | | | | | | | |
December 31, 2017 | | | | | | | | | | | | |
Finite-lived intangibles: | | | | | | | | | | | | |
Developed technology | | $ | 65,827 | | | $ | 58,522 | | | $ | 7,305 | |
Customer and distributor relationships | | | 9,560 | | | | 8,818 | | | | 742 | |
Trade names | | | 4,361 | | | | 3,776 | | | | 585 | |
Total identifiable intangible assets | | $ | 79,748 | | | $ | 71,116 | | | $ | 8,632 | |
Intangible asset amortization expense amounted to $1,534, $1,940 and $2,320 for the years ended December 31, 2018, 2017 and 2016, respectively. Assuming no change in the gross carrying value of identifiable intangible assets and estimated lives, estimated amortization expenses are $1,548 for 2019, $1,346 for 2020, $598 for 2021, $532 for 2022, and $515 for 2023.
6. | Convertible Note Receivable: |
The Company entered into a convertible loan agreement with Simax Precision Technologies Limited (“Simax”) on May 31, 2018. Simax may borrow from the Company up to $15,000 in multiple promissory notes. The Company expects to be a supplier of lithography modules to Simax which is focused on the manufacture, sale and service of lithography systems.
The convertible notes will bear a rate of interest of 4.25% per annum payable on a semi-annual basis. The convertible notes provide the Company with the option to convert the outstanding indebtedness into equity. If the Company does not elect to exercise its option to convert the notes, Simax will repay the principal amount outstanding and any outstanding interest in equal installments beginning on the fifth anniversary of the loan date and continuing on a quarterly basis over the next three years.
As of December 31, 2018, the Convertible notes receivable balance was $5,000 with accrued interest of $41.
Inventories
Inventories are comprised of the following:
| | December 31, | |
| | 2018 | | | 2017 | |
Materials | | $ | 61,025 | | | $ | 39,765 | |
Work-in-process | | | 21,910 | | | | 20,923 | |
Finished goods | | | 13,885 | | | | 6,833 | |
Total inventories | | $ | 96,820 | | | $ | 67,521 | |
The Company has established reserves of $11,678 and $13,035 at December 31, 2018 and 2017, respectively, for slow moving and obsolete inventory. During 2018, the Company recorded a net charge in cost of revenue of $3,042 for the write-down of inventory for excess parts, for older product lines and for parts that were rendered obsolete by design and engineering advancements. In 2018, the Company disposed of $4,398 of inventory. During 2017, the Company recorded a
F-20
Table of Contents
RUDOLPH TECHNOLOGIES, INC.
NOTES TO THE CONSOLIDATED FINANCIAL STATEMENTS—(Continued)
(In thousands, except per share data)
net charge in cost of revenue of $3,833 for the write-down of inventory for excess parts, for older product lines and for parts that were rendered obsolete by design and engineering advancements. In 2017, the Company disposed of $1,343 of inventory.
Property, Plant and Equipment
Property, plant and equipment, net, is comprised of the following:
| | December 31, | |
| | 2018 | | | 2017 | |
Land and building | | $ | 2,584 | | | $ | 2,584 | |
Machinery and equipment | | | 29,097 | | | | 29,870 | |
Furniture and fixtures | | | 3,226 | | | | 3,201 | |
Computer equipment and software | | | 7,906 | | | | 5,444 | |
Leasehold improvements | | | 9,448 | | | | 9,472 | |
| | | 52,261 | | | | 50,571 | |
Accumulated depreciation | | | (33,387 | ) | | | (33,229 | ) |
Total property, plant and equipment, net | | $ | 18,874 | | | $ | 17,342 | |
Depreciation expense amounted to $4,848, $3,990 and $3,677 for the years ended December 31, 2018, 2017 and 2016, respectively.
Other assets
Other assets is comprised of the following:
| | December 31, | |
| | 2018 | | | 2017 | |
Convertible note receivable | | $ | 5,000 | | | $ | — | |
Other | | | 506 | | | | 492 | |
Total other assets | | $ | 5,506 | | | $ | 492 | |
Other current liabilities
Other current liabilities is comprised of the following:
| | December 31, | |
| | 2018 | | | 2017 | |
Contingent consideration - acquisitions | | $ | 1,422 | | | $ | 634 | |
Customer deposits | | | 1,135 | | | | 5,561 | |
Accrued inventory | | | 1,103 | | | | 384 | |
Intangible asset acquisition - Stella Alliance | | | 150 | | | | 100 | |
Deferred rent | | | 75 | | | | 151 | |
Other | | | 3,658 | | | | 2,454 | |
Total other current liabilities | | $ | 7,543 | | | $ | 9,284 | |
F-21
Table of Contents
RUDOLPH TECHNOLOGIES, INC.
NOTES TO THE CONSOLIDATED FINANCIAL STATEMENTS—(Continued)
(In thousands, except per share data)
Other non-current liabilities
Other non-current liabilities is comprised of the following:
| | December 31, | |
| | 2018 | | | 2017 | |
Unrecognized tax benefits (including interest) | | $ | 5,409 | | | $ | 4,660 | |
Contingent consideration - acquisitions | | | 638 | | | | 1,959 | |
Deferred revenue | | | 1,314 | | | | 983 | |
Deferred rent | | | 1,405 | | | | 750 | |
Other | | | 2,395 | | | | 2,109 | |
Total non-current liabilities | | $ | 11,161 | | | $ | 10,461 | |
On July 25, 2011, the Company issued $60,000 aggregate principal amount of 3.75% Convertible Senior Notes due 2016 (the “Notes”) at par. The Notes were issued pursuant to an indenture, dated as of July 25, 2011, between the Company and Bank of New York Mellon Trust Company, N.A., as Trustee, which included a form of Note. The Notes provided for the payment of interest semi-annually in arrears on January 15 and July 15 of each year, beginning January 15, 2012, at an annual rate of 3.75%. Concurrently with the issuance of the Notes, the Company purchased a convertible note hedge and sold a warrant. Each of the convertible note hedge and warrant transactions were entered into with an affiliate of the initial purchaser of the Notes.
On July 15, 2016, the Company redeemed all of its outstanding 3.75% Convertible Senior Notes with an aggregate principle amount of $60,000. Under the terms of the indenture, holders of the Notes were paid cash up to the aggregate principal amount of the notes and were issued shares of common stock for the remainder of the conversion, with any fractional shares paid in cash. The conversion resulted in the issuance of 540 shares of common stock of the Company to the bondholders, but resulted in no dilution to Rudolph shareholders as these shares were covered by the convertible note hedge that was entered into by the Company in 2011 at the time of issuance of the Notes.
The sale of the warrant gave the holder the right to purchase 4,634 shares of the Company’s common stock at a strike price of $17.00 per share. The warrant has a series of daily expiration dates beginning in October 2016 and ending in January 2017. From October 13, 2016 to December 31, 2016, the holder exercised 4,248 warrants, which settled for 80 shares of the Company’s common stock and $10,525 payable in cash, of which $9,500 was paid as of December 31, 2016 and $1,025 was paid in January 2017, at a weighted average stock price of $19.82 per share. The remaining 386 warrants were exercised in January 2017 by the holder for 102 shares of the Company’s common stock at a weighted average stock price of $23.13 per share.
The following table presents the amount of interest cost recognized relating to the Notes during the years ended December 31, 2018, 2017 and 2016.
| | December 31, | |
| | 2018 | | | 2017 | | | 2016 | |
Contractual interest coupon | | $ | — | | | $ | — | | | $ | 1,186 | |
Amortization of interest discount | | | — | | | | — | | | | 1,893 | |
Amortization of debt issuance costs | | | — | | | | — | | | | 261 | |
Total interest cost recognized | | $ | — | | | $ | — | | | $ | 3,340 | |
9. | Commitments and Contingencies: |
Intellectual Property Indemnification Obligations
The Company has entered into agreements with customers that include limited intellectual property indemnification obligations that are customary in the industry. These guarantees generally require the Company to compensate the other party
F-22
Table of Contents
RUDOLPH TECHNOLOGIES, INC.
NOTES TO THE CONSOLIDATED FINANCIAL STATEMENTS—(Continued)
(In thousands, except per share data)
for certain damages and costs incurred as a result of third party intellectual property claims arising from these transactions. The nature of the intellectual property indemnification obligations prevents the Company from making a reasonable estimate of the maximum potential amount it could be required to pay to its customers. Historically, the Company has not made any indemnification payments under such agreements and no amount has been accrued in the accompanying consolidated financial statements with respect to these indemnification guarantees.
Warranty Reserves
The Company generally provides a warranty on its products for a period of 12 to 15 months against defects in material and workmanship. The Company estimates the costs that may be incurred during the warranty period and records a liability in the amount of such costs at the time revenue is recognized. The Company’s estimate is based primarily on historical experience. The Company periodically assesses the adequacy of its recorded warranty liabilities and adjusts the amounts as necessary. Settlements of warranty reserves are generally associated with sales that occurred during the 12 to 15 months prior to the year-end and warranty accruals are related to sales during the same year.
Changes in the Company’s warranty reserves are as follows:
| | Year Ended December 31, | |
| | 2018 | | | 2017 | | | 2016 | |
Balance, beginning of the period | | $ | 2,427 | | | $ | 1,788 | | | $ | 1,894 | |
Accruals | | | 3,486 | | | | 3,464 | | | | 2,405 | |
Usage | | | (3,472 | ) | | | (2,825 | ) | | | (2,511 | ) |
Balance, end of the period | | $ | 2,441 | | | $ | 2,427 | | | $ | 1,788 | |
Legal Matters
From time to time, the Company is subject to legal proceedings and claims in the ordinary course of business. As of December 31, 2018, there are no legal proceedings pending or threatened against the Company that management believes are likely to have a material adverse effect on the Company’s consolidated financial position or otherwise.
Lease Agreements
The Company rents space for its corporate headquarters, manufacturing and service operations and sales offices, which expire through 2029. Total rent expense for these facilities amounted to $3,311, $3,292 and $3,296 for the years ended December 31, 2018, 2017 and 2016, respectively.
The Company also leases certain equipment pursuant to operating leases, which expire through 2023. Rent expense related to these leases amounted to $98, $111 and $99 for the years ended December 31, 2018, 2017 and 2016, respectively.
Total future minimum lease payments under noncancelable operating leases as of December 31, 2018 amounted to $3,170 for 2019, $2,801 for 2020, $2,107 for 2021, $2,051 for 2022, $1,725 for 2023 and $7,484 for all periods thereafter.
Royalty Agreements
Under various licensing agreements, the Company is obligated to pay royalties based on net sales of products sold. There are no minimum annual royalty payments. Royalty expense amounted to $1,904, $1,117 and $586 for the years ended December 31, 2018, 2017 and 2016, respectively.
Open and Committed Purchase Orders
The Company has open and committed purchase orders of $71,752 as of December 31, 2018.
F-23
Table of Contents
RUDOLPH TECHNOLOGIES, INC.
NOTES TO THE CONSOLIDATED FINANCIAL STATEMENTS—(Continued)
(In thousands, except per share data)
Line of Credit
The Company has a credit agreement with a bank that provides for a line of credit which is secured by the marketable securities the Company has with the bank. The Company is permitted to borrow up to 70% of the value of eligible securities held at the time the line of credit is accessed. The available line of credit as of December 31, 2018 was approximately $93,920 with an available interest rate of 4.0%. The credit agreement is available to the Company until such time that either party terminates the arrangement at their discretion. The Company has not utilized the line of credit to date.
10. | Share-Based Compensation and Employee Benefit Plans: |
Share-Based Compensation Plans
The Company’s share-based compensation plans are intended to attract and retain employees and to provide an incentive for them to assist the Company to achieve long-range performance goals and to enable them to participate in long-term growth of the Company. The Company settles restricted stock unit awards and stock option exercises with newly issued common shares.
The Company established the 2018 Stock Plan (the “2018 Plan”) effective May 16, 2018. The 2018 Plan provides for the grant of 3,240 stock awards and stock options to employees, directors and consultants at an exercise price equal to or greater than the fair market value of the common stock on the date of grant. Shares of common stock available for future grants from a previous stock plan totaled 128 and were carried forward into the allocated balance of the 2018 Plan. Restricted stock units granted under the 2018 Plan typically vest over a three to five-year period for employees and one year for directors; however, other vesting periods are allowable under the 2018 Plan. Restricted stock units granted to employees have time based or performance based vesting. If options were to be granted under the 2018 Plan, they would typically grade vest over a five-year period and expire ten years from the date of grant. As of December 31, 2018, there were shares of common stock available for issuance pursuant to future grants under the 2018 Plan totaling 3,332.
The Company established the 2009 Stock Plan (the “2009 Plan”) effective November 1, 2009. The 2009 Plan provided for the grant of 3,300 stock options and other stock awards to employees, directors and consultants at an exercise price equal to or greater than the fair market value of the common stock on the date of grant. Shares of common stock available for future grants from a previous stock plan totaled 2,558 and were carried forward into the allocated balance of the 2009 Plan. Options granted under the 2009 Plan typically grade vested over a five-year period and expire ten years from the date of grant. Restricted stock units granted under the 2009 Plan typically vest over a three to five-year period for employees and one year for directors; however, other vesting periods are allowable under the 2009 Plan. Restricted stock units granted to employees have time based or performance based vesting. In the second quarter of 2018, the 2009 Plan was terminated and therefore as of December 31, 2018, there were no shares of common stock available for issuance pursuant to future grants under the 2009 Plan. As of December 31, 2017, there were 2,049 shares of common stock available for issuance pursuant to future grants under the 2009 Plan.
The following table reflects share-based compensation expense by type of award:
| | Year Ended December 31, | |
| | 2018 | | | 2017 | | | 2016 | |
Share-based compensation expense: | | | | | | | | | | | | |
Restricted stock units, including all performance and market based awards | | $ | 6,062 | | | $ | 5,433 | | | $ | 4,457 | |
Stock options | | | — | | | | 237 | | | | 318 | |
Total share-based compensation | | | 6,062 | | | | 5,670 | | | | 4,775 | |
Tax effect on share-based compensation | | | 1,362 | | | | 2,052 | | | | 1,743 | |
Net effect on net income | | $ | 4,700 | | | $ | 3,618 | | | $ | 3,032 | |
Effect on earnings per share: | | | | | | | | | | | | |
Basic | | $ | (0.15 | ) | | $ | (0.11 | ) | | $ | (0.10 | ) |
Diluted | | $ | (0.15 | ) | | $ | (0.11 | ) | | $ | (0.10 | ) |
F-24
Table of Contents
RUDOLPH TECHNOLOGIES, INC.
NOTES TO THE CONSOLIDATED FINANCIAL STATEMENTS—(Continued)
(In thousands, except per share data)
Restricted Stock Unit Activity
A summary of the Company’s restricted stock unit activity with respect to the years ended December 31, 2016, 2017 and 2018 follows:
| | Number of Shares | | | Weighted Average Grant Date Fair Value | |
Nonvested at December 31, 2015 | | | 1,169 | | | $ | 11.40 | |
Granted | | | 429 | | | $ | 13.20 | |
Vested | | | (413 | ) | | $ | 10.80 | |
Forfeited | | | (49 | ) | | $ | 11.14 | |
Nonvested at December 31, 2016 | | | 1,136 | | | $ | 12.30 | |
Granted | | | 280 | | | $ | 22.70 | |
Vested | | | (321 | ) | | $ | 11.90 | |
Forfeited | | | (81 | ) | | $ | 13.78 | |
Nonvested at December 31, 2017 | | | 1,014 | | | $ | 14.88 | |
Granted | | | 283 | | | $ | 27.99 | |
Vested | | | (404 | ) | | $ | 14.26 | |
Forfeited | | | (99 | ) | | $ | 17.79 | |
Nonvested at December 31, 2018 | | | 794 | | | $ | 19.51 | |
Included in the number of shares granted in the table directly above are market performance-based restricted stock units (“MPRSUs”) granted to executives in the first quarters of 2018 and 2017. The MPRSUs cliff vest at the end of the three years period and have a maximum potential to vest at 200% based on TSR performance. The related share-based compensation expense is determined based on the estimated fair value of the underlying shares on the date of grant and is recognized straight-line over the vesting term.
The following table provides details of the MPRSUs granted during the twelve month periods ended December 31, 2018 and 2017:
| | Year Ended December 31, | |
| | 2018 | | | 2017 | |
Granted | | 53 | | | 38 | |
Maximum vest potential shares | | 105 | | | 76 | |
Estimated fair value per share | | $ | 30.76 | | | $ | 25.30 | |
As of December 31, 2018, there was $9,517 of total unrecognized compensation cost related to restricted stock units granted under the plans. That cost is expected to be recognized over a weighted average period of 2.1 years.
F-25
Table of Contents
RUDOLPH TECHNOLOGIES, INC.
NOTES TO THE CONSOLIDATED FINANCIAL STATEMENTS—(Continued)
(In thousands, except per share data)
Stock Option Activity
A summary of the Company’s stock option activity with respect to the years ended December 31, 2016, 2017 and 2018 follows:
| | Shares | | | Weighted Average Exercise Price Per Share | | | Weighted Average Remaining Contractual Term (years) | | | Aggregate Intrinsic Value | |
Outstanding at December 31, 2015 | | | 490 | | | $ | 9.46 | | | | | | | | | |
Granted | | | — | | | | — | | | | | | | | | |
Exercised | | | (231 | ) | | | 7.76 | | | | | | | | | |
Expired | | | (44 | ) | | | 14.74 | | | | | | | | | |
Forfeited | | | — | | | | — | | | | | | | | | |
Outstanding at December 31, 2016 | | | 215 | | | | 10.19 | | | | | | | | | |
Granted | | | — | | | | — | | | | | | | | | |
Exercised | | | (142 | ) | | | 9.14 | | | | | | | | | |
Expired | | | — | | | | — | | | | | | | | | |
Forfeited | | | — | | | | — | | | | | | | | | |
Outstanding at December 31, 2017 | | | 73 | | | $ | 12.22 | | | | | | | | | |
Granted | | | — | | | | — | | | | | | | | | |
Exercised | | | (26 | ) | | | | | | | | | | | | |
Expired | | | — | | | | — | | | | | | | | | |
Forfeited | | | — | | | | — | | | | | | | | | |
Outstanding at December 31, 2018 | | | 47 | | | $ | 12.22 | | | | 4.0 | | | $ | 384 | |
Vested or expected to vest at December 31, 2018 | | | 47 | | | $ | 12.22 | | | | 4.0 | | | $ | 384 | |
Exercisable at December 31, 2018 | | | 47 | | | $ | 12.22 | | | | 4.0 | | | $ | 384 | |
The total intrinsic value of the stock options exercised during 2018, 2017 and 2016 was $384, $853 and $1,312, respectively. All options outstanding and exercisable at December 31, 2018 had an exercise price of $12.22. As of December 31, 2018, there was no unrecognized compensation cost related to stock options granted under the plans.
Non-Employee Stock Options
At December 31, 2018 and 2017, the fair value of outstanding stock options to non-employees was $126 and $268, respectively.
Employee Stock Purchase Plan
The Company established an Employee Stock Purchase Plan (the “ESPP”) effective November 1, 2018. The Company’s prior employee stock purchase plan, effective November 1, 2009 was terminated in the fourth quarter of 2018. Under the terms of the ESPP, eligible employees may have up to 15% of eligible compensation deducted from their pay and applied to the purchase of shares of Company common stock. The price the employee must pay for each share of stock will be 95% of the fair market value of Company common stock at the end of the applicable six-month purchase period. The ESPP is intended to qualify under Section 423 of the Internal Revenue Code and is a non-compensatory plan as defined by FASB ASC 718, “Stock Compensation.” No stock-based compensation expense attributable to employee stock purchase plan was recorded for the years ended December 31, 2018, 2017 and 2016. Through the Company’s employee stock purchase plans, employees purchased 13, 11 and 15 shares during the twelve months ended December 31, 2018, 2017 and 2016, respectively. As of December 31, 2018 and 2017, there were 1,500 and 2,251 shares available for issuance under the Company’s employee stock purchase plans, respectively.
F-26
Table of Contents
RUDOLPH TECHNOLOGIES, INC.
NOTES TO THE CONSOLIDATED FINANCIAL STATEMENTS—(Continued)
(In thousands, except per share data)
401(k) Savings Plan
The Company has a 401(k) savings plan that allows employees to contribute up to 100% of their annual compensation to the Plan on a pre-tax or after tax basis, limited to a maximum annual amount as set periodically by the Internal Revenue Service. The plan provides a 50% match of all employee contributions up to 6 percent of the employee’s salary. Company matching contributions to the plan totaled $1,118, $1,047 and $1,017 for the years ended December 31, 2018, 2017 and 2016, respectively.
Profit Sharing Program
The Company has a profit sharing program, wherein a percentage of pre-tax profits, at the discretion of the Board of Directors, is provided to all employees who have completed a stipulated employment period. The Company did not make contributions to this program for the years ended December 31, 2018, 2017 and 2016.
11. | Other Expense (Income), Net: |
Other expense (income), net is comprised of the following:
| Year Ended December 31, | |
| 2018 | | | 2017 | | | 2016 | |
Foreign currency exchange losses (gains), net | $ | 255 | | | $ | 457 | | | $ | 592 | |
Gain on casualty insurance claim | | (302 | ) | | | — | | | | — | |
Other | | (9 | ) | | | — | | | | (946 | ) |
Total other expense (income), net | $ | (56 | ) | | $ | 457 | | | $ | (354 | ) |
The components of income tax expense are as follows:
| | Year Ended December 31, | |
| | 2018 | | | 2017 | | | 2016 | |
Current: | | | | | | | | | | | | |
Federal | | $ | 4,423 | | | $ | 6,020 | | | $ | 6,084 | |
State | | | 1,038 | | | | 507 | | | | 983 | |
Foreign | | | 626 | | | | 3,159 | | | | 838 | |
| | | 6,087 | | | | 9,686 | | | | 7,905 | |
Deferred: | | | | | | | | | | | | |
Federal | | | 1,961 | | | | 17,034 | | | | 4,765 | |
State | | | (73 | ) | | | 643 | | | | 184 | |
Foreign | | | 275 | | | | (470 | ) | | | 62 | |
| | | 2,163 | | | | 17,207 | | | | 5,011 | |
Total income tax expense | | $ | 8,250 | | | $ | 26,893 | | | $ | 12,916 | |
The income before tax is comprised of the following:
| | Year Ended December 31, | |
| | 2018 | | | 2017 | | | 2016 | |
Domestic operations | | $ | 49,089 | | | $ | 57,079 | | | $ | 47,599 | |
Foreign operations | | $ | 4,257 | | | $ | 2,723 | | | $ | 2,269 | |
F-27
Table of Contents
RUDOLPH TECHNOLOGIES, INC.
NOTES TO THE CONSOLIDATED FINANCIAL STATEMENTS—(Continued)
(In thousands, except per share data)
The provision for income taxes differs from the amount of income tax determined by applying the applicable U.S. federal income tax rate of 21% for the year ended December 31, 2018, and 35% for years ended December 31, 2017 and 2016 to income before provision for income taxes as follows:
| | Year Ended December 31, | |
| | 2018 | | | 2017 | | | 2016 | |
Federal income tax provision at statutory rate | | $ | 11,203 | | | $ | 20,931 | | | $ | 17,454 | |
State taxes, net of federal effect | | | 747 | | | | 573 | | | | 822 | |
Foreign taxes, net of federal effect | | | 17 | | | | (238 | ) | | | (1,613 | ) |
Domestic manufacturing benefit | | | — | | | | (1,569 | ) | | | (1,244 | ) |
FDII Deduction, related to the Tax Act | | | (2,217 | ) | | | — | | | | — | |
GILTI income net of S250 deduction, related to the Tax Act | | | 113 | | | | — | | | | — | |
Section 162(m) | | | 526 | | | | — | | | | — | |
Research tax credit | | | (2,298 | ) | | | (1,559 | ) | | | (692 | ) |
Deferred tax true-up | | | 57 | | | | 41 | | | | (1,644 | ) |
Remeasurement of deferred tax balances, related to the Tax Act | | | (33 | ) | | | 8,020 | | | | — | |
Transition tax on foreign earnings, related to the Tax Act | | | 138 | | | | (106 | ) | | | — | |
Other | | | (3 | ) | | | 800 | | | | (167 | ) |
Provision for income taxes | | $ | 8,250 | | | $ | 26,893 | | | $ | 12,916 | |
Effective tax rate | | | 15 | % | | | 45 | % | | | 26 | % |
The U.S. government enacted the Tax Act on December 22, 2017. The Tax Act makes broad and complex changes to the U.S. tax code that affected 2017, including, but not limited to, (1) requiring a one-time transition tax on certain unrepatriated earnings of foreign subsidiaries that is payable over eight years and (2) bonus depreciation that will allow for full expensing of qualified property. The Tax Act also establishes new tax laws that affected 2018, including, but not limited to, (1) reduction of the U.S. federal corporate tax rate; (2) the creation of the Base Erosion and Anti-Abuse (“BEAT”), a new minimum tax; (3) a general elimination of U.S. federal income taxes on dividends from foreign subsidiaries; (4) a new provision designed to tax Global Intangible Low-Taxed Income (“GILTI”), which allows for the possibility of using foreign tax credits and a deduction of up to 50 percent to offset the income tax liability (subject to some limitations); (5) the repeal of the domestic production activity deduction; (6) limitations on the deductibility of certain executive compensation; (7) limitations on the use of foreign tax credits to reduce the U.S. income tax liability; and (8) a new provision designed to allow a benefit for the foreign-derived intangible income (“FDII”). In 2018 we evaluated the effects and have determined what accounting policies needed to change and we have calculated the impact of the above provisions.
At December 31, 2018, the Company has completed its accounting for the tax effects of enactment of the Tax Act and, therefore, recorded final adjustments as follows:
• | Reduction of U.S. federal corporate tax rate: The Tax Act reduces the corporate tax rate to 21 percent, effective January 1, 2018. For certain of its deferred tax assets and deferred tax liabilities, the Company has recorded a provisional decrease of $8.0 million, respectively, with a corresponding net adjustment to deferred income tax expense of $8.0 million for the year ended December 31, 2017. During the fourth quarter of 2018, the Company completed the accounting for such revaluation and determined that no adjustment was required. Despite the completion of the Company’s accounting for the Tax Act under SAB 118, many aspects of the law remain unclear and the Company expects ongoing guidance to be issued at both the federal and state levels. The Company will continue to monitor and assess the impact of any new developments. |
• | Transition tax: The transition tax is a tax on previously deferred earnings and profits (“E&P”) of certain of its foreign subsidiaries. To determine the amount of the transition tax, the Company must determine, in addition to other factors, the amount of post-1986 E&P of the relevant subsidiaries, as well as the amount of non-U.S. income taxes paid on such earnings. The Company was able to make a reasonable estimate of the transition tax in the prior year ended on December |
F-28
Table of Contents
RUDOLPH TECHNOLOGIES, INC.
NOTES TO THE CONSOLIDATED FINANCIAL STATEMENTS—(Continued)
(In thousands, except per share data)
| 31, 2017 and recorded a provisional transition tax obligation of $1.5 million with a corresponding adjustment to current income tax expense. The Company also computed a Section 78 foreign tax credit from the post-1986 E&P of the relevant subsidiaries that resulted in a current income tax benefit of $1.5 million. An additional $0.1 million was expensed in the third quarter of 2018 due to finalization of the prior year provisional Tax Act calculations. |
• | Valuation allowances: The Company, as of December 31, 2017, had to assess whether its valuation allowance analyses are affected by various aspects of the Tax Act. Since, as discussed herein, the Company has recorded provisional amounts related to certain portions of the Tax Act, any corresponding determination of the need for or change in a valuation allowance is also provisional. The Company concluded that with all the facts that are available at this point in time that that a full valuation allowance on all carry forward foreign tax credits were needed. The Company recorded the valuation allowance as of December 31, 2017 in the amount of $1.5 million with a corresponding adjustment to current income tax expense. Per the completion of the analysis in 2018, the Company concluded that a full valuation allowance of the foreign tax credits is still required against such deferred tax assets. As of December 31, 2018, the Company’s foreign tax credit carry forwards have a full valuation allowance recorded in the amount of $2.2 million. |
Deferred tax assets and liabilities are comprised of the following:
| | December 31, | |
| | 2018 | | | 2017 | |
Research and development credit carryforward | | $ | 198 | | | $ | 216 | |
Reserves and accruals not currently deductible | | | 1,969 | | | | 1,883 | |
Deferred revenue | | | 1,201 | | | | 1,075 | |
Domestic net operating loss carryforwards | | | 832 | | | | 892 | |
Foreign net operating loss and credit carryforwards | | | 3,146 | | | | 2,551 | |
Intangibles | | | 4,402 | | | | 5,388 | |
Share-based compensation | | | 1,259 | | | | 1,500 | |
Inventory obsolescence reserve | | | 2,774 | | | | 3,260 | |
Other | | | 810 | | | | 1,135 | |
Gross deferred tax assets | | | 16,591 | | | | 17,900 | |
Valuation allowance for deferred tax assets | | | (3,172 | ) | | | (2,447 | ) |
Deferred tax assets after valuation allowance | | | 13,419 | | | | 15,453 | |
Gross deferred tax liabilities | | | (609 | ) | | | (574 | ) |
Net deferred tax assets | | $ | 12,810 | | | $ | 14,879 | |
At December 31, 2018 and 2017, the Company had recorded valuation allowances of $3,172 and $2,447, respectively, on certain of the Company’s deferred tax assets to reflect the deferred tax assets at the net amount that is more likely than not to be realized. The Company recorded a full valuation allowance on all foreign tax credits as of December 31, 2018 in the amount of $2,155, as well as increases to China net operating loss valuation allowance in the amount of $112 based on current year utilization and offset by write-downs of expired net operating losses.
In assessing the realizability of deferred tax assets, the Company uses a more likely than not standard. If it is determined that it is more-likely-than-not that deferred tax assets will not be realized, a valuation allowance must be established against the deferred tax assets. The ultimate realization of the assets is dependent on the generation of future taxable income during the periods in which the associated temporary differences become deductible. Management considers the scheduled reversal of deferred income tax liabilities, projected future taxable income and tax planning strategies when making this assessment. In making the determination that it is more likely than not that the Company’s deferred tax assets will be realized as of December 31, 2018, the Company relied primarily on projected future taxable income.
At December 31, 2018, the Company had federal, state and foreign net operating loss carryforwards of $497, $205 and $990, respectively. The federal, state and foreign net operating loss carryforwards expire on various dates through December 31, 2032, December 31, 2032 and December 31, 2026, respectively. At December 31, 2018, the Company had
F-29
Table of Contents
RUDOLPH TECHNOLOGIES, INC.
NOTES TO THE CONSOLIDATED FINANCIAL STATEMENTS—(Continued)
(In thousands, except per share data)
federal and state research & development credits and foreign tax credit carryforwards of $0, $318 and $2,155, respectively. The state research & development credits are set to expire at various dates through December 21, 2024. The foreign tax credit is set to expire at various dates through December 31, 2028.
A provision has not been made at December 31, 2018 for U.S. nor foreign withholding taxes recorded on approximately $7,914 of undistributed earnings of the Company’s foreign subsidiaries in Europe and Japan nor on any additional outside basis differences inherent in these entities because it is the present intention of management to permanently reinvest these undistributed earnings. The estimated amount of additional tax would not be expected to have a significant impact on the Company’s results of operations.
The total amount of unrecognized tax benefits are as follows:
| | December 31, | |
| | 2018 | | | 2017 | | | 2016 | |
Balance, beginning of the period | | $ | 4,880 | | | $ | 4,827 | | | $ | 5,236 | |
Gross increases—tax positions in prior period | | | 496 | | | | 171 | | | | 118 | |
Gross decreases—tax positions in prior period | | | (61 | ) | | | (362 | ) | | | (735 | ) |
Gross increases—current-period tax positions | | | 213 | | | | 244 | | | | 208 | |
Lapse of statute of limitations | | | — | | | | — | | | | — | |
Balance, end of the period | | $ | 5,528 | | | $ | 4,880 | | | $ | 4,827 | |
Included in the Company’s unrecognized tax benefit ending balance at December 31, 2018 and 2017 are unrecognized tax benefits of $4,995 and $4,403, respectively, which would be reflected as an adjustment to income tax expense if recognized. The year over year increase from 2017 to 2018 is primarily due to additional unrecognized tax benefits related to federal tax exposures. It is reasonably possible that certain amounts of unrecognized tax benefits may reverse in the next 12 months; however, the Company does not expect such reversals to have a significant impact on its results of operations or financial position.
The Company recognizes accrued interest and penalties related to unrecognized tax benefits in income tax expense. During the years ended December 31, 2018, 2017 and 2016, the Company recognized approximately $199, $246 and $76, respectively, in interest and penalties expense associated with uncertain tax positions. As of December 31, 2018 and 2017, the Company had accrued interest and penalties expense related to unrecognized tax benefits of $1,445 and $1,190, respectively.
The Company is subject to U.S. federal income tax as well as income tax in multiple state and foreign jurisdictions. The Company files U.S. federal, U.S. state and foreign tax returns. For U.S. federal tax purposes, the Company is generally no longer subject to tax examinations for years 2014 and prior. For U.S. state tax returns, the Company is generally no longer subject to tax examinations for years 2013 and prior. For foreign tax purposes, the Company is generally no longer subject to examination for tax periods 2013 and prior. Certain carryforward tax attributes generated in prior years remain subject to examination and adjustment. The Company believes that adequate amounts have been reserved for any adjustments that may ultimately result from any future examinations of these years.
In the normal course of business, the Company is subject to tax audits in various jurisdictions, and such jurisdictions may assess additional income taxes or other taxes against it. Although the Company believes its tax estimates are reasonable, the final determination of tax audits and any related litigation could be materially different from the Company’ s historical income tax provisions and accruals. The results of an audit or litigation could have a material adverse effect on the Company’ s results of operations or cash flows in the period or periods for which that determination is made.
13. | Accumulated Other Comprehensive Loss: |
Comprehensive income includes net income, foreign currency translation adjustments, and net unrealized gains and losses on available-for-sale debt securities. See the Consolidated Statements of Comprehensive Income for the effect of the components of comprehensive income on the Company’s net income.
F-30
Table of Contents
RUDOLPH TECHNOLOGIES, INC.
NOTES TO THE CONSOLIDATED FINANCIAL STATEMENTS—(Continued)
(In thousands, except per share data)
The components of accumulated other comprehensive loss, net of tax, are as follows:
| | Foreign currency translation adjustments | | | Net unrealized (gains) losses on marketable securities | | | Accumulated other comprehensive loss (income) | |
Balance at December 31, 2016 | | $ | 2,742 | | | $ | 37 | | | $ | 2,779 | |
Net current period other comprehensive income | | | (1,663 | ) | | | 89 | | | | (1,574 | ) |
Reclassifications | | | — | | | | — | | | | — | |
Balance at December 31, 2017 | | | 1,079 | | | | 126 | | | | 1,205 | |
Net current period other comprehensive loss | | | 194 | | | | (136 | ) | | | 58 | |
Reclassifications | | | — | | | | — | | | | — | |
Balance at December 31, 2018 | | $ | 1,273 | | | $ | (10 | ) | | $ | 1,263 | |
14. | Segment Reporting and Geographic Information: |
The Company is engaged in the design, development, manufacture and support of high-performance control metrology, defect inspection, advanced packaging lithography and data analysis systems used by microelectronics device manufacturers. The Company and its subsidiaries currently operate in a single operating segment: the design, development, manufacture and support of high-performance process control defect inspection and metrology, advanced packaging lithography and process control software systems used by microelectronics device manufacturers. Therefore the Company has one reportable segment. The Company’s chief operating decision maker is the Chief Executive Officer (the “CEO”). The CEO allocates resources and assesses performance of the business and other activities at the reportable segment level.
The following table lists the different sources of revenue:
| | Year Ended December 31, | |
| | 2018 | | | 2017 | | | 2016 | |
Systems and Software: | | | | | | | | | | | | | | | | | | | | | | | | |
Process control | | $ | 190,098 | | | | 70 | % | | $ | 177,177 | | | | 70 | % | | $ | 146,652 | | | | 63 | % |
Lithography | | | 14,975 | | | | 5 | % | | | 14,234 | | | | 5 | % | | | 18,949 | | | | 8 | % |
Software licensing, support and maintenance | | | 29,168 | | | | 11 | % | | | 25,473 | | | | 10 | % | | | 29,795 | | | | 13 | % |
Parts | | | 28,658 | | | | 10 | % | | | 27,143 | | | | 11 | % | | | 25,343 | | | | 11 | % |
Services | | | 10,885 | | | | 4 | % | | | 11,071 | | | | 4 | % | | | 12,041 | | | | 5 | % |
Total revenue | | $ | 273,784 | | | | 100 | % | | $ | 255,098 | | | | 100 | % | | $ | 232,780 | | | | 100 | % |
F-31
Table of Contents
RUDOLPH TECHNOLOGIES, INC.
NOTES TO THE CONSOLIDATED FINANCIAL STATEMENTS—(Continued)
(In thousands, except per share data)
The Company’s significant operations outside the United States include sales, service and application offices in Europe and Asia. For geographical revenue reporting, revenue is attributed to the geographic location in which the product is shipped. Revenue by geographic region is as follows:
| | Year Ended December 31, | |
| | 2018 | | | 2017 | | | 2016 | |
Revenue from third parties: | | | | | | | | | | | | |
United States | | $ | 43,944 | | | $ | 36,104 | | | $ | 30,876 | |
Taiwan | | | 45,312 | | | | 63,079 | | | | 68,211 | |
South Korea | | | 51,750 | | | | 44,180 | | | | 15,556 | |
Singapore | | | 14,371 | | | | 12,775 | | | | 35,517 | |
Austria | | | 719 | | | | 2,601 | | | | 2,049 | |
Japan | | | 22,361 | | | | 18,943 | | | | 11,875 | |
Germany | | | 14,913 | | | | 15,580 | | | | 9,759 | |
China | | | 63,243 | | | | 35,925 | | | | 33,720 | |
Other Europe | | | 11,541 | | | | 21,167 | | | | 18,720 | |
Other Asia | | | 5,630 | | | | 4,744 | | | | 6,497 | |
Total revenue | | $ | 273,784 | | | $ | 255,098 | | | $ | 232,780 | |
In 2018, sales to SK Hynix Inc. accounted for 12.2% of the Company’s revenue. No individual end user customer accounted for more than 10% of the Company’s revenue in 2017 and 2016. The Company does not have purchase contracts with any of its customers that obligate them to continue to purchase its products.
At December 31, 2018 and 2017, no individual customer accounted for more than 10% of net accounts receivable.
Substantially all of the Company’s long-lived assets are located within the United States of America.
Basic earnings per share is calculated using the weighted average number of shares of common stock outstanding during the period. Diluted earnings per share is computed in the same manner and also gives effect to all dilutive common stock equivalent shares outstanding during the period. Potential common shares that would have the effect of increasing diluted earnings per share are considered to be anti-dilutive. In accordance with U.S. GAAP, these shares were not included in calculating diluted earnings per share.
For the year ended December 31, 2018, the weighted average number of restricted stock units and stock options excluded from the computation of diluted earnings per share were 52 and 0, respectively. For the year ended December 31, 2017, the weighted average number of restricted stock units and stock options excluded from the computation of diluted earnings per share were 8 and 0, respectively. For the year ended December 31, 2016, the weighted average number of restricted stock units and stock options excluded from the computation of diluted earnings per share were 0 and 39, respectively.
For the years ended December 31, 2017 and 2016, diluted earnings per share-weighted average shares outstanding included the effect resulting from assumed conversion of the Notes and warrants.
F-32
Table of Contents
RUDOLPH TECHNOLOGIES, INC.
NOTES TO THE CONSOLIDATED FINANCIAL STATEMENTS—(Continued)
(In thousands, except per share data)
The Company’s basic and diluted earnings per share amounts are as follows:
| | December 31, | |
| | 2018 | | | 2017 | | | 2016 | |
Numerator: | | | | | | | | | | | | |
Net income | | $ | 45,096 | | | $ | 32,909 | | | $ | 36,952 | |
Denominator: | | | | | | | | | | | | |
Basic earnings per share - weighted average shares outstanding | | | 31,671 | | | | 31,491 | | | | 31,128 | |
Effect of potential dilutive securities: | | | | | | | | | | | | |
Restricted stock units and stock options - dilutive shares | | | 529 | | | | 670 | | | | 467 | |
Convertible senior notes - dilutive shares | | | — | | | | — | | | | 103 | |
Warrants - dilutive shares | | | — | | | | 1 | | | | 92 | |
Diluted earnings per share - weighted average shares outstanding | | | 32,200 | | | | 32,162 | | | | 31,790 | |
Earnings per share: | | | | | | | | | | | | |
Basic | | $ | 1.42 | | | $ | 1.05 | | | $ | 1.19 | |
Diluted | | $ | 1.40 | | | $ | 1.02 | | | $ | 1.16 | |
16. | Shares Repurchase Authorization: |
In October 2018, the Board of Directors approved a new share repurchase authorization, which allows the Company to repurchase up to $ 40,000 worth of shares of its common stock. The authorization provides for repurchases to be made in the open market or through negotiated transactions from time to time. The share repurchase authorization has no expiration date and may be discontinued at any time. In addition, during the fourth quarter of 2018, the Company completed the purchase of the remaining shares available under the prior 3,000 share repurchase authorization. During the twelve months ended December 31, 2018, the Company repurchased 1,061 shares of common stock under its two share repurchase authorizations and those shares were subsequently retired. At December 31, 2018, there were $33,239 available for future share repurchases.
The following table summarizes the Company’s stock repurchases for December 31, 2018, 2017 and 2016:
| | Year Ended December 31, | |
| | 2018 | | | 2017 | | | 2016 | |
Shares of common stock repurchased | | | 1,061 | | | | — | | | | 615 | |
Cost of stock repurchased | | $ | 21,069 | | | $ | - | | | $ | 8,044 | |
Average price paid per share | | $ | 19.86 | | | $ | - | | | $ | 13.07 | |
17. | Quarterly Consolidated Financial Data (unaudited): |
The following tables present certain unaudited consolidated quarterly financial information for the years ended December 31, 2018 and 2017. In the opinion of the Company’s management, this quarterly information has been prepared on the same basis as the consolidated financial statements and includes all adjustments (consisting only of normal recurring adjustments) necessary to present fairly the information for the periods presented. The results of operations for any quarter are not necessarily indicative of results for the full year or for any future period.
F-33
Table of Contents
RUDOLPH TECHNOLOGIES, INC.
NOTES TO THE CONSOLIDATED FINANCIAL STATEMENTS—(Continued)
(In thousands, except per share data)
Year-over-year quarterly comparisons of the Company’s results of operations may not be meaningful, as the sequential quarterly comparisons set forth below tend to reflect the cyclical activity of the semiconductor industry as a whole. Other quarterly fluctuations in expenses are related directly to sales activity and volume and may also reflect the timing of operating expenses incurred throughout the year, and changes in tax rates.
| | Quarters Ended | | | | | |
| | March 31, 2018 | | | June 30, 2018 | | | September 30, 2018 | | | December 31, 2018 | | | Total | |
Revenue | | $ | 73,096 | | | $ | 77,476 | | | $ | 60,432 | | | $ | 62,780 | | | $ | 273,784 | |
Gross profit | | | 42,421 | | | | 41,736 | | | | 31,454 | | | | 32,668 | | | | 148,279 | |
Income before income taxes | | | 17,674 | | | | 17,290 | | | | 8,368 | | | | 10,014 | | | | 53,346 | |
Net income | | | 15,130 | | | | 14,697 | | | | 7,187 | | | | 8,082 | | | | 45,096 | |
Income per share: | | | | | | | | | | | | | | | | | | | | |
Basic | | $ | 0.48 | | | $ | 0.46 | | | $ | 0.23 | | | $ | 0.26 | | | $ | 1.42 | |
Diluted | | $ | 0.47 | | | $ | 0.45 | | | $ | 0.22 | | | $ | 0.26 | | | $ | 1.40 | |
Weighted average number of shares outstanding: | | | | | | | | | | | | | | | | | | | | |
Basic | | | 31,662 | | | | 31,859 | | | | 31,901 | | | | 31,268 | | | | 31,671 | |
Diluted | | | 32,317 | | | | 32,437 | | | | 32,408 | | | | 31,645 | | | | 32,200 | |
| | Quarters Ended | | | | | |
| | March 31, 2017 | | | June 30, 2017 | | | September 30, 2017 | | | December 31, 2017 | | | Total | |
Revenue | | $ | 60,679 | | | $ | 67,418 | | | $ | 66,920 | | | $ | 60,081 | | | $ | 255,098 | |
Gross profit | | | 31,868 | | | | 35,456 | | | | 35,145 | | | | 32,126 | | | | 134,595 | |
Income before income taxes | | | 9,607 | | | | 12,752 | | | | 25,663 | | | | 11,780 | | | | 59,802 | |
Net income (loss) | | | 7,151 | | | | 9,193 | | | | 17,369 | | | | (804 | ) | | | 32,909 | |
Income (loss) per share: | | | | | | | | | | | | | | | | | | | | |
Basic | | $ | 0.23 | | | $ | 0.29 | | | $ | 0.55 | | | $ | (0.03 | ) | | $ | 1.05 | |
Diluted | | $ | 0.22 | | | $ | 0.29 | | | $ | 0.54 | | | $ | (0.03 | ) | | $ | 1.02 | |
Weighted average number of shares outstanding: | | | | | | | | | | | | | | | | | | | | |
Basic | | | 31,290 | | | | 31,501 | | | | 31,571 | | | | 31,597 | | | | 31,491 | |
Diluted | | | 32,058 | | | | 32,146 | | | | 32,170 | | | | 31,597 | | | | 32,162 | |
F-34
Table of Contents
RUDOLPH TECHNOLOGIES, INC. AND SUBSIDIARIES
SCHEDULE OF VALUATION AND QUALIFYING ACCOUNTS
(In thousands)
Column A | | Column B | | | Column C | | | Column D | | | Column E | |
Description | | Balance at Beginning of Period | | | Charged to (Recovery of) Costs and Expense | | | Charged to Other Accounts (net) | | | Deductions | | | Balance at End of Period | |
Year 2018: | | | | | | | | | | | | | | | | | | | | |
Allowance for doubtful accounts | | $ | 460 | | | $ | 293 | | | $ | — | | | $ | 62 | | | $ | 691 | |
Deferred tax valuation allowance | | | 2,447 | | | | 725 | | | | — | | | | — | | | | 3,172 | |
Year 2017: | | | | | | | | | | | | | | | | | | | | |
Allowance for doubtful accounts | | $ | 680 | | | $ | (222 | ) | | $ | — | | | $ | (2 | ) | | $ | 460 | |
Deferred tax valuation allowance | | | 1,924 | | | | 626 | | | | (103 | ) | | | — | | | | 2,447 | |
Year 2016: | | | | | | | | | | | | | | | | | | | | |
Allowance for doubtful accounts | | $ | 713 | | | $ | 5 | | | $ | — | | | $ | 38 | | | $ | 680 | |
Deferred tax valuation allowance | | | 2,205 | | | | 71 | | | | (352 | ) | | | — | | | | 1,924 | |
F-35
Table of Contents
SIGNATURES
PURSUANT TO THE REQUIREMENTS OF SECTION 13 OR 15(d) OF THE SECURITIES EXCHANGE ACT OF 1934, THE REGISTRANT HAS DULY CAUSED THIS REPORT TO BE SIGNED ON ITS BEHALF BY THE UNDERSIGNED, THEREUNTO DULY AUTHORIZED.
| Rudolph Technologies, Inc. (Registrant) |
| |
| By: | /s/ Michael P. Plisinski |
| | Michael P. Plisinski Chief Executive Officer |
| Date: | February 15, 2019 |
PURSUANT TO THE REQUIREMENTS OF THE SECURITIES EXCHANGE ACT OF 1934, THIS REPORT HAS BEEN SIGNED BELOW BY THE FOLLOWING PERSONS ON BEHALF OF THE REGISTRANT AND IN THE CAPACITIES AND ON THE DATES INDICATED.
Signature | | Title | | Date |
| | | | |
/s/ Michael P. Plisinski | | Chief Executive Officer (Principal Executive Officer) | | February 15, 2019 |
Michael P. Plisinski | | | | |
| | | | |
/s/ Steven R. Roth | | Senior Vice President, Chief Financial Officer (Principal Financial Officer and Principal Accounting Officer) | | February 15, 2019 |
Steven R. Roth | | | |
| | | | |
/s/ Jeffrey A. Aukerman | | Director | | February 15, 2019 |
Jeffrey A. Aukerman | | | | |
| | | | |
/s/ Leo Berlinghieri | | Director | | February 15, 2019 |
Leo Berlinghieri | | | | |
| | | | |
/s/ Daniel H. Berry | | Director | | February 15, 2019 |
Daniel H. Berry | | | | |
| | | | |
/s/ Vita A Cassese | | Director | | February 15, 2019 |
Vita A. Cassese | | | | |
| | | | |
/s/ Thomas G. Greig | | Director | | February 15, 2019 |
Thomas G. Greig | | | | |
| | | | |
/s/ David B. Miller | | Director | | February 15, 2019 |
David B. Miller | | | | |
| | | | |
/s/ John R. Whitten | | Director | | February 15, 2019 |
John R. Whitten | | | | |