UNITED STATES
SECURITIES AND EXCHANGE COMMISSION
Washington, D.C. 20549
FORM N-CSR
CERTIFIED SHAREHOLDER REPORT OF REGISTERED
MANAGEMENT INVESTMENT COMPANIES
Investment Company Act file number 811-09685
Pioneer High Yield Fund
(Exact name of registrant as specified in charter)
60 State Street, Boston, MA 02109
(Address of principal executive offices) (ZIP code)
Christopher J. Kelley, Amundi Asset Management, Inc.,
60 State Street, Boston, MA 02109
(Name and address of agent for service)
Registrant’s telephone number, including area code: (617) 742-7825
Date of fiscal year end: October 31, 2024
Date of reporting period: November 1, 2023 through April 30, 2024
Form N-CSR is to be used by management investment companies to file reports with the Commission not later than 10 days after the transmission to stockholders of any report that is required to be transmitted to stockholders under Rule 30e-1 under the Investment Company Act of 1940 (17 CFR 270.30e-1). The Commission may use the information provided on Form N-CSR in its regulatory, disclosure review, inspection, and policymaking roles.
A registrant is required to disclose the information specified by Form N-CSR, and the Commission will make this information public. A registrant is not required to respond to the collection of information contained in Form N-CSR unless the Form displays a currently valid Office of Management and Budget (“OMB”) control number. Please direct comments concerning the accuracy of the information collection burden estimate and any suggestions for reducing the burden to Secretary, Securities and Exchange Commission, 450 Fifth Street, NW, Washington, DC 20549-0609. The OMB has reviewed this collection of information under the clearance requirements of 44 U.S.C. ss. 3507.
ITEM 1. REPORTS TO STOCKHOLDERS.
Pioneer High Yield Fund
Semiannual Report | April 30, 2024
| | | | |
| A: TAHYX | C: PYICX | R: TYHRX | Y: TYHYX |
IMPORTANT NOTICE – UPCOMING CHANGES TO PIONEER FUNDS ANNUAL & SEMI-ANNUAL REPORTS
The Securities and Exchange Commission (the “SEC”) has adopted rule and form amendments that will result in changes to the design and delivery of annual and semi-annual fund reports (“Reports”). Beginning in July 2024, Reports will be streamlined to highlight key information (“Redesigned Reports”). Certain information currently included in the Reports, including financial statements, will no longer appear in the Reports but will be available online, delivered free of charge to shareholders upon request, and filed with the SEC.
If you previously elected to receive the Fund's Reports electronically, you will continue to receive the Redesigned Reports electronically. Otherwise, you will receive paper copies of the Fund's Redesigned Reports via USPS mail starting in July 2024. If you would like to receive the Fund's Redesigned Reports (and/or other communications) electronically instead of by mail, please contact your financial advisor or, if you are a direct investor, please log into your mutual fund account at amundi.com/usinvestors and select “E-Delivery” under the Profile page. You must be registered for online account access before you can enroll in E-Delivery.
1Pioneer High Yield Fund | Semiannual Report | 4/30/24
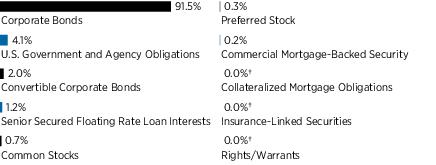
Portfolio Summary | 4/30/24
Portfolio Diversification
(As a percentage of total investments)*
10 Largest Holdings
| (As a percentage of total investments)* |
| 1. | U.S. Treasury Bills, 5/7/24 | 4.08% |
| 2. | Olympus Water US Holding Corp., 9.75%, 11/15/28 (144A) | 1.12 |
| 3. | Aethon United BR LP/Aethon United Finance Corp., 8.25%, 2/15/26 (144A) | 1.07 |
| 4. | Baytex Energy Corp., 7.375%, 3/15/32 (144A) | 1.02 |
| 5. | Owens & Minor, Inc., 6.625%, 4/1/30 (144A) | 1.02 |
| 6. | CCO Holdings LLC/CCO Holdings Capital Corp., 4.75%, 2/1/32 (144A) | 1.01 |
| 7. | Viking Cruises, Ltd., 5.875%, 9/15/27 (144A) | 0.97 |
| 8. | NCL Corp., Ltd., 7.75%, 2/15/29 (144A) | 0.94 |
| 9. | Harvest Midstream I LP, 7.50%, 9/1/28 (144A) | 0.88 |
| 10. | US Acute Care Solutions LLC, 6.375%, 3/1/26 (144A) | 0.87 |
* Excludes short-term investments and all derivative contracts except for options purchased. The Fund is actively managed, and current holdings may be different. The holdings listed should not be considered recommendations to buy or sell any securities.
† Amount rounds to less than 0.1%.
Pioneer High Yield Fund | Semiannual Report | 4/30/242
Prices and Distributions | 4/30/24
Net Asset Value per Share*
| Class | 4/30/24 | 10/31/23 |
| A | $8.51 | $8.01 |
| C | $8.71 | $8.20 |
| R | $9.64 | $9.08 |
| Y | $8.53 | $8.02 |
| | | |
Distributions per Share: 11/1/23 - 4/30/24*
| Class | Net
Investment
Income | Short-Term
Capital Gains | Long-Term
Capital Gains |
| A | $0.2380 | $— | $— |
| C | $0.2040 | $— | $— |
| R | $0.2459 | $— | $— |
| Y | $0.2487 | $— | $— |
* The Fund acquired the assets and liabilities of Pioneer Global High Yield Fund on December 8, 2023 (the “Reorganization”).
Index Definitions
The ICE Bank of America (BofA) U.S. High Yield Index is an unmanaged, commonly accepted measure of the performance of high-yield securities. The ICE Bank of America (BofA) All-Convertibles Speculative Quality Index is an unmanaged index of high-yield U.S. convertible securities. Indices are unmanaged and their returns assume reinvestment of dividends and do not reflect any fees or expenses. It is not possible to invest directly in an index.
The indices defined here pertain to the “Value of $10,000 Investment” and “Value of $5 Million Investment” charts on pages 4 - 7.
3Pioneer High Yield Fund | Semiannual Report | 4/30/24
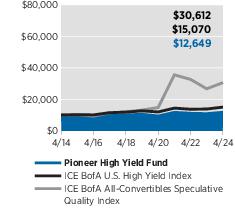
| Performance Update | 4/30/24 | Class A Shares |
Investment Returns
The mountain chart on the right shows the change in value of a $10,000 investment made in Class A shares of Pioneer High Yield Fund at public offering price during the periods shown, compared to that of the ICE Bank of America (BofA) U.S. High Yield Index and the ICE BofA All-Convertibles Speculative Quality Index.
Average Annual Total Returns
(As of April 30, 2024) |
| Period | Net
Asset
Value
(NAV) | Public
Offering
Price
(POP) | ICE
BofA
U.S.
High
Yield
Index | ICE
BofA All-
Convertibles
Speculative
Quality Index |
| 10 Years | 3.16% | 2.69% | 4.19% | 11.84% |
| 5 Years | 2.98 | 2.03 | 3.53 | 18.40 |
| 1 Year | 8.43 | 3.56 | 8.88 | 14.56 |
Expense Ratio
(Per prospectus dated March 1, 2024) |
| Gross | Net |
| 1.22% | 1.11% |
Value of $10,000 Investment
Call 1-800-225-6292 or visit www.amundi.com/us for the most recent month-end performance results. Current performance may be lower or higher than the performance data quoted.
The performance data quoted represents past performance, which is no guarantee of future results. Investment return and principal value will fluctuate, and shares, when redeemed, may be worth more or less than their original cost.
NAV results represent the percent change in net asset value per share. POP returns reflect deduction of maximum 4.50% sales charge. NAV returns would have been lower had sales charges been reflected. All results are historical and assume the reinvestment of dividends and capital gains. Other share classes are available for which performance and expenses will differ.
Performance results reflect any applicable expense waivers in effect during the periods shown. Without such waivers Fund performance would be lower. Waivers may not be in effect for all funds. Certain fee waivers are contractual through a specified period. Otherwise, fee waivers can be rescinded at any time. See the prospectus and financial statements for more information.
The net expense ratio reflects the contractual expense limitation currently in effect through March 1, 2025 for Class A shares. There can be no assurance that Amundi US will extend the expense limitation beyond such time. Please see the prospectus and financial statements for more information.
The performance table and graph do not reflect the deduction of fees and taxes that a shareholder would pay on Fund distributions or the redemption of Fund shares.
Please refer to the financial highlights for more current expense ratios.
Pioneer High Yield Fund | Semiannual Report | 4/30/244
| Performance Update | 4/30/24 | Class C Shares |
Investment Returns
The mountain chart on the right shows the change in value of a $10,000 investment made in Class C shares of Pioneer High Yield Fund during the periods shown, compared to that of the ICE Bank of America (BofA) U.S. High Yield Index and the ICE BofA All-Convertibles Speculative Quality Index.
Average Annual Total Returns
(As of April 30, 2024) |
| Period | If
Held | If
Redeemed | ICE
BofA
U.S.
High
Yield
Index | ICE
BofA All-
Convertibles
Speculative
Quality Index |
| 10 Years | 2.38% | 2.38% | 4.19% | 11.84% |
| 5 Years | 2.14 | 2.14 | 3.53 | 18.40 |
| 1 Year | 7.52 | 6.52 | 8.88 | 14.56 |
Expense Ratio
(Per prospectus dated March 1, 2024) |
| Gross |
| 2.01% |
Value of $10,000 Investment
Call 1-800-225-6292 or visit www.amundi.com/us for the most recent month-end performance results. Current performance may be lower or higher than the performance data quoted.
The performance data quoted represents past performance, which is no guarantee of future results. Investment return and principal value will fluctuate, and shares, when redeemed, may be worth more or less than their original cost.
Class C shares held for less than one year are also subject to a 1% contingent deferred sales charge (CDSC). “If Held” results represent the percent change in net asset value per share. “If Redeemed” returns reflect deduction of the CDSC for the one-year period, assuming a complete redemption of shares at the last price calculated on the last business day of the period, and no CDSC for the five- and 10-year periods. All results are historical and assume the reinvestment of dividends and capital gains. Other share classes are available for which performance and expenses will differ.
Performance results reflect any applicable expense waivers in effect during the periods shown. Without such waivers Fund performance would be lower. Waivers may not be in effect for all funds. Certain fee waivers are contractual through a specified period. Otherwise, fee waivers can be rescinded at any time. See the prospectus and financial statements for more information.
The performance table and graph do not reflect the deduction of fees and taxes that a shareholder would pay on Fund distributions or the redemption of Fund shares.
Please refer to the financial highlights for a more current expense ratio.
5Pioneer High Yield Fund | Semiannual Report | 4/30/24
| Performance Update | 4/30/24 | Class R Shares |
Investment Returns
The mountain chart on the right shows the change in value of a $10,000 investment made in Class R shares of Pioneer High Yield Fund during the periods shown, compared to that of the ICE Bank of America (BofA) U.S. High Yield Index and the ICE BofA All-Convertibles Speculative Quality Index.
Average Annual Total Returns
(As of April 30, 2024) |
| Period | Net
Asset
Value
(NAV) | ICE
BofA
U.S.
High
Yield
Index | ICE
BofA All-
Convertibles
Speculative
Quality Index |
| 10 Years | 2.72% | 4.19% | 11.84% |
| 5 Years | 2.47 | 3.53 | 18.40 |
| 1 Year | 7.78 | 8.88 | 14.56 |
Expense Ratio
(Per prospectus dated March 1, 2024) |
| Gross |
| 1.61% |
Value of $10,000 Investment
Call 1-800-225-6292 or visit www.amundi.com/us for the most recent month-end performance results. Current performance may be lower or higher than the performance data quoted.
The performance data quoted represents past performance, which is no guarantee of future results. Investment return and principal value will fluctuate, and shares, when redeemed, may be worth more or less than their original cost.
Class R shares are not subject to sales charges and are available for limited groups of eligible investors, including institutional investors. All results are historical and assume the reinvestment of dividends and capital gains. Other share classes are available for which performance and expenses will differ.
Performance results reflect any applicable expense waivers in effect during the periods shown. Without such waivers Fund performance would be lower. Waivers may not be in effect for all funds. Certain fee waivers are contractual through a specified period. Otherwise, fee waivers can be rescinded at any time. See the prospectus and financial statements for more information.
The performance table and graph do not reflect the deduction of fees and taxes that a shareholder would pay on Fund distributions or the redemption of Fund shares.
Please see the financial highlights for a more current expense ratio.
Pioneer High Yield Fund | Semiannual Report | 4/30/246
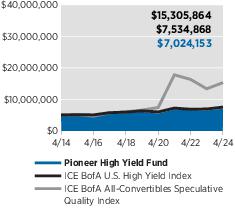
| Performance Update | 4/30/24 | Class Y Shares |
Investment Returns
The mountain chart on the right shows the change in value of a $5 million investment made in Class Y shares of Pioneer High Yield Fund during the periods shown, compared to that of the ICE Bank of America (BofA) U.S. High Yield Index and the ICE BofA All-Convertibles Speculative Quality Index.
Average Annual Total Returns
(As of April 30, 2024) |
| Period | Net
Asset
Value
(NAV) | ICE
BofA
U.S.
High
Yield
Index | ICE
BofA All-
Convertibles
Speculative
Quality Index |
| 10 Years | 3.46% | 4.19% | 11.84% |
| 5 Years | 3.27 | 3.53 | 18.40 |
| 1 Year | 8.82 | 8.88 | 14.56 |
Expense Ratio
(Per prospectus dated March 1, 2024) |
| Gross | Net |
| 0.94% | 0.86% |
Value of $5 Million Investment
Call 1-800-225-6292 or visit www.amundi.com/us for the most recent month-end performance results. Current performance may be lower or higher than the performance data quoted.
The performance data quoted represents past performance, which is no guarantee of future results. Investment return and principal value will fluctuate, and shares, when redeemed, may be worth more or less than their original cost.
Class Y shares are not subject to sales charges and are available for limited groups of eligible investors, including institutional investors. All results are historical and assume the reinvestment of dividends and capital gains. Other share classes are available for which performance and expenses will differ.
Performance results reflect any applicable expense waivers in effect during the periods shown. Without such waivers Fund performance would be lower. Waivers may not be in effect for all funds. Certain fee waivers are contractual through a specified period. Otherwise, fee waivers can be rescinded at any time. See the prospectus and financial statements for more information.
The net expense ratio reflects the contractual expense limitation in effect through March 1, 2025 for Class Y shares. There can be no assurance that Amundi US will extend the expense limitation beyond such time. Please see the prospectus and financial statements for more information.
The performance table and graph do not reflect the deduction of fees and taxes that a shareholder would pay on Fund distributions or the redemption of Fund shares.
Please refer to the financial highlights for more current expense ratios.
7Pioneer High Yield Fund | Semiannual Report | 4/30/24
Comparing Ongoing Fund Expenses
As a shareholder in the Fund, you incur two types of costs:
| (1) | ongoing costs, including management fees, distribution and/or service (12b-1) fees, and other Fund expenses; and |
| (2) | transaction costs, including sales charges (loads) on purchase payments. |
This example is intended to help you understand your ongoing expenses (in dollars) of investing in the Fund and to compare these costs with the ongoing costs of investing in other mutual funds. The example is based on an investment of $1,000 at the beginning of the Fund’s latest six-month period and held throughout the six months.
Using the Tables
Actual Expenses
The first table below provides information about actual account values and actual expenses. You may use the information in this table, together with the amount you invested, to estimate the expenses that you paid over the period as follows:
| (1) | Divide your account value by $1,000
Example: an $8,600 account value ÷ $1,000 = 8.6 |
| (2) | Multiply the result in (1) above by the corresponding share class’s number in the third row under the heading entitled “Expenses Paid During Period” to estimate the expenses you paid on your account during this period. |
Expenses Paid on a $1,000 Investment in Pioneer High Yield Fund
Based on actual returns from November 1, 2023 through April 30, 2024.
| Share Class | A | C | R | Y |
Beginning Account
Value on 11/1/23 | $1,000.00 | $1,000.00 | $1,000.00 | $1,000.00 |
Ending Account Value
(after expenses) on 4/30/24 | $1,092.50 | $1,087.40 | $1,089.10 | $1,095.00 |
Expenses Paid
During Period* | $5.72 | $10.22 | $8.21 | $4.43 |
| | |
| * | Expenses are equal to the Fund’s annualized expense ratio of 1.10%, 1.97%, 1.58%, and 0.85% for Class A, Class C, Class R, and Class Y shares, respectively, multiplied by the average account value over the period, multiplied by 182/366 (to reflect the one-half year period). |
Pioneer High Yield Fund | Semiannual Report | 4/30/248
Comparing Ongoing Fund Expenses (continued)
Hypothetical Example for Comparison Purposes
The table below provides information about hypothetical account values and hypothetical expenses based on the Fund’s actual expense ratio and an assumed rate of return of 5% per year before expenses, which is not the Fund’s actual return. The hypothetical account values and expenses may not be used to estimate the actual ending account balance or expenses you paid for the period.
You may use this information to compare the ongoing costs of investing in the Fund and other funds. To do so, compare this 5% hypothetical example with the 5% hypothetical examples that appear in the shareholder reports of the other funds.
Please note that the expenses shown in the tables are meant to highlight your ongoing costs only and do not reflect any transaction costs, such as sales charges (loads) that are charged at the time of the transaction. Therefore, the table below is useful in comparing ongoing costs only and will not help you determine the relative total costs of owning different funds. In addition, if these transaction costs were included, your costs would have been higher.
Expenses Paid on a $1,000 Investment in Pioneer High Yield Fund
Based on a hypothetical 5% return per year before expenses, reflecting the period from November 1, 2023 through April 30, 2024.
| Share Class | A | C | R | Y |
Beginning Account
Value on 11/1/23 | $1,000.00 | $1,000.00 | $1,000.00 | $1,000.00 |
Ending Account Value
(after expenses) on 4/30/24 | $1,019.39 | $1,015.07 | $1,017.01 | $1,020.64 |
Expenses Paid
During Period* | $5.52 | $9.87 | $7.92 | $4.27 |
| | |
| * | Expenses are equal to the Fund’s annualized expense ratio of 1.10%, 1.97%, 1.58%, and 0.85% for Class A, Class C, Class R, and Class Y shares, respectively, multiplied by the average account value over the period, multiplied by 182/366 (to reflect the one-half year period). |
9Pioneer High Yield Fund | Semiannual Report | 4/30/24
Schedule of Investments | 4/30/24
(Consolidated) (unaudited)
Principal
Amount
USD ($) | | | | | | Value |
| | UNAFFILIATED ISSUERS — 99.0% | |
| | Senior Secured Floating Rate
Loan Interests — 1.2% of Net Assets*(a) | |
| | Auto Parts & Equipment — 0.4% | |
| 2,260,477 | First Brands Group LLC, First Lien 2021 Term Loan, 10.591% (Term SOFR + 500 bps), 3/30/27 | $ 2,169,493 |
| | Total Auto Parts & Equipment | $2,169,493 |
|
|
| | Building & Construction Products — 0.1% | |
| 540,000(b) | MI Windows and Doors LLC, 2024 Incremental Term Loan, 3/28/31 | $ 543,105 |
| | Total Building & Construction Products | $543,105 |
|
|
| | Containers-Paper & Plastic — 0.2% | |
| 1,425,000(b) | LC Ahab US Bidco LLC, Term Loan B, 4/11/31 | $ 1,430,344 |
| | Total Containers-Paper & Plastic | $1,430,344 |
|
|
| | Electric-Generation — 0.2% | |
| 992,644 | Generation Bridge Northeast LLC, Term Loan B, 8.816% (Term SOFR + 350 bps), 8/22/29 | $ 998,848 |
| | Total Electric-Generation | $998,848 |
|
|
| | Medical-Drugs — 0.1% | |
| 655,000(b) | Endo Luxembourg Finance Company I S.a r.l., Term Loan B, 4/9/31 | $ 654,079 |
| | Total Medical-Drugs | $654,079 |
|
|
| | Metal Processors & Fabrication — 0.1% | |
| 379,492 | Grinding Media, Inc. (Molycop, Ltd.), First Lien Initial Term Loan, 9.555% (Term SOFR + 400 bps), 10/12/28 | $ 379,017 |
| | Total Metal Processors & Fabrication | $379,017 |
|
|
| | Physical Practice Management — 0.1% | |
| 777,606 | Team Health Holdings, Inc., Extended Term Loan, 10.566% (Term SOFR + 525 bps), 3/2/27 | $ 684,877 |
| | Total Physical Practice Management | $684,877 |
|
|
| | Total Senior Secured Floating Rate Loan Interests
(Cost $6,905,851) | $6,859,763 |
|
|
The accompanying notes are an integral part of these financial statements.
Pioneer High Yield Fund | Semiannual Report | 4/30/2410
Schedule of Investments | 4/30/24
(Consolidated) (unaudited) (continued)
| Shares | | | | | | Value |
| | Common Stocks — 0.7% of Net Assets | |
| | Automobile Components — 0.2% | |
| 127,021 | Ascent CNR Corp., Class A | $ 1,270,210 |
| | Total Automobile Components | $1,270,210 |
|
|
| | Chemicals — 0.0%† | |
| 148 | LyondellBasell Industries NV, Class A | $ 14,796 |
| | Total Chemicals | $14,796 |
|
|
| | Diversified Telecommunication Services —
0.0%† | |
| 190,086,798 | Atento S.A. | $ 5,807 |
| | Total Diversified Telecommunication Services | $5,807 |
|
|
| | Household Durables — 0.0%† | |
| 1,443,476(c) | Desarrolladora Homex SAB de CV | $ 1,011 |
| | Total Household Durables | $1,011 |
|
|
| | Oil, Gas & Consumable Fuels — 0.0%† | |
| 48(c) | Amplify Energy Corp. | $ 339 |
| | Total Oil, Gas & Consumable Fuels | $339 |
|
|
| | Paper & Forest Products — 0.0%† | |
| 459,481 + | Emerald Plantation Holdings, Ltd. | $ — |
| | Total Paper & Forest Products | $— |
|
|
| | Passenger Airlines — 0.4% | |
| 126,641 | Grupo Aeromexico SAB de CV | $ 2,180,821 |
| | Total Passenger Airlines | $2,180,821 |
|
|
| | Pharmaceuticals — 0.1% | |
| 13,123(c) | Endo, Inc. | $ 374,007 |
| | Total Pharmaceuticals | $374,007 |
|
|
| | Total Common Stocks
(Cost $3,093,370) | $3,846,991 |
|
|
The accompanying notes are an integral part of these financial statements.
11Pioneer High Yield Fund | Semiannual Report | 4/30/24
Principal
Amount
USD ($) | | | | | | Value |
| | Collateralized Mortgage
Obligations—0.0%† of Net Assets | |
| 154,691 | DSLA Mortgage Loan Trust, Series 2005-AR6, Class 2A1C, 6.273% (1 Month Term SOFR + 95 bps), 10/19/45 | $ 139,779 |
| 155,159 | Global Mortgage Securitization, Ltd., Series 2004-A, Class B1, 5.25%, 11/25/32 (144A) | 68,278 |
| | Total Collateralized Mortgage Obligations
(Cost $152,841) | $208,057 |
|
|
| | Commercial Mortgage-Backed
Security—0.2% of Net Assets | |
| 1,219,149 | Med Trust, Series 2021-MDLN, Class G, 10.685% (1 Month Term SOFR + 536 bps), 11/15/38 (144A) | $ 1,216,101 |
| | Total Commercial Mortgage-Backed Security
(Cost $1,219,149) | $1,216,101 |
|
|
| | Convertible Corporate Bonds —
2.1% of Net Assets | |
| | Banks — 0.0%† | |
| IDR 11,178,198,000 | PT Bakrie & Brothers Tbk, 12/31/24 | $ 68,747 |
| | Total Banks | $68,747 |
|
|
| | Biotechnology — 0.1% | |
| 730,000 | Insmed, Inc., 0.75%, 6/1/28 | $ 744,177 |
| | Total Biotechnology | $744,177 |
|
|
| | Energy-Alternate Sources — 0.3% | |
| 2,054,000(d) | Enphase Energy, Inc., 3/1/28 | $ 1,701,664 |
| | Total Energy-Alternate Sources | $1,701,664 |
|
|
| | Entertainment — 0.9% | |
| 3,261,000(d) | DraftKings Holdings, Inc., 3/15/28 | $ 2,698,478 |
| 2,781,000 | IMAX Corp., 0.50%, 4/1/26 | 2,581,046 |
| | Total Entertainment | $5,279,524 |
|
|
| | Pharmaceuticals — 0.2% | |
| 1,453,000 | Revance Therapeutics, Inc., 1.75%, 2/15/27 | $ 969,151 |
| | Total Pharmaceuticals | $969,151 |
|
|
The accompanying notes are an integral part of these financial statements.
Pioneer High Yield Fund | Semiannual Report | 4/30/2412
Schedule of Investments | 4/30/24
(Consolidated) (unaudited) (continued)
Principal
Amount
USD ($) | | | | | | Value |
| | Semiconductors — 0.2% | |
| 950,000 | ON Semiconductor Corp., 0.50%, 3/1/29 | $ 916,750 |
| | Total Semiconductors | $916,750 |
|
|
| | Software — 0.4% | |
| 1,372,000 | Bentley Systems, Inc., 0.375%, 7/1/27 | $ 1,251,950 |
| 1,431,000 | Verint Systems, Inc., 0.25%, 4/15/26 | 1,304,356 |
| | Total Software | $2,556,306 |
|
|
| | Total Convertible Corporate Bonds
(Cost $14,138,039) | $12,236,319 |
|
|
| | Corporate Bonds — 88.6% of Net
Assets | |
| | Advertising — 1.7% | |
| 3,994,000 | Clear Channel Outdoor Holdings, Inc., 7.50%, 6/1/29 (144A) | $ 3,218,468 |
| 1,080,000 | Outfront Media Capital LLC/Outfront Media Capital Corp., 4.25%, 1/15/29 (144A) | 961,252 |
| 3,591,000 | Stagwell Global LLC, 5.625%, 8/15/29 (144A) | 3,215,154 |
| 2,512,000 | Summer BC Bidco B LLC, 5.50%, 10/31/26 (144A) | 2,399,082 |
| | Total Advertising | $9,793,956 |
|
|
| | Aerospace & Defense — 0.2% | |
| 1,100,000 | Spirit AeroSystems, Inc., 9.375%, 11/30/29 (144A) | $ 1,189,674 |
| | Total Aerospace & Defense | $1,189,674 |
|
|
| | Airlines — 2.0% | |
| 1,571,227(e) | ABRA Global Finance, 11.50% (5.50% PIK or 6.00% Cash), 3/2/28 (144A) | $ 1,422,400 |
| 739,575 | American Airlines 2021-1 Class B Pass Through Trust, 3.95%, 7/11/30 | 668,210 |
| 636,666 | American Airlines, Inc./AAdvantage Loyalty IP, Ltd., 5.50%, 4/20/26 (144A) | 629,281 |
| 795,000 | American Airlines, Inc./AAdvantage Loyalty IP, Ltd., 5.75%, 4/20/29 (144A) | 767,757 |
| 1,583,354 | Gol Finance S.A., 15.813% (1 Month Term SOFR + 1,050 bps), 1/29/25 (144A) | 1,706,064 |
| 1,000,000 | Grupo Aeromexico SAB de CV, 8.50%, 3/17/27 (144A) | 980,489 |
The accompanying notes are an integral part of these financial statements.
13Pioneer High Yield Fund | Semiannual Report | 4/30/24
Principal
Amount
USD ($) | | | | | | Value |
| | Airlines — (continued) | |
| 5,177,000 | VistaJet Malta Finance Plc/Vista Management Holding, Inc., 6.375%, 2/1/30 (144A) | $ 4,006,135 |
| 1,620,000 | VistaJet Malta Finance Plc/Vista Management Holding, Inc., 7.875%, 5/1/27 (144A) | 1,440,662 |
| | Total Airlines | $11,620,998 |
|
|
| | Auto Manufacturers — 2.0% | |
| 1,340,000 | Ford Motor Co., 6.10%, 8/19/32 | $ 1,314,436 |
| 950,000 | Ford Motor Credit Co. LLC, 2.70%, 8/10/26 | 882,044 |
| 3,955,000 | Ford Motor Credit Co. LLC, 4.125%, 8/17/27 | 3,714,683 |
| 1,635,000 | Ford Motor Credit Co. LLC, 4.542%, 8/1/26 | 1,581,473 |
| 1,825,000 | Ford Motor Credit Co. LLC, 5.113%, 5/3/29 | 1,738,915 |
| 1,000,000 | Ford Motor Credit Co. LLC, 7.35%, 3/6/30 | 1,041,747 |
| 1,385,000 | JB Poindexter & Co., Inc., 8.75%, 12/15/31 (144A) | 1,415,150 |
| | Total Auto Manufacturers | $11,688,448 |
|
|
| | Auto Parts & Equipment — 0.4% | |
| 2,245,000 | Adient Global Holdings, Ltd., 8.25%, 4/15/31 (144A) | $ 2,331,309 |
| | Total Auto Parts & Equipment | $2,331,309 |
|
|
| | Banks — 1.4% | |
| 120,000 | Akbank TAS, 6.80%, 2/6/26 (144A) | $ 120,000 |
| 880,000(f) | Citizens Financial Group, Inc., 6.645% (SOFR + 233 bps), 4/25/35 | 882,460 |
| 250,000 | Freedom Mortgage Corp., 6.625%, 1/15/27 (144A) | 240,629 |
| 3,363,000 | Freedom Mortgage Corp., 12.25%, 10/1/30 (144A) | 3,649,565 |
| 3,325,000 | KeyBank N.A., 4.90%, 8/8/32 | 2,855,233 |
| 1,025,000(g)(h)# | Sovcombank Via SovCom Capital DAC, 7.60% (5 Year CMT Index + 636 bps) (144A) | 37,028 |
| 750,000(g)(h)# | Sovcombank Via SovCom Capital DAC, 7.75% (5 Year CMT Index + 638 bps) (144A) | 21,094 |
| | Total Banks | $7,806,009 |
|
|
| | Building Materials — 2.8% | |
| 4,331,000 | AmeriTex HoldCo Intermediate LLC, 10.25%, 10/15/28 (144A) | $ 4,562,193 |
| 2,461,000 | Builders FirstSource, Inc., 4.25%, 2/1/32 (144A) | 2,143,624 |
| 270,000 | Builders FirstSource, Inc., 5.00%, 3/1/30 (144A) | 252,811 |
The accompanying notes are an integral part of these financial statements.
Pioneer High Yield Fund | Semiannual Report | 4/30/2414
Schedule of Investments | 4/30/24
(Consolidated) (unaudited) (continued)
Principal
Amount
USD ($) | | | | | | Value |
| | Building Materials — (continued) | |
| 1,895,000 | Camelot Return Merger Sub, Inc., 8.75%, 8/1/28 (144A) | $ 1,862,981 |
| 3,035,000 | Cornerstone Building Brands, Inc., 6.125%, 1/15/29 (144A) | 2,560,875 |
| 2,115,000 | Knife River Corp., 7.75%, 5/1/31 (144A) | 2,196,753 |
| 1,215,000 | Miter Brands Acquisition Holdco, Inc./MIWD Borrower LLC, 6.75%, 4/1/32 (144A) | 1,206,649 |
| 1,406,000 | MIWD Holdco II LLC/MIWD Finance Corp., 5.50%, 2/1/30 (144A) | 1,273,353 |
| | Total Building Materials | $16,059,239 |
|
|
| | Chemicals — 4.5% | |
| 4,667,000 | Mativ Holdings, Inc., 6.875%, 10/1/26 (144A) | $ 4,600,673 |
| 1,840,000 | NOVA Chemicals Corp., 8.50%, 11/15/28 (144A) | 1,933,985 |
| 944,000 | Olin Corp., 5.00%, 2/1/30 | 881,045 |
| EUR 580,000 | Olympus Water US Holding Corp., 9.625%, 11/15/28 (144A) | 657,937 |
| 5,940,000 | Olympus Water US Holding Corp., 9.75%, 11/15/28 (144A) | 6,303,044 |
| 4,241,000 | Rain Carbon, Inc., 12.25%, 9/1/29 (144A) | 4,416,544 |
| EUR 445,000 | SCIL IV LLC/SCIL USA Holdings LLC, 4.375%, 11/1/26 (144A) | 465,596 |
| 1,960,000 | SCIL IV LLC/SCIL USA Holdings LLC, 5.375%, 11/1/26 (144A) | 1,881,154 |
| EUR 1,855,000 | SCIL IV LLC/SCIL USA Holdings LLC, 9.50%, 7/15/28 (144A) | 2,142,780 |
| 2,853,000 | Tronox, Inc., 4.625%, 3/15/29 (144A) | 2,545,127 |
| | Total Chemicals | $25,827,885 |
|
|
| | Commercial Services — 4.9% | |
| 590,000 | Allied Universal Holdco LLC/Allied Universal Finance Corp., 6.00%, 6/1/29 (144A) | $ 500,921 |
| 579,000 | Allied Universal Holdco LLC/Allied Universal Finance Corp., 6.625%, 7/15/26 (144A) | 577,469 |
| 960,000 | Allied Universal Holdco LLC/Allied Universal Finance Corp., 9.75%, 7/15/27 (144A) | 956,365 |
| 1,425,000 | Allied Universal Holdco LLC/Allied Universal Finance Corp./Atlas Luxco 4 S.a.r.l., 4.625%, 6/1/28 (144A) | 1,279,970 |
| 548,393(e) + | Atento Luxco 1 S.A., 20.00% (10.00% PIK or 10.00% Cash), 8/17/25 (144A) | 548,393 |
| 2,030,000 | Brink's Co., 5.50%, 7/15/25 (144A) | 2,013,143 |
The accompanying notes are an integral part of these financial statements.
15Pioneer High Yield Fund | Semiannual Report | 4/30/24
Principal
Amount
USD ($) | | | | | | Value |
| | Commercial Services — (continued) | |
| 1,205,000 | Champions Financing, Inc., 8.75%, 2/15/29 (144A) | $ 1,231,418 |
| 295,000 | Garda World Security Corp., 4.625%, 2/15/27 (144A) | 280,557 |
| 1,232,000 | Garda World Security Corp., 6.00%, 6/1/29 (144A) | 1,089,193 |
| 1,880,000 | Garda World Security Corp., 7.75%, 2/15/28 (144A) | 1,900,621 |
| 3,758,000 | Garda World Security Corp., 9.50%, 11/1/27 (144A) | 3,740,727 |
| 2,865,000 | Neptune Bidco US, Inc., 9.29%, 4/15/29 (144A) | 2,704,204 |
| 2,961,000 | NESCO Holdings II, Inc., 5.50%, 4/15/29 (144A) | 2,756,079 |
| 4,970,000 | Prime Security Services Borrower LLC/Prime Finance, Inc., 6.25%, 1/15/28 (144A) | 4,855,275 |
| 4,511,000 | Sotheby's, 7.375%, 10/15/27 (144A) | 4,203,905 |
| | Total Commercial Services | $28,638,240 |
|
|
| | Computers — 0.8% | |
| 1,435,000 | KBR, Inc., 4.75%, 9/30/28 (144A) | $ 1,338,884 |
| 1,275,000 | NCR Voyix Corp., 5.00%, 10/1/28 (144A) | 1,174,224 |
| 1,859,000 | NCR Voyix Corp., 5.125%, 4/15/29 (144A) | 1,708,257 |
| 635,000 | NCR Voyix Corp., 5.25%, 10/1/30 (144A) | 565,463 |
| | Total Computers | $4,786,828 |
|
|
| | Cosmetics/Personal Care — 0.3% | |
| 1,980,000 | Edgewell Personal Care Co., 5.50%, 6/1/28 (144A) | $ 1,910,622 |
| | Total Cosmetics/Personal Care | $1,910,622 |
|
|
| | Distribution/Wholesale — 0.1% | |
| 555,000 | Windsor Holdings III LLC, 8.50%, 6/15/30 (144A) | $ 578,046 |
| | Total Distribution/Wholesale | $578,046 |
|
|
| | Diversified Financial Services — 5.3% | |
| 700,000(h) | Credito Real SAB de CV SOFOM ER, 8.00%, 1/21/28 (144A) | $ 93,625 |
| 475,000 | Freedom Mortgage Holdings LLC, 9.25%, 2/1/29 (144A) | 477,514 |
| 495,000 | GGAM Finance, Ltd., 7.75%, 5/15/26 (144A) | 502,425 |
| 3,280,000 | GGAM Finance, Ltd., 8.00%, 6/15/28 (144A) | 3,376,760 |
| 4,276,992(e) | Global Aircraft Leasing Co., Ltd., 6.50% (7.25% PIK or 6.50% Cash), 9/15/24 (144A) | 4,045,915 |
The accompanying notes are an integral part of these financial statements.
Pioneer High Yield Fund | Semiannual Report | 4/30/2416
Schedule of Investments | 4/30/24
(Consolidated) (unaudited) (continued)
Principal
Amount
USD ($) | | | | | | Value |
| | Diversified Financial Services — (continued) | |
| 430,000 | Jefferies Finance LLC/JFIN Co.-Issuer Corp., 5.00%, 8/15/28 (144A) | $ 386,876 |
| 3,909,000 | Nationstar Mortgage Holdings, Inc., 5.125%, 12/15/30 (144A) | 3,511,630 |
| 1,150,000 | OneMain Finance Corp., 3.875%, 9/15/28 | 1,012,248 |
| 1,958,000 | OneMain Finance Corp., 5.375%, 11/15/29 | 1,810,691 |
| 810,000 | OneMain Finance Corp., 7.875%, 3/15/30 | 826,480 |
| 2,630,000 | OneMain Finance Corp., 9.00%, 1/15/29 | 2,757,213 |
| 485,000 | PennyMac Financial Services, Inc., 7.875%, 12/15/29 (144A) | 495,018 |
| 4,535,000 | Provident Funding Associates LP/PFG Finance Corp., 6.375%, 6/15/25 (144A) | 4,363,873 |
| EUR 360,000 | Sherwood Financing Plc, 4.50%, 11/15/26 | 334,862 |
| GBP 960,000 | Sherwood Financing Plc, 6.00%, 11/15/26 (144A) | 978,068 |
| 1,066,000(h) | Unifin Financiera SAB de CV, 8.375%, 1/27/28 (144A) | 66,625 |
| 2,227,000 | United Wholesale Mortgage LLC, 5.50%, 4/15/29 (144A) | 2,068,861 |
| 3,905,000 | United Wholesale Mortgage LLC, 5.75%, 6/15/27 (144A) | 3,747,338 |
| | Total Diversified Financial Services | $30,856,022 |
|
|
| | Electric — 3.4% | |
| 875,000 | Calpine Corp., 4.625%, 2/1/29 (144A) | $ 803,759 |
| 3,137,000 | Calpine Corp., 5.00%, 2/1/31 (144A) | 2,842,652 |
| 561,000 | Calpine Corp., 5.25%, 6/1/26 (144A) | 552,980 |
| 2,250,000 | Clearway Energy Operating LLC, 3.75%, 2/15/31 (144A) | 1,902,185 |
| 850,000 | Clearway Energy Operating LLC, 3.75%, 1/15/32 (144A) | 703,811 |
| 1,437,000 | Leeward Renewable Energy Operations LLC, 4.25%, 7/1/29 (144A) | 1,189,232 |
| 241,000 | NRG Energy, Inc., 3.875%, 2/15/32 (144A) | 203,044 |
| 17,300 | NSG Holdings LLC/NSG Holdings, Inc., 7.75%, 12/15/25 (144A) | 17,127 |
| 1,930,000 | Talen Energy Supply LLC, 8.625%, 6/1/30 (144A) | 2,042,006 |
| 1,425,000 | Vistra Operations Co. LLC, 4.375%, 5/1/29 (144A) | 1,297,357 |
| 2,852,000 | Vistra Operations Co. LLC, 5.625%, 2/15/27 (144A) | 2,774,852 |
The accompanying notes are an integral part of these financial statements.
17Pioneer High Yield Fund | Semiannual Report | 4/30/24
Principal
Amount
USD ($) | | | | | | Value |
| | Electric — (continued) | |
| 750,000 | Vistra Operations Co. LLC, 6.95%, 10/15/33 (144A) | $ 781,508 |
| 4,755,000 | Vistra Operations Co. LLC, 7.75%, 10/15/31 (144A) | 4,876,690 |
| | Total Electric | $19,987,203 |
|
|
| | Electrical Components & Equipments — 1.1% | |
| 1,572,000 | Energizer Holdings, Inc., 4.75%, 6/15/28 (144A) | $ 1,428,344 |
| 2,109,000 | Energizer Holdings, Inc., 6.50%, 12/31/27 (144A) | 2,083,368 |
| 2,770,000 | WESCO Distribution, Inc., 6.625%, 3/15/32 (144A) | 2,757,038 |
| | Total Electrical Components & Equipments | $6,268,750 |
|
|
| | Electronics — 0.5% | |
| 1,665,000 | Coherent Corp., 5.00%, 12/15/29 (144A) | $ 1,536,060 |
| 1,225,000 | EquipmentShare.com, Inc., 8.625%, 5/15/32 (144A) | 1,246,339 |
| | Total Electronics | $2,782,399 |
|
|
| | Engineering & Construction — 0.1% | |
| 280,000 | IHS Holding, Ltd., 5.625%, 11/29/26 (144A) | $ 256,900 |
| 275,000 | IHS Holding, Ltd., 6.25%, 11/29/28 (144A) | 237,187 |
| | Total Engineering & Construction | $494,087 |
|
|
| | Entertainment — 2.3% | |
| 1,430,000 | Allwyn Entertainment Financing UK Plc, 7.875%, 4/30/29 (144A) | $ 1,455,053 |
| 3,250,000 | Banijay Entertainment SASU, 8.125%, 5/1/29 (144A) | 3,325,358 |
| 1,265,000 | Caesars Entertainment, Inc., 6.50%, 2/15/32 (144A) | 1,246,333 |
| 1,576,000 | Light & Wonder International, Inc., 7.25%, 11/15/29 (144A) | 1,589,486 |
| 600,000 | Light & Wonder International, Inc., 7.50%, 9/1/31 (144A) | 611,912 |
| 2,880,000 | Melco Resorts Finance, Ltd., 7.625%, 4/17/32 (144A) | 2,817,216 |
| 2,629,000 | Scientific Games Holdings LP/Scientific Games US FinCo, Inc., 6.625%, 3/1/30 (144A) | 2,487,105 |
| | Total Entertainment | $13,532,463 |
|
|
The accompanying notes are an integral part of these financial statements.
Pioneer High Yield Fund | Semiannual Report | 4/30/2418
Schedule of Investments | 4/30/24
(Consolidated) (unaudited) (continued)
Principal
Amount
USD ($) | | | | | | Value |
| | Environmental Control — 0.8% | |
| 875,000 | GFL Environmental, Inc., 4.00%, 8/1/28 (144A) | $ 793,087 |
| 4,056,000 | GFL Environmental, Inc., 4.375%, 8/15/29 (144A) | 3,660,935 |
| | Total Environmental Control | $4,454,022 |
|
|
| | Food — 0.5% | |
| 530,000 | Fiesta Purchaser, Inc., 7.875%, 3/1/31 (144A) | $ 540,051 |
| 885,000 | US Foods, Inc., 4.625%, 6/1/30 (144A) | 804,754 |
| 1,835,000 | US Foods, Inc., 4.75%, 2/15/29 (144A) | 1,709,579 |
| | Total Food | $3,054,384 |
|
|
| | Forest Products & Paper — 0.4% | |
| 2,772,000 | Mercer International, Inc., 5.125%, 2/1/29 | $ 2,421,069 |
| | Total Forest Products & Paper | $2,421,069 |
|
|
| | Healthcare-Products — 0.4% | |
| 2,330,000 | Medline Borrower LP, 3.875%, 4/1/29 (144A) | $ 2,087,286 |
| | Total Healthcare-Products | $2,087,286 |
|
|
| | Healthcare-Services — 2.4% | |
| 3,915,000 | LifePoint Health, Inc., 5.375%, 1/15/29 (144A) | $ 3,130,179 |
| 1,960,000 | Prime Healthcare Services, Inc., 7.25%, 11/1/25 (144A) | 1,946,868 |
| 4,835,000 | US Acute Care Solutions LLC, 6.375%, 3/1/26 (144A) | 4,895,437 |
| 3,925,000 | US Acute Care Solutions LLC, 9.75%, 5/15/29 (144A) | 3,848,990 |
| | Total Healthcare-Services | $13,821,474 |
|
|
| | Home Builders — 0.5% | |
| 155,000 | Beazer Homes USA, Inc., 7.25%, 10/15/29 | $ 153,509 |
| 1,525,000 | KB Home, 4.00%, 6/15/31 | 1,324,422 |
| 1,865,000 | M/I Homes, Inc., 3.95%, 2/15/30 | 1,617,610 |
| | Total Home Builders | $3,095,541 |
|
|
| | Home Furnishings — 0.7% | |
| 4,814,000 | Tempur Sealy International, Inc., 4.00%, 4/15/29 (144A) | $ 4,279,707 |
| | Total Home Furnishings | $4,279,707 |
|
|
| | Household Products/Wares — 0.8% | |
| 4,767,000 | Spectrum Brands, Inc., 3.875%, 3/15/31 (144A) | $ 4,461,053 |
| | Total Household Products/Wares | $4,461,053 |
|
|
The accompanying notes are an integral part of these financial statements.
19Pioneer High Yield Fund | Semiannual Report | 4/30/24
Principal
Amount
USD ($) | | | | | | Value |
| | Iron & Steel — 1.4% | |
| 2,892,000 | Cleveland-Cliffs, Inc., 7.00%, 3/15/32 (144A) | $ 2,824,421 |
| 2,094,000 | Commercial Metals Co., 4.375%, 3/15/32 | 1,847,685 |
| 4,004,000 | TMS International Corp., 6.25%, 4/15/29 (144A) | 3,689,940 |
| | Total Iron & Steel | $8,362,046 |
|
|
| | Leisure Time — 3.5% | |
| 3,665,000 | Carnival Corp., 6.00%, 5/1/29 (144A) | $ 3,551,544 |
| 595,000 | Carnival Holdings Bermuda, Ltd., 10.375%, 5/1/28 (144A) | 645,139 |
| 2,910,000 | NCL Corp., Ltd., 5.875%, 3/15/26 (144A) | 2,851,278 |
| 5,166,000 | NCL Corp., Ltd., 7.75%, 2/15/29 (144A) | 5,276,955 |
| 965,000 | NCL Corp., Ltd., 8.125%, 1/15/29 (144A) | 1,004,989 |
| 805,000 | NCL Finance, Ltd., 6.125%, 3/15/28 (144A) | 785,502 |
| 855,000 | Royal Caribbean Cruises, Ltd., 5.50%, 4/1/28 (144A) | 832,228 |
| 5,645,000 | Viking Cruises, Ltd., 5.875%, 9/15/27 (144A) | 5,473,199 |
| | Total Leisure Time | $20,420,834 |
|
|
| | Lodging — 1.9% | |
| 1,598,981(i) | Grupo Posadas SAB de CV, 7.00%, 12/30/27 (144A) | $ 1,469,064 |
| 2,754,000 | Hilton Grand Vacations Borrower Escrow LLC/Hilton Grand Vacations Borrower Esc, 5.00%, 6/1/29 (144A) | 2,504,908 |
| 1,870,000 | Hilton Grand Vacations Borrower Escrow LLC/Hilton Grand Vacations Borrower Esc, 6.625%, 1/15/32 (144A) | 1,843,572 |
| 2,510,000 | MGM Resorts International, 6.50%, 4/15/32 | 2,435,249 |
| 2,556,000 | Travel + Leisure Co., 6.625%, 7/31/26 (144A) | 2,558,914 |
| | Total Lodging | $10,811,707 |
|
|
| | Machinery-Diversified — 0.1% | |
| 795,000 | Esab Corp., 6.25%, 4/15/29 (144A) | $ 792,017 |
| | Total Machinery-Diversified | $792,017 |
|
|
| | Media — 4.2% | |
| 3,103,000 | CCO Holdings LLC/CCO Holdings Capital Corp., 4.50%, 6/1/33 (144A) | $ 2,333,436 |
| 7,209,000 | CCO Holdings LLC/CCO Holdings Capital Corp., 4.75%, 2/1/32 (144A) | 5,669,408 |
| 2,290,000 | CCO Holdings LLC/CCO Holdings Capital Corp., 5.00%, 2/1/28 (144A) | 2,085,457 |
The accompanying notes are an integral part of these financial statements.
Pioneer High Yield Fund | Semiannual Report | 4/30/2420
Schedule of Investments | 4/30/24
(Consolidated) (unaudited) (continued)
Principal
Amount
USD ($) | | | | | | Value |
| | Media — (continued) | |
| 2,869,000 | CCO Holdings LLC/CCO Holdings Capital Corp., 5.125%, 5/1/27 (144A) | $ 2,688,748 |
| 810,000 | CCO Holdings LLC/CCO Holdings Capital Corp., 7.375%, 3/1/31 (144A) | 768,638 |
| 1,000,000 | CSC Holdings LLC, 4.625%, 12/1/30 (144A) | 434,033 |
| 600,000 | CSC Holdings LLC, 5.00%, 11/15/31 (144A) | 255,396 |
| 2,000,000 | CSC Holdings LLC, 5.375%, 2/1/28 (144A) | 1,534,422 |
| 3,688,000 | CSC Holdings LLC, 7.50%, 4/1/28 (144A) | 1,995,357 |
| 385,000 | CSC Holdings LLC, 11.75%, 1/31/29 (144A) | 342,044 |
| 4,506,000 | McGraw-Hill Education, Inc., 8.00%, 8/1/29 (144A) | 4,138,730 |
| 85,000 | Univision Communications, Inc., 7.375%, 6/30/30 (144A) | 81,394 |
| 1,695,000 | VZ Secured Financing BV, 5.00%, 1/15/32 (144A) | 1,427,763 |
| EUR 855,000 | Ziggo Bond Co. BV, 3.375%, 2/28/30 (144A) | 766,463 |
| | Total Media | $24,521,289 |
|
|
| | Metal Fabricate/Hardware — 0.2% | |
| 1,230,000 | Park-Ohio Industries, Inc., 6.625%, 4/15/27 | $ 1,168,598 |
| | Total Metal Fabricate/Hardware | $1,168,598 |
|
|
| | Mining — 3.8% | |
| 3,886,000 | Coeur Mining, Inc., 5.125%, 2/15/29 (144A) | $ 3,634,460 |
| 2,631,000 | Constellium SE, 3.75%, 4/15/29 (144A) | 2,332,557 |
| 3,975,000 | Eldorado Gold Corp., 6.25%, 9/1/29 (144A) | 3,743,400 |
| 4,175,000 | First Quantum Minerals, Ltd., 8.625%, 6/1/31 (144A) | 4,040,975 |
| 760,000 | First Quantum Minerals, Ltd., 9.375%, 3/1/29 (144A) | 785,213 |
| 3,314,000 | IAMGOLD Corp., 5.75%, 10/15/28 (144A) | 3,063,633 |
| 900,000 | Novelis Corp., 3.875%, 8/15/31 (144A) | 762,133 |
| 3,380,000 | Taseko Mines, Ltd., 8.25%, 5/1/30 (144A) | 3,434,005 |
| | Total Mining | $21,796,376 |
|
|
| | Oil & Gas — 9.2% | |
| 5,991,000 | Aethon United BR LP/Aethon United Finance Corp., 8.25%, 2/15/26 (144A) | $ 6,029,714 |
| 5,690,000 | Baytex Energy Corp., 7.375%, 3/15/32 (144A) | 5,738,373 |
| 920,000 | Baytex Energy Corp., 8.50%, 4/30/30 (144A) | 959,203 |
| 1,245,000 | Borr IHC, Ltd./Borr Finance LLC, 10.00%, 11/15/28 (144A) | 1,286,986 |
| 925,000 | Borr IHC, Ltd./Borr Finance LLC, 10.375%, 11/15/30 (144A) | 960,638 |
The accompanying notes are an integral part of these financial statements.
21Pioneer High Yield Fund | Semiannual Report | 4/30/24
Principal
Amount
USD ($) | | | | | | Value |
| | Oil & Gas — (continued) | |
| 1,645,000 | CITGO Petroleum Corp., 8.375%, 1/15/29 (144A) | $ 1,702,392 |
| 2,210,000 | Civitas Resources, Inc., 8.375%, 7/1/28 (144A) | 2,305,437 |
| 1,340,000 | Civitas Resources, Inc., 8.625%, 11/1/30 (144A) | 1,425,936 |
| 2,210,000 | Civitas Resources, Inc., 8.75%, 7/1/31 (144A) | 2,344,240 |
| 3,310,000 | Harbour Energy Plc, 5.50%, 10/15/26 (144A) | 3,244,814 |
| 1,155,000 | Hilcorp Energy I LP/Hilcorp Finance Co., 6.00%, 4/15/30 (144A) | 1,105,899 |
| 1,155,000 | Hilcorp Energy I LP/Hilcorp Finance Co., 6.25%, 4/15/32 (144A) | 1,115,194 |
| 3,557,000 | Kosmos Energy, Ltd., 7.75%, 5/1/27 (144A) | 3,463,920 |
| 2,790,000 | Parkland Corp., 4.625%, 5/1/30 (144A) | 2,521,442 |
| 2,347,000 | Precision Drilling Corp., 6.875%, 1/15/29 (144A) | 2,322,649 |
| 2,185,000 | Seadrill Finance, Ltd., 8.375%, 8/1/30 (144A) | 2,276,270 |
| 3,895,000 | Shelf Drilling Holdings, Ltd., 9.625%, 4/15/29 (144A) | 3,686,147 |
| 1,885,000 | Sunoco LP/Sunoco Finance Corp., 4.50%, 4/30/30 | 1,696,222 |
| 1,539,000 | Transocean, Inc., 8.75%, 2/15/30 (144A) | 1,604,683 |
| 560,000 | Transocean Titan Financing, Ltd., 8.375%, 2/1/28 (144A) | 574,870 |
| 1,735,000 | Transocean, Inc., 6.80%, 3/15/38 | 1,404,380 |
| 1,110,000 | Transocean, Inc., 8.25%, 5/15/29 (144A) | 1,103,605 |
| 1,110,000 | Transocean, Inc., 8.50%, 5/15/31 (144A) | 1,104,982 |
| 3,464,000 | Tullow Oil Plc, 10.25%, 5/15/26 (144A) | 3,374,715 |
| | Total Oil & Gas | $53,352,711 |
|
|
| | Oil & Gas Services — 0.9% | |
| 2,795,000 | Enerflex, Ltd., 9.00%, 10/15/27 (144A) | $ 2,862,139 |
| 2,180,000 | USA Compression Partners LP/USA Compression Finance Corp., 7.125%, 3/15/29 (144A) | 2,166,057 |
| | Total Oil & Gas Services | $5,028,196 |
|
|
| | Packaging & Containers — 1.8% | |
| 2,619,000 | Clearwater Paper Corp., 4.75%, 8/15/28 (144A) | $ 2,370,766 |
| 3,835,000 | OI European Group BV, 4.75%, 2/15/30 (144A) | 3,502,514 |
| 1,460,000 | Owens-Brockway Glass Container, Inc., 7.25%, 5/15/31 (144A) | 1,462,234 |
The accompanying notes are an integral part of these financial statements.
Pioneer High Yield Fund | Semiannual Report | 4/30/2422
Schedule of Investments | 4/30/24
(Consolidated) (unaudited) (continued)
Principal
Amount
USD ($) | | | | | | Value |
| | Packaging & Containers — (continued) | |
| 1,810,000 | Sealed Air Corp., 5.00%, 4/15/29 (144A) | $ 1,702,871 |
| 1,430,000 | Sealed Air Corp., 7.25%, 2/15/31 (144A) | 1,455,780 |
| | Total Packaging & Containers | $10,494,165 |
|
|
| | Pharmaceuticals — 3.8% | |
| 5,570,000 | AdaptHealth LLC, 5.125%, 3/1/30 (144A) | $ 4,741,301 |
| 445,000 | Endo Finance Holdings, Inc., 8.50%, 4/15/31 (144A) | 452,150 |
| 2,659,000 | Organon & Co./Organon Foreign Debt Co.-Issuer BV, 5.125%, 4/30/31 (144A) | 2,299,242 |
| 5,897,000 | Owens & Minor, Inc., 6.625%, 4/1/30 (144A) | 5,721,801 |
| 4,246,000 | P&L Development LLC/PLD Finance Corp., 7.75%, 11/15/25 (144A) | 3,596,107 |
| 2,554,000 + | Par Pharmaceutical, Inc., 7.50%, 4/1/27 (144A) | — |
| EUR 2,815,000 | Teva Pharmaceutical Finance Netherlands II BV, 4.375%, 5/9/30 | 2,871,805 |
| 778,000 | Teva Pharmaceutical Finance Netherlands III BV, 4.75%, 5/9/27 | 744,043 |
| 778,000 | Teva Pharmaceutical Finance Netherlands III BV, 5.125%, 5/9/29 | 736,984 |
| 1,025,000 | Teva Pharmaceutical Finance Netherlands III BV, 7.875%, 9/15/29 | 1,076,124 |
| 5,290,000 + | Tricida, Inc., 5/15/27 | — |
| | Total Pharmaceuticals | $22,239,557 |
|
|
| | Pipelines — 5.2% | |
| 882,427 | Acu Petroleo Luxembourg S.a.r.l., 7.50%, 1/13/32 (144A) | $ 844,863 |
| 3,340,000 | CQP Holdco LP/BIP-V Chinook Holdco LLC, 5.50%, 6/15/31 (144A) | 3,069,249 |
| 2,885,000 | CQP Holdco LP/BIP-V Chinook Holdco LLC, 7.50%, 12/15/33 (144A) | 2,902,712 |
| 1,215,000 | Delek Logistics Partners LP/Delek Logistics Finance Corp., 7.125%, 6/1/28 (144A) | 1,186,702 |
| 2,860,000 | Energy Transfer LP, 7.375%, 2/1/31 (144A) | 2,949,266 |
| 4,410,000(f)(g) | Energy Transfer LP, 7.125% (5 Year CMT Index + 531 bps) | 4,234,105 |
| 68,000 | EnLink Midstream LLC, 5.375%, 6/1/29 | 65,561 |
| 1,815,000 | EnLink Midstream LLC, 6.50%, 9/1/30 (144A) | 1,837,784 |
| 547,000 | EnLink Midstream Partners LP, 4.15%, 6/1/25 | 533,854 |
| 685,000 | EnLink Midstream Partners LP, 5.05%, 4/1/45 | 550,903 |
| 665,000 | EnLink Midstream Partners LP, 5.45%, 6/1/47 | 563,750 |
| 1,313,000 | EnLink Midstream Partners LP, 5.60%, 4/1/44 | 1,137,030 |
The accompanying notes are an integral part of these financial statements.
23Pioneer High Yield Fund | Semiannual Report | 4/30/24
Principal
Amount
USD ($) | | | | | | Value |
| | Pipelines — (continued) | |
| 1,295,000 | Genesis Energy LP/Genesis Energy Finance Corp., 8.00%, 1/15/27 | $ 1,309,613 |
| 4,916,000 | Harvest Midstream I LP, 7.50%, 9/1/28 (144A) | 4,929,470 |
| 400,000 | Venture Global LNG, Inc., 8.125%, 6/1/28 (144A) | 408,987 |
| 2,470,000 | Venture Global LNG, Inc., 8.375%, 6/1/31 (144A) | 2,534,745 |
| 920,000 | Venture Global LNG, Inc., 9.50%, 2/1/29 (144A) | 988,873 |
| | Total Pipelines | $30,047,467 |
|
|
| | Real Estate — 0.3% | |
| 2,470,000 | Kennedy-Wilson, Inc., 4.75%, 2/1/30 | $ 1,956,234 |
| | Total Real Estate | $1,956,234 |
|
|
| | REITs — 3.1% | |
| 115,000 | GLP Capital LP/GLP Financing II, Inc., 6.75%, 12/1/33 | $ 117,823 |
| 4,478,000 | HAT Holdings I LLC/HAT Holdings II LLC , 3.375%, 6/15/26 (144A) | 4,161,935 |
| 4,475,000 | Iron Mountain, Inc., 7.00%, 2/15/29 (144A) | 4,500,472 |
| 4,525,000 | MPT Operating Partnership LP/MPT Finance Corp., 3.50%, 3/15/31 | 3,034,147 |
| 620,000 | Starwood Property Trust, Inc., 7.25%, 4/1/29 (144A) | 611,628 |
| 3,061,000 | Uniti Group LP/Uniti Fiber Holdings, Inc./CSL Capital LLC, 6.00%, 1/15/30 (144A) | 2,380,512 |
| 2,870,000 | Uniti Group LP/Uniti Group Finance, Inc./CSL Capital LLC, 6.50%, 2/15/29 (144A) | 2,307,270 |
| 900,000 | Uniti Group LP/Uniti Group Finance, Inc./CSL Capital LLC, 10.50%, 2/15/28 (144A) | 933,687 |
| | Total REITs | $18,047,474 |
|
|
| | Retail — 4.7% | |
| 1,708,000 | Abercrombie & Fitch Management Co., 8.75%, 7/15/25 (144A) | $ 1,720,842 |
| 4,370,000 | Asbury Automotive Group, Inc., 4.625%, 11/15/29 (144A) | 3,951,416 |
| 5,099,000 | Beacon Roofing Supply, Inc., 4.125%, 5/15/29 (144A) | 4,552,943 |
| 2,645,000 | Brinker International, Inc., 8.25%, 7/15/30 (144A) | 2,754,127 |
| 2,735,000 | Gap, Inc., 3.625%, 10/1/29 (144A) | 2,314,248 |
| 465,000 | Gap, Inc., 3.875%, 10/1/31 (144A) | 377,920 |
The accompanying notes are an integral part of these financial statements.
Pioneer High Yield Fund | Semiannual Report | 4/30/2424
Schedule of Investments | 4/30/24
(Consolidated) (unaudited) (continued)
Principal
Amount
USD ($) | | | | | | Value |
| | Retail — (continued) | |
| 3,044,000 | Ken Garff Automotive LLC, 4.875%, 9/15/28 (144A) | $ 2,812,215 |
| 3,775,000 | LCM Investments Holdings II LLC, 4.875%, 5/1/29 (144A) | 3,447,797 |
| 1,680,000 | LCM Investments Holdings II LLC, 8.25%, 8/1/31 (144A) | 1,745,167 |
| 2,951,000 | Macy's Retail Holdings LLC, 5.875%, 4/1/29 (144A) | 2,845,269 |
| 490,000 | Staples, Inc., 7.50%, 4/15/26 (144A) | 472,417 |
| | Total Retail | $26,994,361 |
|
|
| | Software — 0.5% | |
| 3,260,000 | AthenaHealth Group, Inc., 6.50%, 2/15/30 (144A) | $ 2,934,805 |
| | Total Software | $2,934,805 |
|
|
| | Telecommunications — 2.3% | |
| 5,572,000 | Altice France Holding S.A., 6.00%, 2/15/28 (144A) | $ 1,625,435 |
| 745,000 | Altice France S.A., 5.125%, 1/15/29 (144A) | 486,739 |
| 3,345,000 | Altice France S.A., 5.125%, 7/15/29 (144A) | 2,178,817 |
| 3,054,000 | CommScope, Inc., 4.75%, 9/1/29 (144A) | 2,130,165 |
| 2,240,000 | Level 3 Financing, Inc., 10.50%, 5/15/30 (144A) | 2,219,665 |
| 440,000 | Total Play Telecomunicaciones SA de CV, 6.375%, 9/20/28 (144A) | 234,881 |
| 885,000 | Total Play Telecomunicaciones SA de CV, 10.50%, 12/31/28 (144A) | 715,708 |
| 3,655,000 | Windstream Escrow LLC/Windstream Escrow Finance Corp., 7.75%, 8/15/28 (144A) | 3,521,729 |
| | Total Telecommunications | $13,113,139 |
|
|
| | Transportation — 1.4% | |
| 4,376,000 | Carriage Purchaser, Inc., 7.875%, 10/15/29 (144A) | $ 3,870,866 |
| 2,009,000 | Danaos Corp., 8.50%, 3/1/28 (144A) | 2,026,723 |
| 2,743,000 | Seaspan Corp., 5.50%, 8/1/29 (144A) | 2,359,061 |
| | Total Transportation | $8,256,650 |
|
|
| | Total Corporate Bonds
(Cost $541,063,465) | $514,164,340 |
|
|
The accompanying notes are an integral part of these financial statements.
25Pioneer High Yield Fund | Semiannual Report | 4/30/24
| Shares | | | | | | Value |
| | Preferred Stock — 0.3% of Net Assets | |
| | Capital Markets — 0.3% | |
| 1,617,862 | Atento preferred | $ 1,617,862 |
| | Total Capital Markets | $1,617,862 |
|
|
| | Total Preferred Stock
(Cost $1,617,862) | $1,617,862 |
|
|
| | Rights/Warrants — 0.0%† of Net
Assets | |
| | Health Care Providers & Services — 0.0%† | |
| 2,136(c)(j) | Option Care Health, Inc., 7/27/25 | $ 5,639 |
| 2,136(c)(k) | Option Care Health, Inc., 12/31/25 | 3,482 |
| | Total Health Care Providers & Services | $9,121 |
|
|
| | Trading Companies & Distributors — 0.0%† | |
| GBP 63,875(c)(l) | Avation Plc, 1/1/59 | $ 11,972 |
| | Total Trading Companies & Distributors | $11,972 |
|
|
| | Total Rights/Warrants
(Cost $—) | $21,093 |
|
|
Face
Amount
USD ($) | | | | | | |
| | Insurance-Linked Securities — 0.0%†
of Net Assets# | |
| | Collateralized Reinsurance — 0.0%† | |
| | Multiperil – Worldwide — 0.0%† | |
| 1,600,000(c)(m) + | Cypress Re 2017, 1/31/25 | $ 160 |
| 555,123(c)(m) + | Dartmouth Re 2018, 1/31/25 | 83,218 |
| | | | | | | $ 83,378 |
|
|
| | Windstorm – Florida — 0.0%† | |
| 650,000(c)(m) + | Formby Re 2018, 2/28/25 | $ — |
| 1,050,000(c)(m) + | Portrush Re 2017, 6/15/24 | 105 |
| | | | | | | $ 105 |
|
|
| | Total Collateralized Reinsurance | $83,483 |
|
|
| | Reinsurance Sidecars — 0.0%† | |
| | Multiperil – U.S. — 0.0%† | |
| 2,400,000(c)(n) + | Harambee Re 2018, 12/31/24 | $ — |
| 1,668,837(n) + | Harambee Re 2019, 12/31/24 | 3,171 |
| | | | | | | $ 3,171 |
|
|
| | Multiperil – Worldwide — 0.0%† | |
| 643,077(c)(n) + | Lorenz Re 2019, 6/30/24 | $ 6,495 |
The accompanying notes are an integral part of these financial statements.
Pioneer High Yield Fund | Semiannual Report | 4/30/2426
Schedule of Investments | 4/30/24
(Consolidated) (unaudited) (continued)
Face
Amount
USD ($) | | | | | | Value |
| | Multiperil – Worldwide — (continued) | |
| 550,000(c)(n) + | Viribus Re 2018, 12/31/24 | $ — |
| 233,537(c)(n) + | Viribus Re 2019, 12/31/24 | — |
| 419,863(c)(m) + | Woburn Re 2019, 12/31/24 | 57,794 |
| | | | | | | $ 64,289 |
|
|
| | Total Reinsurance Sidecars | $67,460 |
|
|
| | Total Insurance-Linked Securities
(Cost $1,217,884) | $150,943 |
|
|
Principal
Amount
USD ($) | | | | | | |
| | U.S. Government and Agency
Obligations — 4.0% of Net Assets | |
| 23,000,000(d) | U.S. Treasury Bills, 5/7/24 | $ 22,979,756 |
| | Total U.S. Government and Agency Obligations
(Cost $22,979,808) | $22,979,756 |
|
|
| Shares | | | | | | |
| | SHORT TERM INVESTMENTS — 1.9% of
Net Assets | |
| | Open-End Fund — 1.9% | |
| 10,842,769(o) | Dreyfus Government Cash Management,
Institutional Shares, 5.19% | $ 10,842,769 |
| | | | | | | $ 10,842,769 |
|
|
| | TOTAL SHORT TERM INVESTMENTS
(Cost $10,842,769) | $10,842,769 |
|
|
| | TOTAL INVESTMENTS IN UNAFFILIATED ISSUERS — 99.0%
(Cost $603,231,038) | $574,143,994 |
| | OTHER ASSETS AND LIABILITIES — 1.0% | $ 5,983,967 |
| | net assets — 100.0% | $ 580,127,961 |
| | | | | | | |
| bps | Basis Points. |
| CMT | Constant Maturity Treasury Index. |
| REIT | Real Estate Investment Trust. |
| SOFR | Secured Overnight Financing Rate. |
The accompanying notes are an integral part of these financial statements.
27Pioneer High Yield Fund | Semiannual Report | 4/30/24
| (144A) | The resale of such security is exempt from registration under Rule 144A of the Securities Act of 1933. Such securities may be resold normally to qualified institutional buyers. At April 30, 2024, the value of these securities amounted to $460,146,259, or 79.3% of net assets. |
| (a) | Floating rate note. Coupon rate, reference index and spread shown at April 30, 2024. |
| (b) | This term loan will settle after April 30, 2024, at which time the interest rate will be determined. |
| (c) | Non-income producing security. |
| (d) | Security issued with a zero coupon. Income is recognized through accretion of discount. |
| (e) | Payment-in-kind (PIK) security which may pay interest in the form of additional principal amount. |
| (f) | The interest rate is subject to change periodically. The interest rate and/or reference index and spread shown at April 30, 2024. |
| (g) | Security is perpetual in nature and has no stated maturity date. |
| (h) | Security is in default. |
| (i) | Debt obligation initially issued at one coupon which converts to a higher coupon at a specific date. The rate shown is the rate at April 30, 2024. |
| (j) | Option Care Health, Inc., 7/27/25 warrants are exercisable into 2,136 shares. |
| (k) | Option Care Health, Inc., 12/31/25 warrants are exercisable into 2,136 shares. |
| (l) | Avation Plc, 1/1/59 warrants are exercisable into 56,875 shares. |
| (m) | Issued as participation notes. |
| (n) | Issued as preference shares. |
| (o) | Rate periodically changes. Rate disclosed is the 7-day yield at April 30, 2024. |
| * | Senior secured floating rate loan interests in which the Fund invests generally pay interest at rates that are periodically re-determined by reference to a base lending rate plus a premium. These base lending rates are generally (i) the lending rate offered by one or more major European banks, such as LIBOR or SOFR, (ii) the prime rate offered by one or more major United States banks, (iii) the rate of a certificate of deposit or (iv) other base lending rates used by commercial lenders. The interest rate shown is the rate accruing at April 30, 2024. |
| + | Security is valued using significant unobservable inputs (Level 3). |
| † | Amount rounds to less than 0.1%. |
| # | Securities are restricted as to resale. |
| Restricted Securities | Acquisition date | Cost | Value |
| Cypress Re 2017 | 1/24/2017 | $ 5,377 | $ 160 |
| Dartmouth Re 2018 | 1/18/2018 | 191,651 | 83,218 |
| Formby Re 2018 | 7/9/2018 | 2,020 | — |
| Harambee Re 2018 | 12/19/2017 | 50,955 | — |
| Harambee Re 2019 | 4/24/2019 | — | 3,171 |
| Lorenz Re 2019 | 7/10/2019 | 105,386 | 6,495 |
| Portrush Re 2017 | 6/12/2017 | 805,334 | 105 |
| Sovcombank Via SovCom Capital DAC | 1/30/2020 | 750,000 | 21,094 |
The accompanying notes are an integral part of these financial statements.
Pioneer High Yield Fund | Semiannual Report | 4/30/2428
Schedule of Investments | 4/30/24
(Consolidated) (unaudited) (continued)
| Restricted Securities | Acquisition date | Cost | Value |
| Sovcombank Via SovCom Capital DAC | 11/10/2021 | $1,025,000 | $ 37,028 |
| Viribus Re 2018 | 12/22/2017 | 9,123 | — |
| Viribus Re 2019 | 3/25/2019 | — | — |
| Woburn Re 2019 | 1/30/2019 | 48,038 | 57,794 |
| Total Restricted Securities | | | $209,065 |
| % of Net assets | | | 0.0% † |
| † | Amount rounds to less than 0.1%. |
FORWARD FOREIGN CURRENCY EXCHANGE CONTRACTS
Currency
Purchased | In
Exchange for | Currency
Sold | Deliver | Counterparty | Settlement
Date | Unrealized
Appreciation |
| USD | 1,866,656 | GBP | 1,475,000 | State Street Bank & Trust Co. | 6/27/24 | $ 23,009 |
| USD | 9,737,283 | EUR | 8,950,000 | State Street Bank & Trust Co. | 6/27/24 | 162,571 |
| TOTAL FORWARD FOREIGN CURRENCY EXCHANGE CONTRACTS | $ 185,580 |
SWAP CONTRACTS
CENTRALLY CLEARED CREDIT DEFAULT SWAP CONTRACTS – BUY PROTECTION
Notional
Amount ($)(1) | Reference
Obligation/Index | Pay/
Receive(2) | Annual
Fixed Rate | Expiration
Date | Premiums
(Received) | Unrealized
Appreciation | Market
Value |
| 36,680,000 | Markit CDX North America High Yield Index Series 42 | Pay | 5.00% | 6/20/29 | $(2,537,753) | $165,168 | $(2,372,584) |
TOTAL CENTRALLY CLEARED CREDIT DEFAULT
SWAP CONTRACTS – BUY PROTECTION | $ (2,537,753) | $ 165,168 | $ (2,372,584) |
CENTRALLY CLEARED CREDIT DEFAULT SWAP CONTRACTS – SELL PROTECTION
Notional
Amount ($)(1) | Reference
Obligation/Index | Pay/
Receive(3) | Annual
Fixed Rate | Expiration
Date | Premiums
(Received) | Unrealized
Appreciation | Market
Value |
| 1,583,400 | Markit CDX North America High Yield Series 33 | Receive | 5.00% | 12/20/24 | $ (770) | $ 50,644 | $ 49,873 |
TOTAL CENTRALLY CLEARED CREDIT DEFAULT
SWAP CONTRACTS – SELL PROTECTION | $ (770) | $ 50,644 | $ 49,873 |
| TOTAL SWAP CONTRACTS | | $(2,538,523) | $215,812 | $(2,322,711 ) |
| | |
| (1) | The notional amount is the maximum amount that a seller of credit protection would be obligated to pay upon occurrence of a credit event. |
| (2) | Pays quarterly. |
| (3) | Receives quarterly. |
The accompanying notes are an integral part of these financial statements.
29Pioneer High Yield Fund | Semiannual Report | 4/30/24
Principal amounts are denominated in U.S. dollars (“USD”) unless otherwise noted.
| EUR | — Euro |
| GBP | — Great British Pound |
| IDR | — Indonesian Rupiah |
| USD | — United States Dollar |
Purchases and sales of securities (excluding short-term investments) for the six months ended April 30, 2024, aggregated $129,283,796 and $147,824,345, respectively.
At April 30, 2024, the net unrealized depreciation on investments based on cost for federal tax purposes of $601,005,337 was as follows:
| Aggregate gross unrealized appreciation for all investments in which there is an excess of value over tax cost | $ 8,709,465 |
| Aggregate gross unrealized depreciation for all investments in which there is an excess of tax cost over value | (37,707,939) |
| Net unrealized depreciation | $(28,998,474) |
Various inputs are used in determining the value of the Fund’s investments. These inputs are summarized in the three broad levels below.
| Level 1 | – | unadjusted quoted prices in active markets for identical securities. |
| Level 2 | – | other significant observable inputs (including quoted prices for similar securities, interest rates, prepayment speeds, credit risks, etc.). See Notes to Financial Statements — Note 1A. |
| Level 3 | – | significant unobservable inputs (including the Adviser’s own assumptions in determining fair value of investments). See Notes to Financial Statements — Note 1A. |
The following is a summary of the inputs used as of April 30, 2024 in valuing the Fund’s investments:
| | Level 1 | Level 2 | Level 3 | Total |
| Senior Secured Floating Rate Loan Interests | $ — | $ 6,859,763 | $ — | $ 6,859,763 |
| Common Stocks | | | | |
| Chemicals | 14,796 | — | — | 14,796 |
| Household Durables | 1,011 | — | — | 1,011 |
| Oil, Gas & Consumable Fuels | 339 | — | — | 339 |
| Paper & Forest Products | — | — | —* | —* |
| All Other Common Stocks | — | 3,830,845 | — | 3,830,845 |
| Collateralized Mortgage Obligations | — | 208,057 | — | 208,057 |
| Commercial Mortgage-Backed Security | — | 1,216,101 | — | 1,216,101 |
| Convertible Corporate Bonds | — | 12,236,319 | — | 12,236,319 |
The accompanying notes are an integral part of these financial statements.
Pioneer High Yield Fund | Semiannual Report | 4/30/2430
Schedule of Investments | 4/30/24
(Consolidated) (unaudited) (continued)
| | Level 1 | Level 2 | Level 3 | Total |
| Corporate Bonds | | | | |
| Commercial Services | $ — | $ 28,089,847 | $548,393 | $ 28,638,240 |
| Pharmaceuticals | — | 22,239,557 | —* | 22,239,557 |
| All Other Corporate Bonds | — | 463,286,543 | — | 463,286,543 |
| Preferred Stock | — | 1,617,862 | — | 1,617,862 |
| Rights/Warrants | | | | |
| Health Care Providers & Services | — | 9,121 | — | 9,121 |
| Trading Companies & Distributors | 11,972 | — | — | 11,972 |
| Insurance-Linked Securities | | | | |
| Collateralized Reinsurance | | | | |
| Multiperil – Worldwide | — | — | 83,378 | 83,378 |
| Windstorm – Florida | — | — | 105 | 105 |
| Reinsurance Sidecars | | | | |
| Multiperil – U.S. | — | — | 3,171 | 3,171 |
| Multiperil – Worldwide | — | — | 64,289 | 64,289 |
| U.S. Government and Agency Obligations | — | 22,979,756 | — | 22,979,756 |
| Open-End Fund | 10,842,769 | — | — | 10,842,769 |
| Total Investments in Securities | $ 10,870,887 | $ 562,573,771 | $ 699,336 | $ 574,143,994 |
| Other Financial Instruments | | | | |
| Net unrealized appreciation on forward foreign currency exchange contracts | $ — | $ 185,580 | $ — | $ 185,580 |
| Centrally cleared swap contracts^ | — | 215,812 | — | 215,812 |
| Total Other Financial Instruments | $ — | $ 401,392 | $ — | $ 401,392 |
| * | Securities valued at $0. |
| ^ | Reflects the unrealized appreciation (depreciation) of the instruments. |
Transfers are calculated on the beginning of period values. During the period ended April 30, 2024, three securities valued at $1,138,194 were transferred from Level 3 to Level 2, due to valuing the securities using significant observable inputs. There were no other transfers in or out of Level 3 during the period.
The accompanying notes are an integral part of these financial statements.
31Pioneer High Yield Fund | Semiannual Report | 4/30/24
Statement of Assets and Liabilities | 4/30/24
(Consolidated) (unaudited)
| ASSETS: | |
| Investments in unaffiliated issuers, at value (cost $603,231,038) | $ 574,143,994 |
| Cash | 31,457 |
| Foreign currencies, at value (cost $3,045,879) | 2,941,823 |
| Swaps collateral | 4,295,730 |
| Unrealized appreciation on forward foreign currency exchange contracts | 185,580 |
| Receivables — | |
| Fund shares sold | 383,475 |
| Interest | 8,657,916 |
| Due from the Adviser | 12,089 |
| Other assets | 88,146 |
| Total assets | $ 590,740,210 |
| LIABILITIES: | |
| Payables — | |
| Investment securities purchased | $ 6,452,912 |
| Fund shares repurchased | 1,090,716 |
| Distributions | 259,669 |
| Trustees’ fees | 2,626 |
| Variation margin for centrally cleared swap contracts | 2,322,711 |
| Management fees | 54,572 |
| Administrative expenses | 15,057 |
| Distribution fees | 14,452 |
| Accrued expenses | 399,534 |
| Total liabilities | $ 10,612,249 |
| NET ASSETS: | |
| Paid-in capital | $ 689,783,317 |
| Distributable earnings (loss) | (109,655,356) |
| Net assets | $ 580,127,961 |
| NET ASSET VALUE PER SHARE: | |
| No par value (unlimited number of shares authorized) | |
| Class A (based on $378,773,577/44,486,209 shares) | $ 8.51 |
| Class C (based on $7,521,335/863,332 shares) | $ 8.71 |
| Class R (based on $7,692,741/797,679 shares) | $ 9.64 |
| Class Y (based on $186,140,308/21,832,136 shares) | $ 8.53 |
| MAXIMUM OFFERING PRICE PER SHARE: | |
| Class A (based on $8.51 net asset value per share/100%-4.50% maximum sales charge) | $ 8.91 |
The accompanying notes are an integral part of these financial statements.
Pioneer High Yield Fund | Semiannual Report | 4/30/2432
Statement of Operations (Consolidated) (unaudited)
FOR THE SIX MONTHS ENDED 4/30/24
| INVESTMENT INCOME: | | |
| Interest from unaffiliated issuers | $ 19,120,332 | |
| Dividends from unaffiliated issuers | 477,873 | |
| Total Investment Income | | $ 19,598,205 |
| EXPENSES: | | |
| Management fees | $ 1,910,833 | |
| Administrative expenses | 100,806 | |
| Transfer agent fees | | |
| Class A | 206,848 | |
| Class C | 3,021 | |
| Class R | 9,064 | |
| Class Y | 71,919 | |
| Distribution fees | | |
| Class A | 455,996 | |
| Class C | 36,214 | |
| Class R | 19,005 | |
| Shareholder communications expense | 50,199 | |
| Custodian fees | 2,758 | |
| Registration fees | 68,056 | |
| Professional fees | 92,807 | |
| Printing expense | 15,376 | |
| Officers’ and Trustees’ fees | 15,084 | |
| Insurance expense | 3,674 | |
| Miscellaneous | 70,448 | |
| Total expenses | | $ 3,132,108 |
| Less fees waived and expenses reimbursed by the Adviser | | (267,505) |
| Net expenses | | $ 2,864,603 |
| Net investment income | | $ 16,733,602 |
| REALIZED AND UNREALIZED GAIN (LOSS) ON INVESTMENTS: | | |
| Net realized gain (loss) on: | | |
| Investments in unaffiliated issuers | $ (15,805,225) | |
| Forward foreign currency exchange contracts | 235,066 | |
| Swap contracts | (2,474,367) | |
| Other assets and liabilities denominated in foreign currencies | 149,065 | $(17,895,461) |
| Change in net unrealized appreciation (depreciation) on: | | |
| Investments in unaffiliated issuers | $46,744,539 † | |
| Forward foreign currency exchange contracts | 185,580 | |
| Swap contracts | 15,997 | |
| Other assets and liabilities denominated in foreign currencies | (105,547) | $ 46,840,569 |
| Net realized and unrealized gain (loss) on investments | | $ 28,945,108 |
| Net increase in net assets resulting from operations | | $ 45,678,710 |
| † | Net change in unrealized depreciation does not include net unrealized depreciation of $20,523,483 in connection with the Fund’s reorganization with Pioneer Global High Yield Fund. See Note 9 in the Notes to Financial Statements. |
The accompanying notes are an integral part of these financial statements.
33Pioneer High Yield Fund | Semiannual Report | 4/30/24
Statements of Changes in Net Assets (Consolidated)
| | Six Months
Ended
4/30/24
(unaudited) | Year
Ended
10/31/23 |
| FROM OPERATIONS: | | |
| Net investment income (loss) | $ 16,733,602 | $ 28,910,869 |
| Net realized gain (loss) on investments | (17,895,461) | (28,715,839) |
| Change in net unrealized appreciation (depreciation) on investments | 46,840,569 | 16,807,745 |
| Net increase in net assets resulting from operations | $ 45,678,710 | $ 17,002,775 |
| DISTRIBUTIONS TO SHAREHOLDERS: | | |
| Class A ($0.24 and $0.48 per share, respectively) | $ (10,308,890) | $ (17,505,509) |
| Class C ($0.20 and $0.41 per share, respectively) | (171,386) | (361,007) |
| Class R ($0.25 and $0.48 per share, respectively) | (195,750) | (399,128) |
| Class Y ($0.25 and $0.50 per share, respectively) | (5,043,837) | (8,963,249) |
| Tax return of capital: | | |
| Class A ($— and $0.03 per share, respectively) | $ — | $ (1,257,816) |
| Class C ($— and $0.03 per share, respectively) | — | (25,939) |
| Class R ($— and $0.03 per share, respectively) | — | (28,678) |
| Class Y ($— and $0.03 per share, respectively) | — | (644,032) |
| Total distributions to shareholders | $ (15,719,863) | $ (29,185,358) |
| FROM FUND SHARE TRANSACTIONS: | | |
| Net proceeds from sales of shares | $ 101,126,886 | $ 149,578,990 |
| Shares issued in Reorganization | 126,937,348 | — |
| Reinvestment of distributions | 14,341,457 | 26,429,835 |
| Cost of shares repurchased | (125,854,126) | (214,831,775) |
| Net increase (decrease) in net assets resulting from Fund share transactions | $ 116,551,565 | $ (38,822,950) |
| Net increase (decrease) in net assets | $ 146,510,412 | $ (51,005,533) |
| NET ASSETS: | | |
| Beginning of period | $ 433,617,549 | $ 484,623,082 |
| End of period | $ 580,127,961 | $ 433,617,549 |
The accompanying notes are an integral part of these financial statements.
Pioneer High Yield Fund | Semiannual Report | 4/30/2434
Statements of Changes in Net Assets (Consolidated) (continued)
| | Six Months
Ended
4/30/24
Shares
(unaudited) | Six Months
Ended
4/30/24
Amount
(unaudited) | Year
Ended
10/31/23
Shares | Year
Ended
10/31/23
Amount |
| Class A | | | | |
| Shares sold | 9,171,553 | $ 77,135,960 | 13,140,112 | $ 108,765,507 |
| Shares issued in Reorganization | 11,031,220 | 91,890,060 | — | — |
| Reinvestment of distributions | 1,107,236 | 9,422,326 | 2,058,510 | 16,962,303 |
| Less shares repurchased | (12,347,716) | (104,178,707) | (18,238,239) | (151,098,863) |
Net increase
(decrease) | 8,962,293 | $ 74,269,639 | (3,039,617) | $ (25,371,053) |
| Class C | | | | |
| Shares sold | 38,797 | $ 337,053 | 44,516 | $ 376,471 |
| Shares issued in Reorganization | 244,019 | 2,079,045 | — | — |
| Reinvestment of distributions | 19,357 | 168,524 | 44,820 | 377,760 |
| Less shares repurchased | (152,099) | (1,313,220) | (380,282) | (3,207,610) |
Net increase
(decrease) | 150,074 | $ 1,271,402 | (290,946) | $ (2,453,379) |
| Class R | | | | |
| Shares sold | 212,485 | $ 2,047,527 | 257,610 | $ 2,422,706 |
| Reinvestment of distributions | 20,164 | 194,238 | 45,392 | 424,090 |
| Less shares repurchased | (228,921) | (2,205,714) | (390,445) | (3,661,843) |
Net increase
(decrease) | 3,728 | $ 36,051 | (87,443) | $ (815,047) |
| Class Y | | | | |
| Shares sold | 2,539,169 | $ 21,606,346 | 4,587,194 | $ 38,014,306 |
| Shares issued in Reorganization | 3,953,027 | 32,968,243 | — | — |
| Reinvestment of distributions | 534,744 | 4,556,369 | 1,050,540 | 8,665,682 |
| Less shares repurchased | (2,139,548) | (18,156,485) | (6,906,726) | (56,863,459) |
Net increase
(decrease) | 4,887,392 | $ 40,974,473 | (1,268,992) | $ (10,183,471) |
The accompanying notes are an integral part of these financial statements.
35Pioneer High Yield Fund | Semiannual Report | 4/30/24
Financial Highlights (Consolidated)
| | Six Months
Ended
4/30/24
(unaudited) | Year
Ended
10/31/23 | Year
Ended
10/31/22 | Year
Ended
10/31/21 | Year
Ended
10/31/20 | Year
Ended
10/31/19 |
| Class A | | | | | | |
| Net asset value, beginning of period | $ 8.01 | $ 8.24 | $ 9.64 | $ 8.99 | $ 9.58 | $ 9.37 |
| Increase (decrease) from investment operations: | | | | | | |
| Net investment income (loss) (a) | $ 0.25 | $ 0.50 | $ 0.45 | $ 0.45 | $ 0.48 | $ 0.47 |
| Net realized and unrealized gain (loss) on investments | 0.49 | (0.22) | (1.47) | 0.63 | (0.58) | 0.24 |
| Net increase (decrease) from investment operations | $ 0.74 | $ 0.28 | $ (1.02) | $ 1.08 | $ (0.10) | $ 0.71 |
| Distributions to shareholders: | | | | | | |
| Net investment income | $ (0.24) | $ (0.48) | $ (0.37) | $ (0.36) | $ (0.49) | $ (0.50) |
| Tax return of capital | — | (0.03) | (0.01) | (0.07) | — | — |
| Total distributions | $ (0.24) | $ (0.51) | $ (0.38) | $ (0.43) | $ (0.49) | $ (0.50) |
| Net increase (decrease) in net asset value | $ 0.50 | $ (0.23) | $ (1.40) | $ 0.65 | $ (0.59) | $ 0.21 |
| Net asset value, end of period | $ 8.51 | $ 8.01 | $ 8.24 | $ 9.64 | $ 8.99 | $ 9.58 |
| Total return (b) | 9.25%(c) | 3.35% | (10.75)% | 12.13% | (0.89)% | 7.82% |
| Ratio of net expenses to average net assets | 1.10%(d) | 1.10% | 1.10% | 1.10% | 1.10% | 1.19% |
| Ratio of net investment income (loss) to average net assets | 6.02%(d) | 6.09% | 4.99% | 4.66% | 5.24% | 4.97% |
| Portfolio turnover rate | 26%(c) | 37% | 32% | 80% | 85% | 59% |
| Net assets, end of period (in thousands) | $378,774 | $284,610 | $317,697 | $425,933 | $417,137 | $512,624 |
| Ratios with no waiver of fees and assumption of expenses by the Adviser and no reduction for fees paid indirectly: | | | | | | |
| Total expenses to average net assets | 1.21%(d) | 1.21% | 1.19% | 1.20% | 1.17% | 1.19% |
| Net investment income (loss) to average net assets | 5.91%(d) | 5.98% | 4.90% | 4.56% | 5.17% | 4.97% |
| (a) | The per-share data presented above is based on the average shares outstanding for the period presented. |
| (b) | Assumes initial investment at net asset value at the beginning of each period, reinvestment of all distributions, the complete redemption of the investment at net asset value at the end of each period and no sales charges. Total return would be reduced if sales charges were taken into account. |
| (c) | Not annualized. |
| (d) | Annualized. |
The accompanying notes are an integral part of these financial statements.
Pioneer High Yield Fund | Semiannual Report | 4/30/2436
Financial Highlights (Consolidated) (continued)
| | Six Months
Ended
4/30/24
(unaudited) | Year
Ended
10/31/23 | Year
Ended
10/31/22 | Year
Ended
10/31/21 | Year
Ended
10/31/20 | Year
Ended
10/31/19 |
| Class C | | | | | | |
| Net asset value, beginning of period | $ 8.20 | $ 8.43 | $ 9.84 | $ 9.18 | $ 9.79 | $ 9.57 |
| Increase (decrease) from investment operations: | | | | | | |
| Net investment income (loss) (a) | $ 0.22 | $ 0.44 | $ 0.38 | $ 0.37 | $ 0.41 | $ 0.40 |
| Net realized and unrealized gain (loss) on investments | 0.49 | (0.23) | (1.48) | 0.64 | (0.58) | 0.25 |
| Net increase (decrease) from investment operations | $ 0.71 | $ 0.21 | $ (1.10) | $ 1.01 | $ (0.17) | $ 0.65 |
| Distributions to shareholders: | | | | | | |
| Net investment income | $ (0.20) | $ (0.41) | $ (0.30) | $ (0.28) | $ (0.44) | $ (0.43) |
| Tax return of capital | — | (0.03) | (0.01) | (0.07) | — | — |
| Total distributions | $ (0.20) | $ (0.44) | $ (0.31) | $ (0.35) | $ (0.44) | $ (0.43) |
| Net increase (decrease) in net asset value | $ 0.51 | $ (0.23) | $ (1.41) | $ 0.66 | $ (0.61) | $ 0.22 |
| Net asset value, end of period | $ 8.71 | $ 8.20 | $ 8.43 | $ 9.84 | $ 9.18 | $ 9.79 |
| Total return (b) | 8.74%(c) | 2.48% | (11.32)% | 11.13% | (1.71)% | 6.98% |
| Ratio of net expenses to average net assets | 1.97%(d) | 2.00% | 1.92% | 1.98% | 1.87% | 1.94% |
| Ratio of net investment income (loss) to average net assets | 5.14%(d) | 5.19% | 4.17% | 3.79% | 4.48% | 4.21% |
| Portfolio turnover rate | 26%(c) | 37% | 32% | 80% | 85% | 59% |
| Net assets, end of period (in thousands) | $7,521 | $5,847 | $ 8,461 | $11,574 | $17,019 | $24,166 |
| (a) | The per-share data presented above is based on the average shares outstanding for the period presented. |
| (b) | Assumes initial investment at net asset value at the beginning of each period, reinvestment of all distributions, the complete redemption of the investment at net asset value at the end of each period and no sales charges. Total return would be reduced if sales charges were taken into account. |
| (c) | Not annualized. |
| (d) | Annualized. |
The accompanying notes are an integral part of these financial statements.
37Pioneer High Yield Fund | Semiannual Report | 4/30/24
| | Six Months
Ended
4/30/24
(unaudited) | Year
Ended
10/31/23 | Year
Ended
10/31/22 | Year
Ended
10/31/21 | Year
Ended
10/31/20 | Year
Ended
10/31/19 |
| Class R | | | | | | |
| Net asset value, beginning of period | $ 9.08 | $ 9.34 | $ 10.93 | $ 10.20 | $ 10.84 | $ 10.61 |
| Increase (decrease) from investment operations: | | | | | | |
| Net investment income (loss) (a) | $ 0.26 | $ 0.53 | $ 0.45 | $ 0.45 | $ 0.50 | $ 0.48 |
| Net realized and unrealized gain (loss) on investments | 0.55 | (0.28) | (1.66) | 0.72 | (0.63) | 0.27 |
| Net increase (decrease) from investment operations | $ 0.81 | $ 0.25 | $ (1.21) | $ 1.17 | $ (0.13) | $ 0.75 |
| Distributions to shareholders: | | | | | | |
| Net investment income | $ (0.25) | $ (0.48) | $ (0.37) | $ (0.37) | $ (0.51) | $ (0.52) |
| Tax return of capital | — | (0.03) | (0.01) | (0.07) | — | — |
| Total distributions | $ (0.25) | $ (0.51) | $ (0.38) | $ (0.44) | $ (0.51) | $ (0.52) |
| Net increase (decrease) in net asset value | $ 0.56 | $ (0.26) | $ (1.59) | $ 0.73 | $ (0.64) | $ 0.23 |
| Net asset value, end of period | $ 9.64 | $ 9.08 | $ 9.34 | $ 10.93 | $ 10.20 | $ 10.84 |
| Total return (b) | 8.91%(c) | 2.71% | (11.20)% | 11.55% | (1.08)% | 7.28% |
| Ratio of net expenses to average net assets | 1.58%(d) | 1.59% | 1.59% | 1.59% | 1.51% | 1.63% |
| Ratio of net investment income (loss) to average net assets | 5.53%(d) | 5.60% | 4.49% | 4.17% | 4.82% | 4.51% |
| Portfolio turnover rate | 26%(c) | 37% | 32% | 80% | 85% | 59% |
| Net assets, end of period (in thousands) | $7,693 | $7,209 | $ 8,231 | $11,336 | $11,556 | $15,332 |
| Ratios with no waiver of fees and assumption of expenses by the Adviser and no reduction for fees paid indirectly: | | | | | | |
| Total expenses to average net assets | 1.58%(d) | 1.60% | 1.59% | 1.59% | 1.51% | 1.63% |
| Net investment income (loss) to average net assets | 5.53%(d) | 5.59% | 4.49% | 4.17% | 4.82% | 4.51% |
| (a) | The per-share data presented above is based on the average shares outstanding for the period presented. |
| (b) | Assumes initial investment at net asset value at the beginning of each period, reinvestment of all distributions and the complete redemption of the investment at net asset value at the end of each period. |
| (c) | Not annualized. |
| (d) | Annualized. |
The accompanying notes are an integral part of these financial statements.
Pioneer High Yield Fund | Semiannual Report | 4/30/2438
Financial Highlights (Consolidated) (continued)
| | Six Months
Ended
4/30/24
(unaudited) | Year
Ended
10/31/23 | Year
Ended
10/31/22 | Year
Ended
10/31/21 | Year
Ended
10/31/20 | Year
Ended
10/31/19 |
| Class Y | | | | | | |
| Net asset value, beginning of period | $ 8.02 | $ 8.25 | $ 9.65 | $ 9.00 | $ 9.59 | $ 9.38 |
| Increase (decrease) from investment operations: | | | | | | |
| Net investment income (loss) (a) | $ 0.26 | $ 0.52 | $ 0.47 | $ 0.47 | $ 0.50 | $ 0.50 |
| Net realized and unrealized gain (loss) on investments | 0.50 | (0.22) | (1.47) | 0.63 | (0.57) | 0.24 |
| Net increase (decrease) from investment operations | $ 0.76 | $ 0.30 | $ (1.00) | $ 1.10 | $ (0.07) | $ 0.74 |
| Distributions to shareholders: | | | | | | |
| Net investment income | $ (0.25) | $ (0.50) | $ (0.39) | $ (0.38) | $ (0.52) | $ (0.53) |
| Tax return of capital | — | (0.03) | (0.01) | (0.07) | — | — |
| Total distributions | $ (0.25) | $ (0.53) | $ (0.40) | $ (0.45) | $ (0.52) | $ (0.53) |
| Net increase (decrease) in net asset value | $ 0.51 | $ (0.23) | $ (1.40) | $ 0.65 | $ (0.59) | $ 0.21 |
| Net asset value, end of period | $ 8.53 | $ 8.02 | $ 8.25 | $ 9.65 | $ 9.00 | $ 9.59 |
| Total return (b) | 9.50%(c) | 3.62% | (10.51)% | 12.40% | (0.62)% | 8.12% |
| Ratio of net expenses to average net assets | 0.85%(d) | 0.85% | 0.85% | 0.85% | 0.85% | 0.88% |
| Ratio of net investment income (loss) to average net assets | 6.27%(d) | 6.33% | 5.24% | 4.90% | 5.50% | 5.27% |
| Portfolio turnover rate | 26%(c) | 37% | 32% | 80% | 85% | 59% |
| Net assets, end of period (in thousands) | $186,140 | $135,951 | $150,232 | $192,006 | $176,362 | $200,617 |
| Ratios with no waiver of fees and assumption of expenses by the Adviser and no reduction for fees paid indirectly: | | | | | | |
| Total expenses to average net assets | 0.92%(d) | 0.93% | 0.91% | 0.90% | 0.87% | 0.88% |
| Net investment income (loss) to average net assets | 6.20%(d) | 6.25% | 5.18% | 4.85% | 5.48% | 5.27% |
| (a) | The per-share data presented above is based on the average shares outstanding for the period presented. |
| (b) | Assumes initial investment at net asset value at the beginning of each period, reinvestment of all distributions and the complete redemption of the investment at net asset value at the end of each period. |
| (c) | Not annualized. |
| (d) | Annualized. |
The accompanying notes are an integral part of these financial statements.
39Pioneer High Yield Fund | Semiannual Report | 4/30/24
Notes to Financial Statements | 4/30/24
(Consolidated) (unaudited)
1. Organization and Significant Accounting Policies
Pioneer High Yield Fund (the “Fund”) is a Delaware statutory trust. The Fund is registered under the Investment Company Act of 1940 as a diversified, open-end management investment company. The investment objective of the Fund is to maximize total return through a combination of income and capital appreciation.
The Fund offers five classes of shares designated as Class A, Class C, Class K, Class R and Class Y shares.Class K shares had not commenced operations as of April 30, 2024. Each class of shares represents an interest in the same portfolio of investments of the Fund and has identical rights (based on relative net asset values) to assets and liquidation proceeds. Share classes can bear different rates of class-specific fees and expenses, such as transfer agent and distribution fees. Differences in class-specific fees and expenses will result in differences in net investment income and, therefore, the payment of different dividends from net investment income earned by each class. The Amended and Restated Declaration of Trust of the Fund gives the Board of Trustees the flexibility to specify either per-share voting or dollar-weighted voting when submitting matters for shareholder approval. Under per-share voting, each share of a class of the Fund is entitled to one vote. Under dollar-weighted voting, a shareholder’s voting power is determined not by the number of shares owned, but by the dollar value of the shares on the record date. Each share class has exclusive voting rights with respect to matters affecting only that class, including with respect to the distribution plan for that class. There is no distribution plan for Class Y shares.
Amundi Asset Management US, Inc., an indirect, wholly owned subsidiary of Amundi and Amundi’s wholly owned subsidiary, Amundi USA, Inc., serves as the Fund’s investment adviser (the “Adviser”). Amundi Distributor US, Inc., an affiliate of the Adviser, serves as the Fund’s distributor (the “Distributor”).
The consolidated financial statements of the Fund include the account of Pioneer Global High Yield Fund. All intercompany accounts and transactions have been eliminated. The Fund purchased one share of Pioneer Global High Yield Fund on December 8, 2023 in connection with the reorganization of Pioneer Global High Yield Fund with the Fund (the “Reorganization”), as described in note 9, as a result of which Pioneer Global High Yield Fund became a wholly-owned subsidiary of the Fund. Following the completion of the Reorganization, the Fund is the sole
Pioneer High Yield Fund | Semiannual Report | 4/30/2440
shareholder of Pioneer Global High Yield Fund, and Pioneer Global High Yield Fund is wholly owned and controlled by the Fund. It is intended that the Fund will remain the sole shareholder of Pioneer Global High Yield Fund and will continue to control Pioneer Global High Yield Fund. Following the completion of the Reorganization, as described in note 9, the sole assets of Pioneer Global High Yield Fund are two securities on which there are currently transfer restrictions. As of April 30, 2024, the assets of Pioneer Global High Yield Fund represented $58,122, or approximately 0.01%, of the net assets of the Fund.
The Fund is required to comply with Rule 18f-4 under the 1940 Act, which governs the use of derivatives by registered investment companies. Rule 18f-4 permits funds to enter into derivatives transactions (as defined in Rule 18f-4) and certain other transactions notwithstanding the restrictions on the issuance of “senior securities” under Section 18 of the 1940 Act. In accordance with Rule 18f-4, the Fund has established and maintains a comprehensive derivatives risk management program, has appointed a derivatives risk manager and complies with a relative or absolute limit on fund leverage risk calculated based on value-at-risk ("VaR").
The Fund is an investment company and follows investment company accounting and reporting guidance under U.S. Generally Accepted Accounting Principles (“U.S. GAAP”). U.S. GAAP requires the management of the Fund to make estimates and assumptions that affect the reported amounts of assets and liabilities, the disclosure of contingent assets and liabilities at the date of the financial statements, and the reported amounts of income, expenses and gain or loss on investments during the reporting period. Actual results could differ from those estimates.
The following is a summary of significant accounting policies followed by the Fund in the preparation of its financial statements:
| A. | Security Valuation |
| | The net asset value of the Fund is computed once daily, on each day the New York Stock Exchange (“NYSE”) is open, as of the close of regular trading on the NYSE. |
| | Fixed income securities are valued by using prices supplied by independent pricing services, which consider such factors as market prices, market events, quotations from one or more brokers, Treasury spreads, yields, maturities and ratings, or may use a pricing matrix or other fair value methods or techniques to provide an estimated value of the security or instrument. A pricing matrix is a means of valuing a debt security on the basis of current market prices for other debt securities, |
41Pioneer High Yield Fund | Semiannual Report | 4/30/24
| | historical trading patterns in the market for fixed income securities and/or other factors. Non-U.S. debt securities that are listed on an exchange will be valued at the bid price obtained from an independent third party pricing service. When independent third party pricing services are unable to supply prices, or when prices or market quotations are considered to be unreliable, the value of that security may be determined using quotations from one or more broker-dealers. |
| | Loan interests are valued at the mean between the last available bid and asked prices from one or more brokers or dealers as obtained from Loan Pricing Corporation, an independent third party pricing service. If price information is not available from Loan Pricing Corporation, or if the price information is deemed to be unreliable, price information will be obtained from an alternative loan interest pricing service. If no reliable price quotes are available from either the primary or alternative pricing service, broker quotes will be solicited. |
| | Event-linked bonds are valued at the bid price obtained from an independent third party pricing service. Other insurance-linked securities (including reinsurance sidecars, collateralized reinsurance and industry loss warranties) may be valued at the bid price obtained from an independent pricing service, or through a third party using a pricing matrix, insurance valuation models, or other fair value methods or techniques to provide an estimated value of the instrument. |
| | Equity securities that have traded on an exchange are valued by using the last sale price on the principal exchange where they are traded. Equity securities that have not traded on the date of valuation, or securities for which sale prices are not available, generally are valued using the mean between the last bid and asked prices or, if both last bid and asked prices are not available, at the last quoted bid price. Last sale and bid and asked prices are provided by independent third party pricing services. In the case of equity securities not traded on an exchange, prices are typically determined by independent third party pricing services using a variety of techniques and methods. |
| | The value of foreign securities is translated into U.S. dollars based on foreign currency exchange rate quotations supplied by a third party pricing source. Trading in non-U.S. equity securities is substantially completed each day at various times prior to the close of the NYSE. The values of such securities used in computing the net asset value of the Fund's shares are determined as of such times. The Adviser may use a fair value model developed by an independent pricing service to value non-U.S. equity securities. |
Pioneer High Yield Fund | Semiannual Report | 4/30/2442
| | Shares of open-end registered investment companies (including money market mutual funds) are valued at such funds’ net asset value. |
| | Forward foreign currency exchange contracts are valued daily using the foreign exchange rate or, for longer term forward contract positions, the spot currency rate and the forward points on a daily basis, in each case provided by a third party pricing service. Contracts whose forward settlement date falls between two quoted days are valued by interpolation. |
| | Swap contracts, including interest rate swaps, caps and floors (other than centrally cleared swap contracts), are valued at the dealer quotations obtained from reputable International Swap Dealers Association members. Centrally cleared swaps are valued at the daily settlement price provided by the central clearing counterparty. |
| | Securities or loan interests for which independent pricing services or broker-dealers are unable to supply prices or for which market prices and/or quotations are not readily available or are considered to be unreliable are valued by a fair valuation team comprised of certain personnel of the Adviser. The Adviser is designated as the valuation designee for the Fund pursuant to Rule 2a-5 under the 1940 Act.The Adviser is designated as the valuation designee for the Fund pursuant to Rule 2a-5 under the 1940 Act. The Adviser’s fair valuation team is responsible for monitoring developments that may impact fair valued securities. |
| | Inputs used when applying fair value methods to value a security may include credit ratings, the financial condition of the company, current market conditions and comparable securities. The Adviser may use fair value methods if it is determined that a significant event has occurred after the close of the exchange or market on which the security trades and prior to the determination of the Fund’s net asset value. Examples of a significant event might include political or economic news, corporate restructurings, natural disasters, terrorist activity or trading halts. Thus, the valuation of the Fund’s securities may differ significantly from exchange prices, and such differences could be material. |
| B. | Investment Income and Transactions |
| | Dividend income is recorded on the ex-dividend date, except that certain dividends from foreign securities where the ex-dividend date may have passed are recorded as soon as the Fund becomes aware of the ex-dividend data in the exercise of reasonable diligence. |
43Pioneer High Yield Fund | Semiannual Report | 4/30/24
| | Interest income, including interest on income-bearing cash accounts, is recorded on the accrual basis. Dividend and interest income are reported net of unrecoverable foreign taxes withheld at the applicable country rates and net of income accrued on defaulted securities. |
| | Interest and dividend income payable by delivery of additional shares is reclassified as PIK (payment-in-kind) income upon receipt and is included in interest and dividend income, respectively. |
| | Principal amounts of mortgage-backed securities are adjusted for monthly paydowns. Premiums and discounts related to certain mortgage-backed securities are amortized or accreted in proportion to the monthly paydowns. All discounts/premiums on purchase prices of debt securities are accreted/amortized for financial reporting purposes over the life of the respective securities, and such accretion/amortization is included in interest income. |
| | Security transactions are recorded as of trade date. Gains and losses on sales of investments are calculated on the identified cost method for both financial reporting and federal income tax purposes. |
| C. | Foreign Currency Translation |
| | The books and records of the Fund are maintained in U.S. dollars. Amounts denominated in foreign currencies are translated into U.S. dollars using current exchange rates. |
| | Net realized gains and losses on foreign currency transactions, if any, represent, among other things, the net realized gains and losses on foreign currency exchange contracts, disposition of foreign currencies and the difference between the amount of income accrued and the U.S. dollars actually received. Further, the effects of changes in foreign currency exchange rates on investments are not segregated on the Statement of Operations from the effects of changes in the market prices of those securities, but are included with the net realized and unrealized gain or loss on investments. |
| D. | Federal Income Taxes |
| | It is the Fund’s policy to comply with the requirements of the Internal Revenue Code applicable to regulated investment companies and to distribute all of its net taxable income and net realized capital gains, if any, to its shareholders. Therefore, no provision for federal income taxes is required. As of April 30, 2024, the Fund did not accrue any interest or penalties with respect to uncertain tax positions, which, if applicable, would be recorded as an income tax expense on the Statement of |
Pioneer High Yield Fund | Semiannual Report | 4/30/2444
| | Operations. Tax returns filed within the prior three years remain subject to examination by federal and state tax authorities. |
| | The amount and character of income and capital gain distributions to shareholders are determined in accordance with federal income tax rules, which may differ from U.S. GAAP. Distributions in excess of net investment income or net realized gains are temporary over distributions for financial statement purposes resulting from differences in the recognition or classification of income or distributions for financial statement and tax purposes. Capital accounts within the financial statements are adjusted for permanent book/tax differences to reflect tax character, but are not adjusted for temporary differences. |
| | A portion of the dividend income recorded by the Fund is from distributions by publicly traded real estate investment trusts (“REITs”), and such distributions for tax purposes may also consist of capital gains and return of capital. The actual return of capital and capital gains portions of such distributions will be determined by formal notifications from the REITs subsequent to the calendar year-end. Distributions received from the REITs that are determined to be a return of capital are recorded by the Fund as a reduction of the cost basis of the securities held and those determined to be capital gain are reflected as such on the Statement of Operations. |
| | The tax character of current year distributions payable will be determined at the end of the current taxable year. The tax character of distributions paid during the year ended October 31, 2023 was as follows: |
| | 2023 |
| Distributions paid from: | |
| Ordinary income | $27,228,892 |
| Tax return of capital | 1,956,466 |
| Total | $29,185,358 |
The following shows the components of distributable earnings (losses) on a federal income tax basis at October 31, 2023:
| | 2023 |
| Distributable earnings/(losses): | |
| Capital loss carryforward | $ (63,480,843) |
| Current year dividend payable | (188,770) |
| Net unrealized depreciation | (55,421,107) |
| Total | $(119,090,720) |
The difference between book basis and tax basis unrealized depreciation is attributable to the tax deferral of losses on wash sales, the tax
45Pioneer High Yield Fund | Semiannual Report | 4/30/24
treatment of premium and amortization, and adjustments relating to event linked bonds and swaps.
| E. | Fund Shares |
| | The Fund records sales and repurchases of its shares as of trade date. The Distributor earned $3,253 in underwriting commissions on the sale of Class A shares during the six months ended April 30, 2024. |
| F. | Class Allocations |
| | Income, common expenses and realized and unrealized gains and losses are calculated at the Fund level and allocated daily to each class of shares based on its respective percentage of adjusted net assets at the beginning of the day. |
| | Distribution fees are calculated based on the average daily net asset value attributable to Class A, Class C and Class R shares of the Fund, respectively (see Note 5). Class Y shares do not pay distribution fees. All expenses and fees paid to the Fund's transfer agent for its services are allocated among the classes of shares based on the number of accounts in each class and the ratable allocation of related out-of-pocket expenses (see Note 4). |
| | The Fund declares as daily dividends substantially all of its net investment income. All dividends are paid on a monthly basis. Short-term capital gain distributions, if any, may be declared with the daily dividends. |
| | Distributions to shareholders are recorded as of the ex-dividend date. Distributions paid by the Fund with respect to each class of shares are calculated in the same manner and at the same time, except that net investment income dividends to Class A, Class C, Class R and Class Y shares can reflect different transfer agent and distribution expense rates. |
| G. | Risks |
| | The value of securities held by the Fund may go up or down, sometimes rapidly or unpredictably, due to general market conditions, such as real or perceived adverse economic, political or regulatory conditions, recessions, the spread of infectious illness or other public health issues, inflation, changes in interest rates, armed conflict such as between Russia and Ukraine or in the Middle East, sanctions against Russia, other nations or individuals or companies and possible countermeasures, lack of liquidity in the bond markets or adverse investor sentiment. In the past several years, financial markets have experienced increased volatility, depressed valuations, decreased liquidity and heightened |
Pioneer High Yield Fund | Semiannual Report | 4/30/2446
| | uncertainty. These conditions may continue, recur, worsen or spread. Inflation and interest rates have increased and may rise further. These circumstances could adversely affect the value and liquidity of the Fund’s investments and negatively impact the Fund’s performance. |
| | The long-term impact of the COVID-19 pandemic and its subsequent variants on economies, markets, industries and individual issuers, are not known. Some sectors of the economy and individual issuers have experienced or may experience particularly large losses. Periods of extreme volatility in the financial markets, reduced liquidity of many instruments, increased government debt, inflation, and disruptions to supply chains, consumer demand and employee availability, may continue for some time. Following Russia’s invasion of Ukraine, Russian securities lost all, or nearly all, their market value. Other securities or markets could be similarly affected by past or future political, geopolitical or other events or conditions. |
| | Governments and central banks, including the U.S. Federal Reserve, have taken extraordinary and unprecedented actions to support local and global economies and the financial markets. These actions have resulted in significant expansion of public debt, including in the U.S. The consequences of high public debt, including its future impact on the economy and securities markets, may not be known for some time. |
| | The U.S. and other countries are periodically involved in disputes over trade and other matters, which may result in tariffs, investment restrictions and adverse impacts on affected companies and securities. For example, the U.S. has imposed tariffs and other trade barriers on Chinese exports, has restricted sales of certain categories of goods to China, and has established barriers to investments in China. Trade disputes may adversely affect the economies of the U.S. and its trading partners, as well as companies directly or indirectly affected and financial markets generally. If the political climate between the U.S. and China does not improve or continues to deteriorate, if China were to attempt unification of Taiwan by force, or if other geopolitical conflicts develop or get worse, economies, markets and individual securities may be severely affected both regionally and globally, and the value of the Fund’s assets may go down. |
| | At times, the Fund’s investments may represent industries or industry sectors that are interrelated or have common risks, making the Fund more susceptible to any economic, political, or regulatory developments or other risks affecting those industries and sectors. |
| | The Fund’s investments in foreign markets and countries with limited developing markets may subject the Fund to a greater degree of risk |
47Pioneer High Yield Fund | Semiannual Report | 4/30/24
| | than investments in a developed market. These risks include disruptive political or economic conditions, military conflicts and sanctions, terrorism, sustained economic downturns, financial instability, less liquid trading markets, extreme price volatility, currency risks, reduction of government or central bank support, inadequate accounting standards, tariffs, tax disputes or other tax burdens, nationalization or expropriation of assets and the imposition of adverse governmental laws, arbitrary application of laws and regulations or lack of rule of law and investment and repatriation restrictions. Lack of information and less market regulation also may affect the value of these securities. Withholding and other non-U.S. taxes may decrease the Fund’s return. Non-U.S. issuers may be located in parts of the world that have historically been prone to natural disasters. Investing in depositary receipts is subject to many of the same risks as investing directly in non-U.S. issuers. Depositary receipts may involve higher expenses and may trade at a discount (or premium) to the underlying security. |
| | Russia launched a large-scale invasion of Ukraine on February 24, 2022. In response to the military action by Russia, various countries, including the U.S., the United Kingdom, and European Union issued broad-ranging economic sanctions against Russia and Belarus and certain companies and individuals. Since then, Russian securities have lost all, or nearly all, their market value, and many other issuers, securities and markets have been adversely affected. The United States and other countries may impose sanctions on other countries, companies and individuals in light of Russia’s military invasion. The extent and duration of the military action or future escalation of such hostilities, the extent and impact of existing and future sanctions, market disruptions and volatility, and the result of any diplomatic negotiations cannot be predicted. These and any related events could have a significant impact on the value and liquidity of certain Fund investments, on Fund performance and the value of an investment in the Fund, particularly with respect to securities and commodities, such as oil, natural gas and food commodities, as well as other sectors with exposure to Russian issuers or issuers in other countries affected by the invasion, and are likely to have collateral impacts on market sectors globally. |
| | Normally, the Fund invests at least 80% of its total assets in below-investment-grade (high-yield) debt securities and preferred stocks. Some of these high-yield securities may be convertible into equity securities of the issuer. Debt securities rated below-investment-grade are commonly referred to as “junk bonds” and are considered speculative with respect to the issuer’s capacity to pay interest and repay principal. These securities involve greater risk of loss, are subject to greater price |
Pioneer High Yield Fund | Semiannual Report | 4/30/2448
| | volatility, and may be less liquid and more difficult to value, especially during periods of economic uncertainty or change, than higher rated debt securities. |
| | The market prices of the Fund’s fixed income securities may fluctuate significantly when interest rates change. The value of your investment will generally go down when interest rates rise. A rise in rates tends to have a greater impact on the prices of longer term or duration securities. For example, if interest rates increase by 1%, the value of a Fund’s portfolio with a portfolio duration of ten years would be expected to decrease by 10%, all other things being equal. In recent years interest rates and credit spreads in the U.S. have been at historic lows. The U.S. Federal Reserve has raised certain interest rates, and interest rates may continue to go up. A general rise in interest rates could adversely affect the price and liquidity of fixed income securities. The maturity of a security may be significantly longer than its effective duration. A security’s maturity and other features may be more relevant than its effective duration in determining the security’s sensitivity to other factors affecting the issuer or markets generally, such as changes in credit quality or in the yield premium that the market may establish for certain types of securities (sometimes called “credit spread”). In general, the longer its maturity the more a security may be susceptible to these factors. When the credit spread for a fixed income security goes up, or “widens”, the value of the security will generally go down. |
| | If an issuer or guarantor of a security held by the Fund or a counterparty to a financial contract with the Fund defaults on its obligation to pay principal and/or interest, has its credit rating downgraded or is perceived to be less creditworthy, or the credit quality or value of any underlying assets declines, the value of your investment will typically decline. Changes in actual or perceived creditworthiness may occur quickly. The Fund could be delayed or hindered in its enforcement of rights against an issuer, guarantor or counterparty. |
| | The Fund’s investments, payment obligations and financing terms may be based on floating rates, such as LIBOR (London Interbank Offered Rate) or SOFR (Secured Overnight Financing Rate). ICE Benchmark Administration, the administrator of LIBOR, has ceased publication of most LIBOR settings on a representative basis. Actions by regulators have resulted in the establishment of alternative reference rates to LIBOR in most major currencies. In the U.S., a common benchmark replacement is based on the SOFR published by the Federal Reserve Bank of New York, including certain spread adjustments and benchmark replacement conforming changes, although other benchmark replacements (without or without spread adjustments) may be used in |
49Pioneer High Yield Fund | Semiannual Report | 4/30/24
| | certain transactions. The impact of the transition from LIBOR on the Fund’s transactions and financial markets generally cannot yet be determined. The transition away from LIBOR may lead to increased volatility and illiquidity in markets for instruments that have relied on LIBOR and may adversely affect the Fund’s performance. |
| | The Fund may invest in REIT securities, the value of which can fall for a variety of reasons, such as declines in rental income, fluctuating interest rates, poor property management, environmental liabilities, uninsured damage, increased competition, or changes in real estate tax laws. |
| | With the increased use of technologies such as the Internet to conduct business, the Fund is susceptible to operational, information security and related risks. While the Fund’s Adviser has established business continuity plans in the event of, and risk management systems to prevent, limit or mitigate, such cyber-attacks, there are inherent limitations in such plans and systems, including the possibility that certain risks have not been identified. Furthermore, the Fund cannot control the cybersecurity plans and systems put in place by service providers to the Fund such as the Fund’s custodian and accounting agent, and the Fund’s transfer agent. In addition, many beneficial owners of Fund shares hold them through accounts at broker-dealers, retirement platforms and other financial market participants over which neither the Fund nor the Adviser exercises control. Each of these may in turn rely on service providers to them, which are also subject to the risk of cyber-attacks. Cybersecurity failures or breaches at the Adviser or the Fund’s service providers or intermediaries have the ability to cause disruptions and impact business operations, potentially resulting in financial losses, interference with the Fund’s ability to calculate its net asset value, impediments to trading, the inability of Fund shareholders to effect share purchases, redemptions or exchanges or receive distributions, loss of or unauthorized access to private shareholder information and violations of applicable privacy and other laws, regulatory fines, penalties, reputational damage, or additional compliance costs. Such costs and losses may not be covered under any insurance. In addition, maintaining vigilance against cyber-attacks may involve substantial costs over time, and system enhancements may themselves be subject to cyber-attacks. |
| | The Fund’s prospectus contains unaudited information regarding the Fund’s principal risks. Please refer to that document when considering the Fund’s principal risks. |
Pioneer High Yield Fund | Semiannual Report | 4/30/2450
| H. | Restricted Securities |
| | Restricted Securities are subject to legal or contractual restrictions on resale. Restricted securities generally are resold in transactions exempt from registration under the Securities Act of 1933. Private placement securities are generally considered to be restricted except for those securities traded between qualified institutional investors under the provisions of Rule 144A of the Securities Act of 1933. |
| | Disposal of restricted investments may involve negotiations and expenses, and prompt sale at an acceptable price may be difficult to achieve. Restricted investments held by the Fund at April 30, 2024 are listed in the Schedule of Investments. |
| I. | Insurance-Linked Securities (“ILS”) |
| | The Fund invests in ILS. The Fund could lose a portion or all of the principal it has invested in an ILS, and the right to additional interest or dividend payments with respect to the security, upon the occurrence of one or more trigger events, as defined within the terms of an insurance-linked security. Trigger events, generally, are hurricanes, earthquakes, or other natural events of a specific size or magnitude that occur in a designated geographic region during a specified time period, and/or that involve losses or other metrics that exceed a specific amount. There is no way to accurately predict whether a trigger event will occur, and accordingly, ILS carry significant risk. The Fund is entitled to receive principal, and interest and/or dividend payments so long as no trigger event occurs of the description and magnitude specified by the instrument. In addition to the specified trigger events, ILS may expose the Fund to other risks, including but not limited to issuer (credit) default, adverse regulatory or jurisdictional interpretations and adverse tax consequences. |
| | The Fund’s investments in ILS may include event-linked bonds. ILS also may include special purpose vehicles (“SPVs”) or similar instruments structured to comprise a portion of a reinsurer’s catastrophe-oriented business, known as quota share instruments (sometimes referred to as reinsurance sidecars), or to provide reinsurance relating to specific risks to insurance or reinsurance companies through a collateralized instrument, known as collateralized reinsurance. Structured reinsurance investments also may include industry loss warranties (“ILWs”). A traditional ILW takes the form of a bilateral reinsurance contract, but there are also products that take the form of derivatives, collateralized structures, or exchange-traded instruments. |
51Pioneer High Yield Fund | Semiannual Report | 4/30/24
| | Where the ILS are based on the performance of underlying reinsurance contracts, the Fund has limited transparency into the individual underlying contracts, and therefore must rely upon the risk assessment and sound underwriting practices of the issuer. Accordingly, it may be more difficult for the Adviser to fully evaluate the underlying risk profile of the Fund’s structured reinsurance investments, and therefore the Fund’s assets are placed at greater risk of loss than if the Adviser had more complete information. Structured reinsurance instruments generally will be considered illiquid securities by the Fund. These securities may be difficult to purchase, sell or unwind. Illiquid securities also may be difficult to value. If the Fund is forced to sell an illiquid asset, the Fund may be forced to sell at a loss. |
| J. | Forward Foreign Currency Exchange Contracts |
| | The Fund may enter into forward foreign currency exchange contracts ("contracts") for the purchase or sale of a specific foreign currency at a fixed price on a future date. All contracts are marked-to-market daily at the applicable exchange rates, and any resulting unrealized appreciation or depreciation is recorded in the Fund's financial statements. The Fund records realized gains and losses at the time a contract is offset by entry into a closing transaction or extinguished by delivery of the currency. Risks may arise upon entering into these contracts from the potential inability of counterparties to meet the terms of the contract and from unanticipated movements in the value of foreign currencies relative to the U.S. dollar (see Note 8). |
| | During the six months ended April 30, 2024, the Fund had entered into various forward foreign currency exchange contracts that obligated the Fund to deliver or take delivery of currencies at specified future maturity dates. Alternatively, prior to the settlement date of a forward foreign currency exchange contract, the Fund may close out such contract by entering into an offsetting contract. |
| | The average market value of forward foreign currency exchange contracts open during the six months ended April 30, 2024 was $0 and $7,661,275 for buys and sells, respectively. Open forward foreign currency exchange contracts outstanding at April 30, 2024 are listed in the Schedule of Investments. |
| K. | Credit Default Swap Contracts |
| | A credit default swap is a contract between a buyer of protection and a seller of protection against a pre-defined credit event or an underlying reference obligation, which may be a single security or a basket or index of securities. The Fund may buy or sell credit default swap contracts to |
Pioneer High Yield Fund | Semiannual Report | 4/30/2452
| | seek to increase the Fund's income, or to attempt to hedge the risk of default on portfolio securities. A credit default swap index is used to hedge risk or take a position on a basket of credit entities or indices. |
| | As a seller of protection, the Fund would be required to pay the notional (or other agreed-upon) value of the referenced debt obligation to the counterparty in the event of a default by a U.S. or foreign corporate issuer of a debt obligation, which would likely result in a loss to the Fund. In return, the Fund would receive from the counterparty a periodic stream of payments during the term of the contract, provided that no event of default occurred. The maximum exposure of loss to the seller would be the notional value of the credit default swaps outstanding. If no default occurs, the Fund would keep the stream of payments and would have no payment obligation. The Fund may also buy credit default swap contracts in order to hedge against the risk of default of debt securities, in which case the Fund would function as the counterparty referenced above. |
| | As a buyer of protection, the Fund makes an upfront or periodic payment to the protection seller in exchange for the right to receive a contingent payment. An upfront payment made by the Fund, as the protection buyer, is recorded within the "Swap contracts, at value" line item on the Statement of Assets and Liabilities. Periodic payments received or paid by the Fund are recorded as realized gains or losses on the Statement of Operations. |
| | Credit default swap contracts are marked-to-market daily using valuations supplied by independent sources, and the change in value, if any, is recorded within the "Swap contracts, at value" line item on the Statement of Assets and Liabilities. Payments received or made as a result of a credit event or upon termination of the contract are recognized, net of the appropriate amount of the upfront payment, as realized gains or losses on the Statement of Operations. |
| | Credit default swap contracts involving the sale of protection may involve greater risks than if the Fund had invested in the referenced debt instrument directly. Credit default swap contracts are subject to general market risk, liquidity risk, counterparty risk and credit risk. If the Fund is a protection buyer and no credit event occurs, it will lose its investment. If the Fund is a protection seller and a credit event occurs, the value of the referenced debt instrument received by the Fund, together with the periodic payments received, may be less than the amount the Fund pays to the protection buyer, resulting in a loss to the Fund. In addition, obligations under sell protection credit default swaps may be partially offset by net amounts received from settlement of buy |
53Pioneer High Yield Fund | Semiannual Report | 4/30/24
| | protection credit default swaps entered into by the Fund for the same reference obligation with the same counterparty. |
| | Certain swap contracts that are cleared through a central clearinghouse are referred to as centrally cleared swaps. All payments made or received by the Fund are pursuant to a centrally cleared swap contract with the central clearing party rather than the original counterparty. Upon entering into a centrally cleared swap contract, the Fund is required to make an initial margin deposit, either in cash or in securities. The daily change in value on open centrally cleared contracts is recorded as "Variation margin for centrally cleared swap contracts" on the Statement of Assets and Liabilities. Cash received from or paid to the broker related to previous margin movement is held in a segregated account at the broker and is recorded as either "Due from broker for swaps" or "Due to broker for swaps" on the Statement of Assets and Liabilities. The amount of cash deposited with a broker as collateral at April 30, 2024 is recorded as "Swaps collateral" on the Statement of Assets and Liabilities. |
| | The Fund may invest in credit default swap index products ("CDX"). A CDX is a swap on an index of credit default swaps. CDXs allow an investor to manage credit risk or take a position on a basket of credit entities (such as credit default swaps or commercial mortgage-backed securities) in a more efficient manner than transacting in a single-name credit default swap. If a credit event occurs in one of the underlying companies, the protection is paid out via the delivery of the defaulted bond by the buyer of protection in return for a payment of notional value of the defaulted bond by the seller of protection or it may be settled through a cash settlement between the two parties. The underlying company is then removed from the index. If the Fund holds a long position in a CDX, the Fund would indirectly bear its proportionate share of any expenses paid by a CDX. A fund holding a long position in CDXs typically receives income from principal or interest paid on the underlying securities. By investing in CDXs, the Fund could be exposed to liquidity risk, counterparty risk, credit risk of the issuers of the underlying loan obligations and of the CDX markets, and operational risks. If there is a default by the CDX counterparty, the Fund will have contractual remedies pursuant to the agreements related to the transaction. CDXs also bear the risk that the Fund will not be able to meet its obligation to the counterparty. |
| | The average notional values of credit default swap contracts buy protection and credit default swap contracts sell protection open during the six months ended April 30, 2024 were $33,539,967 and $1,589,467, |
Pioneer High Yield Fund | Semiannual Report | 4/30/2454
| | respectively. Open credit default swap contracts at April 30, 2024 are listed in the Schedule of Investments. |
2. Management Agreement
The Adviser manages the Fund’s portfolio. Management fees payable under the Fund’s Investment Management Agreement with the Adviser are calculated daily and paid monthly at the annual rate of 0.70% of the Fund’s average daily net assets up to $500 million, 0.65% of the next $500 million of the Fund’s average daily net assets, 0.60% of the next $500 million of the Fund’s average daily net assets, 0.55% of the next $500 million of the Fund’s average daily net assets, 0.45% of the next $6 billion of the Fund’s average daily net assets, 0.40% of the next $1 billion of the Fund’s average daily net assets, 0.35% of the next $1 billion of the Fund’s average daily net assets, and 0.30% of the Fund’s average daily net assets over $10 billion. For the six months ended April 30, 2024, the effective management fee (excluding waivers and/or assumptions of expenses) was equivalent to 0.69% (annualized) of the Fund’s average daily net assets.
The Adviser has contractually agreed to limit ordinary operating expenses (ordinary operating expenses means all fund expenses other than taxes, brokerage commissions, acquired fund fees and expenses and extraordinary expenses, such as litigation) of the Fund to the extent required to reduce Fund expenses to 1.10% and 0.85% of the average daily net assets attributable to Class A and Class Y shares, respectively. These expense limitations are in effect through March 1, 2025. There can be no assurance that the Adviser will extend the expense limitation agreement for a class of shares beyond the date referred to above. Fees waived and expenses reimbursed during the six months ended April 30, 2024 are reflected on the Statement of Operations.
In addition, under the management and administration agreements, certain other services and costs, including accounting, regulatory reporting and insurance premiums, are paid by the Fund as administrative reimbursements. Reflected on the Statement of Assets and Liabilities is $54,572 in management fees payable to the Adviser at April 30, 2024.
3. Compensation of Officers and Trustees
The Fund pays an annual fee to its Trustees. The Adviser reimburses the Fund for fees paid to the Interested Trustees. Except for the chief compliance officer, the Fund does not pay any salary or other compensation to its officers. The Fund pays a portion of the chief compliance officer’s compensation for his services as the Fund’s chief compliance officer. Amundi US pays the remaining portion of the chief compliance officer’s compensation. For the six months ended April 30, 2024, the Fund
55Pioneer High Yield Fund | Semiannual Report | 4/30/24
paid $15,084 in Officers’ and Trustees’ compensation, which is reflected on the Statement of Operations as Officers’ and Trustees’ fees. At April 30, 2024, on its Statement of Assets and Liabilities, the Fund had a payable for Trustees’ fees of $2,626 and a payable for administrative expenses of $15,057, which includes the payable for Officers’ compensation.
4. Transfer Agent
BNY Mellon Investment Servicing (US) Inc. serves as the transfer agent to the Fund at negotiated rates. Transfer agent fees and payables shown on the Statement of Operations and the Statement of Assets and Liabilities, respectively, include sub-transfer agent expenses incurred through the Fund’s omnibus relationship contracts.
In addition, the Fund reimbursed the transfer agent for out-of-pocket expenses incurred by the transfer agent related to shareholder communications activities such as proxy and statement mailings, and outgoing phone calls. For the six months ended April 30, 2024, such out-of-pocket expenses by class of shares were as follows:
| Shareholder Communications: | |
| Class A | $39,908 |
| Class C | 2,218 |
| Class R | 555 |
| Class Y | 7,518 |
| Total | $ 50,199 |
5. Distribution and Service Plans
The Fund has adopted a distribution plan (the “Plan”) pursuant to Rule 12b-1 of the Investment Company Act of 1940 with respect to its Class A, Class C and Class R shares. Pursuant to the Plan, the Fund pays the Distributor 0.25% of the Fund's average daily net assets attributable to Class A shares as compensation for personal services and/or account maintenance services or distribution services with regard to Class A shares. Pursuant to the Plan, the Fund also pays the Distributor 1.00% of the average daily net assets attributable to Class C shares. The fee for Class C shares consists of a 0.25% service fee and a 0.75% distribution fee paid as compensation for personal services and/or account maintenance services or distribution services with regard to Class C shares. Pursuant to the Plan, the Fund further pays the Distributor 0.50% of the average daily net assets attributable to Class R shares for distribution services. Reflected on the Statement of Assets and Liabilities is $14,452 in distribution fees payable to the Distributor at April 30, 2024.
The Fund also has adopted a separate service plan for Class R shares (the “Service Plan”). The Service Plan authorizes the Fund to pay securities
Pioneer High Yield Fund | Semiannual Report | 4/30/2456
dealers, plan administrators or other service organizations that agree to provide certain services to retirement plans or plan participants holding shares of the Fund a service fee of up to 0.25% of the Fund’s average daily net assets attributable to Class R shares held by such plans.
In addition, redemptions of Class A and Class C shares may be subject to a contingent deferred sales charge (“CDSC”). A CDSC of 1.00% may be imposed on redemptions of certain net asset value purchases of Class A shares within 12 months of purchase. Redemptions of Class C shares within 12 months of purchase are subject to a CDSC of 1.00% based on the lower of cost or market value of shares being redeemed. Shares purchased as part of an exchange remain subject to any CDSC that applied to the original purchase of those shares. There is no CDSC for Class R or Class Y shares. Proceeds from the CDSCs are paid to the Distributor. For the six months ended April 30, 2024, CDSCs in the amount of $215 were paid to the Distributor.
6. Line of Credit Facility
The Fund, along with certain other funds in the Pioneer Family of Funds, participates in a committed, unsecured revolving line of credit (“credit facility”). Borrowings are used solely for temporary or emergency purposes. The Fund may borrow up to the lesser of the amount available under the credit facility or the limits set for borrowing by the Fund’s prospectus and the 1940 Act. Until January 31, 2024, the Fund participated in a credit facility in the amount of $380 million. Under such credit facility, depending on the type of loan, interest on borrowings was payable at the Secured Overnight Financing Rate (“SOFR”) plus a credit spread. The Fund also paid both an upfront fee and an annual commitment fee to participate in the credit facility. The upfront fee in the amount of 0.15% of the total credit facility and the commitment fee in the amount of 0.30% of the daily unused portion of each lender’s commitment were allocated among participating funds based on an allocation schedule set forth in the credit facility. Effective January 31, 2024, the Fund participates in a credit facility in the amount of $250 million, the upfront fee with respect to the credit facility is 0.05% of the total credit facility, and the commitment fee with respect to the credit facility is 0.20% of the daily unused portion of each lender’s commitment. For the six months ended April 30, 2024, the Fund had no borrowings under the credit facility.
7. Master Netting Agreements
The Fund has entered into an International Swaps and Derivatives Association, Inc. Master Agreement (“ISDA Master Agreement”) or similar agreement with substantially all of its derivative counterparties. An ISDA Master Agreement is a bilateral agreement between the Fund and a
57Pioneer High Yield Fund | Semiannual Report | 4/30/24
counterparty that governs the trading of certain Over the Counter (“OTC”) derivatives and typically contains, among other things, close-out and set- off provisions which apply upon the occurrence of an event of default and/or a termination event as defined under the relevant ISDA Master Agreement. The ISDA Master Agreement may also give a party the right to terminate all transactions traded under such agreement if, among other things, there is deterioration in the credit quality of the other party.
Upon an event of default or a termination of the ISDA Master Agreement, the non-defaulting party has the right to close out all transactions under such agreement and to net amounts owed under each transaction to determine one net amount payable by one party to the other. The right to close out and net payments across all transactions under the ISDA Master Agreement could result in a reduction of the Fund’s credit risk to its counterparty equal to any amounts payable by the Fund under the applicable transactions, if any. However, the Fund’s right to set-off may be restricted or prohibited by the bankruptcy or insolvency laws of the particular jurisdiction to which each specific ISDA Master Agreement of each counterparty is subject.
The collateral requirements for derivatives transactions under an ISDA Master Agreement are governed by a credit support annex to the ISDA Master Agreement. Collateral requirements are generally determined at the close of business each day and are typically based on changes in market values for each transaction under an ISDA Master Agreement and netted into one amount for such agreement. Generally, the amount of collateral due from or to a counterparty is subject to threshold (a “minimum transfer amount”) before a transfer is required, which may vary by counterparty. Collateral pledged for the benefit of the Fund and/or counterparty is held in segregated accounts by the Fund’s custodian and cannot be sold, re- pledged, assigned or otherwise used while pledged. Cash that has been segregated to cover the Fund’s collateral obligations, if any, will be reported separately on the Statement of Assets and Liabilities as “Swaps collateral.” Securities pledged by the Fund as collateral, if any, are identified as such in the Schedule of Investments.
Pioneer High Yield Fund | Semiannual Report | 4/30/2458
Financial instruments subject to an enforceable master netting agreement, such as an ISDA Master Agreement, have been offset on the Statement of Assets and Liabilities. The following charts show gross assets of the Fund as of April 30, 2024.
| Counterparty | Derivative
Assets
Subject to
Master Netting
Agreement | Derivatives
Available
for Offset | Non-Cash
Collateral
Received(a) | Cash
Collateral
Received(a) | Net Amount
of Derivative
Assets(b) |
| State Street Bank & Trust Co. | $185,580 | $ — | $ — | $ — | $185,580 |
| Total | $185,580 | $— | $— | $— | $185,580 |
(a) The amount presented here may be less than the total amount of collateral received/pledged as the net amount of derivative assets and liabilities cannot be less than $0.
(b) Represents the net amount due from the counterparty in the event of default.
8. Additional Disclosures about Derivative Instruments and Hedging Activities
The Fund’s use of derivatives may enhance or mitigate the Fund’s exposure to the following risks:
Interest rate risk relates to the fluctuations in the value of interest-bearing securities due to changes in the prevailing levels of market interest rates.
Credit risk relates to the ability of the issuer of a financial instrument to make further principal or interest payments on an obligation or commitment that it has to the Fund.
Foreign exchange rate risk relates to fluctuations in the value of an asset or liability due to changes in currency exchange rates.
Equity risk relates to the fluctuations in the value of financial instruments as a result of changes in market prices (other than those arising from interest rate risk or foreign exchange rate risk), whether caused by factors specific to an individual investment, its issuer, or all factors affecting all instruments traded in a market or market segment.
Commodity risk relates to the risk that the value of a commodity or commodity index will fluctuate based on increases or decreases in the commodities market and factors specific to a particular industry or commodity.
59Pioneer High Yield Fund | Semiannual Report | 4/30/24
The fair value of open derivative instruments (not considered to be hedging instruments for accounting disclosure purposes) by risk exposure at April 30, 2024, was as follows:
Statement of Assets
and Liabilities | Interest
Rate Risk | Credit
Risk | Foreign
Exchange
Rate Risk | Equity
Risk | Commodity
Risk |
| Assets | | | | | |
| Unrealized appreciation on forward foreign currency exchange contracts | $ — | $ — | $185,580 | $ — | $ — |
| Centrally cleared swap contracts† | — | 215,812 | — | — | — |
| Total Value | $— | $215,812 | $185,580 | $— | $— |
| | |
| † | Includes cumulative unrealized appreciation (depreciation) of centrally cleared swap contracts as reported in the Schedule of Investments. Only net variation margin is reported within the receivables and/or payables on the Statement of Assets and Liabilities. |
The effect of derivative instruments (not considered to be hedging instruments for accounting disclosure purposes) on the Statement of Operations by risk exposure at April 30, 2024 was as follows:
| Statement of Operations | Interest
Rate Risk | Credit
Risk | Foreign
Exchange
Rate Risk | Equity
Risk | Commodity
Risk |
| Net Realized Gain (Loss) on | | | | | |
| Forward foreign currency exchange contracts | $ — | $ — | $235,066 | $ — | $ — |
| Swap contracts | — | (2,474,367) | — | — | — |
| Total Value | $— | $(2,474,367) | $ 235,066 | $— | $— |
| Change in Net Unrealized Appreciation (Depreciation) on | | | | | |
| Forward foreign currency exchange contracts | $ — | $ — | $185,580 | $ — | $ — |
| Swap contracts | — | 15,997 | — | — | — |
| Total Value | $— | $ 15,997 | $185,580 | $— | $— |
9. Reorganization Information
Effective December 8, 2023, Pioneer Global High Yield Fund was reorganized with and into the Fund (the "Reorganization"). The purpose of this Reorganization was to combine two funds managed by the Adviser with similar investment objectives and strategies.
This tax-free reorganization was accomplished by a tax-free exchange of the assets and liabilities of Pioneer Global High Yield Fund for shares of the Fund. Neither the Funds nor their shareowners realized gain (loss) as a direct result of the Reorganization. Shareowners holding Class A, C and Y
Pioneer High Yield Fund | Semiannual Report | 4/30/2460
shares of Pioneer Global High Yield Fund received Class A, C and Y shares of the Fund, respectively, in the Reorganization.
For financial reporting purposes, assets received and shares issued by the Fund were recorded at net asset value, however, the cost basis of the investments received from Pioneer Global High Yield Fund was carried forward to align ongoing reporting of the Fund’s realized and unrealized gains and losses with amounts distributable to shareowners for tax reporting purposes.
The following charts show the details of the Reorganization as of Reorganization Date:
| | Pioneer Global
High Yield Fund
(Pre-Reorganization) | Pioneer High
Yield Fund
(Pre-Reorganization) | Pioneer High
Yield Fund
(Post-Reorganization) |
| Net Assets | | | |
| Class A | $91,889,483 | $291,949,699 | $383,839,182 |
| Class C | 2,079,049 | 5,852,171 | 7,931,220 |
| Class R | N/A | 7,410,570 | 7,410,570 |
| Class Y | 32,968,072 | 141,063,130 | 174,031,202 |
| Total Net Assets | $ 126,936,604 | $ 446,275,570 | $ 573,212,174 |
| Shares Outstanding | | | |
| Class A | 12,724,511 | 35,042,078 | 46,073,298 |
| Class C | 288,000 | 686,654 | 930,673 |
| Class R | N/A | 784,481 | 784,481 |
| Class Y | 4,654,888 | 16,911,469 | 20,864,496 |
| Total Shares Outstanding | 17,667,400 | 53,424,682 | 68,652,948 |
| Fund Total | | | |
| Unrealized Depreciation | ($20,523,483) | ($36,284,190) | ($56,807,673) |
| | | | |
| | | Exchange
Ratio | Shares Issued in
Reorganization |
| Class A | | 0.8669 | 11,031,220 |
| Class C | | 0.8473 | 244,019 |
| Class R | | N/A | N/A |
| Class Y | | 0.8492 | 3,953,027 |
Assuming the Reorganization had been completed on November 1, 2023, the beginning of the Fund’s current fiscal year, the results of operations for the six-months ended April 30, 2024, would have been as follows:
| Net Investment Income (Loss) | $3,743,346 |
| Net Realized and Unrealized Gains | 42,430,498 |
| Net increase in net assets resulting from operations | $46,173,844 |
Because the combined investment portfolio has been managed as a single integrated portfolio since the Reorganization was completed, it is not practical to separate the amounts of revenue and earnings of Pioneer Global
61Pioneer High Yield Fund | Semiannual Report | 4/30/24
High Yield Fund that have been included in the Fund’s Statement of Operations since the Reorganization Date.
10. Unfunded Loan Commitments
The Fund may enter into unfunded loan commitments. Unfunded loan commitments may be partially or wholly unfunded. During the contractual period, the Fund is obliged to provide funding to the borrower upon demand. A fee is earned by the Fund on the unfunded loan commitment and is recorded as interest income on the Statement of Operations. Unfunded loan commitments are fair valued in accordance with the valuation policy described in Note 1A and unrealized appreciation or depreciation, if any, is recorded on the Statement of Assets and Liabilities.
As of April 30, 2024, the Fund had no unfunded loan commitments outstanding.
Pioneer High Yield Fund | Semiannual Report | 4/30/2462
Additional Information
On March 25, 2024, Ernst & Young LLP (the “Prior Auditor”) resigned as the independent registered public accounting firm of Pioneer High Yield Fund (the “Fund”) due to the independence considerations resulting from a change of the independent registered public accounting firm of a related party. The Prior Auditor’s reports on the financial statements of the Fund for the past two fiscal years, the years ended October 31, 2023 and October 31, 2022, did not contain an adverse opinion or disclaimer of opinion, and were not qualified or modified as to uncertainty, audit scope or accounting principles.
During the last two fiscal year-ends and the subsequent interim period through March 25, 2024, there were no (1) disagreements with the Prior Auditor on any matter of accounting principles or practices, financial statement disclosure, or auditing scope or procedure, which disagreements, if not resolved to the Prior Auditor’s satisfaction, would have caused it to make reference to that matter in connection with its reports on the Fund’s financial statements for such periods; or (2) “reportable events” related to the Fund, as that term is defined in Item 304 (a)(1)(v) of Regulation S-K under the Securities Exchange Act of 1934.
On March 25, 2024, the Audit Committee of the Board approved, and on March 25, 2024, the Board approved, Deloitte & Touche LLP as the independent registered accounting firm of the Fund for fiscal periods ending after March 25, 2024.
63Pioneer High Yield Fund | Semiannual Report | 4/30/24
Trustees, Officers and Service Providers
Trustees
Thomas J. Perna, Chairman
John E. Baumgardner, Jr.
Diane Durnin
Benjamin M. Friedman
Lisa M. Jones
Craig C. MacKay
Lorraine H. Monchak
Marguerite A. Piret*
Fred J. Ricciardi
Officers
Lisa M. Jones, President and
Chief Executive Officer
Marco Pirondini**
Executive Vice President
Anthony J. Koenig, Jr., Treasurer
and Chief Financial and
Accounting Officer
Christopher J. Kelley, Secretary and
Chief Legal Officer
Investment Adviser and Administrator
Amundi Asset Management US, Inc.
Custodian and Sub-Administrator
The Bank of New York Mellon Corporation
Independent Registered Public Accounting Firm
Deloitte & Touche LLP
Principal Underwriter
Amundi Distributor US, Inc.
Legal Counsel
Morgan, Lewis & Bockius LLP
Transfer Agent
BNY Mellon Investment Servicing (US) Inc.
Proxy Voting Policies and Procedures of the Fund are available without charge, upon request, by calling our toll free number (1-800-225-6292). Information regarding how the Fund voted proxies relating to portfolio securities during the most recent 12-month period ended June 30 is publicly available to shareholders at www.amundi.com/us. This information is also available on the Securities and Exchange Commission’s web site at www.sec.gov.
* Ms. Piret became a non-voting Advisory Trustee of the Pioneer Funds effective January 22, 2024.
** Marco Pirondini was appointed to serve as an Executive Vice President of the Fund and Chief Investment Officer of Amundi US, Inc., effective January 1, 2024.
Pioneer High Yield Fund | Semiannual Report | 4/30/2464
How to Contact Amundi
We are pleased to offer a variety of convenient ways for you to contact us for assistance or information.
Call us for:
Account Information, including existing accounts,
new accounts, prospectuses, applications
and service forms
1-800-225-6292
FactFoneSM for automated fund yields, prices,
account information and transactions
1-800-225-4321
| Retirement plans information | 1-800-622-0176 |
Write to us:
Amundi
P.O. Box 534427
Pittsburgh, PA 15253-4427
| Our toll-free fax | 1-800-225-4240 |
| Our internet e-mail address | us.askamundi@amundi.com
(for general questions about Amundi only) |
Visit our web site: www.amundi.com/us
This report must be preceded or accompanied by a prospectus.
The Fund files a complete schedule of portfolio holdings with the Securities and Exchange Commission for the first and third quarters of each fiscal year as an exhibit to its reports on Form N-PORT. Shareholders may view the filed Form N-PORT by visiting the Commission’s web site at https://www.sec.gov.
Amundi Asset Management US, Inc.
60 State Street
Boston, MA 02109
www.amundi.com/us
Securities offered through Amundi Distributor US, Inc.
60 State Street, Boston, MA 02109
Underwriter of Pioneer Mutual Funds, Member SIPC
© 2024 Amundi Asset Management US, Inc. 19383-18-0624
ITEM 2. CODE OF ETHICS.
(a) Disclose whether, as of the end of the period covered by the report, the registrant has adopted a code of ethics that applies to the registrant’s principal executive officer, principal financial officer, principal accounting officer or controller, or persons performing similar functions, regardless of whether these individuals are employed by the registrant or a third party. If the registrant has not adopted such a code of ethics, explain why it has not done so.
The registrant has adopted, as of the end of the period covered by this report, a code of ethics that applies to the registrant’s principal executive officer, principal financial officer, principal accounting officer and controller.
(b) For purposes of this Item, the term “code of ethics” means written standards that are reasonably designed to deter wrongdoing and to promote:
(1) Honest and ethical conduct, including the ethical handling of actual or apparent conflicts of interest between personal and professional relationships;
(2) Full, fair, accurate, timely, and understandable disclosure in reports and documents that a registrant files with, or submits to, the Commission and in other public communications made by the registrant;
(3) Compliance with applicable governmental laws, rules, and regulations;
(4) The prompt internal reporting of violations of the code to an appropriate person or persons identified in the code; and
(5) Accountability for adherence to the code.
(c) The registrant must briefly describe the nature of any amendment, during the period covered by the report, to a provision of its code of ethics that applies to the registrant’s principal executive officer, principal financial officer, principal accounting officer or controller, or persons performing similar functions, regardless of whether these individuals are employed by the registrant or a third party, and that relates to any element of the code of ethics definition enumerated in paragraph (b) of this Item. The registrant must file a copy of any such amendment as an exhibit pursuant to Item 10(a), unless the registrant has elected to satisfy paragraph (f) of this Item by posting its code of ethics on its website pursuant to paragraph (f)(2) of this Item, or by undertaking to provide its code of ethics to any person without charge, upon request, pursuant to paragraph (f)(3) of this Item.
The registrant has made no amendments to the code of ethics during the period covered by this report.
(d) If the registrant has, during the period covered by the report, granted a waiver, including an implicit waiver, from a provision of the code of ethics to the registrant’s principal executive officer, principal financial officer, principal accounting officer or controller, or persons performing similar functions, regardless of whether these individuals are employed by the registrant or a third party, that relates to one or more of the items set forth in paragraph (b) of this Item, the registrant must briefly describe the nature of the waiver, the name of the person to whom the waiver was granted, and the date of the waiver.
Not applicable.
(e) If the registrant intends to satisfy the disclosure requirement under paragraph (c) or (d) of this Item regarding an amendment to, or a waiver from, a provision of its code of ethics that applies to the registrant’s principal executive officer, principal financial officer, principal accounting officer or controller, or persons performing similar functions and that relates to any element of the code of ethics definition enumerated in paragraph (b) of this Item by posting such information on its Internet website, disclose the registrant’s Internet address and such intention.
Not applicable.
(f) The registrant must:
(1) File with the Commission, pursuant to Item 12(a)(1), a copy of its code of ethics that applies to the registrant’s principal executive officer, principal financial officer, principal accounting officer or controller, or persons performing similar functions, as an exhibit to its annual report on this Form N-CSR (see attachment);
(2) Post the text of such code of ethics on its Internet website and disclose, in its most recent report on this Form N-CSR, its Internet address and the fact that it has posted such code of ethics on its Internet website; or
(3) Undertake in its most recent report on this Form N-CSR to provide to any person without charge, upon request, a copy of such code of ethics and explain the manner in which such request may be made. See Item 10(2)
ITEM 3. AUDIT COMMITTEE FINANCIAL EXPERT.
(a) (1) Disclose that the registrant’s Board of Trustees has determined that the registrant either:
(i) Has at least one audit committee financial expert serving on its audit committee; or
(ii) Does not have an audit committee financial expert serving on its audit committee.
The registrant’s Board of Trustees has determined that the registrant has at least one audit committee financial expert.
(2) If the registrant provides the disclosure required by paragraph (a)(1)(i) of this Item, it must disclose the name of the audit committee financial expert and whether that person is “independent.” In order to be considered “independent” for purposes of this Item, a member of an audit committee may not, other than in his or her capacity as a member of the audit committee, the Board of Trustees, or any other board committee:
(i) Accept directly or indirectly any consulting, advisory, or other compensatory fee from the issuer; or
(ii) Be an “interested person” of the investment company as defined in Section 2(a)(19) of the Act (15 U.S.C. 80a-2(a)(19)).
Mr. Fred J. Ricciardi, an independent Trustee, is such an audit committee financial expert.
(3) If the registrant provides the disclosure required by paragraph (a)(1) (ii) of this Item, it must explain why it does not have an audit committee financial expert.
Not applicable.
ITEM 4. PRINCIPAL ACCOUNTANT FEES AND SERVICES.
(a) Disclose, under the caption AUDIT FEES, the aggregate fees billed for each of the last two fiscal years for professional services rendered by the principal accountant for the audit of the registrant’s annual financial statements or services that are normally provided by the accountant in connection with statutory and regulatory filings or engagements for those fiscal years.
N/A
(b) Disclose, under the caption AUDIT-RELATED FEES, the aggregate fees billed in each of the last two fiscal years for assurance and related services by the principal accountant that are reasonably related to the performance of the audit of the registrant’s financial statements and are not reported under paragraph (a) of this Item. Registrants shall describe the nature of the services comprising the fees disclosed under this category.
N/A
(c) Disclose, under the caption TAX FEES, the aggregate fees billed in each of the last two fiscal years for professional services rendered by the principal accountant for tax compliance, tax advice, and tax planning. Registrants shall describe the nature of the services comprising the fees disclosed under this category.
N/A
(d) Disclose, under the caption ALL OTHER FEES, the aggregate fees billed in each of the last two fiscal years for products and services provided by the principal accountant, other than the services reported in paragraphs (a) through (c) of this Item. Registrants shall describe the nature of the services comprising the fees disclosed under this category.
N/A
(e) (1) Disclose the audit committee’s pre-approval policies and procedures described in paragraph (c)(7) of Rule 2-01 of Regulation S-X.
PIONEER FUNDS
APPROVAL OF AUDIT, AUDIT-RELATED, TAX AND OTHER SERVICES
PROVIDED BY THE INDEPENDENT AUDITOR
SECTION I—POLICY PURPOSE AND APPLICABILITY
The Pioneer Funds recognize the importance of maintaining the independence of their outside auditors. Maintaining independence is a shared responsibility involving Amundi Asset Management US, Inc., the audit committee and the independent auditors.
The Funds recognize that a Fund’s independent auditors: 1) possess knowledge of the Funds, 2) are able to incorporate certain services into the scope of the audit, thereby avoiding redundant work, cost and disruption of Fund personnel and processes, and 3) have expertise that has value to the Funds. As a result, there are situations where it is desirable to use the Fund’s independent auditors for services in addition to the annual audit and where the potential for conflicts of interests are minimal. Consequently, this policy, which is intended to comply with Rule 210.2-01(C)(7), sets forth guidelines and procedures to be followed by the Funds when retaining the independent audit firm to perform audit, audit-related tax and other services under those circumstances, while also maintaining independence.
Approval of a service in accordance with this policy for a Fund shall also constitute approval for any other Fund whose pre-approval is required pursuant to Rule 210.2-01(c)(7)(ii).
In addition to the procedures set forth in this policy, any non-audit services that may be provided consistently with Rule 210.2-01 may be approved by the Audit Committee itself and any pre-approval that may be waived in accordance with Rule 210.2-01(c)(7)(i)(C) is hereby waived.
Selection of a Fund’s independent auditors and their compensation shall be determined by the Audit Committee and shall not be subject to this policy.
SECTION II—POLICY
| | | | |
SERVICE CATEGORY | | SERVICE CATEGORY DESCRIPTION | | SPECIFIC PRE-APPROVED SERVICE
SUBCATEGORIES |
| I. AUDIT SERVICES | | Services that are directly related to performing the independent audit of the Funds | | • Accounting research assistance • SEC consultation, registration statements, and reporting • Tax accrual related matters • Implementation of new accounting standards • Compliance letters (e.g. rating agency letters) • Regulatory reviews and assistance regarding financial matters • Semi-annual reviews (if requested) • Comfort letters for closed end offerings |
| | |
| II. AUDIT-RELATED SERVICES | | Services which are not prohibited under Rule 210.2-01(C)(4) (the “Rule”) and are related extensions of the audit services support the audit, or use the knowledge/expertise gained from the audit procedures as a foundation to complete the project. In most cases, if the Audit-Related Services are not performed by the Audit firm, the scope of the Audit Services would likely increase. The Services are typically well-defined and governed by accounting professional standards (AICPA, SEC, etc.) | | • AICPA attest and agreed-upon procedures • Technology control assessments • Financial reporting control assessments • Enterprise security architecture assessment |
| | |
AUDIT COMMITTEE APPROVAL POLICY | | AUDIT COMMITTEE REPORTING POLICY |
• “One-time” pre-approval for the audit period for all pre-approved specific service subcategories. Approval of the independent auditors as auditors for a Fund shall constitute pre approval for these services. | | • A summary of all such services and related fees reported at each regularly scheduled Audit Committee meeting. |
| |
• “One-time” pre-approval for the fund fiscal year within a specified dollar limit for all pre-approved specific service subcategories | | • A summary of all such services and related fees (including comparison to specified dollar limits) reported quarterly. |
| | |
• Specific approval is needed to exceed the pre-approved dollar limit for these services (see general Audit Committee approval policy below for details on obtaining specific approvals) • Specific approval is needed to use the Fund’s auditors for Audit-Related Services not denoted as “pre-approved”, or to add a specific service subcategory as “pre-approved” | | |
SECTION III—POLICY DETAIL, CONTINUED
| | | | |
SERVICE CATEGORY | | SERVICE CATEGORY DESCRIPTION | | SPECIFIC PRE-APPROVED
SERVICE SUBCATEGORIES |
| III. TAX SERVICES | | Services which are not prohibited by the Rule, if an officer of the Fund determines that using the Fund’s auditor to provide these services creates significant synergy in the form of efficiency, minimized disruption, or the ability to maintain a desired level of confidentiality. | | • Tax planning and support • Tax controversy assistance • Tax compliance, tax returns, excise tax returns and support • Tax opinions |
| | |
AUDIT COMMITTEE APPROVAL POLICY | | AUDIT COMMITTEE REPORTING POLICY |
• “One-time” pre-approval for the fund fiscal year within a specified dollar limit | | • A summary of all such services and related fees (including comparison to specified dollar limits) reported quarterly. |
| |
• Specific approval is needed to exceed the pre-approved dollar limits for these services (see general Audit Committee approval policy below for details on obtaining specific approvals) • Specific approval is needed to use the Fund’s auditors for tax services not denoted as pre-approved, or to add a specific service subcategory as “pre-approved” | | |
SECTION III—POLICY DETAIL, CONTINUED
| | | | |
SERVICE CATEGORY | | SERVICE CATEGORY DESCRIPTION | | SPECIFIC PRE-APPROVED
SERVICE SUBCATEGORIES |
IV. OTHER SERVICES A. SYNERGISTIC, UNIQUE QUALIFICATIONS | | Services which are not prohibited by the Rule, if an officer of the Fund determines that using the Fund’s auditor to provide these services creates significant synergy in the form of efficiency, minimized disruption, the ability to maintain a desired level of confidentiality, or where the Fund’s auditors posses unique or superior qualifications to provide these services, resulting in superior value and results for the Fund. | | • Business Risk Management support • Other control and regulatory compliance projects |
| | |
AUDIT COMMITTEE APPROVAL POLICY | | AUDIT COMMITTEE REPORTING POLICY |
• “One-time” pre-approval for the fund fiscal year within a specified dollar limit | | • A summary of all such services and related fees (including comparison to specified dollar limits) reported quarterly. |
| |
• Specific approval is needed to exceed the pre-approved dollar limits for these services (see general Audit Committee approval policy below for details on obtaining specific approvals) | | |
| |
• Specific approval is needed to use the Fund’s auditors for “Synergistic” or “Unique Qualifications” Other Services not denoted as pre-approved to the left, or to add a specific service subcategory as “pre-approved” | | |
SECTION III—POLICY DETAIL, CONTINUED
| | | | |
SERVICE CATEGORY | | SERVICE CATEGORY DESCRIPTION | | SPECIFIC PROHIBITED
SERVICE SUBCATEGORIES |
| PROHIBITED SERVICES | | Services which result in the auditors losing independence status under the Rule. | | 1. Bookkeeping or other services related to the accounting records or financial statements of the audit client* |
| | |
| | | | 2. Financial information systems design and implementation* |
| | |
| | | | 3. Appraisal or valuation services, fairness* opinions, or contribution-in-kind reports |
| | |
| | | | 4. Actuarial services (i.e., setting actuarial reserves versus actuarial audit work)* |
| | |
| | | | 5. Internal audit outsourcing services* |
| | |
| | | | 6. Management functions or human resources |
| | |
| | | | 7. Broker or dealer, investment advisor, or investment banking services |
| | |
| | | | 8. Legal services and expert services unrelated to the audit |
| | |
| | | | 9. Any other service that the Public Company Accounting Oversight Board determines, by regulation, is impermissible |
| | |
AUDIT COMMITTEE APPROVAL POLICY | | AUDIT COMMITTEE REPORTING POLICY |
• These services are not to be performed with the exception of the(*) services that may be permitted if they would not be subject to audit procedures at the audit client (as defined in rule 2-01(f)(4)) level the firm providing the service. | | • A summary of all services and related fees reported at each regularly scheduled Audit Committee meeting will serve as continual confirmation that has not provided any restricted services. |
GENERAL AUDIT COMMITTEE APPROVAL POLICY:
| | • | | For all projects, the officers of the Funds and the Fund’s auditors will each make an assessment to determine that any proposed projects will not impair independence. |
| | • | | Potential services will be classified into the four non-restricted service categories and the “Approval of Audit, Audit-Related, Tax and Other Services” Policy above will be applied. Any services outside the specific pre-approved service subcategories set forth above must be specifically approved by the Audit Committee. |
| | • | | At least quarterly, the Audit Committee shall review a report summarizing the services by service category, including fees, provided by the Audit firm as set forth in the above policy. |
(2) Disclose the percentage of services described in each of paragraphs (b) through (d) of this Item that were approved by the audit committee pursuant to paragraph (c)(7)(i)(C) of Rule 2-01 of Regulation S-X.
N/A
(f) If greater than 50 percent, disclose the percentage of hours expended on the principal accountants engagement to audit the registrant’s financial statements for the most recent fiscal year that were attributed to work performed by persons other than the principal accountant’s full-time, permanent employees.
N/A
(g) Disclose the aggregate non-audit fees billed by the registrants accountant for services rendered to the registrant, and rendered to the registrants investment adviser (not including any sub-adviser whose role is primarily portfolio management and is subcontracted with or overseen by another investment adviser), and any entity controlling, controlled by, or under common control with the adviser that provides ongoing services to the registrant for each of the last two fiscal years of the registrant.
N/A
(h) Disclose whether the registrants audit committee of the Board of Trustees has considered whether the provision of non-audit services that were rendered to the registrants investment adviser (not including any subadviser whose role is primarily portfolio management and is subcontracted with or overseen by another investment adviser), and any entity controlling, controlled by, or under common control with the investment adviser that provides ongoing services to the registrant that were not pre-approved pursuant to paragraph (c)(7)(ii) of Rule 2-01 of Regulation S-X is compatible with maintaining the principal accountant’s independence.
The Fund’s audit committee of the Board of Trustees has considered whether the provision of non-audit services that were rendered to the Affiliates (as defined) that were not pre- approved pursuant to paragraph (c)(7)(ii) of Rule 2-01 of Regulation S-X is compatible with maintaining the principal accountant’s independence.
(i) A registrant identified by the Commission pursuant to Section 104(i)(2)(A) of the Sarbanes-Oxley Act of 2002 (15 U.S.C. 7214(i)(2)(A)), as having retained, for the preparation of the audit report on its financial statements included in the Form NCSR, a registered public accounting firm that has a branch or office that is located in a foreign jurisdiction and that the Public Company Accounting Oversight Board has determined it is unable to inspect or investigate completely because of a position taken by an authority in the foreign jurisdiction must electronically submit to the Commission on a supplemental basis documentation that establishes that the registrant is not owned or controlled by a governmental entity in the foreign jurisdiction. The registrant must submit this documentation on or before the due date for this form. A registrant that is owned or controlled by a foreign governmental entity is not required to submit such documentation.
N/A
(j) A registrant that is a foreign issuer, as defined in 17 CFR 240.3b-4, identified by the Commission pursuant to Section 104(i)(2)(A) of the Sarbanes-Oxley Act of 2002 (15 U.S.C. 7214(i)(2)(A)), as having retained, for the preparation of the audit report on its financial statements included in the Form N-CSR, a registered public accounting firm that has a branch or office that is located in a foreign jurisdiction and that the Public Company Accounting Oversight Board has determined it is unable to inspect or investigate completely because of a position taken by an authority in the foreign jurisdiction, for each year in which the registrant is so identified, must provide the below disclosures. Also, any such identified foreign issuer that uses a variable-interest entity or any similar structure that results in additional foreign entities being consolidated in the financial statements of the registrant is required to provide the below disclosures for itself and its consolidated foreign operating entity or entities. A registrant must disclose:
(1) That, for the immediately preceding annual financial statement period, a registered public accounting firm that the PCAOB was unable to inspect or investigate completely, because of a position taken by an authority in the foreign jurisdiction, issued an audit report for the registrant;
N/A
(2) The percentage of shares of the registrant owned by governmental entities in the foreign jurisdiction in which the registrant is incorporated or otherwise organized;
N/A
(3) Whether governmental entities in the applicable foreign jurisdiction with respect to that registered public accounting firm have a controlling financial interest with respect to the registrant; N/A
(4) The name of each official of the Chinese Communist Party who is a member of the board of directors of the registrant or the operating entity with respect to the registrant;
N/A
(5) Whether the articles of incorporation of the registrant (or equivalent organizing document) contains any charter of the Chinese Communist Party, including the text of any such charter.
N/A
ITEM 5. AUDIT COMMITTEE OF LISTED REGISTRANTS
(a) If the registrant is a listed issuer as defined in Rule 10A-3 under the Exchange Act (17 CFR 240.10A-3), state whether or not the registrant has a separately-designated standing audit committee established in accordance with Section 3(a)(58)(A) of the Exchange Act (15 U.S.C. 78c(a)(58)(A)). If the registrant has such a committee, however designated, identify each committee member. If the entire board of directors is acting as the registrant’s audit committee as specified in Section 3(a)(58)(B) of the Exchange Act (15 U.S.C. 78c(a)(58)(B)), so state.
N/A
(b) If applicable, provide the disclosure required by Rule 10A-3(d) under the Exchange Act (17 CFR 240.10A-3(d)) regarding an exemption from the listing standards for audit committees.
N/A
ITEM 6. SCHEDULE OF INVESTMENTS.
File Schedule of Investments in securities of unaffiliated issuers as of the close of the reporting period as set forth in 210.1212 of Regulation S-X [17 CFR 210.12-12], unless the schedule is included as part of the report to shareholders filed under Item 1 of this Form.
Included in Item 1
ITEM 7. DISCLOSURE OF PROXY VOTING POLICIES AND PROCEDURES FOR CLOSED-END MANAGEMENT INVESTMENT COMPANIES.
A closed-end management investment company that is filing an annual report on this Form N-CSR must, unless it invests exclusively in non-voting securities, describe the policies and procedures that it uses to determine how to vote proxies relating to portfolio securities, including the procedures that the company uses when a vote presents a conflict between the interests of its shareholders, on the one hand, and those of the company’s investment adviser; principal underwriter; or any affiliated person (as defined in Section 2(a)(3) of the Investment Company Act of 1940 (15 U.S.C. 80a-2(a)(3)) and the rules thereunder) of the company, its investment adviser, or its principal underwriter, on the other. Include any policies and procedures of the company’s investment adviser, or any other third party, that the company uses, or that are used on the company’s behalf, to determine how to vote proxies relating to portfolio securities.
N/A
ITEM 8. PORTFOLIO MANAGERS OF CLOSED-END MANAGEMENT INVESTMENT COMPANIES.
(a) If the registrant is a closed-end management investment company that is filing an annual report on this Form N-CSR, provide the following information:
(1) State the name, title, and length of service of the person or persons employed by or associated with the registrant or an investment adviser of the registrant who are primarily responsible for the day-to-day management of the registrant’s portfolio (“Portfolio Manager”). Also state each Portfolio Manager’s business experience during the past 5 years.
N/A
ITEM 9. PURCHASES OF EQUITY SECURITIES BY CLOSED-END MANAGEMENT INVESTMENT COMPANY AND AFFILIATED PURCHASERS.
(a) If the registrant is a closed-end management investment company, in the following tabular format, provide the information specified in paragraph (b) of this Item with respect to any purchase made by or on behalf of the registrant or any affiliated purchaser, as defined in Rule 10b-18(a)(3) under the Exchange Act (17 CFR 240.10b-18(a)(3)), of shares or other units of any class of the registrant’s equity securities that is registered by the registrant pursuant to Section 12 of the Exchange Act (15 U.S.C. 781).
N/A
ITEM 10. SUBMISSION OF MATTERS TO A VOTE OF SECURITY HOLDERS.
Describe any material changes to the procedures by which shareholders may recommend nominees to the registrant’s board of directors, where those changes were implemented after the registrant last provided disclosure in response to the requirements of Item 407(c)(2)(iv) of Regulation S-R(17 CFR 229.407)(as required by Item 22(b)(15)) of Schedule 14A (17 CFR 240.14a-101), or this Item.
There have been no material changes to the procedures by which the shareholders may recommend nominees to the registrant’s board of directors since the registrant last provided disclosure in response to the requirements of Item 407(c)(2)(iv) of Regulation S-R of Schedule 14(A) in its definitive proxy statement, or this item.
ITEM 11. CONTROLS AND PROCEDURES.
(a) Disclose the conclusions of the registrant’s principal executive and principal financials officers, or persons performing similar functions, regarding the effectiveness of the registrant’s disclosure controls and procedures (as defined in Rule 30a-3(c) under the Act (17 CFR 270.30a-3(c))) as of a date within 90 days of the filing date of the report that includes the disclosure required by this paragraph, based on the evaluation of these controls and procedures required by Rule 30a-3(b) under the Act (17 CFR 270.30(a)-3(b) and Rules 13a-15(b) or 15d-15(b) under the Exchange Act (17 CFR 240.13a-15(b) or 240.15d-15(b)).
The registrant’s principal executive officer and principal financial officer have concluded that the registrant’s disclosure controls and procedures are effective based on the evaluation of these controls and procedures as of a date within 90 days of the filing date of this report.
(b) Disclose any change in the registrant’s internal control over financial reporting (as defined in Rule 30a-3(d) under the Act (17CFR 270.30a-3(d)) that occurred during the period covered by this report that has materially affected, or is reasonably likely to materially affect, the registrant’s internal control over financial reporting.
There were no significant changes in the registrant’s internal control over financial reporting that occurred during the period covered by this report that have materially affected, or are reasonably likely to materially affect, the registrant’s internal control over financial reporting.
Item 12. Disclosure of Securities Lending Activities for Closed-End Management Investment Companies.
(a) If the registrant is a closed-end management investment company, provide the following dollar amounts of income and compensation related to the securities lending activities of the registrant during its most recent fiscal year:
N/A
(1) Gross income from securities lending activities;
N/A
(2) All fees and/or compensation for each of the following securities lending activities and related services: any share of revenue generated by the securities lending program paid to the securities lending agent(s) (revenue split); fees paid for cash collateral management services (including fees deducted from a pooled cash collateral reinvestment vehicle) that are not included in the revenue split; administrative fees that are not included in the revenue split; fees for indemnification that are not included in the revenue split; rebates paid to borrowers; and any other fees relating to the securities lending program that are not included in the revenue split, including a description of those other fees;
N/A
(3) The aggregate fees/compensation disclosed pursuant to paragraph (2); and
N/A
(4) Net income from securities lending activities (i.e., the dollar amount in paragraph (1) minus the dollar amount in paragraph (3)).
If a fee for a service is included in the revenue split, state that the fee is included in the revenue split.
N/A
(b) If the registrant is a closed-end management investment company, describe the services provided to the registrant by the securities lending agent in the registrants most recent fiscal year.
N/A
ITEM 13. EXHIBITS.
(a) File the exhibits listed below as part of this Form. Letter or number the exhibits in the sequence indicated.
(1) Any code of ethics, or amendment thereto, that is the subject of the disclosure required by Item 2, to the extent that the registrant intends to satisfy the Item 2 requirements through filing of an exhibit.
(2) A separate certification for each principal executive officer and principal financial officer of the registrant as required byRule 30a-2(a) under the Act (17 CFR 270.30a-2(a)) , exactly as set forth below: Filed herewith.
(b) Certifications pursuant to Rule 30a-2(b) under the 1940 Act and Section 906 of the Sarbanes-Oxley Act of 2002 are attached hereto.
(3) Not applicable.
(4) Registrant’s Independent Public Accountant, attached as Exhibit 99.ACCT.
SIGNATURES
[See General Instruction F]
Pursuant to the requirements of the Securities Exchange Act of 1934 and the Investment Company Act of 1940, the registrant has duly caused this report to be signed on its behalf by the undersigned, thereunto duly authorized.
|
(Registrant) Pioneer High Yield Fund |
|
By (Signature and Title)* /s/ Lisa M. Jones |
Lisa M. Jones, Principal Executive Officer |
Date July 8, 2024 |
Pursuant to the requirements of the Securities Exchange Act of 1934 and the Investment Company Act of 1940, this report has been signed below by the following persons on behalf of the registrant and in the capacities and on the dates indicated.
|
| By (Signature and Title)* /s/ Lisa M. Jones |
| Lisa M. Jones, Principal Executive Officer |
Date July 8, 2024
|
| By (Signature and Title)* /s/ Anthony J. Koenig, Jr. |
| Anthony J. Koenig, Jr., Principal Financial Officer |
Date July 8, 2024
| * | Print the name and title of each signing officer under his or her signature. |