
Annual Meeting MutualFirst Financial, Inc. May 8 , 2013 Symbol: MFSF

MutualFirst Financial, Inc. David Heeter President and CEO

MutualFirst Financial, Inc. 123 rd Annual Meeting MutualBank

MutualFirst Financial, Inc. Introductions

MutualFirst Financial, Inc. Forward Looking Statement This presentation contains statements which constitute forward looking statements within the meaning of the Private Securities Litigation ReformAct of 1995. These statements may appear in a number of places in this presentation and include statements regarding the intent, belief, outlook, estimate or expectations of the company, its directors or its officers primarily with respect to future events and the future financial performance of the company, including but not limited to preliminary estimated ProForma combined financial information. Readers of this presentation are cautioned that any such forward looking statements are not guarantees of future events or performance and involve risk and uncertainties, and that actual results may differ materially from those in the forward looking statements as a result of various factors. These factors include, but are not limited to, the loss of deposits and loan demand to competitors; substantial changes in financial markets; changes in real estate values and the real estate market; regulatory changes; or other risk factors discussed in the latest SEC form 10 - k. The Company does not undertake – and specifically disclaims any obligation – to publicly release the result of any revisions which may be made to any forward - looking statements to reflect events or circumstances after the date of such statements or to reflect the occurrence of anticipated or unanticipated events.

MutualFirst Financial, Inc. Economy ▪ Slow National Improvement ▪ Challenged Global Economy ▪ Fragile Economic Indicators ▪ Very Stable / Low Interest Rate Environment

MutualFirst Financial, Inc. Interest Rates 0.00 1.00 2.00 3.00 4.00 5.00 6.00 Percent Fed Funds 10 Yr FHLMC 30 Yr

MutualFirst Financial, Inc. MutualBank Markets Full Service Financial Center MutualWealth Office Lending Office

MutualFirst Financial, Inc. MutualBank Markets Unemployment Statistics National – 7.6% State – 9.1% 2009 Average – 11.9% 2010 Average – 10.6% 2011 Average – 9.9% 2012 Average – 9.5% 2013 (March) – 9.8% Footprint – Above Average Footprint – Below Average Contiguous County – Above Average Contiguous County – Below Average 2009 Average – 11.9% 2010 Average – 10.6% 2011 Average – 9.9% 2012 Average – 9.5% 2013 (March) – 9.8%

MutualFirst Financial, Inc. 2012 Overview

MutualFirst Financial, Inc. John Bowles

MutualFirst Financial, Inc. Don Kyle

MutualFirst Financial, Inc. Chris Caldwell

MutualFirst Financial, Inc. Strategic Plan 2012 - 2014 ▪ Shareholder Value ▪ Credit Quality ▪ Earnings ▪ Capital ▪ Market Management

MutualFirst Financial, Inc. Charter Change Federal Reserve FDIC Indiana Department of Financial Institutions
MutualFirst Financial, Inc. 2012 Operational Focus Loans

MutualFirst Financial, Inc. Gross Loan Balances $0 $200,000 $400,000 $600,000 $800,000 $1,000,000 $1,200,000 2009 2010 2011 2012 Q1 2013 $1,062,215 $989,384 $901,900 $974,651 $962,641 *In Thousands
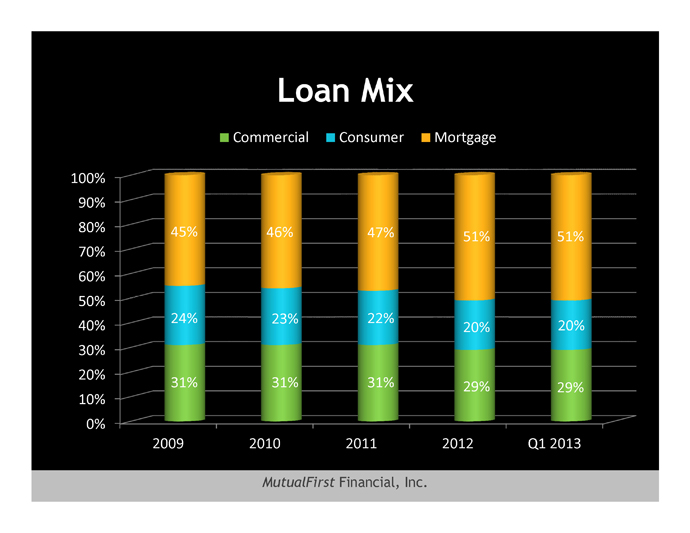
MutualFirst Financial, Inc. Loan Mix 0% 10% 20% 30% 40% 50% 60% 70% 80% 90% 100% 2009 2010 2011 2012 Q1 2013 31% 31% 31% 29% 29% 24% 23% 22% 20% 20% 45% 46% 47% 51% 51% Commercial Consumer Mortgage

MutualFirst Financial, Inc. 1 – 4 Family Residential Outstanding Balances $0 $100,000 $200,000 $300,000 $400,000 $500,000 $600,000 2009 2010 2011 2012 Q1 2013 $480,832 $468,502 $436,416 $507,725 $497,939 *In Thousands

MutualFirst Financial, Inc. Mortgage Loan Originations $0 $50,000 $100,000 $150,000 $200,000 $250,000 $300,000 2009 2010 2011 2012 Q1 2013 $258,608 $185,618 $143,572 $231,244 $34,784 $139,136 Annualized *In Thousands

MutualFirst Financial, Inc. Consumer Portfolio *In Thousands $0 $50,000 $100,000 $150,000 $200,000 $250,000 $300,000 2009 2010 2011 2012 Q1 2013 $259,788 $227,785 $202,384 $199,102 $197,041

MutualFirst Financial, Inc. Commercial Portfolio *In Thousands $100,000 $150,000 $200,000 $250,000 $300,000 $350,000 2009 2010 2011 2012 Q1 2013 $337,373 $313,931 $282,849 $288,848 $287,383

MutualFirst Financial, Inc. 2012 Operational Focus Deposits

MutualFirst Financial, Inc. Total Deposits $800,000 $850,000 $900,000 $950,000 $1,000,000 $1,050,000 $1,100,000 $1,150,000 $1,200,000 $1,250,000 $1,300,000 2009 2010 2011 2012 Q1 2013 $1,045,196 $1,121,569 $1,168,357 $1,184,009 $1,167,727 *In Thousands

MutualFirst Financial, Inc. Deposit Mix 0% 10% 20% 30% 40% 50% 60% 70% 2009 2010 2011 2012 38% 40% 45% 51% 62% 60% 55% 49% Short Term/Core Term

MutualFirst Financial, Inc. 2012 Operational Focus Earnings

MutualFirst Financial, Inc. Non - Interest Income *In Thousands $(2,000) $- $2,000 $4,000 $6,000 $8,000 $10,000 $12,000 $14,000 $16,000 $18,000 2009 2010 2011 2012 $(1,155) $(409) $2,682 $3,471 $2,622 $2,414 $2,650 $1,667 $7,458 $7,229 $6,987 $6,492 $3,047 $3,845 $3,691 $3,894 Other Non-Interest Income Mortgage Banking Revenue Service Fee Income Commissions $11,972 $13,079 $16,010 $15,524

MutualFirst Financial, Inc. Non - Interest Expense $5,000 $10,000 $15,000 $20,000 $25,000 $30,000 $35,000 $40,000 $45,000 2009 2010 2011 2012 Q1 2013 $43,326 $40,005 $40,416 $40,265 $9,913 $39,652 Annualized *In Thousands

MutualFirst Financial, Inc. 2012 Financial Highlights

MutualFirst Financial, Inc. Total Assets $1,000,000 $1,050,000 $1,100,000 $1,150,000 $1,200,000 $1,250,000 $1,300,000 $1,350,000 $1,400,000 $1,450,000 2009 2010 2011 2012 Q1 2013 $1,400,885 $1,406,902 $1,427,193 $1,422,458 $1,413,700 *In Thousands

MutualFirst Financial, Inc. 0.00% 10.00% 20.00% 30.00% 40.00% 50.00% 60.00% 70.00% 80.00% 90.00% Investments Loans Deposits Borrowings 23% 63% 82% 8% 20% 69% 83% 6% 2011 2012 Balance Sheet Structure *Percentage of Total Assets Assets Liabilities

MutualFirst Financial, Inc. Total Deposits *In Thousands $800,000 $850,000 $900,000 $950,000 $1,000,000 $1,050,000 $1,100,000 $1,150,000 $1,200,000 Q4 2010 Q1 2011 Q2 2011 Q3 2011 Q4 2011 Q1 2012 Q2 2012 Q3 2012 Q4 2012 Q1 2013 $1,184,009 $1,167,727 Deposits

MutualFirst Financial, Inc. Deposit Mix 0% 10% 20% 30% 40% 50% 60% 70% 2009 2010 2011 2012 38% 40% 45% 51% 62% 60% 55% 49% Short Term/Core Term

MutualFirst Financial, Inc. Loans Receivable $600,000 $650,000 $700,000 $750,000 $800,000 $850,000 $900,000 $950,000 $1,000,000 Q4 2010 Q1 2011 Q2 2011 Q3 2011 Q4 2011 Q1 2012 Q2 2012 Q3 2012 Q4 2012 Q1 2013 $962,641 $974,651 *In Thousands

MutualFirst Financial, Inc. Strategic Plan 2012 - 2014 ▪ Shareholder Value ▪ Credit Quality ▪ Earnings ▪ Capital ▪ Market Management

MutualFirst Financial, Inc. Strategic Plan 2012 - 2014 ▪ Shareholder Value ▪ Credit Quality ▪ Earnings ▪ Capital ▪ Market Management

MutualFirst Financial, Inc. Net Interest Margin 0.00% 0.50% 1.00% 1.50% 2.00% 2.50% 3.00% 3.50% Q4 2010 Q1 2011 Q2 2011 Q3 2011 Q4 2011 Q1 2012 Q2 2012 Q3 2012 Q4 2012 Q1 2013 3.07% 3.04%

MutualFirst Financial, Inc. Net Interest Income $0 $2,000 $4,000 $6,000 $8,000 $10,000 $12,000 Q4 2010 Q1 2011 Q2 2011 Q3 2011 Q4 2011 Q1 2012 Q2 2012 Q3 2012 Q4 2012 Q1 2013 $9,978 *In Thousands $10,111

MutualFirst Financial, Inc. Non - Interest Income *In Thousands $(2,000) $- $2,000 $4,000 $6,000 $8,000 $10,000 $12,000 $14,000 $16,000 $18,000 2009 2010 2011 2012 $(1,155) $(409) $2,682 $3,471 $2,622 $2,414 $2,650 $1,667 $7,458 $7,229 $6,987 $6,492 $3,047 $3,845 $3,691 $3,894 Other Non-Interest Income Mortgage Banking Revenue Service Fee Income Commissions $11,972 $13,079 $16,010 $15,524

MutualFirst Financial, Inc. Non - Interest Expense $4,000 $5,000 $6,000 $7,000 $8,000 $9,000 $10,000 $11,000 Q4 2010 Q1 2011 Q2 2011 Q3 2011 Q4 2011 Q1 2012 Q2 2012 Q3 2012 Q4 2012 Q1 2013 $9,913 *In Thousands $10,605

MutualFirst Financial, Inc. Strategic Plan 2011 - 2013 ▪ Shareholder Value ▪ Credit Quality ▪ Earnings ▪ Capital ▪ Market Management
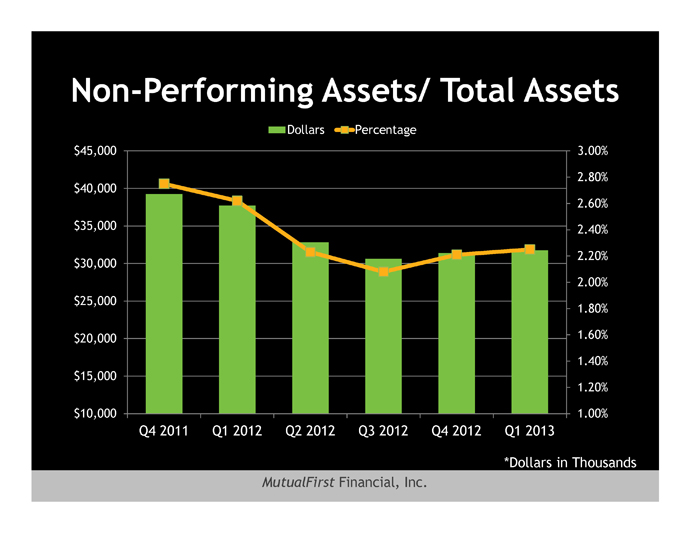
MutualFirst Financial, Inc. Non - Performing Assets/ Total Assets 1.00% 1.20% 1.40% 1.60% 1.80% 2.00% 2.20% 2.40% 2.60% 2.80% 3.00% $10,000 $15,000 $20,000 $25,000 $30,000 $35,000 $40,000 $45,000 Q4 2011 Q1 2012 Q2 2012 Q3 2012 Q4 2012 Q1 2013 Dollars Percentage *Dollars in Thousands

MutualFirst Financial, Inc. Delinquency (30 - 89 days) $5,000 $10,000 $15,000 $20,000 $25,000 $30,000 Q4 2011 Q1 2012 Q2 2012 Q3 2012 Q4 2012 Q1 2013 $16,958 $22,226 *In Thousands

MutualFirst Financial, Inc. Non - Performing Loans/ Total Loans 0.00% 0.50% 1.00% 1.50% 2.00% 2.50% 3.00% 3.50% Q4 2011 Q1 2012 Q2 2012 Q3 2012 Q4 2012 Q1 2013 2.40% 2.54%

MutualFirst Financial, Inc. Net Charge - Offs/ Average Loans and Allowance for Loan Loss/ Non - Performing Loans *Annualized NCO/AL* ALLL/NPL NCO/AL* ALLL/NPL 0.00% 10.00% 20.00% 30.00% 40.00% 50.00% 60.00% 70.00% 80.00% 0.00% 0.50% 1.00% 1.50% 2.00% 2.50% Q4 2010 Q1 2011 Q2 2011 Q3 2011 Q4 2011 Q1 2012 Q2 2012 Q3 2012 Q4 2012 Q1 2013

MutualFirst Financial, Inc. Strategic Plan 2012 - 2014 ▪ Shareholder Value ▪ Credit Quality ▪ Earnings ▪ Capital ▪ Market Management

MutualFirst Financial, Inc. 10.00% 11.00% 12.00% 13.00% 14.00% 15.00% 16.00% Q4 2010 Q1 2011 Q2 2011 Q3 2011 Q4 2011 Q1 2012 Q2 2012 Q3 2012 Q4 2012 Q1 2013 15.58% MutualBank Total Risk Based Capital

MutualFirst Financial, Inc. Partial SBLF Redemption Small Business Lending Fund

MutualFirst Financial, Inc. 10.00% 11.00% 12.00% 13.00% 14.00% 15.00% 16.00% Q4 2010 Q1 2011 Q2 2011 Q3 2011 Q4 2011 Q1 2012 Q2 2012 Q3 2012 Q4 2012 Q1 2013 Post SBLF 15.58% 14.78% MutualBank Total Risk Based Capital

MutualFirst Financial, Inc. What does the future hold?

MutualFirst Financial, Inc. 2013 Strategic Focus ▪ Branch Analysis ▪ Revenue Enhancement ▪ Credit Improvement ▪ Business Banking Campaign ▪ Checking Account Growth

MutualFirst Financial, Inc. Core Checking Growth -100 0 100 200 300 400 500 January February March April 500 Series 1

MutualFirst Financial, Inc. Price to Tangible Book Value $13.09 $15.40 $0.00 $2.00 $4.00 $6.00 $8.00 $10.00 $12.00 $14.00 $16.00 $18.00 12/31/2009 12/31/2010 12/31/2011 12/31/2012 3/31/2013 Tangible Book Value Tangible Book Value
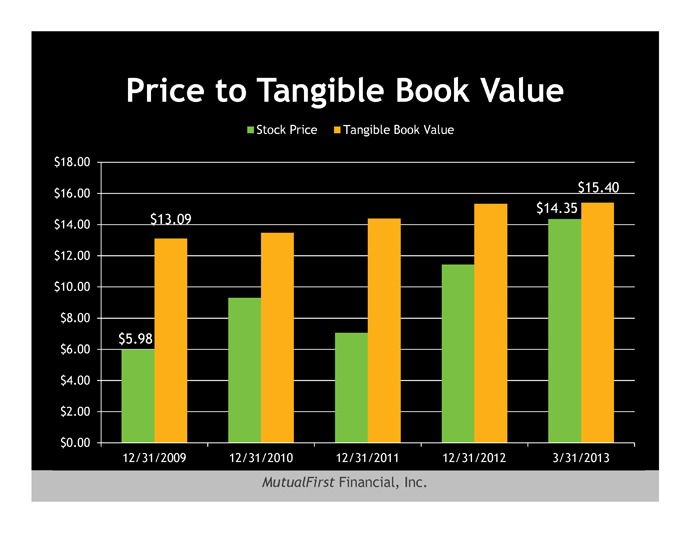
MutualFirst Financial, Inc. Price to Tangible Book Value $5.98 $14.35 $13.09 $15.40 $0.00 $2.00 $4.00 $6.00 $8.00 $10.00 $12.00 $14.00 $16.00 $18.00 12/31/2009 12/31/2010 12/31/2011 12/31/2012 3/31/2013 Stock Price Tangible Book Value

MutualFirst Financial, Inc. Price to Tangible Book Value $5.98 $14.35 $13.09 $15.40 46% 69% 49% 75% 93% 0% 20% 40% 60% 80% 100% 120% $0.00 $2.00 $4.00 $6.00 $8.00 $10.00 $12.00 $14.00 $16.00 $18.00 12/31/2009 12/31/2010 12/31/2011 12/31/2012 3/31/2013 Stock Price Tangible Book Value Price to Tangible Book

MutualFirst Financial, Inc. Thank You