
MutualFirst Financial, Inc. KBW 2013 Community Bank Investor Conference July 31, 2013 Symbol: MFSF
| 1 |

MutualFirst Financial, Inc. David Heeter President and CEO Chris Cook Chief Financial Officer
| 2 |
MutualFirst Financial, Inc. Forward Looking Statement This presentation contains statements which constitute forward looking statements within the meaning of the Private Securities Litigation Reform Act of 1995. These statements may appear in a number of places in this presentation and include statements regarding the intent, belief, outlook, estimate or expectations of the company, its directors or its officers primarily with respect to future events and the future financial performance of the company, including but not limited to preliminary estimated ProForma combined financial information. Readers of this presentation are cautioned that any such forward looking statements are not guarantees of future events or performance and involve risk and uncertainties, and that actual results may differ materially from those in the forward looking statements as a result of various factors. These factors include, but are not limited to, the loss of deposits and loan demand to competitors; substantial changes in financial markets; changes in real estate values and the real estate market; regulatory changes; or other risk factors discussed in the latest SEC form 10 - k. The Company does not undertake – and specifically disclaims any obligation – to publicly release the result of any revisions which may be made to any forward - looking statements to reflect events or circumstances after the date of such statements or to reflect the occurrence of anticipated or unanticipated events.
| 3 |

MutualFirst Financial, Inc. David Heeter President and CEO
| 4 |

MutualFirst Financial, Inc. MutualBank Today • Headquartered in Muncie, Indiana • 124 years of continuous operations • $1.4 billion in total assets • $983 million in gross loans • $1.154 billion in deposits • 406 staff members • 126,911 total accounts
| 5 |
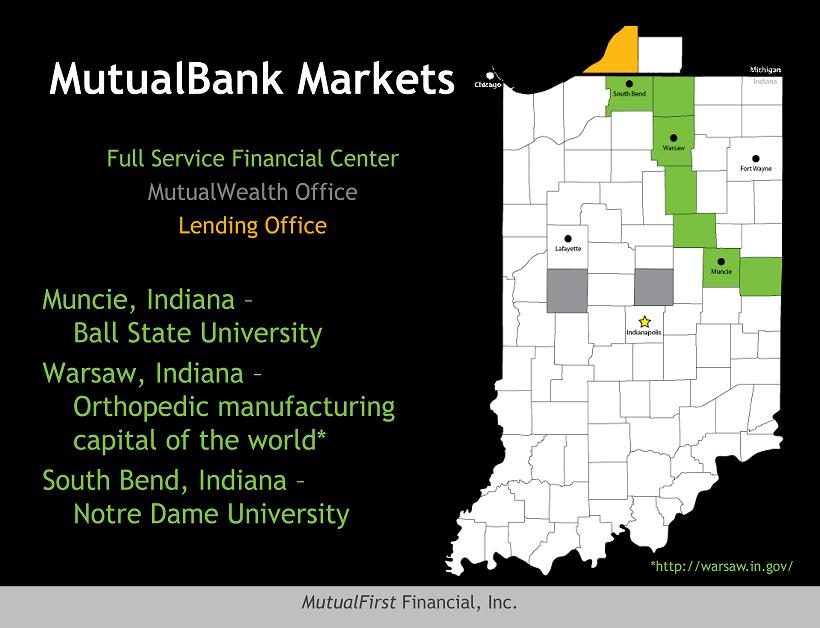
MutualFirst Financial, Inc. MutualBank Markets Muncie, Indiana – Ball State University Warsaw, Indiana – Orthopedic manufacturing capital of the world* South Bend, Indiana – Notre Dame University * http://warsaw.in.gov/ Full Service Financial Center MutualWealth Office Lending Office
| 6 |
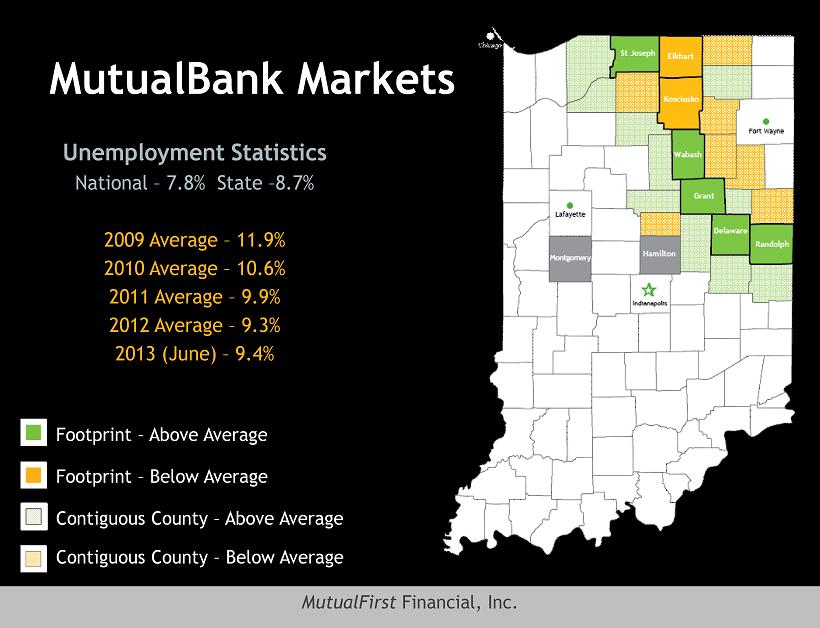
MutualFirst Financial, Inc. MutualBank Markets Unemployment Statistics National – 7.8% State – 8.7% 2009 Average – 11.9% 2010 Average – 10.6% 2011 Average – 9.9% 2012 Average – 9.3% 2013 (June) – 9.4% Footprint – Above Average Footprint – Below Average Contiguous County – Above Average Contiguous County – Below Average
| 7 |
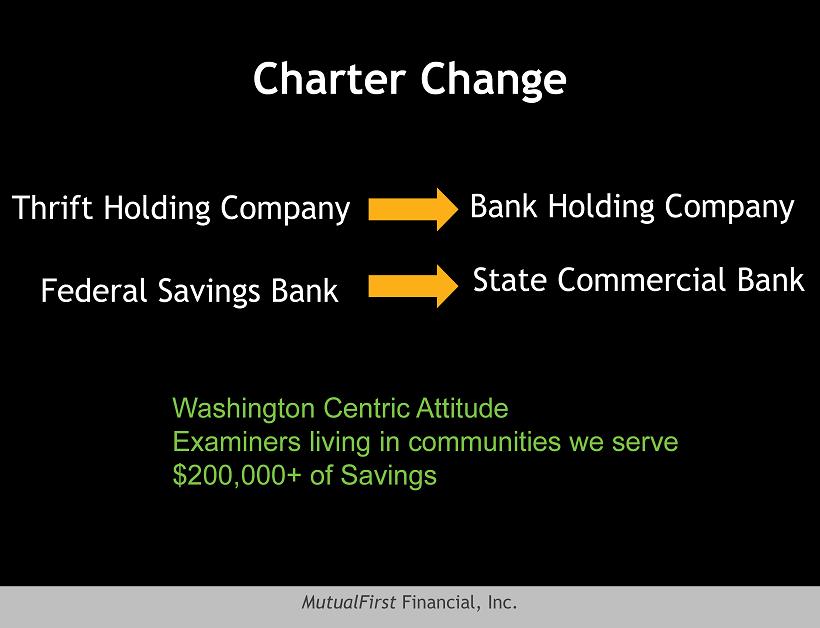
MutualFirst Financial, Inc. Charter Change Thrift Holding Company Bank Holding Company Washington Centric Attitude Examiners living in communities we serve $200,000+ of Savings Federal Savings Bank State Commercial Bank
| 8 |

MutualFirst Financial, Inc. Vision & Values
| 9 |

MutualFirst Financial, Inc. Vision We help people live better lives. Values Character Compassion Class Competition
| 10 |
MutualFirst Financial, Inc. Strategic Plan 2012 - 2014 To enhance Shareholder Value through: Credit Quality Earnings Capital Market Management
| 11 |

MutualFirst Financial, Inc. Chris Cook Chief Financial Officer
| 12 |

MutualFirst Financial, Inc. Earnings Per Share $- $0.10 $0.20 $0.30 $0.40 $0.50 $0.60 $0.70 $0.80 $0.90 2009 2010 2011 2012 YTD 2013 $0.82 $0.48
| 13 |
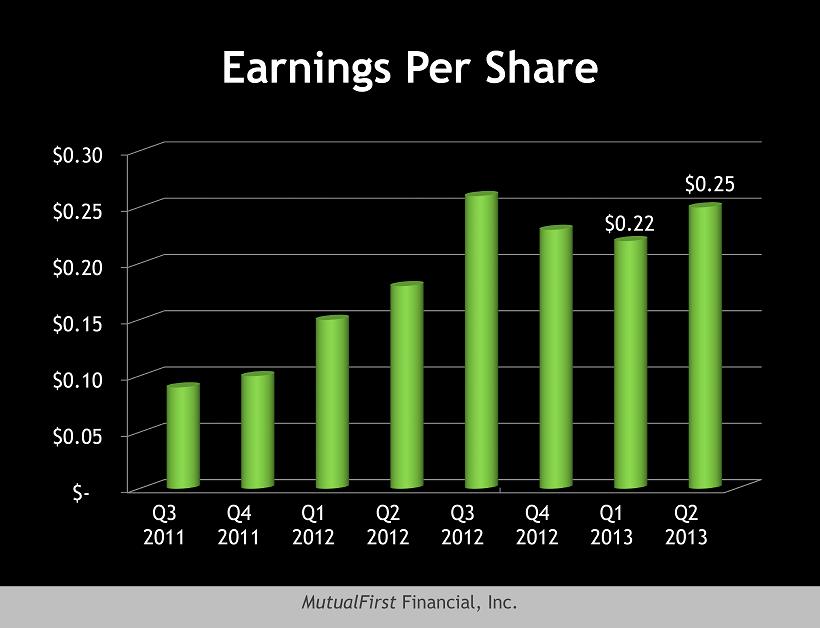
MutualFirst Financial, Inc. Earnings Per Share $- $0.05 $0.10 $0.15 $0.20 $0.25 $0.30 Q3 2011 Q4 2011 Q1 2012 Q2 2012 Q3 2012 Q4 2012 Q1 2013 Q2 2013 $0.22 $0.25
| 14 |
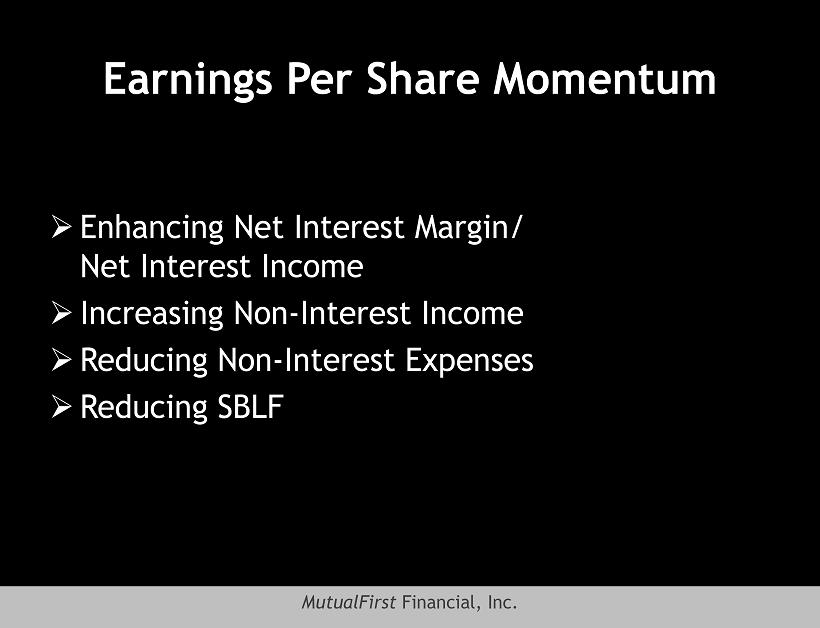
MutualFirst Financial, Inc. Earnings Per Share Momentum » Enhancing Net Interest Margin/ Net Interest Income » Increasing Non - Interest Income » Reducing Non - Interest Expenses » Reducing SBLF
| 15 |
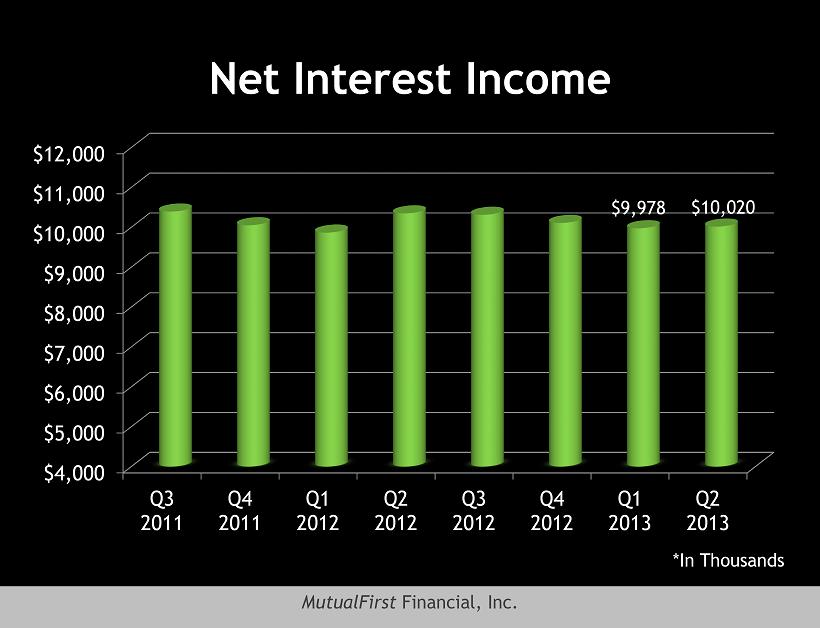
MutualFirst Financial, Inc. Net Interest Income $4,000 $5,000 $6,000 $7,000 $8,000 $9,000 $10,000 $11,000 $12,000 Q3 2011 Q4 2011 Q1 2012 Q2 2012 Q3 2012 Q4 2012 Q1 2013 Q2 2013 $9,978 $10,020 *In Thousands
| 16 |

MutualFirst Financial, Inc. Net Interest Margin 1.00% 1.50% 2.00% 2.50% 3.00% 3.50% 4.00% Q3 2011 Q4 2011 Q1 2012 Q2 2012 Q3 2012 Q4 2012 Q1 2013 Q2 2013 3.07% 3.10%
| 17 |
MutualFirst Financial, Inc. Enhancing Net Interest Margin/ Net Interest Income » Mix – Earning Assets/ Funding » Deposit Repricing » Continue to Improve Credit Quality
| 18 |
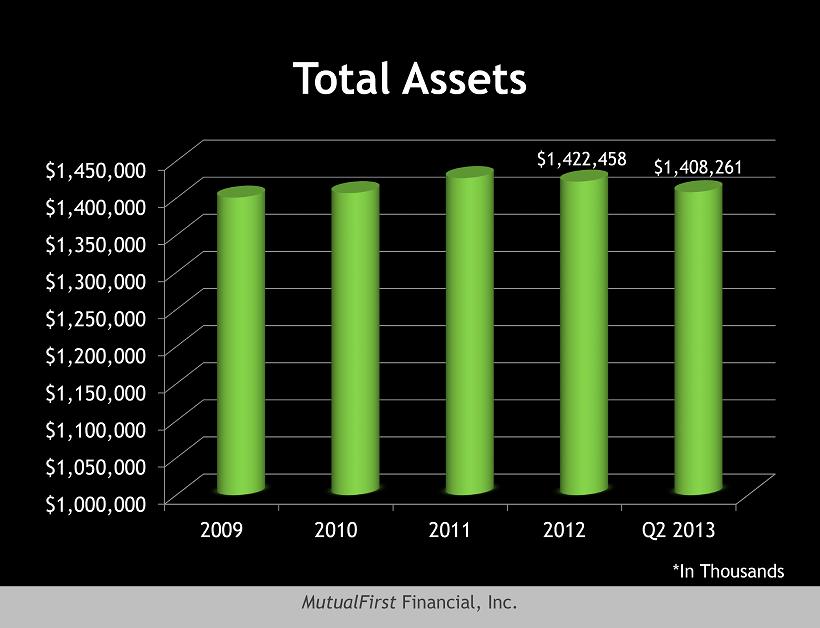
MutualFirst Financial, Inc. Total Assets $1,000,000 $1,050,000 $1,100,000 $1,150,000 $1,200,000 $1,250,000 $1,300,000 $1,350,000 $1,400,000 $1,450,000 2009 2010 2011 2012 Q2 2013 $1,422,458 $1,408,261 *In Thousands
| 19 |
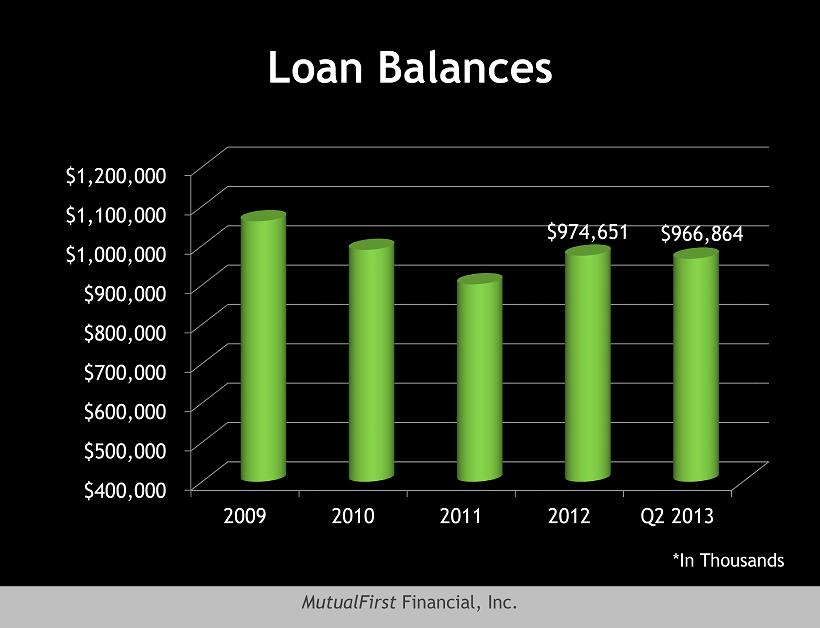
MutualFirst Financial, Inc. Loan Balances $400,000 $500,000 $600,000 $700,000 $800,000 $900,000 $1,000,000 $1,100,000 $1,200,000 2009 2010 2011 2012 Q2 2013 $974,651 $966,864 *In Thousands
| 20 |

MutualFirst Financial, Inc. Earning Asset Mix 11% 40% 21% 28% 2009 22% 39% 16% 23% 2013 Investments Commercial Mortgage Consumer
| 21 |

MutualFirst Financial, Inc. Total Deposits $800,000 $850,000 $900,000 $950,000 $1,000,000 $1,050,000 $1,100,000 $1,150,000 $1,200,000 $1,250,000 $1,300,000 2009 2010 2011 2012 Q2 2013 $1,184,009 $1,154,426 *In Thousands
| 22 |
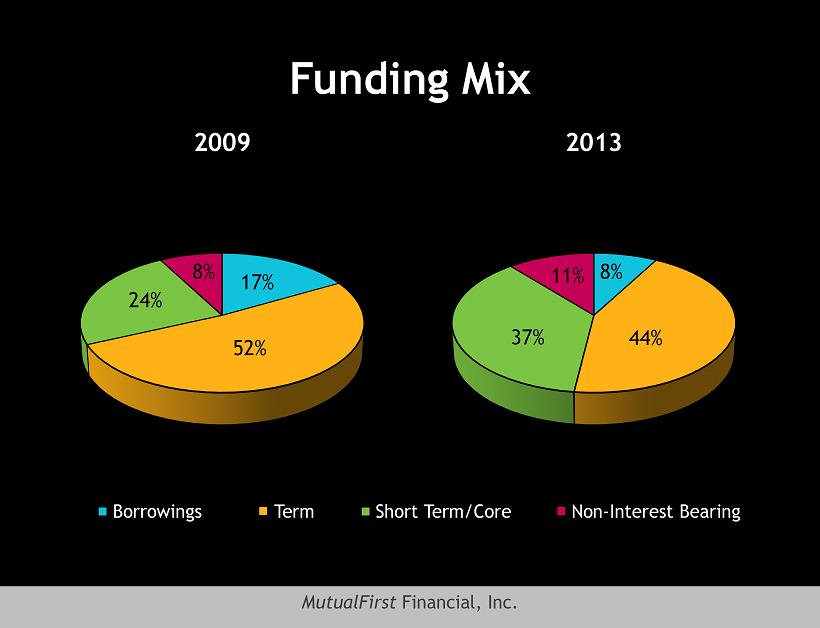
MutualFirst Financial, Inc. Funding Mix 17% 52% 24% 8% 2009 8% 44% 37% 11% 2013 Borrowings Term Short Term/Core Non - Interest Bearing
| 23 |
MutualFirst Financial, Inc. Deposit Repricing » 25% of deposits will reprice down over next 18 months.
| 24 |

MutualFirst Financial, Inc. Credit Quality 2.25% 1.77% 2.54% 1.94% 1.00% 1.50% 2.00% 2.50% 3.00% 3.50% 4.00% Q3 2011 Q4 2011 Q1 2012 Q2 2012 Q3 2012 Q4 2012 Q1 2013 Q2 2013 Non-Performing Assets/ Total Assets Non-Performing Loans/ Total Loans
| 25 |
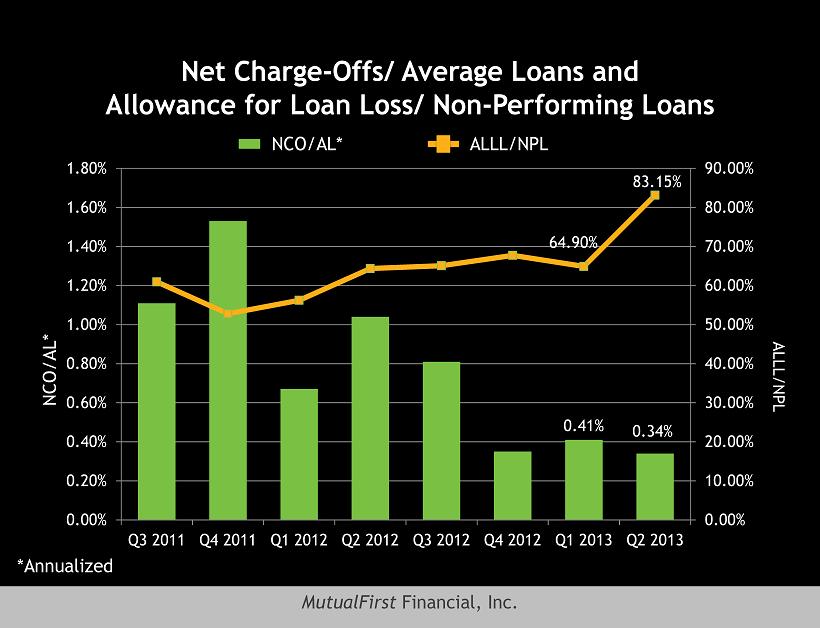
MutualFirst Financial, Inc. Net Charge - Offs/ Average Loans and Allowance for Loan Loss/ Non - Performing Loans *Annualized NCO/AL* ALLL/NPL NCO/AL* ALLL/NPL 0.41% 0.34% 64.90% 83.15% 0.00% 10.00% 20.00% 30.00% 40.00% 50.00% 60.00% 70.00% 80.00% 90.00% 0.00% 0.20% 0.40% 0.60% 0.80% 1.00% 1.20% 1.40% 1.60% 1.80% Q3 2011 Q4 2011 Q1 2012 Q2 2012 Q3 2012 Q4 2012 Q1 2013 Q2 2013
| 26 |
MutualFirst Financial, Inc. Increasing Non - Interest Income » Revenue Enhancement Review » Mortgage Banking » Service Fee Income on Deposits » Commission Income
| 27 |
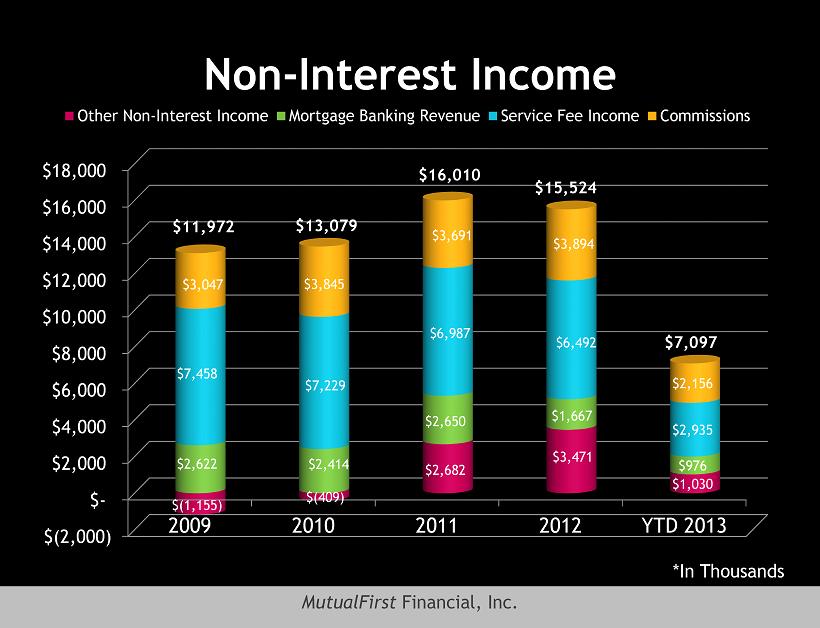
MutualFirst Financial, Inc. Non - Interest Income *In Thousands $(2,000) $- $2,000 $4,000 $6,000 $8,000 $10,000 $12,000 $14,000 $16,000 $18,000 2009 2010 2011 2012 YTD 2013 $(1,155) $(409) $2,682 $3,471 $1,030 $2,622 $2,414 $2,650 $1,667 $976 $7,458 $7,229 $6,987 $6,492 $2,935 $3,047 $3,845 $3,691 $3,894 $2,156 Other Non-Interest Income Mortgage Banking Revenue Service Fee Income Commissions $11,972 $13,079 $16,010 $15,524 $7,097
| 28 |
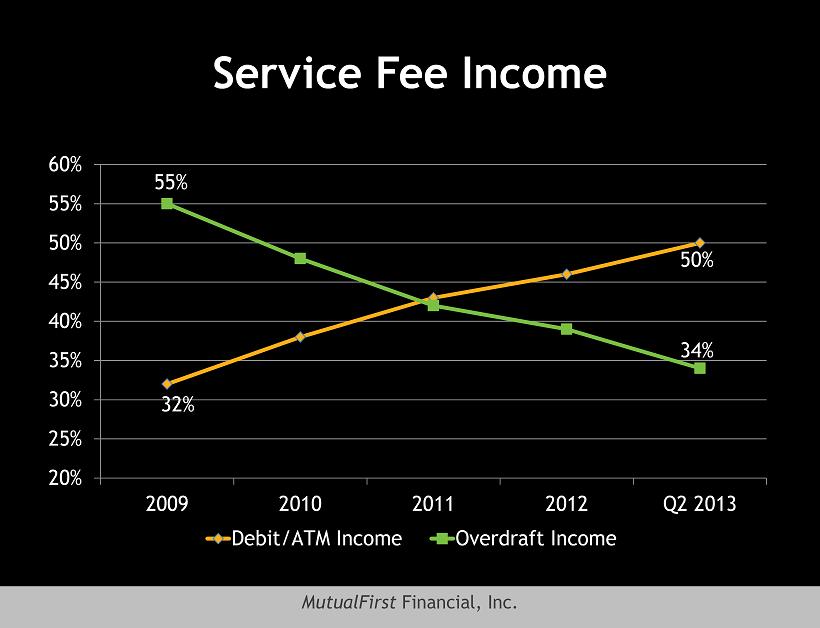
MutualFirst Financial, Inc. Service Fee Income 32% 50% 55% 34% 20% 25% 30% 35% 40% 45% 50% 55% 60% 2009 2010 2011 2012 Q2 2013 Debit/ATM Income Overdraft Income
| 29 |
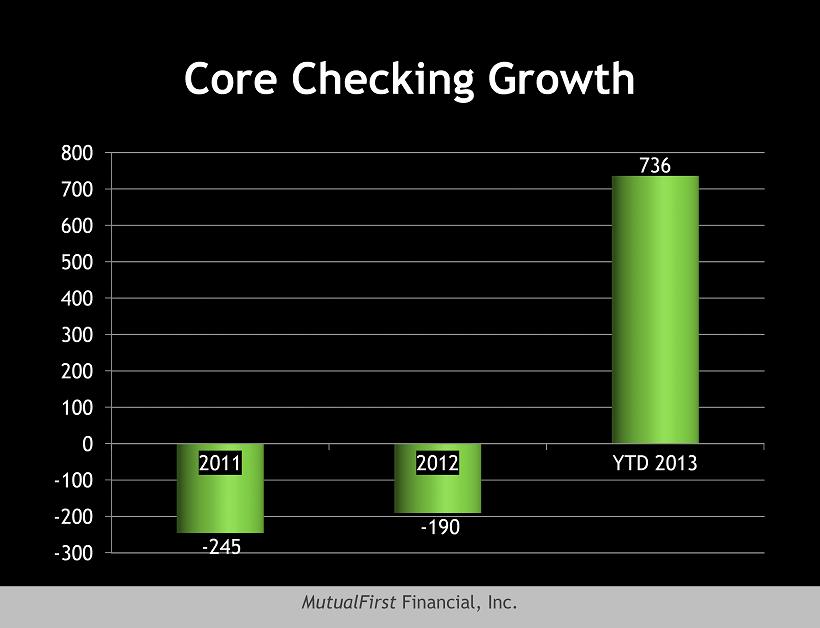
MutualFirst Financial, Inc. Core Checking Growth -300 -200 -100 0 100 200 300 400 500 600 700 800 2011 2012 YTD 2013 - 245 - 190 736
| 30 |
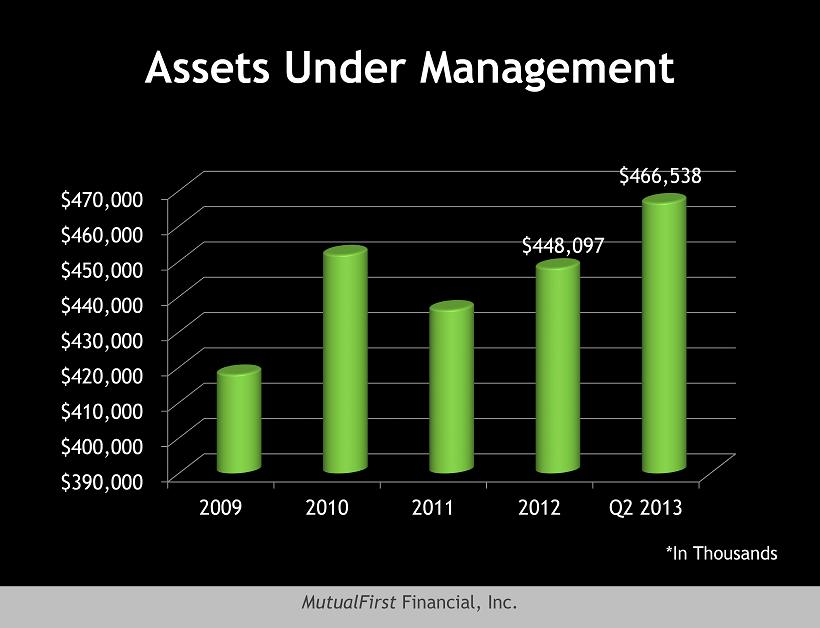
MutualFirst Financial, Inc. Assets Under Management $390,000 $400,000 $410,000 $420,000 $430,000 $440,000 $450,000 $460,000 $470,000 2009 2010 2011 2012 Q2 2013 $448,097 $466,538 *In Thousands
| 31 |
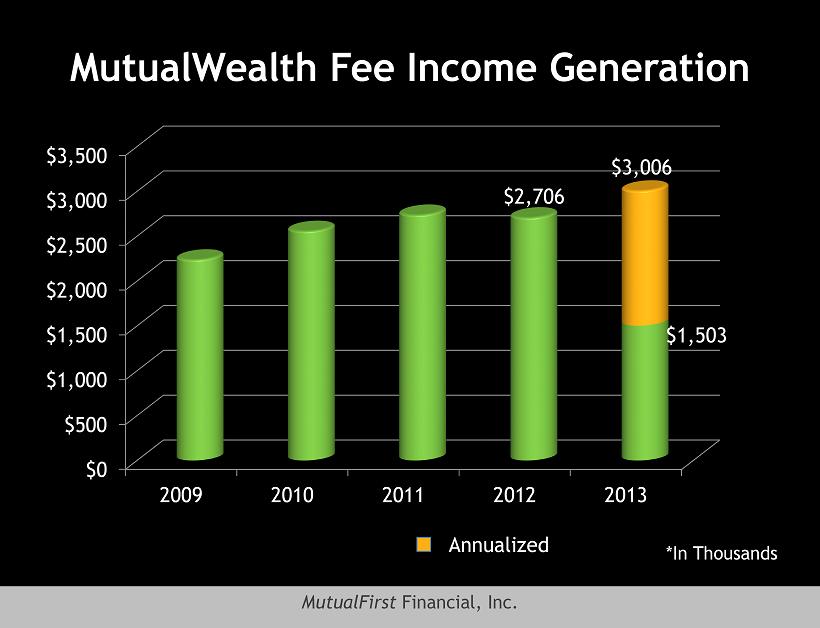
MutualFirst Financial, Inc. MutualWealth Fee Income Generation $0 $500 $1,000 $1,500 $2,000 $2,500 $3,000 $3,500 2009 2010 2011 2012 2013 $3,006 $2,706 $1,503 *In Thousands Annualized
| 32 |
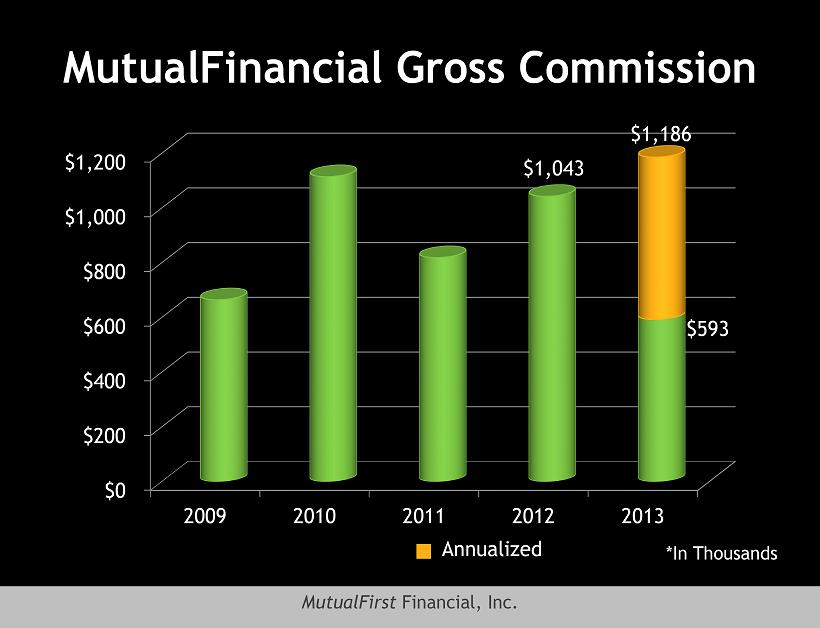
MutualFirst Financial, Inc. MutualFinancial Gross Commission $0 $200 $400 $600 $800 $1,000 $1,200 2009 2010 2011 2012 2013 $1,043 $593 $1,186 *In Thousands Annualized
| 33 |
MutualFirst Financial, Inc. Non - Interest Expense » Branch Optimization » Credit Quality
| 34 |

MutualFirst Financial, Inc. Non - Interest Expense $15,000 $20,000 $25,000 $30,000 $35,000 $40,000 $45,000 2009 2010 2011 2012 2013 $40,265 $39,630 *In Thousands Annualized
| 35 |

MutualFirst Financial, Inc. Non - Interest Expense $4,000 $5,000 $6,000 $7,000 $8,000 $9,000 $10,000 $11,000 Q3 2011 Q4 2011 Q1 2012 Q2 2012 Q3 2012 Q4 2012 Q1 2013 Q2 2013 $9,913 $9,902 *In Thousands
| 36 |
MutualFirst Financial, Inc. Branch Optimization » Independent Market Analysis » Profitability Analysis » Market Demographics
| 37 |

MutualFirst Financial, Inc. Provision Expense $- $2,000 $4,000 $6,000 $8,000 $10,000 $12,000 $14,000 2009 2010 2011 2012 2013 $6,025 $1,500 $3,000 Annualized
| 38 |
MutualFirst Financial, Inc. SBLF Redemption » ¼ Redeemed in 2 nd Quarter 2013 » Evaluating and working toward additional redemption in 2013
| 39 |
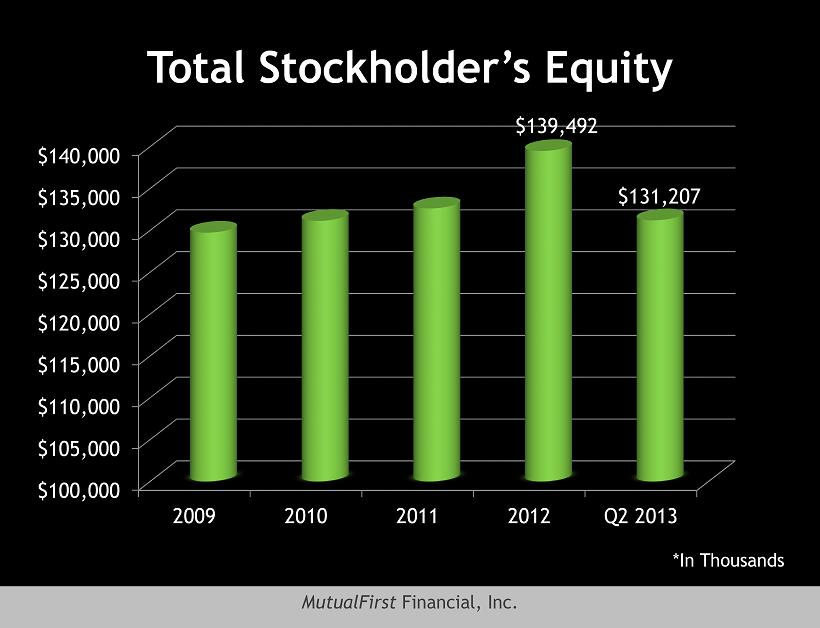
MutualFirst Financial, Inc. Total Stockholder’s Equity $100,000 $105,000 $110,000 $115,000 $120,000 $125,000 $130,000 $135,000 $140,000 2009 2010 2011 2012 Q2 2013 $139,492 $131,207 *In Thousands
| 40 |
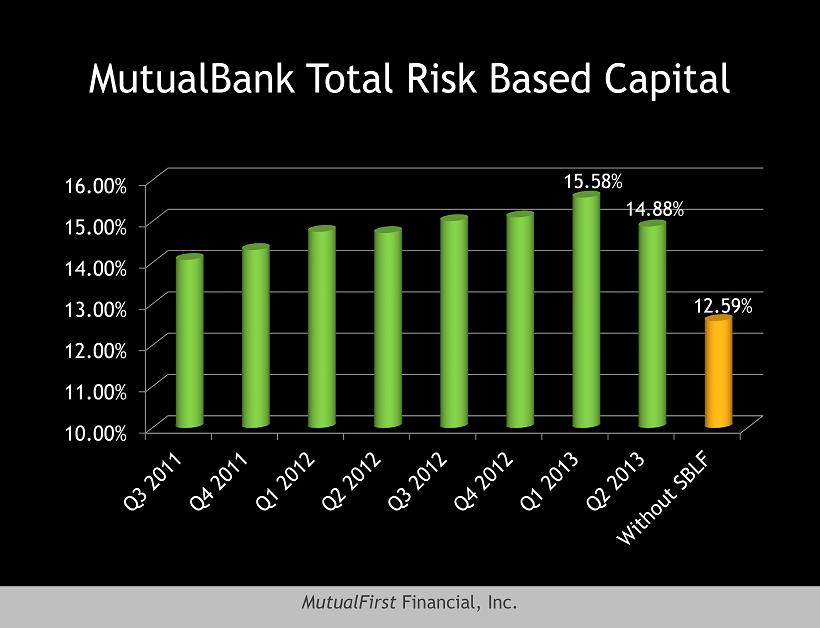
MutualFirst Financial, Inc. 10.00% 11.00% 12.00% 13.00% 14.00% 15.00% 16.00% 15.58% 14.88% 12.59% MutualBank Total Risk Based Capital
| 41 |

MutualFirst Financial, Inc. Market Comparisons
| 42 |
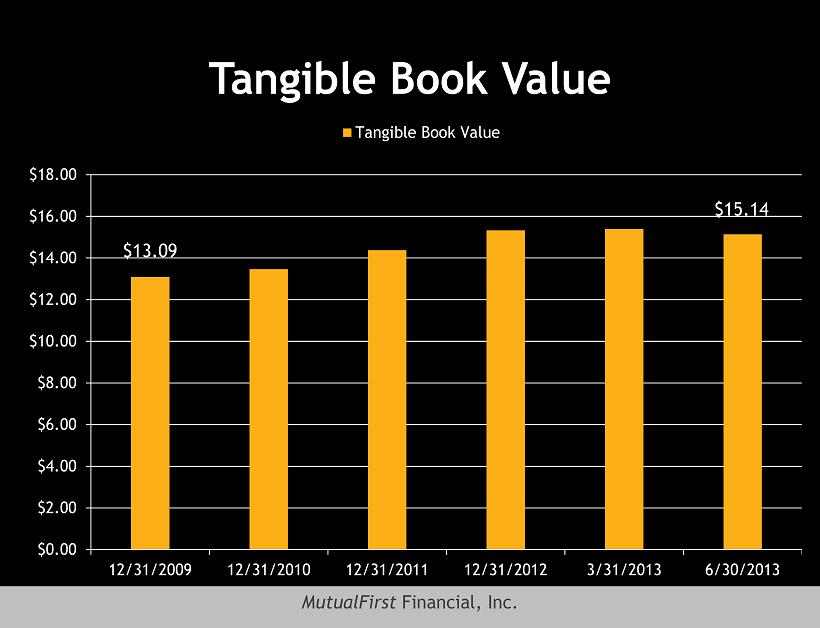
MutualFirst Financial, Inc. Tangible Book Value $13.09 $15.14 $0.00 $2.00 $4.00 $6.00 $8.00 $10.00 $12.00 $14.00 $16.00 $18.00 12/31/2009 12/31/2010 12/31/2011 12/31/2012 3/31/2013 6/30/2013 Tangible Book Value Tangible Book Value
| 43 |
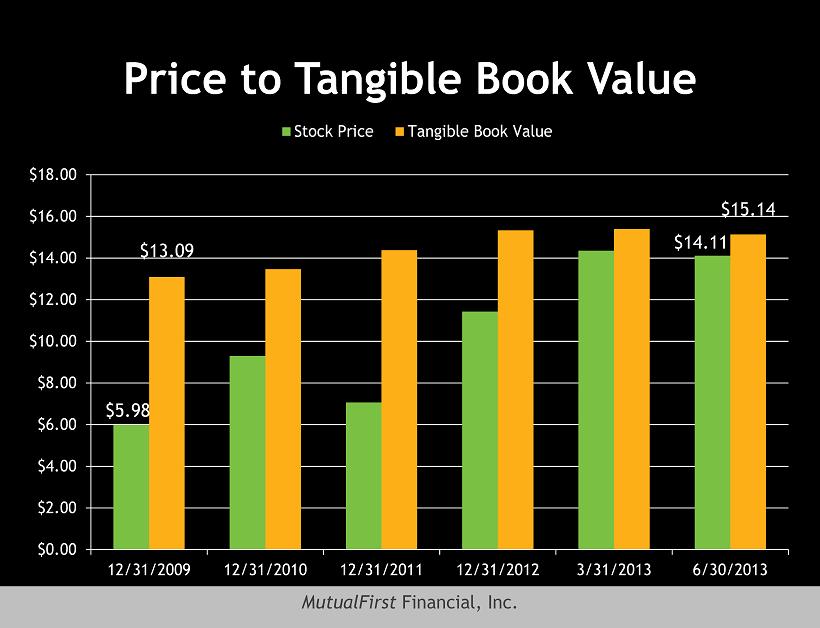
MutualFirst Financial, Inc. Price to Tangible Book Value $5.98 $14.11 $13.09 $15.14 $0.00 $2.00 $4.00 $6.00 $8.00 $10.00 $12.00 $14.00 $16.00 $18.00 12/31/2009 12/31/2010 12/31/2011 12/31/2012 3/31/2013 6/30/2013 Stock Price Tangible Book Value
| 44 |
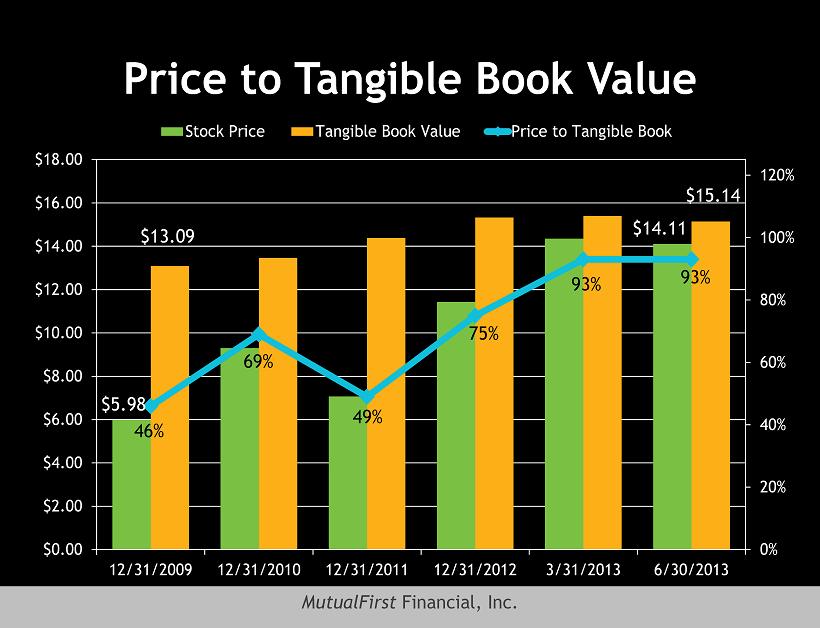
MutualFirst Financial, Inc. Price to Tangible Book Value $5.98 $14.11 $13.09 $15.14 46% 69% 49% 75% 93% 93% 0% 20% 40% 60% 80% 100% 120% $0.00 $2.00 $4.00 $6.00 $8.00 $10.00 $12.00 $14.00 $16.00 $18.00 12/31/2009 12/31/2010 12/31/2011 12/31/2012 3/31/2013 6/30/2013 Stock Price Tangible Book Value Price to Tangible Book
| 45 |

MutualFirst Financial, Inc. Price to Tangible Book 70.00% 75.00% 80.00% 85.00% 90.00% 95.00% 100.00% 105.00% 110.00% MFSF Indiana Banks National Banks 91.6% 102.5% 100.4% *KBW Price Performance Review – June 2013
| 46 |
MutualFirst Financial, Inc. Key Takeaways » Branch Analysis » Revenue Enhancement » Credit Improvement » Business Banking Campaign » Checking Account Growth
| 47 |

MutualFirst Financial, Inc. Thank You
| 48 |