Filer: Ultrapar Participações S.A.
Issuer: Ultrapar Participações S.A.
Subject of the offer: Refinaria de Petróleo Ipiranga S.A.,
Distribuidora de Produtos de Petróleo Ipiranga S.A. and
Companhia Brasileira de Petróleo Ipiranga S.A.
Commission File Number: 001-14950
Investors will be able to obtain copies of the offering document and other documents from the SEC's Public Reference Room at 100 F Street N.E., Washington D.C., 20549. Please call the SEC at 1-800-SEC-0330 for further information on the Public Reference Room. The documents may also be obtained from the website maintained by the SEC at http://www.sec.gov, which contains reports and other information regarding registrants that file electronically with the SEC. In addition, documents (including any exhibits) filed with the SEC by Ultrapar Participações S.A. will be available free of charge from the Investor Relations office of Ultrapar Participações S.A., located at Avenida Brigadeiro Luis Antonio, 1343, 9º Andar São Paulo, SP, Brazil 01317-910, tel: 011-55-11-3177-6695. PLEASE, READ THE DOCUMENTS CAREFULLY BEFORE MAKING A DECISION REGARDING THE MERGER.
This communication shall not constitute an offer to sell or the solicitation of an offer to buy, nor shall there be any sale of securities in any jurisdiction in which such offer, solicitation or sale would be unlawful prior to registration or qualification under the securities laws of such jurisdiction.
Strictly private and confidential | |
Valuation Report to Ultrapar Participações
Ultrapar Participações S.A., Refinaria Petroleo Ipiranga S.A., Distribuidora de Produtos de Petroleo Ipiranga S.A., Companhia Brasileira de Petroleo Ipiranga
April 4, 2007
A Passion to Perform. | |
Disclaimer
| n | These materials may only be used by Ultrapar Participações S.A. (“Ultrapar”) for the purposes defined in the engagement letter signed with Deutsche Bank Securities Inc. (“Deutsche Bank”). Neither Deutsche Bank nor any of its affiliates or any of its or their officers, directors, employees, affiliates, advisors, agents or representatives (collectively, “Deutsche Bank Representatives”) makes any express or implied representation or warranty as to the accuracy or completeness of any of the materials set forth herein or provides advice relating to tax, accounting, legal, antitrust, or other regulatory matters. Nothing contained in the accompanying materials is, or shall be relied upon as, a promise or representation as to the past or the future |
| n | In connection with Deutsche Bank’s role of “conducting a valuation analysis / preparing a valuation report” for Ultrapar, and in preparing its report as to the respective valuations of Companhia Brasileira de Petróleo Ipiranga (“CBPI”), Distribuidora de Produtos de Petróleo Ipiranga S.A. (“DPPI”) and Refinaria de Petróleo Ipiranga S.A. (“RIPI”) (collectively, “Ipiranga”, or the “Ipiranga Group”) and Ultrapar, Deutsche Bank has reviewed certain publicly available financial and other information concerning Ultrapar and the Ipiranga Group and certain internal analyses and other information furnished to it by Ultrapar and the Ipiranga Group. Deutsche Bank has also held discussions with members of the senior managements of Ultrapar and the Ipiranga Group, and with respect to certain assets, the senior management of Braskem, regarding the businesses and prospects of their respective companies and the operations of the combined company following the transactions described herein. In addition, Deutsche Bank has (i) reviewed the reported prices and trading activity for Ultrapar’s and the Ipiranga Group’s stock, (ii) compared certain financial and stock market information for Ultrapar and the Ipiranga Group with similar information for certain other companies whose securities are publicly traded, (iii) reviewed the financial terms of certain recent business combinations which it deemed comparable in whole or in part, (iv) reviewed the terms of the agreements governing the transaction, and (v) performed such other studies and analyses and considered such other factors as it deemed appropriate |
i
Disclaimer (continued)
n | Deutsche Bank has not assumed responsibility for independent verification of, and has not independently verified, any information, whether publicly available or furnished to it, concerning Ultrapar or the Ipiranga Group, including, without limitation, any financial information, forecasts or projections considered in connection with the preparation of its report as to the respective valuations of Ultrapar and the Ipiranga Group. Accordingly, for purposes of its report, Deutsche Bank has assumed and relied upon the accuracy and completeness of all such information and Deutsche Bank has not conducted a physical inspection of any of the properties or assets, and has not prepared or obtained any independent evaluation or appraisal of any of the assets or liabilities, of Ultrapar or the Ipiranga Group. However, Deutsche Bank considers consistent the information used in this Report |
n | It should be understood that any valuations, financial and other forecasts and/or estimates or projections and other assumptions contained in the accompanying materials (including, without limitation, regarding financial and operating performance), were prepared or derived from information (whether oral or in writing) supplied solely by the respective managements of Ultrapar, the Ipiranga Group and Braskem or derived from other public sources, without any independent verification by Deutsche Bank, and involve numerous and significant subjective determinations and assumptions by Ultrapar and the Ipiranga Group, which may not be correct. As a result, it is expected that there will be a difference between actual and estimated or projected results, and actual results may vary materially from those shown herein. In addition, with respect to any such information made available to Deutsche Bank and used in its analyses, Deutsche Bank has assumed that they have been reasonably prepared on bases reflecting the best currently available estimates and judgments of the respective managements of Ultrapar and the Ipiranga Group as to the matters covered thereby. The Report observes the requirements imposed by Brazilian Securities Regulation, in particular Rule #361/02 of the Brazilian Securities Commission ("CVM") |
n | Accordingly, in preparing its report as to the respective valuations of Ultrapar and the Ipiranga Group, neither Deutsche Bank nor any of the Deutsche Bank Representatives make any express or implied representation or warranty, or express any view, as to the accuracy, reasonableness, completeness or achievability of any such financial and other forecasts and/or estimates or projections, or as to the determinations or assumptions on which they are based. Deutsche Bank’s report is necessarily based upon economic, market and other conditions as in effect on, and the information made available to it as of, the date hereof |
ii
Disclaimer (continued)
n | Deutsche Bank has also assumed that all material governmental, regulatory or other approvals and consents required in connection with the consummation of the transaction will be obtained and that in connection with obtaining any necessary governmental, regulatory or other approvals and consents, or any amendments, modifications or waivers to any agreements, instruments or orders to which either Ultrapar or the Ipiranga Group is a party or is subject or by which it is bound, no limitations, restrictions or conditions will be imposed or amendments, modifications or waivers made that would have a material adverse effect on Ultrapar or the Ipiranga Group or materially reduce the contemplated benefits of the transaction to Ultrapar |
n | This Report was based on the information available until today, and the views expressed are subject to change based upon a number of factors, including market conditions and Ultrapar’s and the Ipiranga Group’s business and prospects. Deutsche Bank does not undertake any obligation to update or otherwise revise these materials after the date hereof |
n | This Report and its conclusions are not recommendations by Deutsche Bank as to whether Ipiranga shareholders should tender their shares in the mandatory tender offer, or to Ultrapar or Ipiranga shareholders as to the fairness to such shareholders, from a financial point of view, of the exchange ratio in the incorporation of RIPI, CBPI, DPPI shares in Ultrapar. Each shareholder must reach its own conclusions about the advisability of accepting the offer presented by Ultrapar and the incorporation of the shares of CBPI, DBPI and RIPI by Ultrapar |
n | This valuation report incorporates the changes requested by the Brazilian Securities Exchange Commission (Comissão de Valores Mobiliários – CVM) detailed in the following documents: (i) OFICIO/CVM/SRE/GER-1/Nº 1017/2007, (ii) OFICIO/CVM/SRE/GER-1/Nº 1018/2007, (iii) OFICIO/CVM/SRE/GER-1/Nº 1019/2007, (iv) OFICIO/CVM/SRE/GER-1/Nº 1427/2007, (v) OFICIO/CVM/SRE/GER-1/Nº 1428/2007, (vi) OFICIO/CVM/SRE/GER-1/Nº 1429/2007 and (vii) OFICIO/CVM/SRE/GER-1/Nº 1703/2007. This revised book does not present a different assessment of value than the one presented by Deutsche Bank on the Valuation Report dated July 4th, 2007 |
iii
Section | |||
| 1 | Executive summary | 1 | |
| 2 | Valuation summary | 9 | |
| A | Ultrapar | 10 | |
| B | RIPI | 13 | |
| C | DPPI | 16 | |
| D | CBPI | 19 | |
| 3 | Economic value of assets | 22 | |
| A | Ultrapar | 26 | |
| B | Ultrapar prior to the share merger | 37 | |
| C | Fuel distribution – CBPI | 39 | |
| D | Fuel distribution – DPPI | 45 | |
| E | Copesul | 50 | |
| F | IPQ | 55 | |
| G | Valuation of other assets based on multiples | 60 | |
| 4 | Final considerations | 62 | |
| 5 | Glossary | 64 | |
Appendix | |||
| I | Share price evolution | 68 | |
| II | Comparable multiples | 74 | |
| III | Overview of the industries in which the assessed companies operate | 78 | |
| IV | Calculation backup | 82 | |
| V | Other relevant information | 91 | |
Executive summary | Section 1 |
Section 1
Executive summary
1 |
Executive summary | Section 1 |
Initial considerations |
n | This appraisal report (“Report” or “Valuation Report”) was prepared by Deutsche Bank as requested by Ultrapar |
n | The Report observes the requirements imposed by Brazilian Securities Regulation, in particular Rule #361/02 of the Brazilian Securities Commission (“CVM”). Ultrapar requested this Report to be used in connection with (i) the mandatory tender offers related to the acquisition by Ultrapar of the control of Ipiranga Group, and (ii) the incorporation of CBPI, DPPI and RIPI shares in Ultrapar |
n | The ranges for the respective valuations of Ultrapar, CBPI, DPPI and RIPI are limited to 10% due to a requirement imposed by Rule #361/02 of the CVM |
| 2 |
Executive summary | Section 1 |
Scope of Deutsche Bank’s analysis
The objective of this Valuation Report is to present economic valuations of both Ultrapar and Ipiranga Group in accordance with the criteria defined as mandatory by the CVM
Under the CVM Rule #361/02, Deutsche Bank has conducted an analysis using the following methodologies and assumptions:
n | Economic value based on discounted cash flow (“DCF”) analysis for the main operating companies and comparable multiples for some smaller operating subsidiaries |
| – | Based on publicly available information and discussions with management of Ultrapar and Ipiranga |
n | Market value based on average share prices weighted by traded volume |
– | Average share price weighted by traded volume during the last twelve months ended March 16, 2007 (last trading day pre-announcement) |
n | Book value of the shares |
– | Based on Ultrapar and Ipiranga’s audited financial statements as of December 31,2006 |
Among the different valuation methodologies presented in this Valuation Report, Deutsche Bank believes that economic value based on DCF and comparable multiples is the most applicable methodology for valuing Ultrapar and Ipiranga
Economic value - methodologies for different business lines | ||||||||
Discounted cash flow | Codename | WACC | Public company comparables | Codename | ||||
| Companhia Brasileira de Petróleo Ipiranga | CBPI | 12.2% | Ipiranga Química S.A. | IQ | ||||
| Distribuidora de Prod. de Petróleo Ipiranga | DPPI | 12.3% | Empresa Carioca de Prod. Químicos S.A. | EMCA | ||||
| Copesul Central Química | Copesul | 11.2% | Ipiranga Asfaltos | IASA | ||||
| Ipiranga Petroquímica S.A. | IPQ | 11.8% | AM/PM Comestíveis | AM/PM | ||||
| Ultrapar Participações | Ultrapar | 10.6% | Isa-Sul Administração e Part. Ltda | Isa-sul | ||||
| Refinaria Petróleo Ipiranga S.A. | Refinery | |||||||
| 3 |
Executive summary | Section 1 |
Valuation range - price per share |
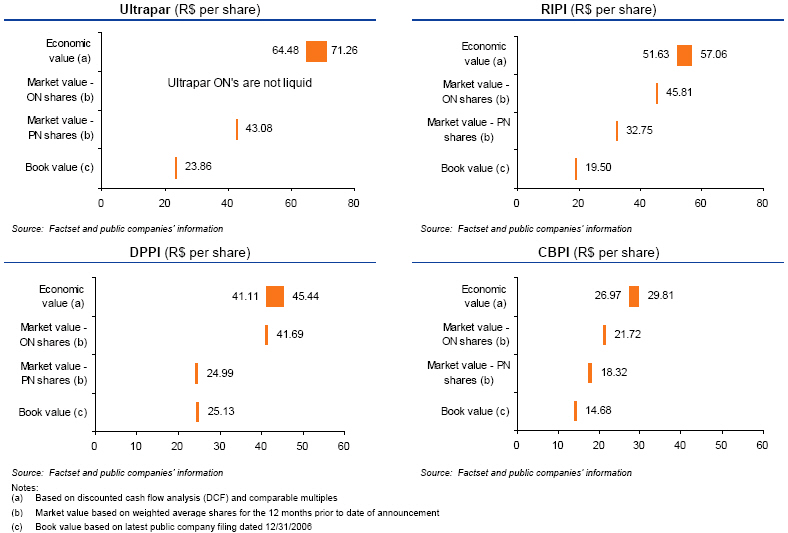
(a) Based on discounted cash flow analysis (DCF) and comparable multiples (b) Market value based on weighted average shares for the 12 months prior to date of announcement (c) Book value based on latest public company filing dated 12/31/2006 |
| 4 |
Executive summary | Section 1 |
Conducting the economic valuation
The three main economic valuation methodologies used were: Discounted Cash Flow (“DCF”), comparable public companies’ multiples and comparable precedent transaction multiples
Discounted Cash Flow - DCF Analysis | Comparable Public Company Analysis | Comparable Precedent Transaction Analysis | ||||
Methodology |
|
|
| |||
Potential advantages |
|
|
| |||
Potential disadvantages |
|
|
| |||
Considerations |
|
|
| |||
| Notes: (1) TEV - Total Enterprise Value = Equity plus Net debt. | ||||||
| 5 |
Executive summary | Section 1 |
Deutsche Bank credentials |
n | Headquartered in Frankfurt am Main, Germany, Deutsche Bank is the largest bank in Germany, and one of the largest financial institutions in Europe and the world, as measured by total assets of € 1,126 billion as of December 31, 2006. As of that date, Deutsche Bank employed 68,849 people on a full-time equivalent basis, operating in 73 countries out of 1,717 facilities worldwide, of which 54 % were in Germany. Deutsche Bank offers a wide variety of investment, financial and related products and services to private individuals, corporate entities and institutional clients around the world (source: Deutsche Bank’s 2006 annual report) |
n | Deutsche Bank and its affiliates’ expertise in assessing Brazilian publicly listed companies includes: the advisory to Ashmore Energy International on the acquisition of Prisma Energy International in 2006, and the fairness opinion valuation of Companhia Siderúrgica Belgo Mineira in 2005 |
n | In addition to that, Deutsche Bank was responsible for the valuation report of Cia. Metalic Nordeste for Companhia Siderúrgica Nacional (“CSN”) in 2002 |
n | Deutsche Bank or its affiliates also advised La Seda de Barcelona S.A. (“LSB”) on the acquisition of Eastman Chemical Iberica S.A. from Eastman Chemical Company in 2007, advised Linde AG on the sale of equipment business of BOC Edwards to CCMP Capital in 2007, advised Gazprom on the sale of a 10.7% stake to Rosneftegaz, advised ConocoPhillips on the divestment of selected European downstream assets (pending), advised Giant Industries on its sale to Western Refining Inc. and provided a fairness opinion valuation (pending), and is advising Valero on strategic alternatives for the Lima, Ohio refinery, among other assignments |
n | Other selected transactions that involved valuation of public companies include: the advisory to Fairchild Semiconductor International in its acquisition of System General Corp, and the advisory to Healthcare REIT in its acquisition of Windrose Medical Properties Trust. Deutsche Bank also acted as advisor to International DisplayWorks Inc. when it was acquired by Flextronics International Ltd. and to US LEC Corp when it merged with Paetec Communications, Inc. All these transactions required a fairness opinion valuation |
n | Deutsche Bank and its affiliates have a qualified team of professionals based in New York and São Paulo led by Mr. Ian Reid who was responsible for producing this Report |
n | In delivering the Report, Deutsche Bank followed its internal policies applicable to the delivery of valuation reports, including forming an internal valuation committee to review and approve the report |
| – | The valuation committee is comprised of at least 3 senior bankers from the M&A department that had met at least twice as it is usual on the 2nd and 4th of April |
| 6 |
Executive summary | Section 1 |
Additional considerations |
n | The date of this Report is April 4, 2007 |
n | This Report may be solely used in the context of the request made by Ultrapar to Deutsche Bank |
n | Research reports prepared by different areas of Deutsche Bank may utilize different assumptions with respect to the future performance of Ultrapar and Ipiranga than those used in the Valuation Report, and thus potentially present significantly different conclusions with respect to valuation. Those different areas at Deutsche Bank are independent to the Corporate Finance and Mergers and Acquisitions department that was responsible for the elaboration of this Report. Those different areas have their own sources of information and a different assessment about what they make available to the public in the form of publications, and there is no communication between the professionals involved in the elaboration of this report and the professionals of those different areas. Deutsche Bank has strict internal policies regarding the segregation of public and private areas at the bank and monitoring the information flow between them in order to guarantee that both areas operate independently |
n | In compliance with the resolution CVM #361/02, Deutsche Bank states that as of April 4, 2007: |
– | There is no commercial or credit relationship that could impact this Report |
– | There is no conflict of interest that compromises the independence necessary to prepare this Report |
– | Deutsche Bank and its affiliates held 8,527 non-voting shares of Braskem and 171,000 ADRs of Braskem; 62,175 voting shares of Petrobras, and 500,540 ADRs of Petrobras; Deutsche Bank and its affiliates did not hold, directly or indirectly, any shares of CBPI, DBPI and RIPI, nor did they hold shares or ADRs of Ultrapar, Petrobras or Braskem other than the shares/ADRs mentioned above |
– | Deutsche Bank is engaged in sales and trading transactions with Petrobras and Braskem, which includes, but is not limited to, derivatives |
– | In May 2006, Deutsche Bank received R$2,673,760.50 net of taxes from Petrobras for the advisory and structuring services rendered in connection with the acquisition of ABB's stake in Termobahia. Deutsche Bank did not receive any other fees from Ultrapar, Braskem or Petrobras in connection with financial advisory, consulting or auditing services, or any other investment banking services over the past 12 months |
– | Deutsche Bank will receive US$3,000,000 net of taxes as a fee for the delivery of this Report |
Ian Reid - Managing Director |
| 7 |
Executive summary | Section 1 |
Additional considerations (continued) |
Ian Reid – Managing Director |
| n | Ian Reid, Managing Director for Corporate Finance and Mergers and Acquisitions for Latin America, was responsible for the preparation of this Valuation Report. Projects relevant in which Mr. Reid has been involved include the merger of Brahma and Antarctica to create Ambev, the unwinding of CSN’s controlling interest in CVRD (advisor to CVRD), acquisition of Bolivian refinery by Petrobras (advisor to Petrobras), the sale of Latasa by Bradesco, Alcoa, and JPMorgan to Rexam (advisor to the sellers), the acquisition of Panamco by Coca Cola FEMSA (advisor to Coca Cola FEMSA), the repurchase by FEMSA of Interbrew’s stake in Femsa Cerveza (advisor to FEMSA) |
Jose Securato – Vice President |
| n | Jose Securato, Vice President for Corporate Finance and Mergers and Acquisitions for Latin America, also participated in the preparation of this Valuation Report. His experience includes, among others, advisory to Ashmore Energy International in its acquisition of Prisma Energy International in 2006 (which included valuation of Elektro), the valuation of Cia. Metalic Nordeste for Companhia Siderúrgica Nacional (“CSN”) in 2002, the sale of 40% of Indura in Chile in 2007, the sale of AGF Chile in 2004, the sale of Ática & Scipione in 2004, the acquisition of TCO/NBT in 2003 and Valuation Reports for the following companies or their businesses: Banco Itaú Argentina, Itausaga Corr. Seguros, Itaupromotora de Vendas, Intrag DTVM, BFB, FIBEMGE, BANERJ, CENF, LAJEADO, ROSAL, and MARTINÓPOLIS between 1998 and 1999 |
Also participating in the preparation of this Valuation Report:
Steve Guberer – Associate |
| n | Steve Guberer, Associate for Corporate Finance and Mergers and Acquisitions for Latin America, joined Deutsche Bank one year ago. His experience includes advisory for Fortress Investment Group and Centerbridge Partners in their US$8.9 billion buyout of Penn National Gaming Inc., announced in June 2007. Steve worked at Deloitte & Touche from 2000 until 2004. Steve received his MBA from the University of Chicago and his bachelor’s degree in accounting from Rutgers University |
Hunter Kushner – Analyst |
| n | Hunter Kushner, Analyst for Corporate Finance and Mergers and Acquisitions for Latin America, joined Deutsche Bank in June 2006. Hunter has worked on the IPO of Klabin Segall in addition to other projects. Hunter has worked in the Investment Management Division at JPMorgan and at Moore Capital Management. He received his Bachelor of Arts in Political Science from Yale University |
Guilherme Gama – Analyst |
| n | Guilherme Gama, Analyst for Corporate Finance and Mergers and Acquisitions for Latin America, joined Deutsche Bank in 2005. His experience includes the initial public offering of Klabin Segall, the public offering of 2008 Notes by Sabesp, and the bond issuance of 10-year notes of US$140 million in value as well as the additional perpetual offering by Globo Comunicações. Prior to this, Guilherme was Financial Director and Junior Business Administrator for the Fundação Getulio Vargas, São Paulo, and in the period between 1999 and 2002, he was responsible for operations and technical and logistical assistance for Gran Coffee Com. Loc. Serv., a business in the sector of coffee serving systems |
| n | Other areas of the bank including the team for Mergers and Acquisitions, the group entitled Energy, Utilities, and Chemicals, and the group entitled Oil & Gas also contributed to this report |
| 8 |
Valuation summary | Section 2 |
Section 2
Valuation summary
| 9 |
Valuation summary | Section 2 |
Tab A
Ultrapar
| 10 |
| Valuation summary | Section 2 |

Source: Public Ultrapar information
Company description
Ultrapar is a holding company for 3 separate operating companies: Oxiteno, Ultragaz, and Ultracargo
Major subsidiaries
| ■ | Ultragaz Participações LTDA |
| - | Ultragaz is the leading distributor of liquefied petroleum gas (LPG) in Brazil, and one of the largest distributors in the world by volume |
- | Distributes bottled and bulk LPG to residential, commercial, and industrial clients in Brazil |
- | 2006 revenue of US$1.4 billion, and volume sold of 1.5 million tons |
| ■ | Oxiteno S.A. |
- | A second-generation producer of commodity & specialty petrochemicals |
- | Oxiteno is the largest producer of ethylene oxide and its main derivatives in Latin America |
- | 2006 revenue of US$707 million, and volume sold of 544,000 tons |
| ■ | Ultracargo Oper. Logísticas e Participações LTDA |
- | Provides integrated logistics services for special products |
- | 2006 revenue of $103 million |
- | Storage capacity at 2006 year end of 240 thousand cubic meters. |
- | Traveled in 2006 approximately 43 million kilometers |
Source: Public Ultrapar information
11 |
| Valuation summary | Section 2 |
Prior to the share merger, Ultrapar’s share value ranges from R$64.48 to R$71.26 based on the economic value
Economic value (R$) | ||||||||||||
| Ultrapar TEV (before steps 1 and 2) | 5,879 | |||||||||||
| (+) net cash | 19 | |||||||||||
| Ultrapar Equity value (before steps 1 and 2) | 5,898 | |||||||||||
(+) assets acquired (a) | 497 | |||||||||||
(-) price paid(b) | (876 | ) | ||||||||||
Ultrapar equity value (after steps 1 and 2) | 5,520 | |||||||||||
| Total number of shares (million) | 81.3 | |||||||||||
Price per share – R$ per share | 64.48 | 67.87 | 71.26 | |||||||||
-5% | +5% | |||||||||||
Note: Figures in R$ million unless otherwise noted.
(a) refer to page 38 of the Valuation Report for more details
(b) Net value to be paid by Ultrapar for steps 1 and 2, net of the value received from
Dynamo for the sale of certain Ipiranga PN’s shares
Source: Ultrapar information and Deutsche Bank
Weighted average share price LTM to announcement(a) | ||||||||
ON | PN | |||||||
| Total volume (000’s) | NA | 17,108 | ||||||
| W.A. share price (R$ per share) | NA | 43.08 | ||||||
(a) From 03/15/2006 to 03/16/2007
Note: Ultrapar’s ON shares have not traded for over 12 months.Source: FactSet
Book value – Ultrapar | ||||
12/31/2006 | ||||
| Shareholder equity – (R$ million) | 1,940.7 | |||
| Total number of shares (million) | 81.3 | |||
| Book value per share (R$ per share) | 23.86 | |||
Note: Book value based on operating company financials as of 12/31/2006
Source: Company’s filings
Weighted average share price announcement to April 2, 2007(a) | ||||||||
ON | PN | |||||||
| Total volume (000’s) | NA | 2,822 | ||||||
| W.A. share price (R$ per share) | NA | 56.10 | ||||||
(a) From 03/16/2007 to 04/02/2007
12 |
| Valuation summary | Section 2 |
Tab B
RIPI
13 |
| Valuation summary | Section 2 |
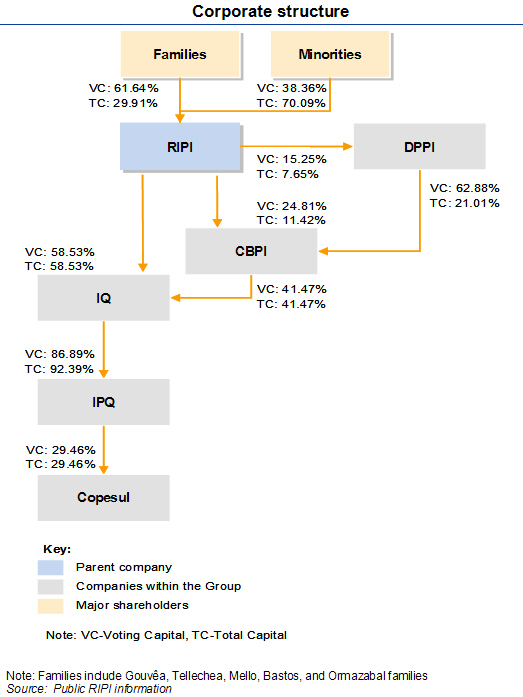
Refinaria Petroleo Ipiranga SA – RIPI
Company description
| ■ | RIPI is a holding company for certain Ipiranga investments and operates a refinery |
Major subsidiaries
| ■ | Companhia Brasileira de Petroleo Ipiranga (CBPI) |
- | A fuels distributor in Brazil, except in Rio Grande do Sul, Roraima and Amapá |
- | 2006 revenue of US$9.8 billion and volume sold of 12.2 billion cubic meters |
| ■ | Distrib. de Produtos de Petroleo Ipiranga (DPPI) |
- | A fuels distributor in Southern Brazil |
- | 2006 revenue of $1.6 billion and volume sold of 1.8 billion cubic meters |
| ■ | Ipiranga Química (IQ) |
- | A wholesale distributor of chemical products with over 5,000 clients in 50 different markets |
- | 2006 revenue of US$212.3 million and EBITDA of US$9.5 million |
- | Through its ownership in IQ, RIPI indirectly controls Copesul (with Braskem) and IPQ |
| ■ | Ipiranga Petroquímica (IPQ) |
- | A 2nd generation producer of high-end petrochemicals |
- | 2006 revenue of US$924.3 million and volume sold of 636,100 tons |
| ■ | Copesul |
- | A naphtha-based cracker owned by Ipiranga & Braskem |
- | 2006 revenue of US$2.9 billion and volume of 2.962 million tons |
Note: Volume sold refers to total volume; Revenue figures not consolidated
Source: Public RIPI information
Note: Families include Gouvea, Tellechea, Mello, bastos, and Ormazabal families Source: Public Ipiranga information |
14 |
| Valuation summary | Section 2 |
RIPI valuation
RIPI’s share value ranges from R$51.63 to R$57.06 based on the economic value
Economic value | ||||||||||||||||
100% | Proportionate | |||||||||||||||
(R$ million) | TEV | TEV | ||||||||||||||
| IQ SA | 3,051 | 58.53 | % | 1,786 | ||||||||||||
CBPI SA | 4,029 | 11.42 | % | 460 | ||||||||||||
DPPI SA | 1,552 | 7.65 | % | 119 | ||||||||||||
RIPI Opco1 | 9 | 100.0 | % | 9 | ||||||||||||
RIPI – Total Enterprise Value | 2,373 | |||||||||||||||
| (-) net debt | (765 | ) | ||||||||||||||
| RIPI – Equity value | 1,609 | |||||||||||||||
| Total number of shares (million) | 29.6 | |||||||||||||||
Price per share – R$ per share | 51.63 | 54.35 | 57.06 | |||||||||||||
| -5 | % | +5 | % | |||||||||||||
Note: Figures in R$ million unless otherwise noted. (1) Based on multiples detailed on pages 61 and 83 Source: RIPI information and Deutsche Bank | ||||||||||||||||
Weighted average share price LTM to announcement(a) | ||||||||
ON | PN | |||||||
| Total volume (000’s) | 1,843 | 5,850 | ||||||
| W.A. share price (R$ per share) | 45.81 | 32.75 | ||||||
| (a) From 03/15/2006 to 03/16/2007 | ||||||||
Source: FactSet | ||||||||
Book value – RIPI SA | ||||
12/31/2006 | ||||
| Shareholder equity – (R$ million) | 577.3 | |||
| Total number of shares (million) | 29.6 | |||
| Book value per share (R$ per share) | 19.50 | |||
Note: Book value based on operating company financials as of 12/31/2006
Source: Company’s filings
Weighted average share price announcement to April 2, 2007(a) | ||||||||
ON | PN | |||||||
| Total volume (000’s) | 528 | 1,495 | ||||||
| W.A. share price (R$ per share) | 91.57 | 44.85 | ||||||
| (a) From 03/16/2007 to 04/02/2007 | ||||||||
Source: FactSet | ||||||||
15 |
| Valuation summary | Section 2 |
Tab C
DPPI
16 |
| Valuation summary | Section 2 |
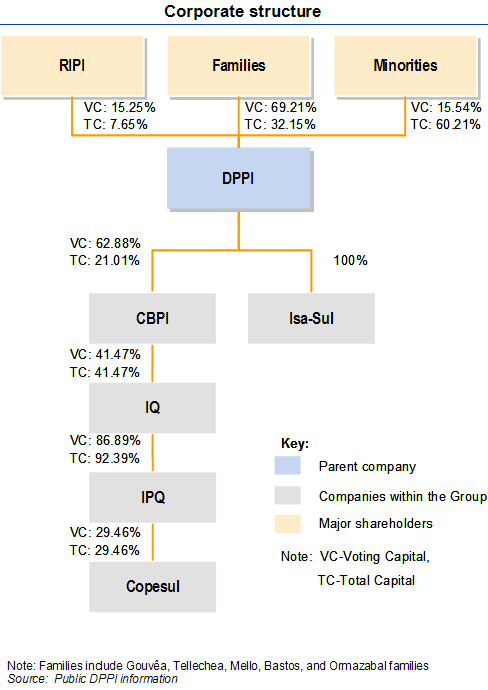
Distribuidora de Produtos de Petroleo Ipiranga SA – DPPI
Company description
| ■ | DPPI is a distributor of fuels in Southern Brazil |
| ■ | The Company delivers fuels to retail gas stations, industrial sites |
| ■ | Approximately 65% of volume is sold to retail gas stations |
| ■ | In 2006, core volume (gasoline, alcohol, and diesel fuels) was 1.8 billion cubic meters. Total volume (including GNV, lubricants, & others) was marginally higher |
| ■ | In 2006, the Company had 2.5% of the Brazilian market by volume sold |
Major subsidiaries
| ■ | Isa-Sul Administração e Participações (Isa-Sul) |
- | Owns 152 of the gas stations in DPPI’s region |
- | 2006 revenue of US$8.7 million and EBITDA of US$7.5 million |
| ■ | Companhia Brasileira de Petroleo Ipiranga (CBPI) |
- | A fuels distributor in Brazil, except in Rio Grande do Sul, Roraima and Amapá |
- | 2006 revenue of US$9.8 billion and volume sold of 12.2 billion cubic meters |
- | Through its ownership in CBPI, DPPI indirectly owns a minority stake in IQ, IPQ, and Copesul |
| ■ | Ipiranga Química (IQ) |
- | A wholesale distributor of chemical products with over 5,000 clients in 50 different markets |
- | 2006 revenue of US$212.3 million and EBITDA of US$9.5 million |
| ■ | Ipiranga Petroquímica (IPQ) |
- | A 2nd generation producer of high-end petrochemicals |
- | 2006 revenue of US$924.3 million and volume sold of 636,100 tons |
| ■ | Copesul |
- | A naphtha-based cracker owned by Ipiranga & Braskem |
- | 2006 revenue of US$2.9 billion and volume of 2.962 million tons |
Note: Volumes refer to volumes sold. Revenues are not consolidated
Source: Public DPPI information
Corporate structure Note: Families include Gouvea, Tellechea, Mello, Bastos, and Ormazabal families Source: Public Ipiranga information |
17 |
| Valuation summary | Section 2 |
DPPI valuation
DPPI’s share value ranges from R$41.11 to R$45.44 based on the economic value
Economic value | ||||||||||||||||
100% | Proportionate | |||||||||||||||
(R$ million) | TEV | TEV | ||||||||||||||
| CBPI | 4,029 | 21.01 | % | 847 | ||||||||||||
DPPI Opco1 | 706 | 100.00 | % | 706 | ||||||||||||
DIPPI – Total Enterprise Value | 1,552 | |||||||||||||||
| (-) net debt | (168 | ) | ||||||||||||||
| DPPI – Equity value | 1,385 | |||||||||||||||
| Total number of shares (million) | 32.0 | |||||||||||||||
Price per share – R$ per share | 41.11 | 43.28 | 45.44 | |||||||||||||
| -5 | % | +5 | % | |||||||||||||
Note: Figures in R$ million, except unless otherwise noted (1) Further details on page 83 | ||||||||||||||||
| Source: DPPI information and Deutsche Bank | ||||||||||||||||
Weighted average share price LTM to announcement(a) | ||||||||
ON | PN | |||||||
| Total volume (000’s) | 24 | 2,919 | ||||||
| W.A. share price (R$ per share) | 41.69 | 24.99 | ||||||
| (a) From 03/15/2006 to 03/16/2007 | ||||||||
Source: FactSet | ||||||||
Book value – DPPI SA | ||||
12/31/2006 | ||||
| Shareholder equity – (R$ million) | 804.0 | |||
| Total number of shares (million) | 32.0 | |||
| Book value per share (R$ per share) | 25.13 | |||
Note: Book value based on operating company financials as of 12/31/2006
Source: Company’s filings
Weighted average share price announcement to April 2, 2007(a) | ||||||||
ON | PN | |||||||
| Total volume (000’s) | 61 | 514 | ||||||
| W.A. share price (R$ per share) | 96.53 | 34.69 | ||||||
| (a) From 03/16/2007 to 04/02/2007 | ||||||||
Source: FactSet | ||||||||
18 |
| Valuation summary | Section 2 |
Tab D
CBPI
19 |
| Valuation summary | Section 2 |
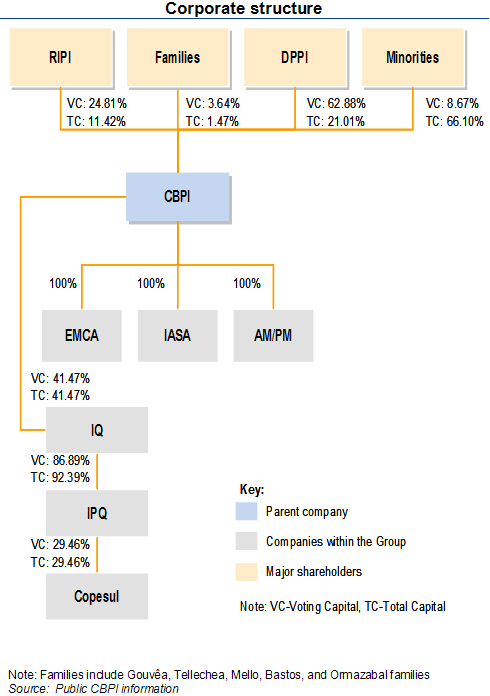
Companhia Brasileira de Petroleo Ipiranga – CBPI
Company description
| ■ | The largest company in the Ipiranga Group by revenue, CBPI is a distributor of fuels in Brazil, except in Rio Grande do Sul, Roraima and Amapá |
| ■ | The Company delivers fuels to retail gas stations, industrial sites |
| ■ | Approximately 65% of volume is sold to retail gas stations |
| ■ | In 2006, core volume (gasoline, alcohol, and diesel fuels) was 11.6 billion cubic meters. Total volume (including GNV, lubricants, & others) was 12.2 billion cubic meters |
| ■ | In 2006, the Company had 16.9% share of the Brazilian market by volume |
Major subsidiaries
| ■ | Empresa Carioca de Produtos Químicos (EMCA) |
- | Produces specialty oils with applications in the pharmaceutical, food, cosmetic, and plastics industries |
- | 2006 revenue of US$42.5 million and EBITDA of US$1.4 million |
| ■ | Ipiranga Asfaltos (IASA) |
- | Produces asphalt and asphalt additives, and provides pavement services |
- | 2006 sales of US$114.3 million and EBITDA of US$6.1 million |
| ■ | AM/PM Comestíveis |
- | A chain of retail convenience stores attached to CBPI gas stations |
- | 2006 sales of US$8.4 million and EBITDA of US$14.7 million, which includes other operating income |
| ■ | Ipiranga Química SA (IQ) |
- | A wholesale distributor of chemical products with over 5,000 clients in 50 different markets |
- | 2006 revenue of US$212.3 million and EBITDA of US$9.5 million |
| - | Through its ownership in IQ, CBPI, indirectly has a stake in IPQ and Copesul |
| ■ | Ipiranga Petroquímica (IPQ) |
- | A 2nd generation producer of high-end petrochemicals |
| - | 2006 revenue of US$924.3 million and volume sold of 636,100 tons |
| ■ | Copesul |
- | A naphtha-based cracker owned by Ipiranga & Braskem |
- | 2006 revenue of US$2.9 billion and volume of 2.962 million tons |
Source: Public CBPI information
Corporate structure Note: Families include Gouvea, Tellechea, Mello, Bastos, and Ormazabal families |
20 |
| Valuation summary | Section 2 |
CBPI’s share value ranges from R$26.97 to R$29.81 based on the economic value
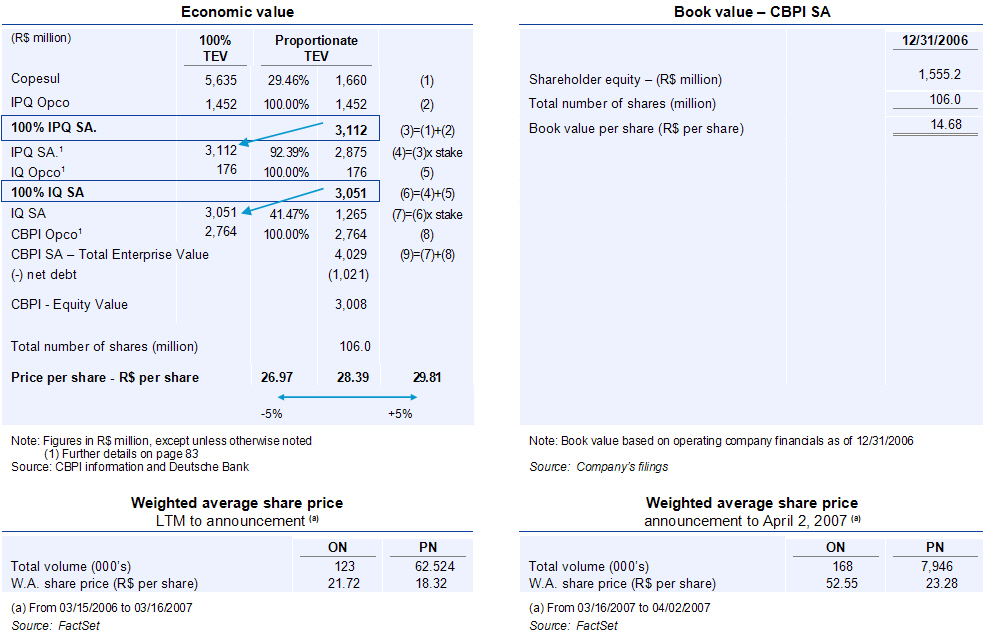 |
                   Economic value                                          Book value - CBPI
                   --------------                                          -----------------
(R$ million)  100%        Proportionate                                                     12/31/2006
              TEV         TEV                                                               ----------
Copesul       5,635       29.46% 1,660 (1)              Shareholder equity - (R$ million)      1,555.2
IPQ Opco      1,452      100.00% 1,452 (2)              Total number of shares (million)         106.0
100% IPQ SA.                     3,112 (3)=(1)+(2)      Book value per share (R$ per share)       14.68
IPQ SA.       3,112       92.39% 2,875 (4)=(3)x stake
IQ Opco         176      100.00%   176 (5)
100% IQ SA                       3,051 (6)=(4)+(5)
IQ SA         3,051       41.47% 1,265 (7)=(6)x stake
CBPI Opco     2,764      100.00% 2,764 (8)
CBPI - Total Enterprise Value             4,029 (9)=(7)+(8)
(-) net debt                             (1,021)
CBPI - Equity Value                       3,008
Total number of shares (million)          106.0
Price per share - R$ per share     26.97   28.39 29.81
                                    -----------------
                                   -5%               +5%
Note: Figures in R$ million, except unless otherwise noted  Note: Book value based on operating company financials
Source: Ipiranga information and Deutsche Bank                    as of 12/31/2006
                                                            Source: Company's filings

               Weighted average share price                           Weighted average share price
                  LTM to announcement (a)                           announcement to April 2, 2007 (a)
- -----------------------------------------------------  ----------------------------------------------------
                                     ON       PN                                            ON       PN
                                   ======= =========                                      ======= =========
Total volume (000's)                  123     62.524   Total volume (000's)                   168     7,946
W.A. share price (R$ per share)     21.72      18.32   W.A. share price (R$ per share)      52.55     23.28
(a) From 03/15/2006 to 03/16/2007                      (a) From 03/16/2007 to 04/02/2007
Source: FactSet                                        Source: FactSet
|
21 |
| Economic value of assets | Section 3 |
Section 3
Economic value of assets
22 |
| Economic value of assets | Section 3 |
Valuation considerations
The companies were valued on a stand-alone basis
The valuation of each asset excludes any potential synergies that could be achieved as a result of the transaction
DCF | ||
| n | Basic assumptions | |
| – | 10-year projections | |
| – | Base date of DCF valuation is December 31, 2006 | |
| – | Exchange rate of 2.1385 R$/US$ as of 12/31/2006 | |
| – | Models projected in nominal Brazilian Reais; cash flows were converted to US Dollars based on average exchange rate for the year | |
| – | WACC in nominal US Dollars | |
| – | To discount the annual cash flow to the present value, it considers that cash flow is generated in the middle of the year (in June)1 | |
| n | Perpetuity | |
| – | Calculated based on Gordon’s growth formula | |
| – | Adjustments to capex/ depreciation, tax rates, net operating working capital | |
| – | Petrochemical companies: perpetuity cash flow adjusted for mid-cycle | |
| n | Equity value | |
| – | TEV minus net debt (as defined in the glossary) | |
DCF valuation | ||
| n | Companhia Brasileira de Petróleo Ipiranga |
| n | Distribuidora de Prod. de Petróleo Ipiranga |
| n | Copesul Central Química |
| n | Ipiranga Petroquímica S.A. |
| n | Ultrapar Participações |
| Source: Ultrapar and Deutsche Bank |
Multiples | ||
| n | Basic assumptions | |
| – | Based on multiples of EBITDA | |
| n | Precedent transactions | |
| – | Applied to LTM EBITDA | |
| n | Trading comparables | |
| – | Applied to 2006 EBITDA except for petrochemicals, where an average of 3 - 5 years (normalized EBITDA) was used depending on the company | |
Multiple -based valuation | ||
| n | Ipiranga Química S.A. – precedent transactions |
| n | Empresa Carioca de Prod. Químicos S.A. – trading comps |
| n | Ipiranga Asfaltos – precedent transactions |
| n | AM/PM Comestíveis – trading comps |
| n | Isa-Sul Adm. e Part. Ltda – implied multiple from DPPI DCF |
| Source: Ultrapar and Deutsche Bank |
1 Assumes that the cash is generated evenly over the year, and for the purpose of discounting it to the net present value, it assumes the generation of cash occurs in the middle of the year (i.e. June), and not at the end of the year (i.e. December)
23 |
| Economic value of assets | Section 3 |
Weighted Average Cost of Capital and Cost of Equity
WACC and Ke
WACC definition

(US$ nominal)
Ipiranga companies | |||||||||
Ultrapar | CBPI | DPPI | Copesul | IPQ | |||||
| I. Beta calculation | |||||||||
1. Beta un-levered (a) | 0.64 | 0.90 | 0.90 | 0.86 | 0.86 | ||||
| Long-term optimal debt (D)/cap (D+E) ratio | 35% (b) | 40% (c) | 40% (c) | 50% (c) | 50% (c) | ||||
| Long-term optimal equity (E) /cap (D+E) ratio | 65% (b) | 60% (c) | 60% (c) | 50% (c) | 50% (c) | ||||
Marginal tax rate (tax)(d) | 22% | 26% | 23% | 33% | 25% | ||||
2. Re-levered equity beta (β) | 0.92 | 1.35 | 1.36 | 1.44 | 1.50 | ||||
II. Calculation of Cost of Capital | |||||||||
US risk free rate (Rfr) (e) | 4.5% p.a. | 4.5% p.a. | 4.5% p.a. | 4.5% p.a. | 4.5% p.a. | ||||
Local risk premium (CRP) (f) | 200 bps | 200 bps | 200 bps | 200 bps | 200 bps | ||||
| Local long-term risk free rate | 6.5% p.a. | 6.5% p.a. | 6.5% p.a. | 6.5% p.a. | 6.5% p.a. | ||||
US equity risk premium (ERP) (g) | 7.1% p.a. | 7.1% p.a. | 7.1% p.a. | 7.1% p.a. | 7.1% p.a. | ||||
3. Cost of Equity (Ke) | 13.0% p.a. | 16.1% p.a. | 16.2% p.a. | 16.7% p.a. | 17.2 p.a.% | ||||
| Local long-term risk free rate | 6.5% p.a. | 6.5% p.a. | 6.5% p.a. | 6.5% p.a. | 6.5% p.a. | ||||
Long-term corporate risk spread (h) | 150 bps | 200 bps | 200 bps | 200 bps | 200 bps | ||||
4. Cost of Debt (Kd) | 8.0% p.a. | 8.50% p.a. | 8.50% p.a. | 8.50% p.a. | 8.50% p.a. | ||||
5. WACC | 10.6% p.a. | 12.2% p.a. | 12.3% p.a. | 11.2% p.a. | 11.8% p.a. | ||||
| Note: | (a) Ultrapar’s beta is the observed and the betas for Grupo Ipiranga’s companies are the betas against the S&P 500 for the sample of companies that represent each industry. Based on 2 years of weekly betas. CBPI and DPPI’s betas were based on Pantry Inc, Casey’s General Stores, and Alimentacion Couche Tard Inc.2 Copesul and IPQ’s betas were based on Copesul, Braskem, Suzano Petroquímica, Petroquímica União, BASF and Nova Chemicals (source: Bloomberg as of February 18, 2007) |
| (b) Based on a more conservative company risk profile than the optimal capital structure for the industry | |
| (c) Based on comparable public companies | |
| (d) Marginal tax rates as provided by the management of the companies. Refer to supporting material in Appendix IV | |
(e) US risk free rate is the yield of the US Treasury (source: FactSet) | |
(f) Local risk premium based on spread of the sovereign bond to the equivalent US Treasury (source: Bloomberg) | |
| (g) Equity risk premium from Ibbotson’s 2006 report | |
(h) Long term corporate risk spreads are based on companies outstanding debt (source: the companies’ financials) |
Source: Bloomberg, Factset and the companies |
2 Pantry Inc., Casey’s General Stores, and Alimentation Couche Tard Inc. are businesses whose principal activities include the distribution of gasoline (77%, 71%, and 58% of 2006 sales respectively). The operation of convenience stores is a secondary activity totally dependent on the distribution of gasoline
24 |
| Economic value of assets | Section 3 |
Macroeconomic assumptions
US Economy | 2004A | 2005A | 2006A | 2007E | 2008E | 2009E | 2010E | 2011E | 2012E | 2013E | 2014E | 2015E | 2016E |
Inflation(1) | 1.6% | 2.6% | 2.3% | 2.0% | 2.0% | 2.0% | 2.0% | 2.0% | 2.0% | 2.0% | 2.0% | 2.0% | 2.0% |
US Treasury(1) | 4.1% | 4.1% | 4.7% | 4.5% | 5.0% | 5.0% | 5.0% | 5.0% | 5.0% | 5.0% | 5.0% | 5.0% | 5.0% |
Brazil Economy | 2004A | 2005A | 2006A | 2007E | 2008E | 2009E | 2010E | 2011E | 2012E | 2013E | 2014E | 2015E | 2016E |
GDP - real growth(2) | 4.9% | 2.3% | 2.9% | 3.5% | 3.7% | 3.6% | 3.4% | 3.3% | 3.1% | 3.0% | 3.0% | 3.0% | 3.0% |
| GDP - nominal growth | 12.8% | 9.7% | 6.1% | 7.4% | 7.8% | 7.2% | 7.0% | 6.9% | 6.7% | 6.6% | 6.6% | 6.6% | 6.6% |
Brazilian population growth(3) | 1.5% | 1.4% | 1.4% | 1.4% | 1.3% | 1.3% | 1.3% | 1.2% | 1.2% | 1.2% | 1.1% | 1.1% | 1.1% |
Inflation (IPCA)(1) | 7.6% | 5.7% | 3.1% | 3.8% | 4.0% | 3.5% | 3.5% | 3.5% | 3.5% | 3.5% | 3.5% | 3.5% | 3.5% |
Selic (average)(4) | 16.2% | 19.0% | 15.1% | 12.2% | 11.1% | 10.0% | 9.5% | 9.5% | 9.5% | 9.5% | 9.5% | 9.5% | 9.5% |
CDI (Brazilian interbank rate)(1) | 16.2% | 19.0% | 15.0% | 12.7% | 11.6% | 10.5% | 10.0% | 10.0% | 10.0% | 10.0% | 10.0% | 10.0% | 10.0% |
FX rate - eop(5) | 2.65 | 2.34 | 2.14 | 2.18 | 2.29 | 2.32 | 2.36 | 2.39 | 2.43 | 2.46 | 2.50 | 2.54 | 2.57 |
FX rate - avg(5) | 2.93 | 2.43 | 2.19 | 2.16 | 2.24 | 2.31 | 2.34 | 2.38 | 2.41 | 2.45 | 2.48 | 2.52 | 2.56 |
| Average R$ devaluation | (20.3%) | (9.9%) | (1.5%) | 3.7% | 3.0% | 1.5% | 1.5% | 1.5% | 1.5% | 1.5% | 1.5% | 1.5% |
Notes and Sources: |
| (1) Based on estimates of the market and Deutsche Bank |
(2) Based on IBGE’s old methodology3. Source: IBGE for 2004 to 2006, and based on estimates of the market and Deutsche Bank for 2007 and onwards |
| (3) IBGE – Brazilian Institute of Geography and Statistics |
(4) Market consensus for 2007 and 2008 (source: BCB, February 2007) and based on estimates of the market and Deutsche Bank for 2009 and onwards |
(5) Market consensus for 2007 and 2008 (source: BCB, February 2007). Brazil – USA purchase power parity (PPP) for 2009 onwards |
3IBGE had recently published the parameters of a new methodology for the calculation of Brazilian GDP, however at the time of publication of the Report, projections based on the new methodology were not available. We therefore consider it most appropriate to use the old methodology, based on which projections were available.
25 |
| Economic value of assets | Section 3 |
Tab A
Ultrapar
26 |
| Economic value of assets | Section 3 |
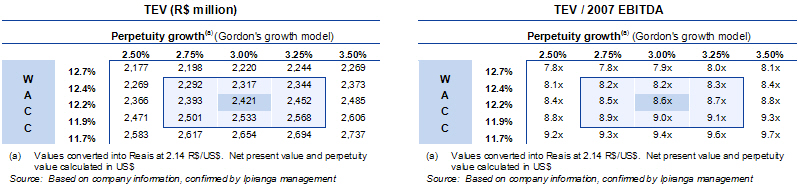
Ultrapar consolidated - DCF valuation
Ultrapar consolidates: Ultragaz, the #1 LPG distributor in Brazil, Oxiteno, the main producer of Ethylene Oxide and its main derivatives in Latin America, and Ultracargo, a logistic company for special products
2007E | 2008E | 2009E | 2010E | 2011E | 2012E | 2013E | 2014E | 2015E | 2016E | Perp. | ||||||||||||
1. EBIT | 157 | 163 | 218 | 239 | 249 | 251 | 257 | 286 | 297 | 347 | 364 | |||||||||||
| annual growth | n.a. | 4.1% | 33.2% | 9.7% | 4.4% | 0.6% | 2.4% | 11.3% | 3.9% | 16.8% | 5.0% | |||||||||||
(-) tax | (37) | (38) | (47) | (51) | (53) | (54) | (56) | (64) | (67) | (77) | (80) | |||||||||||
| effective tax rate | (23.4%) | (23.5%) | (21.6%) | (21.3%) | (21.1%) | (21.5%) | (21.7%) | (22.4%) | (22.6%) | (22.1%) | (22.1%) | |||||||||||
3. EBIT (-) tax | 120 | 125 | 171 | 188 | 197 | 197 | 201 | 222 | 230 | 270 | 284 | |||||||||||
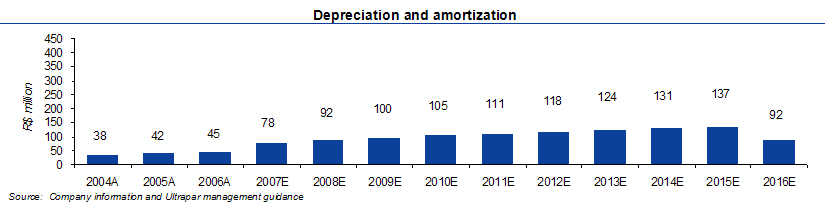
| (+) Depreciation & Amortization | 93 | 103 | 111 | 119 | 127 | 131 | 134 | 116 | 119 | 87 | 87 | |||||||||||
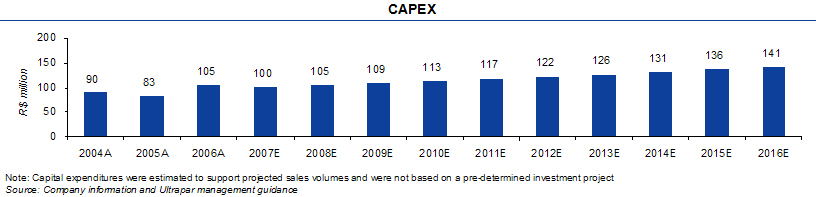
| (-) Capex | (253) | (154) | (103) | (96) | (99) | (101) | (104) | (106) | (100) | (98) | (87) | |||||||||||
| (-) Changes in net operating working capital | (7) | (19) | (50) | (21) | (19) | (17) | (16) | (13) | (11) | (11) | (11) | |||||||||||
4. Free cash flow to the Firm | (47) | 56 | 129 | 190 | 206 | 209 | 215 | 218 | 238 | 248 | 272 | |||||||||||
| annual growth | n.a | n.m | 130.4% | 47.8% | 8.3% | 1.5% | 3.0% | 1.5% | 9.0% | 4.0% | n.m |
Note: Annual free cash flow in US$ millions
Effective tax rate based on the effective tax rates of Ultragaz, Oxiteno, and Ultracargo
Perpetuity’s cash flow is based on long-term real growth of 3% corresponding to long-term expectations for GDP growth. These assumptions were evaluated in due diligence sessions confirmed by management of the businesses and are considered consistent with long-term growth expectations in each sector
Source: Company information and Ultrapar management guidance

TEV (R$ million) (R$ million) Perpetuity growth(a) (Gordon's growth model) (a) Values converted into Reais at 2.14 R$/US$. Net present value and perpetuity value calculated in US$ TEV/ 2007 EBITDA (R$ million) Perpetuity growth(a) (Gordon's growth model) (a) Values converted into Reais at 2.14 R$/US$. Net present value and perpetuity value calculated in US$ |
27 |
| Economic value of assets | Section 3 |
Assumptions - Ultragaz
Selected income statement drivers
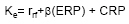
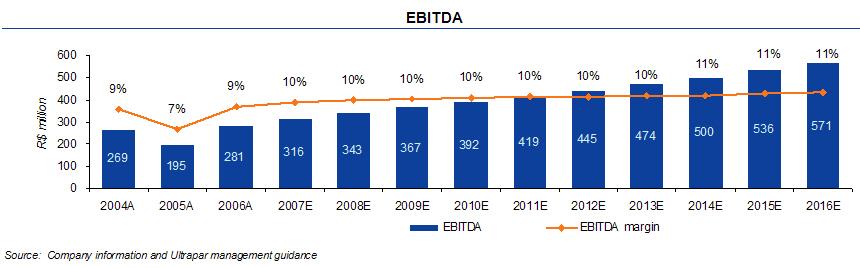
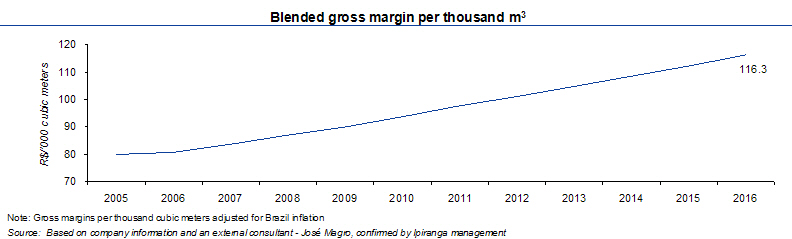
Bottled LPG volumes are driven by population growth, while Bulk sales are driven by GDP growth

Cash gross margins per ton are constant in real terms adjusted for Brazilian inflation

Note: Excludes depreciation Source: Company information and Ultrapar management guidance |
28 |
| Economic value of assets | Section 3 |
Assumptions - Ultragaz (continued)
Selected income statement drivers
Revenues are driven by increasing volumes and are adjusted for inflation
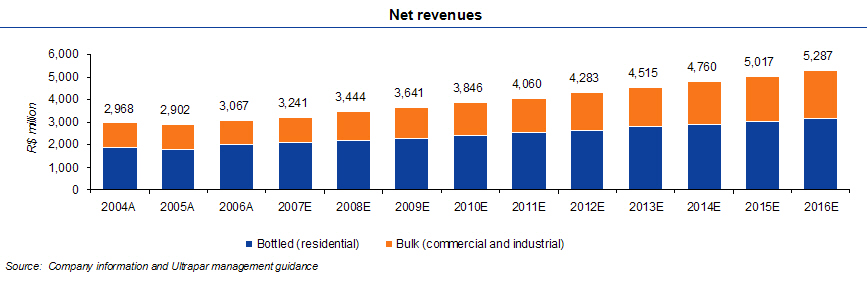
Selling expenses are constant as a percentage of sales, while General and Administrative expenses are adjusted for inflation
29 |
| Economic value of assets | Section 3 |
Assumptions - Ultragaz (continued)
Selected balance sheet drivers
Capex/ton is based on sales volumes and adjusted for inflation
Based on property, plant and equipment depreciation schedule

Change in net operating working capital | ||||||||||||||||||||||||
| Net operating working capital (R$ million) | 2005A | 2006A | 2007E | 2008E | 2009E | 2010E | 2011E | 2012E | 2013E | 2014E | 2015E | 2016E | ||||||||||||
| Net operating working capital | 150.2 | 126.4 | 133.5 | 141.9 | 150.0 | 158.5 | 167.4 | 176.6 | 186.2 | 196.3 | 207.0 | 218.2 | ||||||||||||
| (+) current assets | 216 | 203 | 215 | 228 | 241 | 255 | 269 | 284 | 299 | 316 | 333 | 351 | ||||||||||||
| (-) current liabilities | (65) | (77) | (81) | (87) | (91) | (97) | (102) | (107) | (113) | (119) | (126) | (132) | ||||||||||||
Change in net operating working capital | ||||||||||||||||||||||||
| (Increase) / Decrease in net operating working capital | (7) | (8) | (8) | (8) | (9) | (9) | (10) | (10) | (11) | (11) | ||||||||||||||
Source: Company information and Ultrapar management guidance
30 |
| Economic value of assets | Section 3 |
Assumptions - Oxiteno
Selected income statement drivers
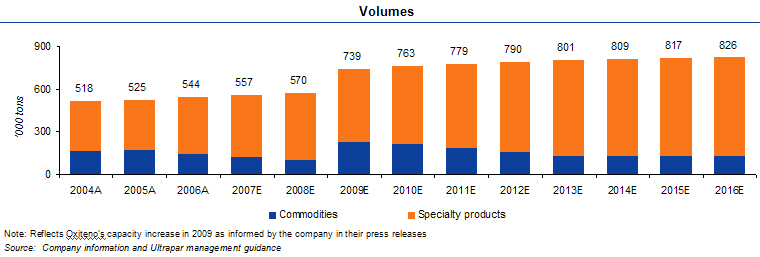
Oxiteno is currently in the process of increasing its capacity (expected to be fully operational in 2009)
Oxiteno’s strategy is to meet Brazil’s demand for specialties (expected to grow twice as fast as GDP)
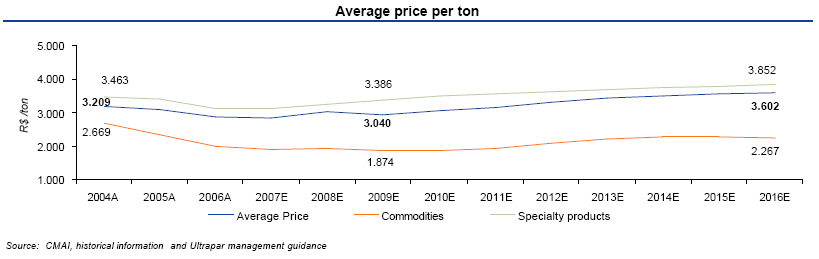
Specialties prices are constant in US Dollars and commodities prices are based on CMAI projections in US Dollars
31 |
| Economic value of assets | Section 3 |
Assumptions - Oxiteno (continued)
Selected income statement drivers
Revenue forecast reflects the capacity expansion and change in production mix

Sales are expected to shift over-time from commodities to specialties and from exports to the domestic market
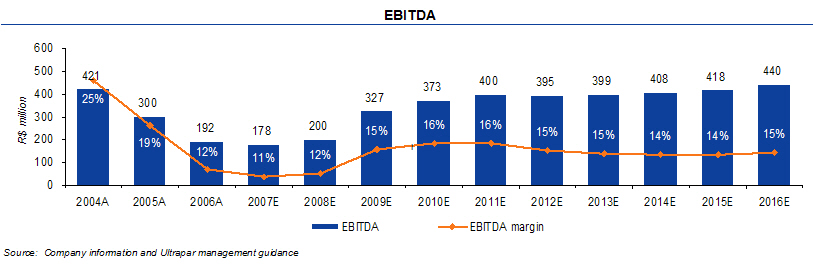
The production shift to specialties diminishes the cyclicality of the EBITDA margin
32 |
| Economic value of assets | Section 3 |
Assumptions - Oxiteno (continued)
Selected balance sheet drivers
Capex is based on Ultrapar guidance relating to the capacity increase

Based on property, plant and equipment depreciation schedule
Net operating working capital assumptions are in line with 2006
Change in net operating working capital | |||||||||||||||||||||||||||||||||||||
Net operating working capital (R$ million) | 2005A | 2006A | 2007E | 2008E | 2009E | 2010E | 2011E | 2012E | 2013E | 2014E | 2015E | 2016E | |||||||||||||||||||||||||
| Net operating working capital | 259.5 | 361.2 | 368.0 | 400.0 | 504.5 | 543.7 | 580.0 | 611.8 | 641.0 | 661.7 | 677.3 | 694.2 | |||||||||||||||||||||||||
| (+) current assets | 352 | 468 | 478 | 520 | 651 | 700 | 747 | 791 | 830 | 858 | 878 | 898 | |||||||||||||||||||||||||
| (-) current liabilities | (92 | ) | (107 | ) | (110 | ) | (120 | ) | (147 | ) | (157 | ) | (167 | ) | (179 | ) | (189 | ) | (196 | ) | (200 | ) | (204 | ) | |||||||||||||
Change in net operating working capital | |||||||||||||||||||||||||||||||||||||
| (Increase) / Decrease in net operating working capital | (7 | ) | (32 | ) | (105 | ) | (39 | ) | (36 | ) | (32 | ) | (29 | ) | (21 | ) | (16 | ) | (17 | ) | |||||||||||||||||
Source: Company information and Ultrapar management guidance
4 Relevant investment projects of the Oxiteno subsidiary are: expansion of the production capacity of ethylene oxide and specialty chemicals at Camaçari, Bahia; a new plant for fatty alcohols and derivatives at Camaçari, Bahia; and the expansion of production capacity of ethylene oxide and specialty chemicals at Mauá, São Paulo, as announced to the market through Ultrapar’s press releases dated August 17, 2006, and February 16, 2005
33 |
| Economic value of assets | Section 3 |
Assumptions - Ultracargo
Selected income statement drivers
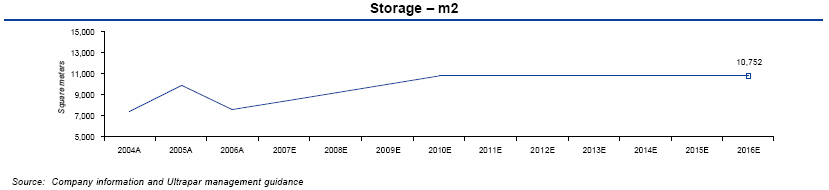
Storage capacity utilized increasing from 78% as of 2007 to 95% as of 2010 based on Ultracargo guidance
Transportation capacity utilized increasing from 84% as of 2007 to 95% as of 2010


34 |
| Economic value of assets | Section 3 |
Assumptions - Ultracargo (continued)
Selected income statement drivers
Revenues increase as a result of volume growth and price inflation

35 |
| Economic value of assets | Section 3 |
Assumptions - Ultracargo (continued)
Selected balance sheet drivers
Capacity increase between 2004 and 2006

Based on property, plant and equipment depreciation schedule

Net operating working capital assumptions are in line with 2006
Change in net operating working capital | |||||||||||||||||||||||||||||||||||||
| Net operating working capital (R$ million) | 2005A | 2006A | 2007E | 2008E | 2009E | 2010E | 2011E | 2012E | 2013E | 2014E | 2015E | 2016E | |||||||||||||||||||||||||
| Net operating working capital | 14.0 | 16.1 | 17.7 | 19.4 | 21.1 | 22.9 | 23.9 | 24.9 | 26.0 | 27.1 | 28.2 | 29.5 | |||||||||||||||||||||||||
| (+) current assets | 33 | 35 | 38 | 42 | 46 | 50 | 52 | 54 | 57 | 59 | 62 | 64 | |||||||||||||||||||||||||
| (-) current liabilities | (19 | ) | (19 | ) | (20 | ) | (23 | ) | (25 | ) | (27 | ) | (28 | ) | (29 | ) | (31 | ) | (32 | ) | (33 | ) | (35 | ) | |||||||||||||
Change in net operating working capital | |||||||||||||||||||||||||||||||||||||
| (Increase) / Decrease in net operating working capital | (2 | ) | (2 | ) | (2 | ) | (2 | ) | (1 | ) | (1 | ) | (1 | ) | (1 | ) | (1 | ) | (1 | ) | |||||||||||||||||
Source: Company information and Ultrapar management guidance
36 |
| Economic value of assets | Section 3 |
Tab B
Ultrapar prior to the share merger
37 |
| Economic value of assets | Section 3 |
Ultrapar prior to the share merger
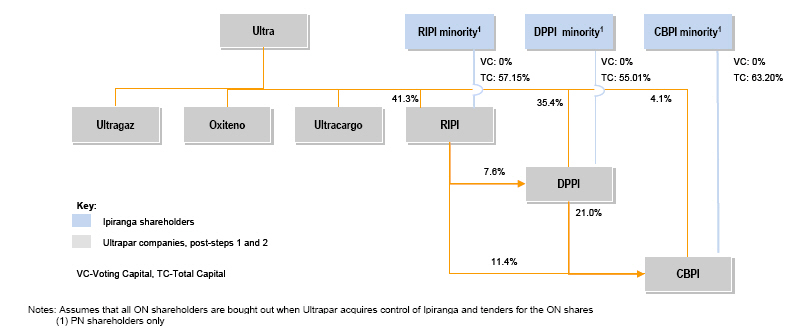
After completing the acquisition of the control block (step 1) and tendering for the other voting shareholders (step 2), Ultrapar will have acquired 41.3% of RIPI, 35.4% of DPPI, and 4.1% of CBPI
Ultrapar will spend R$876 million on steps 1 and 2
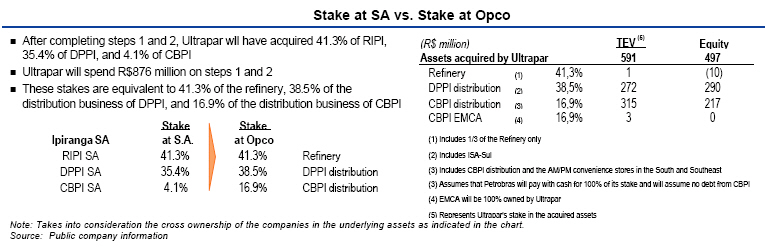
o After completing steps 1 and 2, Ultrapar will have acquired 41.3%
  of RIPI, 35.4% of DPPI, and 4.1% of CBPI
o Ultrapar will spend R$876 million on steps 1 and 2
o These stakes are equivalent to 41.3% of the refinery, 38.5% of the
  distribution business of DPPI, and 16.9% of the distribution
  business of CBPI

                Stake      Stake
Ipiranga SA    at S.A.    at Opco
- -----------    -------    -------
RIPI SA         41.3%      41.3%     Refinery
DPPI SA         35.4%      38.5%     DPPI
                                     distribution
                                     CBPI
CBPI SA          4.1%      16.9%     distribution


(R$ million)                      TEV (5)  Equity
Assets acquired by Ultrapar       591      497
- ------------------------------------------------------
Refinery          (1)     41,3%     1        (10)
DPPI                      38,5%   272        290
distribution      (2)
CBPI                      16,9%   315        217
distribution      (3)
CBPI EMCA         (4)     16,9%     3          0

(1) Includes 1/3 of the Refinery only
(2) Includes ISA-Sul
(3) Includes CBPI distribution and the AM/PM
    convenience stores in the South and Southeast
(3) Assumes that Petrobras will pay with cash for 100%
    of its stake and will assume no debt from CBPI
(4) EMCA will be 100% owned by Ultrapar
(5) Represents Ultrapar's stake in the acquired assets
|
38 |
| Economic value of assets | Section 3 |
Tab C
Fuel distribution - CBPI
39 |
| Economic value of assets | Section 3 |
CBPI distribution – DCF valuation
CBPI: A fuel distributor operating in Brazil, except Rio Grande do Sul, Roraima and Amapa
In addition to the distribution business, CBPI also consolidates AM/PM, IASA, and EMCA totaling R$2.7 billion TEV (refer to page 61)
| 2007E | 2008E | 2009E | 2010E | 2011E | 2012E | 2013E | 2014E | 2015E | 2016E | Perp. | ||||||||||||||||||||||||||||||||||
1. EBIT | 90 | 106 | 122 | 142 | 164 | 251 | 268 | 298 | 340 | 361 | 379 | |||||||||||||||||||||||||||||||||
| annual growth | n.a. | 18.3 | % | 14.7 | % | 16.5 | % | 15.7 | % | 52.6 | % | 6.9 | % | 11.0 | % | 14.1 | % | 6.3 | % | 5.1 | % | |||||||||||||||||||||||
(-) tax | (23 | ) | (27 | ) | (31 | ) | (36 | ) | (42 | ) | (64 | ) | (69 | ) | (76 | ) | (87 | ) | (93 | ) | (97 | ) | ||||||||||||||||||||||
| effective tax rate | (25.6 | %) | (25.6 | %) | (25.6 | %) | (25.6 | %) | (25.6 | %) | (25.6 | %) | (25.6 | %) | (25.6 | %) | (25.6 | %) | (25.6 | %) | (25.6 | %) | ||||||||||||||||||||||
3. EBIT (-) tax | 67 | 79 | 91 | 106 | 122 | 187 | 200 | 222 | 253 | 269 | 282 | |||||||||||||||||||||||||||||||||
| (+) Depreciation & Amortization | 41 | 47 | 52 | 60 | 69 | 78 | 86 | 84 | 73 | 84 | 83 | |||||||||||||||||||||||||||||||||
| (-) Capex, net of reimbursement | (74 | ) | (63 | ) | (91 | ) | (116 | ) | (134 | ) | (98 | ) | (105 | ) | (127 | ) | (144 | ) | (137 | ) | (130 | ) | ||||||||||||||||||||||
| (-) Changes in net operating working capital | (8 | ) | (46 | ) | (55 | ) | (58 | ) | (61 | ) | (37 | ) | (50 | ) | (51 | ) | (52 | ) | (59 | ) | (61 | ) | ||||||||||||||||||||||
4. Free cash flow to the Firm | 27 | 17 | (3 | ) | (8 | ) | (4 | ) | 130 | 131 | 128 | 130 | 156 | 174 | ||||||||||||||||||||||||||||||
| annual growth | n.a. | (37.9 | %) | (120.4 | %) | 125.6 | % | (43.1 | %) | n.a. | 0.4 | % | (1.8 | %) | 1.1 | % | 20.1 | % | n.m. | |||||||||||||||||||||||||
| Note: Annual free cash flow in US$ millions Cash flow in perpetuity reflects a 3% growth in sales volume compared to 2016 in line with GDP’s 3% long-term expected real growth. These assumptions were evaluated in due diligence sessions confirmed by management of the businesses and consistent with expectations of long-term growth in each sector | ||||||||||||||||||||||||||||||||||||||||||||
| Source: Based on company information, confirmed by Ipiranga management | ||||||||||||||||||||||||||||||||||||||||||||
TEV (R$ million) (R$ million) Perpetuity growth(a) (Gordon's growth model) (a) Values converted into Reais at 2.14 R$/US$. Net present value and perpetuity value calculated in US$ TEV/ 2007 EBITDA (R$ million) Perpetuity growth(a) (Gordon's growth model) (a) Values converted into Reais at 2.14 R$/US$. Net present value and perpetuity value calculated in US$ |
40 |
| Economic value of assets | Section 3 |
Assumptions – CBPI distribution
Selected income statement drivers
Gas and alcohol volumes in the Brazilian market were forecasted based on a regression on number of cars in Brazil as a function of GDP per capita, and consumption per car
Diesel volumes in the Brazilian market were projected as a result of a regression on diesel volumes in Brazil on GDP growth
Assumes the weighted average contribution margin of gasoline and ethanol is constant in
real Reais

5 CBPI has the objective of increasing its market share, which is deemed feasible by its management. This assumption was verified in a confirmatory due diligence session, and corroborated by the fact that CBPI gained 2 (two) percentage points of market share between 2001 and 2005, according to the National Petroleum Agency, ANP. However, the market consultant indicated that in order to gain 2 (two) percentage points market share in the coming years, it would demand stronger capex and higher marketing expenses to support this growth. It is expected that CBPI’s market share will stabilize at 18.9% after 2012, when CBPI sales will grow at the market pace, around 8% per year. A scenario in which sales would grow above this pace and therefore resulting in further market share increase would demand significant investments and is inconsistent with the expected increasing competition in the long term, considering a market dominated by 5 main players (which now control about 70% of the market) and numerous other players
41 |
| Economic value of assets | Section 3 |
Assumptions – CBPI distribution (continued)
Selected income statement drivers
Revenue increases driven by market share and gross margin per product increases

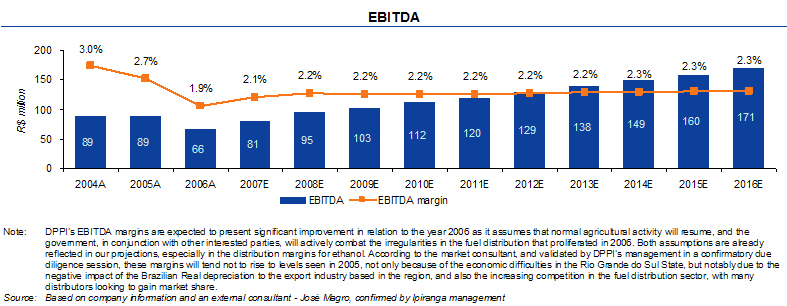
EBITDA margins in 2008-2011 are affected by selling expenses relating to market share growth, stabilized from 2012-2016
42 |
| Economic value of underlying assets | Section 3 |
Assumptions – CBPI distribution (continued)
Selected income statement drivers
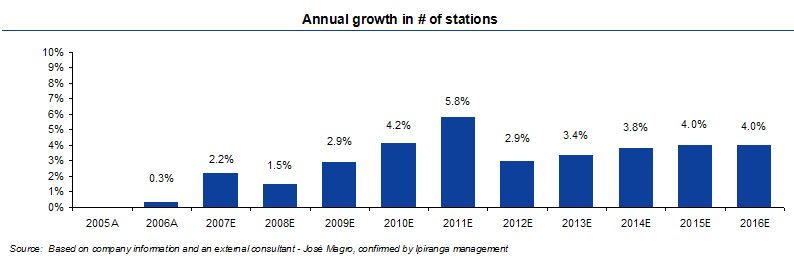
CBPI will increase the number of stations in its network by approximately 3.2% per year as a result of increased volumes of fuel and the increase in market share by 200 basis points
Selling expenses increase in 2007 through 2011 due to CBPI’s strategy to increase market share

43 |
| Economic value of underlying assets | Section 3 |
Assumptions – CBPI distribution (continued)
Selected balance sheet drivers
CAPEX based on number of new stores needed to increase market share as well as for renovating existing stations

Based on property, plant and equipment depreciation schedule
Net operating working capital assumptions are in line with 2006
Change in net operating working capital | ||||||||||||||||||||||||||||||||||||||||||||||||||||
Net operating working capital (R$ million) | 2005A | 2006A | 2007E | 2008E | 2009E | 2010E | 2011E | 2012E | 2013E | 2014E | 2015E | 2016E | ||||||||||||||||||||||||||||||||||||||||
| Net operating working capital | 671 | 872 | 889 | 992 | 1,119 | 1,253 | 1,399 | 1,487 | 1,608 | 1,734 | 1,863 | 2,015 | ||||||||||||||||||||||||||||||||||||||||
| (+) current assets | 1,342 | 1,491 | 1,681 | 1,882 | 2,126 | 2,386 | 2,668 | 2,888 | 3,123 | 3,377 | 3,651 | 3,947 | ||||||||||||||||||||||||||||||||||||||||
| (-) current liabilities | 671 | 618 | 792 | 890 | 1,007 | 1,133 | 1,270 | 1,401 | 1,515 | 1,644 | 1,788 | 1,931 | ||||||||||||||||||||||||||||||||||||||||
Change in net operating working capital | ||||||||||||||||||||||||||||||||||||||||||||||||||||
(Increase) / Decrease in net operating working capital | (17 | ) | (103 | ) | (127 | ) | (135 | ) | (145 | ) | (88 | ) | (122 | ) | (125 | ) | (130 | ) | (152 | ) | ||||||||||||||||||||||||||||||||
Source: Based on company information and an external consultant - José Magro, confirmed by Ipiranga management
44 |
| Economic value of assets | Section 3 |
Tab D
Fuel distribution - DPPI
45 |
| Economic value of assets | Section 3 |
DPPI distribution – DCF Valuation
DPPI: A fuel distributor operating in 2 states in the South of Brazil
Isa-Sul, a wholly owned subsidiary of DPPI, owns 152 gas stations in DPPI’s region. Isa-Sul is valued based on DPPI’s TEV multiple of 2006 EBITDA
Based on 2006 figures, Isa-Sul is valued at R$140 million (refer to pages 61 and 83)
DPPI opco including Isa-Sul is valued at R$706 million, or US$330 million (R$566 million related to DPPI ex-Isa Sul plus R$140 million related to Isa-Sul)
2007E | 2008E | 2009E | 2010E | 2011E | 2012E | 2013E | 2014E | 2015E | 2016E | Perp. | ||||||||||||||||||||||||||||||||||
1. EBIT | 29 | 34 | 35 | 37 | 39 | 41 | 44 | 48 | 55 | 58 | 63 | |||||||||||||||||||||||||||||||||
| annual growth | n.a. | 14.3 | % | 4.5 | % | 6.5 | % | 4.6 | % | 5.3 | % | 5.5 | % | 11.2 | % | 13.6 | % | 4.8 | % | 9.2 | % | |||||||||||||||||||||||
(-) tax | (7 | ) | (8 | ) | (8 | ) | (9 | ) | (9 | ) | (9 | ) | (10 | ) | (11 | ) | (13 | ) | (13 | ) | (14 | ) | ||||||||||||||||||||||
| effective tax rate | (22.8 | %) | (22.8 | %) | (22.8 | %) | (22.8 | %) | (22.8 | %) | (22.8 | %) | (22.8 | %) | (22.8 | %) | (22.8 | %) | (22.8 | %) | (22.8 | %) | ||||||||||||||||||||||
3. EBIT (-) tax | 23 | 26 | 27 | 29 | 30 | 32 | 34 | 37 | 42 | 44 | 49 | |||||||||||||||||||||||||||||||||
| (+) Depreciation & Amortization | 8 | 9 | 10 | 10 | 11 | 12 | 13 | 11 | 8 | 9 | 19 | |||||||||||||||||||||||||||||||||
| (-) Capex | (15 | ) | (8 | ) | (6 | ) | (11 | ) | (8 | ) | (13 | ) | (12 | ) | (12 | ) | (12 | ) | (9 | ) | (19 | ) | ||||||||||||||||||||||
| (-) Changes in net operating working capital | (12 | ) | (13 | ) | (13 | ) | (12 | ) | (10 | ) | (11 | ) | (11 | ) | (12 | ) | (12 | ) | (13 | ) | (14 | ) | ||||||||||||||||||||||
4. Free cash flow to the Firm | 5 | 14 | 18 | 17 | 23 | 20 | 23 | 25 | 27 | 31 | 35 | |||||||||||||||||||||||||||||||||
| annual growth | n.a. | 199.4 | % | 28.0 | % | (6.2 | %) | 38.7 | % | (12.7 | %) | 14.0 | % | 6.4 | % | 7.7 | % | 18.4 | % | n.m. | ||||||||||||||||||||||||
Note: | Annual free cash flow in US$ millions Cash flow in perpetuity reflects a 3% growth in sales volume compared to 2016 in line with GDP’s 3% long-term expected real growth. These assumptions were evaluated in due diligence sessions confirmed by management of the businesses and consistent with expectations of long-term growth in each sector |
Source: | Based on company information, confirmed by Ipiranga management |

TEV (R$ million) (R$ million) Perpetuity growth(a) (Gordon's growth model) (a) Values converted into Reais at 2.14 R$/US$. Net present value and perpetuity value calculated in US$ TEV/ 2007 EBITDA (R$ million) Perpetuity growth(a) (Gordon's growth model) (a) Values converted into Reais at 2.14 R$/US$. Net present value and perpetuity value calculated in US$ |
46 |
| Economic value of assets | Section 3 |
Assumptions – DPPI distribution
Selected income statement drivers
Gas and alcohol volumes in the Brazilian market were forecasted based on a regression on number of cars in Brazil as a function of GDP per capita, and consumption per car
Diesel volumes in the Brazilian market were projected as a result of a regression on diesel volumes in Brazil on GDP growth

Given its leadership in the region, DPPI presents little market share fluctuation

DPPI’s market share remains approximately constant because DPPI is a leader in the region in which it operates – Rio Grande do Sul and Santa Catarina – with an already high 35% (thirty-five percent) market share. Nationally, DPPI reduced its market share from 2.9% in 2001 to 2.6% in 2005 according to the National Petroleum Agency – ANP. As per the recommendation of the market consultant, which was validated on confirmatory due diligence session with DPPI’s management, DPPI would tend to maintain its market share given DPPI’s dominant position in the region, or even lose some market participation to competition in line with the company’s recent performance.
47 |
| Economic value of assets | Section 3 |
Assumptions – DPPI distribution (continued)
Selected income statement drivers
Revenues driven by volumes and contribution margin per product
Projected EBITDA margin is expected to improve in relation to 2006
48 |
| Economic value of assets | Section 3 |
Assumptions – DPPI distribution
Selected balance sheet drivers
CAPEX based on the number of new stores needed to increase market share as well as for renovating existing stations

Based on propery, plant and equipment depreciation schedule

Net operating working capital assumptions are in line with 2006
Change in net operating working capital | ||||||||||||||||||||||||||||||||||||||||||||||||||||
Net operating working capital (R$ million) | 2005A | 2006A | 2007E | 2008E | 2009E | 2010E | 2011E | 2012E | 2013E | 2014E | 2015E | 2016E | ||||||||||||||||||||||||||||||||||||||||
| Net operating working capital | 145 | 255 | 280 | 310 | 340 | 368 | 392 | 417 | 445 | 475 | 506 | 539 | ||||||||||||||||||||||||||||||||||||||||
| (+) current assets | 232 | 310 | 338 | 375 | 412 | 446 | 474 | 505 | 539 | 575 | 613 | 653 | ||||||||||||||||||||||||||||||||||||||||
| (-) current liabilities | 87 | 55 | 59 | 65 | 71 | 77 | 82 | 88 | 93 | 100 | 107 | 114 | ||||||||||||||||||||||||||||||||||||||||
Change in net operating working capital | ||||||||||||||||||||||||||||||||||||||||||||||||||||
(Increase) / Decrease in net operating working capital | (25 | ) | (30 | ) | (31 | ) | (28 | ) | (23 | ) | (26 | ) | (28 | ) | (29 | ) | (31 | ) | (33 | ) | ||||||||||||||||||||||||||||||||
Source: | Based on company information and an external consultant - José Magro, confirmed by Ipiranga management |
49 |
| Economic value of assets | Section 3 |
Tab E
Copesul
50 |
| Economic value of assets | Section 3 |
Copesul – DCF valuation
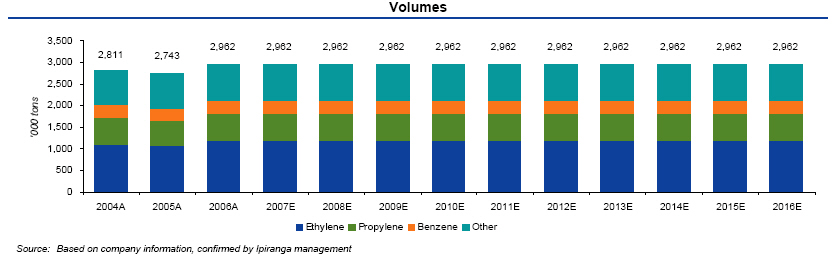
Copesul is a naphtha-based cracker jointly controlled by Ipiranga (29.5%) and Braskem (29.5%)
2006 production consisted of 39% ethylene, 20% propylene, 10% benzene, and 31% other by-products
2007E | 2008E | 2009E | 2010E | 2011E | 2012E | 2013E | 2014E | 2015E | 2016E | Perp. | ||||||||||||||||||||||||||||||||||
1. EBIT | 402 | 294 | 273 | 228 | 231 | 315 | 365 | 454 | 521 | 488 | 374 | |||||||||||||||||||||||||||||||||
| annual growth | (3.6 | %) | (26.9 | %) | (6.9 | %) | (16.5 | %) | 1.1 | % | 36.6 | % | 15.6 | % | 24.6 | % | 14.6 | % | (6.4 | %) | 2.0 | % | ||||||||||||||||||||||
(-) tax | (132 | ) | (96 | ) | (90 | ) | (75 | ) | (76 | ) | (103 | ) | (119 | ) | (149 | ) | (171 | ) | (160 | ) | (122 | ) | ||||||||||||||||||||||
| effective tax rate | (32.8 | %) | (32.8 | %) | (32.8 | %) | (32.8 | %) | (32.8 | %) | (32.8 | %) | (32.8 | %) | (32.8 | %) | (32.8 | %) | (32.8 | %) | (32.8 | %) | ||||||||||||||||||||||
3. EBIT (-) tax | 270 | 198 | 184 | 154 | 155 | 212 | 245 | 306 | 350 | 328 | 251 | |||||||||||||||||||||||||||||||||
| (+) Depreciation & Amortization | 109 | 107 | 105 | 105 | 45 | 8 | 9 | 11 | 12 | 13 | 31 | |||||||||||||||||||||||||||||||||
| (-) Capex | (26 | ) | (26 | ) | (27 | ) | (27 | ) | (28 | ) | (28 | ) | (29 | ) | (29 | ) | (30 | ) | (30 | ) | (31 | ) | ||||||||||||||||||||||
| (-) Changes in net operating working capital | 24 | 41 | 4 | 17 | (5 | ) | (42 | ) | (26 | ) | (45 | ) | (35 | ) | 10 | 0 | ||||||||||||||||||||||||||||
4. Free cash flow to the Firm | 378 | 319 | 266 | 248 | 169 | 150 | 199 | 242 | 297 | 321 | 251 | |||||||||||||||||||||||||||||||||
| annual growth | n.a. | (15.5 | %) | (16.6 | %) | (6.6 | %) | (32.2 | %) | (11.2 | %) | 33.1 | % | 21.3 | % | 23.0 | % | 7.9 | % | n.m. | ||||||||||||||||||||||||
Note: | Annual free cash flow in US$ millions |
Source: | Based on company information, confirmed by Ipiranga management |
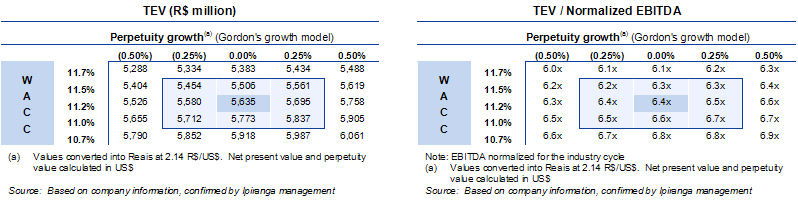
TEV (R$ million)
- ----------------
(a) Values converted into Reais at 2.14 R$/US$. Net present
    value and perpetuity value calculated in US$
Source: Based on company information, confirmed by Ipiranga
management

TEV/Normalized EBITDA
- ---------------------
Note: EBITDA normalized for the industry cycle
(a) Values converted into Reais at 2.14 R$/US$. Net present
    value and perpetuity value calculated in US$
Source: Based on company information, confirmed by Ipiranga
management
|
51 |
| Economic value of assets | Section 3 |
Assumptions – Copesul
Selected income statement drivers
Volumes remain constant at 2006 levels
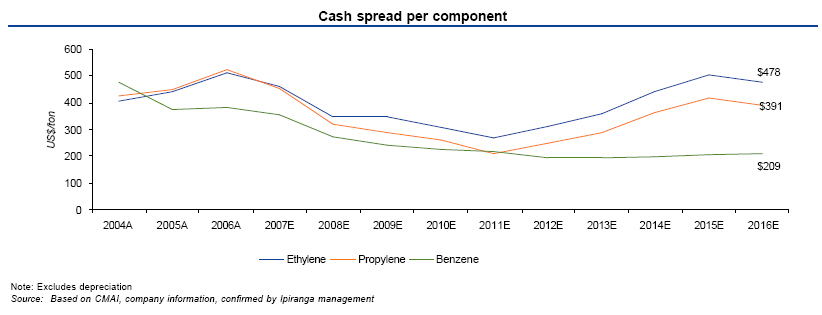
Gross margin was driven by ethylene, propylene, and benzene cash spreads based on CMAI data adjusted for Brazil
52 |
| Economic value of assets | Section 3 |
Assumptions – Copesul (continued)
Selected income statement drivers
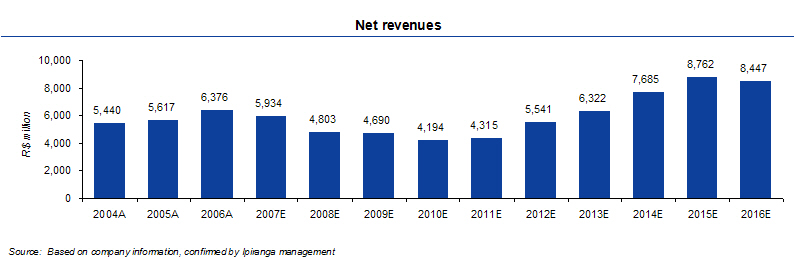
Revenues projected as a constant spread to gross margin
EBITDA margins reflect the ethylene business cycle, based on CMAI data
53 |
| Economic value of assets | Section 3 |
Assumptions – Copesul (continued)
Selected balance sheet drivers
Maintenance CAPEX projected based on company, information confirmed by management

Based on property, plant and equipment depreciation schedule
Net operating working capital assumptions are in line with 2006
Change in net operating working capital | ||||||||||||||||||||||||||||||||||||||||||||||||||||
| Net operating working capital (R$ million) | 2005A | 2006A | 2007E | 2008E | 2009E | 2010E | 2011E | 2012E | 2013E | 2014E | 2015E | 2016E | ||||||||||||||||||||||||||||||||||||||||
| Net operating working capital | 459 | 557 | 506 | 414 | 406 | 366 | 377 | 478 | 543 | 655 | 744 | 719 | ||||||||||||||||||||||||||||||||||||||||
(+) current assets | 795 | 1,061 | 982 | 795 | 776 | 694 | 714 | 917 | 1,046 | 1,272 | 1,450 | 1,398 | ||||||||||||||||||||||||||||||||||||||||
| (-) current liabilities | 336 | 504 | 476 | 380 | 370 | 328 | 337 | 439 | 503 | 617 | 706 | 678 | ||||||||||||||||||||||||||||||||||||||||
Change in net operating working capital | ||||||||||||||||||||||||||||||||||||||||||||||||||||
(Increase) / Decrease in net operating working capital | 51 | 92 | 8 | 40 | (11 | ) | (101 | ) | (65 | ) | (112 | ) | (89 | ) | 25 | |||||||||||||||||||||||||||||||||||||
Source: Based on company information, confirmed by Ipiranga management
54 |
| Economic value of assets | Section 3 |
Tab F
IPQ
55 |
| Economic value of assets | Section 3 |
IPQ - DCF valuation
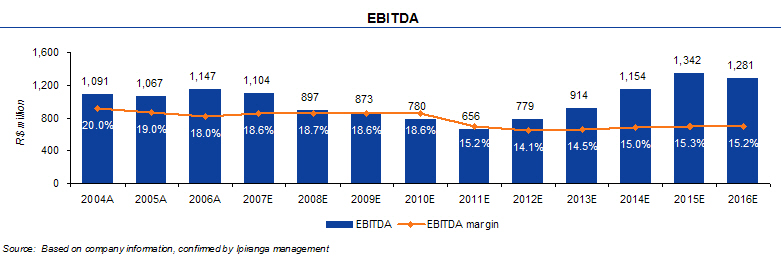
IPQ is a 2nd generation producer of high-end petrochemicals
In 2006, volume sold reached 638,000 tons
2007E | 2008E | 2009E | 2010E | 2011E | 2012E | 2013E | 2014E | 2015E | 2016E | Perp. | ||||||||||||||||||||||||
1. EBIT | 87 | 89 | 86 | 73 | 83 | 79 | 86 | 96 | 106 | 104 | 80 | |||||||||||||||||||||||
| annual growth | n.a. | 2.2 | % | (3.2 | %) | (15.9 | %) | 14.2 | % | (4.7 | %) | 8.8 | % | 12.2 | % | 10.5 | % | (2.7 | %) | 2.0 | % | |||||||||||||
(-) tax | (22 | ) | (22 | ) | (22 | ) | (18 | ) | (21 | ) | (20 | ) | (21 | ) | (24 | ) | (27 | ) | (26 | ) | (20 | ) | ||||||||||||
| effective tax rate | (25.0 | %) | (25.0 | %) | (25.0 | %) | (25.0 | %) | (25.0 | %) | (25.0 | %) | (25.0 | %) | (25.0 | %) | (25.0 | %) | (25.0 | %) | (25.0 | %) | ||||||||||||
3. EBIT (-) tax | 65 | 67 | 65 | 54 | 62 | 59 | 64 | 72 | 80 | 78 | 60 | |||||||||||||||||||||||
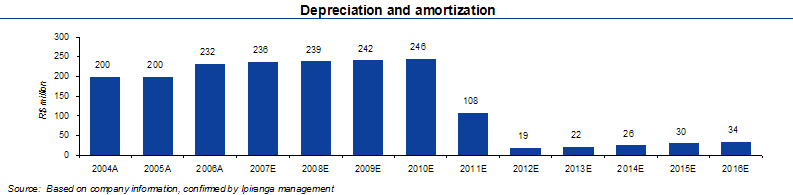
| (+) Depreciation & Amortization | 15 | 15 | 15 | 15 | 15 | 16 | 16 | 16 | 16 | 16 | 17 | |||||||||||||||||||||||
| (-) Capex | (5 | ) | (5 | ) | (5 | ) | (6 | ) | (6 | ) | (6 | ) | (6 | ) | (6 | ) | (6 | ) | (6 | ) | (17 | ) | ||||||||||||
| (-) Changes in net operating working capital | 15 | (0 | ) | 0 | (1 | ) | 1 | (1 | ) | (1 | ) | (1 | ) | 1 | (1 | ) | 0 | |||||||||||||||||
4. Free cash flow to the Firm | 90 | 77 | 75 | 63 | 73 | 68 | 74 | 82 | 91 | 87 | 60 | |||||||||||||||||||||||
| annual growth | n.a. | (15.2 | %) | (2.3 | %) | (15.5 | %) | 14.9 | % | (6.4 | %) | 8.6 | % | 10.5 | % | 11.1 | % | (3.9 | %) | n.m. |
Note: Annual free cash flow in US$ millions
Source: Based on company information, confirmed by Ipiranga management
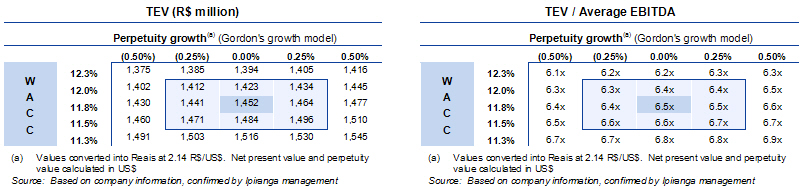
TEV (R$ million) (R$ million) Perpetuity growth(a) (Gordon's growth model) (a) Values converted into Reais at 2.14 R$/US$. Net present value and perpetuity value calculated in US$ TEV/ Average EBITDA (R$ million) Perpetuity growth(a) (Gordon's growth model) (a) Values converted into Reais at 2.14 R$/US$. Net present value and perpetuity value calculated in US$ |
56 |
| Economic value of assets | Section 3 |
Assumptions - IPQ
Selected income statement drivers
Volumes remain flat at 600 thousand tons based on company information confirmed by Ipiranga management
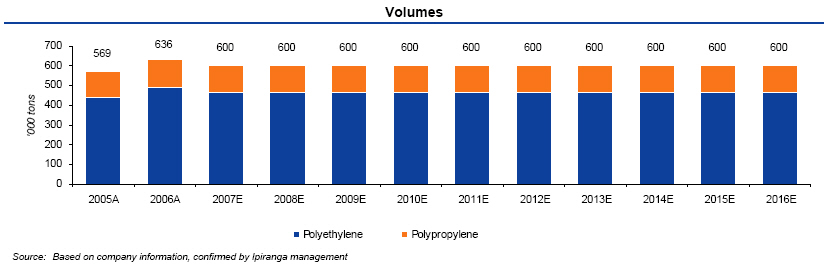
Gross margin is based on cash spreads of Polyethylene and Polypropylene based on adjusted CMAI forecasts

57 |
| Economic value of assets | Section 3 |
Assumptions - IPQ (continued)
Selected balance sheet drivers
CMAI price forecasts for Polyethylene and Polypropylene in US Dollars

58 |
| Economic value of assets | Section 3 |
Assumptions - IPQ (continued)
Selected balance sheet drivers
Maintenance CAPEX projected based on company information, confirmed by Ipiranga management
Based on property, plant and equipment depreciation schedule

Net operating working capital assumptions are in line with 2006
Change in net operating working capital | |||||||||||||||||||||||||||||||||||||
| Net operating working capital (R$ million) | 2005A | 2006A | 2007E | 2008E | 2009E | 2010E | 2011E | 2012E | 2013E | 2014E | 2015E | 2016E | |||||||||||||||||||||||||
| Net operating working capital | (36 | ) | 68 | 36 | 36 | 36 | 38 | 37 | 40 | 41 | 43 | 41 | 43 | ||||||||||||||||||||||||
| (+) current assets | 409 | 619 | 517 | 522 | 474 | 438 | 437 | 462 | 509 | 588 | 570 | 564 | |||||||||||||||||||||||||
| (-) current liabilities | 445 | 551 | 481 | 486 | 439 | 400 | 400 | 422 | 468 | 545 | 529 | 522 | |||||||||||||||||||||||||
Change in net operating working capital | |||||||||||||||||||||||||||||||||||||
| (Increase) / Decrease in net operating working capital | 32 | (0 | ) | 1 | (3 | ) | 1 | (3 | ) | (1 | ) | (2 | ) | 2 | (2 | ) | |||||||||||||||||||||
Source: Based on company information, confirmed by Ipiranga management | |||||||||||||||||||||||||||||||||||||
59 |
| Economic value of assets | Section 3 |
Tab G
Valuation of other assets based on multiples
60 |
| Economic value of assets | Section 3 |
Valuation summary - Other
TEV/’06 | ||||||
Company | Description | TEV (R$mm) | EBITDA | |||
| n | The business has operated on a break even basis (sometimes given | |||||
| Refinaria de Petróleo Ipiranga | special tax incentives by the State) | 9 | 6.5x | |||
| (RIPI) | (pg. 77) | |||||
n | Valuation based on comparable trading companies detailed on page 77 | |||||
n | A chemical products distributor with over 5,000 clients in 50 different | |||||
| Ipiranga Química S.A. (IQ) | markets | 176 | 8.6x | |||
| (pg. 76) | ||||||
| n | Valuation based on precedent transactions detailed on page 76 | |||||
n | A producer of specialty petrochemicals; consolidated by CBPI SA | |||||
| Empresa Carioca de Produtos | n | Valuation based on comparable trading companies | 18 | 6.3x | ||
| Químicos S.A. (EMCA) | (pg. 75) | |||||
n | Comparable sample includes both specialty and commodity | |||||
| petrochemical trading companies detailed on page 75 | ||||||
| n | A producer of asphalt and pavement surface products | |||||
| Ipiranga Asfaltos (IASA) | 89 | 6.8x | ||||
n | Valuation based on precedent transactions detailed on page 77 | (pg. 77) | ||||
n | A retail convenience store chain attached to DPPI and CBPI gas stations, | |||||
| AM/PM Comestíveis | consolidated by CBPI | 236 | 7.5x | |||
| (pg. 76) | ||||||
n | Valuation based on comparable trading companies detailed on page 76 | |||||
| n | A subsidiary that owns 152 and operates 15 of the gas stations in DPPI’s | |||||
| Isa-Sul Administração e Part. Ltda. | region | 140 | 8.8x | |||
| (pg. 83) | ||||||
| n | Valuation based on the same multiple as DPPI implied by the DCF as described on note (1) below |
| Note: All valuation based on the median of the sample of multiples of comparable companies applied to metrics in US dollars, unless otherwise noted |
Valuation was estimated based on EBITDA multiples given that EBITDA is a proxy for cash flow generation. The use of EBITDA as a value driver has the advantage of taking into consideration profitability combined with mitigating the impact of financial leverage (1) 8.8x=US$265 million/US$ 30 million; equivalent to TEV of DPPI (ex-Isa Sul) in US dollars divided by EBITDA of DPPI (ex- Isa Sul) in 2006 in US dollars |
Source: Company information and Wall Street Research
61 |
Final considerations | Section 4 |
Section 4
Final considerations
62 |
| Final considerations | Section 4 |
Share price range
Share price range based on the economic value (R$ per share)
-5% | Mid-range | +5% | ||||
| CBPI | 26.97 | 28.39 | 29.81 | |||
| DPPI | 41.11 | 43.28 | 45.44 | |||
| RIPI | 51.63 | 54.35 | 57.06 | |||
| Ultrapar | 64.48 | 67.87 | 71.26 |
Note: 10% range in compliance with the CVM Resolution #361/02.
63 |
| Glossary | Section 5 |
Section 5
Glossary
64 |
| Glossary | Section 5 |
| n | Beta: beta against the S&P500, a measure of systemic risk |
| n | Capital Asset Pricing Model (CAPM): methodology used to define the cost of equity |
| n | Capex: Capital Expenditures |
| n | Cost of Equity (Ke): return required by the equity holder |
| n | Cost of debt(Kd): cost of third party financing |
| n | CVM: Comissão de Valores Mobiliários |
| n | D&A: depreciation and amortization |
| n | Net debt: Cash and cash equivalents, net position in derivatives, export notes, short and long-term bank loans, receivable and payable dividends, short and long-term receivables and payables related to debentures, short and long-term pension funds deficits, provisions, and other receivables and payables to related parties, including subscription bonus (“bônus de subscrição”) |
| n | Drivers: value drivers or key drivers |
| n | EBIT: Earnings Before Interests and Taxes |
| n | EBITDA: Earnings Before Interest, Taxes, Depreciation and Amortization |
| n | EMBI: Emerging Markets Bond Index – Brazil is a proxi for the Brazilian sovereign debt yield curve. The EMBI-Brazil accounts for the weighted average premium of the Brazilian sovereign bonds to the US Treasury, which risk is perceived as practically zero (source: O Estado de São Paulo) |
| n | EV or TEV: Enterprise value |
| n | Equity value: TEV minus net debt |
| n | Dollar: American Dollar |
| n | DCF: Discounted cash flow |
| n | FCFF: Free Cash Flow to Firm |
| n | Operating cash flow: relates to cash inflows and outflows solely related to the operations |
| n | Free float: percentage of shares in circulation of the total capital of the company |
65 |
| Glossary | Section 5 |
| n | JCP: interest on capital (“Juros sobre Capital Próprio”) |
| n | LTM: Last twelve months |
| n | Gross income: Total revenue, excluding deductions from sales and costs of production |
| n | IPCA: consumer price index |
| n | NOPLAT: Net Operating Profit Less Adjusted Taxes |
| n | ON: “Ação Ordinária” ordinary or voting share |
| n | PN: “Ação Preferencial” preferred or non-voting share |
| n | GDP: Gross Domestic Product defined as goods and services produced in a country excluding expenses utilized in the process of production during a year. A method of measuring the total value generated by all economic activities |
| n | Nominal GDP is GDP in nominal terms, including inflation. Real GDP is GDP in constant dollars in which the growth rate excludes inflation |
| n | ERP: equity risk premium is the expected premium for investing in stocks |
| n | CRP: country risk premium is the expected premium for investing in a certain specific country |
| n | Spread: price or yield differential |
| n | “Tag-along”: (minority) shareholders right to join a transaction in which another shareholder (usually controlling shareholder) is selling their stake. In Brazil, the legislation specifies that voting shareholders of public entities have the right to receive a minimum offer of 80% the price to be paid for control (the 80% tag-along right) |
66 |
| Glossary | Section 5 |
| n | Terminal value: value of the company at the end of the projection |
| n | Total Enterprise Value (TEV): Total value of the company calculated based on economic value of shareholders’ equity plus net debt |
| n | Risk free rate: US Treasury |
| n | Return on Capital ("ROC"): = growth rate divided by reinvestment rate |
| n | Reinvestment rate: = (Capex-Depreciation plus Change in non-cash working capital) devided by (EBIT x (1-tax rate) |
| n | VP: Present value |
| n | WACC: Weighted Average Cost of Capital |
67 |
| Share price evolution | Appendix I |
Appendix I
Share price evolution
68 |
| Share price evolution | Appendix I |
Weighted average share prices - 3/17/06 - 3/17/07
Ultrapar (Share price in R$, Volume in ‘000’s)
Month | PN Price | Volume | ||
March-06(a) | 38.27 | 676 | ||
| April-06 | 36.41 | 990 | ||
| May-06 | 36.99 | 1,078 | ||
| June-06 | 34.49 | 1,511 | ||
| July-06 | 33.88 | 1,159 | ||
| August-06 | 35.51 | 1,503 | ||
| September-06 | 38.48 | 905 | ||
| October-06 | 40.40 | 1,296 | ||
| November-06 | 47.58 | 1,702 | ||
| December-06 | 47.75 | 1,088 | ||
| January-07 | 51.07 | 1,938 | ||
| February-07 | 53.02 | 2,530 | ||
March-07(b) | 50.78 | 733 | ||
WA share price | R$43.1 |
Notes: (a) March 17, 2006, to March 31, 2006 (15 days)
(b) March 1, 2007, to March16, 2007 (16 days)
(b) March 1, 2007, to March16, 2007 (16 days)
Source: FactSet
CBPI (Share price in R$, Volume in ‘000’s)
Month | PN Price | Volume | ON Price | Volume | ||||
March-06(a) | 15.65 | 3,401 | 20.00 | 6 | ||||
| April-06 | 17.94 | 6,389 | 20.75 | 16 | ||||
| May-06 | 17.84 | 5,933 | 21.83 | 3 | ||||
| June-06 | 17.48 | 5,717 | 20.63 | 7 | ||||
| July-06 | 17.02 | 5,001 | 21.83 | 4 | ||||
| August-06 | 17.30 | 6,600 | 24.12 | 0 | ||||
| September-06 | 17.28 | 4,821 | 21.11 | 3 | ||||
| October-06 | 18.78 | 4,459 | 21.29 | 24 | ||||
| November-06 | 18.56 | 4,189 | 21.67 | 17 | ||||
| December-06 | 18.96 | 4,221 | 21.93 | 23 | ||||
| January-07 | 19.18 | 4,891 | 22.22 | 12 | ||||
| February-07 | 22.28 | 3,579 | 26.04 | 7 | ||||
March-07(b) | 22.36 | 3,322 | 27.87 | 1 | ||||
WA share price | R$18.3 | R$21.7 |
Notes: (a) March 17, 2006, to March 31, 2006 (15 days)
(b) March 1, 2007, to March 16, 2007 (16 days)
Source: FactSet
RIPI (Share price in R$, Volume in ‘000’s)
Month | PN Price | Volume | ON Price | Volume | ||||
March-06(a) | 23.61 | 84 | 39.05 | 83 | ||||
| April-06 | 24.96 | 665 | 35.83 | 123 | ||||
| May-06 | 28.95 | 1,134 | 36.52 | 266 | ||||
| June-06 | 30.59 | 425 | 36.99 | 144 | ||||
| July-06 | 30.10 | 323 | 36.21 | 72 | ||||
| August-06 | 31.22 | 497 | 37.35 | 166 | ||||
| September-06 | 33.17 | 415 | 38.45 | 56 | ||||
| October-06 | 35.80 | 437 | 39.69 | 95 | ||||
| November-06 | 37.01 | 353 | 41.51 | 139 | ||||
| December-06 | 37.36 | 289 | 42.56 | 93 | ||||
| January-07 | 37.44 | 568 | 43.72 | 95 | ||||
| February-07 | 40.63 | 371 | 50.00 | 141 | ||||
March-07(b) | 42.54 | 292 | 70.48 | 370 | ||||
WA share price | R$32.7 | R$45.8 |
Notes: (a) March 17, 2006, to March 31, 2006 (15 days)
(b) March 1, 2007, to March 16, 2007 (16 days)
Source: FactSet
DPPI (Share price in R$, Volume in ‘000’s)
Month | PN Price | Volume | ON Price | Volume | ||||
March-06(a) | 23.03 | 38 | 39.00 | 2 | ||||
| April-06 | 24.01 | 251 | 42.47 | 2 | ||||
| May-06 | 25.12 | 185 | 38.05 | 2 | ||||
| June-06 | 24.02 | 398 | 42.92 | 1 | ||||
| July-06 | 24.09 | 113 | 35.74 | 2 | ||||
| August-06 | 23.20 | 261 | 32.25 | 2 | ||||
| September-06 | 23.09 | 115 | 36.54 | 0 | ||||
| October-06 | 23.08 | 318 | 30.20 | 2 | ||||
| November-06 | 23.71 | 460 | 27.71 | 1 | ||||
| December-06 | 25.54 | 316 | 28.69 | 2 | ||||
| January-07 | 27.98 | 239 | 30.00 | 1 | ||||
| February-07 | 32.70 | 138 | 35.00 | 0 | ||||
March-07(b) | 33.08 | 87 | 55.96 | 8 | ||||
WA share price | R$25.0 | R$41.7 |
Notes: (a) March 17, 2006, to March 31, 2006 (15 days)
(b) March 1, 2007, to March 16, 2007 (16 days)
Source: FactSet
69 |
| Share price evolution | Appendix I |
Ultrapar
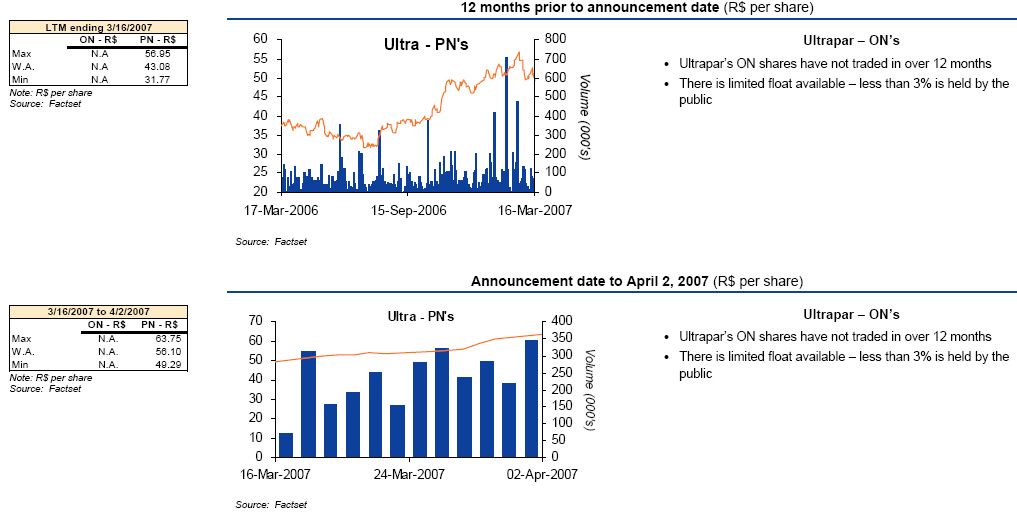
LTM ending 3/16/2007
- --------------------
          ON - R$   PN - R$
          -------   -------
Max         N.A      56.95
W.A.        N.A      43.08
Min         N.A      31.77
- -----------------------------
Note: R$ per share
Source: Factset

3/16/2007 to 4/2/2007
- ---------------------
          ON - R$   PN - R$
          -------   -------
Max         N.A      63.75
W.A.        N.A      56.10
Min         N.A      49.29
- -----------------------------
Note: R$ per share
Source: Factset
|
70 |
| Share price evolution | Appendix I |
RIPI
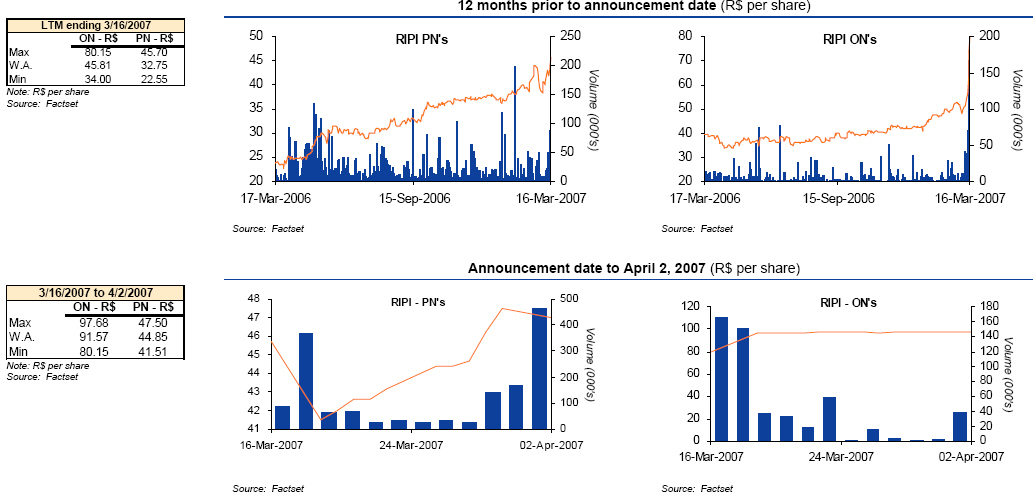
LTM ending 3/16/2007
- --------------------
          ON - R$   PN - R$
          -------   -------
Max         80.15    45.70
W.A.        45.81    32.75
Min         34.00    22.55
- -----------------------------
Note: R$ per share
Source: Factset

3/16/2007 to 4/2/2007
- ---------------------
          ON - R$   PN - R$
          -------   -------
Max         97.68    47.50
W.A.        91.57    44.85
Min         80.15    41.51
- -----------------------------
Note: R$ per share
Source: Factset
|
71 |
| Share price evolution | Appendix I |
CBPI
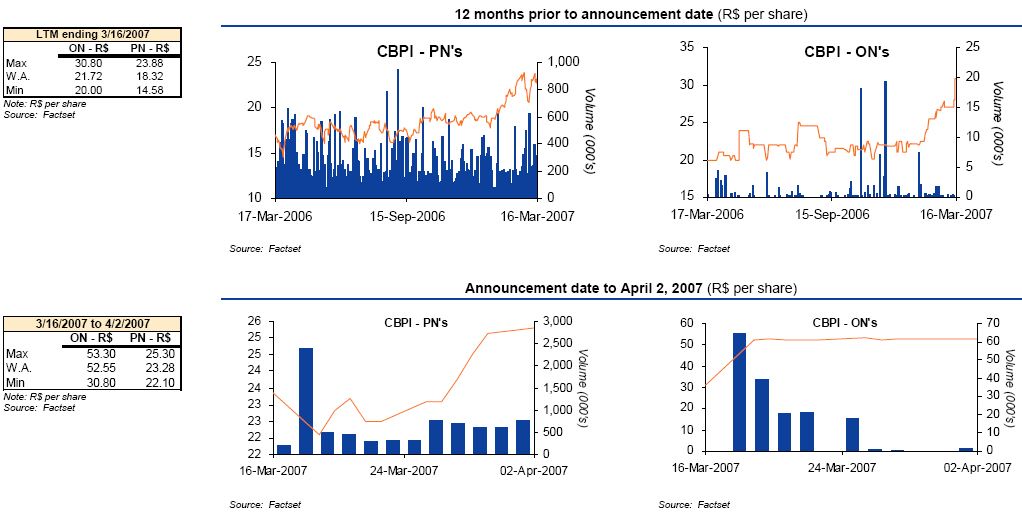
LTM ending 3/16/2007
- --------------------
          ON - R$   PN - R$
          -------   -------
Max         30.80    23.88
W.A.        21.72    18.32
Min         20.00    14.58
- -----------------------------
Note: R$ per share
Source: Factset

3/16/2007 to 4/2/2007
- ---------------------
          ON - R$   PN - R$
          -------   -------
Max         53.50    25.30
W.A.        52.55    23.28
Min         30.80    22.10
- -----------------------------
Note: R$ per share
Source: Factset
|
72 |
| Share price evolution | Appendix I |
DPPI
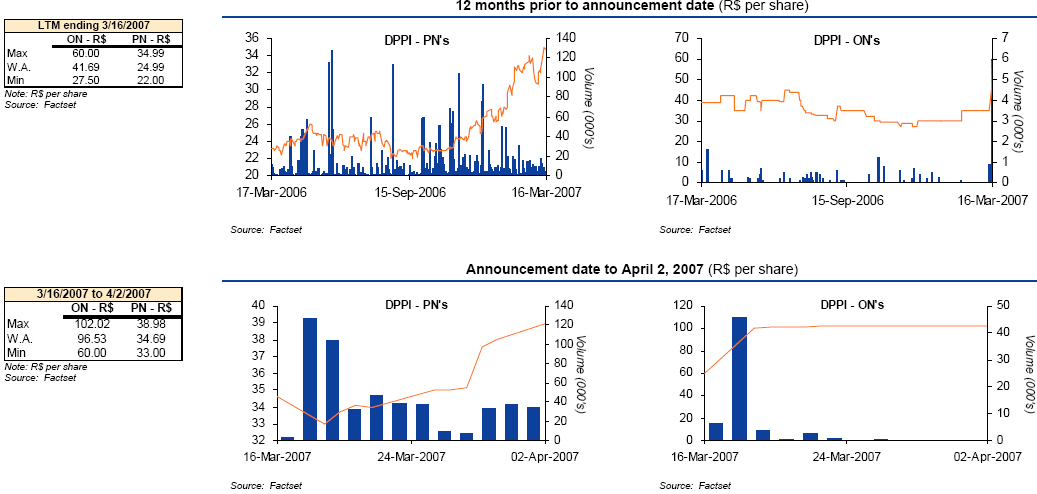
LTM ending 3/16/2007
- --------------------
          ON - R$   PN - R$
          -------   -------
Max         60.00    34.99
W.A.        41.69    24.99
Min         27.50    22.00
- -----------------------------
Note: R$ per share
Source: Factset

3/16/2007 to 4/2/2007
- ---------------------
          ON - R$   PN - R$
          -------   -------
Max         102.02   38.98
W.A.         96.53   34.69
Min          60.00   33.00
- -----------------------------
Note: R$ per share
Source: Factset
|
73 |
| Comparable multiples | Appendix II |
Because there is no company that is directly comparable to EMCA, we judge that the multiples based on a sample of companies that included commodity and specialty chemical companies, consistent with the business model of EMCA, its margins, and its expected growth, would be an adequate parameter for valuation
Appendix II
Comparable multiples
74 |
| Comparable multiples | Appendix II |
Comparable public company analysis - Commodities and specialty chemicals | ||||||||||||||
| | TEV / EBITDA | | ||||||||||||
| Company name | ||||||||||||||
| Commodities | ||||||||||||||
| Nova | $29.70 | $2,477 | $4,208 | 6.2x | 5.2x | 0.6x | 0.7x | |||||||
| BASF | $100.83 | 50,506 | 65,198 | 4.9x | 4.9x | 0.9x | 0.9x | |||||||
| Westlake | $27.32 | 1,784 | 1,992 | 4.9x | 5.1x | 0.8x | 0.7x | |||||||
| Dow | $43.38 | 41,949 | 49,950 | 6.4x | 6.4x | 1.0x | 1.0x | |||||||
| Lyondell PF(pigments sale) | $30.40 | 7,664 | 14,714 | 4.7x | 4.9x | 0.6x | 0.6x | |||||||
| Braskem | $6.46 | 2,332 | 4,484 | 5.7x | 5.6x | 0.8x | 0.9x | |||||||
| Suzano Petroquimica | $2.16 | 488 | 1,220 | n.a. | 6.4x | 1.1x | 0.9x | |||||||
| Petroquimica União | $4.94 | 518 | 716 | 5.2x | 6.6x | 0.5x | 0.5x | |||||||
Mean - commodities | 5.5x | 5.6x | 0.8x | |||||||||||
Median - commodities | 5.2x | 5.4x | 0.8x | |||||||||||
Maximum - commodities | 6.4x | 6.6x | 1.1x | |||||||||||
Minimum - commodities | 4.7x | 4.9x | 0.5x | |||||||||||
| Specialty chemicals | ||||||||||||||
| Clariant | $16.05 | $3,637 | $4,973 | 6.9x | 6.8x | 0.7x | ||||||||
| Rhodia | $3.50 | 4,220 | 6,794 | 7.1x | 6.7x | 1.1x | ||||||||
| Lubrizol | $51.10 | 3,601 | 4,665 | 8.2x | 7.7x | 1.2x | ||||||||
| Huntsman | $18.94 | 4,433 | 7,432 | 7.7x | 6.4x | 0.8x | ||||||||
| Celanese | $30.40 | 5,288 | 7,619 | 6.6x | 6.8x | 1.3x | ||||||||
Mean - specialties | 7.3x | 6.9x | 1.0x | |||||||||||
Median - specialties | 7.1x | 6.8x | 1.1x | |||||||||||
Maximum - specialties | 8.2x | 7.7x | 1.3x | |||||||||||
Minimum - specialties | 6.6x | 6.4x | 0.7x |
| Median - Commodities & Specialties | 6.3x | 6.4x | 0.8x | 0.9x |
Notes: All figures in US$ million unless otherwise noted
Source: Companies information, FactSet and Bloomberg
75 |
| Comparable multiples | Appendix II |
Selected comparable multiples - Chemical distributors & Retail Brazil
Ipiranga Química was valued based on a EBITDA multiple of precedent transactions that involved the sale of distributors of chemical products
Precedent transaction analysis - Chemical distributors |
TEV/LTM | LTM Metric | |||||||
| Target - Buyer | Date | TEV | EBITDA | EBITDA | ||||
| ChemCentral - Univar | Mar-07 | $650 | 9.3x | |||||
| INT Muellor Chemical - NIB Capital | Jun-01 | 228 | 8.8x | |||||
| HCI - Brenntag | Nov-00 | 306 | 8.5x | |||||
| Ellis & Everard - Vopak Distribution | Jan-01 | 480 | 6.1x | |||||
Mean | ||||||||
Median | ||||||||
Max | ||||||||
Min |
Notes: All figures in US$ million unless otherwise noted.
Source: Companies information, FactSet and Bloomberg.
Among the companies listed in the local market, CBD is the one with a profile that most closely mirrors AM/PM7
Comparable public company analysis - Retail Brazil |
Market | TEV / EBITDA | |||||||||
| Company name | Cap. | TEV | 2006A | 2007E | ||||||
| Pao de Acucar - CBD | $4,042 | $4,687 | 7.5x | 5.8x | ||||||
Notes: All figures in US$ million unless otherwise noted.
Source: Companies information, FactSet and Bloomberg.
7 Sales of CBD and AM/PM are primarily foods and consumer goods (foods and perishables exceeds 70% of CBD sales). In the last 5 years, CBD’s average sales growth was 11.4% and EBITDA growth was 12.0%
76 |
| Comparable multiples | Appendix II |
Selected comparable multiples - Refiners and Asphalt producers
Alon, Delek, and Frontier are the companies that best mirror the business of Refinaria (RIPI Opco) and served as a valuation benchmark
Comparable public company analysis - Refiners |
Share price | Market | TEV / EBITDA | Price to earnings | |||||||||||||||
| Company | 3/23/2007 | Cap | TEV | 2006A | 2007E | 2008E | 2006A | 2007E | 2008E | |||||||||
| Alon USA | $36.30 | $1,699 | $2,175 | 8.7x | 6.6x | 8.4x | 14.4x | 10.6x | 13.4x | |||||||||
| Delek US Holdings | 18.77 | 973 | 1,158 | 6.5 | 6.4 | 6.3 | 9.7 | 10.4 | 11.1 | |||||||||
| Frontier Oil | 33.08 | 3,628 | 3,372 | 5.5 | 6.3 | 6.3 | 9.8 | 11.9 | 12.9 | |||||||||
Average | 6.9 | 6.5 | 7.0 | 11.3 | 11.0 | 12.5 | ||||||||||||
Median | 6.5 | 6.4 | 6.3 | 9.8 | 10.6 | 12.9 | ||||||||||||
Max | 8.7 | 6.6 | 8.4 | 14.4 | 11.9 | 13.4 | ||||||||||||
Min | 5.5 | 6.3 | 6.3 | 9.7 | 10.4 | 11.1 | ||||||||||||
Notes: All figures in US$ million unless otherwise noted.
Market Cap. includes options and in-the-money convertibles.
Source: Companies information, FactSet and Bloomberg.
IASA valuation was driven by precedent transactions that involved the sale of asphalt producers
Precedent transaction analysis - Asphalt producers |
TEV / | TEV / | |||||||
| Target / Buyer | Date | TEV | LTM EBITDA | LTM Sales | ||||
| Frehner Construction / Aggregate Industries | 5/11/2004 | 95.8 | NA | 0.6x | ||||
| Better Materials Corp. / Hanson Building Materials | 7/18/2003 | 155 | 7.3x | 1.3x | ||||
| S.E. Johnson / CRH plc | 5/16/2003 | 177 | 6.3x | 0.7x | ||||
| Kiew it Materials / CSR | 10/2/2002 | 648 | 8.8x | 1.3x | ||||
| Mount Hope Rock Products / CRH plc | 4/30/2001 | 138 | 7.3x | 1.3x | ||||
| Northern Ohio Paving and Dolomite Group / CRH plc | 6/21/2000 | 172 | 5.9x | 1.3x | ||||
| The Shelly Company / CRH plc | 2/24/2000 | 362 | 5.7x | 1.1x | ||||
| Thompson-McCully / CRH plc | 7/12/1999 | 422 | 8.0x | 1.7x | ||||
| Dell Contractors and Millington Quarry / CRH plc | 7/5/1999 | 146 | 5.6x | 1.0x | ||||
| MA Segale - Icon Materials / CRH plc | 5/1/1998 | 60 | NA | 1.2x | ||||
Mean | 6.9x | 1.1x | ||||||
Median | 6.8x | 1.2x | ||||||
Max | 8.8x | 1.7x | ||||||
Min | 5.6x | 0.6x |
Notes: All figures in US$ million unless otherwise noted.
CRH plc was previously known as Oldcastle Materials
Source: Companies information, FactSet and Bloomberg.
77 |
| Overview of the industries in which the assessed companies operate | Appendix III |
Appendix III
Overview of the industries in which the assessed companies operate
78 |
| Overview of the industries in which the assessed companies operate | Appendix III |
Brazilian fuel distribution industry
Ipiranga and Petrobras (BR) are the leading players in the Brazilian fuel distribution market
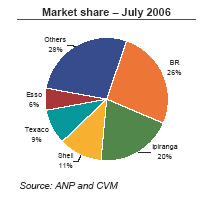
Changes in the regulatory framework benefited the independent (no brand) players

Summary |
| n | According to ANP, total consumption of fuel, including diesel, gasoline, and alcohol reached 67 million m3 in 2006 |
| – | Consumption of fuel has reached an average annual growth rate of 1.4% in the last 5 years (0.9% growth for diesel, 1.2% for gasoline, and 6.7% for alcohol) |
| n | Consumption of the three main fuel products (gasoline, alcohol, and diesel) grows as the number of cars grows. Ethanol-fueled vehicles are expected to post the highest growth rate, due to the large number of flexible fuel (flex-fuel) cars entering the market |
| n | The fuel distribution industry in Brazil has significant growth potential based on the expected growth of the Brazilian economy, and the relatively high number of inhabitants per car observed in Brazil compared to other countries |
| n | Foreign players have been relatively conservative in regards to their expansion plans, while some have already exited the country. In contrast, Ipiranga and BR are committed to increase their market share and expand their national footprint |

79 |
| Overview of the industries in which the assessed companies operate | Appendix III |
Brazilian petrochemical industry
According to ABIQUIM, sales in the Brazilian chemical and petrochemical sector grew 17% between 2000 and 2006, or 2.7% per year

Brazilian market data – 2006 | ||||||||||||||||
(000 tons) | Total production | Imports | Exports | Total consumption | ||||||||||||
| Olefins | �� | 5,298 | 3 | 171 | 5,130 | |||||||||||
| Aromatics | 1,531 | 91 | 410 | 1,211 | ||||||||||||
| Polyolefins | 3,570 | 402 | 1,022 | 2,949 | ||||||||||||
| PVC | 676 | 127 | 51 | 752 | ||||||||||||
| PET | 307 | 173 | 31 | 449 | ||||||||||||
| Caprolactam | 45 | 7 | 18 | 34 | ||||||||||||
Note: Total consumption is an estimate; 2006 figures based on preliminary data
Source: Braskem 20-F
Comments |
| n | The Brazilian petrochemical industry is organized into first, second, and third generation producers based on the stage of raw material processing |
| – | 1st generation producers convert naphtha into basic petrochemicals |
| – | 2nd generation producers process basic petrochemicals into intermediate products |
| – | 3rd generation producers transform intermediate products into final products |
| n | The Brazilian petrochemical industry is the largest in Latin America, but suffers from the lack of integration between businesses and the dependence on imports of raw materials such as naphtha |
| n | Petrobras and its subsidiaries are attempting to diminish Brazilian dependence on petrochemical imports through investment projects involving petroleum, gas, and naphtha |
| n | Brazil’s major petrochemical production centers are located in Camaçari, Triunfo, and Cubatão. Two large investment projects are located in Rio de Janeiro (Comperi) and in Pernambuco (Abreu e Lima), with operations expected to begin in 2012 |
| n | According to BMI, the main companies operating in Brazil include Braskem, Copesul, Petroquímica União, Rio Polímeros, Ultrapar, Politeno, and Dow Química |
Source: Braskem 20-F, Business Monitor International
80 |
| Overview of the industries in which the assessed companies operate | Appendix III |
Brazilian LPG distribution industry

Summary |
| n | In 2006, Brazilian LPG market sales totaled 6.5 million tons. 87% was produced in Brazil and the balance was imported |
| n | Primary use of LPG: |
| – | Bottled: Cooking (historically around 70% of sales) |
| – | Bulk: Cooking and heating in shopping malls, hotels, residences, hospitals, and industrial centers |
| n | Petrobras is responsible for all national production of LPG (87% of national consumption). LPG is transported from Petrobras storage facilities via pipelines and trucks to the LPG distributors, who then sell it in the retail market |
| n | The market for LPG is considered mature with moderate growth potential, dependent on economic growth (which will lead consumers to substitute firewood for LPG) |
| n | Market competition is largely based on brand positioning, customer service, and the efficiency of logistics and distribution |
Source: Ultrapar 20-F
Distributors in the market | |||||
2006 | 2005 | 2004 | |||
| Ultragaz | 23.9% | 24.0% | 24.1% | ||
| SHV Gas | 23.3% | 23.4% | 20.5% | ||
| Liquigás | 21.7% | 21.8% | 21.8% | ||
| Butano | 18.5% | 18.3% | 18.7% | ||
| Others | 12.6% | 12.5% | 14.9% | ||
Total | 100.0% | 100.0% | 100.0% | ||
Description |
| n | Ultragaz: Brazil’s market leader in LPG distribution, with over 1.5 million tons delivered in 2006 |
| n | SHV Gas: A distributor controlled by multinational corporation SHV Energy, and operating under the brands “Minasgás” and “Supergasbrás” |
| n | Liquigás: Acquired by Petrobras from the ENI Group in June 2004; has operated in the Brazilian LPG sector for over 40 years |
| n | Butano: A Brazilian LPG distributor with over 45 years of market experience |
Source: Ultrapar 20-F
81 |
| Calculation backup | Appendix IV |
Appendix IV
Calculation backup
82 |
| Calculation backup | Appendix IV |
TEV calculation for selected companies
RIPI Opco | DPPI Opco | IPQ S.A. | ||||||||
Description | Obs. | Description | Obs. | Description | Obs. | |||||
| EBITDA (R$ million) | 1.42 | In 2006 | TEV (R$ million) | 566 | TEV DPPI (cash flow pg. 46) | Copesul (R$ million) | 5,635 | 100% Copesul (pg. 51) | ||
| R$/US$ average | 2.19 | 2006 average | R$/US$ - report | 2.1385 | 12/31/2006 | Copesul (R$ million) | 1,660 | (1) 29.46% Copesul | ||
| EBITDA (US$ million) | 0.6 | In 2006 | TEV (US$ million) | 265 | (1) TEV DPPI in US$ | IPQ Op. (R$ million) | 1,452 | (2) 100% IPQ Op. (pg. 56) | ||
| Multiple | 6.5x | Refer to pg. 76 | EBITDA (R$ million) | 66 | EBITDA DPPI | TEV (R$ million) | 3,112 | TEV IPQ SA (3)=(1)+2 | ||
| TEV (US$ million) | 4 | R$/US$ average | 2.19 | average for 2006 | ||||||
R$/US$ - report | 2.1385 | 12/31/2006 | EBITDA (US$ million) | 30.1 | (2) EBITDA DPPI in US$ | |||||
TEV (R$ million) | 9 | TEV RIPI Opco | TEV/ 2006 EBITDA | 8.8x | (3) = (2) / (1) | |||||
| EBITDA (R$ million) | 16.3 | EBITDA Isa-Sul 2006 | ||||||||
| R$/US$ average | 2.19 | average for 2006 | ||||||||
| EBITDA (US$ million) | 7.4 | In 2006 | ||||||||
| Multiple | 8.8x | (3) above | ||||||||
| TEV (US$ million) | 65 | |||||||||
| R$/US$ - report | 2.1385 | 12/31/2006 | ||||||||
TEV (R$ million) | 140 | TEV Isa-Sul | ||||||||
| TEV (US$ million) | 566 | |||||||||
TEV (R$ million) | 706 | TEV DPPI Opco | ||||||||
IQ Opco | CBPI Opco | |||||||||
Description | Description | EMCA | IASA | AM/PM | Obs. | |||||
| EBITDA (R$ million) | 20.8 | In 2006 | EBITDA (R$ million) | 3 | 13.4 | 32.2 | In 2006 | |||
| R$/US$ average | 2.19 | 2006 average | R$/US$ average | 2.19 | 2.19 | 2.19 | 2006 average | |||
| EBITDA (US$ million) | 9.5 | In 2006 | EBITDA (US$ million) | 1.4 | 6.1 | 14.7 | In 2006 | |||
| Multiple | 8.6x | Refer to pg. 76 | Multiple | 6.3x | 6.8x | 7.5x | Refer to pgs. 75, 77 & 76 | |||
| TEV (US$ million) | 82 | TEV (US$ million) | 9 | 42 | 110 | |||||
| R$/US$ - report | 2.1385 | 12/31/2006 | R$/US$ - report | 2.1385 | 2.1385 | 2.1385 | 12/31/2006 | |||
TEV (R$ million) | 176 | TEV IQ Opco | TEV (R$ million) | 18 | 89 | 236 | TEV | |||
Description | ||||||||||
| TEV (R$ million) | 2,421 | TEV CBPI (cash flow pg. 40) | ||||||||
| TEV (R$ million) | 18 | TEV EMCA | ||||||||
| TEV (R$ million) | 89 | TEV IASA | ||||||||
| TEV (R$ million) | 236 | TEV AM/PM | ||||||||
TEV (R$ million) | 2,764 | TEV CBPI Opco | ||||||||
83 |
| Calculation backup | Appendix IV |
Net debt calculation
Copesul | IPQ | |||
| Total debt | 358.71 | Total debt | 865.56 | |
| Pension funds | 8.85 | Pension funds | 6.82 | |
| Dividends payable | 201.75 | Dividends payable | 17.15 | |
| Contingencies | 34.46 | Contingencies | 9.44 | |
| Payables to related parties | 4.53 | Payables to related parties | (7.52) | |
| Cash & equivalents | (303.86) | Cash & equivalents | (21.22) | |
| (+) 29.46% Copesul net debt | 89.69 | |||
Net debt/(cash) | 304.44 | Net debt/(cash) | 959.92 | |
| Note: All figures in R$ million | Note: All figures in R$ million | |||
Source: Financial statements of Copesul as of December 31, 2006 | Source: Financial statements of IPQ as of December 31, 2006 | |||
IQ | CBPI | |||
| Total debt | 7.79 | Total debt | 677.83 | |
| Pension funds | 2.18 | Pension funds | 53.47 | |
| Dividends payable | (70.59) | Dividends payable | 0 | |
| Contingencies | 0.87 | Contingencies | 91.37 | |
| Payables to related parties | 123.59 | Payables to related parties | (36.31) | |
| Cash & equivalents | (4.00) | Cash & equivalents | (157.64) | |
| (+) 92.39% IPQ net debt | 886.83 | (+) 41.47% IQ net debt | 392.61 | |
Net debt/(cash) | 946.67 | Net debt/(cash) | 1,021.33 | |
| Note: All figures in R$ million | Note: All figures in R$ million | |||
Source: Financial statements of IQ as of December 31, 2006 | Source: Financial statements of CBPI as of December 31, 2006 | |||
84 |
| Calculation backup | Appendix IV |
Net debt calculation(continued)
DPPI | RIPI | |||
| Total debt | 60.61 | Total debt | 0 | |
| Pension funds | 31.18 | Pension funds | 39.75 | |
| Dividends payable | 0 | Dividends payable | 17.89 | |
| Contingencies | 3.04 | Contingencies | 1.37 | |
| Payables to related parties | (40.80) | Payables to related parties | 27.87 | |
| Cash & equivalents | (101.14) | Cash & equivalents | (5.70) | |
| (+) 21.01% CBPI net debt | 214.62 | (+) 58.53% IQ | 554.05 | |
| (+) 11.42% CBPI net debt | 116.63 | |||
| (+) 7.65% DPPI net debt | 12.81 | |||
Net debt/(cash) | 167.52 | Net debt/(cash) | 764.67 | |
| Note: All figures in R$ million | Note: All figures in R$ million | |||
Source: Financial statements of DPPI as of December 31, 2006 | Source: Financial statements of RIPI as of December 31, 2006 | |||
Ultrapar | ||||
| Cash and Marketable securities | (1,070.08) | |||
| Long term investments | (547.98) | |||
| Short term Loans | 102.76 | |||
| Long term Loans | 1,081.85 | |||
| Debentures | 312.79 | |||
| Dividends | 101.38 | |||
| Pension funds | 0 | |||
Net debt/(cash) | (19.28) | |||
| Note: All figures in R$ million | ||||
Source: Financial statements of Ultrapar as of December 31, 2006 | ||||
85 |
| Calculation backup | Appendix IV |
Corporate tax rate (IR+CS)
When applicable, as in the cases of Copesul, CBPI, and DPPI, the projections were based on the average effective corporate tax rate over the past 3 years as shown in the tables that follow. This assumption was validated by the management of the companies in confirmatory due diligence performed by Deutsche Bank
For IPQ, in addition to the company’s historical data, the projections were based on our assessment for companies in this sector. An effective tax rate of 25% for the coming years was considered adequate by the management of IPQ in confirmatory due diligence
Copesul | CBPI | DPPI | |||||||||||
2004A | 2005A | 2006A | 2004A | 2005A | 2006A | 2004A | 2005A | 2006A | |||||
Result before IR/CS1 | 722 | 722 | 822 | Result before IR/CS1 | 231.0 | 294.3 | 239.3 | Result before IR/CS1 | 86.1 | 123.3 | 92.8 | ||
| IR/CS | (242) | (231) | (270) | IR/CS | (58.7) | (79.0) | (58.9) | IR/CS | (21.5) | (29.8) | (18.0) | ||
| Effective rate | 33.5% | 31.9% | 32.8% | Effective rate | 25.4% | 26.9% | 24.6% | Effective rate | 25.0% | 24.2% | 19.3% | ||
average | 32.8% | average | 25.6% | average | 22.8% | ||||||||
| (1) Excludes equity income result | (1) Excludes equity income result | (1) Excludes equituy income result | |||||||||||
| Values in millions of Reais | Values in millions of Reais | Values in millions of Reais |
For Ultrapar, the projections were based on a greater effective tax rate (22%) than the average of the last 3 years (16%). Such assumption is based on Ultrapar’s guidance which reflects a conservative view of expected fiscal incentives for projects located in areas under the influence of ADENE (previously SUDENE)
Ultrapar | ||||
2004A | 2005A | 2006A | ||
Result before IR/CS1 | 502.9 | 329.2 | 342.5 | |
| IR/CS | (81.5) | (49.3) | (61.4) | |
| Effective rate | 16.2% | 15.0% | 17.9% | |
average | 16.4% | |||
| (1) Excludes equity income result | ||||
| Values in millions of Reais |
86 |
| Calculation backup | Appendix IV |
Capital structure
Our analysis is based on companies that best represent each sector, excluding the companies that, from our point of view, are under-levered or over-levered
Petrochemical | Distribution | |||||||||||||
| The optimal capital structure is estimated as 50% debt, 50% equity | The optimal capital structure is estimated as 40% debt, 60% equity | |||||||||||||
Market | Net | Net | Market | Net | Net | |||||||||
Company | Cap1 | Debt2 | debt/Cap | Company | Cap1 | Debt2 | debt/Cap | |||||||
| Braskem | 4,966 | 4,512 | 48% | Pantry | 1,075 | 750 | 41% | |||||||
| Suzano Petroquímica | 970 | 1,541 | 61% | |||||||||||
| Petroquímica União | 1,137 | 417 | 27% | Average | 41% | |||||||||
Average | 45% | Median | 41% | |||||||||||
Median | 48% | |||||||||||||
| Notes: | Notes: | |||||||||||||
| Values in R$ million | Values in R$ million | |||||||||||||
| (1) Market capitalization as of February 28, 2007 | (1) Market capitalization as of February 28, 2007 | |||||||||||||
| (2) Balance sheet as of December 2006 including minority interest | (2) Balance sheet as of December 2006 including minority interest | |||||||||||||
| Source: Bloomberg, FactSet, and the companies | Source: Bloomberg, FactSet, and Pantry | |||||||||||||
Ultrapar |
| Our analysis uses a sub-optimal capital structure of 35% debt, 65% equity, based on the capital structure observed in a sample of companies* that include those with a sub-optimal capital structure, in line with the recent practice by Ultrapar of maintaining low financial leverage |
Notes: (*) For example: petrochemical companies (Braskem, Suzano Petroquimico, Petroquimica União) and gas distributors (Amerigas Partners LP, Ferrellgas Partners LP, Buckeye Partners LP, Enbridge Energy Partners LP, Enterprise Product Partners LP, Kinder Morgan Energy Partners LP, Magellan Midstream Partners LP, Plains All American Pipeline LP, Crosstex Energy LP, Copano Energy LLC) |
| n | Fuel distribution: considering a capital structure based on the same sample used for the beta, it would result in a 12.7% WACC for CBPI and 12.7% WACC for DPPI. We considered more appropriate to use a more refined sample excluding the companies Casey’s and Alimentation Couche, which have sub-optimal capital structures (less than 20% debt), that resulted in a 12.2% WACC for CBPI and 12.3% WACC for DPPI |
| n | Petrochemical: considering a capital structure based on the same sample used for the beta, it would result in a 11.7% WACC for Copesul and a 12.0% WACC for IPQ. We considered more appropriate to use a more refined sample excluding the companies Copesul, BASF, and Nova Chemicals, which have sub-optimal capital structures (below 20% debt and above 70% debt), that resulted in a 11.2% WACC for Copesul and 11.8% WACC for IPQ |
| n | For Ultrapar, we observed the debt to capital ratio of other companies with the same underlying operations as Ultrapar8, such as for example: petrochemical companies (Braskem, Suzano Petroquimica, Petroquimica União) and LPG distributors (Amerigas Partners LP, Ferrellgas Partners LP, Buckeye Partners LP, Enbridge Energy Partners LP, Enterprise Product Partners LP, Kinder Morgan Energy Partners LP, Magellan Midstream Partners LP, Plains All American Pipeline LP, Crosstex Energy Inc., Crosstex Energy LP, Copano Energy LLC). We have not excluded companies whose capital structure were sub-optimal in line with Ultrapar’s management preference for a low financial leverage |
8 For example, the average of the betas of the referenced companies is 0.53, below the beta of 0.64 implicit for Ultrapar under the utilized assumptions (pg. 24). We consider the observed beta for Ultrapar to be
more appropriate than the average of the comparable companies within similar operations. The betas for each company are: Braskem (0.76), Suzano Petroquimica (0.36), Petroquimica União (0.42), Amerigas Partners LP (0.24), Ferrellgas Partners LP (0.11), Buckeye Partners LP (0.42), Enbridge Energy Partners LP (0.32), Enterprise Product Partners LP (0.54), Kinder Morgan Energy Partners LP (0.34), Magellan idstream Partners LP (0.51), Plains All American Pipeline (0.47), Crosstex Energy Inc. (0.69), Crosstex Energy LP (0.42), Copano Energy LLC (0.44). (source: Bloomberg)
87 |
| Calculation backup | Appendix IV |
Brazilian fuel market
The volume of fuel (alcohol and gasoline only) was calculated by multiplying the number of cars in Brazil (based in the regression of number of cars versus the GDP per capita) by the estimated average consumption of fuel for each type of vehicle
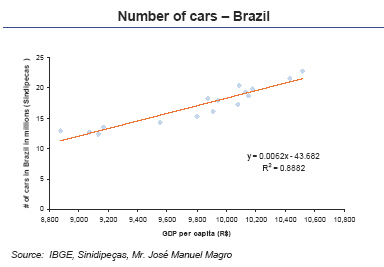
The average fuel consumption was estimated to be approximately 1.23 m3/year for gasoline-based vehicles, and approximately 1.75m3/year for vehicles that consume alcohol, based on the different energy content of alcohol and gasoline
88 |
| Calculation backup | Appendix IV |
Capital expenditure – CBPI cash flow
(in millions of Reais unless otherwise indicated) | 2007E | 2008E | 2009E | 2010E | 2011E | 2012E | 2013E | 2014E | 2015E | 2016E | |
| a) Total investments by the company | 304.2 | 288.9 | 357.9 | 429.3 | 498.2 | 449.4 | 486.7 | 554.3 | 611.8 | 626.0 | |
| a.1) Fixed assets (50%) | 152.1 | 144.5 | 178.9 | 214.6 | 249.1 | 224.7 | 243.3 | 277.1 | 305.9 | 313.0 | Graph pg. 44 |
a.2) Financing to clients1 (50%) | 152.1 | 144.5 | 178.9 | 214.6 | 249.1 | 224.7 | 243.3 | 277.1 | 305.9 | 313.0 | |
b) Repayment of financing to clients2 | 144.9 | 147.3 | 147.2 | 158.5 | 179.3 | 214.2 | 229.5 | 239.0 | 248.4 | 275.5 | |
| (a) - (b) = c) CBPI Investments (R$ million) | 159.3 | 141.6 | 210.7 | 270.8 | 318.8 | 235.1 | 257.2 | 315.2 | 363.4 | 350.6 | |
| c) CBPI Investments (US$ million) | 73.7 | 63.2 | 91.3 | 115.7 | 134.2 | 97.6 | 105.2 | 127.0 | 144.3 | 137.2 | DCF pg. 40 |
| Notes: | (1) Assumes that CBPI finances investments to clients over an average of 3 years |
| (2) Repayment of principal included in other operating income (included in EBIT) |
The Discounted Cash Flow depicted on page 40 of this Report is in US dollar in contrast to the chart on page 44 that is in Brazilian Reais
In general, all investments in the distribution network are equally shared between CBPI and the dealer (owner of the point of sale, or the “Client”). CBPI is responsible for 50% (fifty percent) of all capital expenditures, which are capitalized on the company’s balance sheet. The other 50% (fifty percent) of expenditures are the Clients’ responsibilities who pay for it through a financing line from CBPI, which is amortized over 3 years
CBPI’s cash outflow depicted in the Discounted Cash Flow is, therefore, 100% (one hundred percent) of the annual investments in the distribution network in each year (item “a” above) minus the Client’s repayments of financing relative to previous years investments (item “b” above)
89 |
| Calculation backup | Appendix IV |
Capital expenditure – DPPI cash flow
(in millions of Reais unless otherwise indicated) | 2007E | 2008E | 2009E | 2010E | 2011E | 2012E | 2013E | 2014E | 2015E | 2016E | |
| a) Total investments by the company | 49.0 | 42.8 | 45.7 | 47.6 | 42.8 | 53.6 | 53.4 | 55.5 | 57.0 | 51.3 | |
| a.1) Fixed assets (50%) | 24.5 | 21.4 | 22.9 | 23.8 | 21.4 | 26.8 | 26.7 | 27.7 | 28.5 | 25.7 | Graph pg. 49 |
a.2) Financing to clients1 (50%) | 24.5 | 21.4 | 22.9 | 23.8 | 21.4 | 26.8 | 26.7 | 27.7 | 28.5 | 25.7 | |
b) Repayment of financing to clients2 | 17.6 | 25.8 | 32.9 | 22.9 | 22.7 | 22.7 | 24.0 | 25.0 | 27.1 | 27.6 | |
| (a) - (b) = c) DPPI Investments (R$ million) | 31.4 | 17.0 | 12.8 | 24.6 | 20.1 | 30.9 | 29.4 | 30.5 | 29.9 | 23.7 | |
| c) DPPI Investments (US$ million) | 14.5 | 7.6 | 5.6 | 10.5 | 8.5 | 12.8 | 12.0 | 12.3 | 11.9 | 9.3 | DCF pg. 46 |
| Notes: | (1) Assumes that CBPI finances investments to clients over an average of 3 years |
| (2) Repayment of principal included in other operating income (included in EBIT) |
The Discounted Cash Flow depicted on page 46 of this Report is in US dollar in contrast to the chart on page 49 that is in Brazilian Reais
In general, all investments in the distribution network are equally shared between CBPI and the dealer (owner of the point of sale, or the “Client”). CBPI is responsible for 50% (fifty percent) of all capital expenditures, which are capitalized on the company’s balance sheet. The other 50% (fifty percent) of expenditures are the Clients’ responsibilities who pay for it through a financing line from CBPI, which is amortized over 3 years
CBPI’s cash outflow depicted in the Discounted Cash Flow is, therefore, 100% (one hundred percent) of the annual investments in the distribution network in each year (item “a” above) minus the Client’s repayments of financing relative to previous years investments (item “b” above)
90 |
| Other relevant information | Appendix V |
Appendix V
Other relevant information
91 |
| Other relevant information | Appendix V |
Mr. José Manuel Magro – external consultant
Mr. José Manuel Magro was hired by Ultra to advise on the analysis of the Brazilian fuel market and on the analysis of CBPI and DPPI’s operations
| n | Mr. José Manuel Magro has a BBA from Fundação Getulio Vargas (RJ), got a postgraduate degree in International Marketing at INSEAD – France and earned his MBA in Marketing from a joint program ESPM Brazil / University of California Riverside, US |
| n | Mr. José Manuel Magro has worked for over 18 years at the Shell group. Mr. José Manuel Magro joined Shell in Brasil in 1981 in the Lubricants Planning division, which was followed by assignments in Operations, Aviation business and Marketing divisions |
| n | In 1989, Mr. José Manuel Magro joined Shell Portugal as Marketing and Automotive Fuels Retail Director where he was responsible for the start-up of the Automotive division of Shell in Spain |
| n | In 1994, Mr. José Manuel Magro became the Marketing Coordinator for Shell’s International Automotive Retail division based in London, England. He also represented Shell’s shareholder to oversee the investments in the automotive retail businesses in South Europe and Latin America, especially in Italy, Spain, Portugal, Brazil, Chile and Argentina. Mr. José Manuel Magro assisted Group to launch and international policy for pricing fuels, the customer loyalty program “Smart” and the “Select” convenience store business |
| n | In 1997, Mr. José Manuel Magro returned to Shell Brasil as Director for the Automotive Fuels Retail Marketing division responsible for the development and management of the Brazilian retail network that reached 3,200 retail sites and over 300 convenience stores |
| n | At the end of 1999, Mr. José Manuel Magro left Shell to become the Marketing Vice President of TAM, a Brazilian airline carrier, where he launched the loyalty program “Fidelidade” and the partnerships with American Airlines and Air France |
| n | In 2002, Mr. José Manuel Magro joined the British global communication group WPP where he covered oil companies. He was part of the Global team responsible for the development of British Petroleum (“BP”) brand. Also in 2002, Mr. José Manuel Magro became the CEO of the advertising agency Red Cell Brazil/ 141 Worldwide |
| n | In 2006, Mr. José Manuel Magro became Young & Rubicam’s Vice President, the largest Brazilian advertising agency whose main clients include TAM, Casas Bahia, VIVO, Danone, Bradesco and Chevron/Texaco |
92 |
Description of capital expenditure – CBPI
Comments | NOPLAT growth versus Reinvestment rate | |||
The capex in perpetuity adds value to CBPI as the ROC is higher than the WACC | n Investments in perpetuity add value to CBPI – In perpetuity, the normalized free cash flow to the Firm is 11.5% higher than the cash flow in the last year of the projections despite capex being higher than depreciation – The reinvestment rate in perpetuity is 45% lower than the average reinvestment rate over the projection period – The Return on Capital (“ROC”) in perpetuity is 29.6%, therefore higher than the cost of capital – ROC = growth rate divided by the reinvestment rate n CBPI’s free cash flow in perpetuity has been normalized9 to serve as base for the calculation of CBPI’s terminal value because the company in the end of the projections is not considered mature yet – During the projections, NOPLAT growth fluctuates reflecting the company is not mature yet. Accordingly, the reinvestment rate also fluctuates – Assumes an annual 3% growth in volumes for CBPI to maintain its market share – Capex was estimated based on the expected number of gas stations required to sell the estimated volume of fuels – opening of 164 new gas stations to sell the extra fuel being distributed – renovating about 850 stations (equal to 20% of the base in the last year of the projections) – Repayment of client financing is sufficient to finance clients’ future capex |  | ||
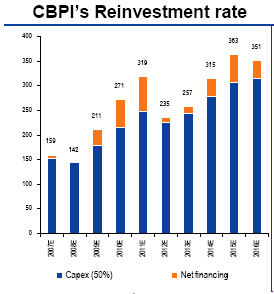 | n In perpetuity, capex is greater than depreciation – In this case, the growth in perpetuity requires substantial investments – Depreciation is not adjusted for inflation as the investments are – The projection is not sufficiently long to reach the expected maturity of the market in the terminal year n There are precedents in literature and in the Brazilian market – Copeland stated that estimating cash flow in perpetuity should reflect expectations of the evolution of the business and the sector10 – This assumption is validated by Damodaran11 – The Valuation Report for Ferronorte, Ferroban and ALL is based on Gordon’s Growth Model in the final year of projections, in which capex was expected to be greater than depreciation n Part of CBPI’s investments is not CBPI’s capex (and does not incorporate CBPI’s asset base), but it also incorporate Clients net financing (refer to pg. 89 and 94) | CBPI’s Reinvestment rate 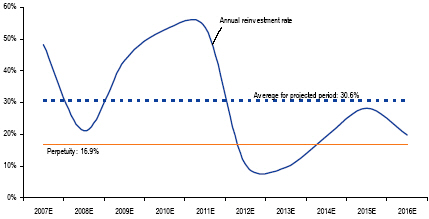 |
(9) We believe it was inappropriate to perpetuate the last cash flow of the projections as CBPI has not yet reached its maturity at that point.
(10) “Estimating the continuing value parameters should be an integral part of the forecasting process. The continuing value parameters should reflect a coherent forecast for the long term economic situation of the company and its industry” from Valuation: measuring and managing the value of companies. Copelland, Tom. Koller, Tim. Murrin, Jack (McKinsey and Company). John Willey and Sons, USA, 3rd edition, pg 277.
(11) The dark side of valuation: valuing old tech, new tech, and new economy companies, de Aswath Damodaran, pgs. 199 e 207.
93 |
Description of capital expenditure – CBPI(continued)
Reinvestment rate versus Sales volume growth | Capex versus Depreciation | |
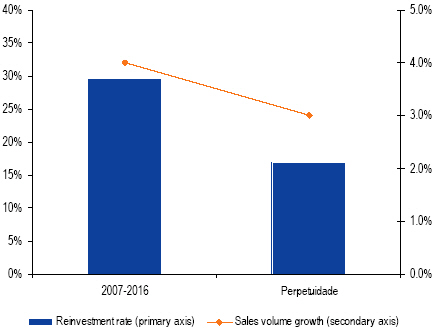 | 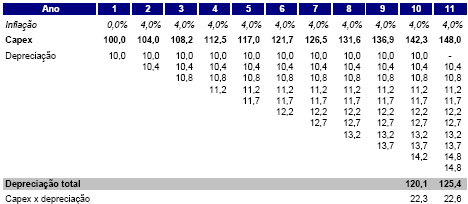 ■The hypothetical example above demonstrates that in years 10 and 11, when the company is in equilibrium and investing at the same rate as depreciation, there is a difference between capex and depreciation ■ The difference results from the monetary adjustment in assets value vis-a-vis the linear depreciation of assets (which is not adjusted for inflation) Note: Values above are in nominal terms for illustrative purpose only | |
| Note: Sales volume growth should not be compared with the “g” in Gordon’s growth model which corresponds to the growth of the free cash flow to the firm |
94 |
Considerations regarding AM/PM valuation
| n | As usual in valuation exercises, we have used the DCF method for the most relevant companies that were part of the Ipiranga Group |
| – | The other companies12 being evaluated were valued based on multiples because the preparation of projections would be subject to a high level of imprecision and wouldn’t improve the quality of the analysis |
| n | We considered inappropriate to value AM/PM based on the DCF analysis |
| – | The projected cash flow would be subject to significant imprecision that wouldn’t improve the conclusions from the analysis |
| – | A valuation based on DCF assumes the company is able to independently execute its business plan in order to maximize its value. This assumption is incorrect for AM/PM as its operations are directly dependent on CBPI’s strategy on fuels distribution13 |
| – | Forecasts for AM/PM would be based on arbitrary assumptions that would be difficult to justify, as for example, estimating the number of CBPI’s clients that would be interested in opening an AM/PM store in their gas stations14 and how this additional AM/PM store would impact the consolidated margins. The valuation based on CBD’s multiple avoided using such speculative assumptions about AM/PM business plan and therefore was the best estimate of AM/PM’s value |
| n | The quality of the valuation based on multiples depends on the quality of the sample15 and not on its size. The quality of the valuation analysis based on multiples depends on the similarities of the companies in the sample and the company being assessed. We have analyzed the companies that could potentially be included in the sample and we have selected those that in our opinion would be a good benchmark for the valuation of AM/PM |
| n | AM/PM’s valuation was based on CBD multiples because CBD is the Brazilian company that best reflects AM/PM’s business plan. CBD has been selected16 as the best benchmark of value given its business profile, the characteristics of the products being sold, its growth profile and margins |
| n | Historical growth rates reflect Ipiranga’s strategy to launch AM/PM stores primarily on Ipiranga’s own gas stations and in the best locations available in the network. In the future, we expect growth rates to be lower given that AM/PM’s growth strategy and market positioning are limited to the gas station network, the desire and viability of opening AM/PM stores, and the Ipiranga Group and the clients agreeing on opening stores |
(12) Specifically, AM/PM represents approximately 6% of CBPI’s value.
(13) AM/PM is not able to independently outline and execute a plan to maximize sales and improve profitability, but rather, AM/PM is part of CBPI which in turn is focused on the business of distributing fuel, and therefore increase the Ipiranga’s brand recognition. AM/PM does not operate in a captive market as AM/PM potential clients can acquire their products in other locations such as supermarkets (CBD), other gas stations (within the network or not), and other types of stores such as restaurants, coffee shops, etc.
(14) Expanding the AM/PM network is not an exclusive decision of the Ipiranga Group, and therefore is not solely based on Ipiranga Group’s economic perspective. Opening an AM/PM store depends on client and Ipiranga to agreeing on opening a store. Note that the client is not obliged to open an AM/PM store, but rather, the Client could open any other convenience store in their gas stations. In addition, not all the gas stations are ready to the opening of an AM/PM store, which is subject to certain criteria such as location and space among others.
(15) Deutsche Bank did not consider correct to compare AM/PM to apparel stores such as Renner, internet based Submarino, department stores or any other retailer focused on selling toys or electronics
(16) Naturally, other companies were considered to be incorporated into the sample, however we understand CBD is the best benchmark of value comparable to AM/PM. Adding more companies to the sample just for the sake of increasing the number of companies in the sample would not improve the quality of the analysis nor the conclusions, but it would compromise the conclusions of the analysis.
95 |