UNITED STATES
SECURITIES AND EXCHANGE COMMISSION
Washington, D.C. 20549
Form 6-K |
Report of Foreign Private Issuer
Pursuant to Rule 13a-16 Or 15d-16 Of
The Securities Exchange Act Of 1934
For the month of August 2021
Commission File Number: 001-14950
ULTRAPAR HOLDINGS INC.
(Translation of Registrant’s Name into English)
Brigadeiro Luis Antonio Avenue, 1343, 9th floor
São Paulo, SP, Brazil 01317-910
(Address of Principal Executive Offices)
Indicate by check mark whether the registrant files or will file annual reports under cover of Form 20-F or Form 40-F:
Form 20-F ____X____ Form 40-F ________
Indicate by check mark if the registrant is submitting the Form 6-K in paper as permitted by Regulation S-T Rule 101(b)(1):
Yes ________ No ____X____
Indicate by check mark if the registrant is submitting the Form 6-K in paper as permitted by Regulation S-T Rule 101(b)(7):
Yes ________ No ____X____
ULTRAPAR HOLDINGS INC.
TABLE OF CONTENTS
|
(Convenience Translation into English from the Original Previously Issued in Portuguese)
Ultrapar Participações S.A.
Interim Financial Information as of and the Six-month Period Ended June 30, 2021 and Report on Review of Interim Financial Information
KPMG Auditores Independentes |
|
Ultrapar Participações S.A. and Subsidiaries
Parent’s Separate and Consolidated
Interim Financial Information
As of and the Six-month Period Ended June 30, 2021
(Convenience Translation into English from the Original Previously Issued in Portuguese)

information - ITR |
|
To the Shareholders, Directors and Management of Ultrapar Participações S.A. São Paulo, SP |
Introduction |
We have reviewed the accompanying individual and consolidated interim financial information of Ultrapar Participações S.A. (“Company”), comprised in the Quarterly Financial Information - ITR Form for the quarter ended June 30, 2021, which comprise the statements of financial position as of June 30, 2021, and related statements of income, comprehensive income for the three and six-month period then ended and changes in shareholders’ equity and cash flows for the six-month period then ended, including the explanatory notes. The Company’s Management is responsible for the preparation of the interim financial information in accordance with Technical Pronouncement CPC 21 (R1) Interim Financial Information and with International Standard IAS 34 – Interim Financial Reporting, issued by the International Accounting Standards Board - IASB, such as for the presentation of these information in a manner consistent with the standards issued by the Brazilian Securities and Exchange Commission, applicable to the preparation of the Quarterly Financial Information - ITR. Our responsibility is to express a conclusion on these interim financial information based on our review. |
Scope of the review |
Our review was conducted in accordance with the Brazilian and international Review Standards of interim information (NBC TR 2410 - Review of Interim Financial Information Performed by the Independent Auditor of the Entity and ISRE 2410 - Review of Interim Financial Information Performed by the Independent Auditor of the Entity, respectively). A review of interim information consists of making inquiries, primarily of persons responsible for financial and accounting matters, and applying analytical and other review procedures. A review is substantially less in scope than an audit conducted in accordance with the auditing standards and consequently does not enable us to obtain assurance that we would become aware of all significant matters that might be identified in an audit. Accordingly, we do not express an audit opinion. |
Conclusion on the individual and consolidated interim financial information |
Based on our review, nothing has come to our attention that causes us to believe that the individual and consolidated interim financial information included in the quarterly information referred to above was not prepared, in all material respects, in accordance with CPC 21 (R1) and IAS 34, issued by the Accounting Committee and by IASB applicable to the preparation of Quarterly Financial Information – ITR and presented in accordance with the standards issued by the Brazilian Securities and Exchange Commission - CVM. |
Other matters - Interim statements of value added |
The individual and consolidated interim statements of value added (DVA) for the six-month period ended June 30, 2021, prepared under the responsibility of the Company's management, and presented as supplementary information for the purposes of IAS 34, were submitted to the same review procedures followed together with the review of the Company's interim financial information. In order to form our conclusion, we evaluated whether these statements are reconciled to the interim financial information and to the accounting records, as applicable, and whether their form and content are in accordance with the criteria set on Technical Pronouncement CPC 09 - Statement of Value Added. Based on our review, nothing has come to our attention that causes us to believe that the accompanying statements of value added are not prepared, in all material respects, according to the criteria defined in this Standard and consistently in accordance with the individual and consolidated interim financial information taken as a whole. |
São Paulo, August 11, 2021
KPMG Auditores Independentes |
Ultrapar Participações S.A. and Subsidiaries
As of June 30, 2021 and December 31, 2020
(In thousands of Brazilian Reais)
|
| Parent |
| Consolidated | ||||
| Note | 06/30/2021 |
| 12/31/2020 |
| 06/30/2021 |
| 12/31/2020 |
Assets |
|
|
|
|
|
|
|
|
Current assets |
|
|
|
|
|
|
|
|
Cash and cash equivalents | 4.a | 3,705 |
| 948,649 |
| 2,860,287 |
| 2,661,494 |
Financial investments and hedging instruments | 4.b | 214,302 |
| 88,100 |
| 3,355,993 |
| 5,033,258 |
Trade receivables | 5.a | - |
| - |
| 3,819,996 |
| 3,318,927 |
Reseller financing | 5.b | - |
| - |
| 543,152 |
| 549,129 |
Inventories | 6 | - |
| - |
| 4,888,796 |
| 3,846,196 |
Recoverable taxes | 7.a | 486 |
| 154 |
| 1,069,766 |
| 1,044,850 |
Recoverable income and social contribution taxes | 7.b | 37,858 |
| 47,913 |
| 353,374 |
| 366,080 |
Dividends receivable |
| 213 |
| 150,301 |
| 1,029 |
| 1,152 |
Other receivables |
| 84,924 |
| 58,300 |
| 114,903 |
| 56,955 |
Prepaid expenses | 10 | 10,215 |
| 3,684 |
| 159,755 |
| 132,122 |
Contractual assets with customers – exclusive rights | 11 | - |
| - |
| 514,410 |
| 478,908 |
Total current assets |
| 351,703 |
| 1,297,101 |
| 17,681,461 |
| 17,489,071 |
Non-current assets |
|
|
|
|
|
|
|
|
Financial investments and hedging instruments | 4.b | - |
| - |
| 762,460 |
| 977,408 |
Trade receivables | 5.a | - |
| - |
| 66,792 |
| 72,195 |
Reseller financing | 5.b | - |
| - |
| 434,023 |
| 419,255 |
Related parties | 8.a | 402,790 |
| 753,459 |
| 22,229 |
| 2,824 |
Deferred income and social contribution taxes | 9.a | 62,358 |
| 64,993 |
| 1,081,597 |
| 974,711 |
Recoverable taxes | 7.a | - |
| - |
| 1,463,750 |
| 1,474,808 |
Recoverable income and social contribution taxes | 7.b | 39,445 |
| 39,446 |
| 193,423 |
| 261,205 |
Escrow deposits | 22.a | 2 |
| 2 |
| 862,669 |
| 949,796 |
Indemnification asset – business combination | 22.c | - |
| - |
| 123,522 |
| 204,439 |
Other receivables |
| - |
| - |
| 22,554 |
| 20,238 |
Prepaid expenses | 10 | 2,802 |
| 3,888 |
| 66,757 |
| 70,507 |
Contractual assets with customers – exclusive rights | 11 | - |
| - |
| 1,297,184 |
| 1,227,423 |
Total long term assets |
| 507,397 |
| 861,788 |
| 6,396,960 |
| 6,654,809 |
Investments |
|
|
|
|
|
|
|
|
In subsidiaries | 12.a | 10,456,648 |
| 10,530,177 |
| - |
| - |
In joint ventures | 12.a; 12.b | - |
| - |
| 146,480 |
| 139,100 |
In associates | 12.c | - |
| - |
| 25,863 |
| 25,588 |
Others |
| - |
| - |
| 2,793 |
| 2,793 |
|
| 10,456,648 |
| 10,530,177 |
| 175,136 |
| 167,481 |
Right-of-use assets | 13 | 34,463 |
| 35,062 |
| 2,057,477 |
| 2,150,286 |
Property, plant, and equipment | 14 | 23,962 |
| 14,328 |
| 8,030,896 |
| 8,005,860 |
Intangible assets | 15 | 253,383 |
| 254,242 |
| 1,631,249 |
| 1,782,655 |
Total non-current assets |
| 11,275,853 |
| 11,695,597 |
| 18,291,718 |
| 18,761,091 |
Total assets |
| 11,627,556 |
| 12,992,698 |
| 35,973,179 |
| 36,250,162 |
The accompanying notes are an integral part of the interim financial information.
Ultrapar Participações S.A. and Subsidiaries
Statements of Financial Position
As of June 30, 2021 and December 31, 2020
(In thousands of Brazilian Reais)
|
| Parent |
| Consolidated | ||||
| Note | 06/30/2021 |
| 12/31/2020 |
| 06/30/2021 |
| 12/31/2020 |
Liabilities |
|
|
|
|
|
|
|
|
Current liabilities |
|
|
|
|
|
|
|
|
Loans, financing and hedge derivative financial instruments | 16 | - |
| 1,038,499 |
| 1,548,657 |
| 2,306,036 |
Debentures | 16.f | 16,396 |
| 9,996 |
| 1,480,638 |
| 949,908 |
Trade payables | 17.a | 25,935 |
| 16,870 |
| 3,058,389 |
| 2,745,019 |
Trade payables – reverse factoring | 17.b | - |
| - |
| 2,434,210 |
| 1,295,633 |
Salaries and related charges | 18 | 32,528 |
| 42,400 |
| 434,217 |
| 468,630 |
Taxes payable | 19 | 741 |
| 812 |
| 288,776 |
| 286,014 |
Dividends payable | 25.h | 9,940 |
| 439,094 |
| 12,124 |
| 442,133 |
Income and social contribution taxes payable |
| - |
| 4,264 |
| 207,360 |
| 169,317 |
Post-employment benefits | 20.b | - |
| - |
| 27,173 |
| 27,077 |
Provision for asset retirement obligation | 21 | - |
| - |
| 4,426 |
| 4,267 |
Provision for tax, civil, and labor risks | 22.a | - |
| - |
| 42,209 |
| 43,660 |
Leases payable | 13 | 5,307 |
| 4,688 |
| 286,617 |
| 260,189 |
Other payables |
| 15,207 |
| 10,157 |
| 226,483 |
| 224,676 |
Deferred revenue | 23 | - |
| - |
| 1,777 |
| 18,282 |
Total current liabilities |
| 106,054 |
| 1,566,780 |
| 10,053,056 |
| 9,240,841 |
Non-current liabilities |
|
|
|
|
|
|
|
|
Loans, financing and hedge derivative financial instruments | 16 | - |
| - |
| 7,698,625 |
| 8,526,064 |
Debentures | 16.f | 1,724,489 |
| 1,724,117 |
| 5,377,711 |
| 5,594,208 |
Related parties | 8.a | 4,804 |
| 5,272 |
| 3,582 |
| 3,711 |
Deferred income and social contribution taxes | 9.a | - |
| - |
| 11,328 |
| 12,732 |
Post-employment benefits | 20.b | 2,725 |
| 2,527 |
| 259,952 |
| 257,647 |
Provision for asset retirement obligation | 21 | - |
| - |
| 49,815 |
| 49,168 |
Provision for tax, civil, and labor risks | 22.a; 22.c | 280 |
| 280 |
| 768,592 |
| 854,385 |
Leases payable | 13 | 32,513 |
| 33,246 |
| 1,509,101 |
| 1,573,099 |
Subscription warrants – indemnification | 24 | 65,645 |
| 86,439 |
| 65,645 |
| 86,439 |
Provision for short-term liabilities of subsidiaries and joint venture | 12.a; 12.b | 20,608 |
| 35,794 |
| 782 |
| 2,096 |
Other payables |
| 5,697 |
| 4,497 |
| 126,173 |
| 139,507 |
Total non-current liabilities |
| 1,856,761 |
| 1,892,172 |
| 15,871,306 |
| 17,099,056 |
Equity |
|
|
|
|
|
|
|
|
Share capital | 25.a; 25.f | 5,171,752 |
| 5,171,752 |
| 5,171,752 |
| 5,171,752 |
Equity instrument granted | 25.b | 29,954 |
| 22,404 |
| 29,954 |
| 22,404 |
Capital reserve | 25.d | 595,420 |
| 594,049 |
| 595,420 |
| 594,049 |
Treasury shares | 25.c | (489,068) |
| (489,068) |
| (489,068) |
| (489,068) |
Revaluation reserve on subsidiaries | 25.e | 4,245 |
| 4,337 |
| 4,245 |
| 4,337 |
Profit reserves | 25.f | 4,408,275 |
| 4,408,275 |
| 4,408,275 |
| 4,408,275 |
Retained earnings |
| 108,529 |
| - |
| 108,529 |
| - |
Valuation adjustments | 25.g.1 | (358,523) |
| (464,990) |
| (358,523) |
| (464,990) |
Cumulative translation adjustments | 25.g.2 | 194,157 |
| 231,596 |
| 194,157 |
| 231,596 |
Additional dividends to the minimum mandatory dividends | 25.h | - |
| 55,391 |
| - |
| 55,391 |
Equity attributable to: |
|
|
|
|
|
|
|
|
Shareholders of the Company |
| 9,664,741 |
| 9,533,746 |
| 9,664,741 |
| 9,533,746 |
Non-controlling interests in subsidiaries |
| - |
| - |
| 384,076 |
| 376,519 |
Total equity |
| 9,664,741 |
| 9,533,746 |
| 10,048,817 |
| 9,910,265 |
Total liabilities and equity |
| 11,627,556 |
| 12,992,698 |
| 35,973,179 |
| 36,250,162 |
The accompanying notes are an integral part of the interim financial information.
Ultrapar Participações S.A. and Subsidiaries
For the six-month period ended June 30, 2021 and 2020
(In thousands of Brazilian Reais, except earnings per share)
|
| Parent |
| Consolidated | ||||
| Note | 06/30/2021 |
| 06/30/2020 |
| 06/30/2021 |
| 06/30/2020 |
Net revenue from sales and services | 26 | - |
| - |
| 52,476,338 |
| 37,263,372 |
Cost of products and services sold | 27 | - |
| - |
| (49,264,664) |
| (34,802,194) |
Gross profit |
| - |
| - |
| 3,211,674 |
| 2,461,178 |
|
|
|
|
|
|
|
|
|
Operating income (expenses) |
|
|
|
|
|
|
|
|
Selling and marketing | 27 | - |
| - |
| (1,365,116) |
| (1,196,737) |
Expected reversion (losses) on doubtful accounts |
| - |
| - |
| 6,340 |
| (56,516) |
General and administrative | 27 | (12,119) |
| - |
| (941,836) |
| (703,121) |
Gain (loss) on disposal of property, plant and equipment and intangibles | 28 | 2 |
| - |
| 40,148 |
| 20,910 |
Impairment | 3.c.1; 28 | - |
| - |
| (394,675) |
| - |
Other operating income | 29 | - |
| 2,178 |
| 228,698 |
| 228,296 |
Other operating expenses | 29 | (19) |
| (1,622) |
| (162,794) |
| (68,142) |
|
|
|
|
|
|
|
|
|
Operating income (loss) before finance income (expenses) and share of profit (loss) of subsidiaries, joint ventures and associates |
| (12,136) |
| 556 |
| 622,439 |
| 685,868 |
Share of profit (loss) of subsidiaries, joint ventures and associates | 12 | 122,334 |
| 218,142 |
| (10,941) |
| (25,698) |
Operating income before finance income (expenses) and income and social contribution taxes |
| 110,198 |
| 218,698 |
| 611,498 |
| 660,170 |
Finance income | 30 | 34,558 |
| 31,769 |
| 212,146 |
| 235,164 |
Finance expenses | 30 | (41,038) |
| (51,633) |
| (548,582) |
| (483,122) |
Financial result, net | 30 | (6,480) |
| (19,864) |
| (336,436) |
| (247,958) |
Profit before income and social contribution taxes |
| 103,718 |
| 198,834 |
| 275,062 |
| 412,212 |
Income and social contribution taxes |
|
|
|
|
|
|
|
|
Current | 9.b; 9.c | - |
| (170) |
| (329,775) |
| (219,632) |
Deferred | 9.b | (2,635) |
| 3,261 |
| 173,900 |
| 26,314 |
|
| (2,635) |
| 3,091 |
| (155,875) |
| (193,318) |
Profit for the period |
| 101,083 |
| 201,925 |
| 119,187 |
| 218,894 |
Income attributable to: |
|
|
|
|
|
|
|
|
Shareholders of the Company |
| 101,083 |
| 201,925 |
| 101,083 |
| 201,925 |
Non-controlling interests in subsidiaries |
| - |
| - |
| 18,104 |
| 16,969 |
Earnings per share (based on weighted average number of shares outstanding) – R$ |
|
|
|
|
|
|
|
|
Basic | 31 | 0.0929 |
| 0.1856 |
| 0.0929 |
| 0.1856 |
Diluted | 31 | 0.0924 |
| 0.1845 |
| 0.0924 |
| 0.1845 |
The accompanying notes are an integral part of the interim financial information.
Ultrapar Participações S.A. and Subsidiaries
Statements of Profit or Loss
For the three-month period ended June 30, 2021 and 2020
(In thousands of Brazilian Reais, except earnings per share)
|
| Parent |
| Consolidated | ||||
| Note | 06/30/2021 |
| 06/30/2020 |
| 06/30/2021 |
| 06/30/2020 |
Net revenue from sales and services | 26 | - |
| - |
| 28,526,054 |
| 15,876,234 |
Cost of products and services sold | 27 | - |
| - |
| (27,030,286) |
| (14,825,003) |
Gross profit |
| - |
| - |
| 1,495,768 |
| 1,051,231 |
|
|
|
|
|
|
|
|
|
Operating income (expenses) |
|
|
|
|
|
|
|
|
Selling and marketing | 27 | - |
| - |
| (710,543) |
| (582,106) |
Expected reversion (losses) on doubtful accounts |
| - |
| - |
| 10,280 |
| (26,241) |
General and administrative | 27 | (12,119) |
| - |
| (473,146) |
| (293,240) |
Gain (loss) on disposal of property, plant and equipment and intangibles | 28 | 1 |
| - |
| 32,072 |
| 13,972 |
Impairment | 3.c.1; 28 | - |
| - |
| (394,675) |
| - |
Other operating income | 29 | - |
| 2,178 |
| 176,096 |
| 68,723 |
Other operating expenses | 29 | 2,995 |
| (1,377) |
| (97,767) |
| (32,508) |
|
|
|
|
|
|
|
|
|
Operating income (loss) before finance income (expenses) and share of profit (loss) of subsidiaries, joint ventures and associates |
| (9,123) |
| 801 |
| 38,085 |
| 199,831 |
Share of profit (loss) of subsidiaries, joint ventures and associates | 12 | (21,719) |
| 63,293 |
| 1,281 |
| (13,270) |
Operating income (loss) before finance income (expenses) and income and social contribution taxes |
| (30,842) |
| 64,094 |
| 39,366 |
| 186,561 |
Finance income | 30 | 16,159 |
| (2,365) |
| 150,578 |
| 53,113 |
Finance expenses | 30 | (16,596) |
| (30,580) |
| (153,333) |
| (133,441) |
Financial result, net | 30 | (437) |
| (32,945) |
| (2,755) |
| (80,328) |
Profit (loss) before income and social contribution taxes |
| (31,279) |
| 31,149 |
| 36,611 |
| 106,233 |
Income and social contribution taxes |
|
|
|
|
|
|
|
|
Current | 9.b; 9.c | - |
| - |
| (223,321) |
| (111,343) |
Deferred | 9.b | 199 |
| 9,917 |
| 168,467 |
| 55,138 |
|
| 199 |
| 9,917 |
| (54,854) |
| (56,205) |
Profit (loss) for the period |
| (31,080) |
| 41,066 |
| (18,243) |
| 50,028 |
Income attributable to: |
|
|
|
|
|
|
|
|
Shareholders of the Company |
| (31,080) |
| 41,066 |
| (31,080) |
| 41,066 |
Non-controlling interests in subsidiaries |
| - |
| - |
| 12,837 |
| 8,962 |
Earnings (loss) per share (based on weighted average number of shares outstanding) – R$ |
|
|
|
|
|
|
|
|
Basic | 31 | (0.0286) |
| 0.0377 |
| (0.0286) |
| 0.0377 |
Diluted | 31 | (0.0284) |
| 0.0375 |
| (0.0284) |
| 0.0375 |
The accompanying notes are an integral part of the interim financial information.
Ultrapar Participações S.A. and Subsidiaries
For the six-month period ended June 30, 2021 and 2020
(In thousands of Brazilian Reais)
|
| Parent |
| Consolidated | ||||
| Note | 06/30/2021 |
| 06/30/2020 |
| 06/30/2021 |
| 06/30/2020 |
Net income for the period |
| 101,083 |
| 201,925 |
| 119,187 |
| 218,894 |
Items that are subsequently reclassified to profit or loss: |
|
|
|
|
|
|
|
|
Fair value adjustments of financial instruments, net | 25.g.1 | (120) |
| 432 |
| (120) |
| 432 |
Fair value adjustments of financial instruments of subsidiaries, net | 25.g.1 | 107,364 |
| (476,773) |
| 107,371 |
| (476,773) |
Fair value adjustments of financial instruments of joint ventures, net | 25.g.1 | (1,338) |
| 1,861 |
| (1,338) |
| 1,861 |
Cumulative translation adjustments and hedge of net investments in foreign operations, net | 25.g.2 | (37,439) |
| 136,122 |
| (37,439) |
| 136,122 |
Items that are not subsequently reclassified to profit or loss: |
|
|
|
|
|
|
|
|
Income and social contribution taxes on actuarial losses of post-employment benefits | 25.g.1 | 561 |
| - |
| 561 |
| - |
Total comprehensive income for the period |
| 170,111 |
| (136,433) |
| 188,222 |
| (119,464) |
Total comprehensive income for the period attributable to shareholders of the Company |
| 170,111 |
| (136,433) |
| 170,111 |
| (136,433) |
Total comprehensive income for the period attributable to non-controlling interest in subsidiaries |
| - |
| - |
| 18,111 |
| 16,969 |
The accompanying notes are an integral part of the interim financial information.
Ultrapar Participações S.A. and Subsidiaries
Statements of Comprehensive Income
For the three-month period ended June 30, 2021 and 2020
(In thousands of Brazilian Reais)
|
| Parent |
| Consolidated | ||||
| Note | 06/30/2021 |
| 06/30/2020 |
| 06/30/2021 |
| 06/30/2020 |
Net income for the period |
| (31,080) |
| 41,066 |
| (18,243) |
| 50,028 |
Items that are subsequently reclassified to profit or loss: |
|
|
|
|
|
|
|
|
Fair value adjustments of financial instruments, net | 25.g.1 | (3) |
| 430 |
| (3) |
| 430 |
Fair value adjustments of financial instruments of subsidiaries, net | 25.g.1 | 228,621 |
| (56,739) |
| 228,628 |
| (56,739) |
Fair value adjustments of financial instruments of joint ventures, net | 25.g.1 | (2,786) |
| (640) |
| (2,786) |
| (640) |
Cumulative translation adjustments and hedge of net investments in foreign operations, net | 25.g.2 | (125,287) |
| 14,248 |
| (125,287) |
| 14,248 |
Items that are not subsequently reclassified to profit or loss: |
|
|
|
|
|
|
|
|
Income and social contribution taxes on actuarial losses of post-employment benefits | 25.g.1 | 561 |
| - |
| 561 |
| - |
Total comprehensive income for the period |
| 70,026 |
| (1,635) |
| 82,870 |
| 7,327 |
Total comprehensive income for the period attributable to shareholders of the Company |
| 70,026 |
| (1,635) |
| 70,026 |
| (1,635) |
Total comprehensive income for the period attributable to non-controlling interest in subsidiaries |
| - |
| - |
| 12,844 |
| 8,962 |
The accompanying notes are an integral part of the interim financial information.
Ultrapar Participações S.A. and Subsidiaries
For the six-month period ended June 30, 2021 and 2020
(In thousands of Brazilian Reais, except dividends per share)
|
|
|
|
|
|
|
|
|
|
|
|
| Profit reserve |
|
|
|
|
|
|
|
|
| Equity attributable to: |
|
| ||||
| Note |
| Share capital |
| Equity instrument granted |
| Capital reserve |
| Treasury shares |
| Revaluation reserve on subsidiaries |
| Legal reserve |
| Investments statutory reserve |
| Valuation adjustments |
| Cumulative translation adjustments |
| Retained earnings |
| Additional dividends to the minimum mandatory dividends |
| Shareholders of the Company |
| Non-controlling interests in subsidiaries |
| Consolidated equity |
Balance as of December 31, 2020 |
|
| 5,171,752 |
| 22,404 |
| 594,049 |
| (489,068) |
| 4,337 |
| 750,010 |
| 3,658,265 |
| (464,990) |
| 231,596 |
| - |
| 55,391 |
| 9,533,746 |
| 376,519 |
| 9,910,265 |
Net income for the period |
|
| - |
| - |
| - |
| - |
| - |
| - |
| - |
| - |
| - |
| 101,083 |
| - |
| 101,083 |
| 18,104 |
| 119,187 |
Other comprehensive income: |
|
|
|
|
|
|
|
|
|
|
|
|
|
|
|
|
|
|
|
|
|
|
|
|
|
|
|
|
|
Fair value adjustments of available for financial instruments, net of income taxes: |
|
|
|
|
|
|
|
|
|
|
|
|
|
|
|
|
|
|
|
|
|
|
|
|
|
|
|
|
|
Company | 25.g.1 |
| - |
| - |
| - |
| - |
| - |
| - |
| - |
| (120) |
| - |
| - |
| - |
| (120) |
| - |
| (120) |
Subsidiaries | 12.a; 25.g.1 |
| - |
| - |
| - |
| - |
| - |
| - |
| - |
| 107,364 |
| - |
| - |
| - |
| 107,364 |
| 7 |
| 107,371 |
Joint ventures | 12.a; 25.g.1 |
| - |
| - |
| - |
| - |
| - |
| - |
| - |
| (1,338) |
| - |
| - |
| - |
| (1,338) |
| - |
| (1,338) |
Income and social contribution taxes on actuarial losses of post-employment benefits | 12.a; 25.g.1 |
| - |
| - |
| - |
| - |
| - |
| - |
| - |
| 561 |
| - |
| - |
| - |
| 561 |
| - |
| 561 |
Currency translation of foreign subsidiaries and the effect of net investments hedge, net of income taxes | 12.a; 25.g.2 |
| - |
| - |
| - |
| - |
| - |
| - |
| - |
| - |
| (37,439) |
| - |
| - |
| (37,439) |
| - |
| (37,439) |
Total comprehensive income for the period |
|
| - |
| - |
| - |
| - |
| - |
| - |
| - |
| 106,467 |
| (37,439) |
| 101,083 |
| - |
| 170,111 |
| 18,111 |
| 188,222 |
Issuance of shares related to the subscription warrants - indemnification - Extrafarma acquisition | 25.d |
| - |
| - |
| 1,371 |
| - |
| - |
| - |
| - |
| - |
| - |
| - |
| - |
| 1,371 |
| - |
| 1,371 |
Equity instrument granted | 25.b |
| - |
| 2,965 |
| - |
| - |
| - |
| - |
| - |
| - |
| - |
| - |
| - |
| 2,965 |
| - |
| 2,965 |
Equity instrument granted of subsidiaries | 12.a; 25.b |
| - |
| 4,585 |
| - |
| - |
| - |
| - |
| - |
| - |
| - |
| - |
| - |
| 4,585 |
| - |
| 4,585 |
Income and social contribution taxes on realization of revaluation reserve of subsidiaries | 25.e |
| - |
| - |
| - |
| - |
| (92) |
| - |
| - |
| - |
| - |
| 92 |
| - |
| - |
| - |
| - |
Prescribed dividends |
|
| - |
| - |
| - |
| - |
| - |
| - |
| - |
| - |
| - |
| 7,137 |
| - |
| 7,137 |
| - |
| 7,137 |
Gains due to the payments fixed dividends to preferred shares of subsidiaries |
|
| - |
| - |
| - |
| - |
| - |
| - |
| - |
| - |
| - |
| 138 |
| - |
| 138 |
| (138) |
| - |
Shareholder transaction – changes of investments |
|
| - |
| - |
| - |
| - |
| - |
| - |
| - |
| - |
| - |
| 79 |
| - |
| 79 |
| (79) |
| - |
Dividends attributable to non-controlling interests |
|
| - |
| - |
| - |
| - |
| - |
| - |
| - |
| - |
| - |
| - |
| - |
| - |
| (10,337) |
| (10,337) |
Approval of additional dividends by the Shareholders’ Meeting | 25.h |
| - |
| - |
| - |
| - |
| - |
| - |
| - |
| - |
| - |
| - |
| (55,391) |
| (55,391) |
| - |
| (55,391) |
Balance as of June 30, 2021 |
|
| 5,171,752 |
| 29,954 |
| 595,420 |
| (489,068) |
| 4,245 |
| 750,010 |
| 3,658,265 |
| (358,523) |
| 194,157 |
| 108,529 |
| - |
| 9,664,741 |
| 384,076 |
| 10,048,817 |
The accompanying notes are an integral part of the interim financial information.
Ultrapar Participações S.A. and Subsidiaries
Statements of Changes in Equity
For the six-month period ended June 30, 2021 and 2020
(In thousands of Brazilian Reais, except dividends per share)
|
|
|
|
|
|
|
|
|
|
|
|
| Profit reserve |
|
|
|
|
|
|
|
|
| Equity attributable to: |
|
| ||||
| Note |
| Share capital |
| Equity instrument granted |
| Capital reserve |
| Treasury shares |
| Revaluation reserve on subsidiaries |
| Legal reserve |
| Investments statutory reserve |
| Valuation adjustments |
| Cumulative translation adjustments |
| Retained earnings |
| Additional dividends to the minimum mandatory dividends |
| Shareholders of the Company |
| Non-controlling interests in subsidiaries |
| Consolidated equity |
Balance as of December 31, 2019 |
|
| 5,171,752 |
| 11,970 |
| 542,400 |
| (485,383) |
| 4,522 |
| 705,341 |
| 3,290,073 |
| (146,317) |
| 102,427 |
| - |
| 261,470 |
| 9,458,255 |
| 376,920 |
| 9,835,175 |
Net income for the period |
|
| - |
| - |
| - |
| - |
| - |
| - |
| - |
| - |
| - |
| 201,925 |
| - |
| 201,925 |
| 16,969 |
| 218,894 |
Other comprehensive income: |
|
|
|
|
|
|
|
|
|
|
|
|
|
|
|
|
|
|
|
|
|
|
|
|
|
|
|
|
|
Fair value adjustments of available for financial instruments, net of income taxes: |
|
|
|
|
|
|
|
|
|
|
|
|
|
|
|
|
|
|
|
|
|
|
|
|
|
|
|
|
|
Company | 25.g.1 |
| - |
| - |
| - |
| - |
| - |
| - |
| - |
| 432 |
| - |
| - |
| - |
| 432 |
| - |
| 432 |
Subsidiaries and joint ventures | 12.a; 25.g.1 |
| - |
| - |
| - |
| - |
| - |
| - |
| - |
| (474,912) |
| - |
| - |
| - |
| (474,912) |
| - |
| (474,912) |
Currency translation of foreign subsidiaries, including the effect of net investments hedge | 25.g.2 |
| - |
| - |
| - |
| - |
| - |
| - |
| - |
| - |
| 136,122 |
| - |
| - |
| 136,122 |
| - |
| 136,122 |
Total comprehensive income for the period |
|
| - |
| - |
| - |
| - |
| - |
| - |
| - |
| (474,480) |
| 136,122 |
| 201,925 |
| - |
| (136,433) |
| 16,969 |
| (119,464) |
Issuance of shares related to the subscription warrants - indemnification - Extrafarma acquisition | 25.d |
| - |
| - |
| 53,072 |
| - |
| - |
| - |
| - |
| - |
| - |
| - |
| - |
| 53,072 |
| - |
| 53,072 |
Equity instrument granted | 25.b |
| - |
| 2,189 |
| - |
| - |
| - |
| - |
| - |
| - |
| - |
| - |
| - |
| 2,189 |
| - |
| 2,189 |
Equity instrument granted of subsidiaries | 12.a; 25.b |
| - |
| 1,281 |
| - |
| - |
| - |
| - |
| - |
| - |
| - |
| - |
| - |
| 1,281 |
| - |
| 1,281 |
Income and social contribution taxes on realization of revaluation reserve of subsidiaries | 25.e |
| - |
| - |
| - |
| - |
| (93) |
| - |
| - |
| - |
| - |
| 93 |
| - |
| - |
| - |
| - |
Loss due to the payments fixed dividends to preferred shares |
|
| - |
| - |
| - |
| - |
| - |
| - |
| - |
| - |
| - |
| (516) |
| - |
| (516) |
| 516 |
| - |
Shareholder transaction – changes of investments |
|
| - |
| - |
| - |
| - |
| - |
| - |
| - |
| - |
| - |
| 41 |
| - |
| 41 |
| (41) |
| - |
Dividends attributable to non-controlling interests |
|
| - |
| - |
| - |
| - |
| - |
| - |
| - |
| - |
| - |
| - |
| - |
| - |
| (2,790) |
| (2,790) |
Approval of additional dividends by the Shareholders’ Meeting | 25.h |
| - |
| - |
| - |
| - |
| - |
| - |
| - |
| - |
| - |
| - |
| (261,470) |
| (261,470) |
| - |
| (261,470) |
Balance as of June 30, 2020 |
|
| 5,171,752 |
| 15,440 |
| 595,472 |
| (485,383) |
| 4,429 |
| 705,341 |
| 3,290,073 |
| (620,797) |
| 238,549 |
| 201,543 |
| - |
| 9,116,419 |
| 391,574 |
| 9,507,993 |
The accompanying notes are an integral part of the interim financial information.
Ultrapar Participações S.A. and Subsidiaries
For the six-month period ended June 30, 2021 and 2020
(In thousands of Brazilian Reais)
|
| Parent |
| Consolidated | ||||
| Note | 06/30/2021 |
| 06/30/2020 |
| 06/30/2021 |
| 06/30/2020 |
Cash flows from operating activities |
|
|
|
|
|
|
|
|
Profit for the period |
| 101,083 |
| 201,925 |
| 119,187 |
| 218,894 |
Adjustments to reconcile net income to cash provided by operating activities |
|
|
|
|
|
|
|
|
Share of loss (profit) of subsidiaries, joint ventures and associates | 12 | (122,334) |
| (218,142) |
| 10,941 |
| 25,698 |
Amortization of contractual assets with customers – exclusive rights | 11 | - |
| - |
| 128,879 |
| 150,854 |
Amortization of right-of-use assets | 13.a | 2,984 |
| 1,854 |
| 175,346 |
| 158,628 |
Depreciation and amortization | 14; 15 | 3,030 |
| 971 |
| 493,054 |
| 458,512 |
PIS and COFINS credits on depreciation | 14; 15 | - |
| - |
| 8,805 |
| 8,794 |
Interest and foreign exchange rate variations |
| 8,778 |
| 36,030 |
| 613,578 |
| 614,526 |
Deferred income and social contribution taxes | 9.b | 2,635 |
| (3,261) |
| (173,900) |
| (26,314) |
Current income and social contribution taxes | 9.b | - |
| 170 |
| 329,775 |
| 219,632 |
Loss on disposal of property, plant, and equipment and intangibles | 28 | (2) |
| - |
| (40,148) |
| (20,910) |
Impairment | 3.c.1; 28 | - |
| - |
| 394,675 |
| - |
Expected losses on doubtful accounts | 5 | - |
| - |
| (6,340) |
| 56,516 |
Provision for losses in inventories | 6 | - |
| - |
| (3,371) |
| (1,800) |
Provision for post-employment benefits | 20.b | 198 |
| 913 |
| 2,626 |
| (2,896) |
Equity instrument granted | 8.c | 2,965 |
| 2,191 |
| 7,550 |
| 3,471 |
Provision of decarbonization – CBIO | 29 | - |
| - |
| 64,920 |
| - |
Provision for tax, civil, and labor risks | 22.a | - |
| (119) |
| (71,543) |
| (6,420) |
Other provisions and adjustments |
| 1,371 |
| (219) |
| 5,312 |
| (2,214) |
|
| 708 |
| 22,313 |
| 2,059,346 |
| 1,854,971 |
(Increase) decrease in current assets |
|
|
|
|
|
|
|
|
Trade receivables and reseller financing | 5 | - |
| (200) |
| (480,955) |
| 517,590 |
Inventories | 6 | - |
| - |
| (1,035,716) |
| 752,595 |
Recoverable taxes | 7 | 5,458 |
| (3,700) |
| (187,259) |
| (268,978) |
Dividends received from subsidiaries and joint ventures |
| 479,726 |
| 219,442 |
| 124 |
| 4,718 |
Other receivables |
| (26,625) |
| (21,543) |
| (57,948) |
| (49,815) |
Prepaid expenses | 10 | (6,531) |
| (2,783) |
| (55,598) |
| (74,316) |
Increase (decrease) in current liabilities |
|
|
|
|
|
|
|
|
Trade payables | 17 | 9,065 |
| 3,755 |
| 1,293,640 |
| (218,037) |
Salaries and related charges | 18 | (9,872) |
| 28,196 |
| (34,413) |
| 33,433 |
Taxes payable | 19 | (70) |
| 557 |
| 2,762 |
| (39,041) |
Post-employment benefits | 20.b | - |
| - |
| 96 |
| 777 |
Other payables |
| 4,583 |
| 1,686 |
| (8,199) |
| 20,082 |
Deferred revenue | 23 | - |
| - |
| (16,505) |
| (1,243) |
(Increase) decrease in non-current assets |
|
|
|
|
|
|
|
|
Trade receivables and reseller financing | 5 | - |
| - |
| (9,365) |
| (52,271) |
Recoverable taxes | 7 | 2 |
| - |
| (79,433) |
| (276,826) |
Escrow deposits |
| - |
| 15 |
| 87,127 |
| (28,302) |
Other receivables |
| - |
| - |
| 78,602 |
| 184 |
Prepaid expenses | 10 | 1,086 |
| (1,732) |
| 10,439 |
| (14,578) |
The accompanying notes are an integral part of the interim financial information.
Ultrapar Participações S.A. and Subsidiaries
Statements of Cash Flows – Indirect Method
For the six-month period ended June 30, 2021 and 2020
(In thousands of Brazilian Reais)
|
| Parent |
| Consolidated | ||||
|
| 06/30/2021 |
| 06/30/2020 |
| 06/30/2021 |
| 06/30/2020 |
Increase (decrease) in non-current liabilities |
|
|
|
|
|
|
|
|
Post-employment benefits | 20.b | - |
| 5,602 |
| (321) |
| 6,044 |
Other payables |
| 732 |
| 4,415 |
| (13,318) |
| (40,167) |
Acquisition of CBIO | 15 | - |
| - |
| (59,019) |
| - |
Payments of contractual assets with customers – exclusive rights | 11 | - |
| - |
| (83,632) |
| (236,579) |
Payments of contingencies | 22.a | - |
| - |
| (15,700) |
| (29,351) |
Income and social contribution taxes paid |
| - |
| - |
| (116,683) |
| (58,139) |
Net cash provided by operating activities |
| 458,262 |
| 256,023 |
| 1,278,072 |
| 1,802,751 |
Cash flows from investing activities |
|
|
|
|
|
|
|
|
Financial investments, net of redemptions | 4.b | (116,065) |
| 42,728 |
| 1,638,130 |
| 312,119 |
Acquisition of property, plant, and equipment | 14 | (11,741) |
| (5,595) |
| (571,714) |
| (354,487) |
Acquisition of intangible assets | 15 | (64) |
| (10,023) |
| (96,850) |
| (78,607) |
Capital increase in subsidiary | 12.a | (75,011) |
| (3,559) |
| - |
| - |
Capital increase in joint ventures | 12.b | - |
| - |
| (22,000) |
| (10,000) |
Related parties | 8.a | 350,669 |
| - |
| (19,405) |
| - |
Proceeds from disposal of property, plant, and equipment and intangibles | 28 | - |
| - |
| 71,931 |
| 49,447 |
Net cash provided by (used in) investing activities |
| 147,788 |
| 23,551 |
| 1,000,092 |
| (81,528) |
Cash flows from financing activities |
|
|
|
|
|
|
|
|
Loans and debentures |
|
|
|
|
|
|
|
|
Proceeds | 16 | - |
| 994,996 |
| 493,594 |
| 1,611,155 |
Repayments | 16 | (1,000,000) |
| - |
| (1,518,163) |
| (984,871) |
Interest paid | 16 | (69,923) |
| (43,083) |
| (352,645) |
| (336,187) |
Payments of lease |
|
|
|
|
|
|
|
|
Principal | 13 | (4,030) |
| (2,229) |
| (211,406) |
| (167,045) |
Interest paid | 13 | (101) |
| (92) |
| (6,653) |
| (5,228) |
Dividends paid | 25.h | (477,408) |
| (260,004) |
| (488,600) |
| (263,059) |
Related parties | 8.a | 468 |
| 3,690 |
| (129) |
| (48) |
Net cash provided by (used in) in financing activities |
| (1,550,994) |
| 693,278 |
| (2,084,002) |
| (145,283) |
Effect of exchange rate changes on cash and cash equivalents in foreign currency |
| - |
| - |
| 4,631 |
| 113,872 |
Increase (decrease) in cash and cash equivalents |
| (944,944) |
| 972,852 |
| 198,793 |
| 1,689,812 |
Cash and cash equivalents at the beginning of the year | 4.a | 948,649 |
| 42,580 |
| 2,661,494 |
| 2,115,379 |
Cash and cash equivalents at the end of the year | 4.a | 3,705 |
| 1,015,432 |
| 2,860,287 |
| 3,805,191 |
Transactions without cash effect: |
|
|
|
|
|
|
|
|
Addition on right-of-use assets and leases payable | 13.a | 2,486 |
| 32,719 |
| 133,813 |
| 293,685 |
Addition on contractual assets with customers – exclusive rights | 11 | - |
| - |
| 158,306 |
| 56,260 |
Reversion fund – private pension | 10; 20.a | - |
| - |
| 3,706 |
| 47,088 |
Issuance of shares related to the subscription warrants – indemnification – Extrafarma acquisition | 25.d | 1,371 |
| 53,072 |
| 1,371 |
| 53,072 |
The accompanying notes are an integral part of the interim financial information.
Ultrapar Participações S.A. and Subsidiaries
For the six-month period ended June 30, 2021 and 2020
(In thousands of Brazilian Reais, except percentages)
|
| Parent |
| Consolidated | ||||||||||||
| Note | 06/30/2021 |
| % |
| 06/30/2020 |
| % |
| 06/30/2021 |
| % |
| 06/30/2020 |
| % |
Revenue |
|
|
|
|
|
|
|
|
|
|
|
|
|
|
|
|
Gross revenue from sales and services, except rents and royalties | 26 | - |
|
|
| - |
|
|
| 55,395,887 |
|
|
| 40,044,517 |
|
|
Rebates, discounts, and returns | 26 | - |
|
|
| - |
|
|
| (675,209) |
|
|
| (753,010) |
|
|
Expected reversion (losses) on doubtful accounts | 5 | - |
|
|
| - |
|
|
| 6,340 |
|
|
| (56,516) |
|
|
Amortization of contractual assets with customers – exclusive rights | 11 | - |
|
|
| - |
|
|
| (128,879) |
|
|
| (150,854) |
|
|
Provision for loss on disposal of property, plant, and equipment and intangibles and other operating income, net | 28; 29 | - |
|
|
| - |
|
|
| 106,052 |
|
|
| 64,759 |
|
|
|
| - |
|
|
| - |
|
|
| 54,704,191 |
|
|
| 39,148,896 |
|
|
Materials purchased from third parties |
|
|
|
|
|
|
|
|
|
|
|
|
|
|
|
|
Raw materials used |
| - |
|
|
| - |
|
|
| (3,527,831) |
|
|
| (2,731,931) |
|
|
Cost of goods, products, and services sold |
| - |
|
|
| - |
|
|
| (46,093,574) |
|
|
| (32,142,487) |
|
|
Third-party materials, energy, services, and others |
| 73,804 |
|
|
| 79,685 |
|
|
| (1,445,601) |
|
|
| (1,157,296) |
|
|
Impairment | 3.c.1; 28 | - |
|
|
| - |
|
|
| (394,675) |
|
|
| - |
|
|
Provision for losses of assets |
| - |
|
|
| - |
|
|
| (20,173) |
|
|
| (19,808) |
|
|
|
| 73,804 |
|
|
| 79,685 |
|
|
| (51,481,854) |
|
|
| (36,051,522) |
|
|
Gross value added |
| 73,804 |
|
|
| 79,685 |
|
|
| 3,222,337 |
|
|
| 3,097,374 |
|
|
Deductions |
|
|
|
|
|
|
|
|
|
|
|
|
|
|
|
|
Depreciation and amortization | 13.a; 14; 15 | (6,014) |
|
|
| (2,825) |
|
|
| (668,400) |
|
|
| (617,140) |
|
|
PIS and COFINS credits on depreciation | 14; 15 | - |
|
|
| - |
|
|
| (8,805) |
|
|
| (8,794) |
|
|
|
| (6,014) |
|
|
| (2,825) |
|
|
| (677,205) |
|
|
| (625,934) |
|
|
Net value added by the Company |
| 67,790 |
|
|
| 76,860 |
|
|
| 2,545,132 |
|
|
| 2,471,440 |
|
|
Value added received in transfer |
|
|
|
|
|
|
|
|
|
|
|
|
|
|
|
|
Share of profit (loss) of subsidiaries, joint ventures, and associates | 12 | 122,334 |
|
|
| 218,142 |
|
|
| (10,941) |
|
|
| (25,698) |
|
|
Rents and royalties | 26 | - |
|
|
| - |
|
|
| 57,137 |
|
|
| 57,226 |
|
|
Financial income | 30 | 34,558 |
|
|
| 31,769 |
|
|
| 212,146 |
|
|
| 235,164 |
|
|
|
| 156,892 |
|
|
| 249,911 |
|
|
| 258,342 |
|
|
| 266,692 |
|
|
Total value added available for distribution |
| 224,682 |
|
|
| 326,771 |
|
|
| 2,803,474 |
|
|
| 2,738,132 |
|
|
Distribution of value added |
|
|
|
|
|
|
|
|
|
|
|
|
|
|
|
|
Labor and benefits |
| 65,984 |
| 29 |
| 61,447 |
| 19 |
| 1,032,861 |
| 37 |
| 932,672 |
| 34 |
Taxes, fees, and contributions |
| 14,968 |
| 7 |
| 7,826 |
| 2 |
| 1,206,638 |
| 43 |
| 1,184,221 |
| 43 |
Financial expenses and rents |
| 42,647 |
| 19 |
| 55,573 |
| 17 |
| 444,788 |
| 16 |
| 402,345 |
| 15 |
Retained earnings |
| 101,083 |
| 45 |
| 201,925 |
| 62 |
| 119,187 |
| 4 |
| 218,894 |
| 8 |
Value added distributed |
| 224,682 |
| 100 |
| 326,771 |
| 100 |
| 2,803,474 |
| 100 |
| 2,738,132 |
| 100 |
The accompanying notes are an integral part of the interim financial information.
Ultrapar Participações S.A. and Subsidiaries
Notes to the Parent’s Separate and Consolidated Interim Financial Information
(In thousands of Brazilian Reais, unless otherwise stated)
1. Operations
Ultrapar Participações S.A. (“Ultrapar” or “Company”) is a publicly-traded company headquartered at the Brigadeiro Luis Antônio Avenue, 1343 in the city of São Paulo – SP, Brazil, listed on B3 S.A. – Brasil, Bolsa, Balcão (“B3”), in the Novo Mercado listing segment under the ticker “UGPA3” and on the New York Stock Exchange (“NYSE”) in the form of level III American Depositary Receipts (“ADRs”) under the ticker “UGP”.
The Company engages in the investment of its own capital in services, commercial, and industrial activities, through the subscription or acquisition of shares of other companies. Through its subsidiaries, it operates in the segments of liquefied petroleum gas – LPG distribution (“Ultragaz”), fuel distribution and related businesses (“Ipiranga”), production and marketing of chemicals (“Oxiteno”), and storage services for liquid bulk (“Ultracargo”), retail distribution of pharmaceutical, hygiene, beauty, and skincare products (“Extrafarma”) and digital payments segment (“Abastece aí”). The information about segments are disclosed in Note 32.
a. Clarifications on the impacts of COVID-19
The World Health Organization (“WHO”) declared a coronavirus pandemic (COVID-19) on March 11, 2020. To contain a spread of the virus in Brazil, the Ministry of Health (“MH”) and the state and municipal governments announced several actions to reduce the agglomeration and movement of people, including the closing of commerce, parks and common areas. In this context, the Company created a Crisis Committee to keep up with it and monitor the main risks and adopt preventive and emergency measures to reduce the pandemic effects.
Since the beginning of the coronavirus pandemic, the Company and its subsidiaries acted in numerous initiatives to ensure the safety and security of its employees and the stability and continuity of its operations and partners, the financial solidity of the Company. All the activities of the companies controlled by the Company are classified as essential in the context of the measures adopted to face the pandemic.
The Company and its subsidiaries quickly adopted the work at home (expressed by home office) for the administrative public, with all the necessary support for the operational continuity. In addition to basic safety concerns with employees, companies implemented several initiatives aimed at welfare, such as virtual meetings, psychological support and concern for ergonomics, following the principle of valuing people.
The emergency measures and speed in answer to the first effects of the crisis, as well as initiatives to support the supply chain, were effective to keep the activities of the subsidiaries in operation, ensuring the delivery of essential services to the population and preserving the health and security of employees and partners.
Uncertainty remains uncertain to what extent the financial information, after June 30, 2021, may be affected by the commercial, operational and financial impacts of the pandemic, because it will depend on its duration and the impacts on economic activities, as well as government, business in response to the crisis. In this context, some financial risk assessments, projections and impairment tests, in connection with the preparation of these financial statements, may be impacted by the pandemic, and may adversely affect the financial position of the Company and its subsidiaries.
Ultrapar Participações S.A. and Subsidiaries
Notes to the Parent’s Separate and Consolidated Interim Financial Information
(In thousands of Brazilian Reais, unless otherwise stated)
Operational impacts
The implemented measures of social isolation, restrictions on the movement of people and the operation of certain businesses due to COVID-19 pandemic continued to impact economic activity in Brazil in this second quarter of 2021. With respect the operations of the Company and its subsidiaries, the main effects were felt by Ipiranga, due to the impact on the Otto Cycle volume as result of mobility restrictions, and at Extrafarma as reflection of the lower flow of people in the mall stores.
Main risks and associated measures
Credit risk - The actions taken by the Company and its subsidiaries throughout 2020 softened the impacts of the pandemic on Ipiranga’s clients' financial condition and, consequently, mitigated its potential effects on Ipiranga's default rates, that remained at the same levels as 2020. The effects of expected losses on doubtful accounts of quarter ended June 30, 2021 are disclosed in Notes 5 and 33.d.
Risk of realization of deferred tax assets - the Company and its subsidiaries realized technical feasibility study of the constitution and realization of deferred tax credits, considering the current projections approved by the Board of Directors for each business segment and did not identify the need for write-offs for the period ended on June 30, 2021.
Risks in financial instruments - the increase in volatility in financial markets may impact financial results according to sensitivity analyzes presented in Note 33.
Liquidity risk – The Company and its subsidiaries presented variations in their net debt position compatible with the results and the seasonality of their businesses.
The management of the Company and its subsidiaries continue maintaining discipline in control of costs and expenses to preserve cash in all business and selectivity in the allocation of capital without compromising sustainable business growth.
b. Clarifications on the cyber incident
According communication sent to the market on January 12, 2021 and January 25, 2021, the Company suffered on January 11, 2021 a cyber incident of type ransomware in its information technology environment.
As a precautionary measure, the Company interrupted its systems, affecting for a short period of time, the operations of its subsidiaries. Immediately, all security and control measures were adopted to remedy the situation and as of January 14, 2021 the operational systems of the Company and its subsidiaries began to be gradually restored, with caution and security, according with the priority and relevance of each affected process. Since January 25, 2021, as communicated to the market on that date, all the critical information systems of the Company and its subsidiaries are in full operation.
The Company has a specific insurance policy for cyber incidents (see Note 34.b), which has already been duly activated.
Ultrapar Participações S.A. and Subsidiaries
Notes to the Parent’s Separate and Consolidated Interim Financial Information
(In thousands of Brazilian Reais, unless otherwise stated)
2. Presentation of interim financial information and summary of significant accounting policies
The parent’s separate and consolidated interim financial information (“interim financial information”) were prepared in accordance with the International Accounting Standard (“IAS”) 34 – Interim Financial Reporting issued by the International Accounting Standards Board (“IASB”) and the in accordance with the pronouncement CPC 21 (R1) issued by the Accounting Pronouncements Committee (“CPC”) and approved by the Brazilian Securities and Exchange Commission (“CVM”).
All relevant specific information of the interim financial information, and only this information, were presented and correspond to that used by the Company’s and its subsidiaries’ Management.
The presentation currency of the Company’s interim financial information is the Brazilian Real, which is the Company’s functional currency.
The Company and its subsidiaries applied the accounting policies described below in a consistent manner for all years presented in these interim financial information.
a. Recognition of revenue
Revenue of sales and services rendered is measured at the value of the consideration that the Company's subsidiaries expect to be entitled to, net of sales returns, discounts, amortization of contractual assets with customers and other deductions, if applicable, being recognized as the entity fulfills its performance obligation and freight mode of delivery. At Ipiranga, the revenue from sales of fuels and lubricants is recognized when the products are delivered to gas stations and to large consumers. At Ultragaz, revenue from sales of LPG is recognized when the products are delivered to customers at home, to independent dealers and to industrial and commercial customers. At Extrafarma, the revenue from sales of pharmaceuticals is recognized when the products are delivered to end user customers in own drugstores and when the products are delivered to independent resellers. At Oxiteno, the revenue from sales of chemical products is recognized when the products are delivered to industrial customers. At Ultracargo, the revenue provided from storage services is recognized as services are performed. At Abastece aí, the revenue provided from storage services of digital payments is recognized as services are performed. The breakdowns of revenues from sales and services are shown in Notes 26 and 32.
Amortization of contractual assets with customers for the exclusive rights in Ipiranga’s reseller service stations and the bonuses paid in performance obligation sales are recognized in the income statement as a deduction of the revenue from sale according to the conditions established in the agreements which is reviewed as per the changes occurred in the agreements (see Notes 2.f and 11).
The am/pm franchising upfront fee is deferred and recognized in profit or loss as the entity fulfills each performance obligation throughout the terms of the agreements with the franchisees. For more information, see Note 23.a.
Deferred revenue from loyalty program is recognized in the income statement when the points are redeemed, on which occasion the costs incurred are also recognized in profit or loss. Deferred revenue of unredeemed points is also recognized in profit or loss when points expire. For more information, see Note 23.b.
Ultrapar Participações S.A. and Subsidiaries
Notes to the Parent’s Separate and Consolidated Interim Financial Information
(In thousands of Brazilian Reais, unless otherwise stated)
Costs of products sold and services provided include goods (mainly fuels, lubricants, LPG, and pharmaceutical products), raw materials (chemicals and petrochemicals) and production, distribution, storage, and fulfillment costs.
Exchange variations and the results of derivative finance instruments are presented in the statement of profit and loss on financial expenses.
Research and development expenses are recognized in the statements of profit or loss in general and administrative expenses and amounted to R$ 33,382 for the six-month period ended June 30, 2021 (R$ 28,773 for the six-month period ended June 30, 2020).
b. Cash and cash equivalents
Includes cash, banks deposits, and short-term up to 90 days of maturity, highly liquid investments that are readily convertible into a known amount of cash and are subject to an insignificant risk of change in value. For further information on cash and cash equivalents of the Company and its subsidiaries, see Note 4.a.
c. Financial assets
The Company and its subsidiaries evaluated the classification and measurement of financial assets based on its business model of financial assets as follows:
- Amortized cost: financial assets held in order to collect contractual cash flows, solely principal and interest. The interest earned and the foreign currency exchange variation are recognized in profit or loss and balances are stated at acquisition cost plus the interest earned, using the effective interest rate method. Financial investments in guarantee of loans are classified as amortized cost.
- Measured at fair value through other comprehensive income: financial assets that are acquired or originated for the purpose of collecting contractual cash flows or selling financial assets. The balances are stated at fair value, and the interest earned, and the foreign currency exchange variation are recognized in profit or loss. Differences between fair value and initial amount of financial investments plus the interest earned are recognized in equity in other comprehensive income in the “Valuation adjustments”. Accumulated gains and losses recognized in equity are reclassified to profit or loss at the time of their settlement. Substantially the financial investments in Bank Certificates of Deposit (“CDB”) and repurchase agreements are classified as measured at fair value through other comprehensive income.
- Measured at fair value through profit or loss: financial assets that were not classified as amortized cost or measured at fair value through other comprehensive income. The balances are stated at fair value and both the interest earned and the exchange variations and changes in fair value are recognized in the income statement. Investment funds and derivatives are classified as measured at fair value through profit or loss.
Ultrapar Participações S.A. and Subsidiaries
Notes to the Parent’s Separate and Consolidated Interim Financial Information
(In thousands of Brazilian Reais, unless otherwise stated)
The Company and its subsidiaries use financial instruments for hedging purposes, applying the concepts described below:
- Hedge accounting – fair value hedge: financial instruments used to hedge exposure to changes in the fair value of an item, attributable to a particular risk, which can affect the entity’s statements of profit or loss. In the initial designation of the fair value hedge, the relationship between the hedging instrument and the hedged item is documented, including the objectives of risk management, the strategy in conducting the transaction, and the methods to be used to evaluate its effectiveness. Once the fair value hedge has been qualified as effective, the hedge item is also measured at fair value. Gains and losses from hedge instruments and hedge items are recognized the statements of profit or loss. The hedge accounting must be discontinued when the hedge becomes ineffective.
- Hedge accounting – cash flow hedge: financial instruments used to hedge the exposure to variability in cash flows that is attributable to a risk associated with an asset or liability or highly probable transaction or firm commitment that may affect the statements of profit or loss. The portion of the gain or loss on the hedging instrument that is determined to be effective relating to the effects of exchange rate effect, is recognized directly in equity in accumulated other comprehensive income as “Valuation adjustments” while the ineffective portion is recognized in the statements of profit or loss. Gains or losses on the hedging instrument relating to the effective portion of this hedge that had been recognized directly in accumulated other comprehensive income shall be recognized in profit or loss in the period in which the hedged item is recognized in profit or loss or as initial cost of non-financial assets, in the same line of the statement that the hedged item is recognized. The hedge accounting shall be discontinued when (i) the hedging relationship is canceled; (ii) the hedging instrument expires; and (iii) the hedging instrument no longer qualifies for hedge accounting. When hedge accounting is discontinued, gains and losses recognized in equity in other comprehensive income are reclassified to the statements of profit or loss in the period which the hedged item is recognized in profit or loss. If the transaction hedged is canceled or is not expected to occur, the cumulative gains and losses in equity in other comprehensive income shall be recognized immediately in profit or loss.
- Hedge accounting – hedge of net investments in foreign operation: financial instruments used to hedge exposure on net investments in foreign subsidiaries due to the fact that the local functional currency is different from the functional currency of the Company. The portion of the gain or loss on the hedging instrument that is determined to be effective, referring to the exchange rate effect, is recognized directly in equity in accumulated other comprehensive income as cumulative translation adjustments, while the ineffective portion and the operating costs are recognized the statements of profit or loss. The gain or loss on the hedging instrument that has been recognized directly in accumulated other comprehensive income shall be recognized in the statements of profit or loss when the disposal of the foreign subsidiary occurs.
For further information on financial instruments, see Note 33.
Ultrapar Participações S.A. and Subsidiaries
Notes to the Parent’s Separate and Consolidated Interim Financial Information
(In thousands of Brazilian Reais, unless otherwise stated)
d. Trade receivables and reseller financing
Trade receivables are recognized at the amount invoiced to the counterparty that the Company subsidiaries are entitled (see Notes 5.a and 33.d.3). The expected losses on doubtful accounts consider the expected losses for the next 12 months take into account the deterioration or improvement of the customers’ credit quality, considering the customers’ characteristics in each business segment. The amount of the expected credit losses is deemed by management to be sufficient to cover any loss on realization of trade receivables.
Reseller financing is provided at subsidized rate for renovation and upgrading of service stations, purchase of products and development of the automotive fuels and lubricants distribution market (see Notes 5.b and 33.d.3). The terms of reseller financing range between 12 and 60 months, with an average term of 40 months. The minimum and maximum subsisted interest rates are 0% per month and 1% per month respectively. These financing are remeasured at a market rate for working capital loans and the remeasurement adjustment between the market rate and the rate subsidized is recognized as a reduction to the reseller’s revenue at the beginning of the contract. Throughout the contract, the interest appropriated by the market rate is recognized to the financial result.
e. Inventories
Inventories are stated at the lower of acquisition cost or net realizable value (see Note 6). The cost value of inventory is measured using the weighted average cost and includes the costs of acquisition and processing directly and indirectly related to the units produced based on the normal capacity of production. Estimates of net realizable value are based on the average selling prices at the end of the reporting period, net of applicable direct selling expenses. Subsequent events related to the fluctuation of prices and costs are also considered, if relevant. If net realizable values are below inventory costs, a provision corresponding to this difference is recognized. Provisions are also made for obsolescence of products, materials, or supplies that (i) do not meet its subsidiaries’ specifications, (ii) have exceeded their expiration date, or (iii) are considered slow-moving inventory. This classification is made by management with the support of its industrial and operations teams.
f. Contractual assets with customers – exclusive rights
Exclusive rights disbursements as provided in Ipiranga’s agreements with reseller service stations and major consumers are recognized as contractual assets when paid and amortized according to the conditions established in the agreements (see Note 2.a and 11).
Ultrapar Participações S.A. and Subsidiaries
Notes to the Parent’s Separate and Consolidated Interim Financial Information
(In thousands of Brazilian Reais, unless otherwise stated)
g. Investments
Investments in subsidiaries are accounted for under the equity method of accounting in the interim financial information of the parent’s separate company (see Notes 3.b and 12.a). A subsidiary is an investee in which the investor is entitled to variable returns on investment and has the ability to interfere in its financial and operational activities. Usually the equity interest in a subsidiary is more than 50%.
Investments in associates and joint ventures are accounted for under the equity method of accounting in the interim financial information (see Note 12 items b and c). An associate is an investment, in which an investor has significant influence, that is, has the power to participate in the financial and operating decisions of the investee but does not exercise control. A joint venture is an investment in which the shareholders have the right to net assets on behalf of a joint control. Joint control is the agreement, which establish that decisions about the relevant activities of the investee require the consent from the parties that share control.
Other investments are stated at acquisition cost less provision for losses, unless the loss is considered temporary.
h. Right-of-use assets and leases payable
The Company and its subsidiaries recognized in the financial position, a right-of-use assets and the respective lease liabilities initially measured at the present value of future lease payments, considering the related contract costs (see Note 13). The amortization expenses of right-of-use assets is recognized in statement of profit or loss over the lease contract term. When the right-of-use asset is used in the construction of the property, plant, and equipment (“PP&E”), its amortization is capitalized until the asset under construction is completed. The liability is increased for interest and decreased by lease payments made. The interests are recognized in the statement of profit or loss using the effective interest rate method. The remeasurement of assets and liabilities based on the contractual index is recognized in the financial position, not having an effect in the result. In case of cancellation of the contract, the assets and respective liabilities are written off to the result, considering, if it is the case, any penalties provided in contractual clauses. The Company and its subsidiaries have no intention in purchasing the underlying asset. The Company and its subsidiaries periodically review the existence of an indication that the right-of-use assets may be impaired (see Note 2.u).
Right-of-use assets include amounts related to area port leases grants (see Note 34.c).
The Company and its subsidiaries apply the recognition exemptions to short-term leases of 12 months or less and lease contracts of low amount assets. In these cases, the recognition of the lease expense in the statements of profit or loss is on a straight-line basis.
Ultrapar Participações S.A. and Subsidiaries
Notes to the Parent’s Separate and Consolidated Interim Financial Information
(In thousands of Brazilian Reais, unless otherwise stated)
i. Property, plant, and equipment
PP&E is recognized at acquisition or construction cost, including capitalization of right-of-use assets amortization and financial charges incurred on PP&E under construction, as well as qualifying maintenance costs resulting from scheduled plant outages and estimated costs to remove, to decommission, or to restore assets (see Notes 2.n and 21), less accumulated depreciation and, when applicable, less provision for losses (see Note 14).
Depreciation is calculated using the straight-line method, over the periods mentioned in Note 14, taking into account the estimated useful lives of the assets, which are reviewed annually.
Leases hold improvements are depreciated over the shorter of the lease contract term and useful life of the property.
j. Intangible assets
Intangible assets include assets acquired by the Company and its subsidiaries from third parties, and are recognized according to the criteria below:
- Goodwill is shown as intangible assets corresponding to the positive difference between the amount paid or payable to the seller and the fair value of the identifiable assets and liabilities assumed of the acquired entity. Goodwill is tested annually for impairment. Goodwill is allocated to the business segments, which represent the lowest level that goodwill is monitored for impairment testing purposes (see Note 15.a).
- Other intangible assets acquired from third parties, such as softwares, technology, and commercial property rights, are measured at the total acquisition cost and amortized using straight-line method, over the periods mentioned in Note 15, taking into account their useful lives, which are reviewed annually.
- The decarbonization credits (“CBIOS”) acquired are recorded at historical cost in intangible assets, retired in the year to fulfillment the individual target set by the National Agency of Petroleum, Natural Gas and Biofuels (“ANP”) and are not amortized. These assets are used to settle of the annual decarbonization obligation adopted by Brazilian National Biofuels Policy – (“RenovaBio”), implemented by Law No. 13,576/2017, with additional regulations established by Decree No. 9,888/2019 and Ordinance No. 419 of November 20, 2019 issued by the Brazilian Ministry of Mines and Energy.
The Company and its subsidiaries have not recognized intangible assets that were generated internally. The Company and its subsidiaries have goodwill and brands acquired in business combinations, which are evaluated as intangible assets with indefinite useful life (see Note 15 items a and e).
k. Other assets
Other assets are stated at the lower of cost and realizable value, including, if applicable, interest earned, monetary changes and changes in exchange rates incurred, less the provisions for losses and, if applicable, adjusted to present value.
Ultrapar Participações S.A. and Subsidiaries
Notes to the Parent’s Separate and Consolidated Interim Financial Information
(In thousands of Brazilian Reais, unless otherwise stated)
l. Financial liabilities
The financial liabilities include trade payables, other payables, financing, loans, debentures, leases payable and derivative financial instruments. Financial liabilities are classified as “financial liabilities at fair value through profit or loss” or “financial liabilities at amortized cost”. The financial liabilities at fair value through profit or loss refer to derivative financial instruments, subscription warrants - indemnification, and financial liabilities designated as hedged items in a fair value hedge relationship upon initial recognition (see Note 2.c – Fair Value Hedge). The financial liabilities at amortized cost are stated at the initial transaction amount plus related charges and net of amortization and transaction costs. The charges are recognized in the statement of profit or loss using the effective interest rate method.
Transaction costs incurred and directly attributable to the activities necessary for contracting loans or for issuing bonds, as well as premiums and discounts upon issuance of debentures and other debt, are allocated to the instrument and amortized in the statement of profit or loss taking into its term, using the effective interest rate method (see Note 16.h).
m. Income and social contribution taxes on income
Current and deferred income tax (“IRPJ”) and social contribution on net income tax (“CSLL”) are calculated based on their current rates. For the calculation of current IRPJ, the value of tax incentives is also considered. At the end of the fiscal year the portion of the profit corresponding to these investment grants is allocated to the constitution of a tax incentive reserve in subsidiaries shareholders' equity, and is excluded from the dividend calculation base and subsequently capitalized. Taxes are recognized based on the rates of IRPJ and CSLL provided for by the laws enacted on the last day of the interim financial information. The current rates in Brazil are 25% for IRPJ and 9% for CSLL. For further information about recognition and realization of IRPJ and CSLL see Note 9.
For purposes of disclosure deferred tax assets were offset against the deferred tax liability IRPJ and CSLL, in the same taxable entity and the same tax authority.
n. Provision for asset retirement obligation – fuel tanks
The subsidiary Ipiranga has the legal obligation to remove the underground fuel tanks located at Ipiranga-branded service stations after a certain period. The estimated cost of the obligation to remove these fuel tanks is recognized as a liability when the tanks are installed. The estimated cost is recognized in PP&E and depreciated over the respective useful lives of the asset. The amounts recognized as a liability accrue inflation effect using the Amplified Consumer Price Index (“IPCA”) until the tank is removed (see Note 21). The estimated removal cost is reviewed and updated annually or when there is significant change in its amount and change in the estimated costs are recognized in statements of profit or loss when they become known.
o. Provisions for tax, civil, and labor risks
A provision for tax, civil and labor risks is recognized for quantifiable risks, when the chance of loss is more-likely-than-not in the opinion of management and internal and external legal counsel, and the amounts are recognized based on the evaluation of the outcomes of the legal proceedings (see Note 22).
Ultrapar Participações S.A. and Subsidiaries
Notes to the Parent’s Separate and Consolidated Interim Financial Information
(In thousands of Brazilian Reais, unless otherwise stated)
p. Post-employment benefits
Post-employment benefits granted and to be granted to employees, retirees, and pensioners are based on an actuarial calculation prepared by an independent actuary and reviewed by management, using the projected unit credit method (see Note 20.b). The actuarial gains and losses are recognized in equity in cumulative other comprehensive income in the “Valuation adjustments”.
q. Other liabilities
Other liabilities are stated at known or measurable amounts and changes in exchange rates incurred. When applicable, other liabilities are recognized at present value, based on interest rates that reflect the term, currency, and risk of each transaction.
r. Foreign currency transactions
Foreign currency transactions carried out by the Company or its subsidiaries are remeasured into their functional currency at the exchange rate prevailing at the date of each transaction. Outstanding monetary assets and liabilities of the Company and its subsidiaries are translated using the exchange rate at the date of the interim financial information. The effect of the difference between those exchange rates is recognized in financial results until the conclusion of each transaction.
s. Basis for translation of interim financial information of foreign subsidiaries
s.1 Subsidiaries with administrative autonomy
Assets and liabilities of the foreign subsidiaries denominated in currencies other than Brazilian Real which have administrative autonomy are translated using the exchange rate at the date of the interim financial information. Revenues and expenses are translated using the average exchange rate of each year and equity is translated at the historical exchange rate of each transaction affecting equity. Gains and losses resulting from changes in these foreign investments are directly recognized in equity in the “cumulative translation adjustments” and will be recognized in profit or loss if and when these investments are disposed of. The balance in cumulative translation adjustments on June 30, 2021 was a gain of R$ 194,157 (gain of R$ 231,596 on December 31, 2020), see Note 25.g.2.
The foreign subsidiaries with functional currency different from the Company and which have administrative autonomy are listed below:
Subsidiary | Functional currency | Location |
Oxiteno México S.A. de C.V. | Mexican Peso | Mexico |
Oxiteno Servicios Corporativos S.A. de C.V. | Mexican Peso | Mexico |
Oxiteno Servicios Industriales S.A. de C.V. | Mexican Peso | Mexico |
Oxiteno USA LLC | U.S. Dollar | United States |
Oxiteno Uruguay S.A. (i) | U.S. Dollar | Uruguay |
(i) The subsidiary Oxiteno Uruguay S.A. (“Oxiteno Uruguay”) determined its functional currency as the U.S. dollar (“US$”), as its inventory sales, purchases of raw material inputs, and financing activities are performed substantially in this currency.
Ultrapar Participações S.A. and Subsidiaries
Notes to the Parent’s Separate and Consolidated Interim Financial Information
(In thousands of Brazilian Reais, unless otherwise stated)
s.2 Subsidiaries without self-administrative autonomy
Assets and liabilities of the other foreign subsidiaries, which do not have administrative autonomy, are considered an extension of the activities of their parent company and are translated using the exchange rate at the date of the financial statements. Gains and losses resulting from changes in these foreign investments are directly recognized as financial result. The loss recognized in income for the six-month period ended June 30, 2021 amounted to R$ 1,888 (gain of R$ 35,211 for the six-month period ended June 30, 2020).
t. Use of estimates, assumptions and judgments
The preparation of the interim financial information requires the use of estimates, assumptions, and judgments for the accounting and disclosure of certain assets, liabilities, and profit or loss. Therefore, the Company and subsidiaries’ management use the best information available at the date of preparation of the interim financial information, as well as the experience of past and current events, also considering assumptions regarding future events. The estimates and assumptions are reviewed periodically.
t.1 Judgments
Information on the judgments is included: in the determination of control in subsidiaries (Notes 2.g, 2.s.1, 3 and 12.a), the determination of joint control in joint venture (Notes 2.g, 12.a and 12.b) and the determination of significant influence in associates (Notes 2.g and 12.c).
t.2 Uncertainties related to the assumptions and estimates
The information regarding uncertainties related to the assumptions and estimates are included: in determining the fair value of financial instruments (Notes 2.c, 2.l, 4, 16 and 33), the determination of the expected losses on doubtful accounts (Notes 2.d, 5 and 33.d.3), the determination of provisions for losses of inventories (Notes 2.e and 6), the estimative of realization of deferred IRPJ and CSLL amounts (Notes 2.m and 9.a), the useful lives and discount rate of right-of-use assets (Notes 2.h and 13), the useful lives of PP&E (Notes 2.i and 14), the useful lives of intangible assets, and the determination of the recoverable amount of goodwill (Notes 2.j and 15.a), provisions for assets retirement obligations (Notes 2.n and 21), provisions for tax, civil, and labor risks (Notes 2.o and 22), estimates for the preparation of actuarial reports (Notes 2.p and 20.b) and the determination of fair value of subscription warrants – indemnification (Notes 24 and 33.j). The actual result of the transactions and information may differ from their estimates.
Ultrapar Participações S.A. and Subsidiaries
Notes to the Parent’s Separate and Consolidated Interim Financial Information
(In thousands of Brazilian Reais, unless otherwise stated)
u. Impairment of assets
The Company and its subsidiaries review in every reporting period the existence of any indication that an asset may be impaired. To intangible assets with indefinite useful life the review is done annually. If there is an indication of impairment the Company and its subsidiaries estimate the recoverable amount of the asset. Assets that cannot be evaluated individually are grouped in the smallest group of assets that generate cash inflow from continuous use and that are largely independent of cash flows of other assets (cash generating units “CGU”). The recoverable amount of assets or CGUs corresponds to the greater of their fair value net of applicable direct selling costs and their value in use.
The fair value less costs to sell is determined by the price that would be received to sell an asset in an orderly transaction between market participants at the measurement date, net of costs of removing the asset, and direct incremental costs to bring an asset into condition for its sale, legal costs, and taxes.
To assess the value in use, the projections of future cash flows, trends, and outlooks, as well as the effects of obsolescence, demand, competition, and other economic factors were considered. Such cash flows are discounted to their present values using the discount rate before tax that reflects market conditions for the period of impairment testing and the specific risks of the asset or CGU being evaluated. In cases where the expected discounted future cash flows are less than their carrying amount, an impairment loss is recognized for the amount by which the carrying value exceeds the fair value of these assets. Losses for impairment of assets are recognized in profit or loss. In case goodwill has been allocated to a CGU, the recognized losses are first allocated to reduce the corresponding goodwill. If the goodwill is not enough to absorb such losses, the surplus is allocated to the assets on a pro-rata basis. An impairment of goodwill cannot be reversed. For other assets, impairment losses may be reversed only to the extent that the asset's carrying amount does not exceed the carrying amount that would have been determined, net of depreciation or amortization, if the impairment had not been recognized.
On June 30, 2021, the Company recognized impairment of assets for the subsidiary Imifarma Produtos Farmacêuticos e Cosméticos S.A. (“Extrafarma”) in the amount of R$ 394,675 and deferred income and social contribution taxes effects of R$ 86,007, resulting in a net loss of R$ 308,668 (see Note 3.c.1).
v. Business combination
A business combination is accounted applying the acquisition method. The cost of the acquisition is measured based on the consideration transferred and to be transferred, measured at fair value at the acquisition date. In a business combination, the assets acquired, and liabilities assumed are measured in order to classify and allocate them accordingly to the contractual terms, economic circumstances and relevant conditions on the acquisition date. The non-controlling interest in the acquired company is measured based on its interest in net assets identified in the acquired company. Goodwill is measured as the excess of the consideration transferred and to be transferred over the fair value of net assets acquired (identifiable assets and liabilities assumed, net). After the initial recognition, goodwill is measured at cost less any accumulated impairment losses. For impairment testing purposes, goodwill is allocated to the Company’s operating segments. When the cost of the acquisition is lower than the fair value of net assets acquired, a gain is recognized directly in the statement of profit or loss. Costs related to the acquisitions are recorded in the statement of profit or loss when incurred. For the three-month period ended on June 30, 2021 there are not business combination.
Ultrapar Participações S.A. and Subsidiaries
Notes to the Parent’s Separate and Consolidated Interim Financial Information
(In thousands of Brazilian Reais, unless otherwise stated)
w. Statements of value added
The statements of value added (“DVA”) are presented as an integral part of the interim financial information as applicable to publicly traded companies in Brazil, according to Law 11,638/07 and as supplemental information for the International Financial Reporting Standards (“IFRS”), which does not require the presentation of DVA.
x. Statements of cash flows indirect method
The Company and its subsidiaries present the interest paid on loans, financing, debentures, and leases payable in financing activities and present financial investments, net of redemptions, in the investing activities.
y. Adoption of the pronouncements issued by CPC and IASB
There are not standards, amendments and interpretations to IFRS issued by the IASB which are effective and could have impact in these interim financial information to June 30, 2021 that have not been adopted by the Company.
Some of the Company's subsidiaries have debts and derivative instruments indexed to LIBOR (see Notes 16.c.1, 16.d and 33.g). In order to be prepared for the transition of the IBORs the Company is monitoring the pronouncements of the authorities, as well as the measures that have been adopted, aiming at the adaptation of the various financial instruments to the new benchmarks. Currently there are no impacts of the change in LIBOR on the Company's operations.
z. Authorization for issuance of the financial statements
These interim financial information were authorized for issuance by the Board of Directors on August 11, 2021.
3. Principles of consolidation and investments in subsidiaries
a. Principles of consolidation
In the preparation of the consolidated interim financial information the investments of one company in another, balances of asset and liability accounts, revenues transactions, costs and expenses were eliminated, as well as the effects of transactions conducted between the companies. Non-controlling interests in subsidiaries are presented within consolidated equity and net income.
Consolidation of a subsidiary begins when the parent company obtains direct or indirect control over a company and ceases when the parent company loses control of a company. Income and expenses of a subsidiary acquired are included in the consolidated statement of profit or loss and comprehensive income from the date the parent company gains the control. Income and expenses of a subsidiary, in which the parent company loses control, are included in the consolidated statement of profit or loss and comprehensive income until the date the parent company loses control.
When necessary adjustments are made to the interim financial information of subsidiaries to bring their accounting policies into line with the Company’s accounting policies.
Ultrapar Participações S.A. and Subsidiaries
Notes to the Parent’s Separate and Consolidated Interim Financial Information
(In thousands of Brazilian Reais, unless otherwise stated)
b. Investments in subsidiaries
The consolidated financial statements include the following direct and indirect subsidiaries:
|
|
|
| % interest in the share | ||||||
|
|
|
| 06/30/2021 |
| 12/31/2020 | ||||
|
|
|
| Control |
| Control | ||||
| Location | Segment |
| Direct |
| Indirect |
| Direct |
| Indirect |
Ipiranga Produtos de Petróleo S.A. | Brazil | Ipiranga |
| 100 |
| - |
| 100 |
| - |
am/pm Comestíveis Ltda. | Brazil | Ipiranga |
| - |
| 100 |
| - |
| 100 |
Icorban – Correspondente Bancário Ltda. | Brazil | Ipiranga |
| - |
| 100 |
| - |
| 100 |
Ipiranga Trading Limited | British Virgin Islands | Ipiranga |
| - |
| 100 |
| - |
| 100 |
Tropical Transportes Ipiranga Ltda. | Brazil | Ipiranga |
| - |
| 100 |
| - |
| 100 |
Ipiranga Imobiliária Ltda. | Brazil | Ipiranga |
| - |
| 100 |
| - |
| 100 |
Ipiranga Logística Ltda. | Brazil | Ipiranga |
| - |
| 100 |
| - |
| 100 |
Oil Trading Importadora e Exportadora Ltda. | Brazil | Ipiranga |
| - |
| 100 |
| - |
| 100 |
Iconic Lubrificantes S.A. | Brazil | Ipiranga |
| - |
| 56 |
| - |
| 56 |
Integra Frotas Ltda. | Brazil | Ipiranga |
| - |
| 100 |
| - |
| 100 |
Companhia Ultragaz S.A. | Brazil | Ultragaz |
| - |
| 99 |
| - |
| 99 |
Ultragaz Comercial Ltda. | Brazil | Ultragaz |
| - |
| 100 |
| - |
| 100 |
Nova Paraná Distribuidora de Gás Ltda. (1) | Brazil | Ultragaz |
| - |
| 100 |
| - |
| 100 |
Utingás Armazenadora S.A. (2) | Brazil | Ultragaz |
| - |
| 57 |
| - |
| 57 |
Bahiana Distribuidora de Gás Ltda. | Brazil | Ultragaz |
| - |
| 100 |
| - |
| 100 |
LPG International Inc. | Cayman Islands | Ultragaz |
| - |
| 100 |
| - |
| 100 |
Imaven Imóveis Ltda. | Brazil | Others |
| - |
| 100 |
| - |
| 100 |
Imifarma Produtos Farmacêuticos e Cosméticos S.A. (3) | Brazil | Extrafarma |
| - |
| 100 |
| - |
| 100 |
UVC Investimentos Ltda. (4) | Brazil | Others | - |
| 99 |
| - |
| 99 | |
Centro de Conveniências Millennium Ltda. and subsidiaries (5) | Brazil | Ipiranga |
| 100 |
| - |
| 100 |
| - |
Oxiteno S.A. Indústria e Comércio | Brazil | Oxiteno |
| 100 |
| - |
| 100 |
| - |
Oxiteno Argentina Sociedad de Responsabilidad Ltda. | Argentina | Oxiteno |
| - |
| 100 |
| - |
| 100 |
Oleoquímica Indústria e Comércio de Produtos Químicos Ltda. | Brazil | Oxiteno |
| - |
| 100 |
| - |
| 100 |
Oxiteno Uruguay S.A. | Uruguay | Oxiteno |
| - |
| 100 |
| - |
| 100 |
Oxiteno México S.A. de C.V. | Mexico | Oxiteno |
| - |
| 100 |
| - |
| 100 |
Oxiteno Servicios Corporativos S.A. de C.V. | Mexico | Oxiteno |
| - |
| 100 |
| - |
| 100 |
Oxiteno Servicios Industriales S.A. de C.V. | Mexico | Oxiteno |
| - |
| 100 |
| - |
| 100 |
Oxiteno USA LLC | United States | Oxiteno |
| - |
| 100 |
| - |
| 100 |
Global Petroleum Products Trading Corp. | Virgin Islands | Oxiteno |
| - |
| 100 |
| - |
| 100 |
Oxiteno Europe SPRL | Belgium | Oxiteno |
| - |
| 100 |
| - |
| 100 |
Oxiteno Colombia S.A.S. | Colombia | Oxiteno |
| - |
| 100 |
| - |
| 100 |
Oxiteno Shanghai LTD. | China | Oxiteno |
| - |
| 100 |
| - |
| 100 |
Empresa Carioca de Produtos Químicos S.A. | Brazil | Oxiteno |
| - |
| 100 |
| - |
| 100 |
Ultracargo – Operações Logísticas e Participações Ltda. | Brazil | Ultracargo |
| 100 |
| - |
| 100 |
| - |
Ultracargo Logística S.A. (6) | Brazil | Ultracargo |
| - |
| 99 |
| - |
| 99 |
TEAS – Terminal Exportador de Álcool de Santos Ltda. | Brazil | Ultracargo |
| - |
| 100 |
| - |
| 100 |
Tequimar Vila do Conde Logística Portuária S.A. | Brazil | Ultracargo |
| - |
| 100 |
| - |
| 100 |
Ultrapar International S.A. | Luxembourg | Others |
| 100 |
| - |
| 100 |
| - |
SERMA – Ass. dos usuários equip. proc. de dados | Brazil | Others |
| - |
| 100 |
| - |
| 100 |
UVC – Fundo de investimento em participações multiestratégia investimento no exterior (7) | Brazil | Others |
| 100 |
| - |
| 100 |
| - |
Eaí Clube Automobilista S.A. (8) | Brazil | Abastece aí |
| 100 |
| - |
| 100 |
| - |
The percentages in the table above are rounded.
| (1) | Non operating company in closing phase. | |
| (2) | In October 2020 there was a change in the share capital of the company Utingás, which became controlled by Companhia Ultragaz S.A. (“Cia Ultragaz”). | |
| (3) | On May 18, 2021 the Company announced the signing of an agreement for the sale of all shares of Extrafarma to Empreendimentos Pague Menos S.A. (“Pague Menos”). For further details, see note 3.c.1. | |
| (4) | Subsidiary created in January 2020 to provide valuation, business management and financial advisory services to UVC - Fundo de investimento em participações multiestratégia investimento no exterior (“UVC – Fundo de investimento”). In September 2020 the company’s name was changed to UVC Investimentos Ltda (“UVC Investimentos”). | |
| (5) | In May 2020 there was a change in the participation of the capital of the subsidiary Millennium which became a direct subsidiary of the Company. | |
| (6) | In April 2021 the name of subsidiary Terminal Químico de Aratu S.A – Tequimar was changed to Ultracargo Logística S.A. (“Ultracargo Logística”). | |
| (7) | Fund constituted on January 2020, the UVC has the purpose to invest in promising companies that can leverage or complement the Company's business, besides to supporting the mapping and sharing of startups and new technologies. |
Ultrapar Participações S.A. and Subsidiaries
Notes to the Parent’s Separate and Consolidated Interim Financial Information
(In thousands of Brazilian Reais, unless otherwise stated)
(8) Subsidiary created in July 2020, focused on digital payments and electronic retail, uniting the “abastece aí” app and the “Km de Vantagens” program.
c. Corporate reorganizations
Consistent with the disclosure it has been providing to its shareholders and to the capital markets, the Company is in the process of reviewing its portfolio pursuing greater complementarity and synergies among its businesses, with investments focused on existing opportunities in the downstream oil and gas chain in Brazil, in which the Company has strong operational scale and structural competitive advantages, allowing greater efficiency and potential for value generation. The management focus and the reduction of the financial leverage are additional benefits of this transaction for the Company. In the context, the Company announced the signatures of contracts described below:
c.1 Extrafarma share sale and purchase agreement and other agreements
On May 18, 2021 the Company announced the signing of a share purchase agreement for the sale of all shares of Extrafarma to Pague Menos. The total sale price (EV – enterprise value) is R$ 700 million, subject to adjustments due mainly to changes in working capital and Extrafarma's net debt position on the closing date of the transaction.
The payment of the transaction will be in three installments: 50% on the closing date and 25% on each the first and the second anniversary of the closing date. A guarantee will be provided by a shareholder of the Pague Menos for the last two installments. The completion of this transaction is subject to usual conditions precedent in such deals, including approval by the Brazilian antitrust authority and by the general shareholders’ meeting of Pague Menos, pursuant to the terms of article 256 of the Brazilian Corporate Law, to be called by the purchasing company in due course, and as already ratified by its controlling shareholder. Furthermore, preemptive rights was granted to Company's shareholders who wished to acquire Extrafarma's shares, proportionally to their respective participation in the Company's share capital and for the same price per share to be paid by Pague Menos, pursuant to article 253 of the Brazilian Corporate Law. The shareholders of the Company that exercised such right will become direct shareholders of Extrafarma after closing of the transaction. The company realized a general shareholders' meeting on June 25, 2021 in which was formalized the offering of the aforementioned preemptive rights, detailing the procedures for its exercise, as applicable. The exercise period ended on July 29, 2021 and the total exercised was less than 1% of the Company's capital.
Extrafarma and Pague Menos will maintain their regular course of business, on an independent manner, until the closing date of the transaction. The transaction will be highly probable, for purposes of classification as "assets and liabilities held for sale", after the approvals by the Brazilian competition authorities, at which time uncertainties will be eliminated for the corporate reorganization and separation of assets and liabilities that will be sold.
Ultrapar Participações S.A. and Subsidiaries
Notes to the Parent’s Separate and Consolidated Interim Financial Information
(In thousands of Brazilian Reais, unless otherwise stated)
On June 30, 2021, the Company realized the impairment test of assets taking into account the amount of transaction and recognized a reduction in the amount of the subsidiary's assets in the amount of R$ 308,668, net of the effects of deferred income and social contribution taxes, as allocated below:
| Note |
| Amount |
Goodwill | 15 |
| 68,273 |
Intangibles assets arising from business combination | 15 |
| 77,004 |
Property, plant, and equipment | 14 |
| 66,913 |
Right-of-use assets | 13 |
| 24,212 |
Taxes to recover | 7.a.1 |
| 158,273 |
Impairment |
|
| 394,675 |
Deferred income and social contribution taxes | 9.a, b and d |
| (86,007) |
Net reduction |
|
| 308,668 |
c.2 ConectCar share sale and purchase agreement
On June 25, 2021 the Company announced the signing of an agreement for the sale of its equity interest in ConectCar Soluções de Mobilidade Eletrônica S.A. (“ConectCar”), through its subsidiary Ipiranga Produtos de Petróleo S.A. (“IPP”), to Porto Seguro S.A., through its subsidiary Portoseg S.A. – Crédito, Financiamento e Investimento.
ConectCar was created in 2012 and operates in the electronic toll and parking payment segment. It is currently controlled by IPP and Redecard S.A. (that belongs to Itaú Unibanco Holding S.A.), both with equal share of 50% in ConectCar’s capital. In addition to contributing to a more complementary and synergistic business portfolio, with additional benefits of greater management focus and Company profitability, the sale of ConectCar also contributes to the concentration of efforts and investments in Abastece Aí, that combines the abastece aí app and the Km de Vantagens loyalty program in a payment and digital relationship platform focused on the driver's ecosystem, fully controlled by the Company.
The sale price of subsidiary IPP’s 50% stake is R$ 165 million, subject to adjustments due mainly to changes in ConectCar’s working capital and net debt position on the closing date of the transaction. The completion of this transaction is subject to usual conditions precedent in such deals, including approval by the Brazilian antitrust and other regulatory authorities. The payment will be made in a single installment on the closing date of the transaction after the main conditions precedent have been met.
ConectCar and Porto Seguro will maintain the normal course of their business independently until the closing of the transaction. The transaction will be highly probable, for purposes of classification as “assets and liabilities held for sale”, after the unrestricted approvals by the Brazilian competition and regulatory authorities, at which time the uncertainties regarding the sale are eliminated. On July 29, 2021, the unrestricted approval by the Administrative Council for Economic Defense ("CADE") was published, pending unrestricted approval by the Central Bank of Brazil ("BACEN").
ConectCar's interim financial information are presented in Note 12.b.
Ultrapar Participações S.A. and Subsidiaries
Notes to the Parent’s Separate and Consolidated Interim Financial Information
(In thousands of Brazilian Reais, unless otherwise stated)
4. Cash and cash equivalents, financial investments and hedge derivative financial instruments
Cash equivalents and financial investments, excluding cash and bank deposits, are substantially represented by investments: (i) in Brazil, in certificates of deposit of financial institutions linked to interest rate of the Interbank Deposits Interest Rate (“DI”), in repurchase agreement, financial bills, and in short term investments funds, whose portfolio comprised of Brazilian Federal Government bonds and in certificates of deposit of financial institutions; (ii) outside Brazil, in certificates of deposit of financial institutions and in short term investments funds, whose portfolio comprised of Federal Government bonds; and (iii) in currency and interest rate hedging instruments.
The financial assets were classified in Note 33.j, based on business model of financial assets of the Company and its subsidiaries.
Cash, cash equivalents and financial investments (consolidated) amounted to R$ 6,978,740 as of June 30, 2021 (R$ 8,672,160 as of December 31, 2020) are as follows:
a. Cash and cash equivalents
Cash and cash equivalents of the Company and its subsidiaries are presented as follows:
| Parent |
| Consolidated | ||||
| 06/30/2021 |
| 12/31/2020 |
| 06/30/2021 |
| 12/31/2020 |
Cash and bank deposits |
|
|
|
|
|
|
|
In local currency | 3,705 |
| 9,419 |
| 464,992 |
| 285,306 |
In foreign currency | - |
| - |
| 97,578 |
| 119,775 |
Financial investments considered cash equivalents |
|
|
|
|
|
|
|
In local currency |
|
|
|
|
|
|
|
Fixed-income securities | - |
| 939,230 |
| 2,273,358 |
| 2,241,852 |
In foreign currency |
|
|
|
|
|
|
|
Fixed-income securities | - |
| - |
| 24,359 |
| 14,561 |
Total cash and cash equivalents | 3,705 |
| 948,649 |
| 2,860,287 |
| 2,661,494 |
Ultrapar Participações S.A. and Subsidiaries
Notes to the Parent’s Separate and Consolidated Interim Financial Information
(In thousands of Brazilian Reais, unless otherwise stated)
b. Financial investments and currency and interest rate hedging instruments
The financial investments which are not classified as cash and cash equivalents are presented as follows:
| Parent |
| Consolidated | ||||
| 06/30/2021 |
| 12/31/2020 |
| 06/30/2021 |
| 12/31/2020 |
Financial investments |
|
|
|
|
|
|
|
In local currency |
|
|
|
|
|
|
|
Fixed-income securities and funds | 214,302 |
| 88,100 |
| 1,793,838 |
| 3,749,852 |
In foreign currency |
|
|
|
|
|
|
|
Fixed-income securities and funds | - |
| - |
| 1,462,369 |
| 1,278,940 |
Currency and interest rate hedging instruments (a) | - |
| - |
| 862,246 |
| 981,874 |
Total financial investments | 214,302 |
| 88,100 |
| 4,118,453 |
| 6,010,666 |
Current | 214,302 |
| 88,100 |
| 3,355,993 |
| 5,033,258 |
Non-current | - |
| - |
| 762,460 |
| 977,408 |
(a) Accumulated gains, net of income tax (see Note 33.i).
5. Trade receivables and reseller financing (Consolidated)
a. Trade receivables
The composition of trade receivables is as follows:
|
| 06/30/2021 |
| 12/31/2020 |
Domestic customers |
| 3,878,914 |
| 3,443,641 |
Domestic customers – related parties (see Note 8.a.2) |
| - |
| 151 |
Foreign customers |
| 381,993 |
| 326,442 |
Foreign customers – related parties (see Note 8.a.2) |
| 1,422 |
| 2,984 |
(-) Expected losses on doubtful accounts |
| (375,541) |
| (382,096) |
|
| 3,886,788 |
| 3,391,122 |
Current |
| 3,819,996 |
| 3,318,927 |
Non-current |
| 66,792 |
| 72,195 |
Ultrapar Participações S.A. and Subsidiaries
Notes to the Parent’s Separate and Consolidated Interim Financial Information
(In thousands of Brazilian Reais, unless otherwise stated)
The breakdown of trade receivables, gross of expected losses on doubtful accounts, is as follows:
|
|
|
| Past due | ||||
| Total |
| Current | less than 30 days | 31-60 days | 61-90 days | 91-180 days | more than 180 days |
06/30/2021 | 4,262,329 |
| 3,485,430 | 133,811 | 29,647 | 13,458 | 40,001 | 559,982 |
12/31/2020 | 3,773,218 |
| 2,963,163 | 124,606 | 27,970 | 21,389 | 47,169 | 588,921 |
The breakdown of expected losses on doubtful accounts, is as follows:
|
|
|
| Past due | ||||
| Total |
| Current | less than 30 days | 31-60 days | 61-90 days | 91-180 days | more than 180 days |
06/30/2021 | 375,541 |
| 20,660 | 1,703 | 1,874 | 1,673 | 14,284 | 335,347 |
12/31/2020 | 382,096 |
| 21,219 | 2,154 | 1,751 | 2,233 | 13,378 | 341,361 |
Movements in the allowance for expected losses on doubtful accounts are as follows:
Balance as of December 31, 2020 |
| 382,096 |
Additions |
| 124,623 |
Reversals |
| (127,035) |
Write-offs |
| (4,143) |
Balance as of June 30, 2021 |
| 375,541 |
For further information about the allowance for expected losses on doubtful accounts see Note 33.d.3.
Ultrapar Participações S.A. and Subsidiaries
Notes to the Parent’s Separate and Consolidated Interim Financial Information
(In thousands of Brazilian Reais, unless otherwise stated)
b. Reseller financing
The composition of reseller financing is as follows:
|
| 06/30/2021 |
| 12/31/2020 |
Reseller financing – Ipiranga |
| 1,174,646 |
| 1,165,395 |
(-) Expected losses on doubtful accounts |
| (197,471) |
| (197,011) |
|
| 977,175 |
| 968,384 |
Current |
| 543,152 |
| 549,129 |
Non-current |
| 434,023 |
| 419,255 |
The breakdown of reseller financing, gross of expected losses on doubtful accounts, is as follows:
|
|
|
| Past due | ||||
| Total |
| Current | less than 30 days | 31-60 days | 61-90 days | 91-180 days | more than 180 days |
06/30/2021 | 1,174,646 |
| 789,252 | 17,593 | 8,188 | 13,779 | 24,724 | 321,110 |
12/31/2020 | 1,165,395 |
| 787,904 | 10,230 | 15,237 | 21,200 | 28,989 | 301,835 |
The breakdown of expected losses on doubtful accounts, is as follows:
|
|
|
| Past due | ||||
| Total |
| Current | less than 30 days | 31-60 days | 61-90 days | 91-180 days | more than 180 days |
06/30/2021 | 197,471 |
| 19,903 | 1,138 | 677 | 993 | 14,217 | 160,543 |
12/31/2020 | 197,011 |
| 22,872 | 785 | 1,812 | 2,397 | 14,684 | 154,461 |
Movements in the allowance for expected losses on doubtful accounts are as follows:
Balance as of December 31, 2020 |
| 197,011 |
Additions |
| 42,141 |
Reversals |
| (41,304) |
Write-offs |
| (377) |
Balance as of June 30, 2021 |
| 197,471 |
For further information about the allowance for expected losses on doubtful accounts see Note 33.d.3.
Ultrapar Participações S.A. and Subsidiaries
Notes to the Parent’s Separate and Consolidated Interim Financial Information
(In thousands of Brazilian Reais, unless otherwise stated)
6. Inventories (Consolidated)
The composition of inventories is as follows:
| 06/30/2021 |
| 12/31/2020 | ||||||||
| Cost |
| Provision for losses |
| Net balance |
| Cost |
| Provision for losses |
| Net balance |
Fuels, lubricants and greases | 2,435,871 |
| (3,144) |
| 2,432,727 |
| 1,682,841 |
| (5,344) |
| 1,677,497 |
Finished goods | 795,108 |
| (20,472) |
| 774,636 |
| 646,180 |
| (22,281) |
| 623,899 |
Work in process | 2,915 |
| - |
| 2,915 |
| 1,450 |
| - |
| 1,450 |
Raw materials | 672,310 |
| (2,063) |
| 670,247 |
| 568,185 |
| (1,827) |
| 566,358 |
Liquefied petroleum gas (LPG) | 118,231 |
| (5,761) |
| 112,470 |
| 110,767 |
| (5,761) |
| 105,006 |
Consumable materials and other items for resale | 154,141 |
| (3,390) |
| 150,751 |
| 129,559 |
| (2,598) |
| 126,961 |
Pharmaceutical, hygiene, and beauty products | 509,858 |
| (2,222) |
| 507,636 |
| 521,689 |
| (2,611) |
| 519,078 |
Purchase for future delivery (1) | 210,811 |
| (463) |
| 210,348 |
| 198,986 |
| (464) |
| 198,522 |
Properties for resale | 27,173 |
| (107) |
| 27,066 |
| 27,532 |
| (107) |
| 27,425 |
| 4,926,418 |
| (37,622) |
| 4,888,796 |
| 3,887,189 |
| (40,993) |
| 3,846,196 |
(1) Refers substantially to ethanol, biodiesel and advances for fuel acquisition.
Movements in the provision for losses are as follows:
Balance as of December 31, 2020 | 40,993 |
Addition to net realizable value adjustment | 1,075 |
Reversal of obsolescence and other losses | (4,446) |
Balance as of June 30, 2021 | 37,622 |
The breakdown of provisions for losses related to inventories is shown in the table below:
| 06/30/2021 |
| 12/31/2020 |
Net realizable value adjustment | 18,563 |
| 17,488 |
Obsolescence and other losses | 19,059 |
| 23,505 |
Total | 37,622 |
| 40,993 |
Ultrapar Participações S.A. and Subsidiaries
Notes to the Parent’s Separate and Consolidated Interim Financial Information
(In thousands of Brazilian Reais, unless otherwise stated)
7. Taxes to recover
a. Recoverable taxes (Consolidated)
Recoverable taxes are substantially represented by credits of Tax on Goods and Services (“ICMS”, the Brazilian VAT), Contribution for Social Security Financing (“COFINS”) and Social Integration Program (“PIS”).
| 06/30/2021 |
| 12/31/2020 |
ICMS (a.1) | 1,088,142 |
| 1,129,325 |
PIS and COFINS (a.2) (a.3) | 1,379,141 |
| 1,297,029 |
Value-added tax (IVA) of foreign subsidiaries | 24,096 |
| 35,600 |
Others | 42,137 |
| 57,704 |
Total | 2,533,516 |
| 2,519,658 |
Current | 1,069,766 |
| 1,044,850 |
Non-current | 1,463,750 |
| 1,474,808 |
a.1 The recoverable ICMS net of provision for losses is substantially related to the following subsidiaries and operations:
(i) The subsidiaries Oxiteno S.A. Indústria e Comércio (“Oxiteno S.A.”), Empresa Carioca de Produtos Químicos S.A. (“EMCA”) and Oleoquímica Indústria e Comércio de Produtos Químicos Ltda. (“Oleoquímica”) accumulated credits in the amount of R$ 255,213 (R$ 195,037 as of December 31, 2020) once predominantly carried out export operations, interstate outflow or deferred ICMS of products purchased within the State of Bahia;
(ii) The subsidiaries IPP, Bahiana Distribuidora de Gás Ltda. (“Bahiana”), Cia. Ultragaz, AMPM and Iconic Lubrificantes S.A. (“Iconic”) have credits in the amount of R$ 797,269 (R$ 754,882 as of December 31, 2020) recognized, mainly, of the following nature: a) transactions of inputs and outputs of products subject to taxation of the own ICMS; b) interstate outflows of oil-related products, whose ICMS was prepaid by the supplier (Petróleo Brasileiro S.A. (“Petrobras”)), in the case of the subsidiaries IPP, Bahiana and Cia. Ultragaz and c) credits for refunds of the ICMS-ST (tax substitution) overpaid when the estimated calculation base is used higher than the actual operation practiced by the subsidiary IPP;
(iii) The subsidiary Extrafarma has ICMS credits and ICMS-ST (tax substitution) advances in the amount of R$ 193,933, being reduced to R$ 35,660 due to the partial allocation of the provision for impairment of assets (R$ 179,405 as of December 31, 2020) on the inflow and outflow of operations carried out by its distribution centers, mostly in the North and Northeast, as well as refunds of the ICMS-ST portion overpaid when the estimated calculation base is used higher than the actual operation.
The amounts of recoverable ICMS are realized by the taxed operations itself, being a revolving credit, which means that the credits are monthly offset with the tax payable on sales and new credits are generated by the acquisition of inputs, as well as by the State's refund on tax substitution operations. Management estimates the realization of the credits classified in non-current assets within an average term of up to 10 years.
Ultrapar Participações S.A. and Subsidiaries
Notes to the Parent’s Separate and Consolidated Interim Financial Information
(In thousands of Brazilian Reais, unless otherwise stated)
The estimated recovery of ICMS assets is stated as follows:
Up to 1 year | 514,141 |
From 1 to 2 years | 316,211 |
From 2 to 3 years | 190,103 |
From 3 to 5 years | 67,687 |
Total of recoverable ICMS, net of provision | 1,088,142 |
The provision for ICMS losses, in the amount of R$ 218,904 (R$ 52,338 as of December 31, 2020), relates to tax credits of the subsidiaries whose amounts are not included within the term determined by its policy and by the allocation of the provision for impairment of assets in the amount of R$ 158,273 of the subsidiary Extrafarma (see note 3.c.1).
a.2 The balance of PIS and COFINS refers, mainly, to credits recorded under Laws 10,637/2002 and 10,833/2003 in the amount of R$ 635,819 (R$ 651,051 as of December 31, 2020), whose consumption will occur through the offset of debts administered by the Brazilian Federal Revenue Service (“RFB”) in an estimated term of 2 years by management. The subsidiaries IPP, Extrafarma, Tropical Transportes Ipiranga Ltda (“Tropical”), EMCA, Oleoquímica and Oxiteno S.A. have credits in the amount of R$ 743,322 (R$ 645,978 as of December 31, 2020) resulting from a favorable decision on the exclusion of ICMS from the calculation basis of PIS and COFINS (see item a.3 below). For these cases, management estimates the realization of these credits within up to 5 years.
The credit balance of PIS and COFINS is realized through the settlement of own debts in subsequent months or with other debts managed by the Receita Federal and social security for cases that the law allows.
a.3 On March 15, 2017, due to general repercussions, the STF decided that ICMS does not compose the basis for calculating PIS and COFINS. After filing the Union's Embargoes for Clarification, the STF definitively ruled about the thesis on May 13, 2021, reaffirming the exclusion of the highlighted ICMS from the PIS and COFINS calculation basis and modulating the effects of the decision for the lawsuits filed after March 15, 2017. Certain subsidiaries have credits originated from favorable decisions on the exclusion of ICMS from the PIS and COFINS calculation base (see note 22.d), having been the respective subsidies to prove the amounts to be refunded properly confirmed by management and recorded in results, up to the present period of 2021, the amount of R$ 953,834, of which R$ 542,059 of principal and R$ 411,775 of monetary variation (R$ 746,962, of which R$ 409,019 of principal and R$ 337,943 of monetary variation up to 2020).
The estimated recovery of PIS and COFINS credits is stated as follows:
Up to 1 year | 489,391 |
From 1 to 2 years | 766,019 |
From 2 to 3 years | 87,884 |
From 3 to 5 years | 35,847 |
Total of recoverable PIS and COFINS | 1,379,141 |
Ultrapar Participações S.A. and Subsidiaries
Notes to the Parent’s Separate and Consolidated Interim Financial Information
(In thousands of Brazilian Reais, unless otherwise stated)
b. Recoverable income tax and social contribution taxes
Relates to IRPJ and CSLL to be recovered by the Company and its subsidiaries arising from the tax advances of previous years, with management estimating the realization of these credits within up to 5 years.
| Parent |
| Consolidated | ||||
| 06/30/2021 |
| 12/31/2020 |
| 06/30/2021 |
| 12/31/2020 |
IRPJ and CSLL | 77,303 |
| 87,359 |
| 546,797 |
| 627,285 |
Current | 37,858 |
| 47,913 |
| 353,374 |
| 366,080 |
Non-current | 39,445 |
| 39,446 |
| 193,423 |
| 261,205 |
8. Related parties
a. Related parties
The balances and transactions of the Company and its related parties are disclosed below:
a.1 Parent
| Assets |
| Liabilities |
|
| ||||
| Debentures |
| Other receivables |
| Related parties |
| Other payables |
| Financial income |
Ipiranga Produtos de Petróleo S.A. | 402,790(2) |
| 50,065 |
| - |
| - |
| 7,789 (2) |
Cia Ultragaz S.A. | - |
| 9,806 |
| - |
| 6,812 |
| - |
Imifarma Produtos Farmacêuticos e Cosméticos S.A. | - |
| 6,276 |
| 4,804 |
| 87 |
| - |
Oxiteno S.A. Indústria e Comércio | - |
| 6,492 |
| - |
| 548 |
| - |
Ultracargo Logistica S.A. | - |
| 2,711 |
| - |
| - |
| - |
Eaí Clube Automobilista S.A. | - |
| 128 |
| - |
| - |
| - |
UVC Investimentos Ltda | - |
| 69 |
| - |
| - |
| - |
am/pm Comestíveis Ltda. | - |
| 17 |
| - |
| - |
| - |
Iconic Lubrificantes S/A | - |
| 10 |
| - |
| - |
| - |
SERMA - Ass. dos usuários equip. proc. de dados | - |
| - |
| - |
| 7,727 |
| - |
Others | - |
| - |
| - |
| 33 |
| - |
Total as of June 30, 2021 | 402,790 |
| 75,574 |
| 4,804 |
| 15,207 |
| 7,789 |
Ultrapar Participações S.A. and Subsidiaries
Notes to the Parent’s Separate and Consolidated Interim Financial Information
(In thousands of Brazilian Reais, unless otherwise stated)
| Assets |
| Liabilities |
|
| ||||
| Debentures |
| Other receivables |
| Related parties |
| Other payables |
| Financial income |
Ipiranga Produtos de Petróleo S.A. | 753,459 (1) |
| 15,545 |
| - |
| - |
| 15,278 (1) |
Cia Ultragaz S.A. | - |
| 10,147 |
| - |
| 8,469 |
| - |
SERMA - Ass. dos usuários equip. proc. de dados | - |
| 9,635 |
| - |
| - |
| - |
Imifarma Produtos Farmacêuticos e Cosméticos S.A. | - |
| 3,785 |
| 5,272 |
| 142 |
| - |
Oxiteno S.A. Indústria e Comércio | - |
| 4,476 |
| - |
| 548 |
| - |
Centro de Conveniências Millennium Ltda. | - |
| 3,700 |
| - |
| - |
| - |
Ultracargo Logística S.A. | - |
| 1,695 |
| - |
| 277 |
| - |
Bahiana Distribuidora de Gás Ltda. | - |
| 831 |
| - |
| - |
| - |
UVC Investimentos Ltda | - |
| 69 |
| - |
| - |
| - |
Eaí Clube Automobilista S.A. | - |
| - |
| - |
| 35 |
| - |
am/pm Comestíveis Ltda. | - |
| 13 |
| - |
| - |
| - |
Total as of December 31, 2020 | 753,459 |
| 49,896 |
| 5,272 |
| 9,471 |
|
|
Total as of June 30, 2020 |
|
|
|
|
|
|
|
| 15,278 |
| (1) | In March 2016 the subsidiary IPP made its second private offering in one single series of 75 debentures at face value of R$ 10,000,000.00 (ten million Brazilian Reais) each, nonconvertible into shares and unsecured, with maturity on March 31, 2021 and semiannual interest linked to DI being subscribed the total by the Company. The debentures were paid off on the maturity date. | |
| (2) | In March 2021 the subsidiary IPP made its nineth private offering in one single series of 400,000 debentures at face value of R$ 1,000.00 (one thousand Brazilian Reais) each, nonconvertible into shares and unsecured, with maturity on March 31, 2024 and semiannual interest linked to DI being subscribed the total by the Company. |
Ultrapar Participações S.A. and Subsidiaries
Notes to the Parent’s Separate and Consolidated Interim Financial Information
(In thousands of Brazilian Reais, unless otherwise stated)
a.2 Consolidated
Balances and transactions between the Company and its subsidiaries and between subsidiaries have been eliminated in consolidation and are not disclosed in this note. The balances and transactions between the Company and its subsidiaries with other related parties are disclosed below:
| Loans | ||
| Assets |
| Liabilities |
Química da Bahia Indústria e Comércio S.A. (1) | - |
| 2,875 |
Routeasy Serviços de Assessoria Logística Ltda. (2) | 2,409 |
| - |
HS Intermediação de Compras Coletivas e Tecnologia Ltda. (3) | 5,000 |
| - |
Voltz Co Ltd (4) | 5,009 |
| - |
ConectCar Soluções de Mobilidade Eletrônica S.A. (5) | 9,321 |
| - |
Others (1) | 490 |
| 707 |
Total as of June 30, 2021 | 22,229 |
| 3,582 |
| Loans | ||
| Assets |
| Liabilities |
Química da Bahia Indústria e Comércio S.A. (1) | - |
| 2,875 |
Routeasy Serviços de Assessoria Logística Ltda. (2) | 2,334 |
| - |
Others (1) | 490 |
| 836 |
Total as of December 31, 2020 | 2,824 |
| 3,711 |
| (1) | Loans contracted have indefinite terms and do not contain remuneration clauses. | |
| (2) | The loan contracted has a term of 36 months, can be extended by mutual agreement between the parties, being remunerated by the DI plus 3% p.a. | |
| (3) | The loan contracted has a term of 24 months, can be extended by mutual agreement between the parties and does not contain remuneration clauses. | |
| (4) | The loan contracted was made in foreign currency (dollar), has a term of 36 months, and can be extended by mutual agreement between the parties, being remunerated by the DI plus 3% p.a. | |
| (5) | The loan contracted has a term of 36 months, can be extended by mutual agreement between the parties and does not contain remuneration clauses. The other shareholder of ConectCar lent the same amount, under the same conditions. |
Ultrapar Participações S.A. and Subsidiaries
Notes to the Parent’s Separate and Consolidated Interim Financial Information
(In thousands of Brazilian Reais, unless otherwise stated)
| Commercial transactions | ||||||||||||
| Receivables (1) |
| Right-of-use assets |
| Payables (1) |
| Leases payable |
| Sales and services |
| Purchases |
| Expenses |
Oxicap Indústria de Gases Ltda. | - |
| - |
| 1,469 |
| - |
| 272 |
| 8,441 |
| - |
Refinaria de Petróleo Riograndense S.A. | - |
| - |
| 148,809 |
| - |
| - |
| 304,996 |
| - |
ConectCar Soluções de Mobilidade Eletrônica S.A. | - |
| - |
| 139 |
| - |
| 600 |
| 38 |
| - |
LA’7 Participações e Empreend. Imob. Ltda. (a) | - |
| 10,808 |
| - |
| 10,392 |
| - |
| - |
| 1,088 |
Chevron (Thailand) Limited | 4 |
| - |
| 6 |
| - |
| 246 |
| 407 |
| - |
Chevron Lubricants Lanka PLC | 117 |
| - |
| - |
| - |
| 164 |
| - |
| - |
Chevron Lubricants Oils S.A. | - |
| - |
| 51 |
| - |
| 415 |
| - |
| - |
Chevron Marine Products | 1,301 |
| - |
| - |
| - |
| 4,475 |
| - |
| - |
Chevron Oronite Brasil LTDA. | - |
| - |
| 44,929 |
| - |
| - |
| 81,193 |
| - |
Chevron Products Company | - |
| - |
| 84,871 |
| - |
| - |
| 332,106 |
| - |
Chevron Belgium NV | - |
| - |
| 990 |
| - |
| - |
| 3,861 |
| - |
Total as of June 30, 2021 | 1,422 |
| 10,808 |
| 281,264 |
| 10,392 |
| 6,172 |
| 731,042 |
| 1,088 |
Ultrapar Participações S.A. and Subsidiaries
Notes to the Parent’s Separate and Consolidated Interim Financial Information
(In thousands of Brazilian Reais, unless otherwise stated)
| Commercial transactions | ||||||||||||
| Receivables (1) |
| Right-of-use assets |
| Payables (1) |
| Leases payable |
| Sales and services |
| Purchases |
| Expenses |
Oxicap Indústria de Gases Ltda. | - |
| - |
| 1,772 |
| - |
| - |
| 9,408 |
| - |
Refinaria de Petróleo Riograndense S.A. | - |
| - |
| 65,215 |
| - |
| - |
| 148,630 |
| - |
ConectCar Soluções de Mobilidade Eletrônica S.A. | 151 |
| - |
| 104 |
| - |
| 1,537 |
| 80 |
| - |
LA’7 Participações e Empreend. Imob. Ltda. (a) | - |
| 8,635 |
| - |
| 8,044 |
| - |
| - |
| 800 |
Chevron (Thailand) Limited | 166 |
| - |
| 6 |
| - |
| - |
| 527 |
| - |
Chevron Brasil Oleos Basicos LTDA | - |
| - |
| 6 |
| - |
| - |
| - |
| - |
Chevron Latin America Marketing LLC | 118 |
| - |
| - |
| - |
| - |
| - |
| - |
Chevron Lubricants Lanka PLC | 3 |
| - |
| - |
| - |
| - |
| - |
| - |
Chevron Lubricants Oils S.A. | 823 |
| - |
| - |
| - |
| - |
| - |
| - |
Chevron Marine Products | 1,873 |
| - |
| - |
| - |
| - |
| - |
| - |
Chevron Oronite Brasil LTDA. | - |
| - |
| 37,482 |
| - |
| - |
| 42,969 |
| - |
Chevron Products Company | - |
| - |
| 87,754 |
| - |
| - |
| 94,705 |
| - |
Chevron Belgium NV | - |
| - |
| 785 |
| - |
| - |
| 5,241 |
| - |
Chevron Petroleum CO Colombia | 1 |
| - |
| - |
| - |
| - |
| - |
| - |
Total as of December 31, 2020 | 3,135 |
| 8,635 |
| 193,124 |
| 8,044 |
|
|
|
|
|
|
Total as of June 30, 2020 |
|
|
|
|
|
|
|
| 1,537 |
| 301,560 |
| 800 |
| (1) | Included in “domestic trade receivables”, “domestic trade payables” and “domestic trade payables – reverse factoring”, respectively. | |
| (a) | Refers to rental contracts of 15 drugstores owned by LA’7 as of June 30, 2021 and December 31, 2020, a company of the former shareholders of Extrafarma that are current shareholders of Ultrapar. |
Purchase and sale transactions relate substantially to the purchase of raw materials, feedstock, transportation, and storage services based on similar market prices and terms with customers and suppliers with comparable operational performance. The operations of ConectCar refer to services provided. In the opinion of the Company and its subsidiaries’ management, transactions with related parties are not subject to credit risk, therefore, no provision for expected losses on accounts receivable or guarantees are recorded. Guarantees provided by the Company in loans of subsidiaries and affiliates are mentioned in Note 16.i.
Ultrapar Participações S.A. and Subsidiaries
Notes to the Parent’s Separate and Consolidated Interim Financial Information
(In thousands of Brazilian Reais, unless otherwise stated)
b. Key executives (Consolidated)
The Company’s compensation strategy combines short and long-term elements, following the principles of alignment of interests and of maintaining a competitive compensation, and is aimed at retaining key officers and remunerating them adequately according to their attributed responsibilities and the value created to the Company and its shareholders.
Short-term compensation is comprised of: (a) fixed monthly compensation paid with the objective of rewarding the executive’s experience, responsibility, and his/her position’s complexity, and includes salary and benefits such as medical coverage, check-up, life insurance, and others; (b) variable compensation paid annually with the objective of aligning the executive’s and the Company’s objectives, which is linked to: (i) the business performance measured through its economic value creation and (ii) the fulfillment of individual annual goals that are based on the strategic plan and are focused on expansion and operational excellence projects, people development and market positioning, among others. Further details about the Deferred Stock Plan are contained in Note 8.c and about post-employment benefits in Note 20.b.
The expenses for compensation of its key executives (Company’s directors and executive officers) as shown below:
| 06/30/2021 |
| 06/30/2020 |
Short-term compensation | 21,657 |
| 21,956 |
Stock compensation | 6,217 |
| 5,437 |
Post-employment benefits | 1,335 |
| 1,359 |
Total | 29,209 |
| 28,752 |
c. Deferred stock plan (Consolidated)
Since 2003 Ultrapar has adopted a stock plan in which the executive has the usufruct of shares held in treasury until the transfer of the full ownership of the shares to those eligible members of management after five to seven years from the initial concession of the rights subject to uninterrupted employment of the participant during the period. The volume of shares and the executives eligible are determined by the Board of Directors, and there is no mandatory annual grant. The total number of shares to be used in the plan is subject to the number of shares in treasury. Ultrapar’s Board of Directors members are not eligible to participate in the stock plan. The fair value of the awards was determined on the grant date based on the market value of the shares on the B3, the Brazilian Securities, Commodities and Futures Exchange and the amounts are amortized between five to seven years from the grant date.
Ultrapar Participações S.A. and Subsidiaries
Notes to the Parent’s Separate and Consolidated Interim Financial Information
(In thousands of Brazilian Reais, unless otherwise stated)
The table below summarizes shares granted to the Company and its subsidiaries’ management:
Grant date | Balance of number of shares granted | Vesting period | Market price of shares on the grant date (in R$ per share) | Total grant costs, including taxes |
| Accumulated recognized grant costs |
| Accumulated unrecognized grant costs |
March 4, 2016 | 253,330 | 2022 and 2023 | 32.72 | 17,147 |
| (15,151) |
| 1,996 |
December 10, 2014 | 266,660 | 2021 | 25.32 | 28,405 |
| (27,391) |
| 1,014 |
| 519,990 |
|
| 45,552 |
| (42,542) |
| 3,010 |
For the six-month period ended June 30, 2021 the amortization in the amount of R$ 1,788 (R$ 3,892 for the six-month period ended June 30, 2020) was recognized as a general and administrative expense.
The table below summarizes the changes of number of shares granted:
Balance on December 31, 2020 |
| 702,260 |
Shares vested and transferred |
| (182,270) |
Balance on June 30, 2021 |
| 519,990 |
In addition, on April 19, 2017, the Ordinary and Extraordinary General Shareholders’ Meeting (“OEGM”) of approved a new incentive plan based on shares (”Plan”), which establishes the general terms and conditions for the concession of common shares issued by the Company and held in treasury, that may or may not involve the granting of usufruct of part of these shares for later transfer of the ownership of the shares, in periods of three to six years, to directors or employees of the Company or its subsidiaries.
As a result of the Plan, common shares representing at most 1% of the Company's share capital may be delivered to the participants, which corresponds, at the date of approval of this Plan, to 11,128,102 common shares.
Ultrapar Participações S.A. and Subsidiaries
Notes to the Parent’s Separate and Consolidated Interim Financial Information
(In thousands of Brazilian Reais, unless otherwise stated)
The table below summarizes the restricted and performance stock programs:
Program | Grant date | Balance of number of shares granted | Vesting period | Market price of shares on the grant date (in R$ per share) | Total grant costs, including taxes |
| Accumulated recognized grant costs |
| Accumulated unrecognized grant costs |
Restricted | October 1, 2017 | 240,000 | 2023 | 38.19 | 12,642 |
| (7,901) |
| 4,741 |
Restricted and performance | November 8, 2017 | 15,778 | 2021 to 2022 | 38.19 | 1,759 |
| (1,577) |
| 182 |
Restricted and performance | April 4, 2018 | 74,602 | 2022 to 2023 | 34.35 | 6,313 |
| (5,057) |
| 1,256 |
Restricted | September 19, 2018 | 80,000 | 2024 | 19.58 | 2,161 |
| (990) |
| 1,171 |
Restricted | September 24, 2018 | 80,000 | 2024 | 18.40 | 2,030 |
| (931) |
| 1,099 |
Restricted and performance | April 3, 2019 | 391,560 | 2022 to 2024 | 23.25 | 16,417 |
| (9,185) |
| 7,232 |
Restricted | September 2, 2019 | 440,000 | 2025 | 16.42 | 9,965 |
| (3,045) |
| 6,920 |
Restricted and performance | April 1, 2020 | 754,896 | 2023 to 2025 | 12.53 | 17,640 |
| (5,773) |
| 11,867 |
Restricted | September 16, 2020 | 700,000 | 2026 | 23.03 | 22,236 |
| (3,088) |
| 19,148 |
Restricted and performance | April 7, 2021 | 1,386,504 | 2024 | 20.85 | 54,447 |
| (4,538) |
| 49,909 |
|
| 4,163,340 |
|
| 145,610 |
| (42,085) |
| 103,525 |
For the six-month period ended June 30, 2021, a general and administrative expense in the amount of R$ 9,905 was recognized in relation to the Plan (R$ 5,769 for the six-month period ended June 30, 2020).
Balance on December 31, 2020 |
| 2,910,162 |
Shares granted on April 7, 2021 |
| 1,386,504 |
Performance shares (i) |
| (133,326) |
Balance on June 30, 2021 |
| 4,163,340 |
(i) Refers to the reversal of the provision constituted in view of the significant probability that performance indicators will not be achieved.
Ultrapar Participações S.A. and Subsidiaries
Notes to the Parent’s Separate and Consolidated Interim Financial Information
(In thousands of Brazilian Reais, unless otherwise stated)
9. Income and social contribution taxes
a. Deferred income (IRPJ) and social contribution taxes (CSLL)
The Company and its subsidiaries recognize deferred tax assets and liabilities, which are not subject to the statute of limitations, mainly resulting from provision for differences between cash and accrual basis, tax loss carryforwards, negative tax bases and provisions for tax, civil, and labor risks. Deferred tax assets are sustained by the continued profitability of their operations. Deferred IRPJ and CSLL are recognized under the following main categories:
| Parent |
| Consolidated | ||||
| 06/30/2021 |
| 12/31/2020 |
| 06/30/2021 |
| 12/31/2020 |
Assets - deferred income and social contribution taxes on: |
|
|
|
|
|
|
|
Provision for impairment of assets | - |
| - |
| 226,254 |
| 75,231 |
Provisions for tax, civil, and labor risks | - |
| - |
| 137,812 |
| 138,516 |
Provision for post-employment benefits | 1,226 |
| 1,078 |
| 98,283 |
| 96,108 |
Provision for differences between cash and accrual basis (i) | - |
| - |
| 548,120 |
| 606,054 |
Goodwill | - |
| - |
| 4,980 |
| 5,161 |
Business combination – tax basis vs. accounting basis of goodwill | - |
| - |
| 18,534 |
| 75,515 |
Provision for asset retirement obligation | - |
| - |
| 16,101 |
| 15,728 |
Provision for suppliers | 7,839 |
| 4,284 |
| 65,234 |
| 49,501 |
Provision for profit sharing and bonus | 4,895 |
| 9,445 |
| 35,857 |
| 56,873 |
Leases payable | 1,141 |
| 976 |
| 61,161 |
| 41,932 |
Change in fair value of subscription warrants | 16,286 |
| 22,833 |
| 16,286 |
| 22,833 |
Provision for deferred revenue | - |
| - |
| 14,009 |
| 25,770 |
Other provisions | 95 |
| 95 |
| 26,210 |
| 14,917 |
Tax losses and negative basis for social contribution carryforwards (9.d) | 36,040 |
| 26,730 |
| 282,547 |
| 363,862 |
Total | 67,522 |
| 65,441 |
| 1,551,388 |
| 1,588,001 |
Offset liability balance of deferred IRPJ and CSLL | (5,164) |
| (448) |
| (469,791) |
| (613,290) |
Net balance of deferred taxes assets | 62,358 |
| 64,993 |
| 1,081,597 |
| 974,711 |
|
|
|
|
|
|
|
|
Liabilities - deferred income and social contribution taxes on: |
|
|
|
|
|
|
|
Revaluation of PP&E | - |
| - |
| 1,732 |
| 1,776 |
Leases payable | - |
| - |
| 1,577 |
| 1,895 |
Provision for differences between cash and accrual basis (i) | - |
| 448 |
| 361,853 |
| 402,780 |
Provision for goodwill | - |
| - |
| 28,676 |
| 92,242 |
Business combination – fair value of assets | - |
| - |
| 69,374 |
| 111,832 |
Temporary differences of foreign subsidiaries | 5,084 |
| - |
| 5,568 |
| - |
Provision for deferred revenue | - |
| - |
| 7,127 |
| 12,196 |
Other provisions | 80 |
| - |
| 5,212 |
| 3,301 |
Total | 5,164 |
| 448 |
| 481,119 |
| 626,022 |
Offset asset balance of deferred IRPJ and CSLL | (5,164) |
| (448) |
| (469,791) |
| (613,290) |
Net balance of deferred taxes liabilities | - |
| - |
| 11,328 |
| 12,732 |
(i) Refers, mainly, to the income tax on the exchange variation of the derivate hedging instruments.
Ultrapar Participações S.A. and Subsidiaries
Notes to the Parent’s Separate and Consolidated Interim Financial Information
(In thousands of Brazilian Reais, unless otherwise stated)
Changes in the net balance of deferred IRPJ and CSLL are as follows:
| Parent |
| Consolidated | ||||
| 06/30/2021 |
| 06/30/2020 |
| 06/30/2021 |
| 06/30/2020 |
Initial balance | 64,993 |
| 41,613 |
| 961,979 |
| 646,163 |
Deferred IRPJ and CSLL recognized in income of the period | (2,635) |
| 3,261 |
| 173,900 |
| 26,314 |
Deferred IRPJ and CSLL recognized in other comprehensive income | - |
| 1 |
| (61,258) |
| 292,540 |
Others | - |
| - |
| (4,352) |
| 17,886 |
Final balance | 62,358 |
| 44,875 |
| 1,070,269 |
| 982,903 |
In order to evaluate the realization of deferred tax assets, the taxable income projections from business plans of each segment of the Company which indicates trends and perspectives, demand effects, competition and other economic factors, and that represent the management’s best estimate about the economic conditions existing during the period of realization of the deferred tax asset were taken into account.
The main key assumptions used to calculate the realization of deferred tax assets are: growth in Gross Domestic Product (“GDP”), exchange rate, basic interest rate (SELIC) and DI, inflation rate, commodity price index, among others. The balance of Company and its subsidiaries of R$ 1,551,388 and parent of R$ 67,522 was supported by the technical study on taxable profit projections for the realization of deferred tax assets.
Ultrapar Participações S.A. and Subsidiaries
Notes to the Parent’s Separate and Consolidated Interim Financial Information
(In thousands of Brazilian Reais, unless otherwise stated)
b. Reconciliation of income and social contribution taxes
IRPJ and CSLL are reconciled to the statutory tax rates as follows:
| Parent |
| Consolidated | ||||
| 06/30/2021 |
| 06/30/2020 |
| 06/30/2021 |
| 06/30/2020 |
Income before taxes | 103,718 |
| 198,834 |
| 275,062 |
| 412,212 |
Statutory tax rates – % | 34 |
| 34 |
| 34 |
| 34 |
Income and social contribution taxes at the statutory tax rates | (35,264) |
| (67,604) |
| (93,521) |
| (140,152) |
Adjustments to the statutory income and social contribution taxes: |
|
|
|
|
|
|
|
Nondeductible expenses (i) | (8,965) |
| (3,482) |
| (34,393) |
| (14,890) |
Nontaxable revenues (ii) | - |
| - |
| 19,388 |
| 13,953 |
Adjustment to estimated income (iii) | - |
| - |
| 1,286 |
| 4,736 |
Unrecorded deferred income and social contribution taxes carryforwards deferred (iv) | - |
| - |
| (104,054) |
| (84,291) |
Share of profit (loss) of subsidiaries, joint ventures and associates | 41,594 |
| 74,169 |
| (3,720) |
| (8,737) |
Write-offs of deferred IRPJ and CSLL on impairment of tax goodwill | - |
| - |
| 24,135 |
| - |
Other adjustments | - |
| 8 |
| 1,043 |
| 734 |
Income and social contribution taxes before tax incentives | (2,635) |
| 3,091 |
| (189,836) |
| (228,647) |
Tax incentives - SUDENE | - |
| - |
| 33,961 |
| 35,329 |
Income and social contribution taxes in the income statement | (2,635) |
| 3,091 |
| (155,875) |
| (193,318) |
|
|
|
|
|
|
|
|
Current | - |
| (170) |
| (329,775) |
| (219,632) |
Deferred | (2,635) |
| 3,261 |
| 173,900 |
| 26,314 |
Effective IRPJ and CSLL rates – % | 2.5 |
| (1.6) |
| 56.7 |
| 46.9 |
| (i) | Consist of certain expenses that cannot be deducted for tax purposes under applicable tax legislation, such as expenses with fines, donations, gifts, losses of assets, negative effects of foreign subsidiaries and certain provisions. |
| (ii) | Consist of certain gains and income that are not taxable under applicable tax legislation, such as the reimbursement of taxes and the reversal of certain provisions. |
| (iii) | Brazilian tax law allows for an alternative method of taxation for companies that generated gross revenues of up to R$ 78 million in their previous fiscal year. Certain subsidiaries of the Company adopted this alternative form of taxation, whereby income and social contribution taxes are calculated on a basis equal to 32% of operating revenues, as opposed to being calculated based on the effective taxable income of these subsidiaries. The adjustment to estimated income represents the difference between the taxation under this alternative method and the income and social contribution taxes that would have been paid based on the effective statutory rate applied to the taxable income of these subsidiaries. |
| (iv) | See Note 9.d. |
| 47 |
Ultrapar Participações S.A. and Subsidiaries
Notes to the Parent’s Separate and Consolidated Interim Financial Information
(In thousands of Brazilian Reais, unless otherwise stated)
c. Tax incentives – SUDENE
For belonging to the sectors of the economy considered priority for the subsidized areas, under the terms of the development program of region operated by the Superintendence for the Development of the Northeast (“SUDENE”), the following subsidiaries, in compliance with the current law have entitled to federal tax benefits providing for IRPJ reduction under:
Subsidiary | Units | Incentive - % | Expiration |
Bahiana Distribuidora de Gás Ltda. | Mataripe base | 75 | 2024 |
| Caucaia base | 75 | 2025 |
| Juazeiro base | 75 | 2026 |
| Aracaju base | 75 | 2027 |
| Suape base | 75 | 2027 |
Ultracargo Logística S.A. | Suape terminal (1) | 75 | 2020 |
| Aratu terminal | 75 | 2022 |
| Itaqui terminal | 75 | 2025 |
Oleoquímica Indústria e Comércio de Produtos Químicos Ltda. | Camaçari plant | 75 | 2021 |
Oxiteno S.A. Indústria e Comércio (2) | Camaçari plant | 75 | 2026 |
Empresa Carioca de Produtos Químicos S.A. | Camaçari plant | 75 | 2026 |
| (1) | Based on the legislation in force the enterprise belongs to the sectors identified as priorities for the development of the Northeast region of Brazil. Combined with Ultracargo Logística's successful track record in meeting the requirements for maintaining and renewing the incentive, as well as in the fact that several investments have been made in the modernization of the production process of the unit that is the object of the benefit – Suape Terminal, the request for the extension of the incentive for another 10 years filed in 2021 at SUDENE and, when approved, will have retroactive effect since January 2021. |
| (2) | The request to transfer the right to reduce the IRPJ to Oxiteno S.A. was submitted to SUDENE and waits decision. |
d. Income and social contribution taxes carryforwards
In June 30, 2021, the Company and certain subsidiaries had tax loss carryforwards related to income tax (IRPJ) of R$ 1,708,678 (R$ 1,687,482 as of December 31, 2020) and negative basis of CSLL of R$ 1,707,832 (R$ 1,689,232 as of December 31, 2020), whose compensations are limited to 30% of taxable income in a given tax year, which do not expire.
Ultrapar Participações S.A. and Subsidiaries
Notes to the Parent’s Separate and Consolidated Interim Financial Information
(In thousands of Brazilian Reais, unless otherwise stated)
The balances which are constituted of deferred taxes related to income tax loss carryforwards and negative basis of social contribution base are as follows:
| 06/30/2021 |
| 12/31/2020 |
Oxiteno S.A. | 227,949 |
| 205,604 |
Ultrapar | 36,040 |
| 27,736 |
Abastece aí | 16,760 |
| 7,362 |
Tequimar Vila do Conde | 1,672 |
| 489 |
Ultracargo | 126 |
| 107 |
Extrafarma | - |
| 72,318 |
Ipiranga | ‐ |
| 44,537 |
Iconic | ‐ |
| 5,691 |
UVC Investimentos | ‐ |
| 18 |
| 282,547 |
| 363,862 |
The balances which are not constituted of deferred taxes related to income tax loss carryforwards and negative basis of social contribution base are as follows:
| 06/30/2021 |
| 12/31/2020 |
Extrafarma | 374,640 |
| 294,400 |
Integra Frotas | 10,004 |
| 7,802 |
UVC – Fundo de Investimento | 2,249 |
| - |
Millennium | 1,026 |
| 640 |
| 387,919 |
| 302,842 |
In addition, certain foreign subsidiaries have income tax loss carryforwards, as shown below, subject to local compensation rules.
| 06/30/2021 |
| 12/31/2020 |
| 06/30/2021 |
| 12/31/2020 |
| US$ |
| US$ |
| R$ |
| R$ |
Oxiteno USA | 232,209 |
| 217,837 |
| 1,161,557 |
| 1,132,035 |
Oxiteno Uruguay | 2,753 |
| 7,943 |
| 13,771 |
| 41,279 |
Ultrapar International | 5,897 |
| 6,261 |
| 18,931 |
| 32,535 |
| 240,859 |
| 232,041 |
| 1,194,259 |
| 1,205,849 |
Ultrapar Participações S.A. and Subsidiaries
Notes to the Parent’s Separate and Consolidated Interim Financial Information
(In thousands of Brazilian Reais, unless otherwise stated)
10. Prepaid expenses
| Parent |
| Consolidated | ||||
| 06/30/2021 |
| 12/31/2020 |
| 06/30/2021 |
| 12/31/2020 |
Rents | - |
| - |
| 17,059 |
| 30,400 |
Advertising and publicity | - |
| - |
| 23,143 |
| 17,752 |
Deferred stock plan, net (see Note 8.c) | 2,919 |
| 2,970 |
| 9,905 |
| 9,900 |
Insurance premiums | 5,645 |
| 971 |
| 87,098 |
| 58,675 |
Software maintenance | 3,191 |
| 3,105 |
| 25,175 |
| 24,233 |
Employee benefits | 561 |
| 526 |
| 9,568 |
| 8,924 |
IPVA and IPTU | 511 |
| - |
| 11,996 |
| 2,632 |
Contribution - private pension fund (see Note 20.a) | 190 |
| - |
| 30,580 |
| 36,068 |
Other prepaid expenses | - |
| - |
| 11,988 |
| 14,045 |
| 13,017 |
| 7,572 |
| 226,512 |
| 202,629 |
Current | 10,215 |
| 3,684 |
| 159,755 |
| 132,122 |
Non-current | 2,802 |
| 3,888 |
| 66,757 |
| 70,507 |
11. Contractual assets with customers – exclusive rights (Consolidated)
Refers to exclusive rights disbursements of Ipiranga’s agreements with reseller service stations and major consumers that are recognized at the time of their occurrence and recognized as a reductions of the revenue from sales and services in the statement of profit or loss according to the conditions established in the agreement, being reviewed as changes occur under the terms of the agreements. In June 30, 2021, the contracts amortization weighted average term was five years.
Balance and changes are shown below:
Balance as of December 31, 2019 |
| 1,465,989 |
Additions |
| 292,839 |
Amortization |
| (150,854) |
Transfer |
| (7,550) |
Balance as of June 30, 2020 |
| 1,600,424 |
Current |
| 472,985 |
Non-current |
| 1,127,439 |
Balance as of December 31, 2020 |
| 1,706,331 |
Additions |
| 241,938 |
Amortization |
| (128,879) |
Transfer |
| (7,796) |
Balance as of June 30, 2021 |
| 1,811,594 |
Current |
| 514,410 |
Non-current |
| 1,297,184 |
| 50 |
Ultrapar Participações S.A. and Subsidiaries
Notes to the Parent’s Separate and Consolidated Interim Financial Information
(In thousands of Brazilian Reais, unless otherwise stated)
12. Investments
The table below presents the amount reconciliation of share of profit (loss) of subsidiaries, joint ventures and associates:
|
| Parent |
| Consolidated | ||||
| Note | 06/30/2021 |
| 06/30/2020 |
| 06/30/2021 |
| 06/30/2020 |
Subsidiaries | 12.a | 119,682 |
| 239,421 |
| - |
| - |
Joint ventures | 12.b | 2,652 |
| (21,279) |
| (11,962) |
| (27,207) |
Associates | 12.c | - |
| - |
| 1,021 |
| 1,509 |
|
| 122,334 |
| 218,142 |
| (10,941) |
| (25,698) |
a. Subsidiaries and joint venture (Parent)
The table below presents the full amounts of statements of financial position and statements of profit or loss of subsidiaries and joint venture:
| 06/30/2021 | |||||||||
| Subsidiaries |
|
|
| Joint venture | |||||
| Ultracargo - Operações Logísticas e Participações Ltda. | Oxiteno S.A. Indústria e Comércio | Ipiranga Produtos de Petróleo S.A. | Ultrapar International S.A. |
| UVC | Centro de Conveniências Millennium Ltda. (**) | Eaí Clube Automobilista S.A. |
| Refinaria de Petróleo Riograndense S.A. |
Number of shares or units held | 11,839,764 | 35,102,127 | 224,467,228,244 | 49,995 |
| 150 | 15,194,789 | 80,000,000 |
| 5,078,888 |
Assets | 1,499,589 | 8,104,644 | 20,443,845 | 6,983,320 |
| 16,383 | 11,038 | 132,484 |
| 712,884 |
Liabilities | 2,768 | 6,391,959 | 13.325.940 | 7,003,146 |
| 31 | 2,584 | 28,053 |
| 715,237 |
Equity | 1,496,821 | 1,712,685 (*) | 7,117,905 (*) | (19,826) |
| 16,352 | 8,454 | 104,431 |
| (2,353) |
Net revenue from sales and services | - | 2,367,364 | 41,621,858 | - |
| - | 11,176 | 33,200 |
| 992,332 |
Net income (loss) | 75,949 | 59,709 (*) | (4,829) (*) | 13,873 |
| (3,017) | (1,134) | (20,868) |
| 7,987 |
% of capital held | 100 | 100 | 100 | 100 |
| 100 | 100 | 100 |
| 33 |
| 51 |
Ultrapar Participações S.A. and Subsidiaries
Notes to the Parent’s Separate and Consolidated Interim Financial Information
(In thousands of Brazilian Reais, unless otherwise stated)
| 12/31/2020 | |||||||||
| Subsidiaries |
| Joint venture | |||||||
| Ultracargo - Operações Logísticas e Participações Ltda. | Oxiteno S.A. Indústria e Comércio | Ipiranga Produtos de Petróleo S.A. | Ultrapar International S.A. |
| UVC | Centro de Conveniências Millennium Ltda. | Eaí Clube Automobilista S.A. |
| Refinaria de Petróleo Riograndense S.A. |
Number of shares or units held | 11,839,764 | 35,102,127 | 224,467,228,244 | 49,995 |
| 150 | 15,194,789 | 80,000,000 |
| 5,078,888 |
Assets | 1,423,217 | 8,142,503 | 20,612,986 | 7,239,492 |
| 4,385 | 14,902 | 85,858 |
| 462,990 |
Liabilities | 2,861 | 6,435,367 | 13,288,033 | 7,273,193 |
| 27 | 5,314 | 22,072 |
| 469,300 |
Equity | 1,420,356 | 1,707,136 (*) | 7,324,953 (*) | (33,701) |
| 4,358 | 9,588 | 63,786 |
| (6,310) |
% of capital held | 100 | 100 | 100 | 100 |
| 100 | 100 | 100 |
| 33 |
| 06/30/2020 | |||||||||
| Subsidiaries |
|
|
| Joint venture | |||||
| Ultracargo - Operações Logísticas e Participações Ltda. | Oxiteno S.A. Indústria e Comércio | Ipiranga Produtos de Petróleo S.A. | Ultrapar International S.A. |
| UVC | Centro de Conveniências Millennium Ltda. |
|
| Refinaria de Petróleo Riograndense S.A. |
Number of shares or units held | 11,839,764 | 35,102,127 | 224,467,228,244 | 49,995 |
| 150 | 15,194,789 |
|
| 5,078,888 |
Net revenue from sales and services | ‐ | 1,762,522 | 29,651,489 | ‐ |
| ‐ | 4,109 |
|
| 784,649 |
Net income (loss) | 100,950 | (18,574) (*) | 179,945 (*) | (21,148) |
| (1,096) | (660) |
|
| (64,053) |
% of capital held | 100 | 100 | 100 | 100 |
| 100 | 100 |
|
| 33 |
(*) Adjusted for intercompany unrealized profits.
(**) Balances are valued using the equity method based on information as of May 31, 2021.
The percentages in the table above are rounded.
The financial information from our business segments is detailed in Note 32.
1
Ultrapar Participações S.A. and Subsidiaries
Notes to the Parent’s Separate and Consolidated Interim Financial Information
(In thousands of Brazilian Reais, unless otherwise stated)
Balances and changes in subsidiaries and joint venture are as follows:
|
| Subsidiaries |
| Joint venture |
|
| ||||||||||||||
|
| Ultracargo - Operações Logísticas e Participações Ltda. |
| Oxiteno S.A. Indústria e Comércio |
| Ipiranga Produtos de Petróleo S.A. |
| UVC |
| Centro de Conveniências Millennium Ltda. |
| Eaí Clube Automobilista S.A. |
| Ultrapar International S.A. |
| Total |
| Refinaria de Petróleo Riograndense S.A. |
| Total |
Balance as of December 31, 2020 |
| 1,420,356 |
| 1,707,136 |
| 7,324,953 |
| 4,358 |
| 9,588 |
| 63,786 |
| ‐ |
| 10,530,177 |
| ‐ |
| 10,530,177 |
Share of profit (loss) of subsidiaries and joint venture |
| 75,949 |
| 59,709 |
| (4,829) |
| (3,017) |
| (1,134) |
| (20,868) |
| 13,872 |
| 119,682 |
| 2,652 |
| 122,334 |
Dividends |
| - |
| (125,114) |
| (204,524) |
| - |
| - |
| - |
| - |
| (329,638) |
| - |
| (329,638) |
Equity instrument granted |
| 614 |
| 446 |
| 2,000 |
| - |
| - |
| 1,525 |
| - |
| 4,585 |
| - |
| 4,585 |
Valuation adjustment of subsidiaries (i) |
| (98) |
| 107,947 |
| (473) |
| - |
| - |
| (12) |
| - |
| 107,364 |
| (1,338) |
| 106,026 |
Gain due to the payments fixed dividends to preferred shares |
| - |
| - |
| 138 |
| - |
| - |
| - |
| - |
| 138 |
| - |
| 138 |
Shareholder transaction – changes of investments |
| - |
| - |
| 79 |
| - |
| - |
| - |
| - |
| 79 |
| - |
| 79 |
Translation adjustments of foreign-based subsidiaries |
| - |
| (37,439) |
| - |
| - |
| - |
| - |
| - |
| (37,439) |
| - |
| (37,439) |
Income and social contribution taxes on actuarial losses of post-employment benefits |
| - |
| - |
| 561 |
| - |
| - |
| - |
| - |
| 561 |
| - |
| 561 |
Capital increase in cash |
| - |
| - |
| - |
| 15,011 |
| - |
| 60,000 |
| - |
| 75,011 |
| - |
| 75,011 |
Transfer to provision for short-term liabilities |
| - |
| - |
| - |
| - |
| - |
| - |
| (13,872) |
| (13,872) |
| (1,314) |
| (15,186) |
Balance as of June 30, 2021 |
| 1,496,821 |
| 1,712,685 |
| 7,117,905 |
| 16,352 |
| 8,454 |
| 104,431 |
| - |
| 10,456,648 |
| - |
| 10,456,648 |
| 53 |
Ultrapar Participações S.A. and Subsidiaries
Notes to the Parent’s Separate and Consolidated Interim Financial Information
(In thousands of Brazilian Reais, unless otherwise stated)
|
| Subsidiaries |
|
|
| Joint venture |
|
| ||||||||||
|
| Ultracargo Operações Logísticas e Participações Ltda. |
| Oxiteno S.A. Indústria e Comércio |
| Ipiranga Produtos de Petróleo S.A. |
| Ultrapar International S.A. |
| UVC |
| Centro de Conveniências Millennium Ltda. |
| Total |
| Refinaria de Petróleo Riograndense S.A. |
| Total |
Balance as of December 31, 2019 |
| 1,261,997 |
| 1,803,209 |
| 7,020,747 |
| (27,497) |
| ‐ |
| ‐ |
| 10,058,456 |
| 18,792 |
| 10,077,248 |
Share of profit (loss) of subsidiaries and joint venture |
| 100,950 |
| (18,574) |
| 179,947 |
| (21,146) |
| (1,096) |
| (660) |
| 239,421 |
| (21,279) |
| 218,142 |
Dividends |
| ‐ |
| (86,954) |
| (129,249) |
| ‐ |
| ‐ |
| ‐ |
| (216,203) |
| (165) |
| (216,368) |
Tax charges on revaluation reserve |
| ‐ |
| ‐ |
| (6) |
| ‐ |
| ‐ |
| ‐ |
| (6) |
| ‐ |
| (6) |
Equity instrument granted |
| 192 |
| 263 |
| 826 |
| ‐ |
| ‐ |
| ‐ |
| 1,281 |
| ‐ |
| 1,281 |
Valuation adjustment of subsidiaries (i) |
| 64 |
| (477,303) |
| 467 |
| ‐ |
| ‐ |
| ‐ |
| (476,772) |
| 1,860 |
| (474,912) |
Translation adjustments of foreign-based subsidiaries |
| ‐ |
| 136,122 |
| ‐ |
| ‐ |
| ‐ |
| ‐ |
| 136,122 |
| ‐ |
| 136,122 |
Capital increase in cash |
| ‐ |
| ‐ |
| ‐ |
| ‐ |
| 3,010 |
| 549 |
| 3,559 |
| ‐ |
| 3,559 |
Loss due to the payments fixed dividends to preferred shares |
| (35) |
| ‐ |
| (481) |
| ‐ |
| ‐ |
| ‐ |
| (516) |
| ‐ |
| (516) |
Shareholder transaction – changes of investments |
| ‐ |
| ‐ |
| (1,189) |
| ‐ |
| ‐ |
| 1,189 |
| ‐ |
| ‐ |
| ‐ |
Balance as of June 30, 2020 |
| 1,363,168 |
| 1,356,763 |
| 7,071,062 |
| (48,643) |
| 1,914 |
| 1,078 |
| 9,745,342 |
| (792) |
| 9,744,550 |
(i) Refers, substantially to the income on the hedging instruments of exchange rate related to firm commitment and highly probable transactions designated as cash flow hedges, see Note 33.h.2.
Ultrapar Participações S.A. and Subsidiaries
Notes to the Parent’s Separate and Consolidated Interim Financial Information
(In thousands of Brazilian Reais, unless otherwise stated)
|
| Provision for short-term liabilities |
|
| ||
|
| Investments in subsidiaries |
| Joint venture |
|
|
|
| Ultrapar International S.A. |
| Refinaria de Petróleo Riograndense S.A. |
| Total |
Balance as of December 31, 2020 |
| 33,698 |
| 2,096 |
| 35,794 |
Transfer to provision for short-term liabilities |
| (13,872) |
| (1,314) |
| (15,186) |
Balance as of June 30, 2021 |
| 19,826 |
| 782 |
| 20,608 |
b. Joint ventures (Consolidated)
The Company holds an interest in Refinaria de Petróleo Riograndense (“RPR”), which is primarily engaged in oil refining.
The subsidiary Ultracargo holds an interest in União Vopak – Armazéns Gerais Ltda. (“União Vopak”), which is primarily engaged in liquid bulk storage in the port of Paranaguá.
The subsidiary IPP holds an interest in ConectCar, which is primarily engaged in automatic payment of tolls and parking in the States of Bahia, Ceará, Espírito Santo, Goiás, Mato Grosso, Mato Grosso do Sul, Minas Gerais, Paraná, Pernambuco, Rio de Janeiro, Rio Grande do Sul, Santa Catarina, São Paulo and Distrito Federal. On June 25, 2021, the sale of ConectCar was announced according Note 3.c.1.
The subsidiary IPP participates in the port concession BEL02A at the port of Miramar, in Belém (PA), through Latitude Logística Portuária S.A. (“Latitude”); for the port of Vitória (ES), participates through Navegantes Logística Portuária S.A. (“Navegantes”); in Cabedelo (PB), has participation in the Nordeste Logística I S.A. ("Nordeste Logística I"), Nordeste Logística II S.A. ("Nordeste Logística II") and Nordeste Logística III S.A. ("Nordeste Logística III”) (see Note 34.c).
These investments of joint ventures Latitude, Navegantes Logística I, Logística II and Logística III are accounted for under the equity method of accounting based on their financial statements as of May 31, 2021, while the other companies are accounted for under the equity method of accounting based on their interim financial information as of June 30, 2021.
Ultrapar Participações S.A. and Subsidiaries
Notes to the Parent’s Separate and Consolidated Interim Financial Information
(In thousands of Brazilian Reais, unless otherwise stated)
Balances and changes in joint ventures are as follows:
| União Vopak |
| RPR |
| ConectCar |
| Latitude Logística |
| Navegantes Logística |
| Nordeste Logística I |
| Nordeste Logística II |
| Nordeste Logística III |
| Total |
Balance as of December 31, 2020 | 7,734 |
| ‐ |
| 81,180 |
| 10,351 |
| 21,624 |
| 824 |
| 7,676 |
| 9,711 |
| 139,100 |
Capital increase | - |
| - |
| 15,000 |
| - |
| - |
| - |
| 6,394 |
| 600 |
| 21,994 |
Valuation adjustments | - |
| (1,338) |
| - |
| - |
| - |
| - |
| - |
| - |
| (1,338) |
Share of profit (loss) of joint ventures | 577 |
| 2,652 |
| (12,324) |
| (1,435) |
| (1,624) |
| 217 |
| (169) |
| 144 |
| (11,962) |
Transfer to provision for short-term liabilities | - |
| (1,314) |
| - |
| - |
| - |
| - |
| - |
| - |
| (1,314) |
Balance as of June 30, 2021 | 8,311 |
| - |
| 83,856 |
| 8,916 |
| 20,000 |
| 1,041 |
| 13,901 |
| 10,455 |
| 146,480 |
|
|
|
|
|
|
|
|
|
|
|
|
|
|
|
|
|
|
| União Vopak |
| RPR |
| ConectCar |
| Latitude Logística |
| Navegantes Logística |
| Nordeste Logística I |
| Nordeste Logística II |
| Nordeste Logística III |
| Total |
Balance as of December 31, 2019 | 7,342 |
| 18,792 |
| 82,818 |
| 10,351 |
| 23,581 |
| 1,930 |
| 4,183 |
| 4,079 |
| 153,076 |
Capital increase | ‐ |
| ‐ |
| 10,000 |
| ‐ |
| ‐ |
| ‐ |
| ‐ |
| ‐ |
| 10,000 |
Valuation adjustments | ‐ |
| 1,860 |
| ‐ |
| ‐ |
| ‐ |
| ‐ |
| ‐ |
| ‐ |
| 1,860 |
Proposed dividends | ‐ |
| (165) |
| ‐ |
| ‐ |
| ‐ |
| ‐ |
| ‐ |
| ‐ |
| (165) |
Share of profit (loss) of joint ventures | 354 |
| (21,279) |
| (6,282) |
| ‐ |
| ‐ |
| ‐ |
| ‐ |
| ‐ |
| (27,207) |
Balance as of June 30, 2020 | 7,696 |
| (792) |
| 86,536 |
| 10,351 |
| 23,581 |
| 1,930 |
| 4,183 |
| 4,079 |
| 137,564 |
| Provision for short-term liabilities |
| RPR |
Balance as of December 31, 2020 | 2,096 |
Transfer to provision for short-term liabilities | (1,314) |
Balance as of June 30, 2021 | 782 |
| 56 |
Ultrapar Participações S.A. and Subsidiaries
Notes to the Parent’s Separate and Consolidated Interim Financial Information
(In thousands of Brazilian Reais, unless otherwise stated)
The table below presents the statements of financial position and statements of profit or loss of joint ventures:
| 06/30/2021 | ||||||||||||||
| União Vopak |
| RPR |
| ConectCar |
| Latitude Logística |
| Navegantes Logística |
| Nordeste Logística I |
| Nordeste Logística II |
| Nordeste Logística III |
Current assets | 9,584 |
| 546,795 |
| 176,478 |
| 21,424 |
| 23,283 |
| 36,201 |
| 38,775 |
| 9,989 |
Non-current assets | 9,744 |
| 166,089 |
| 175,750 |
| 40,276 |
| 166,712 |
| 6,309 |
| 18,141 |
| 52,652 |
Current liabilities | 2,450 |
| 608,056 |
| 165,399 |
| 3,861 |
| 29 |
| 35,059 |
| 1,697 |
| 8,433 |
Non-current liabilities | 256 |
| 107,181 |
| 19,117 |
| 40,007 |
| 129,966 |
| 4,329 |
| 13,515 |
| 22,842 |
Equity | 16,622 |
| (2,353) |
| 167,712 |
| 17,832 |
| 60,000 |
| 3,122 |
| 41,704 |
| 31,366 |
Net revenue from sales and services | 9,534 |
| 992,332 |
| 39,280 |
| - |
| - |
| 1,935 |
| 97 |
| 1,759 |
Costs, operating expenses and income | (7,830) |
| (976,650) |
| (63,928) |
| (2,870) |
| (747) |
| (1,047) |
| (610) |
| (1,167) |
Net finance income and income and social contribution taxes | (550) |
| (7,695) |
| - |
| - |
| (4,125) |
| (238) |
| 7 |
| (161) |
Net income (loss) | 1,154 |
| 7,987 |
| (24,648) |
| (2,870) |
| (4,872) |
| 650 |
| (506) |
| 431 |
Number of shares or units held | 29,995 |
| 5,078,888 |
| 263,768,000 |
| 4,383,881 |
| 22,298,195 |
| 681,637 |
| 3,933,265 |
| 4,871,241 |
% of capital held | 50 |
| 33 |
| 50 |
| 50 |
| 33 |
| 33 |
| 33 |
| 33 |
The percentages in the table above are rounded.
Ultrapar Participações S.A. and Subsidiaries
Notes to the Parent’s Separate and Consolidated Interim Financial Information
(In thousands of Brazilian Reais, unless otherwise stated)
| 12/31/2020 | ||||||||||||
| União Vopak |
| RPR |
| ConectCar |
| Navegantes Logística |
| Nordeste Logística I |
| Nordeste Logística II |
| Nordeste Logística III |
Current assets | 8,510 |
| 291,720 |
| 161,371 |
| 24,691 |
| 972 |
| 18,531 |
| 21,513 |
Non-current assets | 9,796 |
| 171,270 |
| 169,843 |
| 166,389 |
| 6,021 |
| 18,005 |
| 30,503 |
Current liabilities | 2,698 |
| 363,388 |
| 168,854 |
| 8 |
| 4 |
| 5 |
| 6 |
Non-current liabilities | 140 |
| 105,912 |
| ‐ |
| 126,201 |
| 4,516 |
| 13,504 |
| 22,877 |
Equity | 15,468 |
| (6,310) |
| 162,360 |
| 64,871 |
| 2,473 |
| 23,027 |
| 29,133 |
Number of shares or units held | 29,995 |
| 5,078,888 |
| 248,768,000 |
| 22,298,195 |
| 681,637 |
| 3,933,265 |
| 4,871,241 |
% of capital held | 50 |
| 33 |
| 50 |
| 33 |
| 33 |
| 33 |
| 33 |
| 06/30/2020 | ||||
| União Vopak |
| RPR |
| ConectCar |
Net revenue from sales and services | 8,488 |
| 784,649 |
| 45,171 |
Costs, operating expenses and income | (7,264) |
| (861,172) |
| (60,969) |
Net finance income and income and social contribution taxes | (516) |
| 12,470 |
| 3,234 |
Net income (loss) | 708 |
| (64,053) |
| (12,564) |
Number of shares or units held | 29,995 |
| 5,078,888 |
| 248,768,000 |
% of capital held | 50 |
| 33 |
| 50 |
The percentages in the table above are rounded.
| 58 |
Ultrapar Participações S.A. and Subsidiaries
Notes to the Parent’s Separate and Consolidated Interim Financial Information
(In thousands of Brazilian Reais, unless otherwise stated)
c. Associates (Consolidated)
Subsidiary IPP holds an interest in Transportadora Sulbrasileira de Gás S.A. (“TSB”), which is primarily engaged in natural gas transportation services.
Subsidiary Oxiteno S.A. holds an interest in Oxicap Indústria de Gases Ltda. (“Oxicap”), which is primarily engaged in the supply of nitrogen and oxygen for its shareholders in the Mauá petrochemical complex. The subsidiary Oxiteno S.A. holds an interest in Química da Bahia Indústria e Comércio S.A. (“Química da Bahia”), which is primarily engaged in manufacturing, marketing, and processing of chemicals. The operations of Química da Bahia are currently suspended.
Subsidiary Cia. Ultragaz holds an interest in Metalúrgica Plus S.A. (“Metalplus”), which is primarily engaged in the manufacture and trading of LPG containers. The operations of this associate are currently suspended.
Subsidiary Cia. Ultragaz holds an interest in Plenogás Distribuidora de Gás S.A. (“Plenogás”), which is primarily engaged in the marketing of LPG. The operations of this associate are currently suspended.
These investments are accounted for under the equity method of accounting based on the financial statements as of June 30, 2021.
Ultrapar Participações S.A. and Subsidiaries
Notes to the Parent’s Separate and Consolidated Interim Financial Information
(In thousands of Brazilian Reais, unless otherwise stated)
Balances and changes in associates are as follows:
| Transportadora Sulbrasileira de Gás S.A. |
| Oxicap Indústria de Gases Ltda. |
| Química da Bahia Indústria e Comércio S.A. |
| Metalúrgica Plus S.A. |
| Plenogás Distribuidora de Gás S.A. |
| Total |
Balance as of December 31, 2020 | 5,150 |
| 16,348 |
| 3,542 |
| 47 |
| 501 |
| 25,588 |
Dividends | (746) |
| - |
| - |
| - |
| - |
| (746) |
Share of profit (loss) of associates | 1,047 |
| (66) |
| - |
| (48) |
| 88 |
| 1,021 |
Balance as of June 30, 2021 | 5,451 |
| 16,282 |
| 3,542 |
| (1) |
| 589 |
| 25,863 |
| Transportadora Sulbrasileira de Gás S.A. |
| Oxicap Indústria de Gases Ltda. |
| Química da Bahia Indústria e Comércio S.A. |
| Metalúrgica Plus S.A. |
| Plenogás Distribuidora de Gás S.A. |
| Total |
Balance as of December 31, 2019 | 5,661 |
| 15,934 |
| 3,554 |
| 138 |
| 463 |
| 25,750 |
Dividends | (1,808) |
| ‐ |
| ‐ |
| ‐ |
| ‐ |
| (1,808) |
Share of profit (loss) of associates | 1,128 |
| 354 |
| (9) |
| (46) |
| 82 |
| 1,509 |
Balance as of June 30, 2020 | 4,981 |
| 16,288 |
| 3,545 |
| 92 |
| 545 |
| 25,451 |
| 60 |
Ultrapar Participações S.A. and Subsidiaries
Notes to the Parent’s Separate and Consolidated Interim Financial Information
(In thousands of Brazilian Reais, unless otherwise stated)
The table below presents the statements of financial position and statements of profit or loss of associates:
| 06/30/2021 | ||||||||
| Transportadora Sulbrasileira de Gás S.A. |
| Oxicap Indústria de Gases Ltda. |
| Química da Bahia Indústria e Comércio S.A. |
| Metalúrgica Plus S.A. |
| Plenogás Distribuidora de Gás S.A. |
Current assets | 11,931 |
| 70,906 |
| 46 |
| 70 |
| 554 |
Non-current assets | 12,221 |
| 72,594 |
| 10,147 |
| 270 |
| 2,195 |
Current liabilities | 1,751 |
| 28,677 |
| - |
| 40 |
| 231 |
Non-current liabilities | 602 |
| 6,899 |
| 3,109 |
| 302 |
| 752 |
Equity | 21,799 |
| 107,924 |
| 7,084 |
| (2) |
| 1,766 |
Net revenue from sales and services | 7,378 |
| 33,167 |
| - |
| - |
| - |
Costs, operating expenses and income | (2,908) |
| (33,478) |
| - |
| (115) |
| 281 |
Net finance income and income and social contribution taxes | (283) |
| (127) |
| - |
| (30) |
| (18) |
Net income (loss) | 4,187 |
| (438) |
| - |
| (145) |
| 263 |
Number of shares or units held | 20,124,996 |
| 1,987 |
| 1,493,120 |
| 3,000 |
| 1,384,308 |
% of capital held | 25 |
| 15 |
| 50 |
| 33 |
| 33 |
| 12/31/2020 | ||||||||
| Transportadora Sulbrasileira de Gás S.A. |
| Oxicap Indústria de Gases Ltda. |
| Química da Bahia Indústria e Comércio S.A. |
| Metalúrgica Plus S.A. |
| Plenogás Distribuidora de Gás S.A. |
Current assets | 10,570 |
| 65,136 |
| 47 |
| 58 |
| 352 |
Non-current assets | 12,822 |
| 77,339 |
| 10,146 |
| 414 |
| 2,196 |
Current liabilities | 2,189 |
| 26,116 |
| ‐ |
| 28 |
| 154 |
Non-current liabilities | 602 |
| 7,994 |
| 3,109 |
| 302 |
| 890 |
Equity | 20,601 |
| 108,365 |
| 7,084 |
| 142 |
| 1,504 |
Number of shares or units held | 20,124,996 |
| 1,987 |
| 1,493,120 |
| 3,000 |
| 1,384,308 |
% of capital held | 25 |
| 15 |
| 50 |
| 33 |
| 33 |
| 06/30/2020 | ||||||||
| Transportadora Sulbrasileira de Gás S.A. |
| Oxicap Indústria de Gases Ltda. |
| Química da Bahia Indústria e Comércio S.A. |
| Metalúrgica Plus S.A. |
| Plenogás Distribuidora de Gás S.A. |
Net revenue from sales and services | 5,776 |
| 30,335 |
| ‐ |
| ‐ |
| ‐ |
Costs, operating expenses and income | (2,992) |
| (26,412) |
| (18) |
| (112) |
| 265 |
Net finance income and income and social contribution taxes | (261) |
| (1,576) |
| ‐ |
| (29) |
| (18) |
Net income (loss) | 2,523 |
| 2,347 |
| (18) |
| (141) |
| 247 |
Number of shares or units held | 20,124,996 |
| 1,987 |
| 1,493,120 |
| 3,000 |
| 1,384,308 |
% of capital held | 25 |
| 15 |
| 50 |
| 33 |
| 33 |
The percentages in the table above are rounded.
Ultrapar Participações S.A. and Subsidiaries
Notes to the Parent’s Separate and Consolidated Interim Financial Information
(In thousands of Brazilian Reais, unless otherwise stated)
13. Right-of-use assets and leases payable
Some of the subsidiaries of the Company have real estate leases, substantially related to: (i) Ipiranga: fuel stations and distribution centers; (ii) Extrafarma: pharmacies and distribution centers; (iii) Ultragaz: points of sale and bottling bases; (iv) Ultracargo: port areas; and (v) Oxiteno: industrial plant. Some subsidiaries also have lease agreements relating to vehicles.
a. Right-of-use assets
- Parent
| Weighted average useful life (years) | Balance on 12/31/2020 |
| Additions and remeasurement |
| Write-offs |
| Amortization |
| Balance on 06/30/2021 |
Cost: |
|
|
|
|
|
|
|
|
|
|
Real estate | 7 | 41,923 |
| 2,286 |
| - |
| - |
| 44,209 |
Vehicles | 3 | 2,591 |
| 200 |
| (128) |
| - |
| 2,663 |
|
| 44,514 |
| 2,486 |
| (128) |
| - |
| 46,872 |
Accumulated amortization: |
|
|
|
|
|
|
|
|
|
|
Real estate |
| (8,963) |
| - |
| - |
| (2,538) |
| (11,501) |
Vehicles |
| (489) |
| - |
| 27 |
| (446) |
| (908) |
|
| (9,452) |
| - |
| 27 |
| (2,984) |
| (12,409) |
Net amount |
| 35,062 |
| 2,486 |
| (101) |
| (2,984) |
| 34,463 |
Ultrapar Participações S.A. and Subsidiaries
Notes to the Parent’s Separate and Consolidated Interim Financial Information
(In thousands of Brazilian Reais, unless otherwise stated)
- Consolidated
| Weighted average useful life (years) | Balance on 12/31/2020 |
| Additions and remeasurement |
| Write-offs |
| Transfer (i) |
| Effect of foreign currency exchange rate variation |
| Amortization |
| Balance on 06/30/2021 |
Cost: |
|
|
|
|
|
|
|
|
|
|
|
|
|
|
Real estate (ii) | 10 | 2,254,432 |
| 118,441 |
| (69,580) |
| - |
| (875) |
| - |
| 2,302,418 |
Port area | 20 | 268,534 |
| 15,367 |
| (1,559) |
| - |
| - |
| - |
| 282,342 |
Vehicles | 4 | 139,843 |
| 21,232 |
| (7,336) |
| - |
| (77) |
| - |
| 153,662 |
Equipment | 6 | 44,936 |
| 49 |
| (4,335) |
| - |
| (1,154) |
| - |
| 39,496 |
Others | 20 | 27,846 |
| - |
| - |
| - |
| - |
| - |
| 27,846 |
|
| 2,735,591 |
| 155,089 |
| (82,810) |
| - |
| (2,106) |
| - |
| 2,805,764 |
Accumulated amortization: |
|
|
|
|
|
|
|
|
|
|
|
|
|
|
Real estate |
| (481,975) |
| - |
| 34,082 |
| - |
| 391 |
| (140,234) |
| (587,736) |
Port area |
| (3,962) |
| - |
| - |
| (8,993) |
| - |
| (3,429) |
| (16,384) |
Vehicles |
| (63,091) |
| - |
| 5,771 |
| - |
| 47 |
| (23,706) |
| (80,979) |
Equipment |
| (19,619) |
| - |
| 4,646 |
| - |
| 632 |
| (7,364) |
| (21,705) |
Others |
| (16,658) |
| - |
| - |
| - |
| - |
| (613) |
| (17,271) |
|
| (585,305) |
| - |
| 44,499 |
| (8,993) |
| 1,070 |
| (175,346) |
| (724,075) |
Impairment (iii) |
| - |
| (24,212) |
| - |
| - |
| - |
| - |
| (24,212) |
Real estate |
| - |
| (24,212) |
| - |
| - |
| - |
| - |
| (24,212) |
Net amount |
| 2,150,286 |
| 130,877 |
| (38,311) |
| (8,993) |
| (1,036) |
| (175,346) |
| 2,057,477 |
(i) Refers to the amortization of right-of-use assets in the subsidiary Tequimar Vila do Conde Logística Portuária S.A. (“Tequimar Vila do Conde”), which is being capitalized as Construction in progress, as the terminal is under construction.
(ii) Includes lease contracts as presented in Note 8.a.
(iii) Refers to the allocation of the provision for the impairment of Extrafarma's assets (see Note 3.c.1).
Ultrapar Participações S.A. and Subsidiaries
Notes to the Parent’s Separate and Consolidated Interim Financial Information
(In thousands of Brazilian Reais, unless otherwise stated)
b. Leases payable
The changes in leases payable are shown below:
| Parent |
| Consolidated |
Balance as of December 31, 2020 | 37,934 |
| 1,833,288 |
Interest accrued | 1,634 |
| 75,013 |
Payments (i) | (4,131) |
| (218,059) |
Additions and remeasurement | 2,486 |
| 133,813 |
Write-offs | (103) |
| (41,423) |
Effect of foreign currency exchange rate variation | - |
| 13,086 |
Balance as of June 30, 2021 | 37,820 |
| 1,795,718 |
Current | 5,307 |
| 286,617 |
Non-current | 32,513 |
| 1,509,101 |
(i) Includes the amount of R$ 29,237 paid by subsidiary Tequimar Vila do Conde related to port concession grants.
The future disbursements (installments) assumed under leases contracts are presented below:
| 06/30/2021 | ||
| Parent |
| Consolidated |
Up to 1 year | 8,302 |
| 403,363 |
From 1 to 2 years | 8,133 |
| 353,892 |
From 2 to 3 years | 7,348 |
| 319,418 |
From 3 to 4 years | 7,190 |
| 286,761 |
From 4 to 5 years | 6,995 |
| 211,318 |
More than 5 years | 10,942 |
| 1,057,038 |
Total | 48,910 |
| 2,631,790 |
The contracts related to the leases payable are substantially indexed by the IGP-M (General Market Price Index is a measure of Brazilian inflation, calculated by the Getúlio Vargas Foundation).
b.1. Discount rates
The weighted average discount rates for the lease contracts of the Company are:
Contracts for maturity date and discount rate | |
Maturity date of the contracts | Discount rates (% p.a.) |
Up to 5 years | 5.06 |
From 6 to 10 years | 7.26 |
From 11 to 15 years | 7.24 |
More than 15 years | 8.21 |
Ultrapar Participações S.A. and Subsidiaries
Notes to the Parent’s Separate and Consolidated Interim Financial Information
(In thousands of Brazilian Reais, unless otherwise stated)
c. Lease contracts of low amount assets
Subsidiaries Cia. Ultragaz, Bahiana, Extrafarma, IPP, Serma and Oxiteno S.A. have operating lease contracts consider as low value, short term and variable payments for the use of factory and IT equipment’s, vehicles and real states. The subsidiaries have the option to purchase the assets referring to IT equipment at a price equal to the fair value on the date of option, and management does not intend to exercise such option. The future disbursements (payments), assumed as a result of these contracts amount approximately to:
| Up to 1 year | Between 1 and 5 years | Total |
06/30/2021 | 1,783 | 19 | 1,802 |
The amount of lease considered as of low value, short term and variable payments, recognized as an expense for the six-month period ended June 30, 2021 was R$ 27,165 (R$ 11,596 for the six-month period ended June 30, 2020).
d. Inflation effect
The effects of inflation are as follows:
Right to use asset, net | Parent |
| Consolidated |
Nominal base | 34,463 |
| 2,057,477 |
Inflated base | 40,738 |
| 2,433,875 |
| 18.2% |
| 18.3% |
|
|
|
|
Lease liability | Parent |
| Consolidated |
Nominal base | 37,820 |
| 1,795,718 |
Inflated base | 44,096 |
| 2,161,110 |
| 16.6% |
| 20.3% |
|
|
|
|
Financial expense | Parent |
| Consolidated |
Nominal base | 1,634 |
| 75,013 |
Inflated base | 1,926 |
| 91,109 |
| 17.9% |
| 21.5% |
|
|
|
|
Amortization expense | Parent |
| Consolidated |
Nominal base | 2,984 |
| 175,346 |
Inflated base | 3,445 |
| 196,521 |
| 15.4% |
| 12.1% |
Ultrapar Participações S.A. and Subsidiaries
Notes to the Parent’s Separate and Consolidated Interim Financial Information
(In thousands of Brazilian Reais, unless otherwise stated)
14. Property, plant, and equipment
Balances and changes in PP&E are as follows:
- Parent
| Weighted average useful life (years) | Balance on 12/31/2020 |
| Additions |
| Depreciation |
| Balance on 06/30/2021 |
Cost: |
|
|
|
|
|
|
|
|
Buildings | 35 | - |
| 144 |
| - |
| 144 |
Leasehold improvements | 8 | 2,194 |
| 9,728 |
| - |
| 11,922 |
Machinery and equipment | 10 | 82 |
| 42 |
| - |
| 124 |
Furniture and utensils | 8 | 502 |
| 1,811 |
| - |
| 2,313 |
IT equipment | 5 | 13,293 |
| 16 |
| - |
| 13,309 |
|
| 16,071 |
| 11,741 |
| - |
| 27,812 |
Accumulated depreciation: |
|
|
|
|
|
|
|
|
Buildings |
| - |
| - |
| (2) |
| (2) |
Leasehold improvements |
| (178) |
| - |
| (629) |
| (807) |
Machinery and equipment |
| (6) |
| - |
| (6) |
| (12) |
Furniture and utensils |
| (37) |
| - |
| (131) |
| (168) |
IT equipment |
| (1,522) |
| - |
| (1,339) |
| (2,861) |
|
| (1,743) |
| - |
| (2,107) |
| (3,850) |
Net amount |
| 14,328 |
| 11,741 |
| (2,107) |
| 23,962 |
Ultrapar Participações S.A. and Subsidiaries
Notes to the Parent’s Separate and Consolidated Interim Financial Information
(In thousands of Brazilian Reais, unless otherwise stated)
- Consolidated
| Weighted average useful life (years) | Balance on 12/31/2020 |
| Additions |
| Depreciation |
| Transfer (i) |
| Write-offs and disposals |
| Effect of foreign currency exchange rate variation |
| Balance on 06/30/2021 |
Cost: |
|
|
|
|
|
|
|
|
|
|
|
|
|
|
Land | - | 687,108 |
| 1,599 |
| - |
| - |
| (6,809) |
| (1,981) |
| 679,917 |
Buildings | 33 | 2,154,710 |
| 36,240 |
| - |
| 23,533 |
| (14,775) |
| (15,944) |
| 2,183,764 |
Leasehold improvements | 10 | 1,222,822 |
| 8,647 |
| - |
| 41,715 |
| (24,832) |
| (86) |
| 1,248,266 |
Machinery and equipment | 13 | 6,498,362 |
| 85,063 |
| - |
| 245,737 |
| (7,777) |
| (55,171) |
| 6,766,214 |
Automotive fuel/lubricant distribution equipment and facilities | 12 | 3,169,320 |
| 35,820 |
| - |
| 22,631 |
| (15,893) |
| - |
| 3,211,878 |
LPG tanks and bottles | 9 | 776,479 |
| 54,110 |
| - |
| 1,567 |
| (20,796) |
| - |
| 811,360 |
Vehicles | 8 | 310,836 |
| 4,187 |
| - |
| 4,890 |
| (17,879) |
| (74) |
| 301,960 |
Furniture and utensils | 9 | 316,712 |
| 10,868 |
| - |
| 1,113 |
| (9,906) |
| (802) |
| 317,985 |
IT equipment | 5 | 444,844 |
| 9,797 |
| - |
| 1,124 |
| (2,972) |
| (449) |
| 452,344 |
Construction in progress (ii) | - | 580,695 |
| 323,621 |
| - |
| (314,616) |
| - |
| (604) |
| 589,096 |
Advances to suppliers | - | 34,642 |
| 1,448 |
| - |
| (18,377) |
| - |
| - |
| 17,713 |
Imports in progress | - | 866 |
| 3,642 |
| - |
| (308) |
| - |
| (5) |
| 4,195 |
|
| 16,197,396 |
| 575,042 |
| - |
| 9,009 |
| (121,639) |
| (75,116) |
| 16,584,692 |
Ultrapar Participações S.A. and Subsidiaries
Notes to the Parent’s Separate and Consolidated Interim Financial Information
(In thousands of Brazilian Reais, unless otherwise stated)
|
| Balance on 12/31/2020 |
| Additions |
| Depreciation |
| Transfer (i) |
| Write-offs and disposals |
| Effect of foreign currency exchange rate variation |
| Balance on 06/30/2021 |
Accumulated depreciation: |
|
|
|
|
|
|
|
|
|
|
|
|
|
|
Buildings |
| (851,397) |
| - |
| (33,952) |
| (94) |
| 8,698 |
| 4,399 |
| (872,346) |
Leasehold improvements |
| (689,161) |
| - |
| (38,765) |
| 94 |
| 22,974 |
| 16 |
| (704,842) |
Machinery and equipment |
| (3,598,304) |
| - |
| (170,863) |
| - |
| 7,571 |
| 15,807 |
| (3,745,789) |
Automotive fuel/lubricant distribution equipment and facilities |
| (1,906,953) |
| - |
| (89,423) |
| - |
| 10,800 |
| - |
| (1,985,576) |
LPG tanks and bottles |
| (454,651) |
| - |
| (30,124) |
| - |
| 13,142 |
| - |
| (471,633) |
Vehicles |
| (143,854) |
| - |
| (11,466) |
| - |
| 11,077 |
| 77 |
| (144,166) |
Furniture and utensils |
| (191,713) |
| - |
| (11,149) |
| 5 |
| 9,833 |
| 453 |
| (192,571) |
IT equipment |
| (352,256) |
| - |
| (17,744) |
| 6 |
| 2,636 |
| 607 |
| (366,751) |
|
| (8,188,289) |
| - |
| (403,486) |
| 11 |
| 86,731 |
| 21,359 |
| (8,483,674) |
Provision for losses: |
|
|
|
|
|
|
|
|
|
|
|
|
|
|
Land |
| (146) |
| - |
| - |
| - |
| - |
| - |
| (146) |
Leasehold improvements |
| (61) |
| (66,913) (*) |
| - |
| - |
| - |
| 2 |
| (66,972) |
Machinery and equipment |
| (2,857) |
| - |
| - |
| - |
| - |
| 23 |
| (2,834) |
Automotive fuel/lubricant distribution equipment and facilities |
| (73) |
| - |
| - |
| - |
| 13 |
| - |
| (60) |
Advances to suppliers |
| (110) |
| - |
| - |
| - |
| - |
| - |
| (110) |
|
| (3,247) |
| (66,913) |
| - |
| - |
| 13 |
| 25 |
| (70,122) |
Net amount |
| 8,005,860 |
| 508,129 |
| (403,486) |
| 9,020 |
| (34,895) |
| (53,732) |
| 8,030,896 |
(i) Refers to R$ 27 transferred from intangible assets.
(ii) Includes R$ 8,993 transferred from right-of-use assets.
(*) Refers to the allocation of the provision for the impairment of Extrafarma's assets (see Note 3.c.1).
Construction in progress relates substantially to expansions, renovations, constructions and upgrade of industrial facilities, terminals, stores, service stations and distribution bases.
Advances to suppliers is related, basically, to manufacturing of assets for expansion of plants, terminals, stores, service stations and bases and acquisition of real estate.
Ultrapar Participações S.A. and Subsidiaries
Notes to the Parent’s Separate and Consolidated Interim Financial Information
(In thousands of Brazilian Reais, unless otherwise stated)
15. Intangible assets
Balances and changes in intangible assets are as follows:
- Parent
| Weighted average useful life (years) | Balance on 12/31/2020 |
| Additions |
| Amortization |
| Balance on 06/30/2021 |
Cost: |
|
|
|
|
|
|
|
|
Goodwill (a) | - | 246,163 |
| - |
| - |
| 246,163 |
Software (b) | 5 | 9,111 |
| 64 |
| - |
| 9,175 |
|
| 255,274 |
| 64 |
| - |
| 255,338 |
Accumulated amortization: |
|
|
|
|
|
|
|
|
Software |
| (1,032) |
| - |
| (923) |
| (1,955) |
|
| (1,032) |
| - |
| (923) |
| (1,955) |
Net amount |
| 254,242 |
| 64 |
| (923) |
| 253,383 |
Ultrapar Participações S.A. and Subsidiaries
Notes to the Parent’s Separate and Consolidated Interim Financial Information
(In thousands of Brazilian Reais, unless otherwise stated)
- Consolidated
| Weighted average useful life (years) | Balance on 12/31/2020 |
| Additions |
| Amortization |
| Transfer (i) |
| Write-offs and disposals |
| Effect of foreign currency exchange rate variation |
| Balance on 06/30/2021 |
Cost: |
|
|
|
|
|
|
|
|
|
|
|
|
|
|
Goodwill (a) | - | 1,525,088 |
| - |
| - |
| - |
| - |
| - |
| 1,525,088 |
Software (b) | 4 | 1,395,046 |
| 96,181 |
| - |
| (27) |
| (18,117) |
| (1,285) |
| 1,471,798 |
Technology (c) | - | 32,617 |
| - |
| - |
| - |
| - |
| - |
| 32,617 |
Distribution rights | 12 | 133,599 |
| - |
| - |
| - |
| - |
| - |
| 133,599 |
Brands (d) | - | 136,962 |
| - |
| - |
| - |
| - |
| (2,412) |
| 134,550 |
Trademark rights (d) | 39 | 114,792 |
| - |
| - |
| - |
| - |
| - |
| 114,792 |
Others (e) | 10 | 50,698 |
| 669 |
| - |
| - |
| - |
| (1,160) |
| 50,207 |
Decarbonization credits (f) | - | - |
| 59,019 |
| - |
| - |
| (56,661) |
| - |
| 2,358 |
|
| 3,388,802 |
| 155,869 |
| - |
| (27) |
| (74,778) |
| (4,857) |
| 3,465,009 |
Accumulated amortization: |
|
|
|
|
|
|
|
|
|
|
|
|
|
|
Software |
| (825,024) |
| - |
| (98,447) |
| - |
| 18,117 |
| 1,229 |
| (904,125) |
Technology |
| (32,616) |
| - |
| - |
| - |
| - |
| - |
| (32,616) |
Distribution rights |
| (113,326) |
| - |
| (1,696) |
| - |
| - |
| - |
| (115,022) |
Trademark rights |
| (9,056) |
| - |
| (1,469) |
| - |
| - |
| - |
| (10,525) |
Others |
| (32,845) |
| - |
| (72) |
| - |
| - |
| 2 |
| (32,915) |
|
| (1,012,867) |
| - |
| (101,684) |
| - |
| 18,117 |
| 1,231 |
| (1,095,203) |
Provision for losses and impairment: |
|
|
|
|
|
|
|
|
|
|
|
|
|
|
Goodwill (a) |
| (593,280) |
| (68,273) (*) |
| - |
| - |
| - |
| - |
| (661,553) |
Distribution rights |
| - |
| (4,481) (*) |
| - |
| - |
| - |
| - |
| (4,481) |
Brands (d) |
| - |
| (72,523) (*) |
| - |
| - |
| - |
| - |
| (72,523) |
|
| (593,280) |
| (145,277) |
| - |
| - |
| - |
| - |
| (738,557) |
Net amount |
| 1,782,655 |
| 10,592 |
| (101,684) |
| (27) |
| (56,661) |
| (3,626) |
| 1,631,249 |
(i) Refers to amounts transferred to PP&E.
(*) Refers to the allocation of the provision for the impairment of Extrafarma's assets (see Note 3.c.1).
Ultrapar Participações S.A. and Subsidiaries
Notes to the Parent’s Separate and Consolidated Interim Financial Information
(In thousands of Brazilian Reais, unless otherwise stated)
a. Goodwill
The balance of the goodwill is tested annually for impairment and is represented by the following acquisitions:
| Segment | 06/30/2021 |
| 12/31/2020 |
Goodwill on the acquisition of: |
|
|
|
|
Extrafarma | Extrafarma | 661,553 |
| 661,553 |
Extrafarma – impairment | Extrafarma | (661,553) |
| (593,280) |
Extrafarma – net | Extrafarma | - |
| 68,273 |
Ipiranga (1) | Ipiranga | 276,724 |
| 276,724 |
União Terminais | Ultracargo | 211,089 |
| 211,089 |
Texaco | Ipiranga | 177,759 |
| 177,759 |
Iconic (CBLSA) | Ipiranga | 69,807 |
| 69,807 |
Oxiteno Uruguay | Oxiteno | 44,856 |
| 44,856 |
Temmar | Ultracargo | 43,781 |
| 43,781 |
DNP | Ipiranga | 24,736 |
| 24,736 |
Repsol | Ultragaz | 13,403 |
| 13,403 |
TEAS | Ultracargo | 797 |
| 797 |
Others | Oxiteno | 583 |
| 583 |
|
| 863,535 |
| 931,808 |
(1) Including R$ 246,163 at Ultrapar.
On December 31, 2020, the Company tested the balances of goodwill shown in the table above for impairment. The determination of value in use involves assumptions, judgments, and estimates of cash flows, such as growth rates of revenues, costs and expenses, estimates of investments and working capital, and discount rates. The assumptions about growth projections and future cash flows are based on the Company’s business plan of its operating segments, as well as comparable market data, and represent management’s best estimate of the economic conditions that will exist over the economic life of the various CGUs, to which goodwill is related. The main key-assumptions used by the Company to calculate the value in use are described below:
Period of evaluation: the evaluation of the value in use is calculated for a period of five years (except the Extrafarma segment), after which the Company calculated the perpetuity, considering the possibility of carrying the business on indefinitely. For the Extrafarma segment, a period of ten years was used due to a four-year period to maturity of new stores were considered.
Discount and real growth rates: on December 31, 2020, the discount and real growth rates used to extrapolate the projections ranged from 8.5% to 11.0% and from 0% to 1% p.a., respectively, depending on the CGU analyzed.
Revenue from sales and services, costs and expenses, and gross margin considers the budget prepared for 2021 and the long-term strategic plan prepared by management and approved by the Board of Directors.
Ultrapar Participações S.A. and Subsidiaries
Notes to the Parent’s Separate and Consolidated Interim Financial Information
(In thousands of Brazilian Reais, unless otherwise stated)
On June 30, 2021, the Company realized the recovery test of the balance of goodwill and net assets of the subsidiary Extrafarma, considering the amount of the transaction mentioned in Note 3.c.1. The test indicated the need to recognize a loss in the quarter for the goodwill balance in the amount of R$ 68,273.
b. Software
Includes user licenses and costs for the implementation of the various systems used by the Company and its subsidiaries: integrated management and control, financial management, foreign trade, industrial automation, operational and storage management, accounting information, and other systems. Also include expenses related to software in progress in the amount of R$ 37,338 on June 30, 2021 (R$ 35,718 on December 31, 2020).
c. Technology
The subsidiaries Oxiteno S.A. and Oleoquímica recognize as technology certain rights of use held by them. Such licenses include the production of ethylene oxide, ethylene glycols, ethanolamines, glycol ethers, ethoxylates, solvents, fatty acids from vegetable oils, fatty alcohols, and specialty chemicals, which are products that are supplied to various industries.
d. Brands and trademark rights
Brands are represented by the acquisition cost of the ‘am/pm’ brand in Brazil and of the Extrafarma brand, acquired in the business combination, and Chevron and Texaco trademark rights.
e. Other intangibles
Refers mainly to the loyalty program “Clube Extrafarma”.
f. Decarbonization credits
Represent the CBIOS acquired and recorded at acquisition cost. The amount in the “write-offs” column refers to CBIOS retired in the period, that can not be the object of future negotiation.
Ultrapar Participações S.A. and Subsidiaries
Notes to the Parent’s Separate and Consolidated Interim Financial Information
(In thousands of Brazilian Reais, unless otherwise stated)
16. Loans, financing, debentures and hedge derivative financial instruments
a. Composition
- Parent
Description | 06/30/2021 |
| 12/31/2020 |
| Index/ Currency | Weighted average financial charges 06/30/2021 – % p.a. | Maturity |
Brazilian Reais: |
|
|
|
|
|
|
|
Debentures – 6th issuance (f.5) | 1,740,885 |
| 1,734,113 |
| DI | 105.3 | 2023 |
Notes – Ultrapar (g.1) | - |
| 1,038,499 |
| R$ + DI | - | 2021 |
Total | 1,740,885 |
| 2,772,612 |
|
|
|
|
Current | 16,396 |
| 1,048,495 |
|
|
|
|
Non-current | 1,724,489 |
| 1,724,117 |
|
|
|
|
Ultrapar Participações S.A. and Subsidiaries
Notes to the Parent’s Separate and Consolidated Interim Financial Information
(In thousands of Brazilian Reais, unless otherwise stated)
- Consolidated
Description | 06/30/2021 |
| 12/31/2020 |
| Index/ Currency | Weighted average financial charges 06/30/2021 – % p.a. | Maturity |
Foreign currency: |
|
|
|
|
|
|
|
Notes in the foreign market (b) (*) | 6,997,727 |
| 7,267,687 |
| US$ | 5.3 | 2026 to 2029 |
Foreign loan (c.1) (*) | 1,001,449 |
| 1,047,644 |
| US$ | 3.9 | 2021 to 2023 |
Financial institutions (d) | 298,675 |
| 312,200 |
| US$ + LIBOR (1) | 1.4 | 2021 |
Foreign loan (c.1) (*) | 254,009 |
| 261,284 |
| US$ + LIBOR (1) | 1.0 | 2022 |
Financial institutions (d) | 158,285 |
| 154,783 |
| US$ | 2.4 | 2021 |
Financial institutions (d) | 37,875 |
| 39,350 |
| MX$ (2) | 8.1 | 2021 |
Advances on foreign exchange contracts | - |
| 105,579 |
| US$ | - | 2021 |
Total foreign currency | 8,748,020 |
| 9,188,527 |
|
|
|
|
|
|
|
|
|
|
|
|
Brazilian Reais: |
|
|
|
|
|
|
|
Debentures – CRA (f.2, f.4 and f.6) | 2,046,156 |
| 2,037,602 |
| DI | 95.8 | 2022 to 2023 |
Debentures – 6ª issuance (f.5) | 1,740,885 |
| 1,734,113 |
| DI | 105.3 | 2023 |
Debentures – Ipiranga (f.1 and f.3) | 1,532,682 |
| 1,679,036 |
| DI | 105.0 | 2021 to 2022 |
Debentures – CRA (f.2, f.4 and f.6) (*) | 978,294 |
| 1,000,824 |
| IPCA | 4.6 | 2024 to 2025 |
Debentures – Ultracargo Logística and Tequimar Vila do Conde (f.8 and f.9) (*) | 474,764 |
| - |
| IPCA | 4.1 | 2028 |
Banco do Brasil (e) | 203,687 |
| 407,420 |
| DI | 110.9 | 2022 |
Debentures – Ultracargo Logística (f.7) (*) | 85,568 |
| 92,541 |
| R$ | 6.5 | 2024 |
Bank Credit Bill | 50,644 |
| 50,692 |
| R$ + DI | 2.0 | 2022 |
FINEP | 24,037 |
| 29,803 |
| TJLP (3) | 1.6 | 2021 to 2023 |
Notes - Ultrapar (g.1) | - |
| 1,038,499 |
| R$ + DI | - | 2021 |
Total in Brazilian Reais | 7,136,717 |
| 8,070,530 |
|
|
|
|
Total foreign currency and Brazilian Reais | 15,884,737 |
| 17,259,057 |
|
|
|
|
Currency and interest rate hedging instruments (**) | 220,894 |
| 117,159 |
|
|
|
|
Total | 16,105,631 |
| 17,376,216 |
|
|
|
|
Current | 3,029,295 |
| 3,255,944 |
|
|
|
|
Non-current | 13,076,336 |
| 14,120,272 |
|
|
|
|
(*) These transactions were designated for hedge accounting (see Note 33.h).
(**) Accumulated losses (see Note 33.i).
(1) LIBOR = London Interbank Offered Rate.
(2) MX$ = Mexican Peso.
(3) TJLP (Long-term Interest Rate) = set by the National Monetary Council, TJLP is the basic financing cost of Banco Nacional de Desenvolvimento Econômico e Social (“BNDES”), the Brazilian Development Bank. On June 30, 2021, TJLP was fixed at 4.61% p.a.
Ultrapar Participações S.A. and Subsidiaries
Notes to the Parent’s Separate and Consolidated Interim Financial Information
(In thousands of Brazilian Reais, unless otherwise stated)
The changes in loans, financing, debentures and hedge derivative financial instruments are shown below:
| Parent |
| Consolidated |
Balance as of December 31, 2020 | 2,772,612 |
| 17,376,216 |
New loans and debentures with cash effect | - |
| 493,594 |
Interest accrued | 38,196 |
| 362,165 |
Principal payment | (1,000,000) |
| (1,518,163) |
Interest payment | (69,923) |
| (352,645) |
Monetary and exchange rate variation | - |
| (288,417) |
Change in fair value | - |
| (70,854) |
Hedge result | - |
| 103,735 |
Balance as of June 30, 2021 | 1,740,885 |
| 16,105,631 |
The long-term consolidated debt had the following principal maturity schedule:
| Parent |
| Consolidated | ||||
| 06/30/2021 |
| 12/31/2020 |
| 06/30/2021 |
| 12/31/2020 |
From 1 to 2 years | 1,724,489 |
| (750) |
| 3,199,957 |
| 2,702,626 |
From 2 to 3 years | - |
| 1,724,867 |
| 1,762,479 |
| 3,091,641 |
From 3 to 4 years | - |
| - |
| 335,498 |
| 784,778 |
From 4 to 5 years | - |
| - |
| 309,622 |
| 231,271 |
More than 5 years | - |
| - |
| 7,468,780 |
| 7,309,956 |
| 1,724,489 |
| 1,724,117 |
| 13,076,336 |
| 14,120,272 |
The transaction costs and issuance premiums associated with debt issuance were added to their financial liabilities, as shown in Note 16.h.
The Company’s management entered into hedging instruments against foreign exchange and interest rate variations for a portion of its debt obligations (see Note 33.h).
Ultrapar Participações S.A. and Subsidiaries
Notes to the Parent’s Separate and Consolidated Interim Financial Information
(In thousands of Brazilian Reais, unless otherwise stated)
b. Notes in the foreign market
On October 6, 2016 the subsidiary Ultrapar International S.A. (“Ultrapar International”) issued US$ 750,000 (equivalent to R$ 3,751,650 as of June 30, 2021) in notes in the foreign market, maturing in October 2026, with interest rate of 5.25% p.a., paid semiannually. The issue price was 98.097% of the face value of the note. The notes were guaranteed by the Company and its subsidiary IPP. The Company has designated hedge relationships for this transaction (see Notes 33.h.2 and 33.h.3).
On June 6, 2019 the subsidiary Ultrapar International issued US$ 500,000 (equivalent to R$ 2,501,100 as of June 30, 2021) in notes in the foreign market, maturing in June 2029, with interest rate of 5.25% p. a., paid semiannually. The issue price was 100% of the face value of the note. The notes were guaranteed by the Company and its subsidiary IPP. The Company has designated hedge relationships for part of this transaction (see Note 33.h.3).
On June 21 2019, the subsidiary Ultrapar International repurchased US$ 200,000 (equivalent to R$ 1,000,440 as of June 30, 2021) in notes in the foreign market maturing in October 2026.
On July 13, 2020 the subsidiary Ultrapar International made the reopening of notes in the foreign market issued in 2019, realizing new issuance in the amount of US$ 350,000 (equivalent to R$ 1,750,770 as of June 30, 2021) maturing in June 2029, to the coupon (interest) and yield of 5.25% per year, paid semiannually. The issue price was 99.994% of face value of the note. The notes were guaranteed by the Company and the subsidiary IPP.
As a result of the issuance of the notes in the foreign market the Company and its subsidiaries are required to perform certain obligations, including:
- Restriction on sale of all or substantially all assets of the Company and subsidiaries Ultrapar International and IPP;
- Restriction on encumbrance of assets exceeding US$ 150,000 (equivalent to R$ 750,330 as of June 30, 2021) or 15% of the amount of the consolidated tangible assets.
The Company and its subsidiaries are in compliance with the levels of covenants required by this debt. The restrictions imposed on the Company and its subsidiaries are customary in transactions of this nature and have not limited their ability to conduct their business to date.
Ultrapar Participações S.A. and Subsidiaries
Notes to the Parent’s Separate and Consolidated Interim Financial Information
(In thousands of Brazilian Reais, unless otherwise stated)
c. Foreign loans
c.1. The subsidiary IPP has foreign loans in the amount of US$ 235,000 (equivalent to R$ 1,175,517 as of June 30, 2021). IPP also contracted hedging instruments with floating interest rate in U.S. dollar and exchange rate variation, changing the foreign loans charges, on average, to 104.1% of DI. IPP designated these hedging instruments as a fair value hedge (see Note 33.h.1). Therefore, loans and hedging instruments are both measured at fair value from inception, with changes in fair value recognized through profit or loss. The foreign loans are secured by the Company.
The foreign loans have the maturity distributed as follows:
Maturity | US$ |
| R$ |
| Cost in % of DI |
Charges (1) | 15,981 |
| 79,941 |
| - |
Jul/2021 | 60,000 |
| 300,132 |
| 101.8 |
Jun/2022 | 50,000 |
| 250,110 |
| 105.0 |
Sep/2023 | 60,000 |
| 300,132 |
| 105.0 |
Sep/2023 | 65,000 |
| 325,143 |
| 104.8 |
Total / average cost | 250,981 |
| 1,255,458 |
| 104.1 |
(1) Includes interest, transaction costs and mark to market.
d. Financial institutions
The subsidiaries Oxiteno Mexico S.A. de C.V., Oxiteno USA LLC (“Oxiteno USA”) and Oxiteno Uruguay have loans for investments and working capital.
The subsidiary Oxiteno USA has loans with bearing interest of LIBOR + 1.4% and maturity as shown below:
Maturity | US$ |
| R$ |
Charges (1) | 3 |
| 13 |
Sep/2021 | 60,000 |
| 298,662 |
Total | 60,003 |
| 298,675 |
(1) Includes interest.
The proceeds of this loan were used in the working capital and to fund the construction of a new alkoxylation plant in the state of Texas.
Ultrapar Participações S.A. and Subsidiaries
Notes to the Parent’s Separate and Consolidated Interim Financial Information
(In thousands of Brazilian Reais, unless otherwise stated)
e. Banco do Brasil
The subsidiary IPP has floating interest rate loans with Banco do Brasil to marketing, processing, or manufacturing of agricultural goods (ethanol).
These loans mature, as follows (includes accrued interest through June 30, 2021):
Maturity |
| 06/30/2021 |
May/2022 |
| 203,687 |
Total |
| 203,687 |
f. Debentures
f.1 In May 2016 the subsidiary IPP made its fourth issuance of public debentures, in one single series of 500 simple, nominative, registered debentures, nonconvertible into shares and unsecured, which main characteristics are as follows:
Face value unit: | R$ 1,000,000.00 |
Final maturity: | May 25, 2021 |
Payment of the face value: | Annual as from May 2019 |
Interest: | 105.0% of DI |
Payment of interest: | Semiannually |
Reprice: | Not applicable |
Subsidiary IPP paid in advance its fourth public issuance of debentures upon maturity.
f.2 In April 2017 the subsidiary IPP carried out its fifth issuance of debentures, in two series, being one of 660,139 and another of 352,361, simple, nonconvertible into shares, nominative, book-entry and unsecured debentures. The debentures have been subscribed by Eco Consult – Consultoria de Operações Financeiras Agropecuárias Ltda. The proceeds from this issuance were used exclusively for the purchase of ethanol by subsidiary IPP.
The debentures were later assigned and transferred to Eco Securitizadora de Direitos Creditórios do Agronegócio S.A. that acquired these agribusiness credit rights with the purpose to bind the issuance of Certificates of Agribusiness Receivables (CRA). The debentures have an additional guarantee from Ultrapar and the main characteristics of the debentures are as follows:
Amount: | 660,139 |
Face value unit: | R$ 1,000.00 |
Final maturity: | April 18, 2022 |
Payment of the face value: | Lump sum at final maturity |
Interest: | 95.0% of DI |
Payment of interest: | Semiannually |
Reprice: | Not applicable |
Ultrapar Participações S.A. and Subsidiaries
Notes to the Parent’s Separate and Consolidated Interim Financial Information
(In thousands of Brazilian Reais, unless otherwise stated)
Amount: | 352,361 |
Face value unit: | R$ 1,000.00 |
Final maturity: | April 15, 2024 |
Payment of the face value: | Lump sum at final maturity |
Interest: | IPCA + 4.68% |
Payment of interest: | Annually |
Reprice: | Not applicable |
The subsidiary IPP contracted hedging instruments subjected to IPCA variation, changing the debentures charges linked to IPCA to 93.9% of DI. IPP designated these hedging instruments as fair value hedges; therefore, debentures and hedging instruments are both measured at fair value from inception, with changes in fair value recognized through profit or loss.
f.3 In July 2017 the subsidiary IPP made its sixth issuance of public debentures, in one single series of 1,500,000 simple, nonconvertible into shares and unsecured debentures, which main characteristics are as follows:
Face value unit: | R$ 1,000.00 |
Final maturity: | July 28, 2022 |
Payment of the face value: | Annual as from July 2021 |
Interest: | 105.0% of DI |
Payment of interest: | Annually |
Reprice: | Not applicable |
f.4 In October 2017 the subsidiary IPP carried out its seventh issuance of debentures in the amount of R$ 944,077, in two series, being on of 730,384 and another of 213,693, simple, nonconvertible into shares, nominative, book-entry and unsecured debentures. The debentures have been subscribed by Vert Companhia Securitizadora. The proceeds from this issuance were used exclusively for the purchase of ethanol by subsidiary IPP.
The debentures were later assigned and transferred to Vert Créditos Ltda., that acquired these agribusiness credit rights with the purpose to bind the issuance of Certificates of Agribusiness Receivables (CRA). The financial settlement occurred on November 1, 2017. The debentures have an additional guarantee from Ultrapar and the main characteristics of the debentures are as follows:
Amount: | 730,384 |
Face value unit: | R$ 1,000.00 |
Final maturity: | October 24, 2022 |
Payment of the face value: | Lump sum at final maturity |
Interest: | 95.0% of DI |
Payment of interest: | Semiannually |
Reprice: | Not applicable |
Amount: | 213,693 |
Face value unit: | R$ 1,000.00 |
Final maturity: | October 24, 2024 |
Payment of the face value: | Lump sum at final maturity |
Interest: | IPCA + 4.34% |
Payment of interest: | Annually |
Reprice: | Not applicable |
Ultrapar Participações S.A. and Subsidiaries
Notes to the Parent’s Separate and Consolidated Interim Financial Information
(In thousands of Brazilian Reais, unless otherwise stated)
The subsidiary IPP contracted hedging instruments subjected to IPCA variation, changing the debentures charges linked to IPCA to 97.3% of DI. IPP designated these hedging instruments as fair value hedges; therefore, debentures and hedging instruments are both measured at fair value from inception, with changes in fair value recognized through profit or loss.
f.5 In March 2018 the Company made its sixth issuance of public debentures, in a single series of 1,725,000 simple, nonconvertible into shares and unsecured debentures, which main characteristics are as follows:
Face value unit: | R$ 1,000.00 |
Final maturity: | March 5, 2023 |
Payment of the face value: | Lump sum at final maturity |
Interest: | 105.25% of DI |
Payment of interest: | Semiannually |
Reprice: | Not applicable |
f.6 In December 2018 the subsidiary IPP carried out its eighth issuance of debentures in the amount of R$ 900,000, in two series, being one of 660,000 and another of 240,000, simple, nonconvertible into shares, nominative, book-entry and unsecured debentures. The debentures have been subscribed by Vert Companhia Securitizadora. The proceeds from this issuance were used exclusively for the purchase of ethanol by subsidiary IPP. The debentures were subscribed with the purpose to bind the issuance of CRA. The financial settlement occurred on December 21, 2018. The debentures have an additional guarantee from Ultrapar and the main characteristics of the debentures are as follows:
Amount: | 660,000 |
Face value unit: | R$ 1,000.00 |
Final maturity: | December 18, 2023 |
Payment of the face value: | Lump sum at final maturity |
Interest: | 97.5% of DI |
Payment of interest: | Semiannually |
Reprice: | Not applicable |
Amount: | 240,000 |
Face value unit: | R$ 1,000.00 |
Final maturity: | December 15, 2025 |
Payment of the face value: | Lump sum at final maturity |
Interest: | IPCA + 4.61% |
Payment of interest: | Annually |
Reprice: | Not applicable |
The subsidiary IPP contracted hedging instruments subjected to IPCA variation, changing the debentures charges linked to IPCA to 97.1% of DI. IPP designated these hedging instruments as fair value hedges; therefore, debentures and hedging instruments are both measured at fair value from inception, with changes in fair value recognized through profit or loss.
Ultrapar Participações S.A. and Subsidiaries
Notes to the Parent’s Separate and Consolidated Interim Financial Information
(In thousands of Brazilian Reais, unless otherwise stated)
f.7 In November 2019 the subsidiary Ultracargo Logística made its first issuance of debentures, in a single series of 90,000 simple, nonconvertible into shares and unsecured debentures, which main characteristics are as follows:
Face value unit: | R$ 1,000.00 |
Final maturity: | November 19, 2024 |
Payment of the face value: | Lump sum at final maturity |
Interest: | 6.47% |
Payment of interest: | Semiannually |
Reprice: | Not applicable |
The subsidiary Ultracargo Logística contracted hedging instruments subjected interest rate variation, changing the debentures fixed for 99.94% of the DI. Ultracargo Logística designated these hedging instruments as fair value hedges therefore debentures and hedging instruments are both measured at fair value from inception, with changes in fair value recognized in profit or loss.
f.8 In March 2021 the subsidiary Tequimar Vila do Conde made its first issuance of debentures, in a single series of 360,000 simple, nonconvertible into shares and unsecured debentures, which main characteristics are as follows:
Face value unit: | R$ 1,000.00 |
Final maturity: | March 15, 2028 |
Payment of the face value: | Lump sum at final maturity |
Interest: | IPCA + 4.04% |
Payment of interest: | Semiannually |
Reprice: | Not applicable |
The subsidiary Tequimar Vila do Conde contracted hedging instruments subjected interest rate variation changing the debentures fixed for 111.4% of the DI. Tequimar Vila do Conde designated these hedging instruments as fair value hedges therefore debentures and hedging instruments are both measured at fair value from inception with changes in fair value recognized in profit or loss.
f.9 In March 2021 the subsidiary Ultracargo Logística made its second issuance of debentures, in a single series of 100,000 simple, nonconvertible into shares and unsecured debentures, which main characteristics are as follows:
Face value unit: | R$ 1,000.00 |
Final maturity: | March 15, 2028 |
Payment of the face value: | Lump sum at final maturity |
Interest: | IPCA + 4.37% |
Payment of interest: | Semiannually |
Reprice: | Not applicable |
The subsidiary Ultracargo Logística contracted hedging instruments subjected interest rate variation changing the debentures fixed for 111.4% of the DI. Ultracargo Logística designated these hedging instruments as fair value hedges therefore debentures and hedging instruments are both measured at fair value from inception with changes in fair value recognized in profit or loss.
Ultrapar Participações S.A. and Subsidiaries
Notes to the Parent’s Separate and Consolidated Interim Financial Information
(In thousands of Brazilian Reais, unless otherwise stated)
The debentures have maturity dates distributed as shown below (includes accrued interest through June 30, 2021):
Maturity |
| 06/30/2021 |
Charges (1) |
| 79,459 |
Jul/2021 |
| 750,000 |
Apr/2022 |
| 660,139 |
Jul/2022 |
| 750,000 |
Oct/2022 |
| 730,384 |
Mar/2023 |
| 1,725,000 |
Dec/2023 |
| 660,000 |
Apr/2024 |
| 419,203 |
Oct/2024 |
| 252,370 |
Nov/2024 |
| 90,000 |
Dec/2025 |
| 271,274 |
Mar/2028 |
| 470,520 |
Total |
| 6,858,349 |
(1) Includes interest, transaction cost and mark to market.
g. Notes
g.1 In April 2020 the Company made its second public issuance of notes in a single series of 40 commercial notes, not convertible into shares, of unsecured type, whose main characteristics are:
Face value unit: | R$ 25,000,000.00 |
Final maturity: | April 6, 2021 |
Payment of the face value: | Lump sum at final maturity |
Interest: | DI + 3.10% |
Payment of interest: | Lump sum at final maturity |
Reprice: | Not applicable |
The Company paid in advance its second public issuance of notes on maturity.
h. Transaction costs
Transaction costs incurred in issuing debt were deducted from the value of the related financial instruments and are recognized as an expense according to the effective interest rate method as follows:
| Effective rate of transaction costs (% p.a.) |
| Balance on 12/31/2020 |
| Incurred cost |
| Amortization |
| Balance on 06/30/2021 |
Debentures (f) | 0.2 |
| 28,348 |
| 10,529 |
| (6,730) |
| 32,147 |
Notes in the foreign market (b) | 0.1 |
| 37,112 |
| - |
| (2,424) |
| 34,688 |
Notes (g) | 0.5 |
| 1,318 |
| - |
| (1,318) |
| - |
Banco do Brasil (e) | 0.1 |
| 332 |
| - |
| (165) |
| 167 |
Total |
|
| 67,110 |
| 10,529 |
| (10,637) |
| 67,002 |
Ultrapar Participações S.A. and Subsidiaries
Notes to the Parent’s Separate and Consolidated Interim Financial Information
(In thousands of Brazilian Reais, unless otherwise stated)
The amount to be appropriated to profit or loss in the future is as follows:
| Up to 1 year |
| 1 to 2 years |
| 2 to 3 years |
| 3 to 4 years |
| 4 to 5 years |
| More than 5 years |
| Total |
Debentures (f) | 12,916 |
| 8,207 |
| 4,845 |
| 1,965 |
| 1,616 |
| 2,598 |
| 32,147 |
Notes in the foreign market (b) | 4,891 |
| 4,895 |
| 4,911 |
| 4,901 |
| 4,905 |
| 10,185 |
| 34,688 |
Banco do Brasil (e) | 167 |
| - |
| - |
| - |
| - |
| - |
| 167 |
Total | 17,974 |
| 13,102 |
| 9,756 |
| 6,866 |
| 6,521 |
| 12,783 |
| 67,002 |
i. Guarantees
The financings are guaranteed by collateral in the amount of R$ 76,086 as of June 30, 2021 (R$ 75,251 as of December 31, 2020) and by guarantees and promissory notes in the amount of R$ 13,717,405 as of June 30, 2021 (R$ 13,758,033 as of December 31, 2020).
The Company and its subsidiaries offer collateral in the form of letters of credit for commercial and legal proceedings in the amount of R$ 121,256 as of June 30, 2021 (R$ 129,139 as of December 31, 2020).
Some subsidiaries of Company issue collateral to financial institutions in connection with the amounts owed by some of their customers to such institutions (vendor financing) as follows:
| IPP | ||
| 06/30/2021 |
| 12/31/2020 |
Maximum amount of future payments related to these collaterals | 431,925 |
| 330,944 |
Maturities of up to | 49 months |
| 46 months |
Fair value of collaterals | 8,236 |
| 5,496 |
If a subsidiary is required to make any payment under these collaterals, this subsidiary may recover the amount paid directly from its customers through commercial collection. Until June 30, 2021 the subsidiaries did not have losses in connection with these collaterals. The fair value of collaterals is recognized in current liabilities as “other payables”, which is recognized in the statement of profit or loss as customers settle their obligations with the financial institutions.
Ultrapar Participações S.A. and Subsidiaries
Notes to the Parent’s Separate and Consolidated Interim Financial Information
(In thousands of Brazilian Reais, unless otherwise stated)
17. Trade payables
a. Trade payables
| Parent |
| Consolidated | ||||
| 06/30/2021 |
| 12/31/2020 |
| 06/30/2021 |
| 12/31/2020 |
Domestic suppliers | 25,935 |
| 16,870 |
| 2,468,232 |
| 2,306,398 |
Domestic suppliers – related parties (see Note 8.a.2) | - |
| - |
| 7,722 |
| 5,102 |
Foreign suppliers | - |
| - |
| 451,588 |
| 307,486 |
Foreign suppliers - related parties (see Note 8.a.2) | - |
| - |
| 130,847 |
| 126,033 |
| 25,935 |
| 16,870 |
| 3,058,389 |
| 2,745,019 |
b. Trade payables – reverse factoring
| Consolidated | ||
| 06/30/2021 |
| 12/31/2020 |
Domestic suppliers – reverse factoring | 1,976,177 |
| 1,021,424 |
Domestic suppliers – reverse factoring - related parties (see Note 8.a.2) | 142,695 |
| 61,989 |
Foreign suppliers – reverse factoring | 315,338 |
| 212,220 |
| 2,434,210 |
| 1,295,633 |
Some subsidiaries of the Company entered into an agreements with a financial institutions. These agreements consist in the anticipation of the receipt of trade payables by the supplier, in which the financial institutions prepay a certain amount from the supplier, and receives on the maturity date the amount payable by the subsidiaries of the Company. The decision to join this type of transaction is solely and exclusively of the supplier. The agreement does not substantially change the main characteristics of the commercial conditions previously established between the subsidiaries of the Company and the suppliers. These transactions are presented in operating activities in the statements of cash flow.
Some Company’s subsidiaries acquire oil-based fuels and LPG from Petrobras and its subsidiaries and ethylene from Braskem S.A. These suppliers control almost all the markets for these products in Brazil.
18. Salaries and related charges
| Parent |
| Consolidated | ||||
| 06/30/2021 |
| 12/31/2020 |
| 06/30/2021 |
| 12/31/2020 |
Provisions on salaries | 11,212 |
| 7,886 |
| 237,772 |
| 195,286 |
Profit sharing, bonus and premium | 14,396 |
| 27,779 |
| 112,617 |
| 184,306 |
Social charges | 6,372 |
| 5,632 |
| 70,209 |
| 73,267 |
Others | 548 |
| 1,103 |
| 13,619 |
| 15,771 |
| 32,528 |
| 42,400 |
| 434,217 |
| 468,630 |
Ultrapar Participações S.A. and Subsidiaries
Notes to the Parent’s Separate and Consolidated Interim Financial Information
(In thousands of Brazilian Reais, unless otherwise stated)
19. Taxes payable
|
| Parent |
| Consolidated | ||||
|
| 06/30/2021 |
| 12/31/2020 |
| 06/30/2021 |
| 12/31/2020 |
ICMS |
| - |
| - |
| 178,653 |
| 180,522 |
IPI |
| - |
| - |
| 14,319 |
| 8,952 |
PIS and COFINS |
| 474 |
| 569 |
| 9,327 |
| 13,187 |
ISS |
| 54 |
| 49 |
| 42,499 |
| 38,328 |
Value-added tax (IVA) of foreign subsidiaries |
| - |
| - |
| 21,648 |
| 27,322 |
Others |
| 213 |
| 194 |
| 22,330 |
| 17,703 |
|
| 741 |
| 812 |
| 288,776 |
| 286,014 |
20. Employee benefits and private pension plan (Consolidated)
a. ULTRAPREV - Associaçăo de Previdência Complementar
In February 2001 the Company’s Board of Directors approved the adoption of a defined contribution pension plan to be sponsored by the Company and its subsidiaries. Participating employees have been contributing to this plan, managed by Ultraprev - Associação de Previdência Complementar (“Ultraprev”), since August 2001. Under the terms of the plan, every year each participating employee chooses his or her basic contribution to the plan. Each sponsoring company provides a matching contribution in an amount equivalent to each basic contribution, up to a limit of 11% of the employee’s reference salary, according to the rules of the plan. As participating employees retire, they may choose to receive either (i) a monthly sum ranging between 0.3% and 1.0% of their respective accumulated fund in Ultraprev or (ii) a fixed monthly amount, which will exhaust their respective accumulated fund over a period of 5 to 35 years. The Company and its subsidiaries do not take responsibility for guaranteeing amounts or the duration of the benefits received by the retired employee.
In May 2020 the Deliberative Council of Ultraprev approved the use of the reversion fund in the amount of R$ 47,088, and in May 2021 the additional use in the amount of R$ 3,706. The amount of R$ 20,214 was used to deduct the sponsors’ normal contributions. The balance of R$ 30,580 on June 30, 2021 will be used to deduct normal sponsor contributions in a period up to 60 months depending on the sponsor.
For the six-month period ended June 30, 2021, the subsidiaries contributed to Ultraprev with R$ 11,763, including the use of the reversion fund of R$ 9,194 (for the six-month period ended June 30, 2021 the subsidiaries contributed to Ultraprev with R$ 9,485, including the use of the reversion fund of R$ 1,567, for the six-month period ended June 30, 2020), which is recognized as expense in the income statement. The total number of participating employees as of June 30, 2021 was 6,917 active participants and 366 retired participants. In addition Ultraprev had 23 former employees receiving benefits under the rules of a previous plan whose reserves are fully constituted.
Ultrapar Participações S.A. and Subsidiaries
Notes to the Parent’s Separate and Consolidated Interim Financial Information
(In thousands of Brazilian Reais, unless otherwise stated)
b. Post-employment benefits
The subsidiaries recognized a provision for post-employment benefits mainly related to seniority bonus, payment of Government Severance Indemnity Fund (“FGTS”), and health, dental care, and life insurance plan for eligible retirees.
The amounts related to such benefits were determined based on a valuation conducted by an independent actuary and reviewed by management as of June 30, 2021.
| Parent |
| Consolidated | ||||
| 06/30/2021 |
| 12/31/2020 |
| 06/30/2021 |
| 12/31/2020 |
Health and dental care plan (1) | - |
| - |
| 205,696 |
| 200,318 |
Indemnification of FGTS | 2,725 |
| 2,527 |
| 53,066 |
| 53,952 |
Seniority bonus | - |
| - |
| 13,846 |
| 16,336 |
Life insurance (1) | - |
| - |
| 14,517 |
| 14,118 |
Total | 2,725 |
| 2,527 |
| 287,125 |
| 284,724 |
Current | - |
| - |
| 27,173 |
| 27,077 |
Non-current | 2,725 |
| 2,527 |
| 259,952 |
| 257,647 |
(1) Only IPP, Tropical and Iconic.
21. Provision for asset retirement obligation – fuel tanks (Consolidated)
The provision corresponds to the legal obligation to remove the subsidiary IPP’s underground fuel tanks located at by Ipiranga-branded service stations after a certain use period (see Note 2.n).
Changes in the provision for asset retirement obligation are as follows:
Balance as of December 31, 2020 | 53,435 |
Additions (new tanks) | 112 |
Expenditure with tanks removed | (1,747) |
Accretion expense | 2,441 |
Balance as of June 30, 2021 | 54,241 |
Current | 4,426 |
Non-current | 49,815 |
Ultrapar Participações S.A. and Subsidiaries
Notes to the Parent’s Separate and Consolidated Interim Financial Information
(In thousands of Brazilian Reais, unless otherwise stated)
22. Provisions and contingencies (Consolidated)
a. Provisions for tax, civil, and labor risks
The Company and its subsidiaries are parties in tax, civil, environmental, regulatory, and labor disputes at the administrative and judiciary levels, which, when applicable, are backed by escrow deposits. Provisions for losses are estimated and updated by management based on the opinion of the Company’s legal department and its external legal advisors.
The table below demonstrates the breakdown of provisions by nature and its movement:
Provisions | Balance on 12/31/2020 |
| Additions |
| Reversals |
| Payments |
| Interest |
| Balance on 06/30/2021 |
IRPJ and CSLL (a.1.1) | 547,862 |
| - |
| - |
| - |
| 3,292 |
| 551,154 |
ICMS (c) | 108,568 |
| - |
| (82,149) |
| - |
| 50 |
| 26,469 |
Civil, environmental and regulatory claims (a.2.1) | 57,772 |
| 11,534 |
| (6,558) |
| (6,778) |
| 80 |
| 56,050 |
Labor litigation (a.3.1) | 90,675 |
| 2,713 |
| (2,520) |
| (8,922) |
| 1,616 |
| 83,562 |
Others | 93,168 |
| - |
| - |
| - |
| 398 |
| 93,566 |
Total | 898,045 |
| 14,247 |
| (91,227) |
| (15,700) |
| 5,436 |
| 810,801 |
Current | 43,660 |
|
|
|
|
|
|
|
|
| 42,209 |
Non-current | 854,385 |
|
|
|
|
|
|
|
|
| 768,592 |
Some of the provisions above involve in whole or in part, escrow deposits.
Balances of escrow deposits are as follows:
| 06/30/2021 |
| 12/31/2020 |
Tax matters | 702,744 |
| 789,624 |
Labor litigation | 56,389 |
| 57,603 |
Civil and other | 103,536 |
| 102,569 |
Total – non-current assets | 862,669 |
| 949,796 |
a.1 Provisions for tax matters
a.1.1 On October 7, 2005 the subsidiaries Cia. Ultragaz and Bahiana filed for and obtained a preliminary injunction to recognize and offset PIS and COFINS credits on LPG purchases, against other taxes levied by the RFB, notably IRPJ and CSLL. The decision was confirmed by a trial court on May 16, 2008. Under the preliminary injunction the subsidiaries made escrow deposits for these debits which amounted to R$ 526,550 as of June 30, 2021 (R$ 523,136 as of December 31, 2020). On July 18, 2014 a second instance unfavorable decision was published, and the subsidiaries suspended the escrow deposits, and started to pay income taxes from that date. To revert the court decision the subsidiaries presented a writ of prevention which was dismissed on December 30, 2014 and the subsidiaries appealed this decision on February 3, 2015. Appeals were also presented to the respective higher courts Superior Court of Justice (“STJ”) and Federal Supreme Court (“STF”) whose final trial are pending.
Ultrapar Participações S.A. and Subsidiaries
Notes to the Parent’s Separate and Consolidated Interim Financial Information
(In thousands of Brazilian Reais, unless otherwise stated)
a.2 Provisions for civil, environmental and regulatory claims
a.2.1 The Company and its subsidiaries maintain provisions for lawsuits and administrative proceedings, mainly derived from contracts entered into with customers and former services providers, as well as proceedings related to environmental and regulatory issues in the amount of R$ 56,050 as of June 30, 2021 (R$ 57,772 as of December 31, 2020).
a.3 Provisions for labor matters
a.3.1 The Company and its subsidiaries maintain provisions of R$ 83,562 as of June 30, 2021 (R$ 90,675 as of December 31, 2020) for labor litigation filed by former employees and by employees of our service providers mainly contesting the non-payment of labor rights.
b. Contingent liabilities
The Company and its subsidiaries are parties in tax, civil, environmental, regulatory, and labor claims whose loss is assessed as possible (proceedings whose chance of loss is more than 25% and less or equal than 50%) by the Company and its subsidiaries’ legal departments, based on the opinion of its external legal advisors and, based on these assessments, these claims were not recognized in the financial statements. The estimated amount of this contingency is R$ 3,774,053 as of June 30, 2021 (R$ 3,236,982 as of December 31, 2020).
b.1 Contingent liabilities for tax matters and social security
The Company and its subsidiaries have contingent liabilities for tax matters and social security in the amount of R$ 2,731,567 as of June 30, 2021 (R$ 2,419,000 as of December 31, 2020), mainly represented by:
b.1.1 The subsidiary IPP and its subsidiaries have assessments invalidating the offset of excise tax (“IPI”) credits in connection with the purchase of raw materials used in the manufacturing of products which sales are not subject to IPI under the protection of tax immunity. The amount of this contingency is R$ 177,403 as of June 30, 2021 (R$ 176,390 as of December 31, 2020).
b.1.2 The subsidiary IPP and its subsidiaries have legal proceedings related to ICMS. The total amount involved in these proceedings, was R$ 996,369 as of June 30, 2021 (R$ 958.134 as of December 31, 2020). Such proceedings arise mostly of the disregard of ICMS credits amounting to R$ 307,196 as of June 30, 2021 (R$ 300,707 as of December 31, 2020), of which R$ 98,840 (R$ 92,687 as of December 31, 2020) refer to proportional reversal requirement of ICMS credits related to the acquisition of hydrated alcohol; of alleged non-payment in the amount of R$ 104,656 as of June 30, 2021 (R$ 98,157 as of December 31, 2020); of conditioned fruition of fiscal incentive in the amount of R$ 135,512 as of June 30, 2021 (R$ 119,894 as of December 31, 2020); and inventory differences in the amount of R$ 272,264 as of June 30, 2021 (R$ 269,581 as of December 31, 2020) related to the leftovers or faults due to temperature changes or product handling.
b.1.3 The subsidiary Oxiteno S.A. received, tax assessment notices referring to ICMS of the State of Bahia in the amount of R$ 137,372 on June 30, 2021, arising from alleged differences found in the inventory audit and divergences in the calculation of imported content that would imply an ICMS rate higher than applied by the subsidiary.
Ultrapar Participações S.A. and Subsidiaries
Notes to the Parent’s Separate and Consolidated Interim Financial Information
(In thousands of Brazilian Reais, unless otherwise stated)
b.1.4 The Company and its subsidiaries are parties to administrative and judicial suits involving Income Tax, Social Security Contribution, PIS and COFINS, substantially about denials of offset claims and credits disallowance which total amount is R$ 822,966 as of June 30, 2020 (R$ 709,338 as of December 31, 2020), mainly represented by:
b.1.4.1 The subsidiary IPP received a tax assessment related to the IRPJ and CSLL resulting from the supposedly undue amortization of the goodwill paid on acquisition of a subsidiary, in the amount of R$ 214,172 as of June 30, 2021 (R$ 212,350 as of December 31, 2020), which includes the amount of the income taxes, interest and penalty. Management assessed the likelihood of the tax assessment, supported by the opinion of its legal advisors, as “possible”, and therefore did not recognize a provision for this contingent liability. Management assessed the likelihood of loss in this case as "possible", supported by the opinion of its legal advisors, and therefore did not recognize a provision for this contingent liability.
b.2 Contingent liabilities for civil, environmental and regulatory claims
The Company and its subsidiaries have contingent liabilities for civil, environmental and regulatory claims in the amount of R$ 804,557 as of June 30, 2021 (R$ 561,713 as of December 31, 2020), mainly represented by:
b.2.1 The subsidiary Cia. Ultragaz is party to an administrative proceeding before CADE based on alleged anti-competitive practices in the State of Minas Gerais in 2001. The CADE entered a decision against Cia. Ultragaz and imposed a penalty of R$ 33,979 as of June 30, 2021 (R$ 33,895 as of December 31, 2020). The imposition of such administrative decision was suspended by a court order and its merit is being judicially reviewed.
b.2.2 The subsidiary Cia. Ultragaz has lawsuits totaling the amount of R$ 234,351 (R$ 186,381 on December 31, 2020) filed by resellers seeking the declaration of nullity and termination of distribution contracts, in addition to indemnities for losses and damages.
b.2.3 The subsidiary IPP became party to two administrative proceedings filed by CADE, related to allegations of anti-competitive practices in the city of Joinville, State of Santa Catarina and in the Distrito Federal. The process related to the anti-competitive acts of Joinville, established in October 2015, is under judgment (until now two favorable votes and one unfavorable vote have been pronounced) while the lawsuit related to the Distrito Federal, from an administrative inquiry initiated in May 2012, which was converted into an administrative proceeding in June 2020, is in the stage of presentation of defense. Besides these, in April, 2019, IPP received an administrative fine in the amount of R$ 40,693, for allegedly influencing uniform commercial conduct among fuel resellers around the city of Belo Horizonte, state of Minas Gerais. In this case, there was an option for the judicial discussion of the assessment and penalty applied, which has as last relevant movement the presentation of a reply by IPP, and it is certain that a decision has already been issued granting protection to suspend the enforceability of the fine. Management did not recognize a provision for these contingencies, supported by the opinion of external legal counsel that classified the probability of loss as remote. Management did not recognize a provision for these contingencies, supported by the opinion of external lawyers, who classify the likelihood of loss as remote.
Ultrapar Participações S.A. and Subsidiaries
Notes to the Parent’s Separate and Consolidated Interim Financial Information
(In thousands of Brazilian Reais, unless otherwise stated)
b.2.4 On November 29, 2016 a technical opinion was issued by the Operational Support Center for Execution (Centro de Apoio Operacional à Execução – CAEX), a technical body linked to the São Paulo State Public Prosecutor (“MPE”), presenting a proposal of compensation for the alleged environmental damages caused by the fire on April 2nd, 2015 at the Santos Terminal of the subsidiary Ultracargo Logística. This technical opinion is non-binding, with no condemnatory or sanctioning nature, and will still be evaluated by the authorities and parties. The subsidiary disagrees with the methodology and the assumptions adopted in the proposal and is negotiating an agreement with the MPE and the Brazilian Federal Public Prosecutor (“MPF”), since the beginning of the investigation and currently there is no civil lawsuit filed on the matter. The negotiations relate to in natura repair of the any damages. Thus, on May 15, 2019, the subsidiary Ultracargo Logística signed a Partial Conduct Adjustment Commitment Agreement (“TAC”) in the amount of R$ 67,539 with the MPE and MPF to compensate for diffuse and collective damages of any kind arising from the fish mortality and the damage caused to the ichthyofauna. The negotiation on compensation for other alleged damages are still ongoing and once concluded, the payments related to the project costs may affect the future Company’s financial statements.
In the criminal sphere, the MPF denounced the subsidiary Ultracargo Logística, which was summoned and replied to the complaint on June 19, 2018. On September 12, 2019, at a hearing in the federal court of Santos, the MPF and Ultracargo Logística agreed, and the judicial authority approved, the conditional suspension of the criminal proceedings for a period of 2 years, when Ultracargo Logística shall then prove compliance with the execution of the Partial TAC signed, with the obligation of a complementary allocation of R$ 13,000 to TAC and the Fisheries Management Project, to obtain the definitive filing of the process. On February 4, 2021, the subsidiary paid the remaining balance referring to the TAC, without pending and/or additional financial obligation arising from such commitment assumed. In addition, as of June 30, 2021, there are contingent liabilities not recognized related to lawsuits in the amount of R$ 2,329 (R$ 4,428 as of December 31, 2020). Between December 31 2020 and June 30, 2021, there were not extrajudicial claims.
b.3 Contingent liabilities for labor matters
The Company and its subsidiaries have contingent liabilities for labor matters in the amount of R$ 237,929 as of June 30, 2021 (R$ 256,269 as of December 31, 2020), mainly represented by:
b.3.1 The Petrochemical Industry Labor Union (Sindiquímica), of which the employees of Oxiteno S.A. and EMCA, companies located in the Camaçari Petrochemical Complex, are members, filed, in 1990, collective lawsuits against the subsidiaries, demanding the compliance of the fourth section of the collective labor agreement 1989/1990 (CCT 1989/1990), which provided for a salary, adjustment in lieu of the salary policies practiced. The collective actions against the subsidiaries, which have already become final, were judged in a favorable way to Oxiteno Nordeste and EMCA. At the same time, in 1990, there was the proposal for a collective agreement of, which appeared in the collective action, the Union of Employees and the Union of Companies (SINPEQ), discussing the same object (validity of the fourth clause of CCT 1989/1990). This action that transit judged only in October 2019, and remained unfavorable to SINPEQ, having the STF declared valid the fourth clause. During the process of collective agreement between the Unions, some companies in the Camaçari Petrochemical Complex signed an agreement with Sindiquímica. In October 2015 Sindiquímica filed enforcement lawsuits against Oxiteno Nordeste and, in 2017, EMCA, because these companies did not sign the agreement of 2010 with Sindiquímica. In addition to collective actions, individual claims containing the same object have been filed. In all the ongoing lawsuits whose object is the fourth clause, all applicable legal measures have been taken to defend companies and there are not new final decisions in addition to those judged in favor of companies in the 1990s.
Ultrapar Participações S.A. and Subsidiaries
Notes to the Parent’s Separate and Consolidated Interim Financial Information
(In thousands of Brazilian Reais, unless otherwise stated)
c. Lubricants operation between IPP and Chevron
In the process of transaction of the lubricants' operation in Brazil between Chevron and subsidiary IPP (see Note 3.c of Interim Financial Information of 2018 filed on CVM February 20, 2019), it was agreed that each shareholder is responsible for any claims arising out of acts, facts or omissions that occurred prior to the transaction. The liability provisions of the Chevron shareholder in the amount of R$ 20,745 (R$ 101,663 as of December 31, 2020) are reflected in the consolidation of these financial statements. Additionally, in connection with the business combination, a provision in the amount of R$ 198,900 was recognized on December 1, 2017 due contingent liabilities, amounted to R$ 102,777 as of June 30, 2021 (R$ 102,777 as of December 31, 2020. The amounts of provisions of Chevron's liability recognized in the business combination will be reimbursed to subsidiary Iconic in the event of losses and an indemnity asset was hereby constituted in the same amount, without the need to establish a provision for uncollectible amounts.
Part of the provision of the Chevron related to the ICMS tax assessment (R$ 81,060), for the period from July 1996 to December 1997, was definitively extinguished through the payment made by the Chevron in the tax amnesty program, established by the Agreement ICMS/RJ No. 51/2020 (Decree/RJ No. 47,332/2020 and State Law of RJ No. 9,041/2020) on April 16, 2021.
Thus the amount of the provision of the Chevron in the amount of R$ 20,745, refers to: (i) R$ 17,024 ICMS assessments on sales for industrial purposes, in which the STF closed the judgment of the thesis unfavorably to taxpayers; (ii) R$ 3,447 labor claims and (iii) R$ 274 civil, regulatory and environmental claims.
d. Exclusion of ICMS from the calculation basis of PIS and COFINS (contingent assets)
In March 15, 2017, STF decided that ICMS is not included in the PIS and COFINS basis. After filing the Union's Motion for Clarification, the STF definitively ruled on the thesis on May 13, 2021, reaffirming the exclusion of the highlighted ICMS from the PIS and COFINS calculation basis and modulating the effects of the decision for the cases filed after March 15, 2017.
The Company and its subsidiaries had lawsuits on this thesis, having recognized total tax credits in the amount of R$ 953,834 (see Note 7.a.3), of which R$ 206,872 refers to amounts that positively impacted the result in 2021, after the final decision of the STF, which made the asset practically certain and measurable.
Ultrapar Participações S.A. and Subsidiaries
Notes to the Parent’s Separate and Consolidated Interim Financial Information
(In thousands of Brazilian Reais, unless otherwise stated)
23. Deferred revenue (Consolidated)
The subsidiaries of the Company have recognized the following deferred revenue:
| 06/30/2021 |
| 12/31/2020 |
‘am/pm’ and Jet Oil franchising upfront fee (a) | 122 |
| 814 |
Loyalty program “Km de Vantagens” (b) | - |
| 15,424 |
Loyalty program “Clube Extrafarma” (b) | 1,655 |
| 2,044 |
Total current | 1,777 |
| 18,282 |
a. Franchising upfront fee
am/pm is the convenience stores chain of the Ipiranga service stations and, on June 30, 2021, had 48 stores inaugurated with initial deferred franchising upfront fee (58 stores inaugurated as of December 31, 2020). Jet Oil is Ipiranga’s lubricant-changing and automotive service specialized network and, on June 30, 2021, had 23 stores inaugurated with initial deferred franchising upfront fee (45 stores inaugurated as of December 31, 2020). For more information on the deferred revenue from the franchising upfront fee, see Note 2.a.
b. Loyalty programs
The loyalty program called Km de Vantagens (www.kmdevantagens.com.br) under which registered customers are rewarded with points when they buy products in several partners, including the Ipiranga’s service station, was transferred to Abastece aí (www.abasteceai.com.br). The subsidiary IPP remains a partner in the program, offering cashback to its customers based on the limits negotiated under the terms of the partnership, where, after the customer meet the requirements for the right to the benefit, Abastece aí immediately credits the amount to the customer's virtual wallet and charges IPP, which reimburses Abastece aí and recognizes the same amount as reduction in sales.
Subsidiary Extrafarma has a loyalty program called Clube Extrafarma (www.clubeextrafarma.com.br) under which registered customers are rewarded with points when they buy products at its drugstore chain. The customers may exchange these points, during the period of six months, for discounts in products at its drugstore chain, recharge credit on a mobile phone, and prizes offered by partners Multiplus Fidelidade and Ipiranga, through Km de Vantagens. Points received by Extrafarma’s customers are recognized as a reduction of revenue from sales and services.
Deferred revenue is estimated based on the fair value of the points granted, considering the value of the prizes and the expected redemption of these points. For more information on deferred revenue from loyalty program, see Note 2.a.
Ultrapar Participações S.A. and Subsidiaries
Notes to the Parent’s Separate and Consolidated Interim Financial Information
(In thousands of Brazilian Reais, unless otherwise stated)
24. Subscription warrants – indemnification
Because of the association between the Company and Extrafarma on January 31, 2014, 7 subscription warrants – indemnification could be issued, corresponding to up to 6,411,244 shares of the Company. The subscription warrants – indemnification may be exercised beginning 2020 by the former shareholders of Extrafarma and are adjusted according to the changes in the amounts of provisions for tax, civil, and labor risks and contingent liabilities related to the period prior to January 31, 2014. The subscription warrants – indemnification’s fair value is measured based on the share price of Ultrapar (UGPA3) and is reduced by the dividend yield until 2020, since the exercise is possible only from 2020, and they are not entitled to dividends while they are not converted into shares.
On February 19, 2020, August 12, 2020 and February 24, 2021 the Company’s Board of Directors confirmed, the issuance of, respectively, 2,108,542, 86,978 and 70,939 common shares within the authorized capital limit provided by the art. 6 of the Bylaws, due to the partial exercise of the rights conferred by the subscription warrants issued by the Company when the merger of all Extrafarma shares by the Company, approved by the extraordinary general meeting of the Company held in January 31, 2014.
In the association agreement between the Company and Extrafarma on January 31, 2014 and due to the unfavorable decisions of some processes with triggering events prior to January 31, 2014, 578,538 shares linked to the subscription warrants – indemnification were canceled and not issued. On June 30, 2021, 3,569,581 shares were retained linked to subscription warrants – indemnification which will be issued or canceled according as the final decision of the processes are favorable or unfavorable, respectively, being this the maximum number of shares that can be issued in the future, totaling R$ 65,645.
On August 11, 2021, the Company's Board of Directors confirmed the issue of 31,032 common shares due to the partial exercise of the rights conferred by the subscription warrants - indemnification. For more information on the partial issuance, see Note 35.a.
25. Equity
a. Share capital
On June 30, 2021 the subscribed and paid-in capital stock consists of 1,115,076,651 (1,115,005,712 as of December 31, 2020) common shares with no par value and the issuance of preferred shares and participation certificates is prohibited. Each common share entitles its holder to one vote at Shareholders’ Meetings.
The price of the outstanding shares as of June 30, 2021, on B3 was R$ 18.39 (R$ 23.74 as of December 31, 2020).
On February 19, 2020, August 12, 2020, and February 24, 2021, the Board of Directors confirmed the issuance of 2,108,542, 86,978 and 70,939 common shares, respectively, with the same rights attributed to the other shares of the Company already issued, due to the partial exercise of the rights conferred by the subscription warrants – indemnification into shares by the Company in the merger of Extrafarma shares. For more information on the changes in share capital, see Note 24.
Ultrapar Participações S.A. and Subsidiaries
Notes to the Parent’s Separate and Consolidated Interim Financial Information
(In thousands of Brazilian Reais, unless otherwise stated)
As of June 30, 2021 there were 50,363,294 common shares outstanding abroad in the form of ADRs (47,413,094 shares as of December 31, 2020).
On April 10, 2019 the Company’s extraordinary and annual general meeting approved the stock split of common shares issued by Ultrapar, at a ratio of one currently existing share to two shares of the same class and type as well as the changing of the number of shares in which the capital stock of the Company is divided. The stock split approved herein shall not imply in any change in the Ultrapar’s capital stock. The new shares and ADRs resulting from the stock split approved herein are of the same class and type and granted to its holders the same rights of the current shares and ADRs.
b. Equity instrument granted
The Company has a share-based incentive plan, which establishes the general terms and conditions for the concession of common shares issued by the Company held in treasury (see Note 8.c).
c. Treasury shares
The Company acquired its own shares at market prices, without capital reduction, to be held in treasury and to be subsequently disposed of or cancelled, in accordance with CVM Instructions 10, issued on February 14, 1980 and 268, issued on November 13, 1997.
As of June 30, 2021, 24,739,626 common shares were held in the Company's treasury, acquired at an average cost of R$ 19.77 (24,739,626 as of December 31, 2019).
d. Capital reserve
The capital reserve reflects the gain on the transfer of shares at market price used in the Deferred Stock Plan granted to executives of the subsidiaries of the Company, as mentioned in Note 8.c.
Because of Extrafarma’s association in 2014 the Company recognized an increase in the capital reserves in the amount of R$ 498,812, due to the difference between the value attributable to share capital and the market value of the Ultrapar shares on the date of issuance, deducted by R$ 2,260 related to the incurred costs directly attributable to issuing new shares. Additionally, on February 19, 2020, August 12, 2020 and February 24, 2021, there was an increase in the reserve in the amount of R$ 53,072, R$ 1,691 and R$ 1,371, respectively, due to the partial exercise of the subscription warrants – indemnification (see note 24).
e. Revaluation reserve
The revaluation reserve, recognized prior to the adoption of the international accounting standards (CPC / IFRS) instituted by Law 11,638/07, reflects the revaluation of assets of subsidiaries and is based on depreciation, write-off, or disposal of the revalued assets of the subsidiaries, as well as the tax effects recognized by these subsidiaries.
Ultrapar Participações S.A. and Subsidiaries
Notes to the Parent’s Separate and Consolidated Interim Financial Information
(In thousands of Brazilian Reais, unless otherwise stated)
f. Profit reserves
f.1 Legal reserve
Under Brazilian Corporate Law, the Company is required to allocate 5% of net annual earnings to a legal reserve, until the balance reaches 20% of capital stock. This reserve may be used to increase capital or to absorb losses but may not be distributed as dividends.
f.2 Investments reserve
In compliance with Article 194 of the Brazilian Corporate Law and Article 54.b) of the Bylaws this reserve is aimed to protect the integrity of the Company’s assets and to supplement its capital stock, in order to allow new investments to be made. As provided in its Bylaws, the Company may allocate up to 50% of the annual net income, after deducting the legal reserve, to the investments reserve, up to the limit of 100% of the share capital.
The investments reserve is free of distribution restrictions and totaled R$ 3,658,265 as of June 30, 2021 (R$ 3,658,265 as of December 31, 2020).
g. Other comprehensive income
g.1 Valuation adjustments
(i) Gains and losses on the hedging instruments of exchange rate related to firm commitment and highly probable transactions designated as cash flows hedges are recognized in equity as “valuation adjustments”. Gains and losses are reclassified to initial cost of non-financial assets recognized in statements of profit or loss at the moment of paid off of the hedge instrument.
(ii) The differences between the fair value of financial investments measured at fair value through other comprehensive income and the initial amount of financial investments plus the earned income and the foreign currency exchange variation are recognized in equity as valuation adjustments. Gains and losses are reclassified to statements of profit or loss when the financial investment is paid off.
(iii) Actuarial gains and losses relating to post-employment benefits, calculated based on a valuation conducted by an independent actuary, are recognized in equity under the title “valuation adjustments”. Actuarial gains and losses recorded in equity are not reclassified to profit or loss in subsequent periods.
(iv) The Company also recognizes in this item the effect of changes in the non-controlling interest in subsidiaries that do not result in loss of control. This amount corresponds to the difference between the amount by which the non-controlling interest was adjusted and the fair value of the consideration received or paid and represents a transaction with shareholders.
Ultrapar Participações S.A. and Subsidiaries
Notes to the Parent’s Separate and Consolidated Interim Financial Information
(In thousands of Brazilian Reais, unless otherwise stated)
Balance and changes in valuation adjustments of the Company are as follows:
| Fair value of cash flow hedging instruments (i) |
| Fair value of financial instruments (ii) |
| Actuarial gains (losses) of post-employment benefits (iii) |
| Non-controlling shareholders interest change (iv) |
| Total |
Balance as of December 31, 2020 | (609,277) |
| 269 |
| (53,351) |
| 197,369 |
| (464,990) |
Changes in fair value of financial instruments | 162,005 |
| (562) |
| - |
| - |
| 161,443 |
IRPJ and CSLL on fair value | (55,537) |
| - |
| - |
| - |
| (55,537) |
IRPJ and CSLL on actuarial losses | - |
| - |
| 561 |
| - |
| 561 |
Balance as of June 30, 2021 | (502,809) |
| (293) |
| (52,790) |
| 197,369 |
| (358,523) |
| Fair value of cash flow hedging instruments (i) |
| Fair value of financial instruments (ii) |
| Actuarial gains (losses) of post-employment benefits (iii) |
| Non-controlling shareholders interest change (iv) |
| Total |
Balance as of December 31, 2019 | (296,132) |
| 205 |
| (47,759) |
| 197,369 |
| (146,317) |
Changes in fair value of financial instruments | (721,246) |
| 909 |
| ‐ |
| ‐ |
| (720,337) |
IRPJ and CSLL on fair value | 245,857 |
| ‐ |
| ‐ |
| ‐ |
| 245,857 |
Balance as of June 30, 2020 | (771,521) |
| 1,114 |
| (47,759) |
| 197,369 |
| (620,797) |
g.2 Cumulative translation adjustments
The change in exchange rates on assets, liabilities, and income of foreign subsidiaries that have functional currency other than the presentation currency of the Company and an independent management (see Note 2.s.1) and the exchange rate variation on notes in the foreign market, net of income taxes (see Note 33.h.3) is directly recognized in the equity. This cumulative effect is reflected in profit or loss as a gain or loss only in case of disposal or write-off of the investment.
Balance and changes in cumulative translation adjustments of the Company are as follows:
| 06/30/2021 |
| 06/30/2020 |
Initial balance | 231,596 |
| 102,427 |
Currency translation adjustment of foreign subsidiaries | (49,634) |
| 226,742 |
Effect of foreign currency exchange rate variation on financial instruments | 18,477 |
| (137,304) |
IRPJ and CSLL on foreign currency exchange rate variation on financial instruments | (6,282) |
| 46,684 |
Final balance | 194,157 |
| 238,549 |
Ultrapar Participações S.A. and Subsidiaries
Notes to the Parent’s Separate and Consolidated Interim Financial Information
(In thousands of Brazilian Reais, unless otherwise stated)
h. Dividends and allocation of net income
The shareholders of the Company is entitled under the Bylaws to a minimum annual dividend of 50% of adjusted net income, after allocation of 5% to the legal reserve, calculated in accordance with Brazilian Corporate Law. The dividends and interest on equity in excess of the obligation established in the Bylaws are recognized in equity until the Shareholders approve them. The proposed dividends payable that refers of the exercise of 2020, the amount of which on as of December 31, 2020 totaled R$ 479,748 (R$ 0.44 – forty-four cents of Brazilian Real per share), were approved by the Board of Directors on February 24, 2021, and were paid from March 12, 2021.
Balances and changes in dividends payable are as follows:
| Parent |
| Consolidated |
Balance as of December 31, 2020 | 439,094 |
| 442,133 |
Provisions | 55,391 |
| 65,728 |
Prescribed dividends | (7,137) |
| (7,137) |
Payments | (477,408) |
| (488,600) |
Balance as of June 30, 2021 | 9,940 |
| 12,124 |
26. Net revenue from sale and services (Consolidated)
| 06/30/2021 |
| 06/30/2020 |
Gross revenue from sale | 54,921,426 |
| 39,663,687 |
Gross revenue from services | 515,093 |
| 436,021 |
Sales taxes | (2,172,598) |
| (1,934,506) |
Discounts and sales returns | (675,209) |
| (753,010) |
Amortization of contractual assets with customers (see Note 11) | (128,879) |
| (150,854) |
Deferred revenue (see Note 23) | 16,505 |
| 2,034 |
Net revenue from sales and services | 52,476,338 |
| 37,263,372 |
Ultrapar Participações S.A. and Subsidiaries
Notes to the Parent’s Separate and Consolidated Interim Financial Information
(In thousands of Brazilian Reais, unless otherwise stated)
27. Costs and expenses by nature
The Company presents its costs and expenses by function in the consolidated statement of profit or loss and presents below its expenses by nature:
| Parent |
| Consolidated | ||||
| 06/30/2021 |
| 06/30/2020 |
| 06/30/2021 |
| 06/30/2020 |
Raw materials and materials for use and consumption | - |
| - |
| 48,705,665 |
| 34,026,153 |
Personnel expenses | 76,413 |
| 71,298 |
| 1,192,674 |
| 1,073,013 |
Freight and storage | - |
| - |
| 611,433 |
| 634,549 |
Depreciation and amortization | 3,030 |
| 971 |
| 493,054 |
| 458,512 |
Amortization of right-of-use assets | 2,984 |
| 1,854 |
| 175,346 |
| 158,628 |
Advertising and marketing | 16 |
| 278 |
| 42,000 |
| 73,705 |
Services provided by third parties | 53,163 |
| 10,033 |
| 264,276 |
| 150,809 |
Other expenses | 14,524 |
| 7,272 |
| 87,168 |
| 126,683 |
Allocation of SSC/Holding expenses | (138,011) |
| (91,706) |
| - |
| - |
Total | 12,119 |
| - |
| 51,571,616 |
| 36,702,052 |
Classified as: |
|
|
|
|
|
|
|
Cost of products and services sold | - |
| - |
| 49,264,664 |
| 34,802,194 |
Selling and marketing | - |
| - |
| 1,365,116 |
| 1,196,737 |
General and administrative | 12,119 |
| - |
| 941,836 |
| 703,121 |
Total | 12,119 |
| - |
| 51,571,616 |
| 36,702,052 |
28. Gain (loss) on disposal of PP&E and intangibles and impairment (Consolidated)
The gain or loss is determined as the difference between the selling price and residual book value of the investment, PP&E, and intangible asset. For the six-month period ended June 30, 2021 the gain was R$ 40,148 (gain of R$ 20,910 for the six-month period ended June 30, 2020), represented primarily from sale of PP&E. Additionally, on June 30, 2021, considering the transaction mentioned in Note 3.c.1, the Company recognized a provision for impairment of assets of the interest in the subsidiary Extrafarma in the amount of R$ 394,675.
Ultrapar Participações S.A. and Subsidiaries
Notes to the Parent’s Separate and Consolidated Interim Financial Information
(In thousands of Brazilian Reais, unless otherwise stated)
29. Other operating income, net (Consolidated)
| 06/30/2021 |
| 06/30/2020 |
Other operating income, net: |
|
|
|
Commercial partnerships (1) | 14,066 |
| 12,636 |
Merchandising (2) | 10,672 |
| 13,837 |
Extraordinary tax credits (3) | 133,040 |
| 132,021 |
Property rental (4) | 12,583 |
| 12,181 |
Revenue from miscellaneous services (administrative, commercial and IT services) | 46,967 |
| 45,062 |
Contractual fine and gas voucher | 5,800 |
| 5,186 |
Others | 5,570 |
| 7,373 |
| 228,698 |
| 228,296 |
Other operating expenses, net: |
|
|
|
Property rental (4) | (41,906) |
| (47,612) |
Taxes on other operating income (5) | (12,618) |
| (15,716) |
Fines for tax infractions | (1,097) |
| (1,542) |
Decarbonization obligation (6) | (64,920) |
| - |
Others | (42,253) |
| (3,272) |
| (162,794) |
| (68,142) |
Other operating income, net | 65,904 |
| 160,154 |
(1) Refers to contracts with service providers and suppliers, which establish trade agreements for convenience stores and gas stations.
(2) Refers to contracts with suppliers of convenience stores, which establish, among other agreements, promotional campaigns.
(3) Refers substantially to PIS and COFINS credits (see Note 7.a.3), registered in the second quarter of 2021 and in the first quarter of 2020.
(4) Refers to Ipiranga’s income and expenses with property rentals and sublease, especially for establishment of own gas stations, linked to contractual requirements for the preservation of the brand.
(5) Refers substantially to ICMS, ISS, PIS and COFINS.
(6) Refers to the obligation adopted by the RenovaBio to set decarbonization targets for its sector.
Ultrapar Participações S.A. and Subsidiaries
Notes to the Parent’s Separate and Consolidated Interim Financial Information
(In thousands of Brazilian Reais, unless otherwise stated)
30. Finance income (Expense)
| Parent |
| Consolidated | ||||
| 06/30/2021 |
| 06/30/2020 |
| 06/30/2021 |
| 06/30/2020 |
Finance income: |
|
|
|
|
|
|
|
Interest on financial investments | 15,188 |
| 23,723 |
| 54,205 |
| 84,692 |
Interest from customers | - |
| ‐ |
| 59,038 |
| 60,616 |
Changes in subscription warrants – indemnification (see Note 24) | 19,256 |
| 8,010 |
| 19,256 |
| 8,010 |
Selic interest on extraordinary PIS/COFINS credits (see Note 7.a.3) | - |
| ‐ |
| 73,832 |
| 77,915 |
Other finance income | 114 |
| 36 |
| 5,815 |
| 3,931 |
| 34,558 |
| 31,769 |
| 212,146 |
| 235,164 |
Finance expenses: |
|
|
|
|
|
|
|
Interest on loans | (14,801) |
| (15,001) |
| (290,266) |
| (200,059) |
Interest on debentures | (23,765) |
| (33,108) |
| (97,786) |
| (142,625) |
Interest on leases payable | (1,634) |
| (2,584) |
| (89,239) |
| (69,649) |
Bank charges, financial transactions tax, and other charges | (838) |
| (940) |
| (42,892) |
| (39,197) |
Exchange variation, net of gains and losses with derivative financial instruments | - |
| - |
| (15,126) |
| (30,628) |
Interest of provisions and other expenses | - |
| - |
| (13,273) |
| (964) |
| (41,038) |
| (51,633) |
| (548,582) |
| (483,122) |
Finance income (expense) | (6,480) |
| (19,864) |
| (336,436) |
| (247,958) |
Ultrapar Participações S.A. and Subsidiaries
Notes to the Parent’s Separate and Consolidated Interim Financial Information
(In thousands of Brazilian Reais, unless otherwise stated)
31. Earnings per share (Parent and Consolidated)
The table below presents a reconciliation of numerators and denominators used in computing earnings per share. The Company has a deferred stock plan and subscription warrants – indemnification, as mentioned in Notes 8.c and 24, respectively.
| 06/30/2021 |
| 06/30/2020 |
Basic earnings per share |
|
|
|
Net income for the year of the Company | 101,083 |
| 201,925 |
Weighted average shares outstanding (in thousands) | 1,088,123 |
| 1,088,217 |
Basic earnings per share – R$ | 0.0929 |
| 0.1856 |
Diluted earnings per share |
|
|
|
Net income for the year of the Company | 101,083 |
| 201,925 |
Weighted average shares outstanding (in thousands), including dilution effects | 1,093,905 |
| 1,094,700 |
Diluted earnings per share – R$ | 0.0924 |
| 0.1845 |
Weighted average shares outstanding (in thousands) |
|
|
|
Weighted average shares outstanding for basic per share | 1,088,123 |
| 1,088,217 |
Dilution effect |
|
|
|
Subscription warrants – indemnification | 3,568 |
| 3,774 |
Deferred stock plan | 2,214 |
| 2,709 |
Weighted average shares outstanding for diluted per share | 1,093,905 |
| 1,094,700 |
Earnings per share were adjusted retrospectively by the issuance of 2,266,459 common shares due to the partial exercise of the rights conferred by the subscription warrants disclosed in note 24.
32. Segment information
The Company operates six main business segments: gas distribution, fuel distribution, chemicals, storage, drugstores and digital payments. The gas distribution segment (Ultragaz) distributes LPG to residential, commercial, and industrial consumers, especially in the South, Southeast, and Northeast regions of Brazil. The fuel distribution segment (Ipiranga) operates the distribution and marketing of gasoline, ethanol, diesel, fuel oil, kerosene, natural gas for vehicles, and lubricants and related activities throughout all the Brazilian territory. The chemicals segment (Oxiteno) produces ethylene oxide and its main derivatives and fatty alcohols, which are raw materials used in the home and personal care, agrochemical, paints, varnishes, and other industries. The storage segment (Ultracargo) operates liquid bulk terminals, especially in the Southeast and Northeast regions of Brazil. The drugstores segment (Extrafarma) trades pharmaceutical, hygiene, and beauty products through its own drugstore chain in the North, Northeast and Southeast regions of the country. The digital payments segment (Abastece aí) offers digital payments services, combining the “abastece aí” app and the loyalty program “Km de Vantagens”. The segments shown in the financial statements are strategic business units supplying different products and services. Intersegment sales are at prices similar to those that would be charged to third parties.
Ultrapar Participações S.A. and Subsidiaries
Notes to the Parent’s Separate and Consolidated Interim Financial Information
(In thousands of Brazilian Reais, unless otherwise stated)
a. Financial information related to segments
The main financial information of each of the Company’s segments are stated as follows:
| 06/30/2021 | |||||||||
Income | Ipiranga | Ultragaz | Oxiteno | Ultracargo | Extrafarma | Abastece aí | Subtotal | Others | Elimination | Total |
Segments | (1) (2) | |||||||||
Net revenue from sales and services | 43,708,767 | 4,383,420 | 3,108,719 | 347,867 | 1,003,701 | 33,200 | 52,585,674 | 16,688 | (126,024) | 52,476,338 |
Transactions with third parties | 43,708,725 | 4,381,024 | 3,096,596 | 250,440 | 1,003,701 | 33,200 | 52,473,686 | 2,652 | - | 52,476,338 |
Intersegment transactions | 42 | 2,396 | 12,123 | 97,427 | - | - | 111,988 | 14,036 | (126,024) | - |
Cost of products and services sold | (42,215,002) | (3,927,252) | (2,394,855) | (138,572) | (698,364) | - | (49,374,045) | 42 | 109,339 | (49,264,664) |
Gross profit | 1,493,765 | 456,168 | 713,864 | 209,295 | 305,337 | 33,200 | 3,211,629 | 16,730 | (16,685) | 3,211,674 |
Operating income (expenses) |
|
|
|
|
|
|
|
|
|
|
Selling and marketing | (634,219) | (201,266) | (209,840) | (4,080) | (288,996) | (23,669) | (1,362,070) | (3,046) | - | (1,365,116) |
Expected reversion (losses) on doubtful accounts | 13,987 | (7,119) | (546) | 30 | (12) | - | 6,340 | - | - | 6,340 |
General and administrative | (359,845) | (97,609) | (241,498) | (63,428) | (55,762) | (43,743) | (861,885) | (96,636) | 16,685 | (941,836) |
Gain (loss) on disposal of property, plant and equipment and intangibles | 37,498 | 2,922 | 373 | 18 | (665) | - | 40,146 | 2 | - | 40,148 |
Impairment | - | - | - | - | (394,675) | - | (394,675) | - | - | (394,675) |
Other operating income, net | 53,912 | 7,408 | 1,744 | 3,239 | (2,647) | 2,496 | 66,152 | (248) | - | 65,904 |
Operating income before finance income (expenses) and share of profit (loss) of subsidiaries, joint ventures and associates | 605,098 | 160,504 | 264,097 | 145,074 | (437,420) | (31,716) | 705,637 | (83,198) | - | 622,439 |
Share of profit (loss) of subsidiaries, joint ventures and associates | (1,820) | 39 | (67) | 577 | - | - | (1,271) | (9,670) | - | (10,941) |
Operating income before finance income (expenses) and income and social contribution taxes | 603,278 | 160,543 | 264,030 | 145,651 | (437,420) | (31,716) | 704,366 | (92,868) | - | 611,498 |
Depreciation of PP&E and amortization of intangible assets charges | 160,885 | 102,928 | 135,443 | 36,790 | 39,309 | 6,556 | 481,911 | 11,143 | - | 493,054 |
Amortization of contractual assets with customers – exclusive rights | 128,056 | 823 | - | - | - | - | 128,879 | - | - | 128,879 |
Amortization of right-of-use assets | 92,581 | 22,493 | 10,211 | 10,283 | 36,613 | 120 | 172,301 | 3,045 | - | 175,346 |
Total of depreciation and amortization | 381,522 | 126,244 | 145,654 | 47,073 | 75,922 | 6,676 | 783,091 | 14,188 | - | 797,279 |
Ultrapar Participações S.A. and Subsidiaries
Notes to the Parent’s Separate and Consolidated Interim Financial Information
(In thousands of Brazilian Reais, unless otherwise stated)
| 06/30/2020 | |||||||||
Income | Ipiranga | Ultragaz | Oxiteno | Ultracargo | Extrafarma | Abastece aí | Subtotal | Others | Elimination | Total |
Segments | (1) (2) | |||||||||
Net revenue from sales and services | 30,249,792 | 3,484,878 | 2,308,868 | 318,307 | 977,430 | - | 37,339,275 | 24,431 | (100,334) | 37,263,372 |
Transactions with third parties | 30,249,679 | 3,482,652 | 2,301,228 | 252,572 | 977,430 | - | 37,263,561 | (189) | - | 37,263,372 |
Intersegment transactions | 113 | 2,226 | 7,640 | 65,735 | - | - | 75,714 | 24,620 | (100,334) | - |
Cost of products and services sold | (29,239,619) | (2,965,225) | (1,850,002) | (128,104) | (691,239) | - | (34,874,189) | 113 | 71,882 | (34,802,194) |
Gross profit | 1,010,173 | 519,653 | 458,866 | 190,203 | 286,191 | - | 2,465,086 | 24,544 | (28,452) | 2,461,178 |
Operating income (expenses) |
|
|
|
|
|
|
|
|
|
|
Selling and marketing | (535,184) | (195,381) | (174,251) | (3,721) | (286,153) | - | (1,194,690) | (2,047) | - | (1,196,737) |
Expected reversion (losses) on doubtful accounts | (41,265) | (15,382) | (105) | 362 | (126) | - | (56,516) | - | - | (56,516) |
General and administrative | (272,767) | (79,793) | (198,907) | (57,612) | (51,411) | - | (660,490) | (71,083) | 28,452 | (703,121) |
Gain (loss) on disposal of property, plant and equipment and intangibles | 20,490 | 3,200 | (162) | (259) | (2,359) | - | 20,910 | - | - | 20,910 |
Other operating income, net | 66,744 | 6,667 | 73,203 | 12,598 | (933) | - | 158,279 | 1,875 | - | 160,154 |
Operating income before finance income (expenses) and share of profit (loss) of subsidiaries, joint ventures and associates | 248,191 | 238,964 | 158,644 | 141,571 | (54,791) | - | 732,579 | (46,711) | - | 685,868 |
Share of profit (loss) of subsidiaries, joint ventures and associates | 1,128 | 36 | 345 | 354 | - | - | 1,863 | (27,561) | - | (25,698) |
Operating income before finance income (expenses) and income and social contribution taxes | 249,319 | 239,000 | 158,989 | 141,925 | (54,791) | - | 734,442 | (74,272) | - | 660,170 |
Depreciation of PP&E and amortization of intangible assets charges | 156,700 | 94,202 | 126,361 | 30,843 | 41,368 | - | 449,474 | 9,038 | - | 458,512 |
Amortization of contractual assets with customers – exclusive rights | 150,041 | 813 | - | - | - | - | 150,854 | - | - | 150,854 |
Amortization of right-of-use assets | 86,655 | 18,609 | 6,062 | 9,305 | 35,950 | - | 156,581 | 2,047 | - | 158,628 |
Total of depreciation and amortization | 393,396 | 113,624 | 132,423 | 40,148 | 77,318 | - | 756,909 | 11,085 | - | 767,994 |
(1) Includes in the line “General and administrative” the amount of R$ 68,940 in 2021 (R$ 47,303 in 2020) of expenses related to Ultrapar's holding structure, including the Presidency, Financial Board, Legal Board, Board of Directors and Fiscal Council, Risk, Compliance and Audit Board and Sustainability Board.
(2) The “Others” column consists of financial income and expenses, income tax and social contribution of the segments, the parent company Ultrapar and the subsidiaries Serma, Imaven Imóveis Ltda. (“Imaven”), Ultrapar International, UVC Investimentos, UVC - Fundo de investimento and equity of joint ventures of ConectCar and RPR.
Ultrapar Participações S.A. and Subsidiaries
Notes to the Parent’s Separate and Consolidated Interim Financial Information
(In thousands of Brazilian Reais, unless otherwise stated)
| 06/30/2021 | |||||||||
Cash flow | Ipiranga | Ultragaz | Oxiteno | Ultracargo | Extrafarma | Abastece aí | Subtotal | Others | Elimination | Total |
Segments | (3) | |||||||||
Acquisition of property, plant, and equipment | 109,981 | 174,580 | 96,980 | 177,916 | 10,856 | 251 | 570,564 | 1,150 | - | 571,714 |
Acquisition of intangible assets | 45,470 | 11,170 | 8,290 | 5,954 | 9,905 | 15,998 | 96,787 | 63 | - | 96,850 |
Payments of contractual assets with customers – exclusive rights | 83,632 | - | - | - | - | - | 83,632 | - | - | 83,632 |
|
|
|
|
|
|
|
|
|
|
|
| 06/30/2020 | |||||||||
Cash flow | Ipiranga | Ultragaz | Oxiteno | Ultracargo | Extrafarma | Abastece aí | Subtotal | Others | Elimination | Total |
Segments | (3) | |||||||||
Acquisition of property, plant, and equipment | 100,217 | 113,612 | 82,970 | 45,079 | 6,420 | - | 348,298 | 6,189 | - | 354,487 |
Acquisition of intangible assets | 33,684 | 15,109 | 3,366 | 29 | 11,252 | - | 63,440 | 15,167 | - | 78,607 |
Payments of contractual assets with customers – exclusive rights | 231,767 | 4,812 | - | - | - | - | 236,579 | - | - | 236,579 |
|
|
|
|
|
|
|
|
|
|
|
| 06/30/2021 | |||||||||
Assets | Ipiranga | Ultragaz | Oxiteno | Ultracargo | Extrafarma | Abastece aí | Subtotal | Others | Elimination | Total |
Segments | (3) | |||||||||
Total assets (excluding intersegment transactions) | 19,105,893 | 3,002,424 | 8,878,349 | 2,656,420 | 1,477,289 | 132,440 | 35,252,815 | 720,364 | - | 35,973,179 |
|
|
|
|
|
|
|
|
|
|
|
| 12/31/2020 | |||||||||
Assets | Ipiranga | Ultragaz | Oxiteno | Ultracargo | Extrafarma | Abastece aí | Subtotal | Others | Elimination | Total |
Segments | (3) | |||||||||
Total assets (excluding intersegment transactions) | 18,761,207 | 2,927,061 | 8,892,850 | 2,197,675 | 1,845,038 | 85,787 | 34,709,618 | 1,540,544 | - | 36,250,162 |
(3) The “Others” column comprises the parent company Ultrapar (including goodwill from certain acquisitions) and the subsidiaries Serma, Imaven, Ultrapar International, UVC Investimentos and UVC - Fundo de investimento.
Ultrapar Participações S.A. and Subsidiaries
Notes to the Parent’s Separate and Consolidated Interim Financial Information
(In thousands of Brazilian Reais, unless otherwise stated)
|
| 06/30/2021 |
| 06/30/2020 |
Income before financial result, income and social contribution taxes |
| 611,498 |
| 660,170 |
Financial result, net |
| (336,436) |
| (247,958) |
Income before income and social contribution taxes |
| 275,062 |
| 412,212 |
|
|
|
|
|
Additions to PP&E and intangible assets (excluding intersegment account balances): |
|
|
|
|
Ultragaz |
| 185,750 |
| 128,721 |
Ipiranga |
| 158,135 |
| 139,395 |
Oxiteno |
| 105,784 |
| 88,949 |
Ultracargo |
| 184,000 |
| 47,123 |
Extrafarma |
| 20,761 |
| 17,672 |
Abastece aí |
| 16,249 |
| - |
|
| 670,679 |
| 421,860 |
Others (1) |
| 1,213 |
| 21,358 |
Total additions to PP&E and intangible assets (see Notes 14 and 15) |
| 671,892 |
| 443,218 |
Asset retirement obligation – fuel tanks (see Note 21) |
| (112) |
| (59) |
Provision for demobilization of machinery and equipment |
| 16 |
| (406) |
Capitalized borrowing costs |
| (3,232) |
| (9,659) |
Total investments in PP&E and intangible assets (cash flow) |
| 668,564 |
| 433,094 |
Addition on contractual assets with customers – exclusive rights (see Note 11): |
|
|
|
|
Ipiranga |
| 241,938 |
| 288,027 |
Ultragaz |
| - |
| 4,812 |
Total |
| 241,938 |
| 292,839 |
(1) The “Others” column comprises the parent company Ultrapar (including goodwill from certain acquisitions) and the subsidiaries Serma, Imaven, Ultrapar International, UVC Investimentos and UVC – Fundo de investimento.
Ultrapar Participações S.A. and Subsidiaries
Notes to the Parent’s Separate and Consolidated Interim Financial Information
(In thousands of Brazilian Reais, unless otherwise stated)
b. Geographic area information
The right-of-use assets, PP&E and intangible assets of the Company and its subsidiaries are located in Brazil, except those related to Oxiteno’ plants abroad, as shown below:
| 06/30/2021 |
| 12/31/2020 |
United States of America | 1,072,094 |
| 1,152,876 |
Mexico | 146,391 |
| 163,042 |
Uruguay | 86,730 |
| 90,347 |
| 1,305,215 |
| 1,406,265 |
The subsidiaries generate revenue from operations in Brazil, United Stated of America, Mexico and Uruguay, as well as from exports of products to foreign customers, as disclosed below:
| 06/30/2021 |
| 06/30/2020 |
Net revenue from sale and services: |
|
|
|
Brazil | 51,394,328 |
| 36,361,460 |
United States of America and Canada | 353,305 |
| 292,373 |
Argentina | 293,730 |
| 204,537 |
Other Latin American countries | 142,659 |
| 69,695 |
Mexico | 130,906 |
| 115,595 |
Far East | 25,154 |
| 49,859 |
Europe | 89,744 |
| 82,073 |
Uruguay | 15,493 |
| 44,179 |
Others | 31,019 |
| 43,601 |
Total | 52,476,338 |
| 37,263,372 |
Sales to the foreign market are made substantially by the Oxiteno.
Ultrapar Participações S.A. and Subsidiaries
Notes to the Parent’s Separate and Consolidated Interim Financial Information
(In thousands of Brazilian Reais, unless otherwise stated)
33. Risks and financial instruments (Consolidated)
a. Risk management and financial instruments – governance
The main risks to which the Company and its subsidiaries are exposed reflect strategic/operational and economic/financial aspects. Operational/strategic risks (including, but not limited to, demand behavior, competition, technological innovation, and material changes in the industry structure) are addressed by the Company’s management model. Economic/financial risks primarily reflect default of customers, behavior of macroeconomic variables, such as exchange and interest rates, as well as the characteristics of the financial instruments used by the Company and its subsidiaries and their counterparties. These risks are managed through control policies, specific strategies, and the establishment of limits.
The Company has a policy for the management of resources, financial instruments, and risks approved by its Company’s Board of Directors (“Policy”). In accordance with the Policy, the main objectives of financial management are to preserve the value and liquidity of financial assets and ensure financial resources for the development of the business, including expansions. The main financial risks considered in the Policy are market risks (currencies, interest rates and commodities), liquidity and credit. The governance of the management of financial risks follows the segregation of duties below:
The execution of the Policy has done by corporate financial board, through its treasury department, with the assistance of the accounting, legal and tax departments.
The monitoring of compliance of the Policy and possible issues is the responsibility of the Risk and Investment Committee, (“Committee”), which is composed of Chief Financial Officer (“CFO”), Treasury Director, Controller and other directors designated by the CFO and which meet quarterly. The monthly monitoring of Policy standards is responsibility of the CFO.
Approval of the Policy and the periodic assessment of Company exposure to financial risks are subject to the approval of the Company’s Board of Directors of Ultrapar.
The Audit and Risks Committee advises the Company’s Board of Directors in the assessment of controls, management and exposure of financial risks and revision of Policy. The Risk, Compliance and Audit board monitors of standards compliance of the Policy and reports to the Audit and Risks Committee the risks exposure and compliance or noncompliance of the Policy.
Ultrapar Participações S.A. and Subsidiaries
Notes to the Parent’s Separate and Consolidated Interim Financial Information
(In thousands of Brazilian Reais, unless otherwise stated)
b. Currency risk
Most transactions of the Company, through its subsidiaries, are located in Brazil and therefore, the reference currency for risk management is the Brazilian Real. Currency risk management is guided by neutrality of currency exposures and considers the risks of the Company and its subsidiaries and their exposure to changes in exchange rates. The Company considers as its main currency exposures the changes in assets and liabilities in foreign currency.
The Company and its subsidiaries use exchange rate hedging instruments (especially between the Brazilian Real and the U.S. dollar) available in the financial market to protect their assets, liabilities, receipts, and disbursements in foreign currency and net investments in foreign operations. Hedge is used in order to reduce the effects of changes in exchange rates on the Company´s income and cash flows in Brazilian Reais within the exposure limits under its Policy. Such foreign exchange hedging instruments have amounts, periods, and rates substantially equivalent to those of assets, liabilities, receipts, and disbursements in foreign currencies to which they are related.
Assets and liabilities in foreign currencies are stated below, translated into Brazilian Reais:
b.1 Assets and liabilities in foreign currencies
| 06/30/2021 |
| 12/31/2020 |
Assets in foreign currency |
|
|
|
Cash, cash equivalents and financial investments in foreign currency (except hedging instruments) | 1,584,306 |
| 1,413,276 |
Foreign trade receivables, net of allowance for doubtful accounts and advances to foreign customers | 354,697 |
| 307,829 |
Other assets | 1,708,001 |
| 1,767,626 |
| 3,647,004 |
| 3,488,731 |
Liabilities in foreign currency |
|
|
|
Financing in foreign currency, gross of transaction costs and discount | (8,801,972) |
| (9,246,707) |
Payables arising from imports, net of advances to foreign suppliers | (888,431) |
| (633,013) |
| (9,690,403) |
| (9,879,720) |
Foreign currency hedging instruments | 4,652,564 |
| 4,837,554 |
Net liability position – total | (1,390,835) |
| (1,553,435) |
Net asset position – income statement effect | 85,842 |
| 186,306 |
Net liability position – equity effect | (1,476,677) |
| (1,739,741) |
Ultrapar Participações S.A. and Subsidiaries
Notes to the Parent’s Separate and Consolidated Interim Financial Information
(In thousands of Brazilian Reais, unless otherwise stated)
b.2 Sensitivity analysis of assets and liabilities in foreign currency
Scenarios I, II and III were based on 10%, 25% and 50% variations, respectively, applied on the net position of the Company exposed to the currency risk, simulating the effects of appreciation and devaluation of the Real in the income statement and the equity:
The table below shows, in the three scenarios, the effects of exchange rate changes on the net liability position of R$ 1,390,835 in foreign currency as of June 30, 2021:
| Risk | Scenario I | Scenario II | Scenario III | ||
|
| Base | 25% | 50% | ||
(1) Income statement effect | Real devaluation | 8,584 | 21,460 | 42,921 | ||
(2) Equity effect | (147,668) | (369,169) | (738,338) | |||
(1) + (2) | Net effect | (139,084) | (347,709) | (695,417) | ||
|
|
|
|
| ||
(3) Income statement effect | Real appreciation | (8,584) | (21,460) | (42,921) | ||
(4) Equity effect | 147,668 | 369,169 | 738,338 | |||
(3) + (4) | Net effect | 139,084 | 347,709 | 695,417 |
The table below shows, in the three scenarios, the effects of exchange rate changes on the net liability position of R$ 1,553,435 in foreign currency as of December 31, 2020:
| Risk | Scenario I | Scenario II | Scenario III | ||
|
| Base | 25% | 50% | ||
(1) Income statement effect | Real devaluation | 18,631 | 46,577 | 93,153 | ||
(2) Equity effect | (173,974) | (434,935) | (869,871) | |||
(1) + (2) | Net effect | (155,343) | (388,358) | (776,718) | ||
|
|
|
|
| ||
(3) Income statement effect | Real appreciation | (18,631) | (46,577) | (93,153) | ||
(4) Equity effect | 173,974 | 434,935 | 869,871 | |||
(3) + (4) | Net effect | 155,343 | 388,358 | 776,718 |
The equity effect refers to cumulative translation adjustments of changes in the exchange rate on equity of foreign subsidiaries (see Notes 2.s.1 and 25.g.2), net investments hedge in foreign entities, cash flow hedge of firm commitment and highly probable transaction (see Note 2.c and “h. Hedge Accounting” below).
c. Interest rate risk
The Company and its subsidiaries adopt policies for borrowing and investing financial resources and for capital cost minimization. The financial investments of the Company and its subsidiaries are primarily held in transactions linked to the DI, as set forth in Note 4. Borrowings primarily relate to financing from Banco do Brasil, as well as debentures and borrowings in foreign currency, as shown in Note 16.
The Company attempts to maintain most of its financial interest assets and liabilities at floating rates.
Ultrapar Participações S.A. and Subsidiaries
Notes to the Parent’s Separate and Consolidated Interim Financial Information
(In thousands of Brazilian Reais, unless otherwise stated)
c.1 Assets and liabilities exposed to floating interest rates
The financial assets and liabilities exposed to floating interest rates are demonstrated below:
| Note | 06/30/2021 |
| 12/31/2020 |
DI |
|
|
|
|
Cash equivalents | 4.a | 2,273,358 |
| 2,241,852 |
Financial investments | 4.b | 1,793,838 |
| 3,749,852 |
Loans and debentures | 16.a | (5,574,054) |
| (6,947,362) |
Liability position of foreign exchange hedging instruments – DI | 33.g | (2,130,192) |
| (2,124,146) |
Liability position of fixed interest instruments + IPCA – DI | 33.g | (1,369,609) |
| (2,203,705) |
Net liability position in DI |
| (5,006,659) |
| (5,283,509) |
TJLP |
|
|
|
|
Loans – TJLP | 16.a | (24,037) |
| (29,803) |
Net liability position in TJLP |
| (24,037) |
| (29,803) |
LIBOR |
|
|
|
|
Asset position of foreign exchange hedging instruments – LIBOR | 33.g | 250,119 |
| 260,958 |
Loans – LIBOR | 16.a | (552,684) |
| (573,484) |
Net liability position in LIBOR |
| (302,565) |
| (312,526) |
Total net liability position exposed to floating interest |
| (5,333,261) |
| (5,625,838) |
Ultrapar Participações S.A. and Subsidiaries
Notes to the Parent’s Separate and Consolidated Interim Financial Information
(In thousands of Brazilian Reais, unless otherwise stated)
c.2 Sensitivity analysis of floating interest rate risk
For sensitivity analysis of floating interest rate risk, the Company used the accumulated amount of the reference indexes (DI, TJLP, LIBOR and SELIC) as a base scenario. Scenarios I, II and III were based on 10%, 25% and 50% variations, respectively, applied in the floating interest rate of the base scenario:
The tables below show the incremental expenses and income that would be recognized in finance income, due to the effect of floating interest rate changes in different scenarios.
|
| 06/30/2021 | ||||
| Risk | Scenario I | Scenario II | Scenario III | ||
|
| Base | 25% | 50% | ||
Exposure of interest rate risk |
|
|
|
| ||
Interest effect on cash equivalents and financial | Increase in DI | 4,997 | 12,493 | 24,985 | ||
Interest effect on debt in DI | Increase in DI | (7,984) | (19,960) | (39,921) | ||
Interest rate hedging instruments (liabilities in DI) effect | Increase in DI | (8,053) | (15,499) | (27,908) | ||
Incremental expenses |
| (11,040) | (22,966) | (42,844) | ||
|
|
|
|
| ||
Interest effect on debt in TJLP | Increase in TJLP | (61) | (152) | (305) | ||
Incremental expenses |
| (61) | (152) | (305) | ||
|
|
|
|
| ||
Foreign exchange hedging instruments (assets in LIBOR) effect | Increase in LIBOR | 1,966 | 2,062 | 2,222 | ||
Interest effect on debt in LIBOR | Increase in LIBOR | (824) | (937) | (1,124) | ||
Incremental expenses |
| 1,142 | 1,125 | 1,098 | ||
|
| 12/31/2020 | ||||
| Risk | Scenario I | Scenario II | Scenario III | ||
|
| Base | 25% | 50% | ||
Exposure of interest rate risk |
|
|
|
| ||
Interest effect on cash equivalents and financial | Increase in DI | 13,175 | 32,937 | 65,875 | ||
Interest effect on debt in DI | Increase in DI | (19,674) | (49,184) | (98,368) | ||
Interest rate hedging instruments (liabilities in DI) effect | Increase in DI | (1,137) | (11,934) | (29,929) | ||
Incremental expenses |
| (7,636) | (28,181) | (62,422) | ||
|
|
|
|
| ||
Interest effect on debt in TJLP | Increase in TJLP | (301) | (752) | (1,503) | ||
Incremental expenses |
| (301) | (752) | (1,503) | ||
|
|
|
|
| ||
Foreign exchange hedging instruments (assets in LIBOR) effect | Increase in LIBOR | 528 | 1,320 | 2,640 | ||
Interest effect on debt in LIBOR | Increase in LIBOR | (1,410) | (3,525) | (7,050) | ||
Incremental expenses |
| (882) | (2,205) | (4,410) | ||
|
|
|
|
| ||
Interest effect on debt in SELIC | Increase in SELIC | (41) | (102) | (203) | ||
Incremental expenses |
| (41) | (102) | (203) | ||
Ultrapar Participações S.A. and Subsidiaries
Notes to the Parent’s Separate and Consolidated Interim Financial Information
(In thousands of Brazilian Reais, unless otherwise stated)
d. Credit risks
The financial instruments that would expose the Company and its subsidiaries to credit risks of the counterparty are basically represented by cash and bank deposits, financial investments, hedging instruments (see Note 4), and trade receivables (see Note 5).
d.1 Credit risk of financial institutions
Such risk results from the inability of financial institutions to comply with their financial obligations to the Company and its subsidiaries due to insolvency. The Company and its subsidiaries regularly conduct a credit review of the institutions with which they hold cash and cash equivalents, financial investments, and hedging instruments through various methodologies that assess liquidity, solvency, leverage, portfolio quality, etc. Cash and cash equivalents, financial investments, and hedging instruments are held only with institutions with a solid credit history, chosen for safety and soundness. The volume of cash and cash equivalents, financial investments, and hedging instruments are subject to maximum limits by each institution and, therefore, require diversification of counterparties.
d.2 Government credit risk
The Company's policy allows investments in government securities from countries classified as investment grade AAA or aaa by specialized credit rating agencies (S&P, Moody’s and Fitch) and in Brazilian government bonds. The volume of such financial investments is subject to maximum limits by each country and, therefore, requires diversification of counterparties.
The credit risk of financial institution and government of cash, cash equivalents and financial investments is summarized below:
|
| Fair value | ||
Counterparty credit rating |
| 06/30/2021 |
| 12/31/2020 |
AAA |
| 6,123,777 |
| 8,190,428 |
AA |
| 728,794 |
| 317,894 |
A |
| 126,169 |
| 163,838 |
Total |
| 6,978,740 |
| 8,672,160 |
Ultrapar Participações S.A. and Subsidiaries
Notes to the Parent’s Separate and Consolidated Interim Financial Information
(In thousands of Brazilian Reais, unless otherwise stated)
d.3 Customer credit risk
The credit policy establishes the analysis of the profile of each new customer, individually, regarding their financial condition. The review carried out by the subsidiaries of the Company includes the evaluation of external ratings, when available, financial statements, credit bureau information, industry information and, when necessary, bank references. Credit limits are established for each customer and reviewed periodically, in a shorter period the greater the risk, depending on the approval of the responsible area in cases of sales that exceed these limits.
In monitoring credit risk, customers are grouped according to their credit characteristics and depending on the business the grouping takes into account, for example, whether they are natural or legal clients, whether they are wholesalers, resellers or final customers, considering also the geographic area.
The expected of credit losses are calculated by the expected loss approach based on the probability of default rates. Loss rates are calculated on the basis of the average probability of a receivable amount to advance through successive stages of default until full write-off. The probability of default calculation takes into account a credit risk score for each exposure, based on data considered to be capable of foreseeing the risk of loss (external classifications, audited financial statements, cash flow projections, customer information available in the press, for example), with addition of the credit assessment based on experience.
Such credit risks are managed by each business unit through specific criteria for acceptance of customers and their credit rating and are additionally mitigated by the diversification of sales. No single customer or group accounts for more than 10% of total revenue.
The subsidiaries of the Company request guarantees related to trade receivables and other receivables in specific situations to customers, but these guarantees don’t influence in the calculation of risk of loss. The subsidiaries of the Company maintained the following allowance for expected losses on doubtful accounts balances on trade receivables:
| 06/30/2021 |
| 12/31/2020 |
Ipiranga | 433,313 |
| 447,389 |
Ultragaz | 121,732 |
| 113,621 |
Oxiteno | 16,319 |
| 16,430 |
Extrafarma | 85 |
| 73 |
Ultracargo | 1,563 |
| 1,594 |
Total | 573,012 |
| 579,107 |
Ultrapar Participações S.A. and Subsidiaries
Notes to the Parent’s Separate and Consolidated Interim Financial Information
(In thousands of Brazilian Reais, unless otherwise stated)
The table below presents information about credit risk exposure:
| 06/30/2021 |
| 12/31/2020 | ||||||||
| Weighted average rate of losses |
| Accounting balance |
| Provision for losses |
| Weighted average rate of losses |
| Accounting balance |
| Provision for losses |
Current | 0.9% |
| 4,274,682 |
| 40,563 |
| 1.2% |
| 3,751,067 |
| 44,091 |
less than 30 days | 1.9% |
| 151,404 |
| 2,841 |
| 2.2% |
| 134,836 |
| 2,939 |
31-60 days | 6.7% |
| 37,835 |
| 2,551 |
| 8.2% |
| 43,207 |
| 3,563 |
61-90 days | 9.8% |
| 27,237 |
| 2,666 |
| 10.9% |
| 42,589 |
| 4,630 |
91-180 days | 44.0% |
| 64,725 |
| 28,501 |
| 36.8% |
| 76,158 |
| 28,062 |
more than 180 days | 56.3% |
| 881,092 |
| 495,890 |
| 55.7% |
| 890,756 |
| 495,822 |
|
|
| 5,436,975 |
| 573,012 |
|
|
| 4,938,613 |
| 579,107 |
The information about expected losses on doubtful accounts balances by geographic area are as follows:
| 06/30/2021 |
| 12/31/2020 |
Brazil | 562,555 |
| 568,461 |
Uruguay | - |
| 76 |
Other Latin American countries | 604 |
| 271 |
United States of America and Canada | 1,072 |
| 1,146 |
Europe | 8,757 |
| 9,120 |
Others | 24 |
| 33 |
| 573,012 |
| 579,107 |
For further information about the allowance for expected losses on doubtful accounts, see Notes 5.a and 5.b.
Ultrapar Participações S.A. and Subsidiaries
Notes to the Parent’s Separate and Consolidated Interim Financial Information
(In thousands of Brazilian Reais, unless otherwise stated)
d.4 Price risk
The Company and its subsidiaries are exposed to commodity price risk, due the fluctuation in prices for diesel and gasoline, among others. These products are traded on the stock exchange and are subjected to the impacts of macroeconomic and geopolitical factors outside the control of the Company and its subsidiaries.
To mitigate the risk of the fluctuation of diesel and gasoline prices, the Company and its subsidiaries permanently monitor the market, seeking to protection of price movements through hedge transactions for cargo purchased in the international market, used contracts of derivative for heating oil (diesel) and RBOB (gasoline) traded on the stock exchange.
The table below shows the positions of derivative financial instruments to hedge commodity price risk at June 30, 2021:
Derivative |
| Contract |
| Notional amount (m3) |
| Notional amount (USD thousands) |
| Fair value (R$ thousands) | ||||||||||
|
| Position |
| Product |
| Maturity |
| 06/30/2021 |
| 12/31/2020 |
| 06/30/2021 |
| 12/31/2020 |
| 06/30/2021 |
| 12/31/2020 |
Term |
| Sold |
| Heating Oil |
| jul-21 |
| 137,365 |
| 108,429 |
| 77,418 |
| 42,399 |
| 931 |
| (563) |
Term |
| Sold |
| RBOB |
| jul-21 |
| 6,201 |
| - |
| 3,650 |
| - |
| (109) |
| - |
|
|
|
|
|
|
|
|
|
|
|
|
|
|
|
| 822 |
| (563) |
Ultrapar Participações S.A. and Subsidiaries
Notes to the Parent’s Separate and Consolidated Interim Financial Information
(In thousands of Brazilian Reais, unless otherwise stated)
e. Liquidity risk
The Company and its subsidiaries’ main sources of liquidity derive from (i) cash, cash equivalents, and financial investments, (ii) cash generated from operations and (iii) financing. The Company and its subsidiaries believe that these sources are sufficient to satisfy their current funding requirements, which include, but are not limited to, working capital, capital expenditures, amortization of debt, and payment of dividends.
The Company and its subsidiaries periodically examine opportunities for acquisitions and investments. They consider different types of investments, either directly, through joint ventures, or through associated companies, and finance such investments using cash generated from operations, debt financing, through capital increases, or through a combination of these methods.
The Company and its subsidiaries believe to have sufficient working capital and sources of financing to meet their current needs. On June 2021, the gross indebtedness due over the next twelve months totaled R$ 3,490,899, including estimated interests on loans (for quantitative information, see Note 16.a). Furthermore, the investments for 2021 totaled R$ 1,890,763. Until the first and second quarters, R$ 676,385 were realized. On June 30, 2021, the Company and its subsidiaries had R$ 6,216,280 in cash, cash equivalents, and short-term financial investments (for quantitative information, see Note 4).
The table below presents a summary of financial liabilities as of June 30, 2021 by the Company and its subsidiaries, listed by maturity. The amounts disclosed in this table are the contractual undiscounted cash outflows, and, therefore, these amounts may be different from the amounts disclosed on the balance sheet.
Financial liabilities | Total | Less than 1 year | Between 1 and 3 years | Between 3 and 5 years | More than 5 years |
Loans including future contractual interest (1) (2) | 19,398,805 | 3,490,899 | 6,260,149 | 1,413,804 | 8,233,953 |
Currency and interest rate hedging instruments (3) | 823,115 | 232,420 | 214,437 | 193,796 | 182,462 |
Trade payables | 5,492,599 | 5,492,599 | - | - | - |
Leases payable | 2,631,790 | 403,363 | 673,310 | 498,079 | 1,057,038 |
(1) To calculate the estimated interest on loans some macroeconomic assumptions were used, including averaging for the period the following: (i) DI of % 4.29% to 2021, 8.17% to 2022 and 9.01% to 2023; (ii) exchange rate of the Real against the U.S. dollar of R$ 5.19 in 2021, R$ 5.52 in 2022, R$ 5.37 in 2023, R$ 5.10 in 2024, R$ 4.90 in 2025, R$ 4.81 in 2026, R$ 4.84 in 2027, R$ 4.86 in 2028 and R$ 4.88 in 2029; (iii) TJLP of 4.88%; (iv) IPCA of 6.97% in 2021, 3.70% in 2022, 3.3% in 2023, 3.1% in 2024 and 3.0% as from 2025; (v) exchange rate of the Real against the mexican peso of R$ 0.26; (vii) exchange rate of the mexican peso against the U.S. dollar of MXN 19.65 in 2021. (source: B3, Bulletin Focus and financial institutions).
(2) Includes estimated interest payments on short-term and long-term loans until the payment date.
(3) The currency and interest rate hedging instruments were estimated based on projected U.S dollar futures contracts and the futures curves of DI x Pre and DI x IPCA contracts quoted on B3 on June 30, 2021 and on the futures curve of LIBOR (ICE – Intercontinental Exchange) and commodities heating oil and RBOB contracts quoted on New York Mercantile Exchange (“NYMEX”) on June 30, 2021. In the table above, only the hedging instruments with negative results at the time of settlement were considered.
Ultrapar Participações S.A. and Subsidiaries
Notes to the Parent’s Separate and Consolidated Interim Financial Information
(In thousands of Brazilian Reais, unless otherwise stated)
f. Capital management
The Company manages its capital structure based on indicators and benchmarks. The key performance indicators related to the capital structure management are the weighted average cost of capital, net debt / EBITDA, interest coverage, and indebtedness / equity ratios. Net debt is composed of cash, cash equivalents, and financial investments (see Note 4) and loans, including debentures (see Note 16). The Company can change its capital structure depending on the economic and financial conditions, in order to optimize its financial leverage and capital management. The Company seeks to improve its return on invested capital by implementing efficient working capital management and a selective investment program.
g. Selection and use of financial instruments
In selecting financial investments and hedging instruments, an analysis is conducted to estimate rates of return, risks involved, liquidity, calculation methodology for the carrying value and fair value, and a review is conducted of any documentation applicable to the financial instruments. The financial instruments used to manage the financial resources of the Company and its subsidiaries are intended to preserve value and liquidity.
The Policy contemplates the use of derivative financial instruments only to cover identified risks and in amounts consistent with the risk (limited to 100% of the identified risk). The risks identified in the Policy are described in the above sections and are subject to risk management. In accordance with the Policy, the Company and its subsidiaries can use forward contracts, Swaps, options, and futures contracts to manage identified risks. Leveraged derivative instruments are not permitted. Because the use of derivative financial instruments is limited to the coverage of identified risks, the Company and its subsidiaries use the term “hedging instruments” to refer to derivative financial instruments.
Ultrapar Participações S.A. and Subsidiaries
Notes to the Parent’s Separate and Consolidated Interim Financial Information
(In thousands of Brazilian Reais, unless otherwise stated)
The table below summarizes the position of hedging instruments entered by the Company and its subsidiaries:
Designated as hedge accounting |
|
|
|
|
|
|
|
|
|
|
|
|
|
|
| ||
|
|
|
|
|
|
|
|
|
|
|
|
|
|
|
|
|
|
Product |
| Hedged object |
| Rates agreement |
| Maturity |
| Note |
| Notional amount 1 |
| Fair value | |||||
|
|
|
| Assets | Liabilities |
|
|
|
|
| 06/30/2021 |
| 12/31/2020 |
| 06/30/2021 |
| 12/31/2020 |
Foreign exchange swap |
| Debt |
| USD + 4.58 % | 103.91% DI |
| sep-23 |
| 33.h.1 |
| USD 185,000 |
| USD 185,000 |
| 252,326 |
| 298,889 |
Foreign exchange swap |
| Debt |
| USD + LIBOR-3M + 1.14% | 105.00% DI |
| jun-22 |
| 33.h.1 |
| USD 50,000 |
| USD 50,000 |
| 87,765 |
| 94,782 |
Interest rate swap |
| Debt |
| 4.40% + IPCA | 101.44% DI |
| mar-28 |
| 33.h.1 |
| R$ 1,266,054 |
| R$ 806,054 |
| 188,061 |
| 203,837 |
Interest rate swap |
| Debt |
| 6.47% | 99.94% DI |
| nov-24 |
| 33.h.1 |
| R$ 90,000 |
| R$ 90,000 |
| (3,684) |
| 3,498 |
Term |
| Firm commitments |
| BRL | Heating Oil/RBOB |
| jul-21 |
| 33.h.1 |
| USD 81,068 |
| USD 42,399 |
| 822 |
| (563) |
NDF |
| Firm commitments |
| BRL | USD |
| jul-21 |
| 33.h.1 |
| USD 65,354 |
| USD 23,124 |
| 1,106 |
| (733) |
|
|
|
|
|
|
|
|
|
|
|
|
|
|
| 526,396 |
| 599,710 |
Not designated as hedge accounting |
|
|
|
|
|
|
|
|
|
|
|
|
| ||
|
|
|
|
|
|
|
|
|
|
|
|
|
|
|
|
Product |
| Hedged object |
| Rates agreement |
| Maturity |
| Notional amount 1 |
| Fair value | |||||
|
|
|
| Assets | Liabilities |
|
|
| 06/30/2021 |
| 12/31/2020 |
| 06/30/2021 |
| 12/31/2020 |
Foreign exchange swap |
| Debt |
| USD + 0.18% | 55.5% DI |
| jun-29 |
| USD 320,000 |
| USD 320,000 |
| 454,168 |
| 519,260 |
NDF |
| Firm commitments |
| BRL | USD |
| sep-21 |
| USD 460,771 |
| USD 378,550 |
| (174,228) |
| (112,152) |
Interest rate swap |
| Debt |
| 2.67% | 100% DI |
| - |
| - |
| R$ 1,300,000 |
| - |
| (5) |
Interest rate swap |
| Debt |
| 5.25% | DI - 1.36% |
| jun-29 |
| USD 300,000 |
| - |
| (40,323) |
| - |
|
|
|
|
|
|
|
|
|
|
|
|
| 239,617 |
| 407,103 |
(1) Currency as indicated.
All transactions mentioned above were properly registered with CETIP S.A.
Ultrapar Participações S.A. and Subsidiaries
Notes to the Parent’s Separate and Consolidated Interim Financial Information
(In thousands of Brazilian Reais, unless otherwise stated)
h. Hedge accounting
The Company and its subsidiaries use derivative and non-derivative financial instruments for hedging purposes and test, throughout the duration of the hedge, their effectiveness, as well as the changes in their fair value.
h.1 Fair value hedge
The Company and its subsidiaries designate as fair value hedges certain financial instruments used to offset the variations in interest and exchange rates, which are based on the market value of financing contracted in Brazilian Reais and U.S. dollars.
The foreign exchange hedging instruments designated as fair value hedge are:
In thousands, except the DI % | 06/30/2021 |
| 12/31/2020 |
Notional amount – US$ | 235,000 |
| 235,000 |
Result of hedging instruments – gain/(loss) – R$ | (38,386) |
| 574,378 |
Fair value adjustment of debt – R$ | 6,980 |
| (13,131) |
Finance expense in the statements of profit or loss – R$ | 28,209 |
| (597,735) |
Average effective cost – DI % | 104.1 |
| 104.1 |
For more information, see Note 16.c.1.
The interest rate hedging instruments designated as fair value hedge are:
In thousands, except the DI % | 06/30/2021 |
| 12/31/2020 |
Notional amount – US$ | 1,266,054 |
| 806,054 |
Result of hedging instruments – gain/(loss) – R$ | (3,841) |
| 67,446 |
Fair value adjustment of debt – R$ | 56,833 |
| (18,446) |
Finance expense in the statements of profit or loss – R$ | (21,904) |
| (99,555) |
Average effective cost – DI % | 101.4 |
| 95.8 |
For more information, see Notes 16.f.2, 16.f.4, 16.f.6, 16.f.8 and 16.f.9.
In thousands, except the DI % | 06/30/2021 |
| 12/31/2020 |
Notional amount – US$ | 90,000 |
| 90,000 |
Result of hedging instruments – gain/(loss) – R$ | (5,352) |
| 6,528 |
Fair value adjustment of debt – R$ | 7,041 |
| 3,250 |
Finance expense in the statements of profit or loss – R$ | 4,178 |
| (8,968) |
Average effective cost – DI % | 99.9 |
| 99.9 |
For more information, see Note 16.f.7.
Ultrapar Participações S.A. and Subsidiaries
Notes to the Parent’s Separate and Consolidated Interim Financial Information
(In thousands of Brazilian Reais, unless otherwise stated)
The foreign exchange hedging instruments and commodities designated as fair value hedge are as described below. The purpose of this relationship is to transform the cost of the imported product from fixed to variable until the moment of blend the fuel, as occurs with the price practiced in its sales. The subsidiary IPP realizes these operations with over-the-counter derivatives that are designated in a hedge accounting relationship, as a fair value hedge in an amount equivalent to the inventories of imported product.
In thousands, except the DI % | 06/30/2021 |
| 12/31/2020 |
Notional amount – US$ | 146,422 |
| 65,523 |
Result of hedging instruments – gain/(loss) – R$ | (83,666) |
| (87,448) |
Fair value adjustment of inventories – R$ | (15,468) |
| 18,468 |
h.2 Cash flow hedge
The Company and its subsidiaries designate, as cash flow hedge of firm commitment and highly probable transactions, derivative financial instruments to hedge firm commitments and non-derivative financial instruments to hedge highly probable future transactions, to hedge against fluctuations arising from changes in exchange rate.
On June 30, 2021, the notional amount of foreign exchange hedging instruments for highly probable future transactions designated as cash flow hedge, related to notes in the foreign market totaled US$ 427,501 (US$ 468,215 on December 31, 2020). On June 30, 2021, the unrealized gain of “Other comprehensive income” is R$ 107,807 (loss of R$ 315,403 on December 31, 2020), net of deferred IRPJ and CSLL.
h.3 Net investment hedge in foreign entities
The Company and its subsidiaries designate, as net investment hedge in foreign entities, notes in the foreign market, for hedging net investment in foreign entities, to offset changes in exchange rates.
On June 30, 2021 the balance of foreign exchange hedging instruments designated as net investments hedge in foreign entities, related to part of the investments made in entities which functional currency is other than the Brazilian Real, totaled US$ 95,000 (US$ 95,000 on December 31, 2020).On June 30, 2021, the gain of “Other comprehensive income” is R$ 12,195 (loss of R$ 73,108 on December 31, 2020), net of deferred income and social contribution taxes. The effects of exchange rate changes on investments and hedging instruments were offset in equity.
Ultrapar Participações S.A. and Subsidiaries
Notes to the Parent’s Separate and Consolidated Interim Financial Information
(In thousands of Brazilian Reais, unless otherwise stated)
i. Gains (losses) on hedging instruments
The following tables summarize the value of gains (losses) recognized, which affected the equity of the Company and its subsidiaries:
| 06/30/2021 | ||
| Profit or loss |
| Equity |
a – Exchange rate derivates receivable in U.S. dollars (i) and (ii) and commodities | (147,187) |
| - |
b – Interest rate swaps in R$ (iii) | (26,901) |
| - |
c – Non-derivative financial instruments (iv) | 78,178 |
| (617,469) |
Total | (95,910) |
| (617,469) |
| 06/30/2020 |
| 12/31/2020 |
| Profit or loss |
| Equity |
a – Exchange rate derivates receivable in U.S. dollars (i) and (ii) and commodities | 388,391 |
| - |
b – Exchange rate derivates payable in U.S. dollars (ii) | (365,777) |
| 80 |
c – Interest rate swaps in R$ (iii) | 22,872 |
| - |
d – Non-derivative financial instruments (iv) | (833,572) |
| (737,471) |
Total | (788,086) |
| (737,391) |
(i) Does not consider the effect of exchange rate variation of exchange Swaps receivable in U.S. dollars when this effect is offset in the gain or loss of the hedged item (debt/firm commitments).
(ii) Considers the designation effect of foreign exchange hedging.
(iii) Considers the designation effect of interest rate hedging in Brazilian Reais; and
(iv) Considers the results of notes in the foreign market (for further information see Note 16.b).
Ultrapar Participações S.A. and Subsidiaries
Notes to the Parent’s Separate and Consolidated Interim Financial Information
(In thousands of Brazilian Reais, unless otherwise stated)
j. Fair value of financial instruments
The fair values and the carrying values of the financial instruments, including currency and interest rate hedging instruments, are stated below:
|
|
| 06/30/2021 |
| 12/31/2020 | ||||
| Category | Note | Carrying value |
| Fair value |
| Carrying value |
| Fair value |
Financial assets: |
|
|
|
|
|
|
|
|
|
Cash and cash equivalents |
|
|
|
|
|
|
|
|
|
Cash and bank | Measured at amortized cost | 4.a | 562,570 |
| 562,570 |
| 405,081 |
| 405,081 |
Financial investments in local currency | Measured at fair value through other comprehensive income | 4.a | 2,273,358 |
| 2,273,358 |
| 2,241,852 |
| 2,241,852 |
Financial investments in foreign currency | Measured at fair value through profit or loss | 4.a | 24,359 |
| 24,359 |
| 14,561 |
| 14,561 |
Financial investments: |
|
|
|
|
|
|
|
|
|
Fixed-income securities and funds in local currency | Measured at fair value through profit or loss | 4.b | 1,544,626 |
| 1,544,626 |
| 3,643,286 |
| 3,643,286 |
Fixed-income securities and funds in local currency | Measured at fair value through other comprehensive income | 4.b | 173,114 |
| 173,114 |
| 31,315 |
| 31,315 |
Fixed-income securities (guarantee of loans) | Measured at amortized cost | 4.b | 76,098 |
| 76,098 |
| 75,251 |
| 75,251 |
Fixed-income securities and funds in foreign currency | Measured at fair value through other comprehensive income | 4.b | 1,462,369 |
| 1,462,369 |
| 1,278,940 |
| 1,278,940 |
Currency and interest rate hedging and commodities instruments | Measured at fair value through profit or loss | 4.b | 862,246 |
| 862,246 |
| 981,874 |
| 981,874 |
Trade Receivables | Measured at amortized cost | 5.a | 3,886,788 |
| 3,860,039 |
| 3,391,122 |
| 3,369,766 |
Reseller Financing | Measured at amortized cost | 5.b | 977,175 |
| 973,797 |
| 968,384 |
| 965,645 |
Total |
|
| 11,842,703 |
| 11,812,576 |
| 13,031,666 |
| 13,007,571 |
|
|
|
|
|
|
|
|
|
|
Financial liabilities: |
|
|
|
|
|
|
|
|
|
Financing | Measured at fair value through profit or loss | 16.a | 1,255,458 |
| 1,255,458 |
| 1,308,928 |
| 1,308,928 |
Financing | Measured at amortized cost | 16.a | 7,770,930 |
| 8,346,227 |
| 9,406,013 |
| 10,186,947 |
Debentures | Measured at amortized cost | 16.a | 5,319,723 |
| 5,276,394 |
| 5,450,751 |
| 5,363,621 |
Debentures | Measured at fair value through profit or loss | 16.a | 1,538,626 |
| 1,538,626 |
| 1,093,365 |
| 1,093,365 |
Leases payable | Measured at amortized cost | 13 | 1,795,718 |
| 1,795,718 |
| 1,833,288 |
| 1,833,288 |
Commodities, currency and interest rate hedging instruments | Measured at fair value through profit or loss | 16.a | 220,894 |
| 220,894 |
| 117,159 |
| 117,159 |
Trade payables | Measured at amortized cost | 17 | 5,492,599 |
| 5,428,931 |
| 4,040,652 |
| 4,008,457 |
Subscription warrants – indemnification | Measured at fair value through profit or loss | 24 | 65,645 |
| 65,645 |
| 86,439 |
| 86,439 |
Total |
|
| 23,459,593 |
| 23,927,893 |
| 23,336,595 |
| 23,998,204 |
Ultrapar Participações S.A. and Subsidiaries
Notes to the Parent’s Separate and Consolidated Interim Financial Information
(In thousands of Brazilian Reais, unless otherwise stated)
The fair value of financial instruments, including currency and interest hedging instruments, was determined as follows:
- The fair value of cash and bank deposit balances are identical to their carrying values.
- Financial investments in investment funds are valued at the value of the fund unit as of the date of the financial statements, which corresponds to their fair value.
- Financial investments in CDBs (Bank Certificates of Deposit) and similar investments offer daily liquidity through repurchase at the “yield curve” and the Company calculates their fair value through methodologies commonly used for mark to the market.
- The fair value of trade receivables and trade payables are approximate to their carrying values and the Company calculates its fair value through methodologies commonly used in the market.
- The subscription warrants – indemnification was measured based on the share price of Ultrapar (UGPA3) at the financial statements date and are adjusted to the Company’s dividend yield, since the exercise is only possible starting in 2020 onwards and they are not entitled to dividends until then. The number of shares of subscription warrants – indemnification is also adjusted according to the changes in the amounts of provision for tax, civil, and labor risks and contingent liabilities related to the period prior to January 31, 2014 (see Note 24).
- The fair value calculation of notes in the foreign market is based on the quoted price in an active market (see Note 16.b).
The fair value of other financial investments, financing and leases payable was determined using calculation methodologies commonly used for mark-to-market reporting, which consist of calculating future cash flows associated with each instrument adopted and adjusting them to present value at the market rates as of the date of the financial statements. For some cases where there is no active market for the financial instrument, the Company and its subsidiaries can use quotes provided by the transaction counterparties.
The interpretation of market information on the choice of calculation methodologies for the fair value requires considerable judgment and estimates to obtain a value deemed appropriate to each situation. Consequently, the estimates presented do not necessary indicate the amounts that may be realizable in the current market.
Financial instruments were classified as financial assets or liabilities measured at amortized cost, except (i) all exchange rate and interest rate hedging instruments, which are measured at fair value through profit or loss, financial investments classified as measured at fair value through profit or loss and financial investments that are classified as measured at fair value through other comprehensive income (see Note 4.b), (ii) loans and financing measured at fair value through profit or loss (see Note 16.a), (iii) guarantees to customers that have vendor arrangements (see Note 16.i), which are measured at fair value through profit or loss, and (iv) subscription warrants – indemnification, which are measured at fair value through profit or loss (see Note 24). Cash, banks, trade receivables and reseller financing are classified as measured at amortized cost. Trade payables, leases payable and other payables are classified as financial liabilities measured at amortized cost.
Ultrapar Participações S.A. and Subsidiaries
Notes to the Parent’s Separate and Consolidated Interim Financial Information
(In thousands of Brazilian Reais, unless otherwise stated)
j.1 Fair value hierarchy of financial instruments
The financial instruments are classified in the following categories:
(a) Level 1 – prices negotiated (without adjustment) in active markets for identical assets or liabilities;
(b) Level 2 – inputs other than prices negotiated in active markets included in Level 1 and observable for the asset or liability, either directly (as prices) or indirectly (derived from prices).
The table below shows the categories of the financial assets and financial liabilities:
| Category | Note | 06/30/2021 |
| Level 1 |
| Level 2 |
Financial assets: |
|
|
|
|
|
|
|
Cash and cash equivalents |
|
|
|
|
|
|
|
Cash and bank | Measured at amortized cost | 4.a | 562,570 |
| - |
| - |
Financial investments in local currency | Measured at fair value through other comprehensive income | 4.a | 2,273,358 |
| - |
| 2,273,358 |
Financial investments in foreign currency | Measured at fair value through profit or loss | 4.a | 24,359 |
| 24,359 |
| - |
Financial investments: |
|
|
|
|
|
|
|
Fixed-income securities and funds in local currency | Measured at fair value through profit or loss | 4.b | 1,544,626 |
| 1,544,626 |
| - |
Fixed-income securities and funds in local currency | Measured at fair value through other comprehensive income | 4.b | 173,114 |
| - |
| 173,114 |
Fixed-income securities (guarantee of loans) | Measured at amortized cost | 4.b | 76,098 |
| - |
| - |
Fixed-income securities and funds in foreign currency | Measured at fair value through other comprehensive income | 4.b | 1,462,369 |
| 29,013 |
| 1,433,356 |
Currency and interest rate hedging and commodities instruments | Measured at fair value through profit or loss | 4.b | 862,246 |
| - |
| 862,246 |
Trade Receivables | Measured at amortized cost | 5.a | 3,860,039 |
| - |
| - |
Reseller Financing | Measured at amortized cost | 5.b | 973,797 |
| - |
| - |
Total |
|
| 11,812,576 |
|
|
|
|
|
|
|
|
|
|
|
|
Financial liabilities: |
|
|
|
|
|
|
|
Financing | Measured at fair value through profit or loss | 16.a | 1,255,458 |
| - |
| 1,255,458 |
Financing | Measured at amortized cost | 16.a | 8,346,227 |
| - |
| - |
Debentures | Measured at amortized cost | 16.a | 5,276,394 |
| - |
| - |
Debentures | Measured at fair value through profit or loss | 16.a | 1,538,626 |
| - |
| 1,538,626 |
Leases payable | Measured at amortized cost | 13 | 1,795,718 |
| - |
| - |
Commodities, currency and interest rate hedging instruments | Measured at fair value through profit or loss | 16.a | 220,894 |
| - |
| 220,894 |
Trade payables | Measured at amortized cost | 17 | 5,428,931 |
| - |
| - |
Subscription warrants – indemnification (1) | Measured at fair value through profit or loss | 24 | 65,645 |
| - |
| 65,645 |
Total |
|
| 23,927,893 |
|
|
|
|
Ultrapar Participações S.A. and Subsidiaries
Notes to the Parent’s Separate and Consolidated Interim Financial Information
(In thousands of Brazilian Reais, unless otherwise stated)
| Category | Note | 12/31/2020 |
| Level 1 |
| Level 2 |
Financial assets: |
|
|
|
|
|
|
|
Cash and cash equivalents |
|
|
|
|
|
|
|
Cash and bank | Measured at amortized cost | 4.a | 405,081 |
| - |
| - |
Financial investments in local currency | Measured at fair value through other comprehensive income | 4.a | 2,241,852 |
| - |
| 2,241,852 |
Financial investments in foreign currency | Measured at fair value through profit or loss | 4.a | 14,561 |
| 14,561 |
| - |
Financial investments: |
|
|
|
|
|
|
|
Fixed-income securities and funds in local currency | Measured at fair value through profit or loss | 4.b | 3,643,286 |
| 3,643,286 |
| - |
Fixed-income securities and funds in local currency | Measured at fair value through other comprehensive income | 4.b | 31,315 |
| - |
| 31,315 |
Fixed-income securities (guarantee of loans) | Measured at amortized cost | 4.b | 75,251 |
| - |
| - |
Fixed-income securities and funds in foreign currency | Measured at fair value through other comprehensive income | 4.b | 1,278,940 |
| 30,245 |
| 1,248,695 |
Currency and interest rate hedging and commodities instruments | Measured at fair value through profit or loss | 4.b | 981,874 |
| - |
| 981,874 |
Trade Receivables | Measured at amortized cost | 5.a | 3,369,766 |
| - |
| - |
Reseller Financing | Measured at amortized cost | 5.b | 965,645 |
| - |
| - |
Total |
|
| 13,007,571 |
|
|
|
|
|
|
|
|
|
|
|
|
Financial liabilities: |
|
|
|
|
|
|
|
Financing | Measured at fair value through profit or loss | 16.a | 1,308,928 |
| - |
| 1,308,928 |
Financing | Measured at amortized cost | 16.a | 10,186,947 |
| - |
| - |
Debentures | Measured at amortized cost | 16.a | 5,363,621 |
| - |
| - |
Debentures | Measured at fair value through profit or loss | 16.a | 1,093,365 |
| - |
| 1,093,365 |
Leases payable | Measured at amortized cost | 13 | 1,833,288 |
| - |
| - |
Commodities, currency and interest rate hedging instruments | Measured at fair value through profit or loss | 16.a | 117,159 |
| - |
| 117,159 |
Trade payables | Measured at amortized cost | 17 | 4,008,457 |
| - |
| - |
Subscription warrants – indemnification (1) | Measured at fair value through profit or loss | 24 | 86,439 |
| - |
| 86,439 |
Total |
|
| 23,998,204 |
|
|
|
|
(1) Refers to subscription warrants issued by the Company in the Extrafarma acquisition.
Ultrapar Participações S.A. and Subsidiaries
Notes to the Parent’s Separate and Consolidated Interim Financial Information
(In thousands of Brazilian Reais, unless otherwise stated)
k. Sensitivity analysis of derivative financial instruments
The Company and its subsidiaries use derivative financial instruments only to hedge against identified risks and in amounts consistent with the risk (limited to 100% of the identified risk). Thus, for purposes of sensitivity analysis of market risks associated with financial instruments, the Company analyzes the hedging instrument and the hedged item together, as shown on the charts below.
For the sensitivity analysis of foreign exchange hedging instruments as of June 30, 2021, management adopted as a base scenario the Real/U.S. dollar exchange rates at maturity of each swap, projected by U.S dollar futures contracts quoted on B3. As a reference, the exchange rate for the last maturity of foreign exchange hedging instruments is R$ 8.52 (R$ 8.23 as of December 31, 2020) in the base scenario. Scenarios II and III were estimated with a 25% and 50% additional appreciation or depreciation of the Brazilian Real against the base scenario, according to the risk to which the hedged item is exposed.
Based on the balances of the hedging instruments and hedged items as of June 30, 2021 and December 31, 2020, the exchange rates were replaced, and the changes between the new balance in Brazilian Reais and the original balance in Brazilian Reais were calculated in each of the three scenarios. The table below shows the change in the values of the main derivative instruments and their hedged items, considering the changes in the exchange rate in the different scenarios:
06/30/2021 | Risk | Scenario I Base |
| Scenario II |
| Scenario III |
Currency swaps receivable in U.S. dollars |
|
|
|
|
|
|
(1) U.S. Dollar / Real swaps | Dollar appreciation | 1,168,217 |
| 2,750,902 |
| 4,027,097 |
(2) Debts / firm commitments in dollars | (1,168,261) |
| (2,750,945) |
| (4,027,140) | |
(1)+(2) | Net effect in result | (44) |
| (43) |
| (43) |
|
|
|
|
|
|
|
Currency swaps payable in U.S. dollars |
|
|
|
|
|
|
(3) Real / U.S. Dollar swaps | Dollar devaluation | 12,672 |
| (428,710) |
| (870,092) |
(4) Gross margin of Oxiteno/Ipiranga | (12,672) |
| 428,710 |
| 870,092 | |
(3)+(4) | Net effect in result | - |
| - |
| - |
|
|
|
|
|
|
|
Cash Flow Hedge |
|
|
|
|
|
|
(1) Cash Flow Hedge | Dollar devaluation | 425,097 |
| 1,065,982 |
| 1,706,868 |
(2) Debts | (425,097) |
| (1,065,982) |
| (1,706,868) | |
(1)+(2) | Net effect in equity | - |
| - |
| - |
|
|
|
|
|
|
|
Net Investment |
|
|
|
|
|
|
(1) Net Investment Hedge | Dollar devaluation | 197,551 |
| 365,741 |
| 533,932 |
(2) Debts | (197,551) |
| (365,741) |
| (533,932) | |
(1)+(2) | Net effect in equity | - |
| - |
| - |
Ultrapar Participações S.A. and Subsidiaries
Notes to the Parent’s Separate and Consolidated Interim Financial Information
(In thousands of Brazilian Reais, unless otherwise stated)
12/31/2020 | Risk | Scenario I Base |
| Scenario II |
| Scenario III |
Currency swaps receivable in U.S. dollars |
|
|
|
|
|
|
(1) U.S. Dollar / Real swaps | Dollar appreciation | 1,013,826 |
| 1,522,343 |
| 2,030,860 |
(2) Debts / firm commitments in dollars | (1,013,824) |
| (1,522,330) |
| (2,030,835) | |
(1)+(2) | Net effect in result | 2 |
| 13 |
| 25 |
|
|
|
|
|
|
|
Currency swaps payable in U.S. dollars |
|
|
|
|
|
|
(3) Real / U.S. Dollar swaps | Dollar devaluation | 59 |
| 17,877 |
| 35,694 |
(4) Gross margin of Oxiteno | (59) |
| (17,877) |
| (35,694) | |
(3)+(4) | Net effect in result | - |
| - |
| - |
|
|
|
|
|
|
|
Cash Flow Hedge |
|
|
|
|
|
|
(1) Cash Flow Hedge | Dollar devaluation | 368,439 |
| 1,042,394 |
| 1,716,350 |
(2) Debts | (368,439) |
| (1,042,394) |
| (1,716,350) | |
(1)+(2) | Net effect in equity | - |
| - |
| - |
|
|
|
|
|
|
|
Net Investment |
|
|
|
|
|
|
(1) Net Investment Hedge | Dollar devaluation | 170,315 |
| 336,315 |
| 502,316 |
(2) Debts | (170,315) |
| (336,315) |
| (502,316) | |
(1)+(2) | Net effect in equity | - |
| - |
| - |
For sensitivity analysis of hedging instruments for interest rates in Brazilian Reais as of June 30, 2021 and December 31, 2020, the Company used the futures curve of the DI x Pre contract quoted on B3 as of June 30, 2021 for each of the swap and debt (hedged item) maturities, to determine the base scenario. Scenarios II and III were estimated based on a 25% and 50% deterioration, respectively, of the base scenario pre-fixed interest rate.
Ultrapar Participações S.A. and Subsidiaries
Notes to the Parent’s Separate and Consolidated Interim Financial Information
(In thousands of Brazilian Reais, unless otherwise stated)
Based on the three scenarios of interest rates in Brazilian Reais, the Company estimated the values of its debt and hedging instruments according to the risk which is being hedged (variations in the pre-fixed interest rates in Brazilian Reais), by projecting them to future value at the contracted rates and bringing them to present value at the interest rates of the estimated scenarios. The results are shown in the table below:
06/30/2021 | Risk | Scenario I Base |
| Scenario II |
| Scenario III |
Interest rate swap (Real) – Debentures - CRA |
|
|
|
|
|
|
(1) Fixed rate swap - DI | Decrease in Pre-fixed rate | (562,771) |
| (468,376) |
| (362,370) |
(2) Fixed rate debt | 562,771 |
| 468,376 |
| 362,370 | |
(1)+(2) | Net effect in result | - |
| - |
| - |
12/31/2020 | Risk | Scenario I Base |
| Scenario II |
| Scenario III |
Interest rate swap (Real) – Debentures - CRA |
|
|
|
|
|
|
(1) Fixed rate swap - DI | Decrease in Pre-fixed rate | (39,412) |
| (230,705) |
| (187,597) |
(2) Fixed rate debt | 39,412 |
| 230,705 |
| 187,597 | |
(1)+(2) | Net effect in result | - |
| - |
| - |
For the sensitivity analysis of the commodity price swings hedging instruments on June 30, 2020 and December 31, 2020, the Company used the futures heating oil and gasoline (RBOB) contracts quoted on NYMEX. Scenarios II and III were estimated based on 25% and 50% deterioration, respectively, of the base scenario commodity price.
Based on the balances of the hedging instruments and the objects hedged on June 30, 2021 and December 31, 2020, prices were substituted and the variations between the new balance in Reais and the balance in Reais in the report date were calculated in each of the three scenarios. The table below shows the variation of the amounts of the derivative instruments and their objects of hedge, considering the variations in commodity prices in the different scenarios:
06/30/2021 | Risk | Scenario I Base |
| Scenario II |
| Scenario III |
NDF Commodities |
|
|
|
|
|
|
(1) NDF Commodities | Decrease in Commodities Price | - |
| 1,011,322 |
| 2,022,643 |
(2) Gross margin from Ipiranga | - |
| (1,011,322) |
| (2,022,643) | |
(1)+(2) | Net effect in result | - |
| - |
| - |
12/31/2020 | Risk | Scenario I Base |
| Scenario II |
| Scenario III |
NDF Commodities |
|
|
|
|
|
|
(1) NDF Commodities | Decrease in Commodities Price | - |
| 551,794 |
| 1,103,589 |
(2) Gross margin from Ipiranga | - |
| (551,794) |
| (1,103,589) | |
(1)+(2) | Net effect in result | - |
| - |
| - |
Ultrapar Participações S.A. and Subsidiaries
Notes to the Parent’s Separate and Consolidated Interim Financial Information
(In thousands of Brazilian Reais, unless otherwise stated)
34. Commitments (Consolidated)
a. Contracts
a.1 Subsidiary Ultracargo Logística has agreements with CODEBA, with the Complexo Industrial Portuário Governador Eraldo Gueiros and with the company Empresa Maranhense de Administração Portuária, in connection with its port facilities in Aratu, Suape and Itaqui, respectively. Such agreements establish a minimum cargo movement of products, as shown below:
Port | Minimum movement per year | Maturity |
Aratu | 900,000 ton. | 2022 |
Suape | 250,000 ton. | 2027 |
Suape | 400,000 ton. | 2029 |
Aratu | 465,403 ton. | 2031 |
Itaqui | 1,222,377 m³ | 2049 |
If the annual movement is less than the minimum contractual movement, the subsidiary is liable to pay the difference between the effective movement and the minimum contractual movement, based on the port tariff rates in effect on the date established for payment. As of June 30, 2021, these rates were R$ 8.37 and R$ 2.67 per ton for Aratu and Suape, respectively and R$ 0.78 per m³ for Itaqui. According to contractual conditions and tolerances, on June 30, 2021 there were not material pending issues regarding the minimum purchase limits of the contract.
a.2 Subsidiary Oxiteno S.A. has a supply agreement with Braskem S.A. which establishes and regulates the conditions for the supply of ethylene to Oxiteno based on the international market for this product. These contracts establish a minimum commitment to according to the table below:
Plant | Minimum purchase (tons) per year | Maturity |
Camaçari | 205,000 | 2021 |
Mauá | 44,100 | 2023 |
Should the minimum purchase commitment not be met, the subsidiary would be liable for a fine based on the current ethylene price for the quantity not purchased. According to contractual conditions and tolerances, on June 30, 2021 there are no material issues regarding the minimum purchase commitment.
Ultrapar Participações S.A. and Subsidiaries
Notes to the Parent’s Separate and Consolidated Interim Financial Information
(In thousands of Brazilian Reais, unless otherwise stated)
b. Insurance coverage
The Company is supported by insurance policies with the objective of covering several risks to which it is exposed.
In the insurance policies the maximum compensation values based on the risk analysis of certain locations.
The General Liability Insurance program covers the Ultrapar and its subsidiaries with a maximum aggregate coverage of US$ 250 million.
The Company maintains liability insurance policies for directors, executive officers and council to indemnify Ultrapar and its subsidiaries in the total amount of US$ 80 million.
Until July 2021, the Company maintained an insurance policy against cyber risks with maximum coverage of R$ 100 million.
In addition, group life and personal accident, health and national and international transportation and other insurance policies are also maintained.
The coverage and limit of the insurance policies are based on study of risks and losses conducted by independent insurance advisors, being the type and amounts of insurance are considered by management to be sufficient to cover potential losses based that may occur in view of the nature of the activities conducted by the companies.
Ultrapar Participações S.A. and Subsidiaries
Notes to the Parent’s Separate and Consolidated Interim Financial Information
(In thousands of Brazilian Reais, unless otherwise stated)
c. Area port lease
On March 22, 2019, Ultrapar, through its subsidiary IPP, won the port concessions of three areas with minimum storage capacity of 64 thousand m³ (not reviewed) located at the port of Cabedelo, in the state of Paraíba, and one area with minimum storage capacity of 66 thousand m³ (not reviewed) at the port of Vitória, in the state of Espírito Santo, which will be designated for handling, storage and distribution of fuels. These concessions were carried out by two consortiums of which IPP holds one third of the total participation. For the port of Cabedelo, the companies Nordeste Logística I, Nordeste Logística II and Nordeste Logística III were incorporated, in partnership with Raízen Combustível S.A. and Petrobrás Distribuidora S.A. For the port of Vitória, the company Navegantes was incorporated, in partnership with Raízen Combustível S.A. and Petrobrás Distribuidora S.A. The total investments regarding IPP’s stake sums up to R$160 million (not reviewed) for a concession term of 25 years.
On April 5, 2019, Company, through its subsidiary IPP and Ultracargo Logística, also won three concessions. IPP won two concessions in the port of Miramar, in Belém, state of Pará: (i) area BEL02A, through a consortium 50% owned by IPP, that shall have minimum storage capacity of 41 thousand m³, and (ii) area BEL04, which is currently operated by IPP with minimum storage capacity of 23 thousand m³. Such areas will be operated for at least 15 years, according to the auction notice. For the area BEL02A, Latitude was incorporated, together with Petróleo Sabbá S.A.. Ultracargo Logística won the concession of area VDC12 in the port of Vila do Conde, in Barcarena, state of Pará. The minimum storage capacity will be 59 thousand m³. The area will be operated by Ultracargo Logística for at least 25 years, according to the auction notice. For the area VDC12, Tequimar Vila do Conde was incorporated (see Note 3.b). The estimated investments regarding the participation of IPP and Ultracargo Logística sums up to R$ 450 million, approximately, to be disbursed throughout the five years subsequent to the auction, including the auction grants and the minimum investment required for these areas.
On April 9, 2021, the Company, through its subsidiary Ultracargo Logística, won the auction for leasing the IQI13 area in the Itaqui port, State of Maranhão, for storage and handling of liquid bulk products, specially fuels. In the leased area, a new terminal will be built with a minimum installed capacity of 79 thousand cubic meters. The lease will have a minimum duration of 20 years according to the auction notice. For this capacity, an investment of approximately R$ 310 million is estimated, including the amount related to the grant, to be disbursed in up to six years after signature of the contract.
35. Subsequent events
a. Issuance of Extrafarma subscription warrants
On August 11, 2021, the Company’s Board of Directors confirmed the issuance of 31,032 common shares within the authorized capital limit provided by the art. 6 of the Bylaws, due to the partial exercise of the rights conferred by the subscription warrants (see Note 24) issued by the Company when the merger of all Extrafarma shares by the Company, approved by the extraordinary general meeting of the Company held in January 31, 2014. The share capital of the Company will therefore be represented by 1,115,107,683 common shares, all of which are registered and with no par value.

SãoPaulo, August 11, 2021 – Ultrapar Participações S.A. (“Company”, “Ultra Group” or “Ultrapar”, B3: UGPA3 / NYSE: UGP), a company engaged in the oil & gas chain through Ipiranga, Ultragaz and Ultracargo, specialty chemicals through Oxiteno and retail pharmacy with Extrafarma, today announces its results for the second quarter of 2021.
Net revenues | Recurring EBITDA¹ | Net income¹ |
R$ 29 billion | R$ 898 | R$ 290 million |
|
|
|
Investments | Cash flow from operations – 1H21 | Market cap |
R$ 398 | R$ 1.3 | R$ 21 billion |
¹ Does not include impairment at Extrafarma of R$ 395 million
Highlights
- Record quarterly results registered at Ultracargo and Oxiteno.
- Earnings progression and net debt reduction allowed Ultrapar to reach the lowest level of financial leverage of the last two years.
- Approval of R$ 218 million in dividends for the 1H21, equivalent to R$ 0.20 per share.
- Start-up of operations of the new Itaqui and Vila do Conde terminals ahead of schedule, generating additional revenues and results for Ultracargo already in 2021.
- Advance on the Ultrapar’s portfolio review process, with the announcement of Extrafarma and ConectCar divestments, consistent with the strategy disclosed by the Company. Extrafarma's divestment led to the recognition of an impairment of R$ 395 million in 2Q21, with no cash effects.
- Hosting of The Ultra Series – Meet Ultrapar’s Leaders event in July with Marcello Farrel, AmPm’s Executive Officer, to detail the new convenience store concept and the company-operated stores model, in addition to the discussion on the AmPm’s growth and profitability plans.
- Publishing of the Ultra Group’s 2020 Integrated Report in May, including the disclosure of ESG indicators and initiatives in the environmental, social and governance areas. Donation of R$ 1.5 million to the Butantã Institute, for the purchase of equipment for the new production plant of vaccines against COVID-19 (ButanVac) and influenza.

|  |

Update on strategic initiatives |
Portfolio review – Transactions announced during 2Q21
1) Extrafarma
- Signing of the sale agreement on May 18 for the enterprise value of R$ 700 million.
- Extraordinary General Shareholders’ Meeting to grant right of first refusal held on June 25 and term of exercise of such rights terminated on July 29. Total exercise below 1% of Extrafarma’s capital.
- Recognition of an impairment of Extrafarma's assets of R$ 395 million in 2Q21, with no cash effects.
2) ConectCar
- Signing of the sale agreement of the 50% stake held by Ultrapar on June 25, for the enterprise value of R$ 165 million.
- Approval by the Brazilian Antitrust Authority (CADE), with no restrictions, on July 28.
Expansion projects
1) Ultracargo
- Start-up of operations of 25 thousand m³ in Itaqui already on the first half of the year and another 21 thousand m³ concluded in Jul/21, with an average tightening of five months in the original schedule.
- Expected start-up of operations of 110 thousand m³ in Vila do Conde terminal accelerated from 1Q22 to 4Q21, with gradual ramp-up of the capacity.
2) Ultragaz
- Operational start-up of the plants in Fortaleza (state of Ceará) and Belém (state of Pará) expected for the end of 4Q21.
3) Ipiranga
- Operational start-up of storage facilities in Cabedelo (state of Paraíba), Fortaleza (state of Ceará) and Miritituba (state of Pará) in 2021/2022.
4) AmPm
- Opening of 66 company-operated stores year-to-date, totaling 121 stores until July.
|  |

Considerations on the financial and operational information |
The financial information presented in this document was prepared in accordance with the International Financial Reporting Standards (IFRS) norms. The financial information of Ultrapar corresponds to the Company’s consolidated information. The information on Ultragaz, Ultracargo, Oxiteno, Ipiranga and Extrafarma are presented without the elimination of intersegment transactions. Therefore, the sum of such information may not correspond to Ultrapar’s consolidated information. Additionally, the financial and operational information presented in this document is subject to rounding and consequently, the total amounts presented in the tables and charts may differ from the direct numerical sum of the amounts that precede them.
The financial information presented in this document includes the adoption of the IFRS 16 norm and the segregation of certain expenses pertaining to the holding.
Information denominated EBITDA – Earnings Before Interest, Taxes on Income and Social Contribution on Net Income, Depreciation and Amortization; Adjusted EBITDA – adjusted by the amortization of contractual assets with customers – exclusive rights and by the cash flow hedge from bonds; and EBIT – Earnings Before Interest and Taxes on Income and Social Contribution on Net Income are presented in accordance to Instruction No. 527, issued by the Brazilian Securities and Exchange Commission – CVM on October 4, 2012. The calculation of EBITDA based on net income is shown below:
| Quarter | Accumulated | |||||||||
| R$ million | 2Q21 | 2Q20 | 1Q21 | 1H21 | 1H20 | |||||
| Net income | (18.2) | 50.0 | 137.4 | 119.2 | 218.9 | |||||
| (+) Income and social contribution taxes | 54.9 | 56.2 | 101.0 | 155.9 | 193.3 | |||||
| (+) Net financial (income) expenses | 2.8 | 80.3 | 333.7 | 336.4 | 248.0 | |||||
| (+) Depreciation and amortization | 335.7 | 313.4 | 332.7 | 668.4 | 617.1 | |||||
| EBITDA | 375.1 | 500.0 | 904.8 | 1,279.9 | 1,277.3 | |||||
| Adjustments | ||||||||||
| (+) Amortization of contractual assets with customers - exclusive rights (Ipiranga) | 80.3 | 67.5 | 47.8 | 128.1 | 150.0 | |||||
| (+) Amortization of contractual assets with customers - exclusive rights (Ultragaz) | 0.4 | 0.5 | 0.4 | 0.8 | 0.8 | |||||
| (+) Cash flow hedge from bonds (Oxiteno) | 47.7 | 43.1 | 43.3 | 91.0 | 62.7 | |||||
| Adjusted EBITDA | 503.5 | 611.0 | 996.3 | 1,499.8 | 1,490.9 | |||||
| Ultragaz | 136.5 | 205.7 | 150.2 | 286.8 | 352.6 | |||||
| Ultracargo | 100.2 | 91.5 | 92.5 | 192.7 | 182.1 | |||||
| Oxiteno | 273.8 | 161.6 | 226.9 | 500.7 | 354.1 | |||||
| Ipiranga | 421.8 | 178.7 | 563.0 | 984.8 | 658.6 | |||||
| Extrafarma | (373.0) | 13.7 | 11.5 | (361.5) | 22.5 | |||||
| Holding¹/Others | (55.9) | (40.1) | (47.9) | (103.7) | (79.0) | |||||
| Non-recurring items that affected EBITDA | ||||||||||
| (-) Tax credits (Oxiteno) | - | - | - | - | (70.9) | |||||
| (-) Tax credits (Ultracargo) | - | (11.7) | - | - | (11.7) | |||||
| (+) Impairment (Extrafarma) | 394.7 | - | - | 394.7 | - | |||||
| Recurring EBITDA | 898.1 | 599.3 | 996.3 | 1,894.4 | 1,408.2 | |||||
| Ultragaz | 136.5 | 205.7 | 150.2 | 286.8 | 352.6 | |||||
| Ultracargo | 100.2 | 79.8 | 92.5 | 192.7 | 170.3 | |||||
| Oxiteno | 273.8 | 161.6 | 226.9 | 500.7 | 283.2 | |||||
| Ipiranga | 421.8 | 178.7 | 563.0 | 984.8 | 658.6 | |||||
| Extrafarma | 21.6 | 13.7 | 11.5 | 33.2 | 22.5 | |||||
| Holding¹/Others | (55.9) | (40.1) | (47.9) | (103.7) | (79.0) | |||||
¹ Mainly expenses related to the governance bodies (Board of Directors, Fiscal Council, Committees), to the Presidency, Financial Department and areas linked to the Group's strategy, risk management, portfolio management and capital allocation, such as IR and M&A
|  |

Ultrapar |
Amounts in R$ million | 2Q21 | 2Q20 | 1Q21 | Δ | Δ | 1H21 | 1H20 | Δ |
2Q21 v 2Q20 | 2Q21 v 1Q21 | 1H21 v 1H20 | ||||||
Net revenues | 28,526 | 15,876 | 23,950 | 80% | 19% | 52,476 | 37,263 | 41% |
Adjusted EBITDA | 503 | 611 | 996 | (18%) | (49%) | 1,500 | 1,491 | 1% |
Recurring EBITDA¹ | 898 | 599 | 996 | 50% | (10%) | 1,894 | 1,408 | 35% |
Depreciation and amortization² | 416 | 381 | 381 | 9% | 9% | 797 | 768 | 4% |
Financial result³ | (50) | (123) | (377) | (59%) | (87%) | (427) | (311) | 38% |
Net income | (18) | 50 | 137 | n/a | n/a | 119 | 219 | (46%) |
Net income ex-impairment | 290 | 50 | 137 | n/a | 111% | 428 | 219 | 95% |
Earnings per share attributable to shareholders4 | 0.26 | 0.04 | 0.12 | n/a | 110% | 0.38 | 0.19 | 103% |
Investments5 | 398 | 361 | 294 | 10% | 35% | 691 | 711 | -3% |
Cash flow from operations | 1,150 | 871 | 128 | 32% | n/a | 1,278 | 1,803 | -29% |
¹ Does not include Oxiteno’s tax credits of R$ 71 million in 1Q20, Ultracargo’s tax credits of R$ 12 million in 2Q20, and impairment at Extrafarma of R$ 395 million in 2Q21
² Includes amortization of contractual assets with clients – exclusive rights
³ Includes the result of the cash flow hedge from bonds
4 Calculated in Reais based on the weighted average number of shares over the period, net of shares held in treasury
5 Includes R$ 29 million related to the grant of Ultracargo's terminal in Vila do Conde in 1Q21
Net revenues – Total of R$ 28,526 million, an increase of 80% and 19% in relation to 2Q20 and 1Q21, respectively, due to increased revenues in all businesses, mainly Ipiranga.
Recurring EBITDA – Total of R$ 898 million, excluding the impairment at Extrafarma (no cash effects), an increase of 50% compared to 2Q20, due to the increase in EBITDA by Ipiranga, Oxiteno, Ultracargo and Extrafarma, attenuated by the lower EBITDA at Ultragaz. Compared to the 1Q21, EBITDA reduced 10% due to the lower EBITDA at Ipiranga and Ultragaz, despite the increase of Oxiteno, Ultracargo and Extrafarma.
Results from the holding, affiliates and abastece aí – In addition to the results of the five main businesses, Ultrapar recorded a negative result of R$ 56 million, mainly composed of (i) R$ 38 million of negative EBITDA with the holding, R$ 17 million higher than in 2Q20, mainly due to increased expenses with strategic projects, (ii) R$ 14 million of negative EBITDA with abastece aí (new digital payment company), due to expenses with technology and marketing to consolidate the performance and expansion of the application and loyalty program and (iii) R$ 3 million of negative EBITDA from affiliates.
Depreciation and amortization – Total of R$ 416 million (+9%), due to the increase in investments made over the last twelve months and higher amortization of contractual assets at Ipiranga. In relation to 1Q21, total costs and expenses with depreciation and amortization were 9% higher, due to the higher amortization of contractual assets at Ipiranga.
Financial result (including cash flow hedge) – Ultrapar recognized net financial expenses of R$ 50 million in 2Q21, compared to net financial expenses of R$ 123 million in 2Q20, mainly due to accrued interest from extraordinary tax credits related to the ICMS exclusion from the PIS/Cofins calculation basis in the amount of R$ 73 million in 2Q21. Compared to the 1Q21, when Ultrapar recognized net financial expenses of R$ 377 million, the difference is explained by the improvement in the mark-to-market of the hedges of the bonds and the accrued interest from tax credits, as mentioned above.
Net income ex-impairment – Total of R$ 290 million, an increase of R$ 240 million compared to 2Q20, due to the increase in EBITDA and improvement in financial result. In relation to 1Q21, the increase of 111% resulted mainly from the improvement in the financial result, despite the lower EBITDA.
Cash flow from operations – Generation of R$ 1.3 billion in the 1H21, compared to the generation of R$ 1.8 billion in the 1H20, due to the increased investments in working capital for the period, mainly due to increases in fuel and raw material prices, attenuated by the increase in EBITDA.
|  |

Ultragaz |
| 2Q21 | 2Q20 | 1Q21 | Δ | Δ | 1H21 | 1H20 | Δ |
2Q21 v 2Q20 | 2Q21 v 1Q21 | 1H21 v 1H20 | ||||||
Total volume (000 tons) | 439 | 432 | 406 | 1% | 8% | 845 | 854 | (1%) |
Bottled | 299 | 313 | 274 | (4%) | 9% | 573 | 600 | (5%) |
Bulk | 140 | 120 | 132 | 17% | 6% | 272 | 253 | 7% |
EBITDA (R$ million) | 137 | 206 | 150 | (34%) | (9%) | 287 | 353 | (19%) |
Operational performance – The volume sold by Ultragaz in 2Q21 increased by 1% in relation to 2Q20. The bottled segment decreased by 4%, mainly due to the peak demand for LPG bottles in 2Q20 at the beginning of the pandemic. The bulk segment, on the other hand, increased 17% in sales volume, due to sales growth in the industrial, commercial and services segments that were the most impacted by the pandemic in 2020. Compared to 1Q21, the volume sold increased by 8%, reflecting the seasonality between the quarters, and slightly above the market growth.
Net revenues – Total of R$ 2,346 million (+36%), due mainly to the increase in LPG cost. Compared to 1Q21, net revenues were 15% higher, for the same reason mentioned above.
Cost of goods sold – Total of R$ 2,115 million (+47%), mainly due to the readjustments of LPG costs by Petrobras. In relation to 1Q21, the cost of goods sold increased by 17%, arising from the same reason mentioned above, in addition to the increase in freight costs (due to the stoppage of REPAR refinery), requalification of tanks and maintenance.
Sales, general and administrative expenses – Total of R$ 159 million, an increase of 17% in relation to 2Q20, due to the increase in personnel and freight expenses. Compared to 1Q21, the sales, general and administrative expenses increased 9%, mainly due to the increase in expenses with freight and marketing (launching of the new brand).
EBITDA – Total of R$ 137 million (-34%), due to the strong comparative basis in 2Q20 and the consecutive increases in LPG costs and expenses for the period, attenuated by the increase in volume sold. In relation to 1Q21, the decrease was 9%, arising from the partial pass through of LPG cost increases and higher freight expenses, due to the increase in product handling.
Investments – The investments totaled R$ 104 million in this quarter, mainly allocated to the acquisition and replacement of bottles, to the new plants in Belém (state of Pará) and Fortaleza (state of Ceará), and to equipment installed in new customers in the bulk segment.
|  |

Ultracargo |
| 2Q21 | 2Q20 | 1Q21 | Δ | Δ | 1H21 | 1H20 | Δ |
2Q21 v 2Q20 | 2Q21 v 1Q21 | 1H21 v 1H20 | ||||||
Installed capacity¹ (000 m³) | 859 | 832 | 843 | 3% | 2% | 851 | 827 | 3% |
m³ sold (000 m³) | 3,155 | 2,963 | 3,137 | 7% | 1% | 6,292 | 6,112 | 3% |
EBITDA (R$ million) | 100 | 92 | 93 | 9% | 8% | 193 | 182 | 6% |
Recurring EBITDA² (R$ million) | 100 | 80 | 93 | 26% | 8% | 193 | 170 | 13% |
1 Monthly average
2 Does not include the effect of tax credits of R$ 12 million in 2Q20
Operational performance – Ultracargo’s average installed capacity increased 3% in relation to 2Q20, as a result of the capacity expansions in Itaqui started in the last twelve months. The m³ sold increased 7%, mainly due to the increase in fuels handling in Itaqui. In relation to 1Q21, the m³ sold increased 1%, due to the increase in fuels handling in Santos, Aratu and Itaqui, attenuated by the reduction of ethanol handling in Suape.
Net revenues – Total of R$ 176 million (+13%), due to the contractual readjustments and increase in fuels handling. Compared to 1Q21, net revenues increased 2%, arising from the contractual readjustments and increase in the m³ sold.
Cost of services provided – Total of R$ 70 million (+6%), mainly due to the strong increase in product handling, as well as rental readjustments and increase in depreciation, arising from the capacity expansions. In relation to 1Q21, the cost of services provided increased 2%, because of the increase in handling and maintenance costs, attenuated by a reduction of personnel costs.
Sales, general and administrative expenses – Total of R$ 34 million (+19%), arising from the increase in expenses incurred with information technology and engineering services to support expansion projects, productivity gains and digital transformation, in addition to depreciation expenses. In relation to 1Q21, the sales, general and administrative expenses remained almost stable.
Other operating results – Reduction of R$ 6 million in relation to 2Q20, mainly arising from the R$ 12 million of extraordinary PIS/Cofins credits in 2Q20. Increase of R$ 5 million compared to 1Q21, mainly due to the one-off positive effect of tax credits in this quarter.
EBITDA – Ultracargo reached a record EBITDA level of R$ 100 million (+26% on recurring EBITDA in 2Q20), mainly due to the increase in net revenues, partially offset by higher costs and expenses. In relation to 1Q21, the EBITDA increased 8%, due to the increase in net revenues and the recognition of tax credits in 2Q21.
Investments – Investments in the period amounted to R$ 93 million, directed to the construction of the new terminal in Vila do Conde (PA), the expansion of the Itaqui terminal and projects for efficiency gains, maintenance and operational safety of the terminals. The start-up of operations in Itaqui and Vila do Conde terminals are 5 and 3 months ahead of schedule, respectively, and the start-up of operations of the Vila do Conde terminal is expected for 4Q21.
|  |

Oxiteno |
| 2Q21 | 2Q20 | 1Q21 | Δ | Δ | 1H21 | 1H20 | Δ |
2Q21 v 2Q20 | 2Q21 v 1Q21 | 1H21 v 1H20 | ||||||
Average exchange rate (R$/US$) | 5.30 | 5.39 | 5.47 | (2%) | (3%) | 5.38 | 4.92 | 9% |
Total volume (000 tons) | 192 | 166 | 181 | 15% | 6% | 372 | 347 | 7% |
Commodities | 32 | 28 | 19 | 16% | 71% | 51 | 60 | (15%) |
Specialty chemicals/Others | 160 | 139 | 162 | 15% | (2%) | 322 | 287 | 12% |
Sales in Brazil | 136 | 111 | 127 | 23% | 7% | 263 | 238 | 10% |
International sales | 55 | 56 | 54 | (1%) | 3% | 109 | 109 | 1% |
EBITDA (R$ million) | 274 | 162 | 227 | 69% | 21% | 501 | 354 | 41% |
Recurring EBITDA¹ (R$ million) | 274 | 162 | 227 | 69% | 21% | 501 | 283 | 77% |
¹ Does not include the effect of tax credits of R$ 71 million in 1Q20
Operational performance – Total volume sold by Oxiteno increased 15% compared to 2Q20, with an 15% growth in specialty chemicals, boosted by increased sales mainly in the coatings segment, which was negatively impacted by the initial phase of the pandemic in 2020, and crop solutions segment in Brazil, in addition to the increase in volumes in the United States. The volume of commodities increased 16%, also because of lower sales in 2020 due to the pandemic. Compared to 1Q21, the volume increased 6%, arising from the recovery in sales of commodities in the domestic market (scheduled shutdowns in 1Q21) and the increase in sales in the United States, where operations were impacted by the winter storm in 1Q21.
Net revenues – Total of R$ 1,672 million (+39%), due to the increase in sales volume and the increase of 22% in average dollar prices, as a result of the increase in raw material costs. In relation to 1Q21, net revenues increased 16%, arising from the factors already mentioned above.
Cost of goods sold – Total of R$ 1,290 million (+33%), due to the increase in sales volume and the increase in raw material costs, in addition to the increase in personnel (variable remuneration) and maintenance costs, relating to the scheduled shutdown in the Mauá plant, and the effect of the Zero Cost Collar in 2Q20 (margin hedge, discontinued as from 2021). In relation to 1Q21, the cost of goods increased 17%, due to the increase in sales volume, increase in raw material costs and increase in personnel costs, partially offset by a decrease in costs incurred in the United States operations associated with the winter storm.
Sales, general and administrative expenses – Total of R$ 228 million (+28%), due to the increase in freight expenses, due to the increase in sales volume, maintenance (mainly related to the scheduled shutdown in the Mauá plant), personnel (collective bargaining adjustment and variable remuneration) and storage. In relation to 1Q21, the sales, general and administrative expenses increased 2%, due to the factors already mentioned above, attenuated by the provision for disposal of waste of the plant in Uruguay in 1Q21 of R$ 7 million.
EBITDA – Total of R$ 274 million, a record recurring quarterly result, which represents an increase of 69% in relation to 2Q20, due to the increase in sales volume and margin improvement, partially offset by increased costs and expenses. Compared to 1Q21, EBITDA grew 21%, due to the same factors mentioned above.
Investments – Oxiteno invested R$ 70 million in the quarter, in the maintenance and safety of production units.
|  |

Ipiranga |
| 2Q21 | 2Q20 | 1Q21 | Δ | Δ | 1H21 | 1H20 | Δ |
2Q21 v 2Q20 | 2Q21 v 1Q21 | 1H21 v 1H20 | ||||||
Total volume (000 m³) | 5,585 | 4,626 | 5,367 | 21% | 4% | 10,952 | 10,116 | 8% |
Diesel | 3,024 | 2,582 | 2,751 | 17% | 10% | 5,775 | 5,304 | 9% |
Otto cycle | 2,453 | 1,958 | 2,501 | 25% | (2%) | 4,954 | 4,626 | 7% |
Others¹ | 109 | 86 | 115 | 27% | (5%) | 223 | 185 | 21% |
EBITDA (R$ million) | 422 | 179 | 563 | 136% | (25%) | 985 | 659 | 50% |
¹ Fuel oils, arla 32, kerosene, lubricants and greases
Operational performance – Ipiranga reported an increase of 21% in the volume sold compared to 2Q20, growth of 25% in the Otto cycle and 17% in diesel, due to stronger effects of the pandemic in the consumption of fuels in Brazil in 2Q20. In relation to 1Q21, the volume was 4% higher, because of the growth of 10% in diesel, attenuated by the reduction of 2% in the Otto cycle, arising mainly from the mobility restrictions in early April.
Net revenues – Total of R$ 23,864 million (+93%), due to the recovery of the sales volume and increase in the average prices of oil derivatives and ethanol, all of which recorded a significant reduction in April and May 2020 due to the pandemic. In relation to 1Q21, net revenues increased 20%, arising from the increase in sales volume and increase in the average prices of oil derivatives and ethanol.
Cost of goods sold – Total of R$ 23,267 million (+93%), due to the increase in costs practiced by Petrobras and ethanol costs, in addition to the increase in sales volume. In relation to 1Q21, the increase of 23% resulted from the same factors mentioned above.
Sales, general and administrative expenses – Total of R$ 493 million (+36%), due to the increase in freight expenses (increase in volume sold and increase in unit cost), one-off expenses with legal proceedings (tax-related settlements, labor and civil lawsuits), Iconic (mainly higher volume sold), and AmPm company-operated stores, in addition to the savings obtained on several fronts in 2Q20. In relation to 1Q21, the sales, general and administrative expenses increased 1%, due to the increase in expenses incurred with freight, AmPm company-operated stores and Iconic, partially offset by a reduction in expenses incurred with provision for doubtful accounts, marketing and personnel expenses (lower variable remuneration).
Other operating results – Total of R$ 74 million, an increase of R$ 52 million in relation to 2Q20, due to the recognition of extraordinary tax credits, net of write-offs, in the amount of R$ 97 million in 2Q21 and the recognition of costs of CBios relating to the goals defined by RenovaBio of R$ 32 million. Compared to 1Q21, the increase totaled R$ 93 million, due to the same factors referred to above.
Results from disposal of PP&E – Total of R$ 32 million, an increase of R$ 18 million and R$ 26 million compared to 2Q20 and 1Q21, respectively, due to higher results from sales of real estate assets.
EBITDA – Total of R$ 422 million (+136%), mainly due to volumes recovery and the increase in other operating results, attenuated by the increase in expenses. In relation to 1Q21, the reduction of 25% resulted from the decrease in margins, partially offset by other operating results and disposal of assets.
Investments – R$ 110 million were invested, directed to the expansion and maintenance of Ipiranga’s service stations and franchise network and logistics infrastructure. Out of the total investments, R$ 58 million refers to additions to fixed and intangible assets, R$ 48 million to contractual assets with clients (exclusivity rights) and R$ 3 million to financing granted to customers, net of receipts.
|  |

Extrafarma |
| 2Q21 | 2Q20 | 1Q21 | Δ | Δ | 1H21 | 1H20 | Δ |
2Q21 v 2Q20 | 2Q21 v 1Q21 | 1H21 v 1H20 | ||||||
Number of stores (end of the period) | 400 | 410 | 402 | (2%) | 0% | 400 | 410 | (2%) |
% of mature stores (+3 years) | 83% | 62% | 80% | 21 p.p. | 3 p.p. | 83% | 62% | 21 p.p. |
Gross revenues (R$ million) | 542 | 515 | 517 | 5% | 5% | 1,059 | 1,036 | 2% |
EBITDA (R$ million) | (373) | 14 | 12 | n/a | n/a | (361) | 23 | n/a |
Recurring EBITDA¹ (R$ million) | 22 | 14 | 12 | 58% | 87% | 33 | 23 | 47% |
¹ Does not consider impairment of assets of R$ 395 million in 2Q21
Operational performance – Extrafarma ended 2Q21 with 400 pharmacies, with 1 opening and 11 closures in the last twelve months, a reduction of 2% in its network, resulting from greater selectivity in expansion and a more rigorous approach to underperforming stores. At the end of the quarter, maturing stores (with up to three years of operation) represented 17% of the network.
Gross revenues – Total of R$ 542 million (+5%), due to the 10% increase in the same stores sales (excluding mobile phone sales), partially offset by the lower number of stores (-2%) and the strong comparison basis in mobile phone sales in 2Q20 (-65%), due to the temporary shutdown of commercial activities by virtue of the pandemic in that period. In relation to 1Q21, gross revenues increased 5%, mainly due to the cyberattack occurred in 1Q21 and the annual readjustment in the price of medicines.
Cost of goods sold and gross profit – The cost of goods sold totaled R$ 352 million (+3%), aligned with the increase in sales and the annual readjustment in the price of medicines. The gross profit totaled R$ 162 million (+14%), equivalent to the gross margin of 29.8%, 2.3 p.p. above 2Q20. In relation to 1Q21, the cost of goods sold increased 2%, while the gross profit increased 12%, mainly due to the cyberattack occurred in 1Q21.
Sales, general and administrative expenses – Total of R$ 177 million (+9%), due mainly to the savings in expenses obtained in 2Q20, as a result of the pandemic, and inflationary impacts on personnel and services. Compared to 1Q21, sales, general and administrative expenses increased 6%, mainly due to higher personnel expenses.
Impairment – Loss of R$ 395 million due to impairment of assets, with no cash effects, as a result of the signing of the sale agreement of Extrafarma to Pague Menos in 2Q21.
Recurring EBITDA – Total of R$ 22 million, excluding the impairment, an increase of 58% in relation to 2Q20. Such growth resulted from the debugging process implemented and the increased profitability of the existing network. In relation to 1Q21, the increase of 87% resulted mainly from the negative impact caused by the cyberattack in 1Q21 and from the increased profitability of the existing network.
Investments – In the 2Q21, investments totaled R$ 11 million, mainly allocated to information technology, as well as refurbishments and improvements in stores.
|  |

Indebtedness (R$ million) |
Ultrapar consolidated | 2Q21 | 2Q20 | 1Q21 |
Gross debt | (16,106) | (17,764) | (18,606) |
Cash and cash equivalents | 6,979 | 8,448 | 8,501 |
Net debt (ex-IFRS 16) | (9,127) | (9,317) | (10,105) |
Leases payable | (1,796) | (1,775) | (1,794) |
Net debt | (10,923) | (11,092) | (11,899) |
Net debt/LTM Adjusted EBITDA¹ (ex-IFRS 16) | 2.6x | 3.1x | 3.2x |
Net debt/LTM Adjusted EBITDA¹ | 2.8x | 3.2x | 3.3x |
Average cost of debt | 114% DI | 141% DI | 212% DI |
DI + 0.5% | DI + 1.2% | DI + 2.3% | |
Average cash yield (% DI) | 76% | 87% | 82% |
Average debt duration (years) | 4.4 | 4.4 | 4.6 |
¹ LTM Adjusted EBITDA does not include the impairment of Extrafarma of R$ 593 million for 2Q20 (registered in 4Q19) and of R$ 395 million for 2Q21
In 2Q21, Ultrapar paid the remaining installment of the preventive loans contracted in March and April 2020, at the beginning of the pandemic, that had higher costs and short-term maturities. Accordingly, the gross debt decreased R$ 2.5 billion in the quarter, with an expressive reduction of the average cost of debt. The net financial debt ended 2Q21 totaling R$ 9.1 billion, composed of gross indebtedness of R$ 16.1 billion and cash position of R$ 7.0 billion. Considering the leases payable (IFRS 16) of R$ 1.8 billion, the total net debt was R$ 10.9 billion (2.8x Adjusted EBITDA LTM) compared to R$ 11.9 billion on March 31, 2021 (3.3x Adjusted EBITDA LTM). The reduction of the net debt compared to the position at the end of 1Q21 resulted mainly from the increase in operational cash generation and the R$ 366 million positive effect of the exchange rate variation in the net debt on the portion of bonds designated for hedge accounting. The reduction of the financial leverage resulted from the reduction in net debt, due to the reasons previously explained, as well as the increased level of LTM EBITDA, ex-impairment.
Maturity profile and debt breakdown:
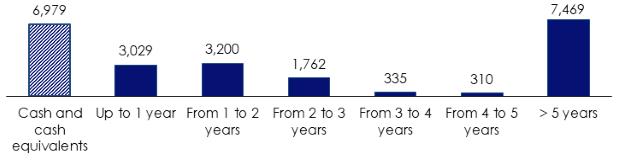

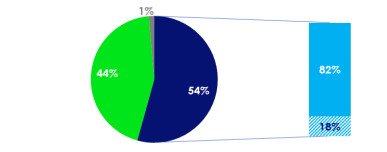


|  |

Updates on ESG themes |
In May 2021, the Ultra Group disclosed its 2020 Integrated Report, with the GRI seal, including ESG indicators and initiatives in the environmental, social and governance areas (click here to access the file). In addition, in July, Ultra Group donated R$ 1.5 million to the Butantã Institute for the purchase of equipment for the new plant that will produce vaccines against COVID-19 (ButanVac) and influenza.
Ultragaz disclosed in June its 2020 Sustainability Report (click here to access the file, in Portuguese only), in addition to the review and disclosure of its Sustainability Policy. As part of its social responsibility, Ultragaz carried out the distribution of 2 thousand oxygen cylinders in 143 cities in the state of São Paulo. Additionally, throughout the quarter, it donated 1.3 thousand basic food baskets in partnerships with regional NGOs in the states of Pernambuco, Sergipe and Bahia, and donated 8 thousand gas bottles, in partnership with CUFA (Central Única das Favelas) to serve several communities in São Paulo and Bahia. In addition, the educational campaign for prevention of COVID-19 was concluded in June with over 10 million persons impacted. Focused on the development of low-income women, the Female Entrepreneurship course, in partnership with Women Consulate and Itaú Mulher Empreendedora, was concluded, with an increase in income of around 60% of women after the professional qualification. Ultragaz also launched its new culture and diversity program.
Ultracargo reinforced its commitment with the communities in the surroundings upon renewal of the sponsorship of the Community in Action Award, conducted on an annual basis in Santos, in order to recognize the social projects developed by those living in the neighborhood, in addition to the completion of the Port Logistics Operators course, which was freely offered to 25 residents in Barcarena, in the state of Pará. Based on these actions, the company seeks to contribute for the increase in the number of job opportunities of the participants, in the future terminal in Vila do Conde (PA) or in other companies operating in the region. In addition, Ultracargo donated 6 thousand basic food baskets directed to the local communities next to its operations to reduce the effects of the COVID-19 pandemic.
In April, Oxiteno launched its 2020 Sustainability Report (click here to access the file) and, for the second year, entered into a partnership with Gerando Falcões NGO in connection with the “Corona no paredão, Fome não” campaign. The company also launched the program for diversity and inclusion “Together” in Mercosur, in order to ensure a labor environment more inclusive and diverse, and also structured the Quality of Life Program based on the results obtained from the health mapping in 2020, which is supported by five pillars: Physical Health, Emotional Health, Welfare, Self-development and Relationship. The program is supported by the Flowing application to facilitate the access by the participants to the available benefits and activities. In May, the “Together” program was launched in the USA and Mexico.
Ipiranga launched, for the first time, its 2020 Sustainability Report (click here to access the file) in June of this year. The company also conducted several actions on behalf of the community, such as the donation of 5 thousand basic food baskets, in partnership with Gerando Falcões NGO, to vulnerable families in Brazil. In partnership with IBP and in conjunction with large companies, Ipiranga donated medicines for intubation to the Ministry of Health for patients in ICUs, an initiative in which 3.7 million medicines were imported. Ipiranga also began the 2021 season of the Health in the Road Program, including 120 scheduled events, distributed in 20 states and 94 municipalities, offering basic health support to truck drivers and communities in the surroundings of the road service stations of Ipiranga. In June, the program recorded historical numbers, with over 835 persons served in a single day in the state of Goiás. In the same region and in the city of Bacabal (state of Maranhão), in partnership with the Municipal Health Department, the program structure was used to offer the vaccine against COVID-19 to the truck drivers. Also, in June, in partnership with UNICEF, more than 129 thousand PPE items were delivered to be used by the health professionals in the cities and metropolitan regions in Santarém (state of Pará) and Salvador (state of Bahia), indirectly impacting over 1 million persons.
In partnership with the non-for-profit hospital SOPAI, Extrafarma received donations and hygiene items in its drugstores in Fortaleza. Extrafarma also promoted a campaign for collection of basic food baskets, totaling R$ 87 thousand collected by the company and its associates, which amount will be allocated to the Transforma Brasil project for the purchase of more than 1.7 thousand basic food baskets, to be distributed to 32 institutions in Ceará, Pará and Rio Grande do Norte, totaling approximately 22 tons of food.
|  |

Capital markets |
Ultrapar’s combined average daily financial volume on B3 and NYSE totaled R$ 147 million/day in 2Q21 (-10%). Ultrapar’s shares ended the quarter quoted at R$ 18.39 on B3, a depreciation of 13% in the quarter, while the Ibovespa stock index rose by 9%. In NYSE, Ultrapar’s shares decreased 2% in 2Q21, while the Dow Jones stock index appreciated 5%. Ultrapar ended 2Q21 with a market cap of R$ 21 billion.
Capital markets | 2Q21 | 2Q20 | 1Q21 | 1H21 | 1H20 |
Number of shares (000) | 1,115,077 | 1,114,919 | 1,115,077 | 1,115,077 | 1,114,919 |
Market capitalization¹ (R$ million) | 20,506 | 20,492 | 23,651 | 20,506 | 20,492 |
B3 |
|
|
|
|
|
Average daily trading volume (000 shares) | 5,732 | 9,136 | 6,859 | 6,291 | 9,438 |
Average daily financial volume (R$ 000) | 116,073 | 141,452 | 145,258 | 130,551 | 160,858 |
Average share price (R$/share) | 20.25 | 15.48 | 21.18 | 20.75 | 17.04 |
NYSE |
|
|
|
|
|
Quantity of ADRs² (000 ADRs) | 50,363 | 47,480 | 49,955 | 50,363 | 47,480 |
Average daily trading volume (000 ADRs) | 1,533 | 1,494 | 2,282 | 1,908 | 1,688 |
Average daily financial volume (US$ 000) | 5,951 | 4,341 | 8,733 | 7,342 | 6,544 |
Average share price (US$/ADRs) | 3.88 | 2.91 | 3.83 | 3.85 | 3.88 |
Total |
|
|
|
|
|
Average daily trading volume (000 shares) | 7,265 | 10,630 | 9,141 | 8,198 | 11,125 |
Average daily financial volume (R$ 000) | 147,500 | 164,769 | 193,310 | 170,290 | 191,685 |
¹ Calculated on the closing share price for the period
² 1 ADR = 1 common share
UGPA3 x Ibovespa Performance – 2Q21
(Mar 31, 2021 = 100)


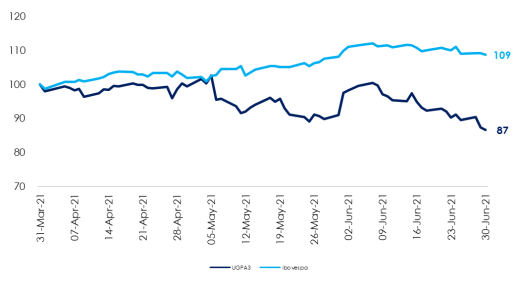
|  |

2Q21 Conference call |
Ultrapar will host a conference call for analysts and investors on August 12, 2021 to comment on the Company’s performance in the second quarter of 2021 and outlook. The presentation will be available for download in the Company’s website 30 minutes prior to the conference call.
The conference call will be transmitted via WEBCAST and held in Portuguese with simultaneous translation into English. The access link is available at ri.ultra.com.br. Please connect 10 minutes in advance.
Conference call in Portuguese with simultaneous translation into English
Time: 11:00 a.m. (BRT) / 10:00 a.m. (EDT)
Participants in Brazil: +55 (11) 3181-8565
Code: Ultrapar – in Portuguese
Replay: +55 (11) 3193-1012 or +55 (11) 2820-4012 (available for seven days)
Code: 3167603#
International participants: +1 (844) 204-8942 or +1 (412) 717-9627
Code: Ultrapar – in English
Replay: +55 (11) 3193-1012 or +55 (11) 2820-4012 (available for seven days)
Code: 9792937#
|  |

| ULTRAPAR | ||||||
| CONSOLIDATED BALANCE SHEET | ||||||
| In million of Reais | JUN 21 | JUN 20 | MAR 21 | |||
| ASSETS | ||||||
| Cash and cash equivalents | 2,860.3 | 3,805.2 | 3,933.2 | |||
| Financial investments and hedging instruments | 3,356.0 | 3,174.9 | 3,553.5 | |||
| Trade receivables and reseller financing | 4,363.1 | 3,505.6 | 4,240.8 | |||
| Inventories | 4,888.8 | 2,970.2 | 4,491.7 | |||
| Recoverable taxes | 1,423.1 | 1,476.1 | 1,482.7 | |||
| Prepaid expenses | 159.8 | 158.2 | 162.0 | |||
| Contractual assets with customers - exclusive rights | 514.4 | 473.0 | 490.9 | |||
| Other receivable | 112.9 | 87.3 | 61.7 | |||
| Total Current Assets | 17,678.5 | 15,650.4 | 18,416.4 | |||
| Financial investments and hedging instruments | 762.5 | 1,467.5 | 1,014.4 | |||
| Trade receivables and reseller financing | 500.8 | 470.7 | 468.3 | |||
| Deferred income and social contribution taxes | 1,081.6 | 1,016.6 | 1,061.4 | |||
| Recoverable taxes | 1,657.2 | 1,149.1 | 1,730.7 | |||
| Escrow deposits | 862.7 | 949.7 | 950.4 | |||
| Prepaid expenses | 66.8 | 87.8 | 59.5 | |||
| Contractual assets with customers - exclusive rights | 1,297.2 | 1,127.4 | 1,270.6 | |||
| Other receivables | 171.3 | 197.2 | 236.4 | |||
| Investments | 175.1 | 165.8 | 169.5 | |||
| Right to use assets | 2,057.5 | 2,135.5 | 2,125.3 | |||
| Property, plant and equipment | 8,030.9 | 7,899.3 | 8,176.1 | |||
| Intangible assets | 1,631.2 | 1,770.5 | 1,792.4 | |||
| Total Non-Current Assets | 18,294.7 | 18,437.0 | 19,054.8 | |||
| TOTAL ASSETS | 35,973.2 | 34,087.4 | 37,471.2 | |||
| LIABILITIES | ||||||
| Loans, financing and hedge derivative financial instruments | 1,548.7 | 2,335.1 | 2,277.9 | |||
| Debentures | 1,480.6 | 262.1 | 971.3 | |||
| Trade payables | 5,492.6 | 2,538.3 | 4,526.1 | |||
| Salaries and related charges | 434.2 | 439.1 | 384.7 | |||
| Taxes payable | 496.1 | 316.6 | 440.9 | |||
| Leases payable | 286.6 | 238.5 | 263.1 | |||
| Other payables | 314.2 | 355.3 | 354.6 | |||
| Total Current Liabilities | 10,053.1 | 6,485.0 | 9,218.6 | |||
| Loans, financing and hedge derivative financial instruments | 7,698.6 | 8,951.8 | 9,329.2 | |||
| Debentures | 5,377.7 | 6,215.2 | 6,027.8 | |||
| Provisions for tax, civil and labor risks | 768.6 | 846.7 | 859.1 | |||
| Post-employment benefits | 260.0 | 247.1 | 259.0 | |||
| Leases payable | 1,509.1 | 1,536.7 | 1,530.7 | |||
| Other payables | 257.3 | 297.0 | 284.1 | |||
| Total Non-Current Liabilities | 15,871.3 | 18,094.5 | 18,290.0 | |||
| TOTAL LIABILITIES | 25,924.4 | 24,579.4 | 27,508.6 | |||
| EQUITY | ||||||
| Share capital | 5,171.8 | 5,171.8 | 5,171.8 | |||
| Reserves | 5,007.9 | 4,595.3 | 5,008.0 | |||
| Treasury shares | (489.1) | (485.4) | (489.1) | |||
| Other | (25.9) | (165.3) | (107.2) | |||
| Non-controlling interests in subsidiaries | 384.1 | 391.6 | 379.2 | |||
| Total equity | 10,048.8 | 9,508.0 | 9,962.6 | |||
| TOTAL LIABILITIES AND EQUITY | 35,973.2 | 34,087.4 | 37,471.2 | |||
| Cash and financial investments | 6,978.7 | 8,447.5 | 8,501.0 | |||
| Loans and debentures | (16,105.6) | (17,764.2) | (18,606.3) | |||
| Leases payable | (1,795.7) | (1,775.3) | (1,793.8) | |||
| Net cash (debt) | (10,922.6) | (11,091.9) | (11,899.0) | |||
| Net cash (debt) ex-IFRS 16 | (9,126.9) | (9,316.6) | (10,105.2) | |||
|  |

| ULTRAPAR | ||||||||||
| CONSOLIDATED INCOME STATEMENT | ||||||||||
| In million of Reais | 2Q21 | 2Q20 | 1Q21 | 1H21 | 1H20 | |||||
| Net revenue from sales and services | 28,526.1 | 15,876.2 | 23,950.3 | 52,476.3 | 37,263.4 | |||||
| Cost of products and services sold | (27,030.3) | (14,825.0) | (22,234.4) | (49,264.7) | (34,802.2) | |||||
| Gross profit | 1,495.8 | 1,051.2 | 1,715.9 | 3,211.7 | 2,461.2 | |||||
| Operating expenses | ||||||||||
| Selling and marketing | (700.3) | (608.3) | (658.5) | (1,358.8) | (1,253.3) | |||||
| General and administrative | (473.1) | (293.2) | (468.7) | (941.8) | (703.1) | |||||
| Other operating income, net | 78.3 | 36.2 | (12.4) | 65.9 | 160.2 | |||||
| Gain (loss) on disposal of property, plant and equipment and intangibles | 32.1 | 14.0 | 8.1 | 40.1 | 20.9 | |||||
| Impairment | (394.7) | - | - | (394.7) | - | |||||
| Operating income (loss) | 38.1 | 199.8 | 584.4 | 622.4 | 685.9 | |||||
| Financial result | ||||||||||
| Financial income | 150.6 | 53.1 | 61.6 | 212.1 | 235.2 | |||||
| Financial expenses | (153.3) | (133.4) | (395.2) | (548.6) | (483.1) | |||||
| Share of profit (loss) of subsidiaries, joint ventures and associates | 1.3 | (13.3) | (12.2) | (10.9) | (25.7) | |||||
| Income before income and social contribution taxes | 36.6 | 106.2 | 238.4 | 275.1 | 412.2 | |||||
| Provision for income and social contribution taxes | ||||||||||
| Current | (245.5) | (130.7) | (118.2) | (363.7) | (255.0) | |||||
| Deferred | 168.5 | 55.1 | 5.4 | 173.9 | 26.3 | |||||
| Benefit of tax holidays | 22.2 | 19.3 | 11.7 | 34.0 | 35.3 | |||||
| Net income | (18.2) | 50.0 | 137.4 | 119.2 | 218.9 | |||||
| Net income attributable to: | ||||||||||
| Shareholders of the Company | (31.1) | 41.1 | 132.2 | 101.1 | 201.9 | |||||
| Non-controlling interests in subsidiaries | 12.8 | 9.0 | 5.3 | 18.1 | 17.0 | |||||
| Adjusted EBITDA | 503.5 | 611.0 | 996.3 | 1,499.8 | 1,490.9 | |||||
| Depreciation and amortization¹ | 416.4 | 381.4 | 380.9 | 797.3 | 768.0 | |||||
| Cash flow hedge bonds | 47.7 | 43.1 | 43.3 | 91.0 | 62.7 | |||||
| Total investments² | 397.6 | 360.8 | 293.8 | 691.4 | 710.9 | |||||
| RATIOS | ||||||||||
| Earnings per share (R$) | 0.26 | 0.04 | 0.12 | 0.38 | 0.19 | |||||
| Net debt (ex-IFRS 16) / Stockholders' equity | 0.91 | 0.98 | 1.01 | 0.91 | 0.98 | |||||
| Net debt / Stockholders' equity | 1.09 | 1.17 | 1.19 | 1.09 | 1.17 | |||||
| Net debt / LTM Adjusted EBITDA³ (ex-IFRS16) | 2.64 | 3.07 | 3.18 | 2.64 | 3.07 | |||||
| Net debt / LTM Adjusted EBITDA³ | 2.81 | 3.24 | 3.31 | 2.81 | 3.24 | |||||
| Net interest expense / Adjusted EBITDA | 0.01 | 0.13 | 0.33 | 0.22 | 0.17 | |||||
| Gross margin (%) | 5.2% | 6.6% | 7.2% | 6.1% | 6.6% | |||||
| Operating margin (%) | 0.1% | 1.3% | 2.4% | 1.2% | 1.8% | |||||
| Adjusted EBITDA margin (%) | 1.8% | 3.8% | 4.2% | 2.9% | 4.0% | |||||
| Number of employees | 16,458 | 16,003 | 16,304 | 16,458 | 16,003 | |||||
| ¹ Includes amortization with contractual assets with customers – exclusive rights | ||||||||||
| ² Includes property, plant and equipment and additions to intangible assets, contractual assets with customers (exclusive rights), initial direct costs of assets with right of use, financing of clients and rental advances (net of repayments) and acquisition of shareholdings | ||||||||||
| ³ LTM adjusted EBITDA does not consider impairment of Extrafarma for 2Q21, 2Q20, 1H21 and 1H20 | ||||||||||
|  |

| ULTRAPAR | |||||
| CONSOLIDATED CASH FLOW | |||||
| In million of Reais | JAN - JUN | JAN - JUN | |||
| 2021 | 2020 | ||||
| Cash flows from operating activities | |||||
| Net income for the period | 119.2 | 218.9 | |||
| Adjustments to reconcile net income to cash provided by operating activities | |||||
| Share of loss (profit) of subsidiaries, joint ventures and associates | 10.9 | 25.7 | |||
| Amortization of contractual assets with customers - exclusive rights | 128.9 | 150.9 | |||
| Amortization of right to use assets | 175.3 | 158.6 | |||
| Depreciation and amortization | 493.1 | 458.5 | |||
| PIS and COFINS credits on depreciation | 8.8 | 8.8 | |||
| Interest and foreign exchange rate variations | 613.6 | 614.5 | |||
| Deferred income and social contribution taxes | (173.9) | (26.3) | |||
| Current income and social contribution taxes | 329.8 | 219.6 | |||
| (Gain) loss on disposal of property, plant and equipment and intangibles | (40.1) | (20.9) | |||
| Impairment | 394.7 | - | |||
| Expected losses on doubtful accounts | (6.3) | 56.5 | |||
| Provision for losses in inventories | (3.4) | (1.8) | |||
| Provision for post-employment benefits | 2.6 | (2.9) | |||
| Equity instrument granted | 7.6 | 3.5 | |||
| Provision for decarbonization - CBIOs | 64.9 | - | |||
| Provision for tax, civil, and labor risks | (71.5) | (6.4) | |||
| Other provisions and adjustments | 5.3 | (2.2) | |||
| 2,059.3 | 1,855.0 | ||||
| (Increase) decrease in current assets | |||||
| Trade receivables and reseller financing | (481.0) | 517.6 | |||
| Inventories | (1,035.7) | 752.6 | |||
| Recoverable taxes | (187.3) | (269.0) | |||
| Dividends received from subsidiaries and joint-ventures | 0.1 | 4.7 | |||
| Other receivables | (57.9) | (49.8) | |||
| Prepaid expenses | (55.6) | (74.3) | |||
| Increase (decrease) in current liabilities | |||||
| Trade payables | 1,293.6 | (218.0) | |||
| Salaries and related charges | (34.4) | 33.4 | |||
| Taxes payable | 2.8 | (39.0) | |||
| Post-employment benefits | 0.1 | 0.8 | |||
| Other payables | (8.2) | 20.1 | |||
| Deferred revenue | (16.5) | (1.2) | |||
| (Increase) decrease in non-current assets | |||||
| Trade receivables and reseller financing | (9.4) | (52.3) | |||
| Recoverable taxes | (79.4) | (276.8) | |||
| Escrow deposits | 87.1 | (28.3) | |||
| Other receivables | 78.6 | 0.2 | |||
| Prepaid expenses | 10.4 | (14.6) | |||
| Increase (decrease) in non-current liabilities | |||||
| Post-employment benefits | (0.3) | 6.0 | |||
| Other payables | (13.3) | (40.2) | |||
| CBIO acquisition | (59.0) | - | |||
| Payments of contractual assets with customers - exclusive rights | (83.6) | (236.6) | |||
| Contingency payments | (15.7) | (29.4) | |||
| Income and social contribution taxes paid | (116.7) | (58.1) | |||
| Net cash provided by operating activities | 1,278.1 | 1,802.8 | |||
| Cash flows from investing activities | |||||
| Financial investments, net of redemptions | 1,638.1 | 312.1 | |||
| Acquisition of property, plant, and equipment | (571.7) | (354.5) | |||
| Acquisition of intangible assets | (96.9) | (78.6) | |||
| Capital increase in joint ventures | (22.0) | (10.0) | |||
| Related parties | (19.4) | - | |||
| Proceeds from disposal of property, plant and equipment and intangibles | 71.9 | 49.4 | |||
| Net cash provided by (used in) investing activities | 1,000.1 | (81.5) | |||
| Cash flows from financing activities | |||||
| Loans and debentures | |||||
| Proceeds | 493.6 | 1,611.2 | |||
| Repayments | (1,518.2) | (984.9) | |||
| Interest paid | (352.6) | (336.2) | |||
| Payments of leases¹ | (218.1) | (172.3) | |||
| Dividends paid | (488.6) | (263.1) | |||
| Related parties | (0.1) | (0.0) | |||
| Net cash provided by (used in) financing activities | (2,084.0) | (145.3) | |||
| Effect of exchange rate changes on cash and cash equivalents in foreign currency | 4.6 | 113.9 | |||
| Increase (decrease) in cash and cash equivalents | 198.8 | 1,689.8 | |||
| Cash and cash equivalents at the beginning of the period | 2,661.5 | 2,115.4 | |||
| Cash and cash equivalents at the end of the period | 2,860.3 | 3,805.2 | |||
| Transactions without cash effect: | |||||
| Addition on right to use assets and leases payable | 133.8 | 293.7 | |||
| Addition on contractual assets with costumers - exclusive rights | 158.3 | 56.3 | |||
| Reversion fund - private pension | 3.7 | 47.1 | |||
| Issuance of shares related to the subscription warrants - indemnification - Extrafarma acquisition | 1.4 | 53.1 | |||
| ¹ Includes R$ 29 million related to the grant of Ultracargo's terminal in Vila do Conde in 1Q21 | |||||
|  |

| ULTRAGAZ | ||||||||||
| CONSOLIDATED BALANCE SHEET | ||||||||||
| In million of Reais | JUN 21 | JUN 20 | MAR 21 | |||||||
| OPERATING ASSETS | ||||||||||
| Trade receivables | 449.3 | 336.9 | 398.5 | |||||||
| Non-current trade receivables | 32.8 | 31.3 | 32.0 | |||||||
| Inventories | 154.2 | 132.6 | 158.4 | |||||||
| Taxes | 79.1 | 96.1 | 87.1 | |||||||
| Escrow deposits | 219.9 | 220.4 | 220.3 | |||||||
| Other | 79.2 | 73.7 | 81.9 | |||||||
| Right to use assets | 92.6 | 107.0 | 105.2 | |||||||
| Property, plant and equipment / Intangibles | 1,135.9 | 1,022.4 | 1,084.2 | |||||||
| TOTAL OPERATING ASSETS | 2,242.9 | 2,020.5 | 2,167.7 | |||||||
| OPERATING LIABILITIES | ||||||||||
| Suppliers | 112.2 | 93.1 | 101.5 | |||||||
| Salaries and related charges | 80.4 | 90.3 | 68.7 | |||||||
| Taxes | 14.4 | 13.0 | 16.0 | |||||||
| Judicial provisions | 130.0 | 129.4 | 129.3 | |||||||
| Leases payable | 144.7 | 144.3 | 144.7 | |||||||
| Other | 54.0 | 83.1 | 68.6 | |||||||
| TOTAL OPERATING LIABILITIES | 535.7 | 553.2 | 528.8 | |||||||
| CONSOLIDATED INCOME STATEMENT | ||||||||||
| In million of Reais | 2Q21 | 2Q20 | 1Q21 | 1H21 | 1H20 | |||||
| Net revenues | 2,345.6 | 1,723.4 | 2,037.8 | 4,383.4 | 3,484.9 | |||||
| Cost of products sold | (2,115.3) | (1,442.3) | (1,811.9) | (3,927.3) | (2,965.2) | |||||
| Gross profit | 230.3 | 281.1 | 225.9 | 456.2 | 519.7 | |||||
| Operating expenses | ||||||||||
| Selling | (112.2) | (104.2) | (96.2) | (208.4) | (210.8) | |||||
| General and administrative | (47.1) | (32.3) | (50.5) | (97.6) | (79.8) | |||||
| Other operating income | 1.8 | 1.8 | 5.6 | 7.4 | 6.7 | |||||
| Gain (loss) on disposal of property, plant and equipment and intangibles | 0.3 | 2.3 | 2.6 | 2.9 | 3.2 | |||||
| Operating income (loss) | 73.1 | 148.7 | 87.4 | 160.5 | 239.0 | |||||
| Share of profit of subsidiaries, joint ventures and associates | 0.0 | 0.0 | 0.0 | 0.0 | 0.0 | |||||
| Adjusted EBITDA | 136.5 | 205.7 | 150.2 | 286.8 | 352.6 | |||||
| Depreciation and amortization¹ | 63.4 | 56.9 | 62.8 | 126.2 | 113.6 | |||||
| Ratios | ||||||||||
| Gross margin (R$/ton) | 525 | 650 | 557 | 540 | 609 | |||||
| Operating margin (R$/ton) | 166 | 344 | 216 | 190 | 280 | |||||
| Adjusted EBITDA margin (R$/ton) | 311 | 476 | 370 | 340 | 413 | |||||
| Number of employees | 3,419 | 3,428 | 3,445 | 3,419 | 3,428 | |||||
| ¹ Includes amortization with contractual assets with customers - exclusive rights | ||||||||||
|  |

| ULTRACARGO | ||||||||||
| CONSOLIDATED BALANCE SHEET | ||||||||||
| In million of Reais | JUN 21 | JUN 20 | MAR 21 | |||||||
| OPERATING ASSETS | ||||||||||
| Trade receivables | 22.3 | 62.0 | 30.4 | |||||||
| Inventories | 7.9 | 8.1 | 7.9 | |||||||
| Taxes | 29.2 | 17.4 | 25.6 | |||||||
| Other | 27.3 | 30.1 | 30.8 | |||||||
| Right to use assets | 458.5 | 475.1 | 472.7 | |||||||
| Property, plant and equipment / Intangibles / Investments | 1,618.0 | 1,329.3 | 1,535.9 | |||||||
| TOTAL OPERATING ASSETS | 2,163.1 | 1,922.1 | 2,103.3 | |||||||
| OPERATING LIABILITIES | ||||||||||
| Suppliers | 38.7 | 25.0 | 43.5 | |||||||
| Salaries and related charges | 36.8 | 37.5 | 34.2 | |||||||
| Taxes | 5.3 | 11.6 | 8.9 | |||||||
| Judicial provisions | 10.3 | 9.9 | 10.2 | |||||||
| Leases payable | 415.2 | 436.0 | 416.7 | |||||||
| Other¹ | 68.9 | 97.7 | 69.0 | |||||||
| TOTAL OPERATING LIABILITIES | 575.3 | 617.8 | 582.5 | |||||||
| ¹ Includes the long term obligations with clients account | ||||||||||
| CONSOLIDATED INCOME STATEMENT | ||||||||||
| In million of Reais | 2Q21 | 2Q20 | 1Q21 | 1H21 | 1H20 | |||||
| Net revenues | 175.8 | 155.0 | 172.0 | 347.9 | 318.3 | |||||
| Cost of services sold | (69.8) | (65.6) | (68.8) | (138.6) | (128.1) | |||||
| Gross profit | 106.0 | 89.4 | 103.3 | 209.3 | 190.2 | |||||
| Operating expenses | ||||||||||
| Selling | (2.0) | (1.7) | (2.0) | (4.1) | (3.4) | |||||
| General and administrative | (31.7) | (26.8) | (31.7) | (63.4) | (57.6) | |||||
| Other operating income | 4.1 | 9.7 | (0.8) | 3.2 | 12.6 | |||||
| Gain (loss) on disposal of property, plant and equipment and intangibles | (0.0) | (0.0) | 0.1 | 0.0 | (0.3) | |||||
| Operating income (loss) | 76.3 | 70.6 | 68.7 | 145.1 | 141.6 | |||||
| Share of profit of subsidiaries, joint ventures and associates | 0.1 | 0.3 | 0.5 | 0.6 | 0.4 | |||||
| EBITDA | 100.2 | 91.5 | 92.5 | 192.7 | 182.1 | |||||
| Depreciation and amortization | 23.8 | 20.6 | 23.3 | 47.1 | 40.1 | |||||
| Ratios | ||||||||||
| Gross margin (%) | 60.3% | 57.7% | 60.0% | 60.2% | 59.8% | |||||
| Operating margin (%) | 43.4% | 45.6% | 40.0% | 41.7% | 44.5% | |||||
| EBITDA margin (%) | 57.0% | 59.1% | 53.8% | 55.4% | 57.2% | |||||
| Number of employees | 888 | 878 | 917 | 888 | 878 | |||||
|  |

| OXITENO | ||||||||||
| CONSOLIDATED BALANCE SHEET | ||||||||||
| In million of Reais | JUN 21 | JUN 20 | MAR 21 | |||||||
| OPERATING ASSETS | ||||||||||
| Trade receivables | 870.8 | 707.8 | 869.5 | |||||||
| Inventories | 1,227.8 | 951.9 | 1,238.5 | |||||||
| Taxes | 688.5 | 665.1 | 693.4 | |||||||
| Other | 74.6 | 173.1 | 148.1 | |||||||
| Right to use assets | 35.8 | 40.1 | 43.6 | |||||||
| Property, plant and equipment / Intangibles / Investments | 2,785.5 | 2,962.4 | 2,979.8 | |||||||
| TOTAL OPERATING ASSETS | 5,683.0 | 5,500.2 | 5,972.9 | |||||||
| OPERATING LIABILITIES | ||||||||||
| Suppliers | 1,075.0 | 545.9 | 984.9 | |||||||
| Salaries and related charges | 118.4 | 114.7 | 111.9 | |||||||
| Taxes | 64.3 | 36.4 | 50.3 | |||||||
| Judicial provisions | 29.7 | 26.8 | 33.4 | |||||||
| Leases payable | 42.0 | 42.4 | 48.7 | |||||||
| Other | 71.8 | 43.3 | 56.1 | |||||||
| TOTAL OPERATING LIABILITIES | 1,401.3 | 809.6 | 1,285.2 | |||||||
| CONSOLIDATED INCOME STATEMENT | ||||||||||
| In million of Reais | 2Q21 | 2Q20 | 1Q21 | 1H21 | 1H20 | |||||
| Net revenues | 1,672.3 | 1,201.0 | 1,436.4 | 3,108.7 | 2,308.9 | |||||
| Cost of products sold | ||||||||||
| Variable | (1,093.2) | (798.4) | (905.9) | (1,999.1) | (1,527.4) | |||||
| Fixed | (143.1) | (124.5) | (144.8) | (287.9) | (226.9) | |||||
| Depreciation and amortization | (53.6) | (50.2) | (54.2) | (107.8) | (95.7) | |||||
| Gross profit | 382.3 | 227.9 | 331.5 | 713.9 | 458.9 | |||||
| Operating expenses | ||||||||||
| Selling | (109.7) | (89.8) | (100.7) | (210.4) | (174.4) | |||||
| General and administrative | (118.7) | (89.2) | (122.8) | (241.5) | (198.9) | |||||
| Other operating income | 0.2 | 1.3 | 1.5 | 1.7 | 73.2 | |||||
| Gain (loss) on disposal of property, plant and equipment and intangibles | 0.1 | (0.0) | 0.3 | 0.4 | (0.2) | |||||
| Operating income (loss) | 154.3 | 50.1 | 109.8 | 264.1 | 158.6 | |||||
| Share of profit of subsidiaries, joint ventures and associates | 0.0 | 0.1 | (0.1) | (0.1) | 0.3 | |||||
| Adjusted EBITDA | 273.8 | 161.6 | 226.9 | 500.7 | 354.1 | |||||
| Depreciation and amortization | 71.7 | 68.2 | 73.9 | 145.7 | 132.4 | |||||
| Cash flow hedge from bonds | 47.7 | 43.1 | 43.3 | 91.0 | 62.7 | |||||
| Ratios | ||||||||||
| Gross margin (R$/ton) | 1,996 | 1,371 | 1,834 | 1,917 | 1,323 | |||||
| Gross margin (US$/ton) | 377 | 254 | 335 | 356 | 269 | |||||
| Operating margin (R$/ton) | 805 | 302 | 607 | 709 | 457 | |||||
| Operating margin (US$/ton) | 152 | 56 | 111 | 132 | 93 | |||||
| Adjusted EBITDA margin (R$/ton) | 1,429 | 972 | 1,255 | 1,345 | 1,021 | |||||
| Adjusted EBITDA margin (US$/ton) | 270 | 180 | 229 | 250 | 207 | |||||
| Number of employees | 1,885 | 1,834 | 1,873 | 1,885 | 1,834 | |||||
|  |

| IPIRANGA | ||||||||||
| CONSOLIDATED BALANCE SHEET | ||||||||||
| In million of Reais | JUN 21 | JUN 20 | MAR 21 | |||||||
| OPERATING ASSETS | ||||||||||
| Trade receivables | 2,980.6 | 2,335.9 | 2,903.6 | |||||||
| Non-current trade receivables | 467.8 | 439.2 | 436.0 | |||||||
| Inventories | 2,988.6 | 1,385.7 | 2,580.4 | |||||||
| Taxes | 1,644.7 | 1,089.6 | 1,495.9 | |||||||
| Contractual assets with customers - exclusive rights | 1,806.7 | 1,593.9 | 1,756.2 | |||||||
| Other | 473.0 | 533.6 | 508.3 | |||||||
| Right to use assets | 1,086.8 | 1,073.8 | 1,090.0 | |||||||
| Property, plant and equipment / Intangibles / Investments | 3,558.2 | 3,593.3 | 3,572.2 | |||||||
| TOTAL OPERATING ASSETS | 15,006.4 | 12,044.9 | 14,342.6 | |||||||
| OPERATING LIABILITIES | ||||||||||
| Suppliers | 4,037.0 | 1,690.3 | 3,162.0 | |||||||
| Salaries and related charges | 108.1 | 108.0 | 92.8 | |||||||
| Post-employment benefits | 267.6 | 234.6 | 265.0 | |||||||
| Taxes | 182.6 | 140.6 | 242.6 | |||||||
| Judicial provisions | 212.2 | 299.8 | 301.2 | |||||||
| Leases payable | 766.1 | 709.9 | 754.6 | |||||||
| Other | 281.0 | 286.4 | 323.6 | |||||||
| TOTAL OPERATING LIABILITIES | 5,854.6 | 3,469.7 | 5,141.8 | |||||||
| CONSOLIDATED INCOME STATEMENT | ||||||||||
| In million of Reais | 2Q21 | 2Q20 | 1Q21 | 1H21 | 1H20 | |||||
| Net revenues | 23,863.8 | 12,350.2 | 19,845.0 | 43,708.8 | 30,249.8 | |||||
| Cost of products and services sold | (23,267.2) | (12,035.0) | (18,947.8) | (42,215.0) | (29,239.6) | |||||
| Gross profit | 596.6 | 315.2 | 897.2 | 1,493.8 | 1,010.2 | |||||
| Operating expenses | ||||||||||
| Selling | (314.8) | (273.2) | (305.4) | (620.2) | (581.0) | |||||
| General and administrative | (178.1) | (88.6) | (181.7) | (359.8) | (247.5) | |||||
| Other operating income | 73.7 | 21.9 | (19.8) | 53.9 | 66.0 | |||||
| Gain (loss) on disposal of property, plant and equipment and intangibles | 31.7 | 14.0 | 5.8 | 37.5 | 20.5 | |||||
| Operating income (loss) | 209.1 | (10.8) | 396.0 | 605.1 | 268.2 | |||||
| Share of profit of subsidiaries, joint ventures and associates | 4.7 | 0.8 | (6.5) | (1.8) | 1.1 | |||||
| Adjusted EBITDA | 421.8 | 178.7 | 563.0 | 984.8 | 658.6 | |||||
| Depreciation and amortization¹ | 208.1 | 188.7 | 173.4 | 381.5 | 389.2 | |||||
| Ratios | ||||||||||
| Gross margin (R$/m³) | 107 | 68 | 167 | 136 | 100 | |||||
| Operating margin (R$/m³) | 37 | (2) | 74 | 55 | 27 | |||||
| Adjusted EBITDA margin (R$/m³) | 76 | 39 | 105 | 90 | 65 | |||||
| Adjusted EBITDA margin (%) | 1.8% | 1.4% | 2.8% | 2.3% | 2.2% | |||||
| Number of service stations | 7,110 | 7,105 | 7,107 | 7,110 | 7,105 | |||||
| Number of employees | 3,723 | 3,351 | 3,626 | 3,723 | 3,351 | |||||
| ¹ Includes amortization with contractual assets with customers - exclusive rights | ||||||||||
|  |

| EXTRAFARMA | ||||||||||
| BALANCE SHEET | ||||||||||
| In million of Reais | JUN 21 | JUN 20 | MAR 21 | |||||||
| OPERATING ASSETS | ||||||||||
| Trade receivables | 41.4 | 66.5 | 40.7 | |||||||
| Inventories | 510.4 | 491.9 | 506.6 | |||||||
| Taxes | 87.6 | 213.7 | 241.4 | |||||||
| Other | 34.6 | 29.6 | 28.2 | |||||||
| Right to use assets | 348.8 | 402.5 | 378.2 | |||||||
| Property, plant and equipment / Intangibles | 256.0 | 508.8 | 476.5 | |||||||
| TOTAL OPERATING ASSETS | 1,278.9 | 1,713.0 | 1,671.6 | |||||||
| OPERATING LIABILITIES | ||||||||||
| Suppliers | 191.7 | 179.0 | 184.7 | |||||||
| Salaries and related charges | 53.1 | 58.6 | 42.4 | |||||||
| Taxes | 16.4 | 27.5 | 19.7 | |||||||
| Judicial provisions | 9.9 | 9.7 | 9.6 | |||||||
| Leases payable | 389.2 | 403.4 | 390.5 | |||||||
| Other | 17.0 | 11.1 | 17.8 | |||||||
| TOTAL OPERATING LIABILITIES | 677.3 | 689.3 | 664.6 | |||||||
| INCOME STATEMENT | ||||||||||
| In million of Reais | 2Q21 | 2Q20 | 1Q21 | 1H21 | 1H20 | |||||
| Gross revenues | 541.8 | 514.7 | 517.2 | 1,059.0 | 1,035.5 | |||||
| Sales returns, discounts and taxes | (27.9) | (30.6) | (27.4) | (55.3) | (58.1) | |||||
| Net revenues | 513.9 | 484.1 | 489.8 | 1,003.7 | 977.4 | |||||
| Cost of products and services sold | (352.4) | (342.7) | (345.9) | (698.4) | (691.2) | |||||
| Gross profit | 161.5 | 141.3 | 143.8 | 305.3 | 286.2 | |||||
| Operating expenses | (177.3) | (163.3) | (167.5) | (344.8) | (337.7) | |||||
| Other operating income | (1.2) | (0.6) | (1.5) | (2.6) | (0.9) | |||||
| Gain (loss) on disposal of property, plant and equipment and intangibles | (0.0) | (2.3) | (0.6) | (0.7) | (2.4) | |||||
| Impairment | (394.7) | - | - | (394.7) | - | |||||
| Operating income (loss) | (411.7) | (24.8) | (25.8) | (437.4) | (54.8) | |||||
| EBITDA | (373.0) | 13.7 | 11.5 | (361.5) | 22.5 | |||||
| Depreciation and amortization | 38.6 | 38.5 | 37.3 | 75.9 | 77.3 | |||||
| Ratios¹ | ||||||||||
| Gross margin (%) | 29.8% | 27.5% | 27.8% | 28.8% | 27.6% | |||||
| Operating margin (%) | (76.0%) | (4.8%) | (5.0%) | (41.3%) | (5.3%) | |||||
| EBITDA margin (%) | (68.8%) | 2.7% | 2.2% | (34.1%) | 2.2% | |||||
| Number of employees | 6,025 | 6,095 | 5,948 | 6,025 | 6,095 | |||||
| ¹ Calculated based on gross revenues | ||||||||||
ULTRAPAR PARTICIPAÇÕES S.A.
Publicly Traded Company
CNPJ nº 33.256.439/0001-39 | NIRE 35.300.109.724 |
MINUTES OF THE MEETING OF THE BOARD OF DIRECTORS
Date, Hour and Place:
August 11, 2021, at 2:30 p.m., at the Company’s headquarters, located at Av. Brigadeiro Luís Antônio, nr 1343, 9th floor, in the City of and State of São Paulo, also contemplating participation through Microsoft Teams.
Members in Attendance:
(i) Members of the Board of Directors undersigned; (ii) Secretary of the Board of Directors, Mr. André Brickmann Areno; (iii) Chief Executive Officer, Mr. Frederico Pinheiro Fleury Curado; (iv) Chief Financial and Investor Relations Officer, Mr. Rodrigo de Almeida Pizzinatto; (v) in relation to item 1, (1) other executive officers of the Company, namely, Mrs. Décio de Sampaio Amaral, João Benjamin Parolin, Marcelo Pereira Malta de Araújo and Tabajara Bertelli Costa; and (2) the president of the Fiscal Council, Mr. Flávio Cesar Maia Luz.
Matters discussed and resolutions:
- After having analyzed and discussed the performance of the Company in the second quarter of the current fiscal year, the respective financial statements were approved.
- "Ad referendum” of the Annual General Shareholders’ Meeting that will analyze the balance sheet and financial statements of the fiscal year of 2021, the Board of Directors approved the distribution of interim dividends in the total amount of R$ 218,073,611.40 (two hundred and eighteen million, seventy three thousand, six hundred and eleven Reais and forty cents of Real). The holders of common shares of the Company are entitled to receive R$ 0.20 (twenty cents of Real) per share, excluding the shares held in treasury account at this date.
- It has also been determined that dividends declared herein will be paid as of August 27, 2021 onwards, with no remuneration or monetary adjustment. The record date to establish the right to receive the approved dividends will be August 19, 2021 in Brazil and August 23, 2021 in the United States of America. The shares of the Company will be traded "ex-dividend" on both the São Paulo Stock Exchange (B3 S.A. – Brasil, Bolsa, Balcão) and the New York Stock Exchange (NYSE) from August 20, 2021 onwards.
- The members of the Board of Directors of the Company authorized the issuance of 31,032 (thirty one thousand and thirty two) common shares within the limits of the authorized capital stock pursuant to Article 6 of the Company’s Bylaws, due to partial exercise of the subscription warrants issued by the Company as of the approval of the merger of shares issued by Imifarma Produtos Farmacêuticos e Cosméticos S.A. by the Company, approved on the Extraordinary General Shareholders’ Meeting held on January 31, 2014. The management of the Company shall provide the necessary subscription bulletins for signing and formalization of the new shares’ subscription by the referred subscription warrants holders. The common shares will have the same rights assigned to the other shares previously issued by the Company.
The Company’s capital stock will be represented by 1,115,107,683 (one billion, one hundred and fifteen million, one hundred and seven thousand, six hundred and eighty-three) common shares, all of them nominative with no par value.
Notes: The resolutions were approved, with no amendments or qualifications, by all the Board Members.
There being no further matters to discuss, the meeting was concluded, and these minutes were written, read, passed, and signed by all Directors present.
Pedro Wongtschowski – Chairman
Lucio de Castro Andrade Filho – Vice-Chairman
Alexandre Teixeira de Assumpção Saigh
Ana Paula Vitali Janes Vescovi
Flávia Buarque de Almeida
Jorge Marques de Toledo Camargo
José Galló
José Luiz Alquéres
José Mauricio Pereira Coelho
Marcos Marinho Lutz
Otávio Lopes Castello Branco Neto
André Brickmann Areno – Secretary

ULTRAPAR PARTICIPAÇÕES S.A.
Distribution of dividends
São Paulo, August 11, 2021 – Ultrapar Participações S.A. informs that the Board of Directors, at the meeting held today, approved the distribution of dividends, in the amount of R$ 218,073,611.40, equivalent to R$ 0.20 per common share, to be paid from August 27, 2021 onwards, without remuneration or monetary adjustment.
The record date that establishes the right to receive the dividend will be August 19, 2021 in Brazil, and August 23, 2021 in the United States. Therefore, from August 20, 2021 onwards, the shares will be traded "ex-dividend" on both the São Paulo Stock Exchange (B3 S.A. – Brasil, Bolsa, Balcão) and the New York Stock Exchange (NYSE).
The number of shares considered to calculate the dividend per share considers the issuance of 31,032 common shares, that was approved by the Board of Directors on this date.
Rodrigo de Almeida Pizzinatto
Chief Financial and Investor Relations Officer
Ultrapar Participações S.A.
SIGNATURES
Pursuant to the requirements of the Securities Exchange Act of 1934, the registrant has duly caused this report to be signed on its behalf by the undersigned, thereunto duly authorized.
Date: August 11, 2021
| ULTRAPAR HOLDINGS INC. | ||
| By: | /s/ Rodrigo de Almeida Pizzinatto | |
| Name: | Rodrigo de Almeida Pizzinatto | |
| Title: | Chief Financial and Investor Relations Officer | |
(Parent and Consolidated Interim Financial Information as of and the Three-month period Ended June 30, 2021 and Report on Review of Interim Financial Information, 2Q21 Earnings Release, Minutes of the Meeting of the Board of Directors of Ultrapar Participações S.A., held on August 11, 2021 and Notice to shareholders)