Exhibit 99.1

25
YEAR
EVEREST
25 YEARS PUBLIC, NEARLY SO YEARS OF HISTORY
ANNIVERSARY
Investor Day
June 23, 2021

Cautionary Note On Forward-looking Statements This presentation contains forward-looking statements within the meaning of the U.S. federal securities laws. We intend these forward-looking statements to be covered by the safe harbor provisions for forward-looking statements in the U.S. Federal securities laws. These statements reflect management's current expectations based on assumptions we believe are reasonable, but are not guarantees of performance. The forward-looking statements contained in this document involve risks and uncertainties that could cause actual results to differ materially from those contained in forward-looking statements made on behalf of the Company. These risks and uncertainties include, but are not limited to, the impact of general economic conditions and conditions affecting the insurance and reinsurance industry, the adequacy of our reserves, our ability to assess underwriting risk, trends in rates for property and casualty insurance and reinsurance, competition, investment market and investment income fluctuations, trends in insured and paid losses, catastrophes, pandemic, regulatory and legal uncertainties and other factors described in our latest Annual Report on Form 10-K. Except as required by law, the Company undertakes no obligation to publicly update or revise any forward-looking statements, whether as a result of new information, future events or otherwise. EVEREST RE GROUP, LTD.
2
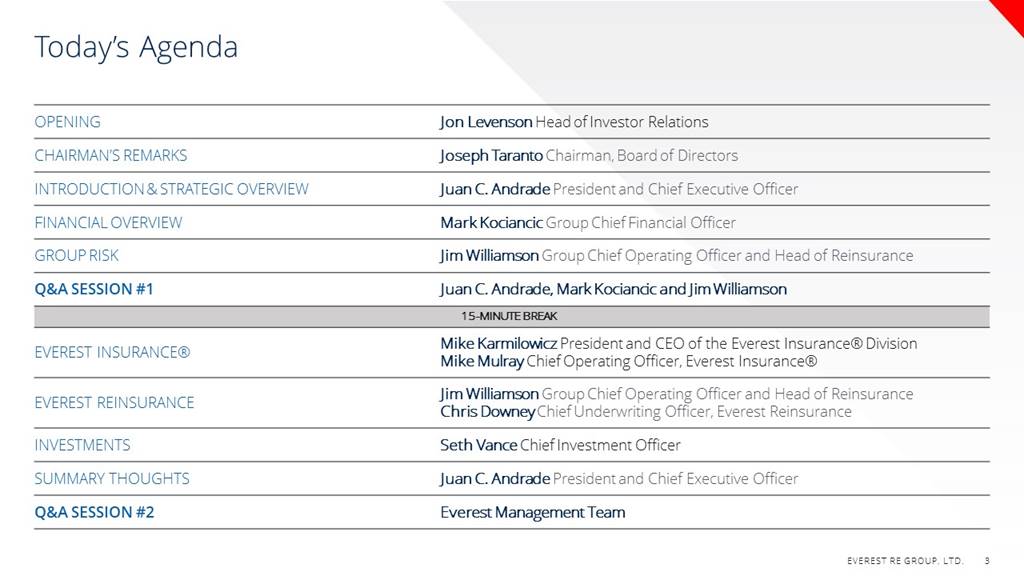
Today's Agenda
OPENING
Jon Levenson Head of Investor Relations
CHAIRMAN'S REMARKS
Joseph Taranto Chairman, Board of Directors
INTRODUCTION & STRATEGIC OVERVIEW
Juan C. Andrade President and Chief Executive Officer
FINANCIAL OVERVIEW
Mark Kociancic Group Chief Financial Officer
GROUP RISK
Jim Williamson Group Chief Operating Officer and Head of Reinsurance
Q&A SESSION #1
Juan C. Andrade, Mark Kociancic and Jim Williamson
15-MINUTE BREAK
EVEREST INSURANCE®
Mike Karmilowicz President and CEO of the Everest Insurance® Division
Mike Mulray Chief Operating Officer, Everest Insurance®
EVEREST REINSURANCE
Jim Williamson Group Chief Operating Officer and Head of Reinsurance
Chris Downey Chief Underwriting Officer, Everest Reinsurance
INVESTMENTS
Seth Vance Chief Investment Officer
SUMMARY THOUGHTS
Juan C. Andrade President and Chief Executive Officer
Q&A SESSION #2
Everest Management Team
EVEREST RE GROUP, LTD.
3
Introduction
& Strategic
Overview
EVEREST RE GROUP, LTD.
4
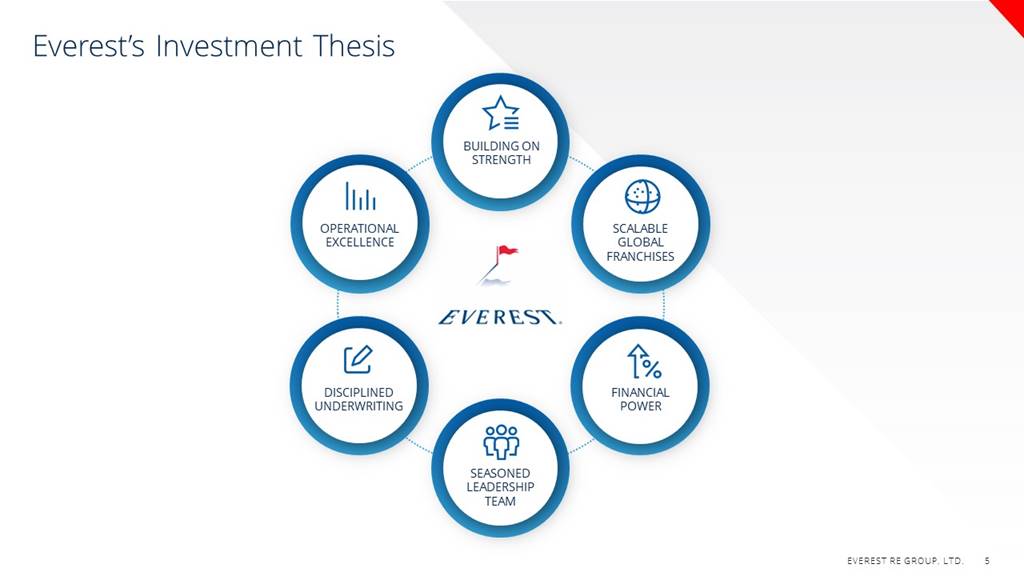
Everest's Investment Thesis
BUILDING ON STRENGTH
OPERATIONAL EXCELLENCE
SCALABLE GLOBAL FRANCHISES EVEREST
DISCIPLINED UNDERWRITING
FINANCIAL POWER
SEASONED LEADERSHIP TEAM
EVEREST RE GROUP, LTD.
5
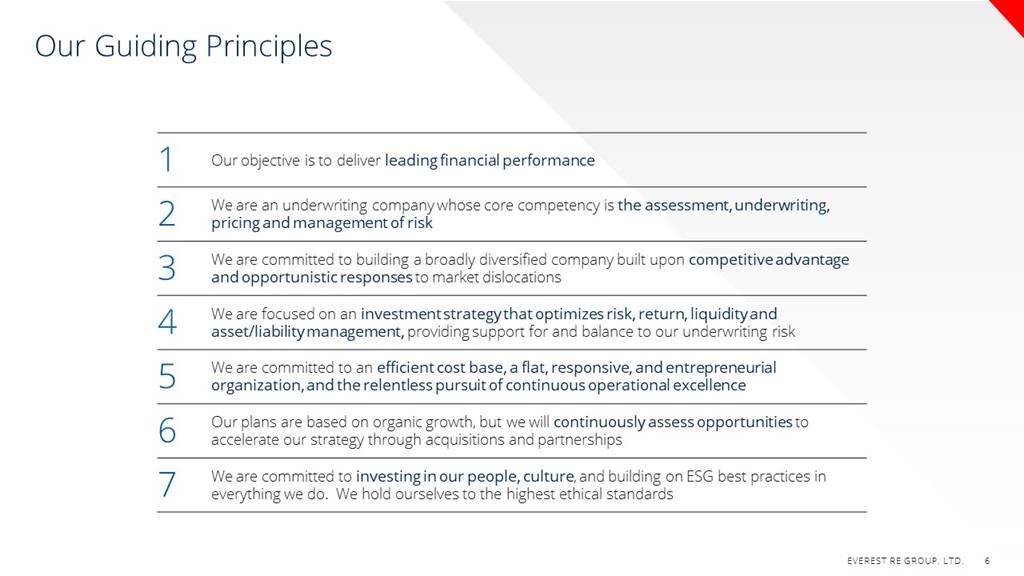
Our Guiding Principles
1. Our objective is to deliver leading financial performance
2. We are an underwriting company whose core competency is the assessment, underwriting, pricing and management of risk
3. We are committed to building a broadly diversified company built upon competitive advantage
and opportunistic responses to market dislocations 4. We are focused on an investment strategy that optimizes risk, return, liquidity and asset/liability management, providing support for and balance to our underwriting risk
5. We are committed to an efficient cost base, a flat, responsive, and entrepreneurial organization, and the relentless pursuit of continuous operational excellence
6. Our plans are based on organic growth, but we will continuously assess opportunities to accelerate our strategy through acquisitions and partnerships
7. We are committed to investing in our people, culture, and building on ESG best practices in everything we do. We hold ourselves to the highest ethical standards
EVEREST RE GROUP, LTD.
6

Forging a New Path Forward
Building on a 50-year legacy
Operating from aposition of strength
Top Tier Management Team
Operational Excellence
Margin Expansion
Enhanced Investment Performance
Effective Capital Management
Global and Diverse Talent and Culture
EVEREST RE GROUP, LTD.
7

Delivering For Our Stakeholders
Building on
Strength
Accelerating profitable insurance growth / Capitalizing on leading global reinsurance franchise
Path forward is
Clear
Defined strategic priorities
Delivering superior
Results
Attractive shareholder returns
EVEREST RE GROUP, LTD.
8

A Unique Global Platform
STRONG GROSS WRITTEN PREMIUM GROWTH
EVEREST: A MARKET LEADER
$10.5
$9.1
$8.5
Growth company with competitive advantage in key markets
$7.2
$3.2
$6.0
$2.3
$2.8
$2.1
$1.8
Broadly diversified income streams
$6.2
$6.4
$7.3
$4.2
$5.1
Strong underlying underwriting performance with
reduced volatility
2016
2017
2018
2019
2020
Reinsurance
Insurance
Low expense base
ROBUST FINANCIAL METRICS
Nimble, entrepreneurial and responsive
BALANCE SHEET
(12/31/20)
$9.7B
14.1%
$25.5B
Strong cash flow
GAAP EQUITY
LT DEBT TO
CAPITAL(1)
INVESTMENT
PORTFOLIO
Growing, highly liquid, strong credit quality
investments
A+
A+
A1
FINANCIAL
STRENGTH
RATINGS
Robust, scalable 3rd party capital capabilities
A.M. Best
S&P Global
Moody's Investors
Service
STABLE OUTLOOK
(1) Excludes FHLB debt
EVEREST RE GROUP, LTD.
9

Everest Re: Our Divisions
POSITIONING
Everest Reinsurance Division
Everest Insurance® Division
· Entrepreneurial and responsive problem solvers
2020 GROSS WRITTEN PREMIUM BUSINESS MIX
2020 GROSS WRITTEN PREMIUM BUSINESS MIX
9%
Property Pro Rata
12%
16%
Accident & Health
· Rigorous centralized business controls and risk management allow for active portfolio oversight
13%
Property Non-Cat XOL
33%
Specialty Casualty
Property Cat XOL
$7.3B
$3.2 B
Prof Liab / Other Specialty
19%
Casualty Pro Rata
31%
· Think Globally, trade locally with 24 offices in 10 countries
21%
Property / Short Tail
Casualty XOL
7%
Financial Lines
Workers' Comp
17%
22%
· Preferred partner to our customers
KEY OPERATING STATISTICS
KEY OPERATING STATISTICS
· 11% GWP CAGR (5-Years)
· 16% GWP CAGR (5-Years)
· 85.2% attritional combined ratio* (2020)
· 94.2% attritional combined ratio* (2020)
* Attritional combined ratio excludes catastrophe losses, reinstatement premiums, prior year development and COVID-19 pandemic impact.
EVEREST RE GROUP, LTD.
10
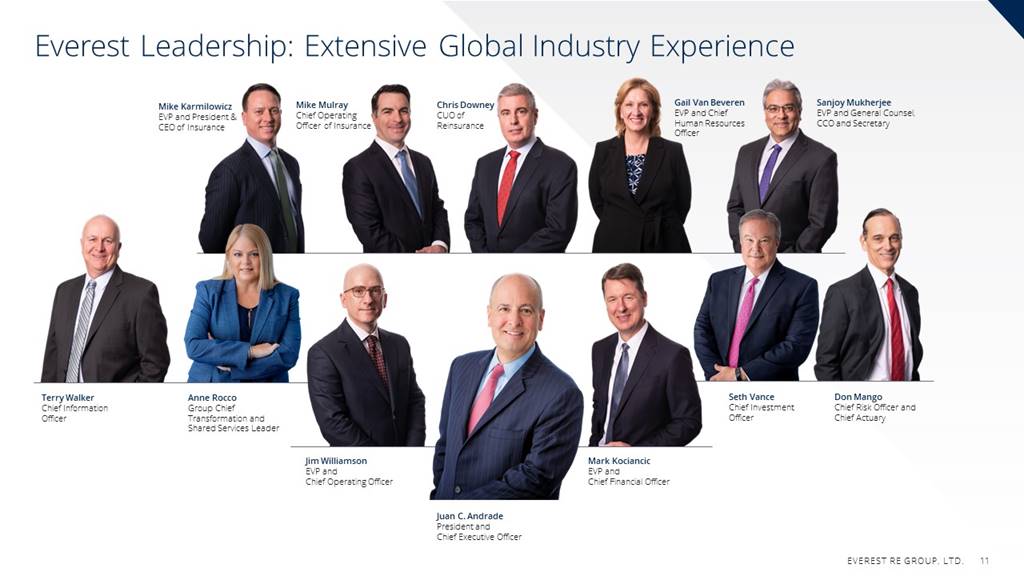
Everest Leadership: Extensive Global Industry Experience
Mike Karmilowicz
EVP and President & CEO of Insurance
Mike Mulray
Chief Operating Officer of Insurance
Chris Downey
CUO of Reinsurance
Gail Van Beveren
EP and Chief Human Resources
Officer
Sanjoy Mukherjee
EVP and General Counsel, CCO and Secretary
.
Terry Walker
Chief Information Officer
Anne Rocco
Group Chief Transformation and Shared Services Leader
Seth Vance
Chief Investment Officer
Don Mango
Chief Risk Officer and Chief Actuary
Jim Williamson
EVP and Chief Operating Officer
Mark Kociancic
EVP and Chief Financial Officer
Juan C. Andrade
President and Chief Executive Officer
EVEREST RE GROUP, LTD.
11

Strategic Building Blocks
BUILDING OUR FRANCHISES
· Grow the Specialty P&C Insurance Platform with Expanded Margins
· Capitalize on and Grow Leading P&C Reinsurance Franchise
· Sharpen Investment Strategy
CONTINUOUS PURSUIT OF OPERATIONAL
EXCELLENCE
· Focused Underwriting Discipline
· Dynamic Capital Allocation
· Scalable Operating Model
WINNING BEHAVIORS
· Focus on People, Talent and Culture
· Promoting Diversity, Equity and Inclusion
· Pursue ESG Excellence
EVEREST RE GROUP, LTD.
12
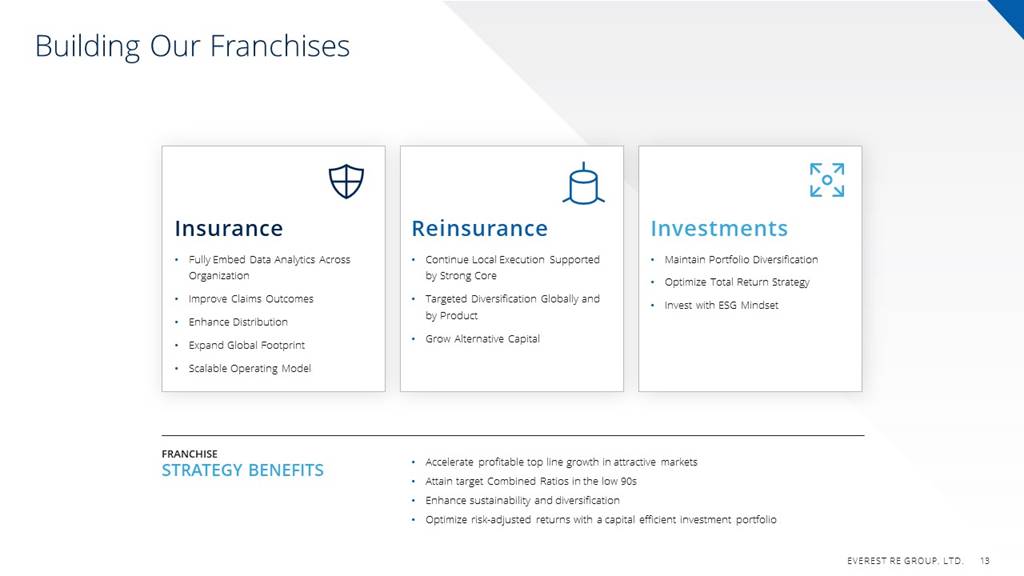
Building Our Franchises
Insurance
· Fully Embed Data Analytics Across
· Improve Claims Outcomes
· Enhance Distribution
· Expand Global Footprint
· Scalable Operating Model
Reinsurance
· Continue Local Execution Supported by Strong Core
· Targeted Diversification Globally and by Product
· Grow Alternative Capital
Investments
· Maintain Portfolio Diversification
· Optimize Total Return Strategy
· Invest with ESG Mindset
FRANCHISE
STRATEGY BENEFITS
· Accelerate profitable top line growth in attractive markets
· Attain target Combined Ratios in the low 90s
· Enhance sustainability and diversification
· Optimize risk-adjusted returns with a capital efficient investment portfolio
EVEREST RE GROUP, LTD.
13
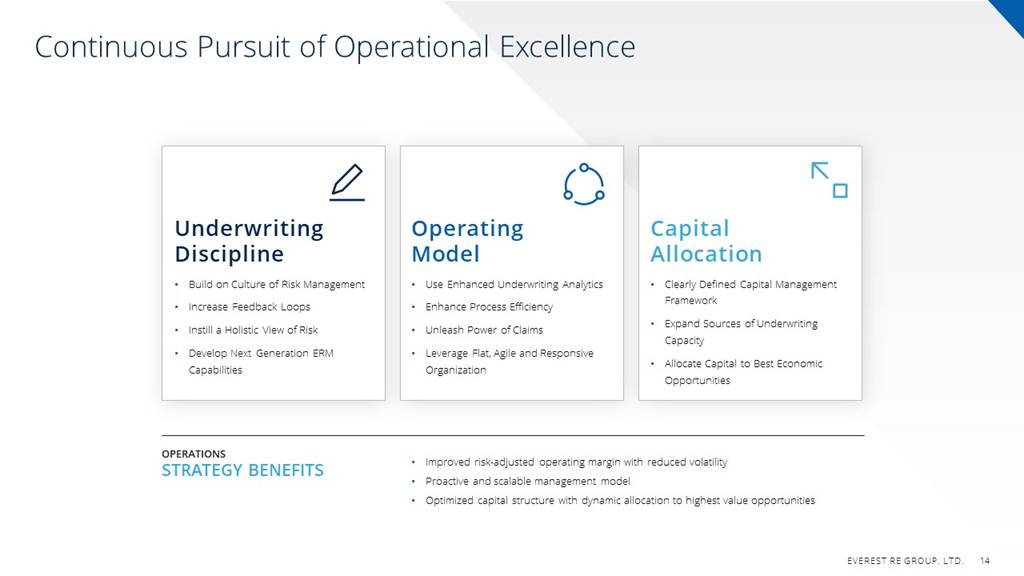
Continuous Pursuit of Operational Excellence
Underwriting Discipline
· Build on Culture of Risk Management
· Increase Feedback Loops
· Instill a Holistic View of Risk
· Develop Next Generation ERM Capabilities
Operating Model
· Use Enhanced Underwriting Analytics
· Enhance Process Efficiency
· Unleash Power of Claims
· Leverage Flat, Agile and Responsive Organization
Capital Allocation
· Clearly Defined Capital Management Framework
· Expand Sources of Underwriting Capacity
· Allocate Capital to Best Economic Opportunities
OPERATIONS
STRATEGY BENEFITS
· Improved risk-adjusted operating margin with reduced volatility
· Proactive and scalable management model
· Optimized capital structure with dynamic allocation to highest value opportunities
EVEREST RE GROUP, LTD.
14
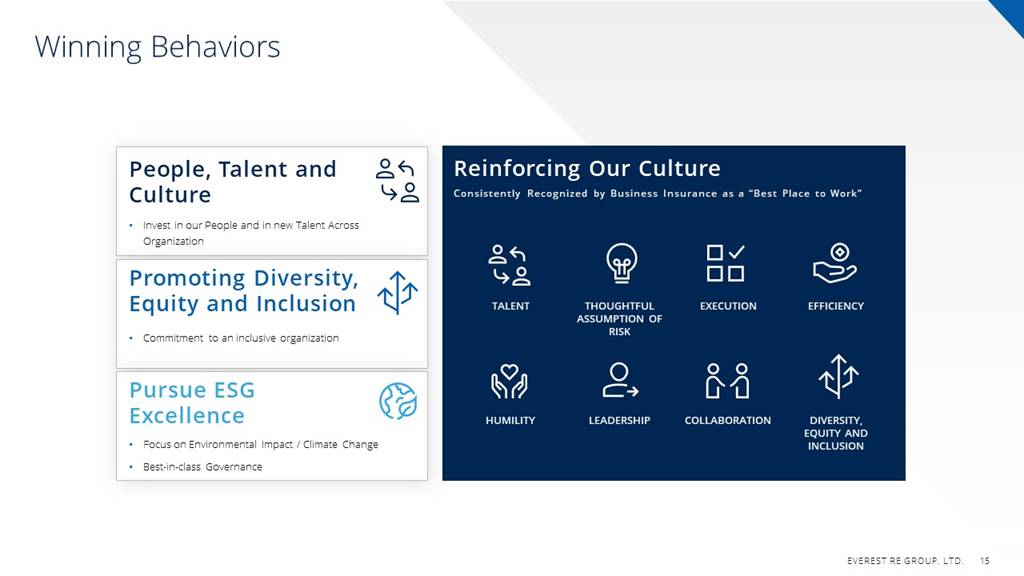
Winning Behaviors
People, Talent and Culture
· Invest in our People and in new Talent Across Organization
Promoting Diversity, Equity and Inclusion
· Commitment to an inclusive organization
Pursue ESG Excellence
· Focus on Environmental Impact / Climate Change
· Best-in-class Governance
Reinforcing Our Culture
Consistently Recognized by Business Insurance as a "Best Place to Work"
TALENT
EXECUTION
EFFICIENCY
THOUGHTFUL ASSUMPTION OF RISK
HUMILITY
LEADERSHIP
COLLABORATION
DIVERSITY, EQUITY AND INCLUSION
EVEREST RE GROUP, LTD.
15
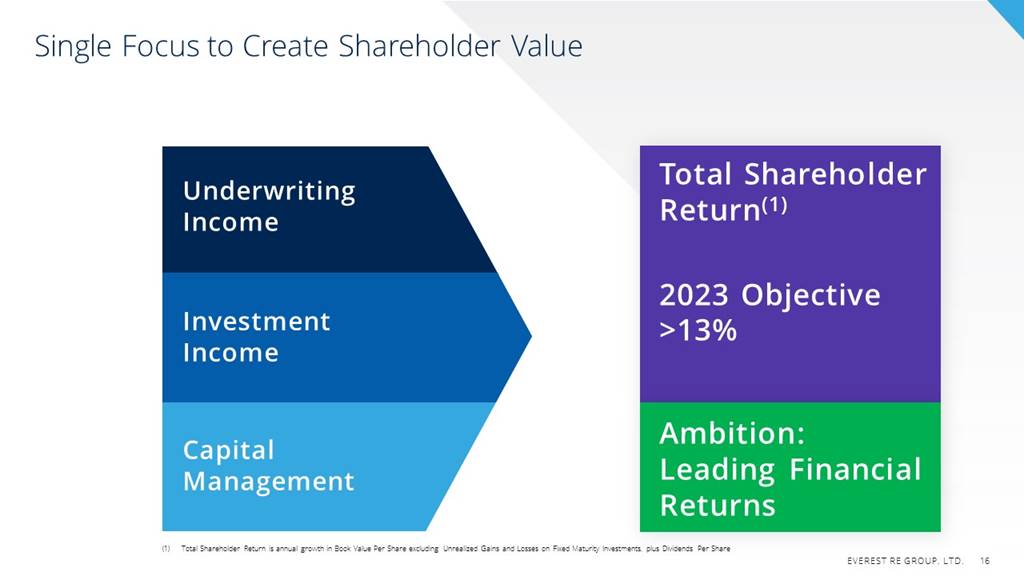
Single Focus to Create Shareholder Value
Underwriting Income
Investment Income
Capital Management
Total Shareholder Return(1)
2023 Objective > 13%
Ambition: Leading Financial Returns
(1)Total Shareholder Return is annual growth in Book Value Per Share excluding Unrealized Gains and Losses on Fixed Maturity Investments, plus Dividends Per Share
EVEREST RE GROUP, LTD.
16
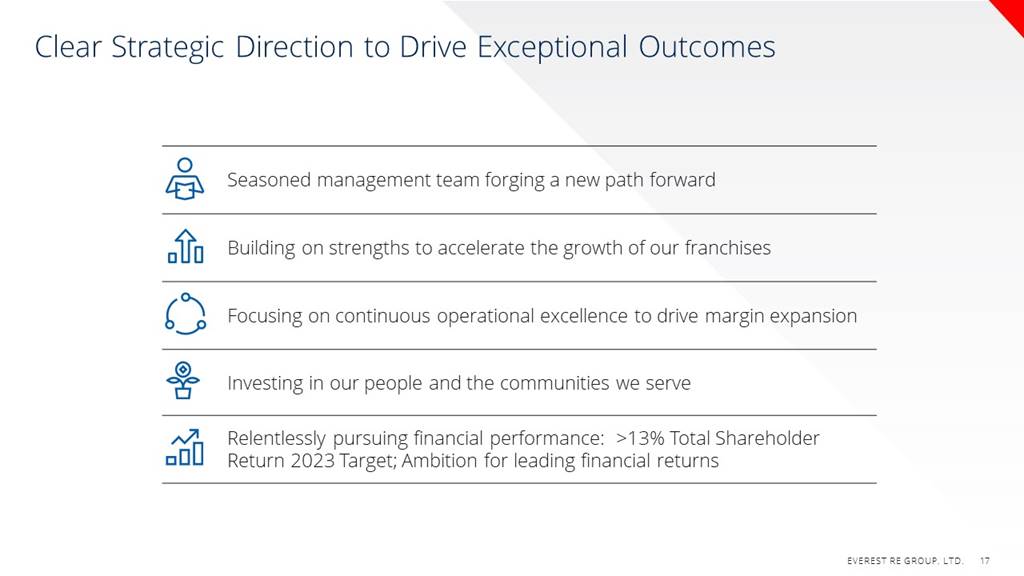
Clear Strategic Direction to Drive Exceptional Outcomes
Seasoned management team forging a new path forward
Building on strengths to accelerate the growth of our franchises
Focusing on continuous operational excellence to drive margin expansion
Investing in our people and the communities we serve
Relentlessly pursuing financial performance: >13% Total Shareholder col Return 2023 Target; Ambition for leading financial returns
EVEREST RE GROUP, LTD.
17

Group
Finance
Overview
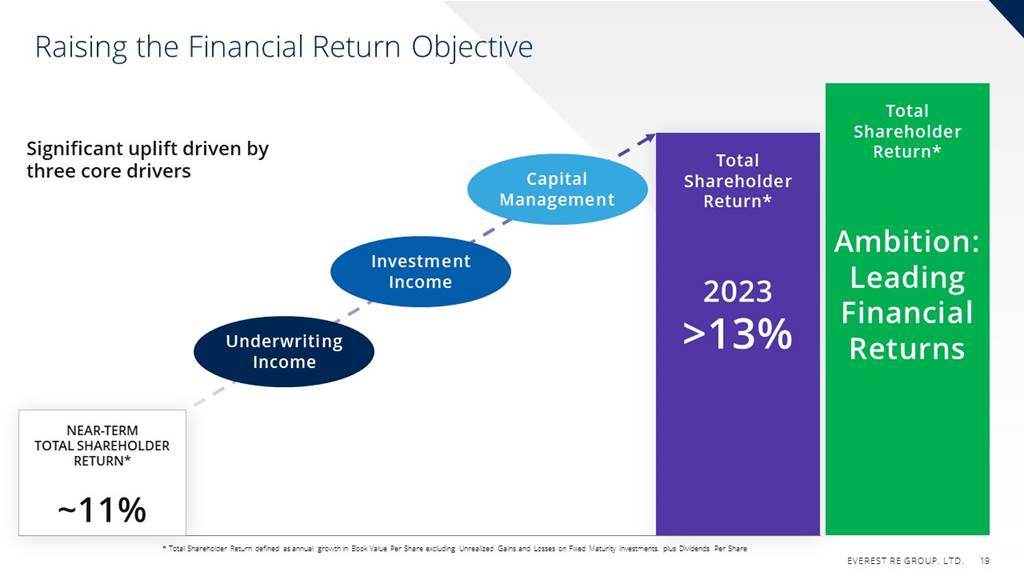
Raising the Financial Return Objective
Significant uplift driven by three core drivers
NEAR-TERM TOTAL SHAREHOLDER RETURN*
~11%
Underwriting Income
Investment Income
Capital Management
Total Shareholder Return*
2023
> 13%
Total Shareholder Return*
Ambition: Leading Financial Returns
Underwriting Income
* Total Shareholder Return defined as annual growth in Book Value Per Share excluding Unrealized Gains and Losses on Fixed Maturity Investments, plus Dividends Per Share
EVEREST RE GROUP, LTD.
19

3-Year (2021 – 2023) Strategic Plan Financial Target Assumptions
GWP Growth Rate
Key Ratios
Underwriting Income
2023
Group: 10 - 15% CAGR
• 91% - 93% CR (Group and Divisions)
.
Reinsurance: 8 - 12% CAGR
6 - 7% Cat load (included in CR)
Insurance: 18-22% CAGR
~6% Group general expense ratio
Total Shareholder Return*
Investment Mix
Return on Inv Assets
Investment Income
2.75% - 3.25%
Increasing Alternative Fixed
Income, Public & Private Equity
>13%
Capital Structure
Capital Return
Capital
Management
• A+ Financial Strength Rating(1)
• Commitment to proactive capital management
15 -20% LT Debt Leverage Ratio
* Total Shareholder Return defined as annual growth in Book Value Per Share excluding Unrealized Gains and Losses on Fixed Maturity Investments, plus Dividends Per Share
(1) Moderately-high risk profile
EVEREST RE GROUP, LTD.
20

Delivering Financial Performance: Underwriting Income
Premium Growth & Scale
· Strong gross written premium growth creates operating leverage
· Scalable platforms
Technology Enhancements
· Investment in data & analytics
· Improved claims outcomes
· Transitioning manual processes to automated solutions
Underwriting and Portfolio Optimization
· Thoughtful cycle management
· Dynamic portfolio Management
· Margin expansion
· Expense discipline
EVEREST RE GROUP, LTD.
21
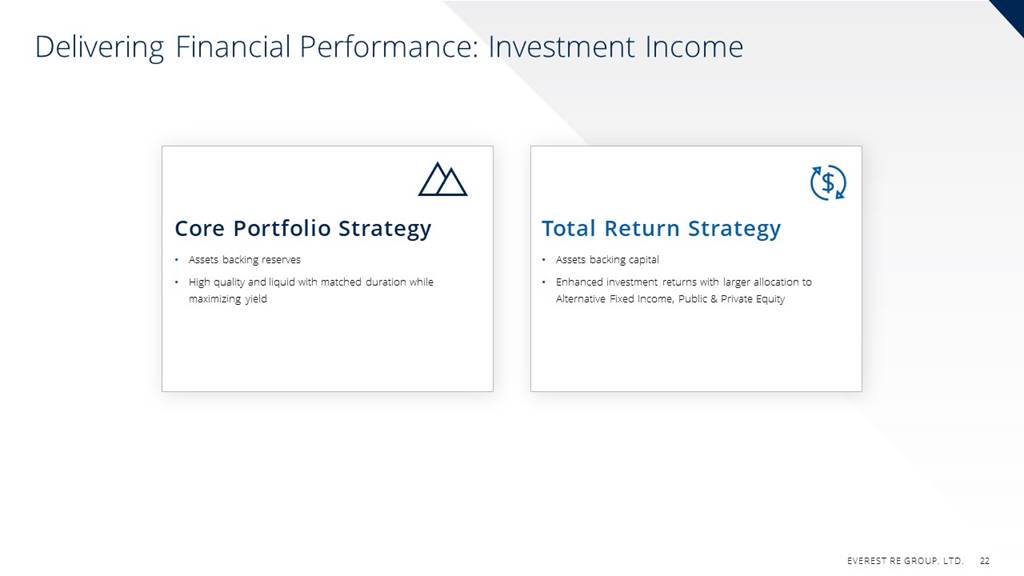
Delivering Financial Performance: Investment Income
Core Portfolio Strategy
· Assets backing reserves
· High quality and liquid with matched duration while maximizing yield
Total Return Strategy
· Assets backing capital
· Enhanced investment returns with larger allocation to Alternative Fixed Income, Public & Private Equity
EVEREST RE GROUP, LTD.
22
Delivering Financial Performance: Capital Management
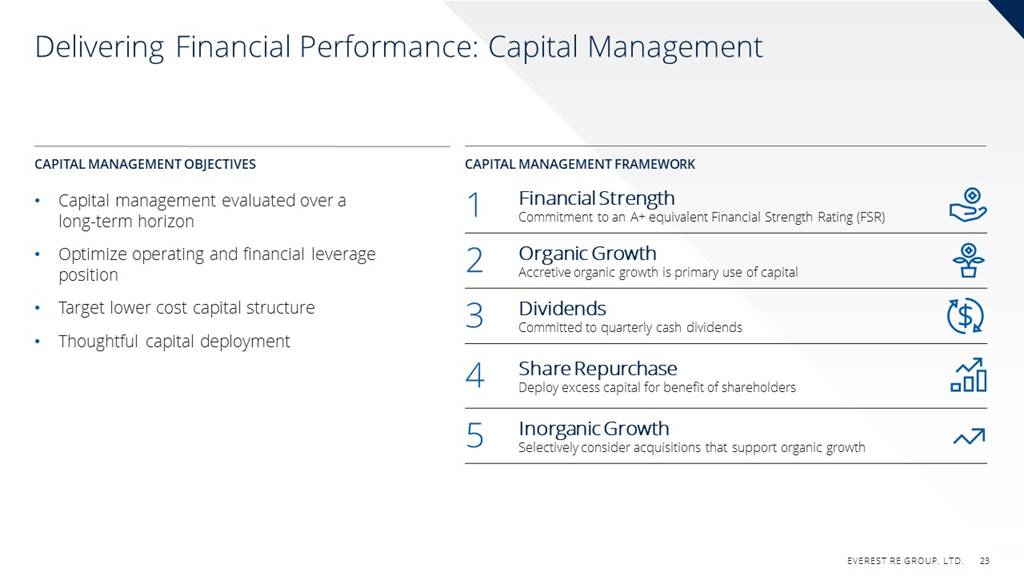
CAPITAL MANAGEMENT OBJECTIVES
CAPITAL MANAGEMENT FRAMEWORK
· Capital management evaluated over a long-term horizon
1 Financial Strength
Commitment to an A+ equivalent Financial Strength Rating (FSR)
.
· Optimize operating and financial leverage position
2 Organic Growth
Accretive organic growth is primary use of capital
· Target lower cost capital structure
3 Dividends
Committed to quarterly cash dividends
· Thoughtful capital deployment
4 Share Repurchase
Deploy excess capital for benefit of shareholders
5 Inorganic Growth
Selectively consider acquisitions that support organic growth
EVEREST RE GROUP, LTD.
23
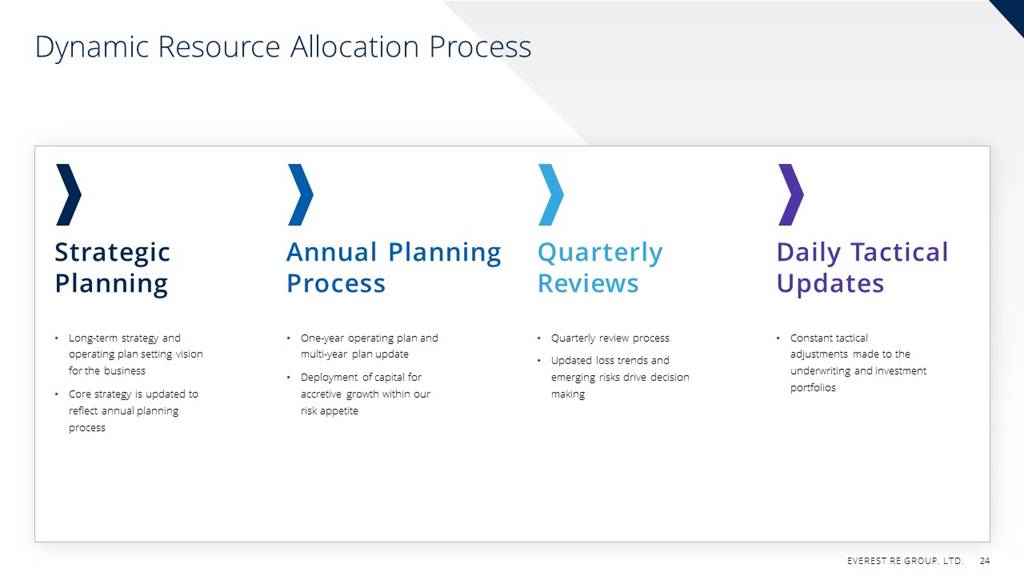
Dynamic Resource Allocation Process
Strategic Planning
· Long-term strategy and operating plan setting vision for the business
· Core strategy is updated to reflect annual planning process
Annual Planning Process
· One-year operating plan and multi-year plan update
· Deployment of capital for accretive growth within our risk appetite
Quarterly Reviews
· Quarterly review process
· Updated loss trends and emerging risks drive decision making
Daily Tactical Updates
· Constant tactical adjustments made to the underwriting and investment portfolios
EVEREST RE GROUP, LTD.
24
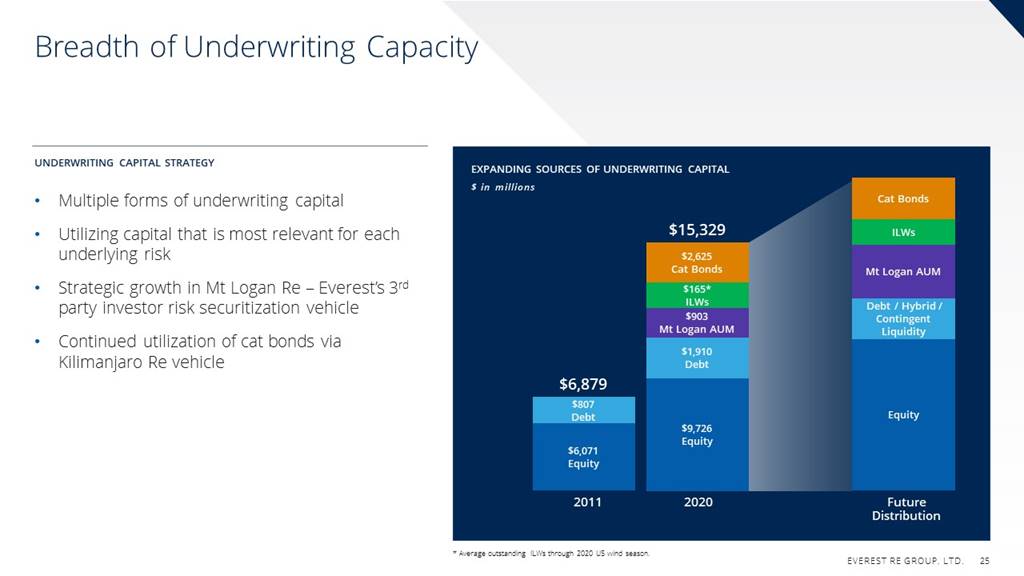
Breadth of Underwriting Capacity
UNDERWRITING CAPITAL STRATEGY
EXPANDING SOURCES OF UNDERWRITING CAPITAL
$ in millions
· Multiple forms of underwriting capital
Cat Bonds
$15,329
ILWs
· Utilizing capital that is most relevant for each underlying risk
$2,625
Cat Bonds
Mt Logan AUM
· Strategic growth in Mt Logan Re - Everest's 3rd party investor risk securitization vehicle
$165*
ILWs
$903
Mt Logan AUM
Debt / Hybrid /
Contingent
Liquidity
· Continued utilization of cat bonds via Kilimanjaro Re vehicle
$1,910
Debt
$6,879
$807
Debt
Equity
$9,726
Equity
$6,071
Equity
2011
2020
Future
Distribution
* Average outstanding ILWs through 2020 US wind season.
EVEREST RE GROUP, LTD.
25
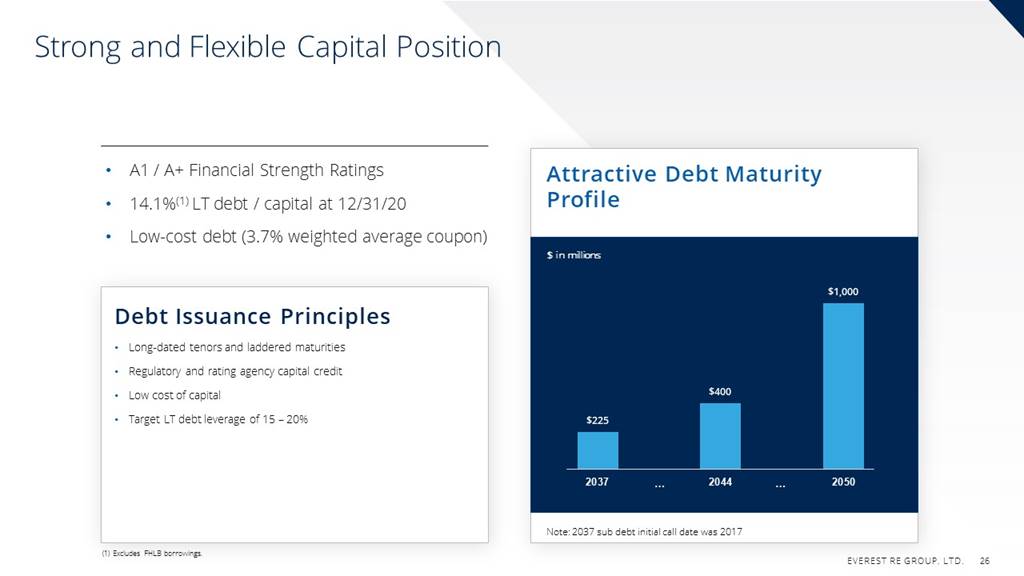
Strong and Flexible Capital Position
· A1 / A+ Financial Strength Ratings
Attractive Debt Maturity
Profile
· 14.1%(1) LT debt / capital at 12/31/20
· Low-cost debt (3.7% weighted average coupon)
$ in millions
$1,000
Debt Issuance Principles
.
· Long-dated tenors and laddered maturities
· Regulatory and rating agency capital credit
· Low cost of capital
· Target LT debt leverage of 15 - 20%
$400
$225
2037
2044
2050
Note: 2037 sub debt initial call date was 2017
(1) Excludes FHLB borrowings.
EVEREST RE GROUP, LTD.
26
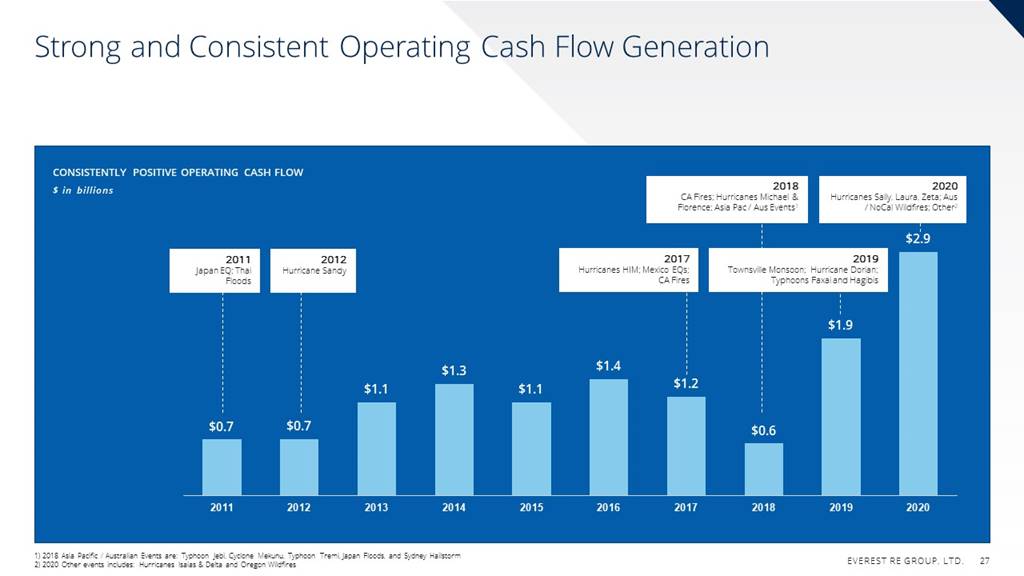
Strong and Consistent Operating Cash Flow Generation
CONSISTENTLY POSITIVE OPERATING CASH FLOW
$ in billions
2018 CA Fires; Hurricanes Michael & Florence; Asia Pac/Aus Events
2020 Hurricanes Sally, Laura, Zeta; Aus /NoCal Wildfires; Other2
$2.9
2011 Japan EQ; Thai Floods
2012 Hurricane Sandy
2017 Hurricanes HIM; Mexico EQS; CA Fires
2019 Townsville Monsoon; Hurricane Dorian; Typhoons Faxai and Hagibis
$1.9
$1.3
$1.4
$1.2
$1.1
$1.1
$0.7
$0.7
$0.6
2011
2012
2013
2014
2015
2016
2017
2018
2019
2020
1) 2018 Asia Pacific / Australian Events are: Typhoon jebi, Cyclone Mekunu, Typhoon Tremi Japan Floods, and Sydney Hailstorm
2) 2020 Other events includes: Hurricanes Isaias & Delta and Oregon Wildfires
EVEREST RE GROUP, LTD.
27

Prudent Liquidity Management
STRONG LIQUIDITY PROFILE
· U.S. platform minimizes collateral requirements
•
$1.6B FHLB*
Facility
· Strong operating cash flows
.
· Conservative PML's
Liquidity Facility
· Quality reinsurance with significant available collateral
· Low debt leverage
Everest's Liquidity Paradigm
· Readily marketable investment securities
Fixed Income Assets
Investment Income
· $1.6B Federal Home Loan Bank (FHLB) credit facility
Cash & Short-term Assets
Underwriting Income
Liquid Assets
Operating Cash Flows
* Federal Home Loan Bank (FHLB)
EVEREST RE GROUP, LTD.
28
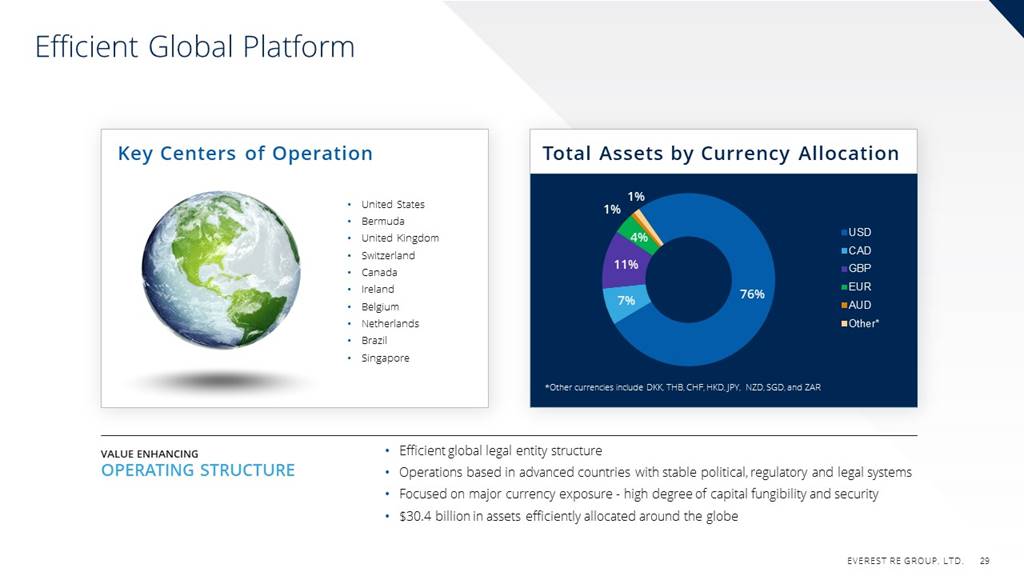
Efficient Global Platform
Key Centers of Operation
Total Assets by Currency Allocation
· United States
1%
1%
· Bermuda
USD
· United Kingdom
4%
· Switzerland
CAD
11%
· Canada
GBP
· Ireland
EUR
76%
7%
.
· Belgium
I AUD
O
· Netherlands
Other*
· Brazil
· Singapore
*Other currencies include DKK, THB, CHF, HKD JPY, NZD, SGD, and ZAR
VALUE ENHANCING
OPERATING STRUCTURE
•
· Efficient global legal entity structure
· Operations based in advanced countries with stable political, regulatory and legal systems
· Focused on major currency exposure - high degree of capital fungibility and security
· $30.4 billion in assets efficiently allocated around the globe
.
EVEREST RE GROUP, LTD.
29

Financial Strategy Supports Shareholder Value Creation
2023 Total Shareholder Return target >13%; Ambition for leading financial returns
10 - 15% gross written premium CAGR
Low 90's combined ratio assumption
Enhancing investment returns with greater focus on Alternative FI / PE
Capital structure evolution will improve shareholder returns
EVEREST RE GROUP, LTD.
30

Group Risk
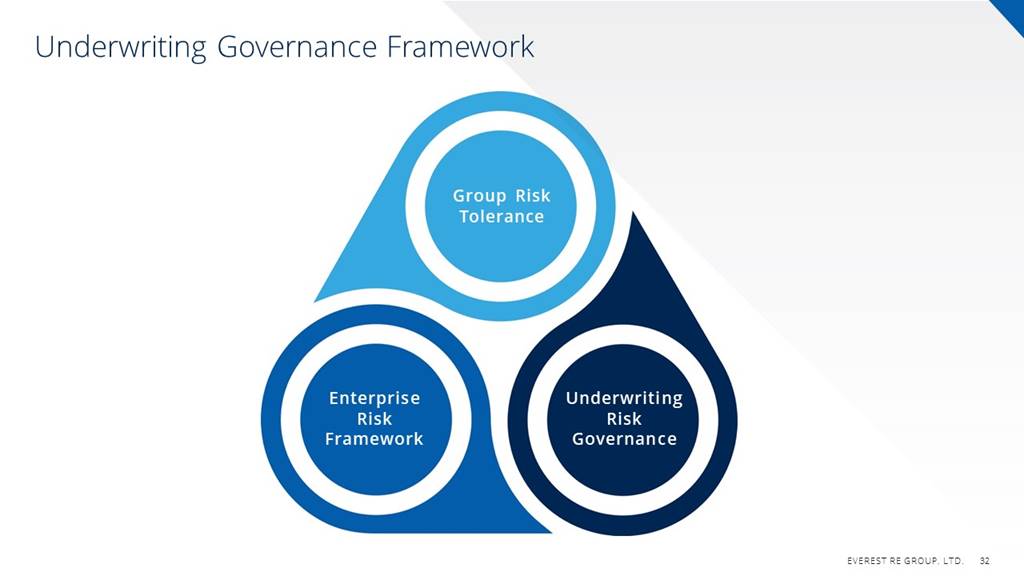
Underwriting Governance Framework
Group Risk Tolerance
Enterprise Risk Framework
Underwriting Risk Governance
EVEREST RE GROUP. LTD.
32

Transforming Everest's Risk Profile
ENTERPRISE RISK STRATEGY
Risk Profile Managed to Superior Risk / Reward Economics
· Increased expected earnings despite significant reduction in risk profile
2017
· Go-forward appetite defined by clear trading range
· Strong market conditions mean a nimble deployment of additional capacity
2016
2018
2015
Reducing Risk: PML Management
Earnings at Risk
AFTER TAX 1:100 PML AS A % OF GROUP EQUITY*
2014
11.4%
2019
9.1%
7.7%
6.7%
2021
5.9%
5.2%
2020
2017
2021
Capital at Risk
illustrative purposes
SE U.S., Wind Cal, EQ Texas, Wind
* Calculated as the 1:100 PML as of January 1 of the respective year, divided by Everest's shareholders' equity of the preceding December 31.
EVEREST RE GROUP, LTD.
33
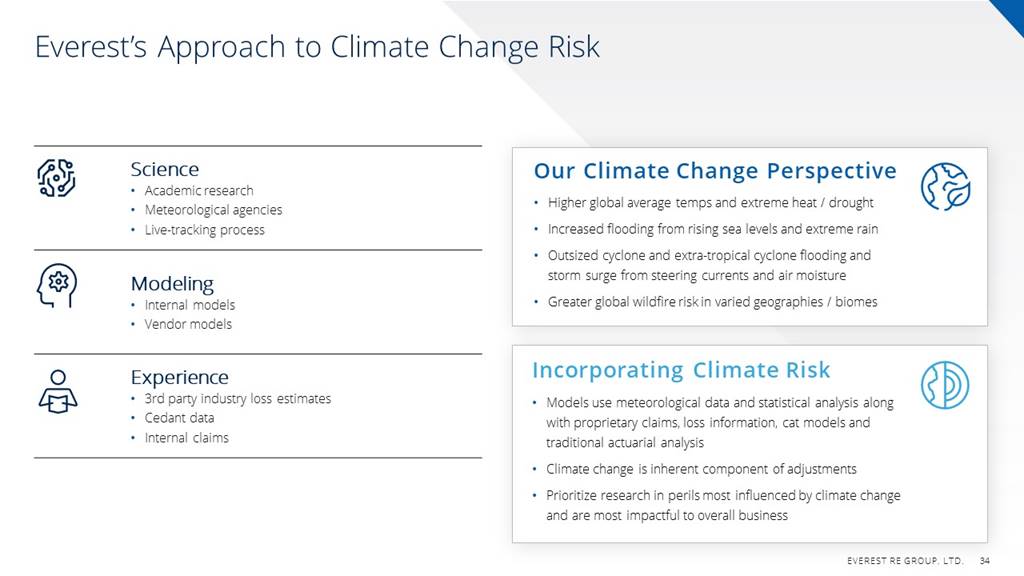
Everest's Approach to Climate Change Risk
Science
· Academic research
· Meteorological agencies
· Live-tracking process
Modeling
· Internal models
· Vendor models
Experience
· 3rd party industry loss estimates
· Cedant data
· Internal claims
Our Climate Change Perspective
· Higher global average temps and extreme heat / drought
· Increased flooding from rising sea levels and extreme rain
· Outsized cyclone and extra-tropical cyclone flooding and storm surge from steering currents and air moisture
· Greater global wildfire risk in varied geographies / biomes
Incorporating Climate Risk
· Models use meteorological data and statistical analysis along with proprietary claims, loss information, cat models and traditional actuarial analysis
· Climate change is inherent component of adjustments
· Prioritize research in perils most influenced by climate change and are most impactful to overall business
EVEREST RE GROUP, LTD.
34
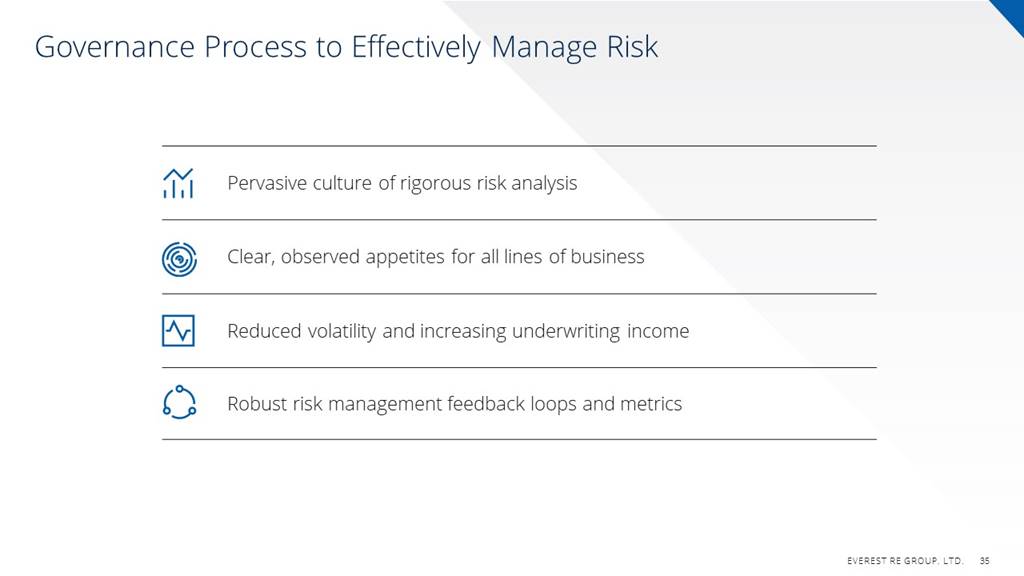
Governance Process to Effectively Manage Risk
Pervasive culture of rigorous risk analysis
Clear, observed appetites for all lines of business
Reduced volatility and increasing underwriting income
Robust risk management feedback loops and metrics
EVEREST RE GROUP, LTD.
35

Q&A
Everest
Insurance
z
Our Mission
To be a World-Class Specialty Diversified Global Insurance Company
EVEREST RE GROUP, LTD.
38
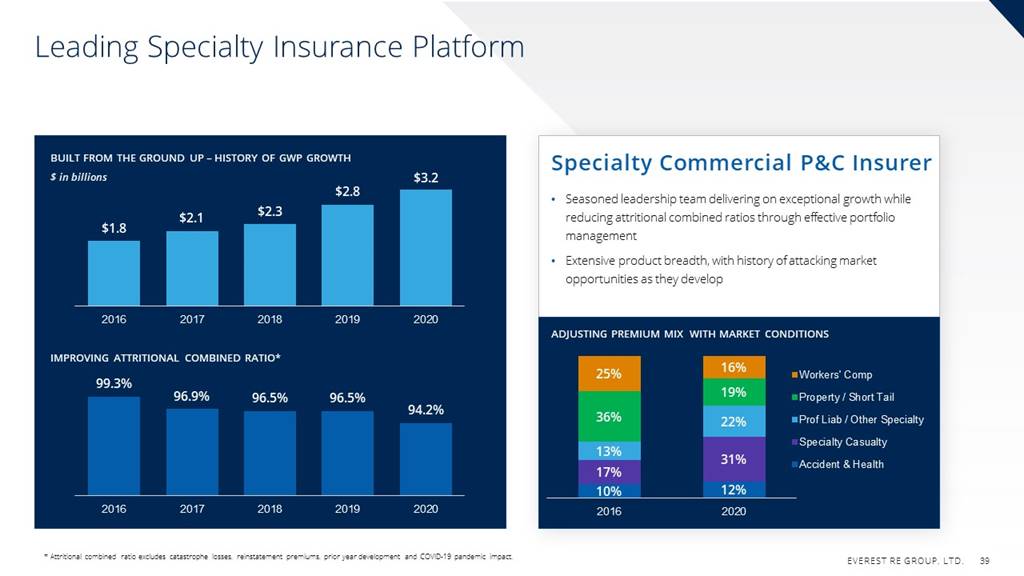
Leading Specialty Insurance Platform
BUILT FROM THE GROUND UP - HISTORY OF GWP GROWTH
Specialty Commercial P&C Insurer
$ in billions
$3.2
$2.8
$2.3
· Seasoned leadership team delivering on exceptional growth while reducing attritional combined ratios through effective portfolio management
$2.1
$1.8
1
.
· Extensive product breadth, with history of attacking market opportunities as they develop
2016
2017
2018
2019
2020
ADJUSTING PREMIUM MIX WITH MARKET CONDITIONS
IMPROVING ATTRITIONAL COMBINED RATIO*
16%
25%
Workers' Comp
99.3%
96.9%
19%
96.5%
96.5%
Property / Short Tail
94.2%
36%
22%
Prof Liab/ Other Specialty
Specialty Casualty
13%
31%
Accident & Health
17%
10%
12%
2016
2017
2018
2019
2020
2016
2020
* Attritional combined ratio excludes catastrophe losses, reinstatement premiums, prior year development and COVID-19 pandemic impact.
EVEREST RE GROUP, LTD.
39
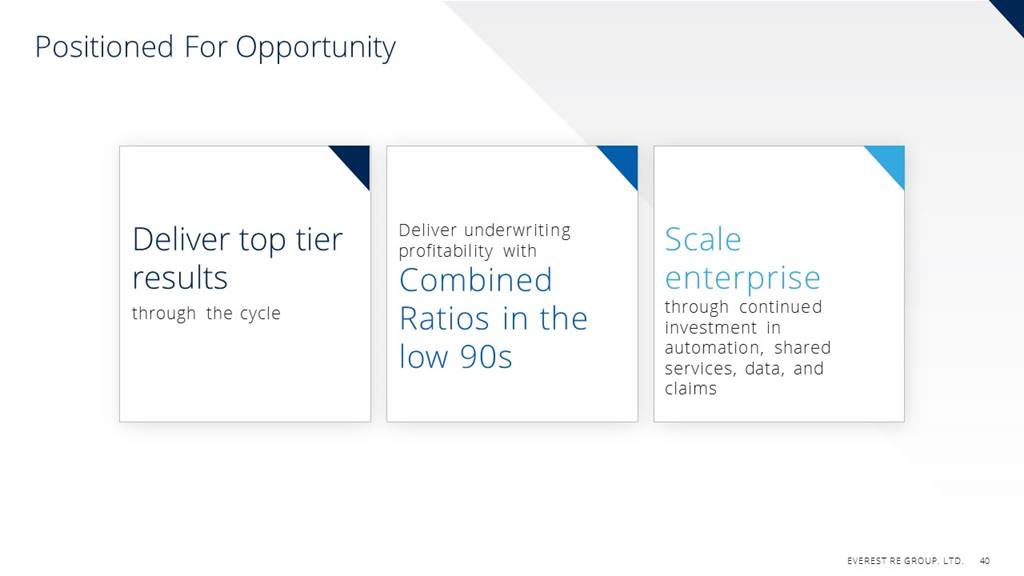
Positioned For Opportunity
Deliver top tier results through the cycle
Deliver underwriting profitability with Combined Ratios in the low 90s
Scale enterprise through continued investment in automation, shared services, data, and claims
EVEREST RE GROUP, LTD.
40
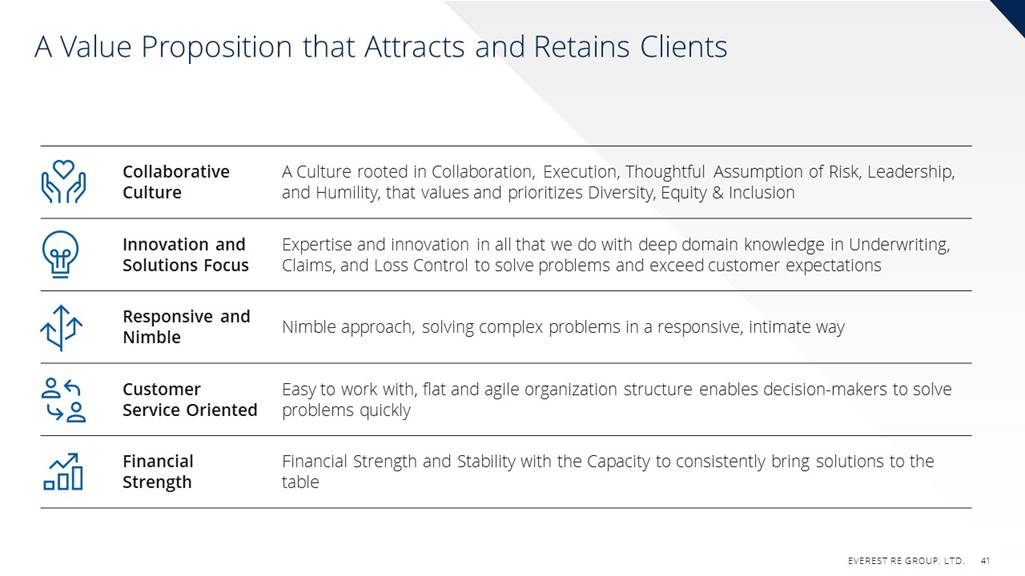
A Value Proposition that Attracts and Retains Clients
Collaborative Culture
A Culture rooted in collaboration, Execution, Thoughtful Assumption of Risk, Leadership, and Humility, that values and prioritizes Diversity, Equity & Inclusion
Innovation and Solutions Focus
Expertise and innovation in all that we do with deep domain knowledge in Underwriting, Claims, and Loss Control to solve problems and exceed customer expectations
Responsive and Nimble
Nimble approach, solving complex problems in a responsive, intimate way
Customer Service Oriented
Easy to work with, flat and agile organization structure enables decision-makers to solve problems quickly
Financial Strength
Financial Strength and Stability with the Capacity to consistently bring solutions to the table
EVEREST RE GROUP, LTD.
41

Industry Leading Management Team
EXECUTIVE LEADERSHIP
MIKE KARMILOWICZ
President & CEO
MIKE MULRAY
Chief Operating Officer
DANA LODGE
Chief Financial Officer
PATRICIA MCMAHON
Chief Claims Officer
MARCUS COOPER
Senior Vice President Head of North American Distribution, Insurance
OWEN WILLIAMS
Senior Vice President, ETS Global Business Systems
GLOBAL LEADERSHIP
VINCENT VANDENDAEL
CEO Everest Global Markets
LINDA RYAN
CEO Everest Insurance (Ireland), DAC
NEIL LIGHTBOWN
CUO, Everest Global Markets and Active Underwriter, Syndicate 2786
DARIN SCANZANO
CEO Everest Insurance Company of Canada
KYLE ADAMS
Head of Bermuda Insurance
CAMERON VOGT
Global Head of Actuarial Pricing & Modeling
SEGMENT LEADERSHIP
DAVID SANDLER
President Risk Management Group
CONNIE GERMANO
President Specialty Casualty
BRIAN DRUM
Senior Vice President, Head of Everest Underwriting Partners
ERIK NIKODEM
Senior Vice President, Global Head of Property
ROB CLARK
Senior Vice President, Head of Everest Specialty Underwriters
LOU MONTEAGUDO
Senior Vice President, Head of Accident & Health
EVEREST RE GROUP, LTD.
42
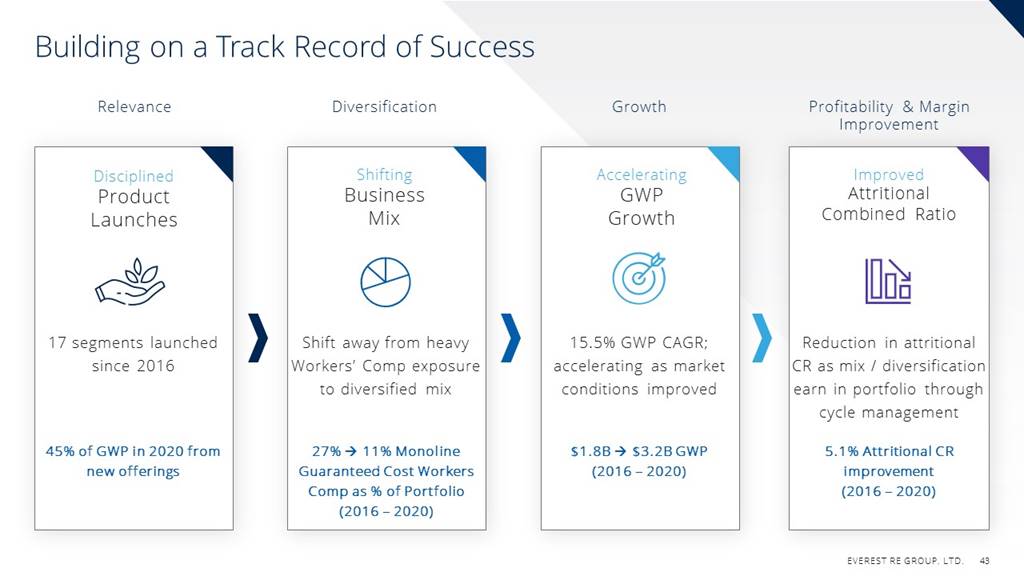
Building on a Track Record of success
Relevance
Diversification
Growth
Profitability & Margin
Improvement
Disciplined
Product
Launches
Shifting
Business
Mix
Accelerating
GWP
Growth
Improved
Attritional
Combined Ratio
17 segments launched since 2016
Shift away from heavy Workers' Comp exposure to diversified mix
Reduction in attritional CR as mix / diversification earn in portfolio through cycle management
15.5% GWP CAGR; accelerating as market conditions improved
45% of GWP in 2020 from new offerings
27% → 11% Monoline Guaranteed Cost Workers Comp as % of Portfolio (2016 - 2020)
$1.8B → $3.2B GWP(2016 - 2020)
5.1% Attritional CR Improvement (2016 - 2020)
EVEREST RE GROUP, LTD.
43
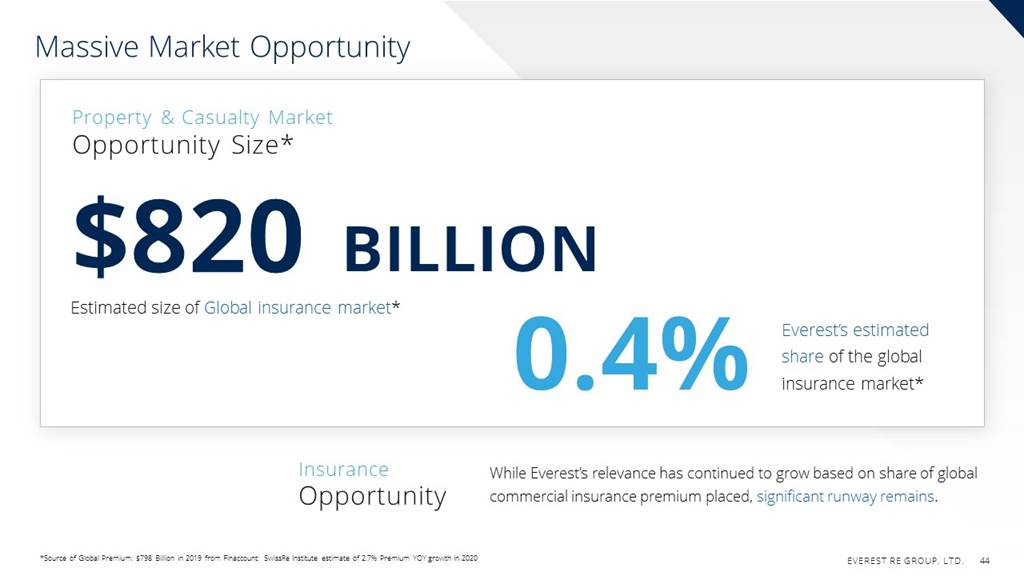
Massive Market Opportunity
Property & Casualty Market
Opportunity Size*
$820 BILLION
0.4%
Estimated size of Global insurance market*
Everest's estimated
share of the global
insurance market*
Insurance
Opportunity
While Everest's relevance has continued to grow based on share of global commercial insurance premium placed, significant runway remains.
*Source of Global Premium: $798 Billion in 2019 from Finaccount; SwissRe Institute estimate of 2.7% Premium YOY growth in 2020
EVEREST RE GROUP, LTD.
44
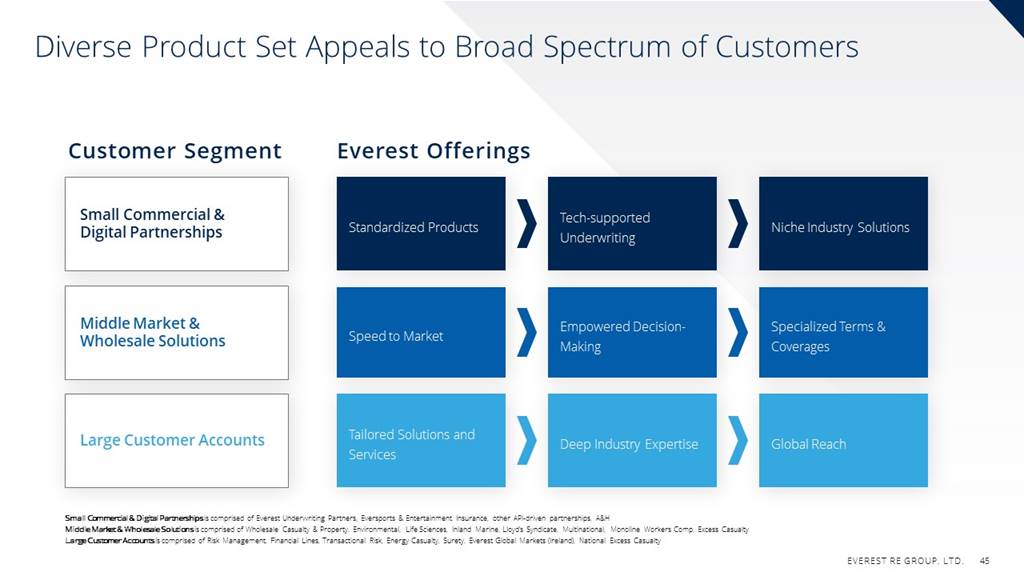
Diverse Product Set Appeals to Broad Spectrum of Customers
Customer Segment
Everest Offerings
Small Commercial & Digital Partnerships
Standardized Products
Tech-supported Underwriting
Niche Industry Solutions
Middle Market & Wholesale Solutions
Speed to Market
Empowered Decision- Making
Specialized Terms & Coverages
Tailored Solutions and Services
Large Customer Accounts
Deep Industry Expertise
Global Reach
Small Commercial & Digital Partnerships is comprised of Everest Underwriting Partners, Eversports & Entertainment Insurance, other API-driven partnerships, A&H Middle Market & Wholesale Solutions is comprised of Wholesale Casualty & Property, Environmental, Life Sciences, Inland Marine, Lloyd's Syndicate, Multinational, Monoline Workers Comp, Excess Casualty
Large Customer Accounts is comprised of Risk Management, Financial Lines, Transactional Risk, Energy Casualty, Surety, Everest Global Markets (Ireland), National Excess Casualty
EVEREST RE GROUP, LTD.
45
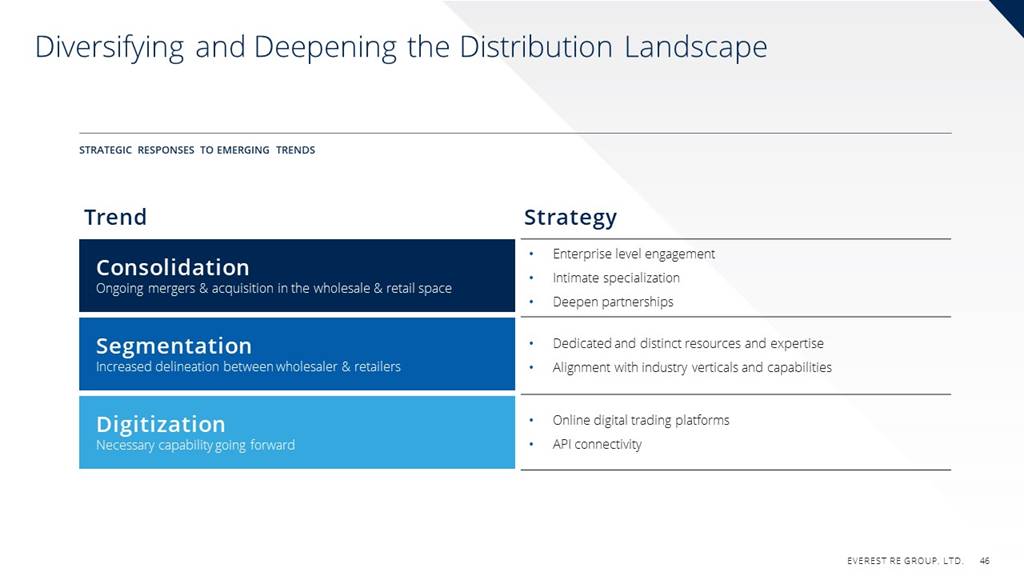
Diversifying and Deepening the Distribution Landscape
STRATEGIC RESPONSES TO EMERGING TRENDS
Trend
Strategy
Consolidation
Ongoing mergers & acquisition in the wholesale & retail space
· Enterprise level engagement
· Intimate specialization
· Deepen partnerships
.
Segmentation
Increased delineation between wholesaler & retailers
· Dedicated and distinct resources and expertise
· Alignment with industry verticals and capabilities
Digitization
Necessary capability going forward
· Online digital trading platforms
· API connectivity
EVEREST RE GROUP, LTD.
46

Scale Creates Margin Opportunity
Operating leverage
Portfolio management flexibility
Focused investment in technology
Skilled Cycle Management
Low 90s Combined Ratio
EVEREST RE GROUP, LTD.
47

Positioned to Deliver
Differentiated Value Proposition grounded in Strong Culture
Right Leadership, Right Vision
Size of Global Market Opportunity
Focused Strategy, Aligned Capabilities
Delivering Top Tier Performance
EVEREST RE GROUP, LTD.
48

Everest
Reinsurance
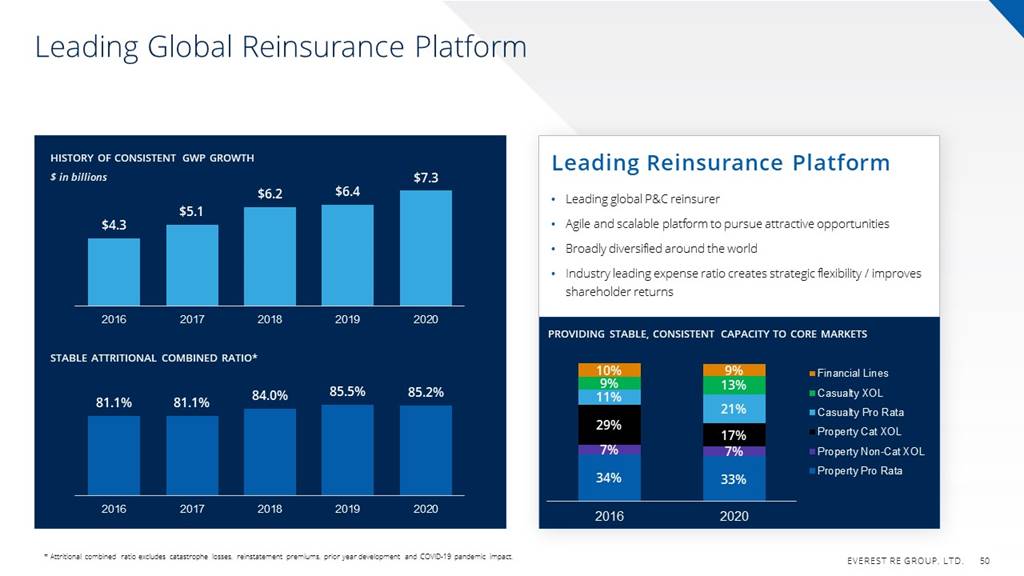
Leading Global Reinsurance Platform
HISTORY OF CONSISTENT GWP GROWTH
Leading Reinsurance Platform
$ in billions
$7.3
$6.2
$6.4
· Leading global P&C reinsurer
$5.1
$4.3
· Agile and scalable platform to pursue attractive opportunities
I
· Broadly diversified around the world
· Industry leading expense ratio creates strategic flexibility / improves shareholder returns
2016
2017
2018
2019
2020
PROVIDING STABLE, CONSISTENT CAPACITY TO CORE MARKETS
STABLE ATTRITIONAL COMBINED RATIO*
Financial Lines
10%
9%
11%
9%
13%
84.0%
85.5%
85.2%
Casualty XOL
81.1%
81.1%
21%
Casualty Pro Rata
29%
17%
Property Cat XOL
7%
7%
Property Non-Cat XOL
Property Pro Rata
34%
33%
2016
2017
2018
2019
2020
2016
2020
* Attritional combined ratio excludes catastrophe losses, reinstatement premiums, prior year development and COVID-19 pandemic impact.
EVEREST RE GROUP, LTD.
50
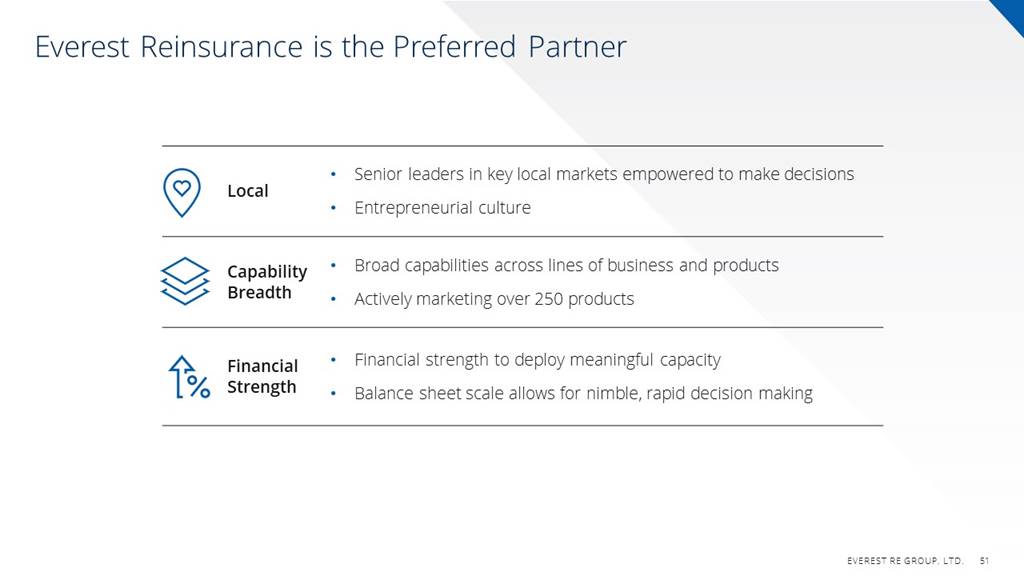
Everest Reinsurance is the Preferred Partner
Local
· Senior leaders in key local markets empowered to make decisions
· Entrepreneurial culture
Capability Breadth
· Broad capabilities across lines of business and products
· Actively marketing over 250 products
Financial Strength
· Financial strength to deploy meaningful capacity
· Balance sheet scale allows for nimble, rapid decision making
EVEREST RE GROUP, LTD.
51
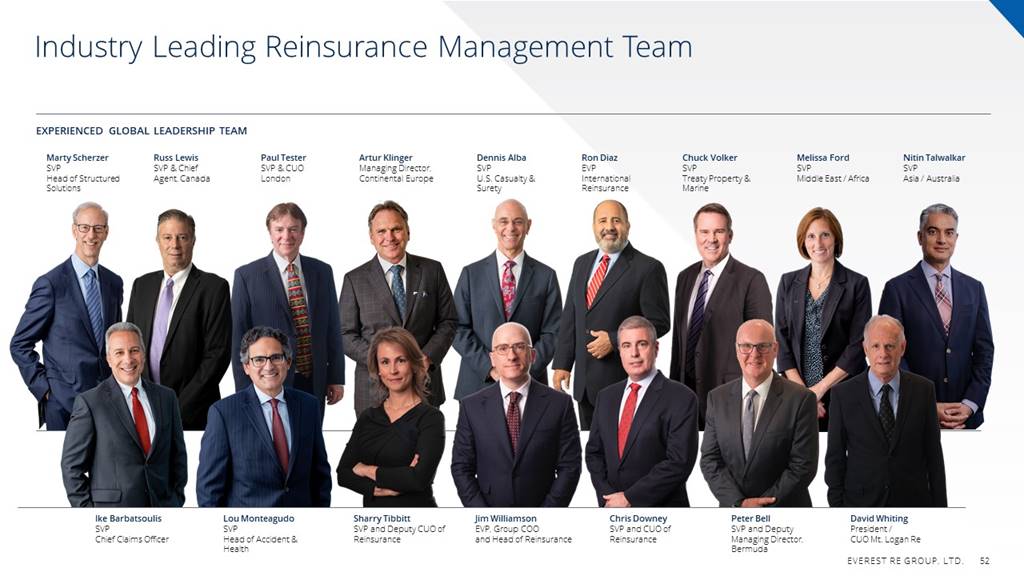
Industry Leading Reinsurance Management Team
EXPERIENCED GLOBAL LEADERSHIP TEAM
Marty Scherzer
SVP Head of Structured Solutions
Russ Lewis
SVP & Chief Agent, Canada
Paul Tester
SVP & CUO London
Artur Klinger
Managing Director, Continental Europe
Dennis Alba
SVP U.S. Casualty & Surety
Ron Diaz
EVP International Reinsurance
Chuck Volker
SVP
Treaty Property & Manne
Melissa Ford
SVP Middle East Africa
Nitin Talwalkar
SVP Asia / Australia
Ike Barbatsoulis
SVP Chief Claims Officer
Lou Monteagudo
SVP Head of Acadent & Health
Sharry Tibbitt
SVP and Deputy CuO of Reinsurance
Jim Williamson
EVP, Group Coo and Head of Reinsurance
Chris Downey
SVP and CuO of Reinsurance
Peter Bell
SVP and Deputy Managing Director, Bermuda
David Whiting
President /
CUO Mt. Logan Re
EVEREST RE GROUP, LTD.
52

Local Leaders Drive Superior Execution
LOCAL STRATEGY IN ACTION
Think Globally, Trade Locally
· Offices in all key global reinsurance centers – local decision makers empowered to transact
· Ceding clients in 115 countries
· Dynamically allocating capital across markets
52%
United States
48%
International
2020 GWP Distribution
Note: countries with an Everest ceding client highlighted in blue.
EVEREST RE GROUP, LTD.
53

Existing Product Capabilities Supports Reinsurance Strategy
FLEXIBLE PRODUCTS TO HELP COMPANIES AND COMMUNITIES GET BACK TO NORMAL AFTER LOSS
Reinsurance Strategy Drivers
Growth in Favorable Markets
Aviation
Liability
Marine
Technology, Data and Analytics
3rd Party Capital
Natural Catastrophes
Professional Liabilities
Residential and Commercial Housing
EVEREST RE GROUP, LTD.
54
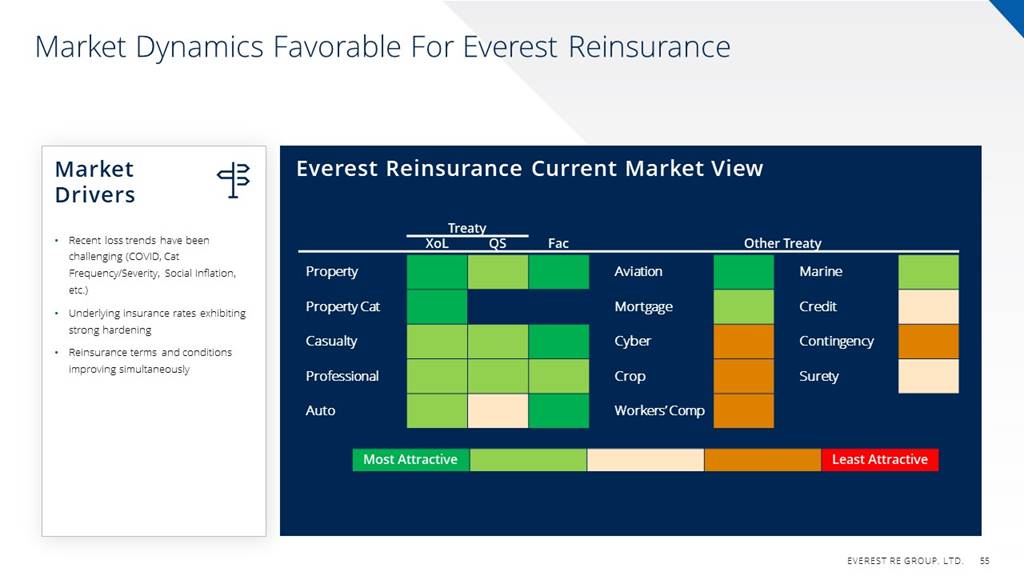
Market Dynamics Favorable For Everest Reinsurance
Everest Reinsurance Current Market View
Market Drivers
Recent loss trends have been challenging (COVID, Cat Frequency/Severity, Social Inflation, etc.)
Treaty
XOL
QS
Fac
Other Treaty
Property
Aviation
Marine
Property Cat
Mortgage
Credit
.
· Underlying insurance rates exhibiting strong hardening
Casualty
Cyber
Contingency
· Reinsurance terms and conditions improving simultaneously
Professional
Crop
Surety
Auto
Workers' Comp
Most Attractive
Least Attractive
EVEREST RE GROUP, LTD.
55

Partnership with Capital Markets Investors
Leading ILS Manager
Leading Issuer of Cat Bonds
KILIMANJARO RE
LADDERED CAT BOND ISSUANCE STRATEGY
· Mt Logan investors are strategically aligned with Everest: win/win lose/lose relationship
Mt. Logan Re.
· Largest global sponsor of cat bonds
•
Flexibility to grow
Efficient capacity for Everest's
global underwriting franchise
$2.3B in-forcell) limit; staggered term over 4-5
years - creates portfolio of hedging over time
$2.3B
2026
Index-based, annual aggregate coverage
Enhances client relationships and
improves terms
2021
2025
2025
7-Year
2019
2024
Track Record
2023
2018
2022
Nearly $1B
2017
2022
Assets Under
Management
Issuance
Current
Maturity
Date
Outstanding(1
Date
1. As of June 1, 2021
EVEREST RE GROUP, LTD.
56

Technology Augmenting Competitive Position and Margins
RECOGNIZED TECHNOLOGY LEADER
1 Core Systems
Build on core systems strategy
CIO
100
2. Enhanced Automation
Focus on analytics, automation and customer experience
CAT PRICING TEAM WIN
AWARD WINNER
3 Focus on Innovation
Data analytics enables data-driven decisions
2019
4. Process Reengineering
Leverage artificial intelligence, machine learning and robotic process automation
NOVARICA
5 Improved Analytics
NN
Digital reinsurance workbench to improve return on underwriter
(IMPACT
AWARDS
REINSURANCE
AUTOMATION PLATFORM
2020
EVEREST RE GROUP, LTD.
57

Build on Industry Leading Position to Enhance Underwriting Profit
Ongoing Portfolio Management
Focus on Accretive Growth
Nimble UW Cycle Management
Sustain Volatility Management
Best-in-Class Expense Ratio
Low 90s Combined Ratio
EVEREST RE GROUP, LTD.
58

Everest: A Leading Global Reinsurer
Preferred global trading partner for brokers and ceding clients
Industry leading talent, bench strength and product expertise
Trade globally in local markets while maintaining strong group controls
Product capabilities enable outperformance in all market conditions
Clear strategy to achieve growth & enhance margins
EVEREST RE GROUP, LTD.
59

Investments

Investment Portfolio Guiding Principles
ENGINES OF EARNINGS POWER
REINSURANCE
PRIVESTIMENTO
INSURANCE
1 Portfolio Diversification
2 High Degree of Liquidity
3 Strong Credit Quality
4 Match Asset / Liability Duration
5 Dual Strategy Approach: Stable Income and Total Return
6 Optimize Risk-Adjusted Return and Capital Efficiency
EVEREST RE GROUP, LTD.
61

Everest's Responsible ESG Investing
2019
· Signatory to United Nations' Principles for Responsible Investment (UN-PRI)
· Restrict future purchase of bonds issued by companies that derive >= 25% of revenue from coal*
2020
· 79% of total assets and 94% of fixed income assets managed by other UN-PRI signatories
2021 and Beyond
· Include ESG factors when making investment decisions
· Enhance portfolio reporting and analytics
· Integrate ESG standards to investments and underwriting
· Prioritize UN-PRI membership in selecting asset managers
* 0.29% exposure to companies that derive >= 25% of their revenue from coal. Prohibiting new purchases of companies that derive >=25% of their revenue from coal
EVEREST RE GROUP, LTD.
62
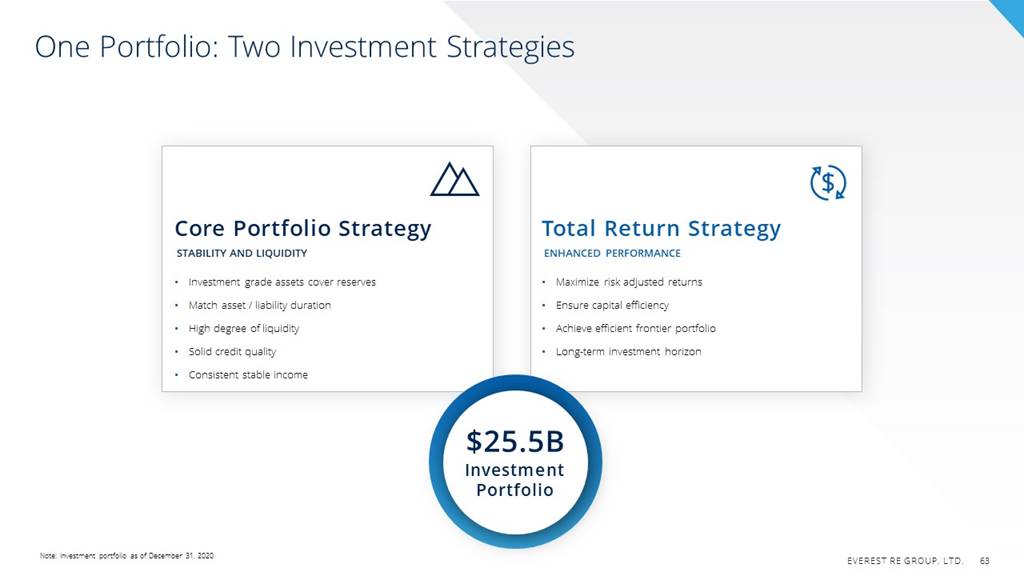
One Portfolio: Two Investment Strategies
Core Portfolio Strategy
STABILITY AND LIQUIDITY
· Investment grade assets cover reserves
· Match asset / liability duration
· High degree of liquidity
· Solid credit quality
· Consistent stable income
Total Return Strategy
ENHANCED PERFORMANCE
· Maximize risk adjusted returns
· Ensure capital efficiency
· Achieve efficient frontier portfolio
· Long-term investment horizon
$25.5B Investment Portfolio
Note: Investment portfolio as of December 31, 2020
EVEREST RE GROUP, LTD.
63

Asset Allocation Strategy
STRATEGIC ASSET ALLOCATION WITHIN RISK TOLERANCE
1.
Target
4Q 2020
Min
Max
Asset Allocation Strategic
Direction
Cash
4%
2%
10%
SHIFT IN PORTFOLIO CONSTRUCTION
Fixed Income
84%
70%
90%
Reduction in Corporate Bonds by 3-4% allocation
Short-term
5%
0%
10%
Commensurate increase in Private Equity and Alternative Fixed Income
(i.e. middle market loans, private debt and structured products)
Government Related
12%
10%
25%
Corporate Bonds
42%
35%
55%
PHILOSOPHY
Agency
9%
5%
15%
.
Asset / Liability duration matching
Securitized
14%
10%
20%
Retain strong credit quality and liquidity
Municipals
2%
0%
10%
Improve capital efficiency
Public Equity
5%
0%
10%
Private Equity / Credit
7%
5%
15%
Expected
2.75% - 3.25%
1.
Securitized includes: CLOS, ABS, CMBS and Non-agency RMBS
Return on invested Assets
EVEREST RE GROUP, LTD.
64
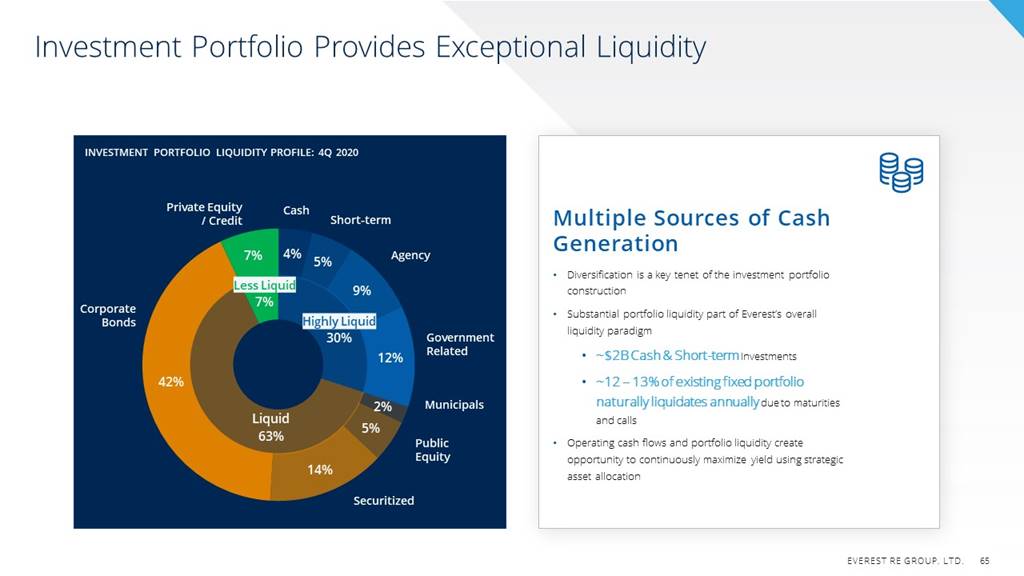
Investment Portfolio Provides Exceptional Liquidity
INVESTMENT PORTFOLIO LIQUIDITY PROFILE: 4Q 2020
Private Equity
Credit
Cash
Short-term
Multiple Sources of Cash
Generation
7%
4%
5%
Agency
Diversification is a key tenet of the investment portfolio
construction
Corporate
Bonds
Less Liquid
9%
7%
Highly Liquid
30%
Substantial portfolio liquidity part of Everest's overall
liquidity paradigm
Government
Related
12%
-$2B Cash & Short-term Investments
42%
~12-13% of existing fixed portfolio
naturally liquidates annually due to maturities
2%
Municipals
and calls
Liquid
63%
5%
Public
Equity
Operating cash flows and portfolio liquidity create
opportunity to continuously maximize yield using strategic
14%
asset allocation
Securitized
EVEREST RE GROUP, LTD.
65
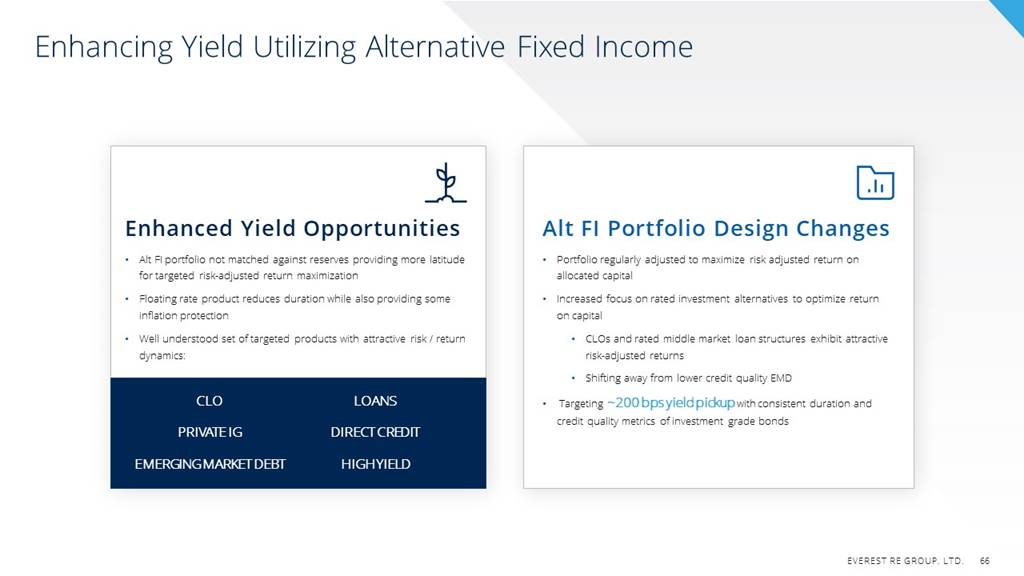
Enhancing Yield Utilizing Alternative Fixed Income
Enhanced Yield Opportunities
· Alt Fl portfolio not matched against reserves providing more latitude for targeted risk-adjusted return maximization
· Floating rate product reduces duration while also providing some inflation protection
· Well understood set of targeted products with attractive risk / return dynamics:
Alt El Portfolio Design Changes
· Portfolio regularly adjusted to maximize risk adjusted return on allocated capital
· Increased focus on rated investment alternatives to optimize return on capital
☐ CLOs and rated middle market loan structures exhibit attractive risk-adjusted returns
☐ Shifting away from lower credit quality EMD
· Targeting -200 bps yield pickup with consistent duration and credit quality metrics of investment grade bonds
CLO
LOANS
PRIVATE IG
DIRECT CREDIT
EMERGING MARKET DEBT
HIGH YIELD
EVEREST RE GROUP, LTD.
66
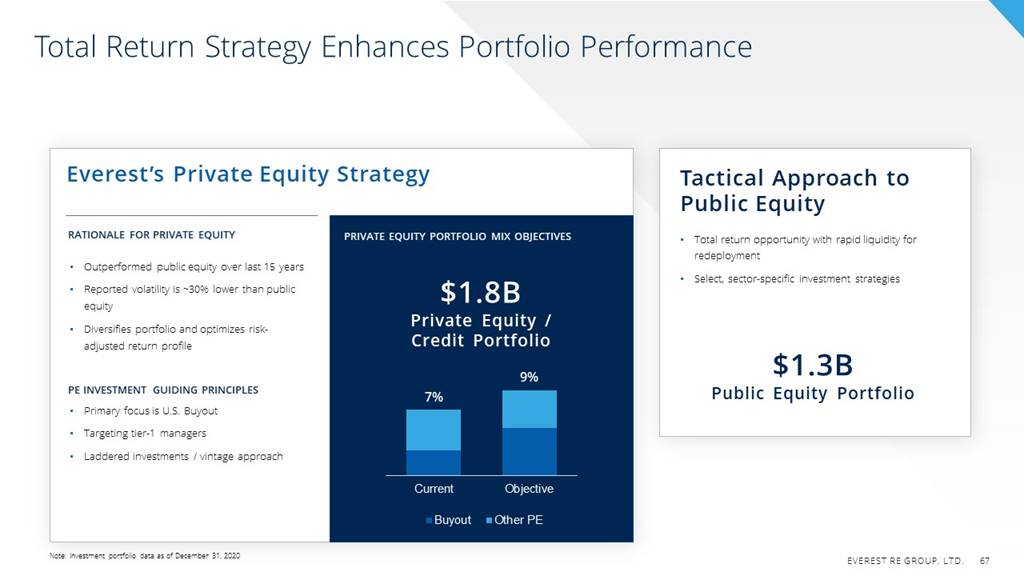
Total Return Strategy Enhances Portfolio Performance
Everest's Private Equity Strategy
Tactical Approach to
Public Equity
RATIONALE FOR PRIVATE EQUITY
PRIVATE EQUITY PORTFOLIO MIX OBJECTIVES
Total return opportunity with rapid liquidity for
redeployment
.
· Outperformed public equity over last 15 years
· Select, sector-specific investment strategies
· Reported volatility is -30% lower than public equity
$1.8B
Private Equity /
Credit Portfolio
· Diversifies portfolio and optimizes risk- adjusted return profile
9%
$1.3B
Public Equity Portfolio
PE INVESTMENT GUIDING PRINCIPLES
7%
Primary focus is U.S. Buyout
Targeting tier-1 managers
Laddered investments / vintage approach
Current
Objective
Buyout
Other PE
Note: Investment portfolio data as of December 31, 2020
EVEREST RE GROUP, LTD.
67

Investments: A Core Earnings Engine
Single portfolio with two strategies: Core and Total Return
Continued focus on responsible investing
Core strategy provides liquidity, stability and current income
Shift towards PE will improve performance
Investment performance is key to Everest's shareholder returns
EVEREST RE GROUP, LTD.
68
Investing in
Everest
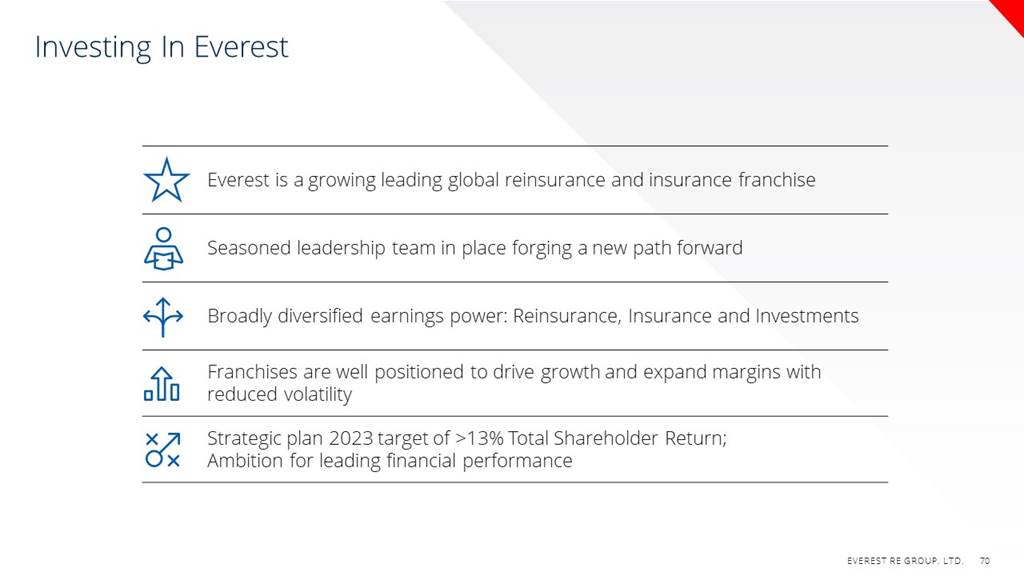
Investing In Everest
Everest is a growing leading global reinsurance and insurance franchise
Seasoned leadership team in place forging a new path forward
Broadly diversified earnings power: Reinsurance, Insurance and Investments
Franchises are well positioned to drive growth and expand margins with reduced volatility
Strategic plan 2023 target of >13% Total Shareholder Return; Ambition for leading financial performance
EVEREST RE GROUP, LTD.
70

Q&A
EVEREST YEAR
Thank you for joining Everest's 2021 Investor Day

Appendix
Reference Information
2020/21 ESG Rankings
NYSE: RE
Outstanding Debt: L+2.385% Sub Notes due 2037
Environmental: 6
4.868% Sr Notes due 2044
ISS
*
Social: 5
MSCI
BB
3.500% Sr Notes due 2050
Governance: 4
FINANCIAL
STRENGTH
RATINGS
A+
A+
A1
(SAM
44th percentile
SUSTAINALYTICS
Low Risk
#23 of 290
insurers ranked
A.M. Best
S&P Global
Moody's Investors
Service
STABLE OUTLOOK
* AS of May 2021. Score of 1 is best.
Definitions / Notes
Glossary of Terms
BVPS: Book Value per Share
ILS: Insurance-linked Securities
Total Shareholder Return: annual growth in Book Value per Share, excluding Unrealized
Gains and Losses on Fixed Maturity Investments, plus Dividends per Share
CLO: Collateralized Loan Obligation
ILW: Industry Loss Warranty
Attritional Combined Ratio: Calendar year combined ratio excluding catastrophe losses,
reinstatement premiums, prior year development and COVID-19 pandemic impacts.
.
CR: Combined Ratio
.
PML: Probable Maximum Loss
.
DPS: Dividend per Share
.
Private IG: Private Investment Grade Debt
EMD: Emerging Market Debt
QS: Quota Share
Note: Asset allocations (both percentages and dollar amounts) have been adjusted
relative to GAAP financial presentation to reflect underlying asset risk profile rather than
legal entity structure of holding where relevant.
.
Fac: Facultative Risk
XOL: Excess of Loss
EVEREST RE GROUP, LTD.
73