Searchable text section of graphics shown above
[LOGO]
Corporate Presentation
June 2006
Forward-Looking Statements
This presentation may contain “forward-looking” statements, which are made pursuant to the safe-harbor provisions of the Private Securities Litigation Reform Act of 1995, and include words such as “anticipates,” “expects,” “intends,” “plans,” “believes,” “may,” “will” or similar expressions that are intended to identify forward-looking statements. In addition, any statements that refer to expectations, projections or other characterizations of future performance are subject to substantial risks, uncertainties and assumptions that are difficult to predict. Therefore, ARTISTdirect’s actual results could differ materially and adversely from those expressed in any forward-looking statements as a result of various factors. For a further description of various risks, factors and uncertainties with respect to ARTISTdirect’s business, its industry, its plans and its financial results, please refer to our filings with the Securitites and Exchange Commission, which can be viewed without charge on the Internet at www.sec.gov.
[LOGO]
2
The Company
ARTISTdirect, Inc. (OTCBB: ARTD) is a public digital media company that offers the world’s largest companies a uniquely powerful platform to protect and promote their content (and brands) on the Internet.
ARTISTdirect has two operating divisions:
1.ARTISTdirect Internet Group
2.MediaDefender
3
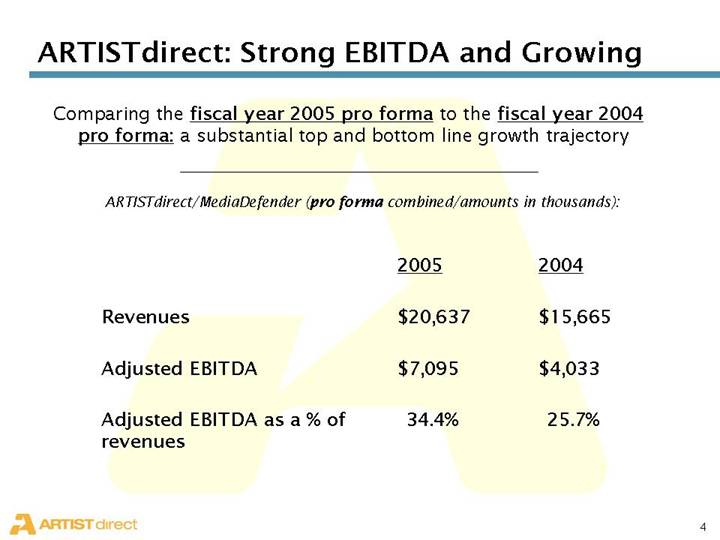
ARTISTdirect: Strong EBITDA and Growing
Comparing the fiscal year 2005 pro forma to the fiscal year 2004 pro forma: a substantial top and bottom line growth trajectory
ARTISTdirect/MediaDefender (pro forma combined/amounts in thousands):
| | 2005 | | 2004 | |
| | | | | |
Revenues | | $ | 20,637 | | $ | 15,665 | |
| | | | | |
Adjusted EBITDA | | $ | 7,095 | | $ | 4,033 | |
| | | | | |
Adjusted EBITDA as a% of revenues | | 34.4 | % | 25.7 | % |
4
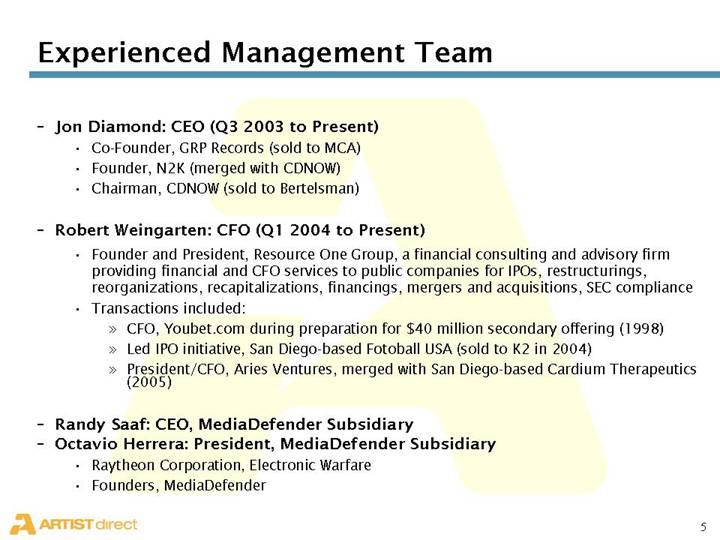
Experienced Management Team
• Jon Diamond: CEO (Q3 2003 to Present)
• Co-Founder, GRP Records (sold to MCA)
• Founder, N2K (merged with CDNOW)
• Chairman, CDNOW (sold to Bertelsman)
• Robert Weingarten: CFO (Q1 2004 to Present)
• Founder and President, Resource One Group, a financial consulting and advisory firm providing financial and CFO services to public companies for IPOs, restructurings, reorganizations, recapitalizations, financings, mergers and acquisitions, SEC compliance
• Transactions included:
• CFO, Youbet.com during preparation for $40 million secondary offering (1998)
• Led IPO initiative, San Diego-based Fotoball USA (sold to K2 in 2004)
• President/CFO, Aries Ventures, merged with San Diego-based Cardium Therapeutics (2005)
• Randy Saaf: CEO, MediaDefender Subsidiary
• Octavio Herrera: President, MediaDefender Subsidiary
• Raytheon Corporation, Electronic Warfare
• Founders, MediaDefender
5
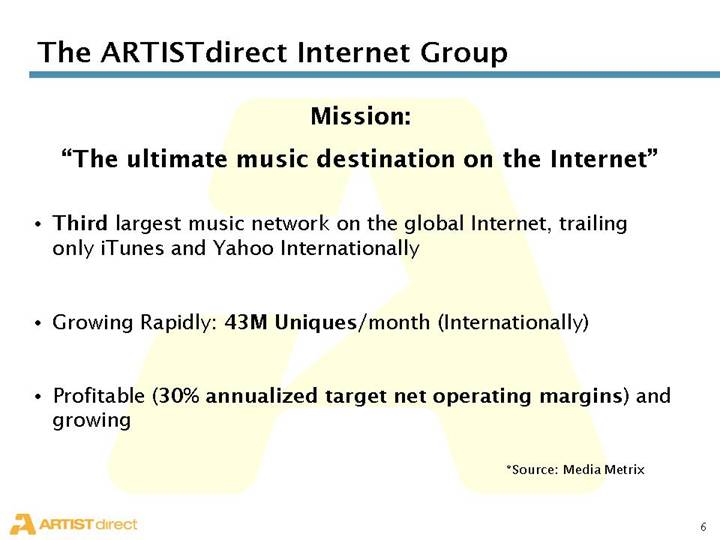
The ARTISTdirect Internet Group
Mission:
“The ultimate music destination on the Internet”
• Third largest music network on the global Internet, trailing only iTunes and Yahoo Internationally
• Growing Rapidly: 43M Uniques/month (Internationally)
• Profitable (30% annualized target net operating margins) and growing
*Source: Media Metrix
6
MediaDefender: The Industry Choice
Mission:
“The peer-to-peer platform of the global media industry”
Positioned for Growth:
• Leading source for protecting digital content on the Internet
• Uniquely offers comprehensive protection services on all major P2P networks
• High Barriers to Entry: Complex development cycle for new networks
• Proprietary, scalable technology
• Umbrella patent filed
• Massive P2P counter–measure infrastructure (approx. 2,500 servers unified)
7
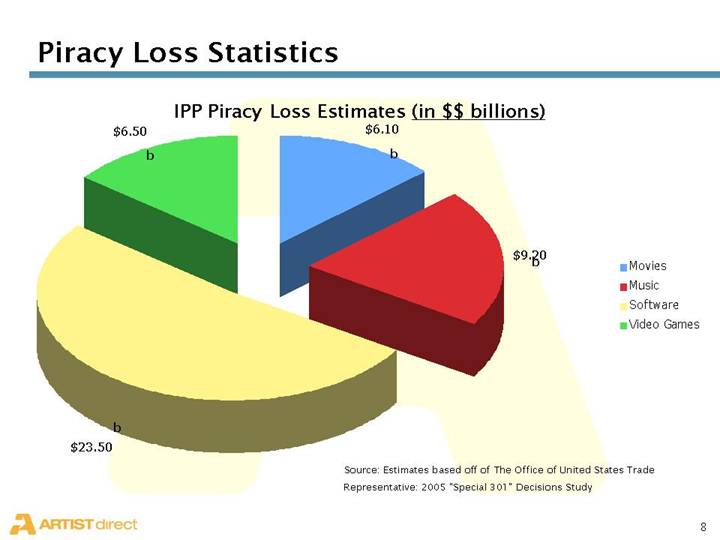
Piracy Loss Statistics
IPP Piracy Loss Estimates (in $$ billions)
[CHART]
| Source: Estimates based off of The Office of United States Trade |
| Representative: 2005 “Special 301” Decisions Study |
8
MediaDefender: The Industry Choice
MediaDefender pioneered the field, and has a 90% market share:
FILM/TV | | MUSIC |
[LOGO] | | [LOGO] |
| | |
SOFTWARE | | GAMES |
[LOGO] | | [LOGO] |
9
MediaDefender Services
• IPP – Internet Piracy Prevention on the 15 major global P2P networks
• Interdiction
• Decoying
• Spoofing
• Swarming
• Marketing/Promotion (aka Re-Direction)
• Leveraging the billions of decoys MediaDefender delivers on P2P for advertising and promotion opportunities
• Marketing/Business Intelligence
• Productizing and selling the perfect search data of the 300MM global P2P users consuming content
10
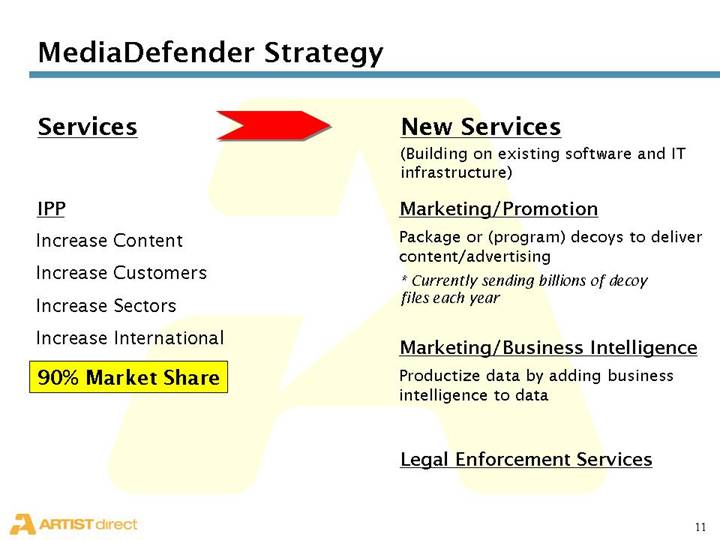
MediaDefender Strategy
Services | | [GRAPHIC] | | New Services |
| | | | (Building on existing software and IT |
| | | | infrastructure) |
| | | | |
IPP | | | | Marketing/Promotion |
| | | | |
Increase Content | | | | Packageor (program) decoys to deliver |
| | | | content/advertising |
Increase Customers | | | | |
�� | | | | * Currently sending billions of decoy files each |
Increase Sectors | | | | year |
| | | | |
Increase International | | | | |
| | | | Marketing/Business Intelligence |
90% Market Share | | | | Productize data by adding business intelligence to |
| | | | data |
| | | | |
| | | | Legal Enforcement Services |
11
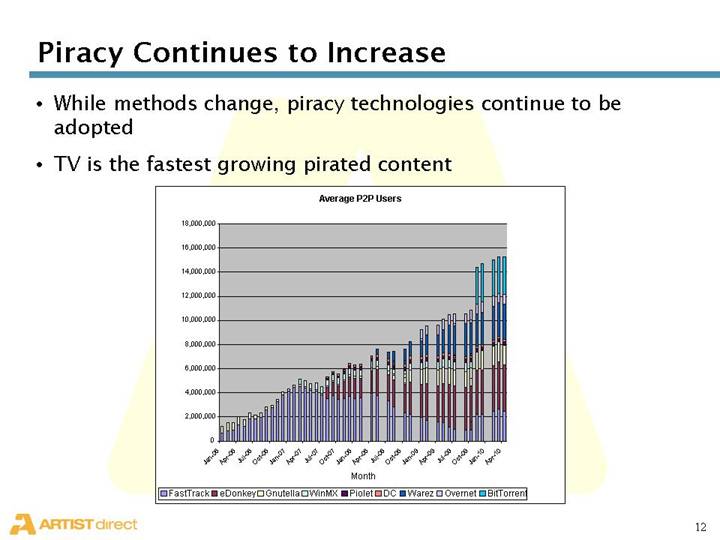
Piracy Continues to Increase
• While methods change, piracy technologies continue to be adopted
• TV is the fastest growing pirated content
[CHART]
12
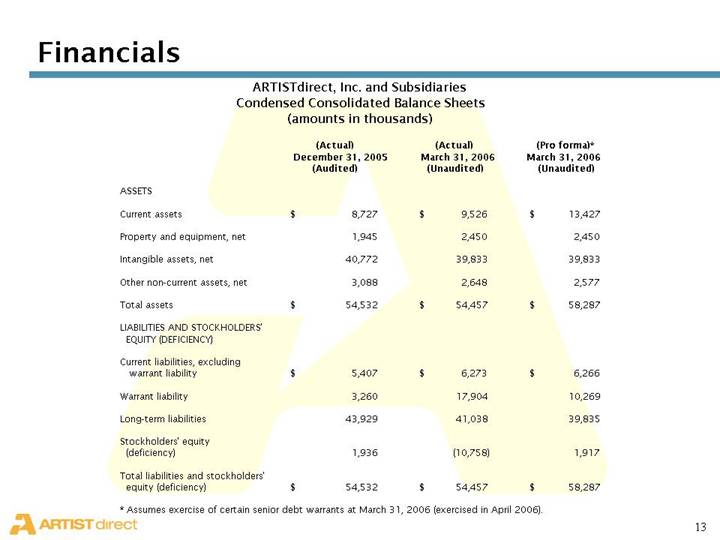
Financials
ARTISTdirect, Inc. and Subsidiaries
Condensed Consolidated Balance Sheets
(amounts in thousands)
| | (Actual)
December 31, 2005 | | (Actual)
March 31, 2006 | | (Pro forma)*
March 31, 2006 | |
| | (Audited) | | (Unaudited) | | (Unaudited) | |
ASSETS | | | | | | | |
| | | | | | | |
Current assets | | $ | 8,727 | | $ | 9,526 | | $ | 13,427 | |
| | | | | | | |
Property and equipment, net | | 1,945 | | 2,450 | | 2,450 | |
| | | | | | | |
Intangible assets, net | | 40,772 | | 39,833 | | 39,833 | |
| | | | | | | |
Other non-current assets, net | | 3,088 | | 2,648 | | 2,577 | |
| | | | | | | |
Total assets | | $ | 54,532 | | $ | 54,457 | | $ | 58,287 | |
| | | | | | | |
LIABILITIES AND STOCKHOLDERS’ EQUITY (DEFICIENCY) | | | | | | | |
| | | | | | | |
Current liabilities, excluding warrant liability | | $ | 5,407 | | $ | 6,273 | | $ | 6,266 | |
| | | | | | | |
Warrant liability | | 3,260 | | 17,904 | | 10,269 | |
| | | | | | | |
Long-term liabilities | | 43,929 | | 41,038 | | 39,835 | |
| | | | | | | |
Stockholders’ equity (deficiency) | | 1,936 | | (10,758 | ) | 1,917 | |
| | | | | | | |
Total liabilities and stockholders’ equity (deficiency) | | $ | 54,532 | | $ | 54,457 | | $ | 58,287 | |
* Assumes exercise of certain senior debt warrants at March 31, 2006 (exercised in April 2006).
13
ARTISTdirect, Inc. and Subsidiaries
Condensed Consolidated Statements of Operations (Unaudited)
Three Months Ended March 31, 2006 and 2005
(amounts in thousands)
| | 2006 | | 2005 | |
| | (Actual) | | (Pro forma)* | |
| | | | | |
Net revenue | | $ | 5,273 | | $ | 4,014 | |
| | | | | |
Cost of revenue | | 3,084 | | 2,466 | |
| | | | | |
Gross profit | | 2,189 | | 1,548 | |
| | | | | |
Gross profit% | | 41.5 | % | 38.6 | % |
| | | | | |
Operating expenses | | 2,591 | | 1,445 | |
| | | | | |
Interest expense, amortization of deferred financing costs and other | | 1,291 | | 1,082 | |
| | | | | |
Adjustment for warrant liability | | 14,644 | | — | |
| | | | | |
Provision for income taxes | | 100 | | 127 | |
| | | | | |
Net loss | | $ | (16,437 | ) | $ | (1,106 | ) |
| | | | | |
Adjusted EBITDA | | $ | 1,228 | | $ | 1,154 | |
| | | | | |
Adjusted EBITDA as a% of net revenue | | 23.3 | % | 28.7 | % |
*Discontinued operations, impairment losses and non-recurring items for 2005 are not included.
14
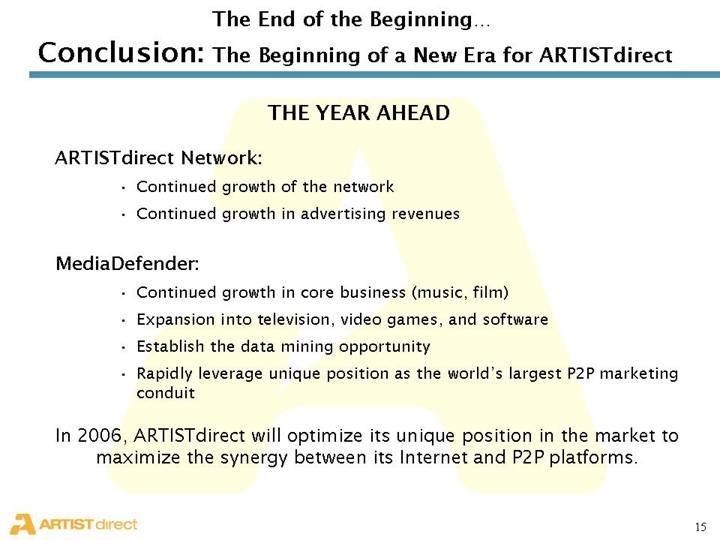
The End of the Beginning…
Conclusion: The Beginning of a New Era for ARTISTdirect
THE YEAR AHEAD
ARTISTdirect Network:
• Continued growth of the network
• Continued growth in advertising revenues
MediaDefender:
• Continued growth in core business (music, film)
• Expansion into television, video games, and software
• Establish the data mining opportunity
• Rapidly leverage unique position as the world’s largest P2P marketing conduit
In 2006, ARTISTdirect will optimize its unique position in the market to maximize the synergy between its Internet and P2P platforms.
15
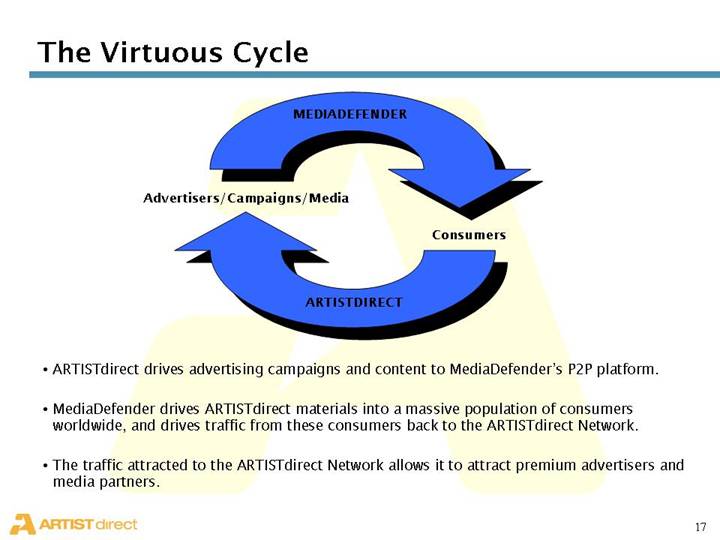
The Virtuous Cycle
| [GRAPHIC] | |
| MEDIADEFENDER | |
| | |
Advertisers/Campaigns/Media | | |
| | |
| | Consumers |
| | |
| ARTISTDIRECT | |
| [GRAPHIC] | |
• ARTISTdirect drives advertising campaigns and content to MediaDefender’s P2P platform.
• MediaDefender drives ARTISTdirect materials into a massive population of consumers worldwide, and drives traffic from these consumers back to the ARTISTdirect Network.
• The traffic attracted to the ARTISTdirect Network allows it to attract premium advertisers and media partners.
17
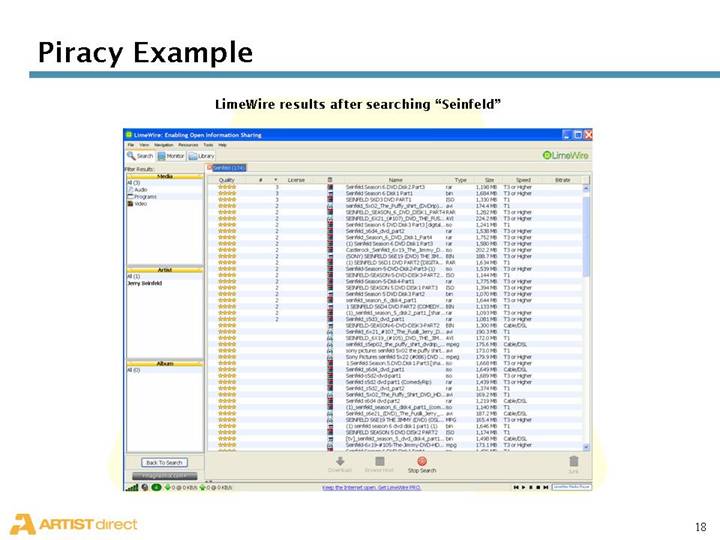
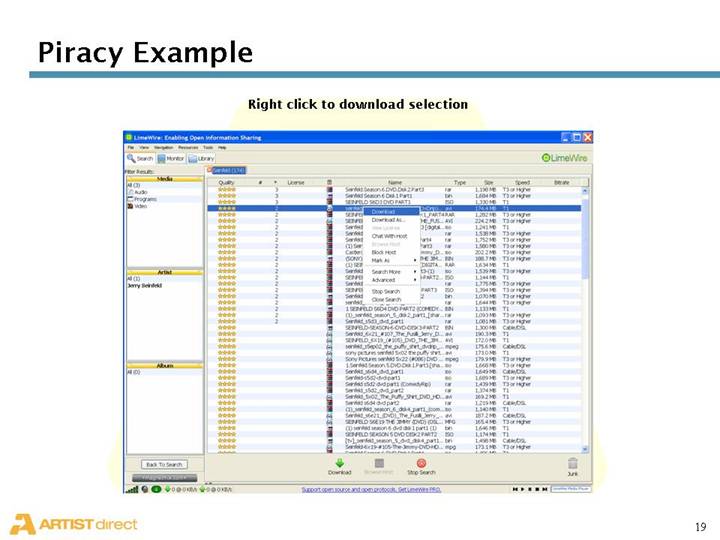
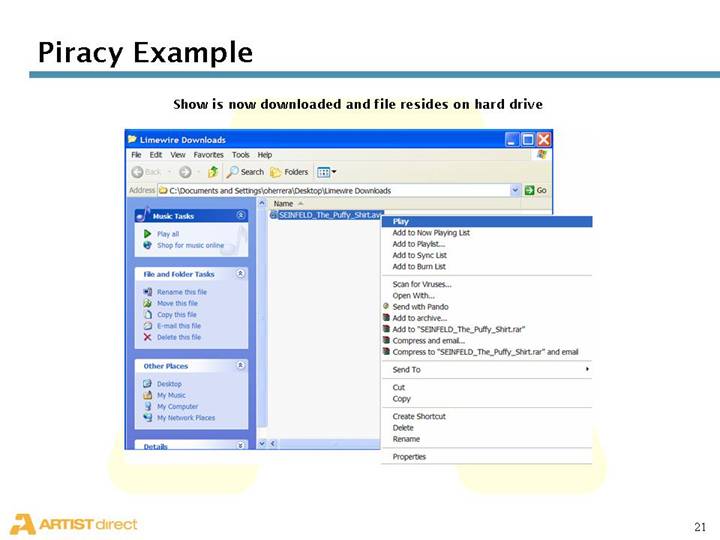
Piracy Example
LimeWire results after searching “Seinfeld”
[GRAPHIC]
18
Right click to download selection
[GRAPHIC]
19
Begin downloading selected Seinfeld episode
[GRAPHIC]
20
Show is now downloaded and file resides on hard drive
[GRAPHIC]
21
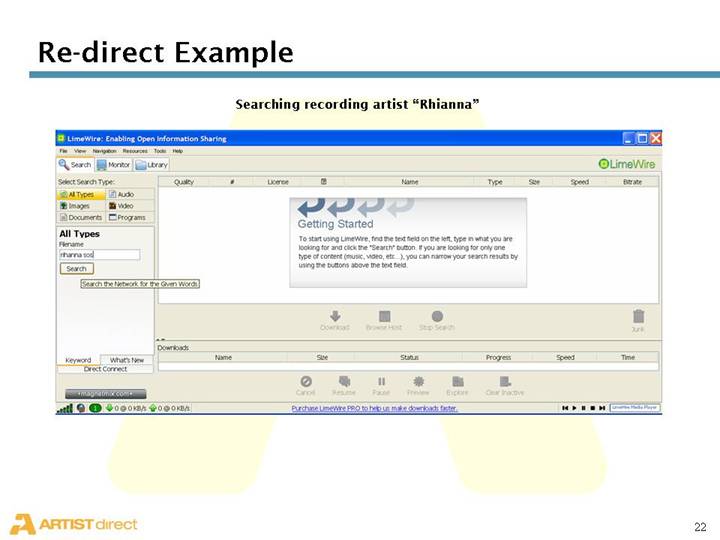
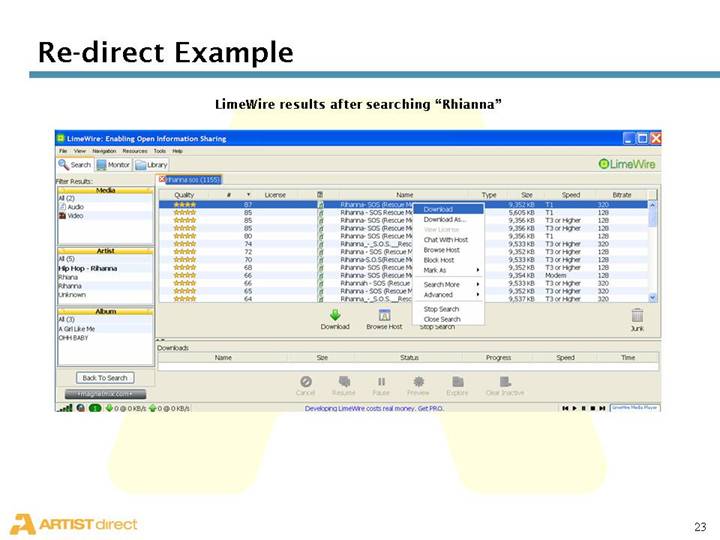
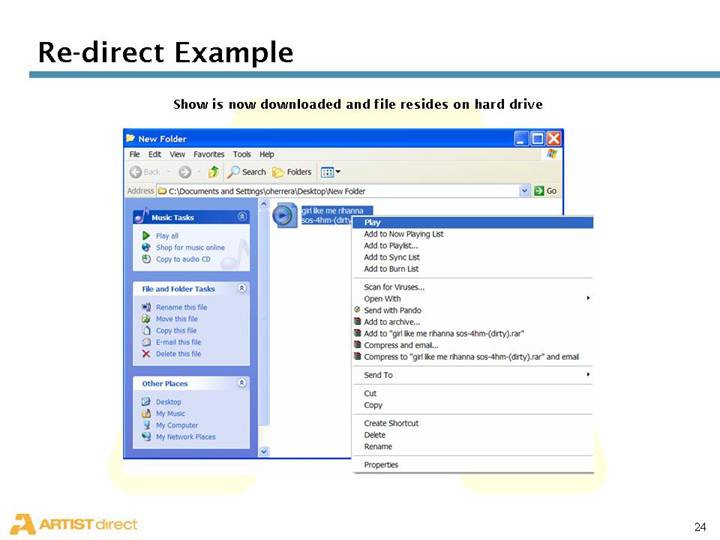
Re-direct Example
Searching recording artist “Rhianna”
[GRAPHIC]
22
LimeWire results after searching “Rhianna”
[GRAPHIC]
23
Show is now downloaded and file resides on hard drive
[GRAPHIC]
24
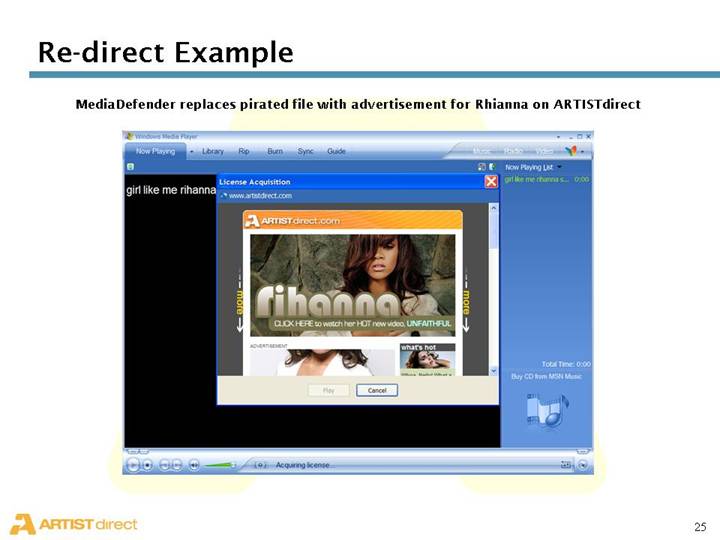
MediaDefender replaces pirated file with advertisement for Rhianna on ARTISTdirect
[GRAPHIC]
25
Financials
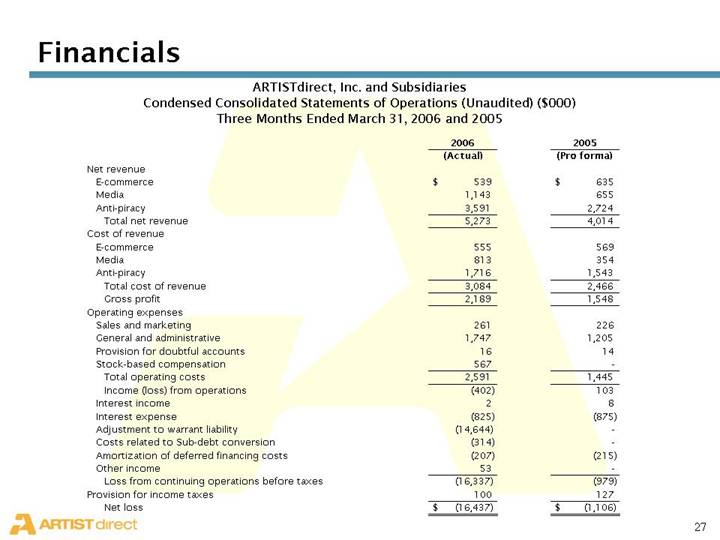
ARTISTdirect, Inc. and Subsidiaries
Condensed Consolidated Statements of Operations (Unaudited) ($000)
Three Months Ended March 31, 2006 and 2005
| | 2006 | | 2005 | |
| | (Actual) | | (Pro forma) | |
Net revenue | | | | | |
E-commerce | | $ | 539 | | $ | 635 | |
Media | | 1,143 | | 655 | |
Anti-piracy | | 3,591 | | 2,724 | |
Total net revenue | | 5,273 | | 4,014 | |
Cost of revenue | | | | | |
E-commerce | | 555 | | 569 | |
Media | | 813 | | 354 | |
Anti-piracy | | 1,716 | | 1,543 | |
Total cost of revenue | | 3,084 | | 2,466 | |
Gross profit | | 2,189 | | 1,548 | |
Operating expenses | | | | | |
Sales and marketing | | 261 | | 226 | |
General and administrative | | 1,747 | | 1,205 | |
Provision for doubtful accounts | | 16 | | 14 | |
Stock-based compensation | | 567 | | — | |
Total operating costs | | 2,591 | | 1,445 | |
Income (loss) from operations | | (402 | ) | 103 | |
Interest income | | 2 | | 8 | |
Interest expense | | (825 | ) | (875 | ) |
Adjustment to warrant liability | | (14,644 | ) | — | |
Costs related to Sub-debt conversion | | (314 | ) | — | |
Amortization of deferred financing costs | | (207 | ) | (215 | ) |
Other income | | 53 | | — | |
Loss from continuing operations before taxes | | (16,337 | ) | (979 | ) |
Provision for income taxes | | 100 | | 127 | |
Net loss | | $ | (16,437 | ) | $ | (1,106 | ) |
27
| | 2006 | | 2005 | |
| | (Actual) | | (Pro forma) | |
| | | | | |
Reconciliation of Net Loss to Adjusted EBITDA | | | | | |
| | | | | |
Net Loss | | $ | (16,437 | ) | $ | (1,106 | ) |
Interest income | | (2 | ) | (8 | ) |
Other income | | (53 | ) | — | |
Interest expense | | | | | |
Cash | | 685 | | 733 | |
Amortization of discount on debt | | 140 | | 142 | |
Costs related to Sub-debt conversion | | 314 | | — | |
Amortization of deferred financing costs | | 207 | | 215 | |
Amortization of intangible assets | | 939 | | 939 | |
Adjustment to warrant liability | | 14,644 | | — | |
Depreciation | | 124 | | 112 | |
Provision for income taxes | | 100 | | 127 | |
Stock-based compensation | | 567 | | — | |
Adjusted EBITDA | | $ | 1,228 | | $ | 1,154 | |
28
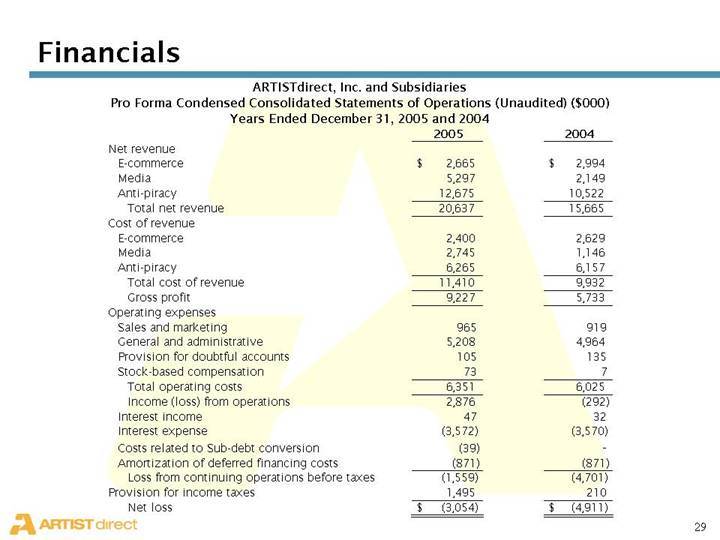
ARTISTdirect, Inc. and Subsidiaries
Pro Forma Condensed Consolidated Statements of Operations (Unaudited)
($000)
Years Ended December 31, 2005 and 2004
| | 2005 | | 2004 | |
Net revenue | | | | | |
E-commerce | | $ | 2,665 | | $ | 2,994 | |
Media | | 5,297 | | 2,149 | |
Anti-piracy | | 12,675 | | 10,522 | |
Total net revenue | | 20,637 | | 15,665 | |
Cost of revenue | | | | | |
E-commerce | | 2,400 | | 2,629 | |
Media | | 2,745 | | 1,146 | |
Anti-piracy | | 6,265 | | 6,157 | |
Total cost of revenue | | 11,410 | | 9,932 | |
Gross profit | | 9,227 | | 5,733 | |
Operating expenses | | | | | |
Sales and marketing | | 965 | | 919 | |
General and administrative | | 5,208 | | 4,964 | |
Provision for doubtful accounts | | 105 | | 135 | |
Stock-based compensation | | 73 | | 7 | |
Total operating costs | | 6,351 | | 6,025 | |
Income (loss) from operations | | 2,876 | | (292 | ) |
Interest income | | 47 | | 32 | |
Interest expense | | (3,572 | ) | (3,570 | ) |
Costs related to Sub-debt conversion | | (39 | ) | — | |
Amortization of deferred financing costs | | (871 | ) | (871 | ) |
Loss from continuing operations before taxes | | (1,559 | ) | (4,701 | ) |
Provision for income taxes | | 1,495 | | 210 | |
Net loss | | $ | (3,054 | ) | $ | (4,911 | ) |
29
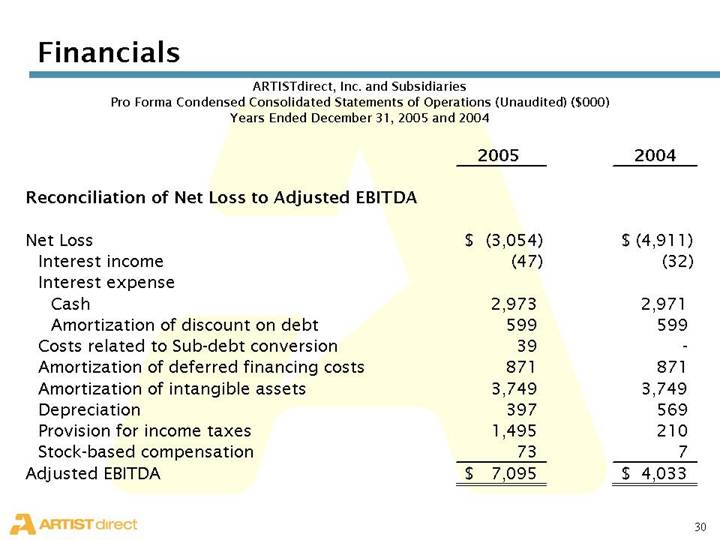
| | 2005 | | 2004 | |
| | | | | |
Reconciliation of Net Loss to Adjusted EBITDA | | | | | |
| | | | | |
Net Loss | | $ | (3,054 | ) | $ | (4,911 | ) |
Interest income | | (47 | ) | (32 | ) |
Interest expense | | | | | |
Cash | | 2,973 | | 2,971 | |
Amortization of discount on debt | | 599 | | 599 | |
Costs related to Sub-debt conversion | | 39 | | — | |
Amortization of deferred financing costs | | 871 | | 871 | |
Amortization of intangible assets | | 3,749 | | 3,749 | |
Depreciation | | 397 | | 569 | |
Provision for income taxes | | 1,495 | | 210 | |
Stock-based compensation | | 73 | | 7 | |
Adjusted EBITDA | | $ | 7,095 | | $ | 4,033 | |
30